Article

Optimization of Ethanol Production from NaOH-Pretreated Solid State Fermented Sweet Sorghum Bagasse

1
Institute of Nuclear and New Energy Technology, Tsinghua University, Tsinghua Garden, Beijing 10084, China
2
Beijing Engineering Research Center for Biofuels, Beijing 10084, China
*
Authors to whom correspondence should be addressed.
Energies 2014, 7(7), 4054-4067; https://doi.org/10.3390/en7074054
Submission received: 21 February 2014 / Revised: 16 June 2014 / Accepted: 19 June 2014 / Published: 25 June 2014

Abstract

:
Ethanol production from NaOH-Pretreated solid state fermented sweet sorghum bagasse with an engineered strain of Z. mobilis TSH-ZM-01 was optimized. Results showed that: (1) residual solid removal during ethanol fermentation was unnecessary and 24 h fermentation duration was optimal for ethanol production; (2) ethanol yield of 179.20 g/kg of solid state fermented sweet sorghum bagasse achieved under the optimized process conditions of cellulase loading of 0.04 g/g-glucan, xylanase loading of 0.01 g/g-xylan, liquid to solid ratio of 9:1 and pre-hydrolysis duration for 72 h.

1. Introduction

Sweet sorghum is considered a promising energy crop for biofuel production [1,2,3]. There are approximately equal quantities of soluble carbohydrates (e.g., sucrose, glucose and fructose) and insoluble carbohydrates in sweet sorghum stalks (cellulose and hemicellulose) [4], which can be utilized for bioethanol production. Soluble carbohydrates in sweet sorghum stalks can be efficiently converted into sugar-based ethanol by advanced solid state fermentation technology [5]. Major challenge for large scale application of ethanol production from sweet sorghum is the efficient conversion of the solid state fermented sweet sorghum (SS) bagasse into cellulosic ethanol.
The most common method for cellulosic ethanol production from sweet sorghum bagasse involves pretreatment, acid or enzymatic hydrolysis, fermentation and ethanol distillation. A pretreatment process is employed to break the lignin seal and disrupt the crystalline structure of the cellulose [6] and contribute to 30%–40% of production cost [7]. Compared to other pretreatment technologies, alkaline pretreatment processes generally utilize lower temperatures, pressures and residence times, and produce lower concentration of inhibitors [8,9]. NaOH pretreatment is one of the most used methods. After pretreatment, the solid phase could be hydrolyzed to fermentable sugars by saccharification and then converted into ethanol by microbes (separate enzymatic hydrolysis and fermentation, SHF) or simultaneous saccharification and co-fermentation (SSCF) with ethanol producing microbes. Compared with SHF, SSCF combine saccharification, pentose and hexose anaerobic co-fermentation in a single stage and was more favorable for ethanol production due to its lower cost, shorter processing duration and higher ethanol yields [10].
Commonly, Saccharomyces cerevisiae (S. cerevisiae) is used for alcoholic fermentations [11]. However, recent studies demonstrated that Zymomonas mobilis (Z. mobilis) had many advantages over S. cerevisiae such as higher specific rate of sugar uptake, higher ethanol yield, lower biomass production [12,13,14]. Therefore, Z. mobilis may be used as a better to S. cerevisiae in ethanol production [14].
The aim of this work was to identify the optimum conditions for cellulosic ethanol production from NaOH-pretreated SS utilizing the SSCF process with an engineered strain of Z. mobilis TSH-ZM-01. In this study, NaOH-pretreated solid state fermented sweet sorghum bagasse was used as raw material. The xylose-utilizing recombinant Z. mobilis TSH01 was constructed by a series of transformation vectors, consisting of a marker gene for tetracycline resistance and four xylose metabolism genes (xylose isomerase, xylulokinase, transaltolase and transkedolase) by gene cloning [15]. During SSCF, residual solids always exist in the hydrolysate but the influence of the residual solids on the ethanol fermentation process is still unclear. Therefore, the effect of un-hydrolyzed residual solids generated during SSCF on the ethanol fermentation was first analyzed. At the same time, a feasible fermentation duration was also established. Then a Box-Behnken design (BBD) response surface method was employed to optimize the operating parameters of the SSCF process including cellulase loading, xylanase loading, pre-hydrolysis duration (PD) and the liquid to solid ratio (LSR).

2. Results and Discussion

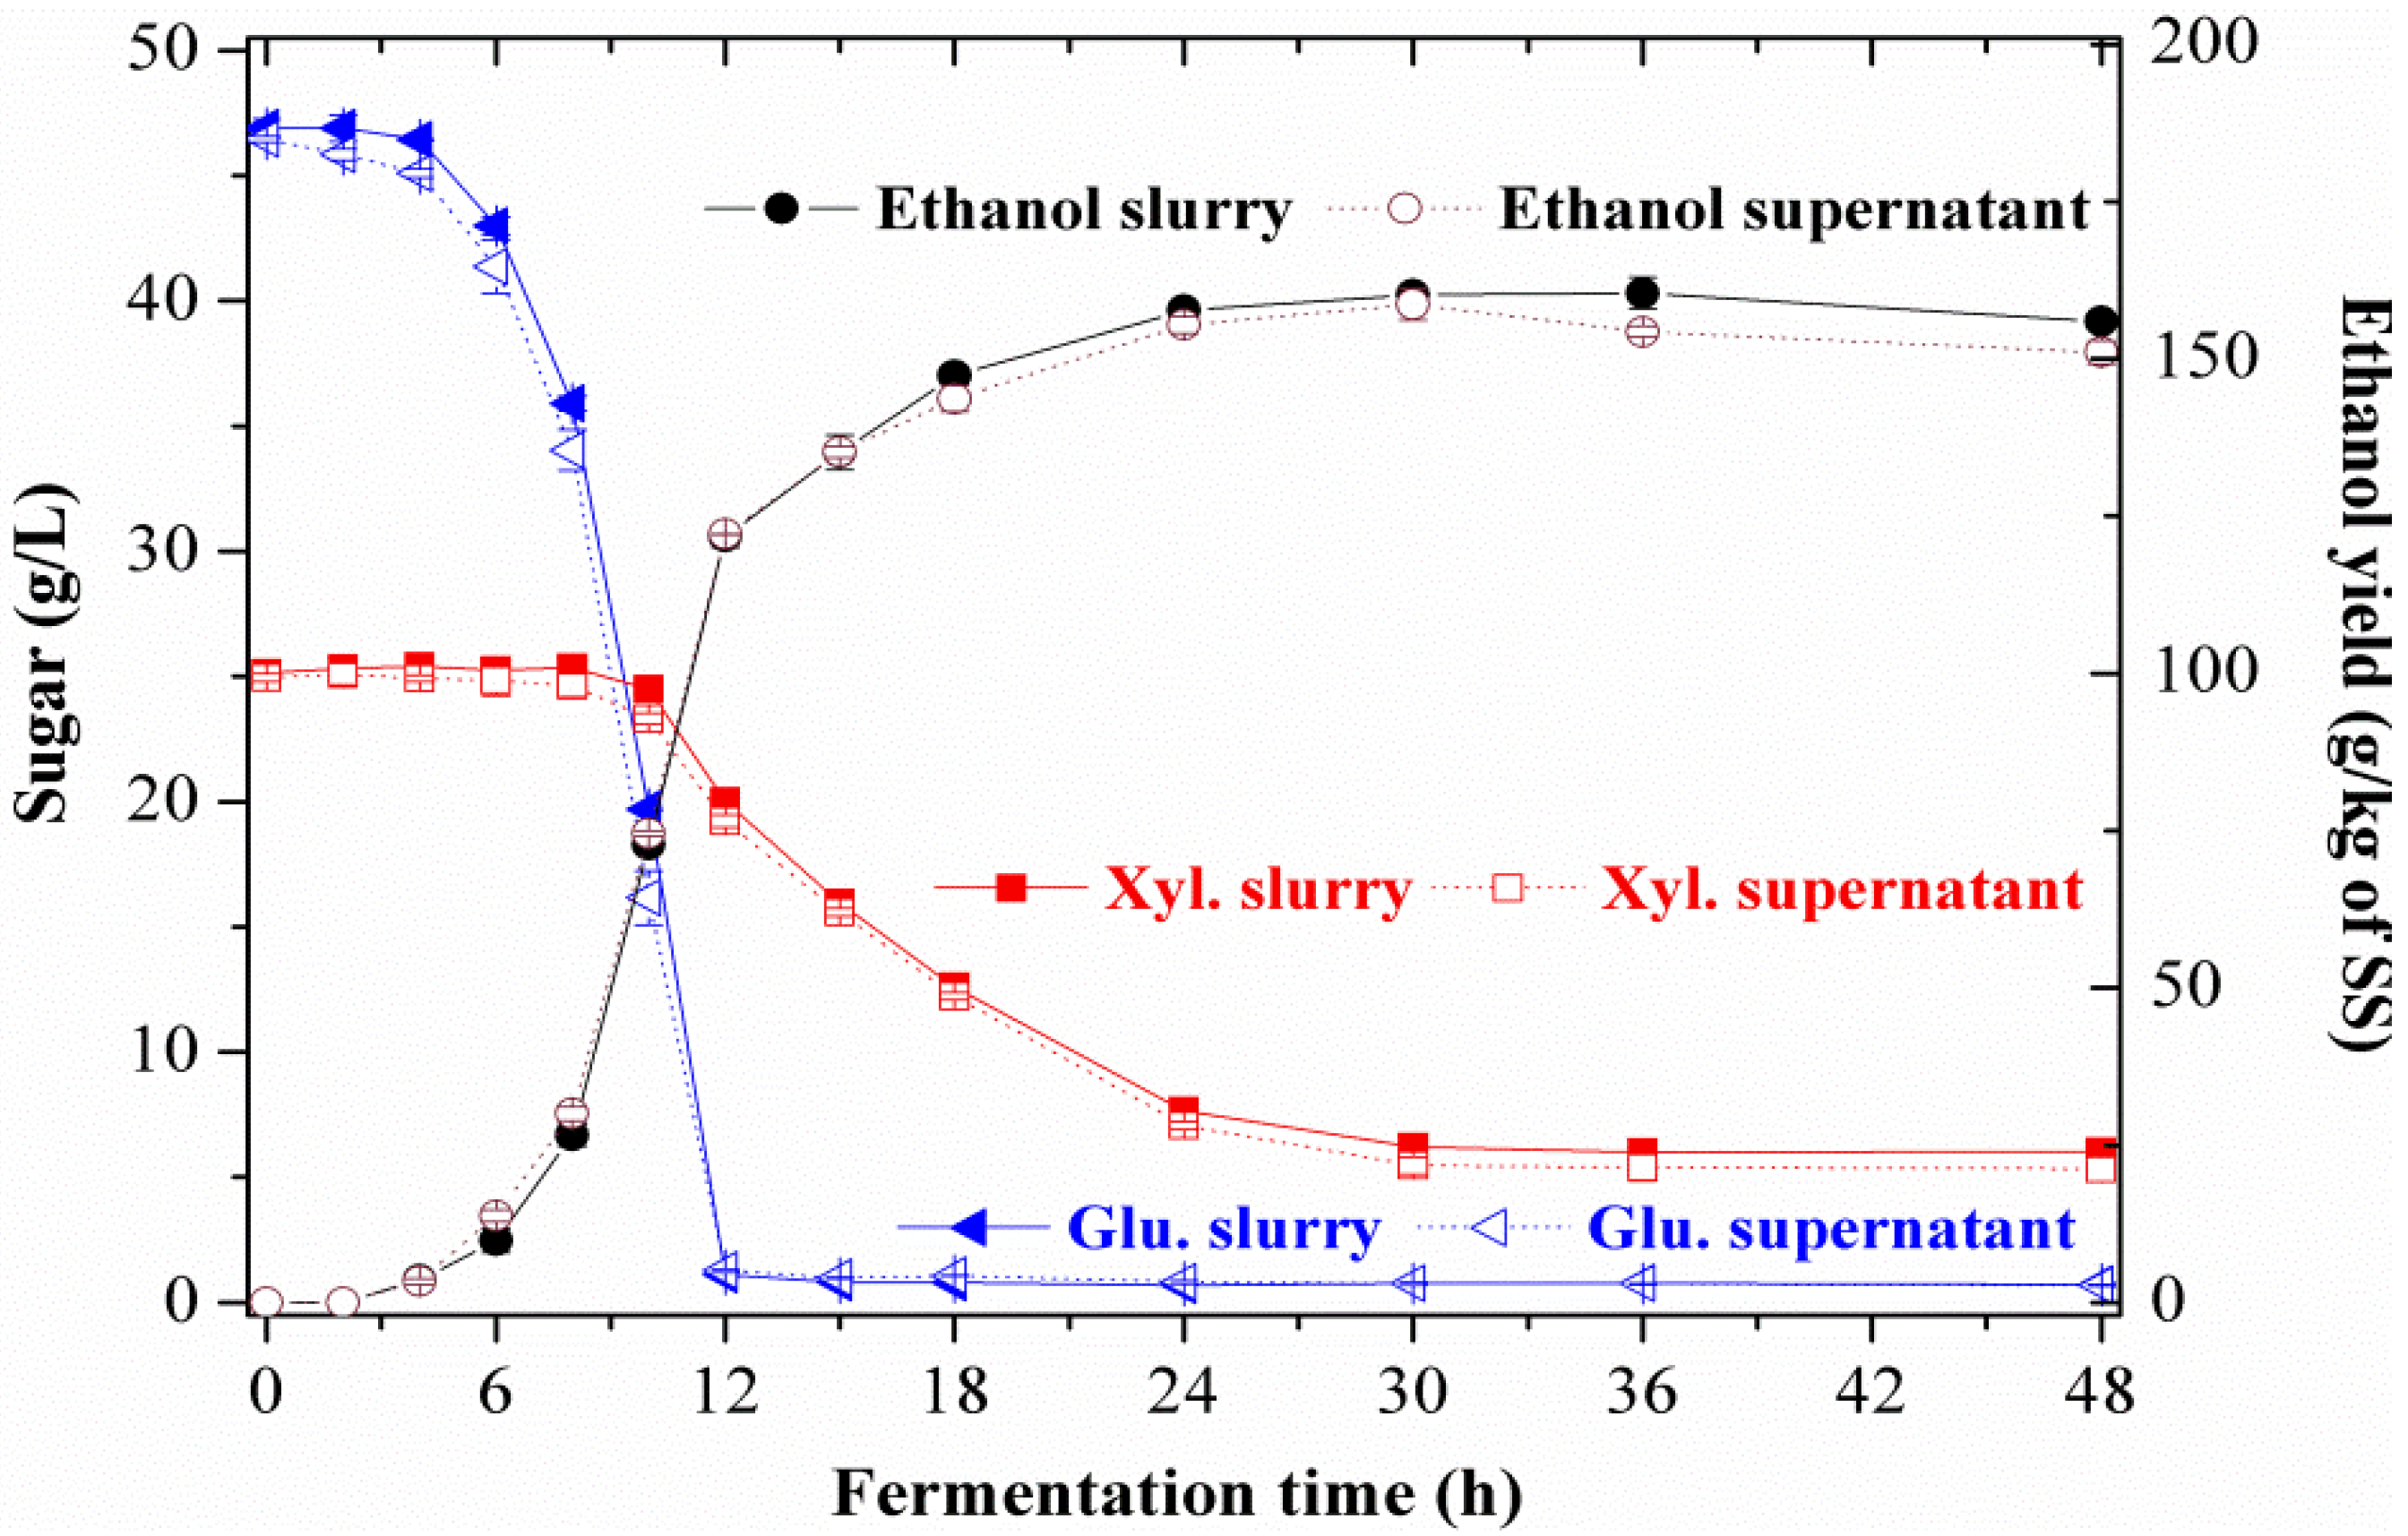
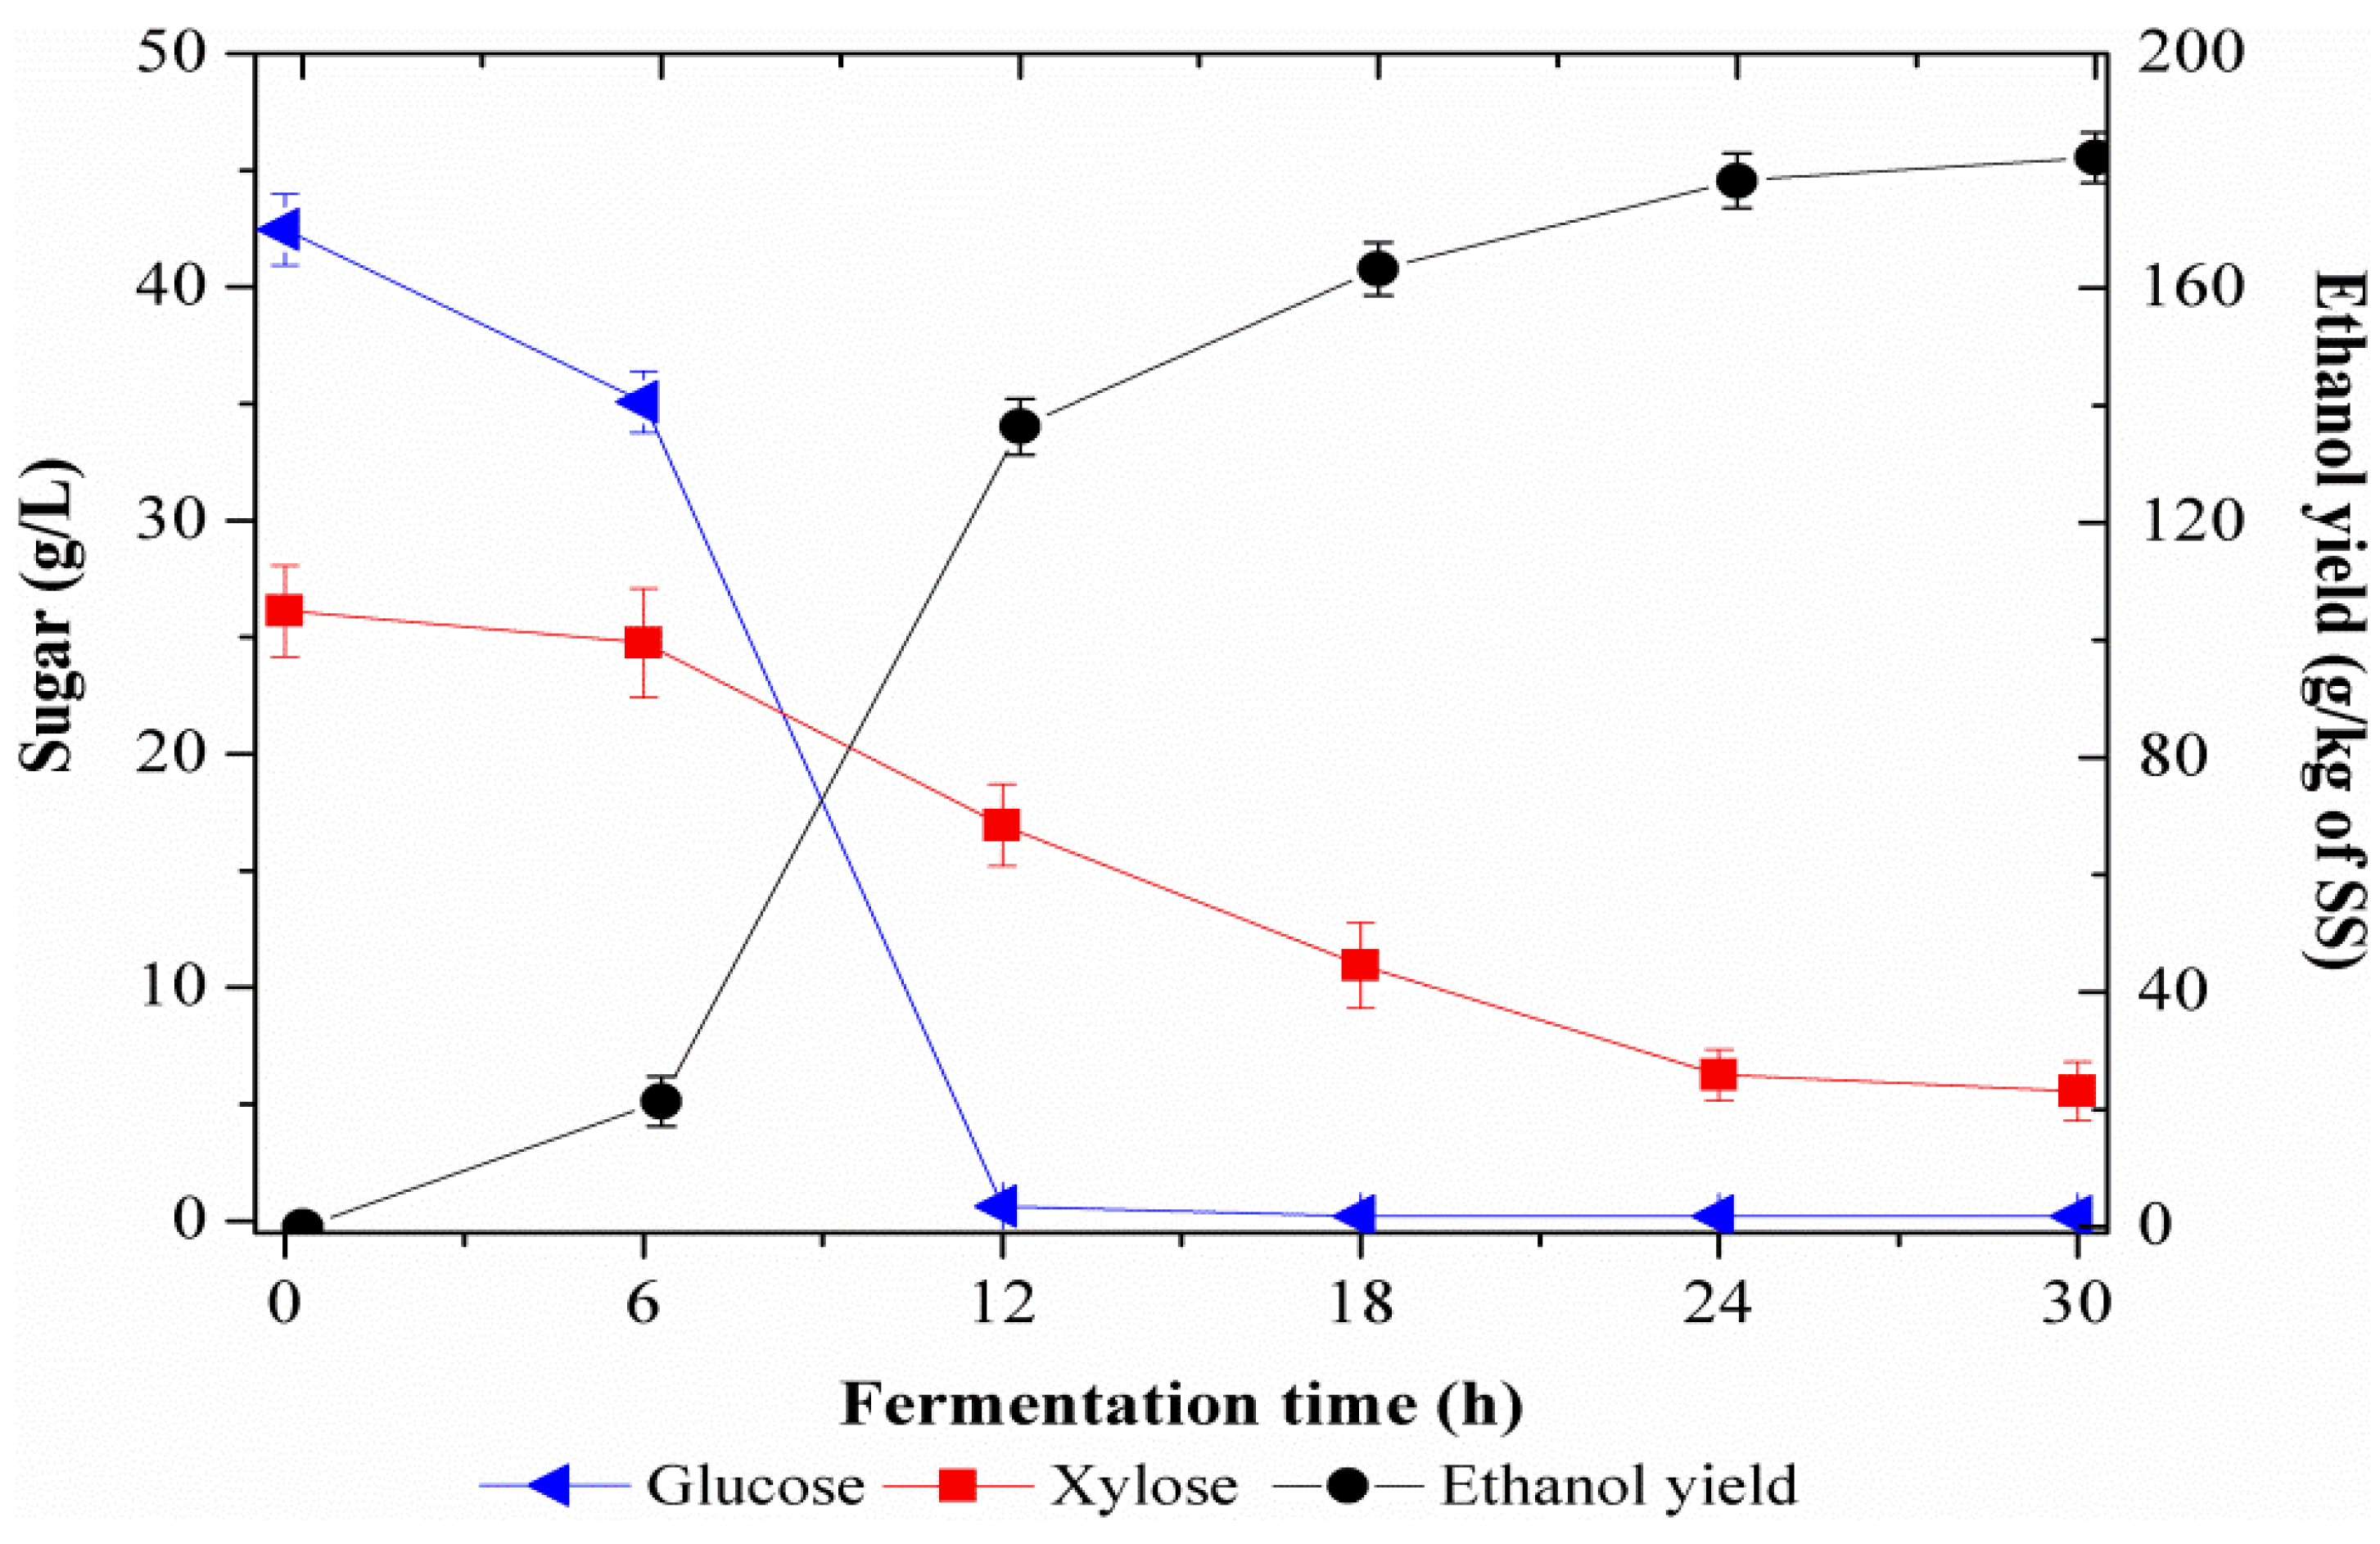
2.1. Determination of the Optimum Fermentation Duration

In order to investigate the influence of residual solids on the performance of ethanol production by Z. mobilis, fermentation using the whole slurry or only the supernatant was compared. From Figure 1, similar concentrations of glucose and xylose remained in both the hydrolyzed slurry and the supernatant after 48 h of fermentation. Ethanol yield slightly decrease from 155.56 g/kg to 151.01 g/kg when using the supernatant compared to the slurry. Removal of residual solids prior to the fermentation appeared to have no or very little effect on improving the ethanol production.
Also from Figure 1, ethanol accumulated rapidly during the first 24 h of fermentation with ethanol yield at 157.68 g/kg and 155.37 g/kg for the hydrolyzed slurry and the supernatant respectively. Ethanol yield plateaued after 24 h of fermentation in both samples. These results indicated that the maximum ethanol production had already been reached by this time. In addition, glucose was depleted in both samples after 12 h of fermentation. Xylose concentration in both samples was reduced gradually from about 25 g/L to a stable 5 g/L from 12 h to 24 h. These results suggested that most of the available fermentable sugars for fermentation from the hydrolysis step had already been utilized by Z. Mobilis TSH-ZM-01 strains after 24 h. Therefore, the optimum time for maximum ethanol production and minimum fermentation appeared to be 24 h and was used for all subsequent experiments.
Figure 1. Sugar and ethanol concentration changed during fermentation with a Z. mobilis TSH-ZM-01 in both hydrolyzed slurry and supernatant.
Energies 07 04054 g001

2.2. Box-Behnken Designs for Optimization of SSCF of SS

Once the optimal fermentation time was determined, a Box-Behnken design was utilized to test four different independent variables in the fermentation process. Twenty-nine conditions in triplicates were set up and shown in Table 1. The resulting ethanol yield for each experimental trial was listed along with the predicted values. The predicted values were calculated from the following polynomial equation. The equation was obtained using multiple regression analysis and was employed to explain the role of each variable and their second order interactions in ethanol yield. The equation for the model as a function of the coded factors was given in the Equation (1):
Y = 143.93 + 53.59 z 1 + 8.42 z 2 + 2.92   z 3 + 13.48 z 4 6.09 z 1 z 2 1.07 z 1 z 3 + 3.25 z 1 z 4 4.67 z 2 z 3 1.26 z 2 z 4 + 4.93 z 3 z 4 51.04 z 1 2 0.55 z 2 2 5.54 z 3 2 10.41 z 4 2
Table 1. Box-Behnken design (coded values) and experimental data for response surface methodology (RSM).
No.Process parametersEthanol yield (g/kg of SS)
z1z2z3z4Experiment aPredicted
Cellulase loading (g/g-glucan)Xylanase loading (g/g-xylan)Liquid to solid ratioPrehydrolysis duration (h)
1−1−10033.40 ± 2.0527.24
21−100149.75 ± 1.88146.60
3−110055.41 ± 2.0256.25
41100147.40 ± 1.56151.26
500−1−1115.64 ± 2.75119.51
6001−1114.35 ± 2.21115.48
700−11140.05 ± 0.97136.61
80011158.49 ± 2.41152.31
9−100−127.63 ± 2.8521.66
10100−1128.52 ± 2.86122.34
11−100137.11 ± 1.1942.12
121001151.00 ± 2.02155.81
130−1−10113.98 ± 1.74124.84
1401−10150.39 ± 2.35151.00
150−110141.78 ± 1.88140.01
160110159.53 ± 1.56147.51
17−10−1037.30 ± 0.9332.77
1810−10149.43 ± 2.09142.08
19−101029.92 ± 1.5340.74
201010137.78 ± 1.96145.79
210−10−1110.86 ± 1.25112.82
22010−1126.96 ± 1.51132.16
230−101144.02 ± 1.65142.30
240101155.09 ± 3.01156.61
250000152.76 ± 2.81146.93
260000155.56 ± 2.54146.93
270000126.38 ± 1.01146.93
280000150.72 ± 1.36146.93
290000149.25 ± 1.96146.93
Note: a Experiments were carried out in triplicate.
An ANOVA study for the quadratic model was used to evaluate the impact and significance of terms such as linear terms, squared terms and interactions in the regression equation, and results are shown in Table 2. A smaller magnitude p-value indicates greater significance for the corresponding coefficient. In this study, p-values less than 0.05 indicated that the corresponding coefficient terms were significant. The results from Table 2 showed that the model was highly significant, as evident from the probability p-value (<0.0001). The lack of fit was observed to be insignificant (p-lack of fit = 0.7741), indicating the model was adequate to fit the experimental data. The high value of the coefficient of determination (R2) of 0.9761 implied that only 2.39% of the total variation was not explained by the model. The vicinity of the adjusted R2 (0.9522) to R2 means a good adjustment of the theoretical response values to the experimental data by the developed model. The predicted R2 is 0.9029, which is in reasonable agreement with the adjusted R2. Adequate precision measures the signal to noise ratio. A ratio of adequate precision greater than 4 is desirable. In this study, the adequate precision value was 19.037, which indicated an adequate signal. A low value for the coefficient of variation (CV, CV = 8.28%) indicated that the experiments were precise and reliable. Therefore, the developed model is suitable and can be used to navigate the designed space and predict the response.
Table 2. ANOVA for the fitted quadratic model and simplified mode a.
SourceCoefficient aSum of squaresD bMean squareF-valuep-value
ANOVA for the fitted quadratic model of ethanol theoretical yield
Model-55,539.74143967.1240.83<0.0001
Intercept146.93-----
Cellulase loading (z1)53.5934,466.38134,466.38354.71<0.0001
Xylanase loading (z2)8.42849.911849.918.750.0104
Liquid to solid ratio (z3)2.92102.381102.381.050.3221
Prehydrolysis duration (z4)13.482181.4712181.4722.450.0003
z1 × z2−6.09148.291148.291.530.2370
z1 × z3−1.074.5514.550.0470.8319
z1 × z43.2542.31142.310.440.5201
z2 × z3−4.6787.07187.070.900.3599
z2 × z4−1.266.3216.320.0650.8025
z3 × z44.9397.31197.311.000.3339
z12−51.0416,900.58116,900.58173.93<0.0001
z22−0.551.9711.970.0200.8888
z32−5.54199.391199.392.050.1740
z42−0.41702.951702.957.230.0176
Lack of fit-809.711080.970.590.7741
ANOVA for the simplified mode of ethanol theoretical yield
Model-54,850.46510,970.09123.10<0.0001
Intercept56.05-----
Cellulase loading (z1)20.7234,466.38134,466.38386.77<0.0001
Xylanase loading (z2)3.18849.911849.919.540.0052
Prehydrolysis duration (z4)5.272181.4712181.4724.48<0.0001
z12−19.5417,306.33117,306.33194.21<0.0001
z42−3.52615.121615.126.900.0151
Lack of fit-1498.981978.890.570.8182
Note: a R2 = 0.9761; adjusted R2 = 0.9522; predicted R2 = 0.9029; adequate precision = 19.037; CV% = 8.28. b degree of freedom.
A positive sign for the coefficient indicated that the tested variables had a synergistic effect on the ethanol yield while a negative coefficient indicated an antagonistic effect [16]. Statistical analysis showed that cellulase loading (p < 0.0001), xylanase loading (p = 0.0104) and PD (p = 0.0003) had a significant positive linear effect (p < 0.05) on ethanol yield while cellulase loading (p < 0.0001) and PD (p = 0.0176) had a significant negative quadratic effect (p < 0.05). These results indicated that ethanol yield increased with the increase of cellulase loading, xylananse loading and PD, however, yield decreased when the cellulase loading and PD were raised above a certain level. Moreover, the most effective factor was cellulase loading (F = 354.71), then by prehydrolysis duration (F = 22.45) and followed by xylananse loading (F = 8.75). The positive linear effect of LSR, the negative quadratic effect of xylananse loading and LSR were insignificant at the 5% level. The interaction between each two variables was observed to be insignificant at the 5% level. After removing the insignificant factors, the improved second order polynomial regression model was described in Equation (2):
Y = 143.61 + 53.59 z 1 + 8.42 z 2 + 13.48 z 4 50.07 z 1 2 9.44 z 4 2
The coefficient estimates and p-values of the simplified model were also presented in Table 2.

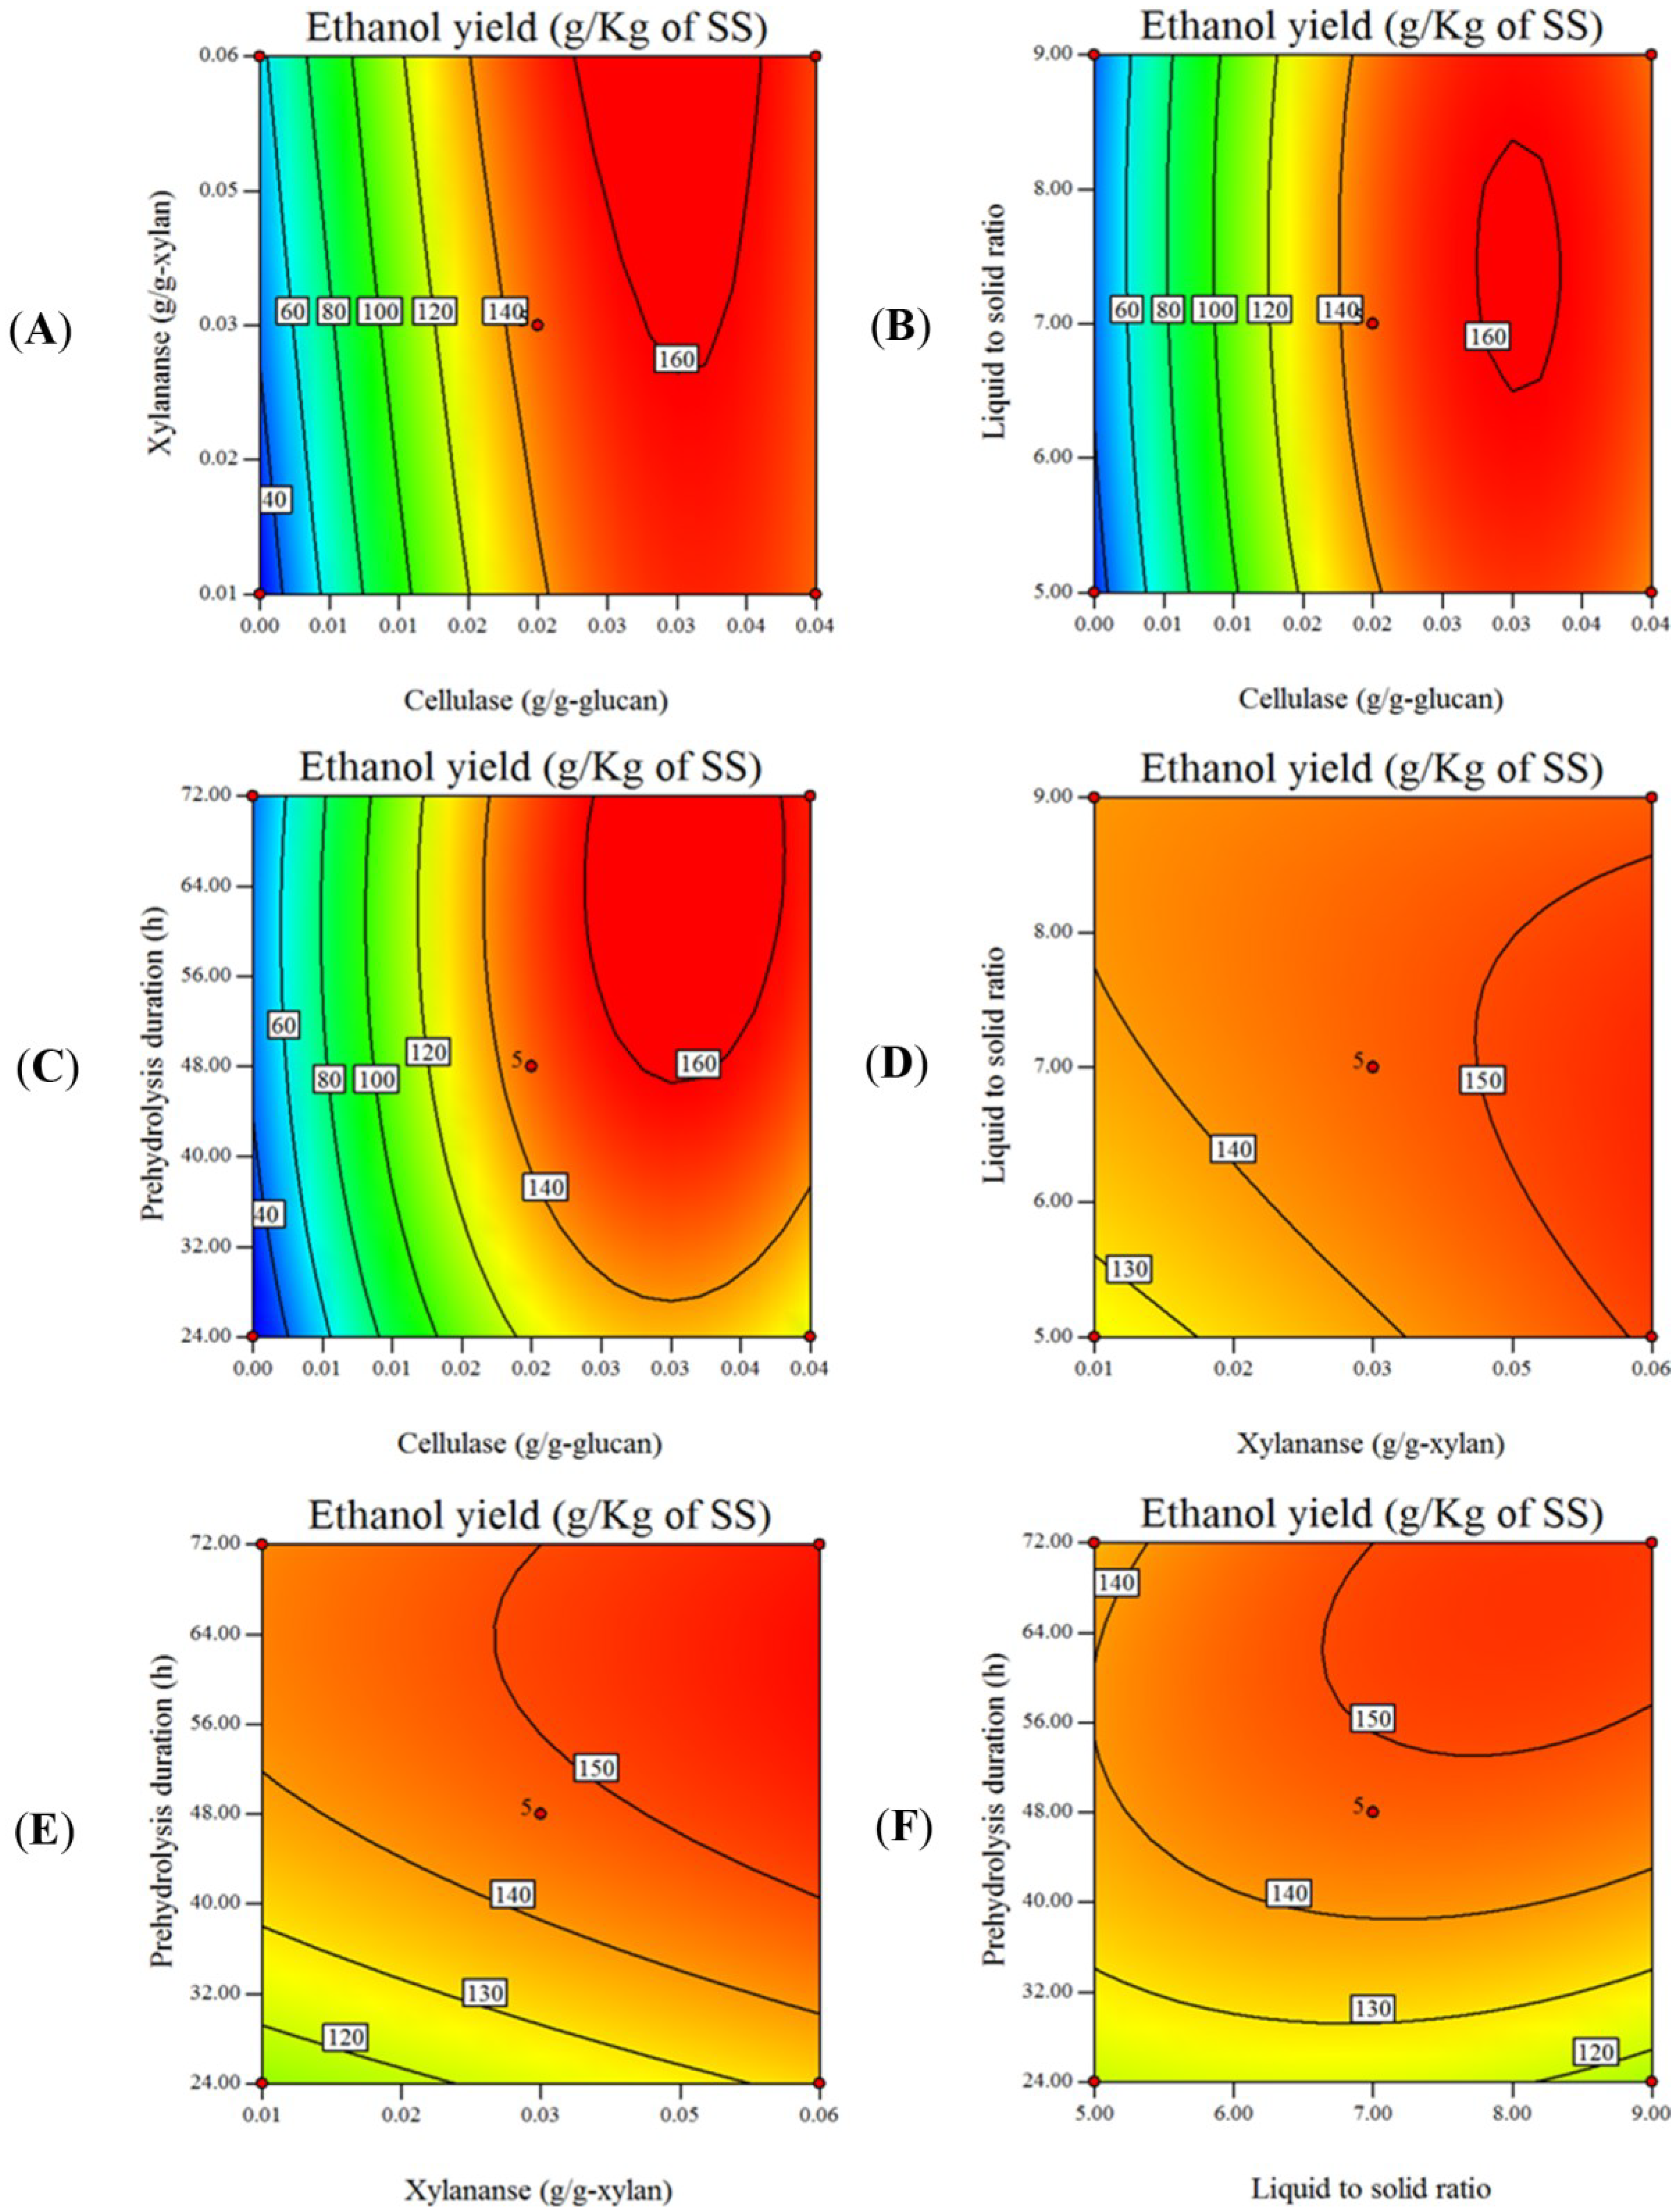
2.3. Effect of Cellulase and Xylanase Loading, Pre-Hydrolysis Duration and Liquid to Solid Ratio on Ethanol Yield

The effects of processing variables on ethanol yield were analyzed using contour plots. Figure 2 showed the effects of two independent variables on the response while the other two variables were held constant at the middle range. From Figure 2A–C, ethanol yield increased with the increase of cellulase loading until it was raised above 0.04 FPU/g-glucan. The increase of cellulase loading may enhance the release of glucose, which would promote bacterium growth and ethanol production. On the other hand, Z. mobilis TSH-ZM-01 did not have specialized xylose transporters but depended on hexose transporters to transport xylose [15]. Therefore, xylose consumption does not start until glucose is nearly depleted. Further increase in cellulase loading beyond 0.04 FPU/g-glucan may lead to rapid accumulation of glucose in the hydrolyzed slurry and consequently repressed the xylose metabolism within the 24 h of fermentation, which could cause the underutilization of total fermentable sugars (glucose plus xylose) by Z. mobilis TSH-ZM-01 strain and lead to the reduction of the final ethanol yield.
Figure 2E,F depicts the effect of PD on the ethanol yield. From Figure 2F, the ethanol yield increased with the increase of the PD from 24 h to 64 h when the LSR was held at a constant level (1:7). When the PD was raised above 64 h, the ethanol yield decreased. Similar trend was observed in Figure 2E when the xylanase loading was held at a constant level (0.03 g/g-xylan). The results from Figure 2E,F were consistent with experiments which pre-hydrolysis duration had a positive linear effect and a significant negative quadratic effect on the ethanol yield. Although an increase in PD could promote release of hexose and pentose, high monosaccharide concentration could lead to product inhibition by glucose of the cellulases [17]. Moreover, monosaccharide accumulation could lead to the inhibition of microbial growth and slowed down the metabolism [18]. At the same time, slow heat dispersion along with too rapid saccharification may have resulted in heat accumulation and temperature elevation [19], which consequently could decrease enzyme activities and cell viability. Therefore, further extension of pre-hydrolysis duration would hamper ethanol production. Hence, determining the optimum PD is essential for SSCF.
Figure 2. Contour plots for the effects of two variables on the ethanol yield while the other two variables were held constant at the middle.
Energies 07 04054 g002
The effect of xylanase loading on the ethanol yield was shown as contour plot in Figure 2D,E. Figure 2D showed that the ethanol yield continuously increased with the increase of the xylanase loading when LSR ranged from 5:1 to 9:1. Similar trend was observed in Figure 2E with PD from 24 h to 72 h. Increased xylananse loading would enhance release of xylose making the sugar available for Z. mobilis TSH-ZM-01 fermentation. However, further increase in addition of xylananse had only a slight effect on ethanol yield. This could be attributed to that the metabolism of xylose by Z. mobilis TSH-01 was hysteresis [15], which resulted in only partial xylose utilization in the hydrolyzed slurry by Z. mobilis TSH-ZM-01 strain during the 24 h SSCF.
The result that LSR had insignificant effect on ethanol yield differ drastically from what would have been expected, as LSR was often considered to be one of the most important parameters affecting saccharification and fermentation [20,21,22]. Reasons from these results still need to be further investigated.

2.4. Validation of the Model

The model predicted a maximum ethanol yield of 170.46 g/kg of SS under the optimum parameters of cellulase loading at 0.03 g/g-glucan (6.42 FPU/g-glucan), xylanase loading at 0.06 g/g-xylan (1059.48 U/g-xylan), PD for 65 h and LSR of 7:1. In order to validate the optimized parameters and the predicted ethanol yield, triplicate fermentations were performed. As shown in Figure 3, the hydrolyzed slurry contained 42.45 g/L glucose and 26.13 g/L xylose after 65 h. Shortly after adding the seed culture of the Z. mobilis TSH-ZM-01 cells, concentration of both glucose and xylose in the fermentation broth dropped rapidly, while the ethanol yield increased rapidly (Figure 3). The maximum ethanol yield of 182.29 g/kg of SS was achieved at 30 h SSCF. On the other hand, the increased ethanol yield almost remains unchanged after 24 h SSCF. This result was in accordance with the comparison fermentation experiment in which 24 h was the optimum fermentation duration (Figure 1). Under the optimum SSCF condition, 179.20 g/kg of SS ethanol yield was achieved, which were equivalent of an ethanol concentration of 39.04 g/L and an ethanol theoretical yield of 69.85% respectively. These results agreed with previously published data. Wang et al. [21] reported an ethanol concentration of 39 g/L on H2SO4 pretreated sweet sorghum bagasse with an enzyme loading of 29 FPU/g-glucan and initial bagasse solid concentration of 10%. Chen et al. [23] reported an ethanol yield 210 g/kg of raw material from ammonia hydroxide pretreated sweet sorghum bagasse with addition of 60 FPU/g of glucan supplemented with 64 CBU/g of glucan β-glucosidase. Shen et al. [24] obtained ethanol concentration of 23.2 g/L after fermentation of steam explosion pretreated sweet sorghum bagasse supplemented with cellulase at 7.5 FPU/g dry material of cellulase and β-glucosidase at 64 CBU/g dry material. Leonidas and Paul reached an ethanol theoretical yield of 70.4% with sweet sorghum bagasse with cellulase loading of 10 FPU/g dry material in the saccharification step and extra loading of 10 FPU/g dry material at start-up of simultaneous saccharification and fermentation [22]. Our results in this study were similar to the studies mentioned above but achieved with lower enzyme consumption and higher LSR. Therefore, the optimized process in this study would significantly reduce the capital cost during SSCF process, and improve the commercial potential of cellulosic ethanol production.
Figure 3. Sugar and ethanol concentration changed during SSCF with a Z. mobilis TSH-ZM-01 in 10 g NaOH pretreated SS under optimal condition.
Energies 07 04054 g003

3. Experimental Section

3.1. Solid State Fermented Sweet Sorghum Bagasse (SS)

Sweet sorghum “Chuntian 2#” was harvested in Hebei Province, China. Leaves and husks were stripped by hand. The stem was crushed into particles of 1–2 mm in diameter, and 3–20 mm in length by a pulverizer. The solid-state ethanol fermentation of sweet sorghum stem was conducted according to Li et al. [5]. The solid state fermented sweet sorghum bagasse (SS), the solid residue left after solid-state ethanol fermentation, was saved after the fermentation of soluble carbohydrates. The SS were stored in a sealed plastic bag at −20 °C to prevent any possible degradation or spoilage.

3.2. NaOH Pretreatment

NaOH pretreatment was performed according to Yu et al. [25]. After sodium hydroxide pretreatment, the whole slurry was collected and solid-liquid separation was performed by centrifuge. The separated solids were washed with deionized water until pH reached 7.0. The washed solids (called substrate) were used for ethanol production. The composition of substrate was determined by the NREL method [26,27]. The composition of substrate (w/w) was determined as: 54.80% ± 0.53% glucan, 30.15% ± 0.47% xylan and 9.92% ± 0.67% lignin.

3.3. Microbes and Media

An engineered strain Z. mobilis TSH-ZM-01 recombined by Tsinghua University [15] was used for SSCF. The ethanol-producing bacterium Z. mobilis was metabolically engineered to tetracycline resistance and broaden its range of fermentable substrates to include the pentose sugar xylose. The microbe was stored in rich medium agar slants containing glucose 20 g/L, yeast extract 10 g/L, KH2PO4 2 g/L, and agar 15 g/L with a pH of 6.0 and in liquid medium of the same composition (without agar) by periodic transfers. For long-term storage, stock cultures were maintained in 20% glycerol at −80 °C. The microbe was sub-cultured before each experiment in order to maintain its viability.

3.4. Fermentation Experiment

Autoclaved substrate (10 g) was added to a 250 mL flask and diluted with sodium acetate buffer (50 mM) to reach the LSR of 7:1. The substrate was pre-hydrolyzed with cellulase loading of 0.02 g/g-glucan, xylanase loading of 0.03 g/g-xylan at pH 4.8, 50 °C and 150 rpm for 48 h. The experimental parameters were employed according to previous experiment. For the comparison fermentation experiment, partial hydrolyzed slurry was centrifuged to remove the solid residues, and the supernatant was collected. Before ethanol fermentation, the pH and temperature were adjusted to 6.0 and 32 °C, respectively. The comparison fermentation between the whole slurry and its supernatant was carried out with the same strain (Z. mobilis TSH-01) for 48 h. The initial Z. mobilis TSH-01 seed culture of 10% (v/v) was cultured with autoclaved 10X yeast peptone media, containing 10 g of yeast extract, and 100 g of peptone per liter of distilled water, as nutrients. Experiments were performed in triplicate.

3.5. Simultaneous Saccharification and Co-Fermentation (SSCF)

SSCF was performed according to Jin et al. with minor modifications [10]. Autoclaved substrate (10 g) was added to the 250 mL flask and diluted with sodium acetate buffer (50 mM) to reach the indicated liquid-solid ratio. Prior to SSCF, the substrate was pre-hydrolyzed with indicated concentration of enzymes at pH 4.8, 50 °C and 150 rpm for the indicated time. After pre-hydrolysis, the pH and temperature was adjusted to 6.0 and 32 °C, respectively. 10% (v/v) of autoclaved 10× yeast peptone media, containing 10 g of yeast extract, 100 g of peptone per liter of distilled water, was added to the flask containing enzymatic slurry as nutrients, and then the hydrolyzed slurry was inoculated with 10% (v/v) of Z. mobilis TSH-01 seed culture. Samples were taken at the indicated time, and centrifuged at 15,000 rpm, 4 °C for 10 min. The supernatant was collected for the sugar and ethanol analysis. Experiments were carried in triplicate.

3.6. Analytical Methods

3.6.1. Enzyme Assay

Both Cellulase (CTec-3) and xylanase (HTec-3) were kindly provided by Novozyme Co. Ltd., Tianjin, China. Celluclase activity was 213.87 FPU/g determined by NREL method [28]. Xylanase activity was 17658 U/g determined according to the State Standard of the People’s Republic of China (GB/T 23874–2009).

3.6.2. Monomeric Sugars and Ethanol

The monomeric sugars, including glucose and xylose were measured with a HPLC (Shimadzu LC-20AD, Tokyo, Japan) integrated with a refractive index detector and a Bio-Rad HPX-87H (250 mm × 4.6 mm) column. Ethanol was analyzed on a gas chromatograph (SHIMADZU GC-14C) with a flame ionization detector. Ethanol yield was determined using Equation (3):
 Y ethanol yield   ( g kg 1 of SS ) = C ethanol , final   ×   V final   × 0.542 M substrate × 1000
Cethanol represents the ethanol concentration in the liquor fractions after fermentation (g/L); VFinal represents the final volume of fermentation broth (L); Msubstrate represents the mass of substrate (g); and 0.542 represents the solid recovery coefficient after NaOH pretreatment.

3.6.3. Experimental Design and Statistical Analysis

Box-Behnken designs (BBD) are a class of rotatable or nearly rotatable second-order designs based on three-level incomplete factorial design. It has the advantage of avoiding experiments performed under undesirable extreme conditions [29]. In this study, a Box-Behnken design with 24 factorial experiments and five center point experiments was used to determine the optimum condition during SSCF of NaOH pretreated SS. The cellulase loading (0–0.04 g/g-glucan), xylanase loading (0.01–0.06 g/g-xylan), LSR (5:1–9:1) and PD (24–72 h) were independent variables studied for optimization of the ethanol yield. The design was represented by a second-order polynomial regression model to generate contour plots:
Y = β 0 + i = 1 k β i x i + i = 1 k β i i x i 2 + 1 i j k β i j x i x j + ε
Y is the response of ethanol yield; xi is process factors; β0 is the offset coefficient; βi is linear coefficients; βii is quadratic coefficients; βij is interaction coefficients and ε is the residual associated to the experiments. The relationship between the actual value of process factor and the coded forms of the input variable is described as Equation (4):
z j = x i x 0 j
where zj is the coded value of the input variable; xi is its real value; x0 is its real value at the central point; and j is the step change in the variable xi. The regression analysis of experimental data was performed in Design-Expert software version 8.0.2 (Stat-Ease Inc., Minneapolis, MN, USA) to determine the coefficients of the regression equation and estimate the response surface.

4. Conclusions

24 h fermentation duration without residual solid removal was optimum for the ethanol production. Ethanol yield of 179.20 g/kg of alkali pretreated SS was achieved under the optimum conditions: Cellulase loading of 0.03 g/g-glucan, xylananse loading of 0.06 g/g-xylan, LSR of 7:1 and PD for 65 h. Ethanol yield achieved in this study were similar to the studies in recent articles but with lower enzyme consumption and higher LSR [21,22,23,24]. Further work still need to be done to quantitatively understanding reduced fermentation performance in NaOH treated SS hydrolysate using Z. mobilis TSH-ZM-01 and scale up the SSCF process with optimization of operating parameters for industrial application.

Acknowledgments

This research was funded by the Ministry of Science and Technology of China, International S&T Cooperation program (Grant No. 2013DFA60470 and 2012DFG61720) and National Key technologies R&D Program (Grant No. 2011BAD22B03), 863 Project (Grant No. 2012AA101805). We would like to thank Ran Du and Yan Jiang for their analytical and technical help.

Author Contributions

Menghui Yu conducted the experiments and wrote the manuscript. Shizhong Li, Jihong Li and Ran Du designed the experiments. All authors read and approved the final manuscript SS and BAS (Supervisors) conceived of this study and edited the manuscript.

Conflicts of Interest

The authors declare no conflict of interest.

References

  1. Carrillo, M.A.; Staggenborg, S.A.; Pineda, J.A. Washing sorghum biomass with water to improve its quality for combustion. Fuel 2014, 116, 427–431. [Google Scholar] [CrossRef]
  2. Yin, R.Z.; Liu, R.H.; Mei, Y.F.; Fei, W.T.; Xun, X.Q. Characterization of bio-oil and bio-char obtained from sweet sorghum bagasse fast pyrolysis with fractional condensers. Fuel 2013, 112, 96–104. [Google Scholar] [CrossRef]
  3. Ren, L.T.; Liu, Z.X.; Wei, T.Y.; Xie, G.H. Evaluation of energy input and output of sweet sorghum grown as a bioenergy crop on coastal saline-alkali land. Energy 2012, 47, 166–173. [Google Scholar] [CrossRef]
  4. Yu, J.L.; Zhong, J.; Zhang, X.; Tan, T.W. Ethanol production from H2SO3-steam pretreated fresh sweet sorghum stem by simultaneous saccharification and fermentation. Appl. Biochem. Biotechnol. 2010, 160, 401–409. [Google Scholar] [CrossRef] [PubMed]
  5. Li, S.Z.; Li, G.M.; Zhang, L.; Zhou, Z.X.; Han, B.; Hou, W.H.; Wang, J.B.; Li, T.C. A demonstration study of ethanol production from sweet sorghum stems with advanced solid state fermentation technology. Appl. Energy 2013, 102, 260–265. [Google Scholar] [CrossRef]
  6. Mosier, N.; Wyman, C.; Dale, B.; Elander, R.; Lee, Y.Y.; Holtzapple, M.; Ladisch, M. Features of promising technologies for pretreatment of lignocellulosic biomass. Bioresour. Technol. 2005, 96, 673–686. [Google Scholar] [CrossRef] [PubMed]
  7. Tao, L.; Andy, A.; Elander, R.T.; Pallapolu, V.R.; Lee, Y.Y.; Garlock, R.J.; Balan, V.; Dale, B.E.; Kim, Y.; Mosier, N.S.; et al. Process and technoeconomic analysis of leading pretreatment technologies for lignocellulosic ethanol production using switchgrass. Bioresour. Technol. 2011, 102, 11105–11114. [Google Scholar]
  8. Li, J.H.; Han, B.; Yu, M.H.; Li, G.M.; Jiang, Y.; Li, S.Z. A novel cost-effective technology to convert sucrose and homocelluloses in sweet sorghum stalks into ethanol. Biotechnol. Biofuels 2013, 6, 174:1–174:12. [Google Scholar]
  9. Taherzadeh, M.J.; Karimi, K. Pretreatment of lignocellulosic wastes to improve ethanol and biogas production: A review. Int. J. Mol. Sci. 2008, 9, 1621–1651. [Google Scholar] [CrossRef] [PubMed]
  10. Jin, M.; Sarks, C.; Gunawan, C.; Bice, B.D.; Simonett, S.P.; Narasimhan, R.A.; Willis, L.B.; Dale, B.E.; Balan, V.; Sato, T.K.; et al. Phenotypic selection of a wild Saccharomyces cerevisiae strain for simultaneous saccharification and co-fermentation of AFEX™ pretreated corn stover. Biotechnol. Biofuels 2013, 6, 108:1–108:14. [Google Scholar] [CrossRef]
  11. Bai, F.W.; Anderson, W.A.; Moo-Young, M. Ethanol fermentation technologies from sugar and starch feedstocks. Biotechnol. Adv. 2008, 26, 89–105. [Google Scholar] [CrossRef] [PubMed]
  12. Panesar, P.S.; Marwaha, S.S.; Kennedy, J.F. Zymomonas Mobilis: An Alternative Ethanol Producer. J. Chem. Technol. Biotechnol. 2006, 81, 623–635. [Google Scholar] [CrossRef]
  13. Davis, L.; Jeon, Y.J.; Svenson, C.; Rogers, P.; Pearce, J.; Peiris, P. Evaluation of wheat stillage for ethanol production by recombinant Zymomonas mobilis. Biomass Bioenergy 2005, 29, 49–59. [Google Scholar] [CrossRef]
  14. Saharkhiz, S.; Mazaheri, D.; Shojaosadati, S.A. Evaluation of bioethanol production from carob pods by Zymomonas mobilis and Saccharomyces cerevisiae in solid submerged fermentation. PREP Biochem. Biotechnol. 2013, 43, 415–430. [Google Scholar] [CrossRef] [PubMed]
  15. Feng, Q.Z.; Li, S.Z.; Wang, L.; Li, T.C. Evaluation on glucose-xylose co-fermentation by a recombinant Zymomonas mobilis strain. Chin. J. Biotechnol. 2012, 28, 37–47. [Google Scholar]
  16. Hasan, S.H.; Srivastava, P.; Talat, M. Biosorption of Pb(II) from water using biomass of Aeromonas hydrophila: Central composite design for optimization of process variables. J. Hazard. Mater. 2009, 168, 1155–1162. [Google Scholar] [CrossRef] [PubMed]
  17. Andrić, P.; Meyer, A.S.; Jensen, P.A.; Dam-Johansen, K. Reactor design for minimizing product inhibition during enzymatic lignocellulose hydrolysis: II. Quantification of inhibition and suitability of membrane reactors. Biotechnol. Adv. 2010, 28, 407–425. [Google Scholar] [CrossRef] [PubMed]
  18. Mazaheri, D.; Shojaosadati, S.A.; Mousavi, S.M.; Hejazi, P.; Saharkhiz, S. Bioethanol production from carob pods by solid-state fermentation with Zymomonas mobilis. Appl. Energy 2012, 99, 372–378. [Google Scholar] [CrossRef]
  19. Pandey, A. Solid-state fermentation. Biochem. Eng. J. 2013, 13, 81–84. [Google Scholar]
  20. Matsakas, L.; Christakopoulos, P. Fermentation of liquefacted hydrothermally pretreated sweet sorghum bagasse to ethanol at high-solids content. Bioresour. Technol. 2013, 127, 202–208. [Google Scholar] [CrossRef] [PubMed]
  21. Wang, L.J.; Luo, Z.L.; Shahbazi, A. Optimization of simultaneous saccharification and fermentation for the production of ethanol from sweet sorghum (Sorghum bicolor) bagasse using response surface methodology. Ind. Crop. Prod. 2013, 42, 280–291. [Google Scholar] [CrossRef]
  22. Matsakas, L.; Christakopoulos, P. Optimization of ethanol production from high dry matter liquefied dry sweet sorghum stalks. Biomass Bioenergy 2013, 5, 91–98. [Google Scholar] [CrossRef]
  23. Chen, C.; Boldor, D.; Aita, G.; Walker, M. Ethanol production from sorghum by a microwave-assisted dilute ammonia pretreatment. Bioresour. Technol. 2012, 110, 190–197. [Google Scholar] [CrossRef] [PubMed]
  24. Shen, F.; Hu, J.; Zhong, Y.; Michael, L.Y.L.; Jack, N.S.; Liu, R. Ethanol production from steam-pretreated sweet sorghum bagasse with high substrate consistency enzymatic hydrolysis. Biomass Bioenergy 2012, 41, 157–164. [Google Scholar] [CrossRef]
  25. Yu, M.H.; Li, J.H.; Li, S.Z.; Du, R.; Jiang, Y.; Fan, G.F.; Zhao, G.; Chang, S. A cost-effective integrated process to convert solid-state fermented sweet sorghum bagasse into cellulosic ethanol. Appl. Energy 2014, 115, 331–336. [Google Scholar] [CrossRef]
  26. Sluiter, A.; Hames, B.; Ruiz, R.; Scarlata, C.; Sluiter, J.; Templeton, D.; Crocker, D. Determination of Structural Carbohydrates and Lignin in Biomass. In Laboratory Analytical Procedure (LAP); National Renewable Energy Laboratory: Golden, CO, USA, 2008. [Google Scholar]
  27. Sluiter, A.; Hames, B.; Hyman, D.; Payne, C.; Ruiz, R.; Scarlata, C.; Sluiter, J.; Templeton, D.; Wolfe, J. Determination of Total Solids in Biomass and Total Dissolved Solids in Liquid Process Samples. In Laboratory Analytical Procedure (LAP); National Renewable Energy Laboratory: Golden, CO, USA, 2008. [Google Scholar]
  28. Adney, B.; Baker, J. Measurement of Cellulase Activities: Laboratory Analytical Procedure. In Laboratory Analytical Procedure (LAP); National Renewable Energy Laboratory: Golden, CO, USA, 2008. [Google Scholar]
  29. Ferreira, S.L.C.; Bruns, R.E.; Ferreira, H.S.; Matos, G.D.; David, J.M.; Brandao, G.C.; da Silva, E.G.; Portugal, L.A.; dos Reis, P.S.; Souza, A.S.; et al. Box-Behnken design: An alternative for the optimization of analytical methods. Anal. Chim. Acta 2007, 597, 179–186. [Google Scholar] [CrossRef] [PubMed]

