Article

Capacity Calculation of Shunt Active Power Filters for Electric Vehicle Charging Stations Based on Harmonic Parameter Estimation and Analytical Modeling

1
State Key Laboratory of Power Transmission Equipment & System Security and New Technology, Chongqing University, Chongqing 400044, China
2
Department of Electrical Engineering, University of Wisconsin-Milwaukee, Milwaukee, WI 53211, USA
*
Author to whom correspondence should be addressed.
Energies 2014, 7(8), 5425-5443; https://doi.org/10.3390/en7085425
Submission received: 1 July 2014 / Revised: 15 August 2014 / Accepted: 18 August 2014 / Published: 22 August 2014

Abstract

:
The influence of electric vehicle charging stations on power grid harmonics is becoming increasingly significant as their presence continues to grow. This paper studies the operational principles of the charging current in the continuous and discontinuous modes for a three-phase uncontrolled rectification charger with a passive power factor correction link, which is affected by the charging power. A parameter estimation method is proposed for the equivalent circuit of the charger by using the measured characteristic AC (Alternating Current) voltage and current data combined with the charging circuit constraints in the conduction process, and this method is verified using an experimental platform. The sensitivity of the current harmonics to the changes in the parameters is analyzed. An analytical harmonic model of the charging station is created by separating the chargers into groups by type. Then, the harmonic current amplification caused by the shunt active power filter is researched, and the analytical formula for the overload factor is derived to further correct the capacity of the shunt active power filter. Finally, this method is validated through a field test of a charging station.

1. Introduction

Due to the increasing environmental pollution and the growing shortage of resources, countries have begun to develop electric vehicles, which necessitate the construction of the corresponding facilities, such as charging stations [1,2]. The increasing installation of nonlinear charging infrastructure in the form of charging stations will produce substantial harmonic pollution in the grid [2,3,4], which may result in some serious consequences (e.g., the increased losses and voltage fluctuations in the network, heating problems and efficiency losses of the electric equipment, the power supply interruptions, or even large scale blackouts) [3,5,6]. These efficiency losses of the power supply infrastructure will also affect the life cycle of alternative electric vehicles, which is important for the choice of the alternative technologies with different pathways [7,8]. Therefore, the electric vehicle manufacturers have adopted the IEC 1000-3-2 [9] and SAE J2894/1 [10] standards for the voltage and current harmonic limits of electric vehicles.
At present, electric vehicle chargers typically use pulse width modulation (PWM) [11] or active power factor correction technology [12] to suppress the harmonics from the charging infrastructure. In earlier charging stations, which used passive power factor correction rectifiers [13,14,15], it was difficult to reduce the harmonics from the charger. Active power filters (APF) can be used in a charging station to compensate for the harmonics produced by the nonlinear loads. There are two main types of APFs: shunt and series APFs. Shunt APFs are more widely used than series APFs in charging stations due to their many advantages, such as easy installation and mature technology [16,17]. However, the interaction between the shunt APFs and the charging infrastructure will amplify the load current harmonics [18], which will reduce the compensation effect of the APFs. Therefore, it is not only necessary to further study the harmonic characteristics and methods of modeling the charging station, but also important to explore the best way to configure the shunt APF in a charging station.
The harmonic pollution from an electric vehicle charging station originates mainly from the uncontrolled or thyristor-controlled rectification circuit of the charger. After rectification by the three-phase rectifier, the grid voltage will generate a pulsating DC (Direct Current) voltage on the DC side of the charger, and a DC current will be produced when the DC voltage acts on the load. Harmonic distortion will occur in the voltage and current on the AC (Alternating Current) side of the charging station because of the coupling between the rectifier and the power grid. The existing literature on this topic has mainly employed experimental testing [2,5] and simulation analysis [14,15]. However, the former method is only applicable to charging facilities under experimental conditions. Although the latter method can be used to analyze charging circuits with different structures, the analytic relationship between the terminal voltage harmonics and current harmonics of the charger cannot be obtained. Previous studies [19,20] have presented frequency-domain analytical models of single-phase uncontrolled and thyristor-controlled rectification circuits for a single-phase rectifier with low power. These models have demonstrated the contribution of the terminal voltage harmonics to the current harmonics. For higher-power chargers (including regular and fast-charging types), which typically use a three-phase rectification circuit [2,13,15], the literature [20] also provides frequency-domain analytical models of three-phase thyristor-controlled rectification circuits. However, these models assume a priori knowledge about the circuit parameters of the charger, and the differences in the parameters of chargers from different manufacturers will lead to different harmonic characteristics in the input current. It is difficult to obtain detailed equivalent circuit parameters for each charger. Previous studies [21] have proposed a method using the measured AC current waveform of a single-phase uncontrolled rectifier under given voltage conditions to estimate the parameters of the harmonic analysis circuit. However, for the commonly used three-phase uncontrolled rectification charger, the charging current has two modes: the continuous conduction mode (CCM) and discontinuous conduction mode (DCM), which is different from that of the single-phase rectification circuit. Thus, the analysis used for the single-phase rectifier cannot be applied to the three-phase rectification circuit.
The installed capacity of the APF directly determines its harmonic compensation effect. The capacity is currently designed based on the configuration of the charger and the total harmonic distortion of the current, and then corrected by a safety factor [22]. However, the existing method cannot determine the safety factor accurately because the interaction between the harmonic current and harmonic voltage of the charging station is not considered, and an accurate method of selecting the safety factor has not been proposed. The harmonic current will appear to be amplified when the shunt APF in the charging station operate due to the harmonic response [18,23]. Ignoring this phenomenon will lead to the accidental overload of the shunt APF. This paper analyzes the characteristics of the charging current for an electric vehicle charger with a three-phase uncontrolled rectification circuit and a passive power correction link under different operating conditions based on the measured AC voltage and current. A method for estimating the parameters of the charger equivalent circuit is also proposed. The harmonic current amplification caused by the shunt APF is then studied. An analytical formula for the APF overload factor is derived by considering the frequency-domain harmonic model of the charger. A capacity correction method is proposed for the shunt APF in a charging station based on the harmonic current amplification effect. The feasibility of this method is then verified by adopting it in an electric vehicle charging station.

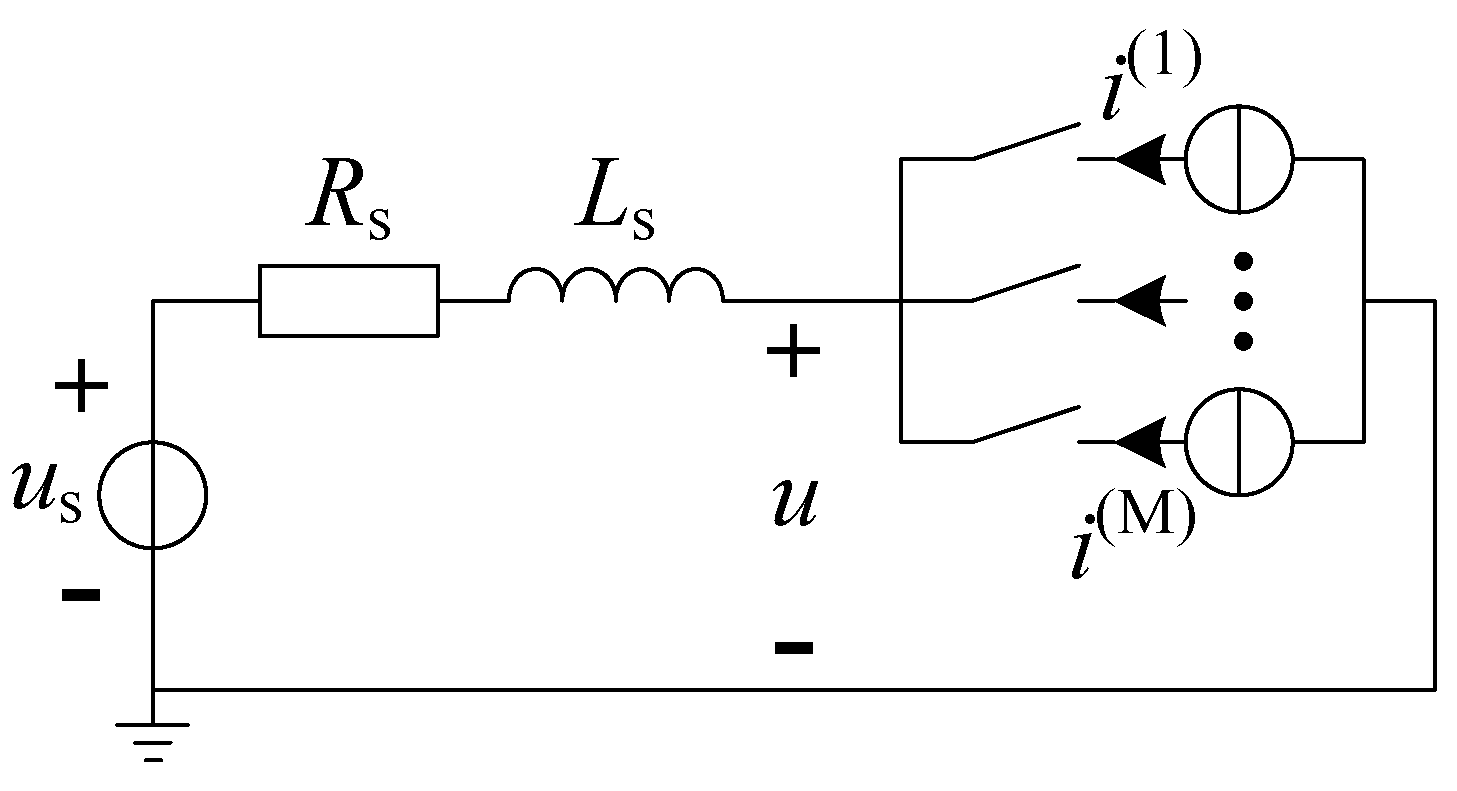
2. Parameter Estimation for the Equivalent Circuit of Charger

The primary source of harmonic pollution from electric vehicle charging stations is the three-phase charger, which is the common type of charger used in early stations. The first level of the charger is a three-phase uncontrolled rectification circuit with a passive power factor correction link [2]. Shown in Figure 1, the power factor correction, which consists of a filter inductance L and a filter capacitance C on the DC side, is used to reduce the harmonics injected into the power grid. The parameters L, C and the load voltage uR are different in different types of chargers, but the load resistance R is determined by uR and the power produced by the charging process. Because the charging time is long, the circuit uses a variable load resistance R for the equivalent high-arising from frequency power conversion circuit at different stages. The parameters L, C, uR and R are needed for the harmonic analysis and modeling of the charger, but it is difficult to obtain the parameters directly from the manufacturers. This paper focuses on measurement-based estimation of the charger circuit parameters.
For the charging current of each phase in Figure 1, there are two charging processes in each half-wave cycle. As the charging power changes, the charging current of the two conduction processes in each half-wave cycle will change from continuous to discontinuous, corresponding to light and heavy loads. Figure 2 shows the measured waveform of the DC voltages udc and uR, the A-phase current ia and the line voltages uab and uac of the three-phase charger in the two conditions. The current in Figure 2a is enlarged by a factor of five. α 1, α2 are the firing angles and δ1, δ2 are the extinction angles corresponding to the first and second charging processes, respectively, of the diode during a half-wave cycle. Im and β are the peak value of the charging current pulse and the conducting width angle of a single charging process, respectively, and γ is the angle corresponding to Im. In Figure 2b, the extinction angle δ1 of the first charging process is the same as the firing angle α2 of the second charging process, and the beginning and ending charging currents have the relationship ia2) = ia1) = I0 (which is not equal to zero), which is not true in the DCM (Discontinuous Current Mode) of Figure 2a.
Figure 1. Equivalent circuit for charger.
Energies 07 05425 g001
Figure 2. Operating characteristics of charger: (a) current in DCM (Discontinuous Current Mode) and (b) current in CCM (Continuous Current Mode).
Energies 07 05425 g002
Due to the voltage drop in the filter inductance L, uR is always less than the peak value of the line voltage during the charging process, and uR can be considered to maintain the value of UR after the smoothing effect of the filter capacitance C. Based on these assumptions, and combined with the charging circuit constraint, the load voltage UR can be calculated using the measured values of the AC voltage and conducting width angle β of the pulse current. Additionally, the equivalent load resistance R and the filter capacitance C can be estimated according to the charging power, and the filter inductance L can be estimated from the charging pulse current Im and the angle γ. The parameter estimation process is described in detail below.

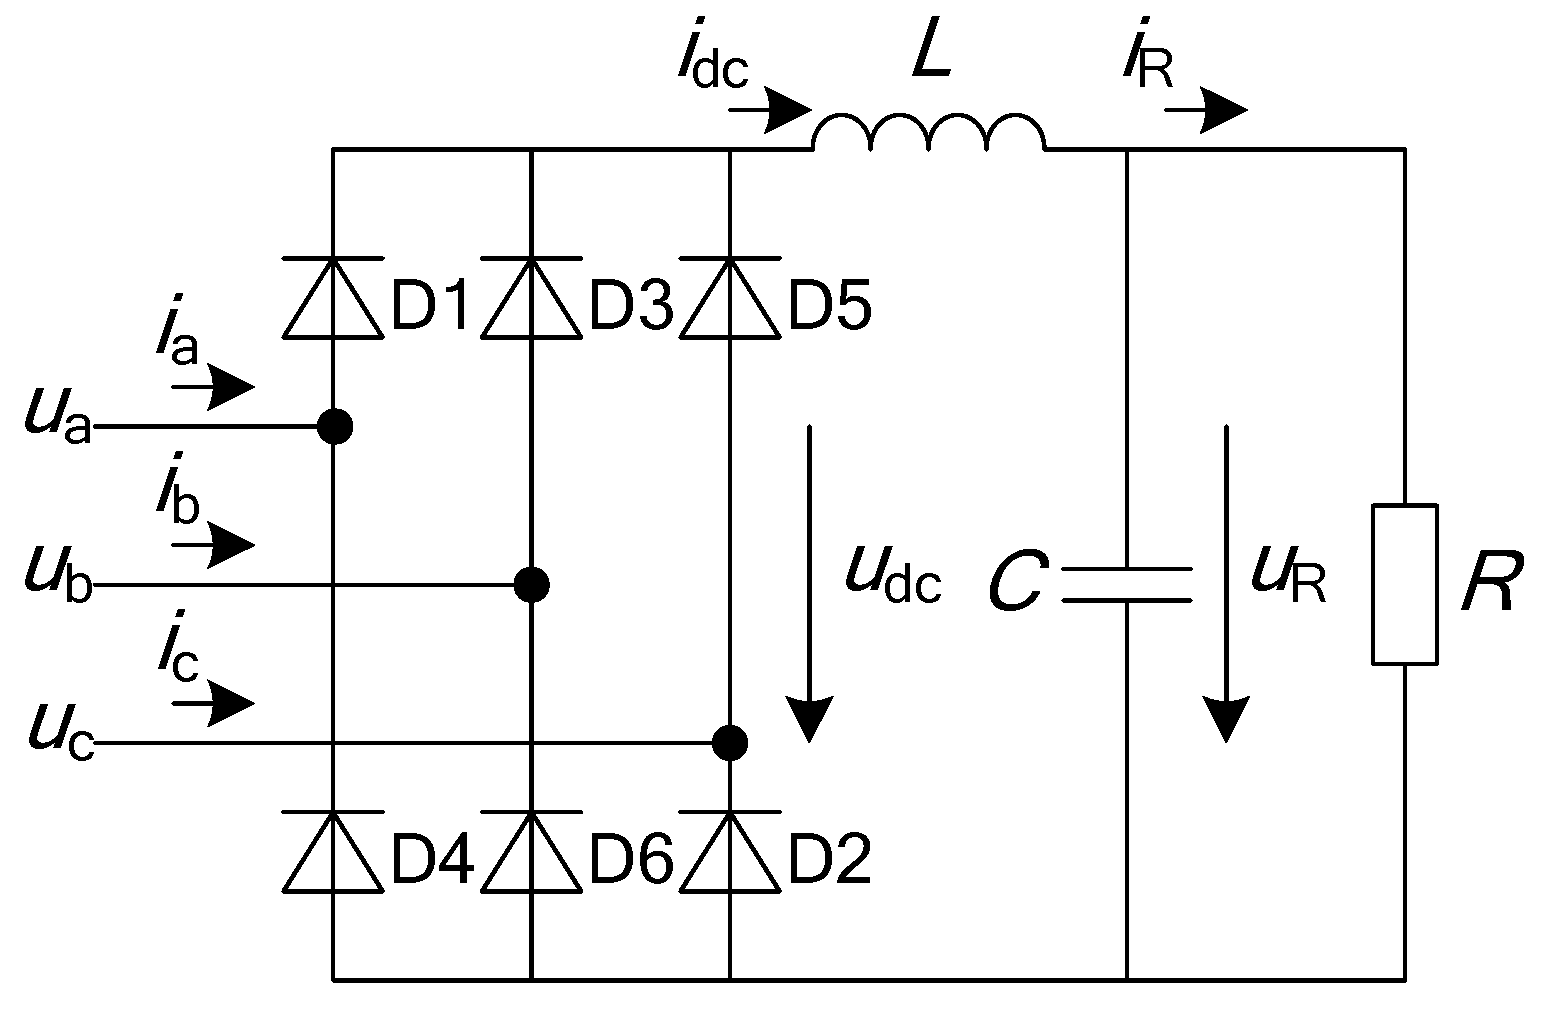
2.1. Estimation of the DC Voltage UR

From Figure 1, the voltage and current balance equation during the conducting interval [α1, δ1] is:
u ab ( θ ) = ω L d i a ( θ ) + u R ( θ )
where ω is the fundamental angular frequency. The B-phase voltage is higher than the A-phase voltage so that diodes D3 and D4 conduct. The actual phase voltage of the grid contains several odd harmonics, but the line voltage uab does not contain the third harmonic. From Figure 2a, UR = −uab1) when the current is discontinuous:
U R = u ab ( α 1 ) = h = 1 , 7 , H 6 U h cos ( h α 1 + φ h + π 6 ) h = 5 , 11 , H 6 U h cos ( h α 1 + φ h π 6 )
where h is the harmonic order, Uh and φh are the root-mean-square (RMS) magnitude and phase angle of the hth harmonic voltage, respectively, and H is the highest harmonic order. Because the load voltage uR remains approximately unchanged (uR = UR), each beginning and ending charging current in DCM is zero, which can be described by ia1) = ia1) = 0. The relationship between δ1 and α1 is given by δ1 = α1 + β. Equation (3) can be obtained from Equation (1) by integrating over the interval [α11]:
U R = 1 β { h = 1 , 7 , H 6 U h h [ sin ( h ( α 1 + β ) + φ h + π 6 ) sin ( h α 1 + φ h + π 6 ) ] + h = 5 , 11 , H 6 U h h [ sin ( h ( α 1 + β ) + φ h π 6 ) sin ( h α 1 + φ h π 6 ) ] }
When the charging current is continuous, each beginning and ending charging current is not zero but still satisfies the equation ia2) = ia1) = I0, and UR meets the constraints of Equation (3). Figure 2b illustrates that when the charging current reaches Im, the load voltage is equal to the grid voltage, UR = −uab(γ). β = (δ2 − α1)/2 and Δγ = γ − α1 can also be obtained from the measured current in Figure 2b; therefore:
U R = u ab ( α 1 + Δ γ ) = h = 1 , 7 , H 6 U h cos [ h ( α 1 + Δ γ ) + φ h + π 6 ] h = 5 , 11 , H 6 U h cos [ h ( α 1 + Δ γ ) + φ h π 6 ]
When estimating the parameters of the charging circuit, the continuity or discontinuity of the charging current should be determined a priori according to the measured waveform. If the current is discontinuous, using the measured values of the AC voltage and β, α1 can be obtained by combining Equations (2) and (3). When the current is continuous, using the measured values of the AC voltage, β and Δγ, α1 can be obtained from Equations (3) and (4). We can then obtain the load voltage UR.

2.2. Estimation of the Filter Inductance L

The filter inductance L can be estimated using the charging current from the beginning to the peak value Im. Equation (5) can be obtained by integrating Equation (1) over the interval [α1, γ]:
i a ( γ ) i a ( α 1 ) = 1 ω L { h = 1 , 7 , H 6 U h h [ sin ( h γ + φ h + π 6 ) sin ( h α 1 + φ h + π 6 ) ]    + h = 5 , 11 , H 6 U h h [ sin ( h γ + φ h π 6 ) sin ( h α 1 + φ h π 6 ) ] + U R Δ γ }
ΔI = ia(γ) − ia1) = Im when the charging current is discontinuous, and ΔI = ImI0 (Figure 2) when the current is continuous. Consequently, the filter inductance L can be calculated from the following equation:
L = 1 ω Δ I { h = 1 , 7 , H 6 U h h [ sin ( h γ + φ h + π 6 ) sin ( h α 1 + φ h + π 6 ) ] + h = 5 , 11 , H 6 U h h [ sin ( h γ + φ h π 6 ) sin ( h α 1 + φ h π 6 ) ] + U R Δ γ }
The filter inductance L can be obtained from Equation (6) using the measured values of the AC voltage, β and Δγ in CCM, as well as the calculated values of α1 and UR. If the current is continuous, the initial charging current I0 is also needed in addition to these parameters.

2.3. Estimation of the DC Load Resistance R and Filter Capacitance C

During the charging process, the DC current iR of the charger drops stepwise, and each step lasts approximately 5–6 min [4]. In this paper, the measured data to estimate the parameters are obtained from a 20 ms time window in which the charging power Pc is relatively stable. Therefore, the DC current iR during this time window is considered equal to IR. The DC equivalent resistance R is:
R = U R I R = U R 2 P c
Neglecting the effect of the filter inductance, the load voltage uR rises to the peak value Umax of the line voltage after a single charging cycle, and then, the voltage begins to discharge through the RC circuit. Because the DC filter capacitance has six charging-discharging processes in every cycle, the method described in the literature [21] can be used to calculate the DC capacitance as follows:
C = 2 π U max 12 ω R ( U max U R )
The circuit parameters of the three-phase charger can be estimated by measuring its a priori voltage and current waveform in one mode. The filter inductance L and capacitance C of the charger are constant; thus, only the load voltage and resistance are needed to perform a new estimate as the charging power conditions change. Based on the derived parameter estimation, the measurement-based modeling of the charger is performed by combining the estimate with the following three-phase frequency-domain harmonic model of the charging circuit.

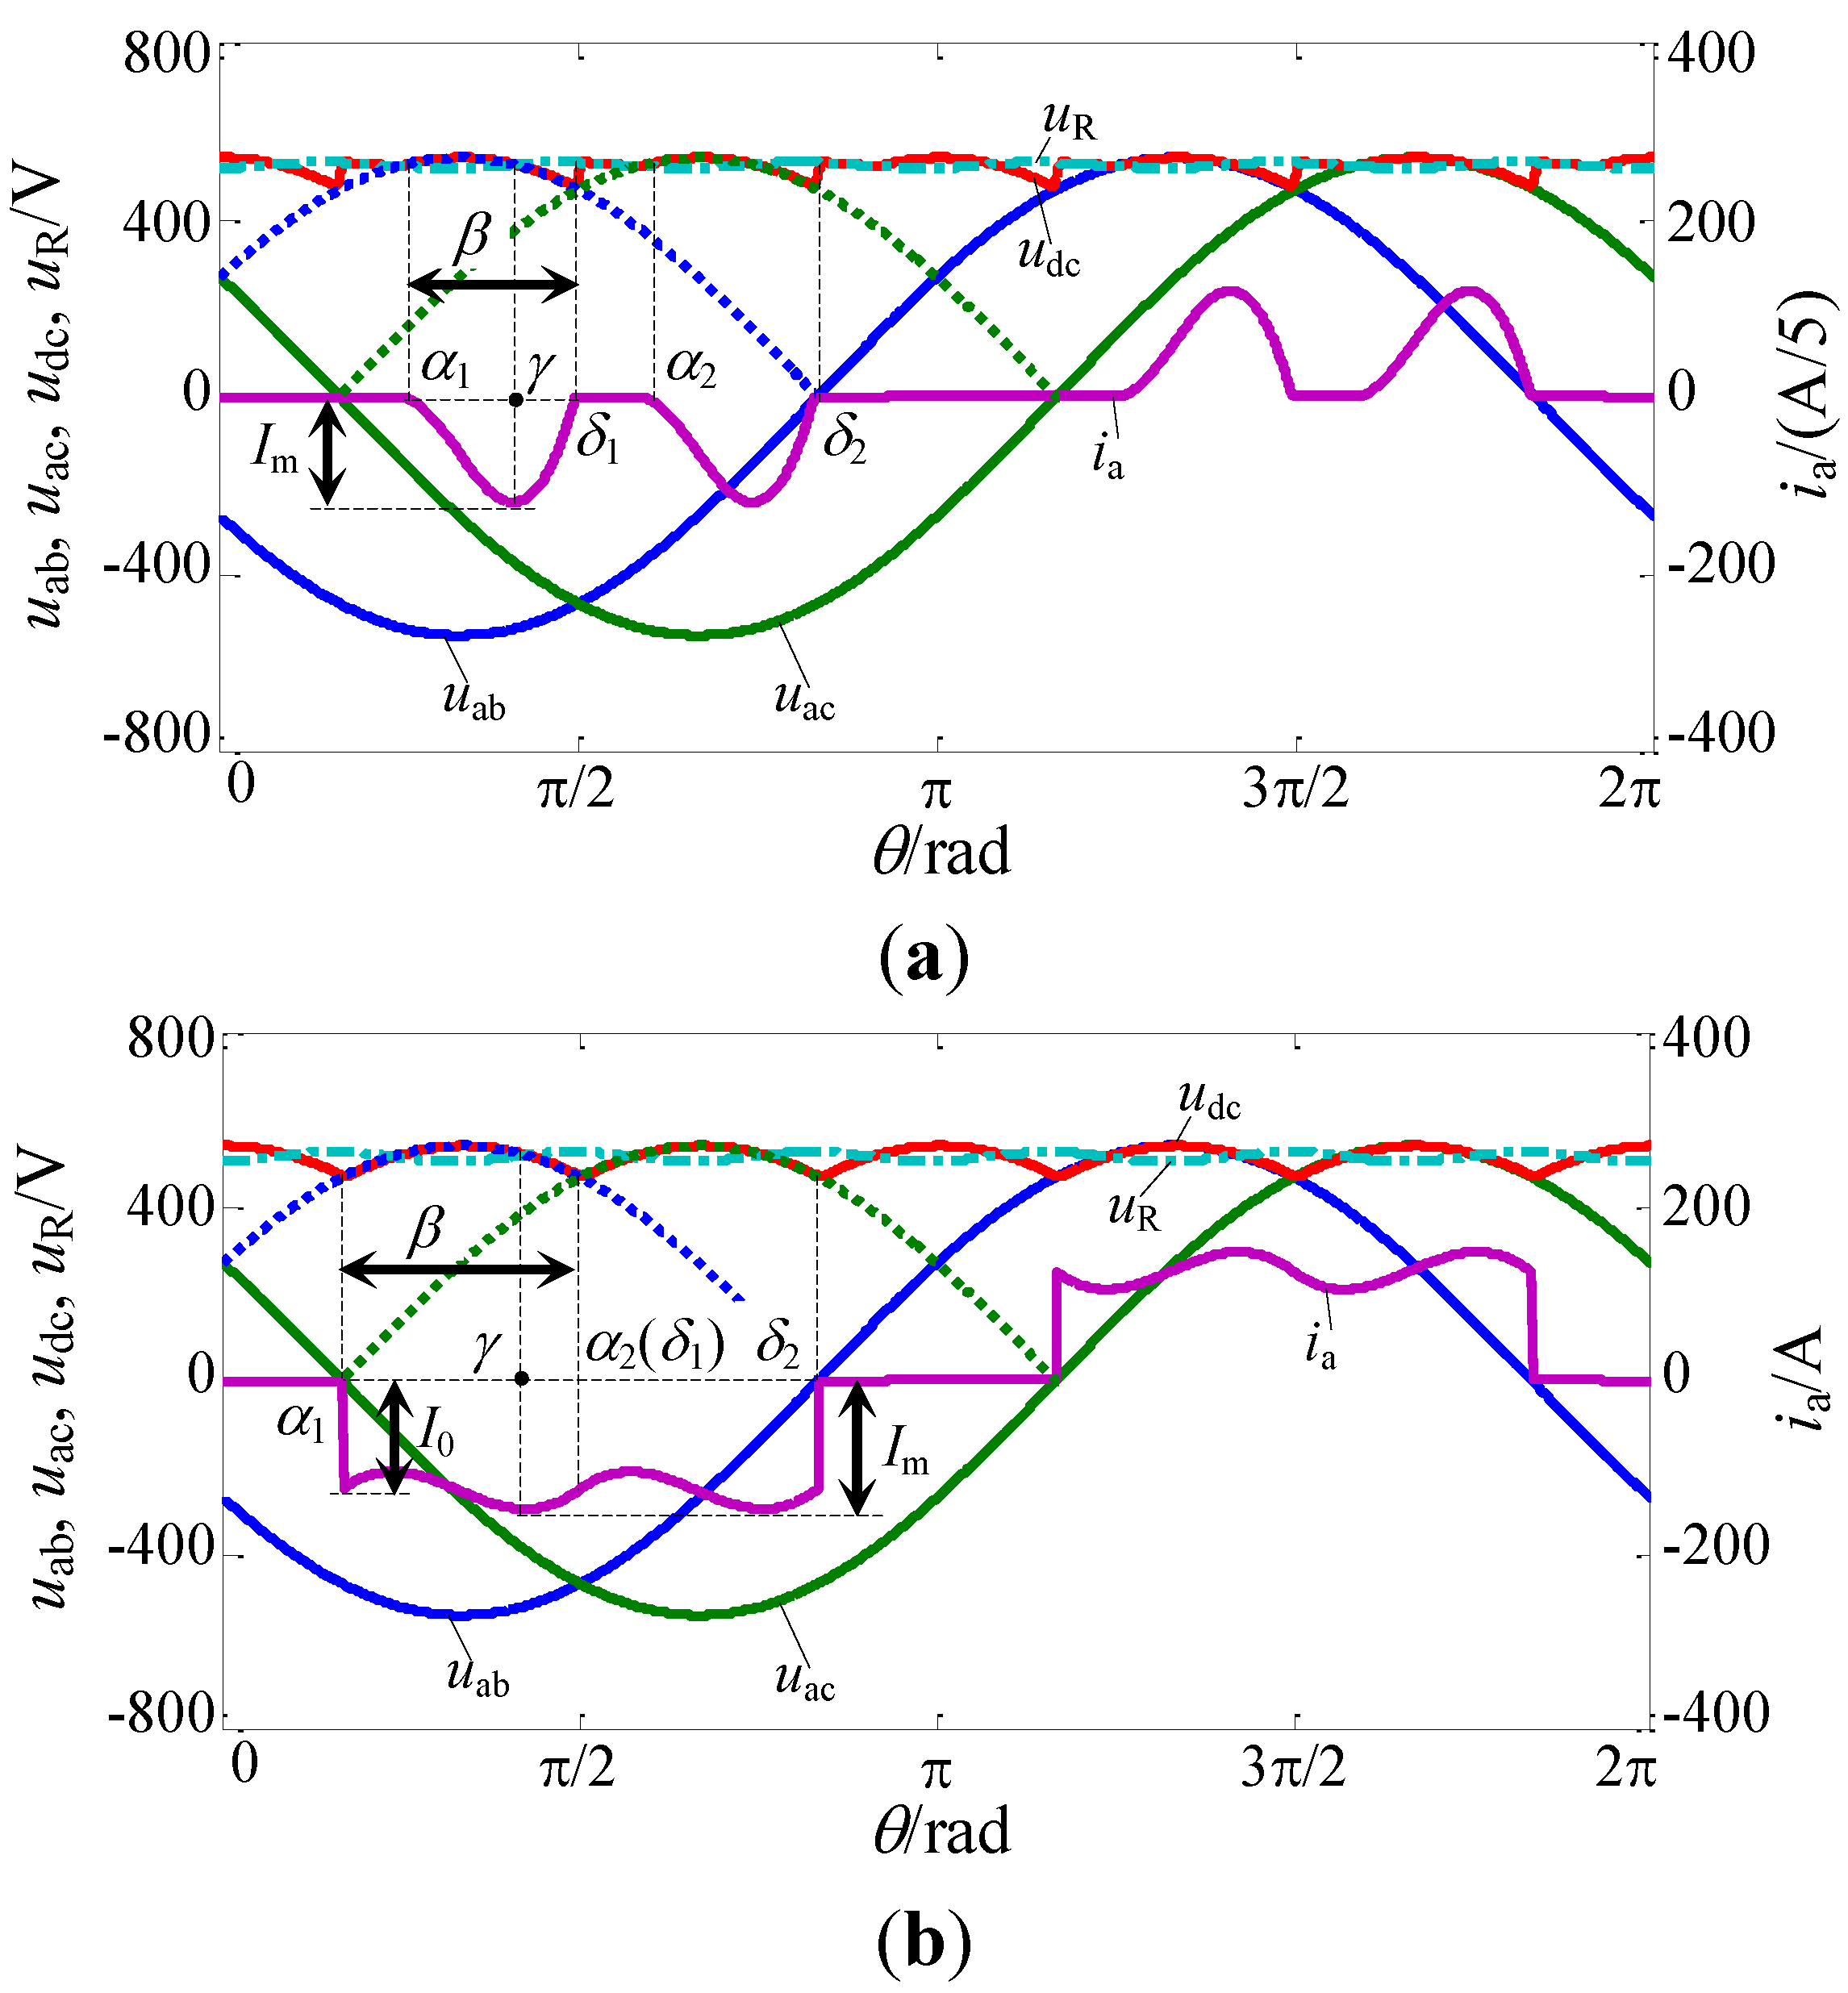
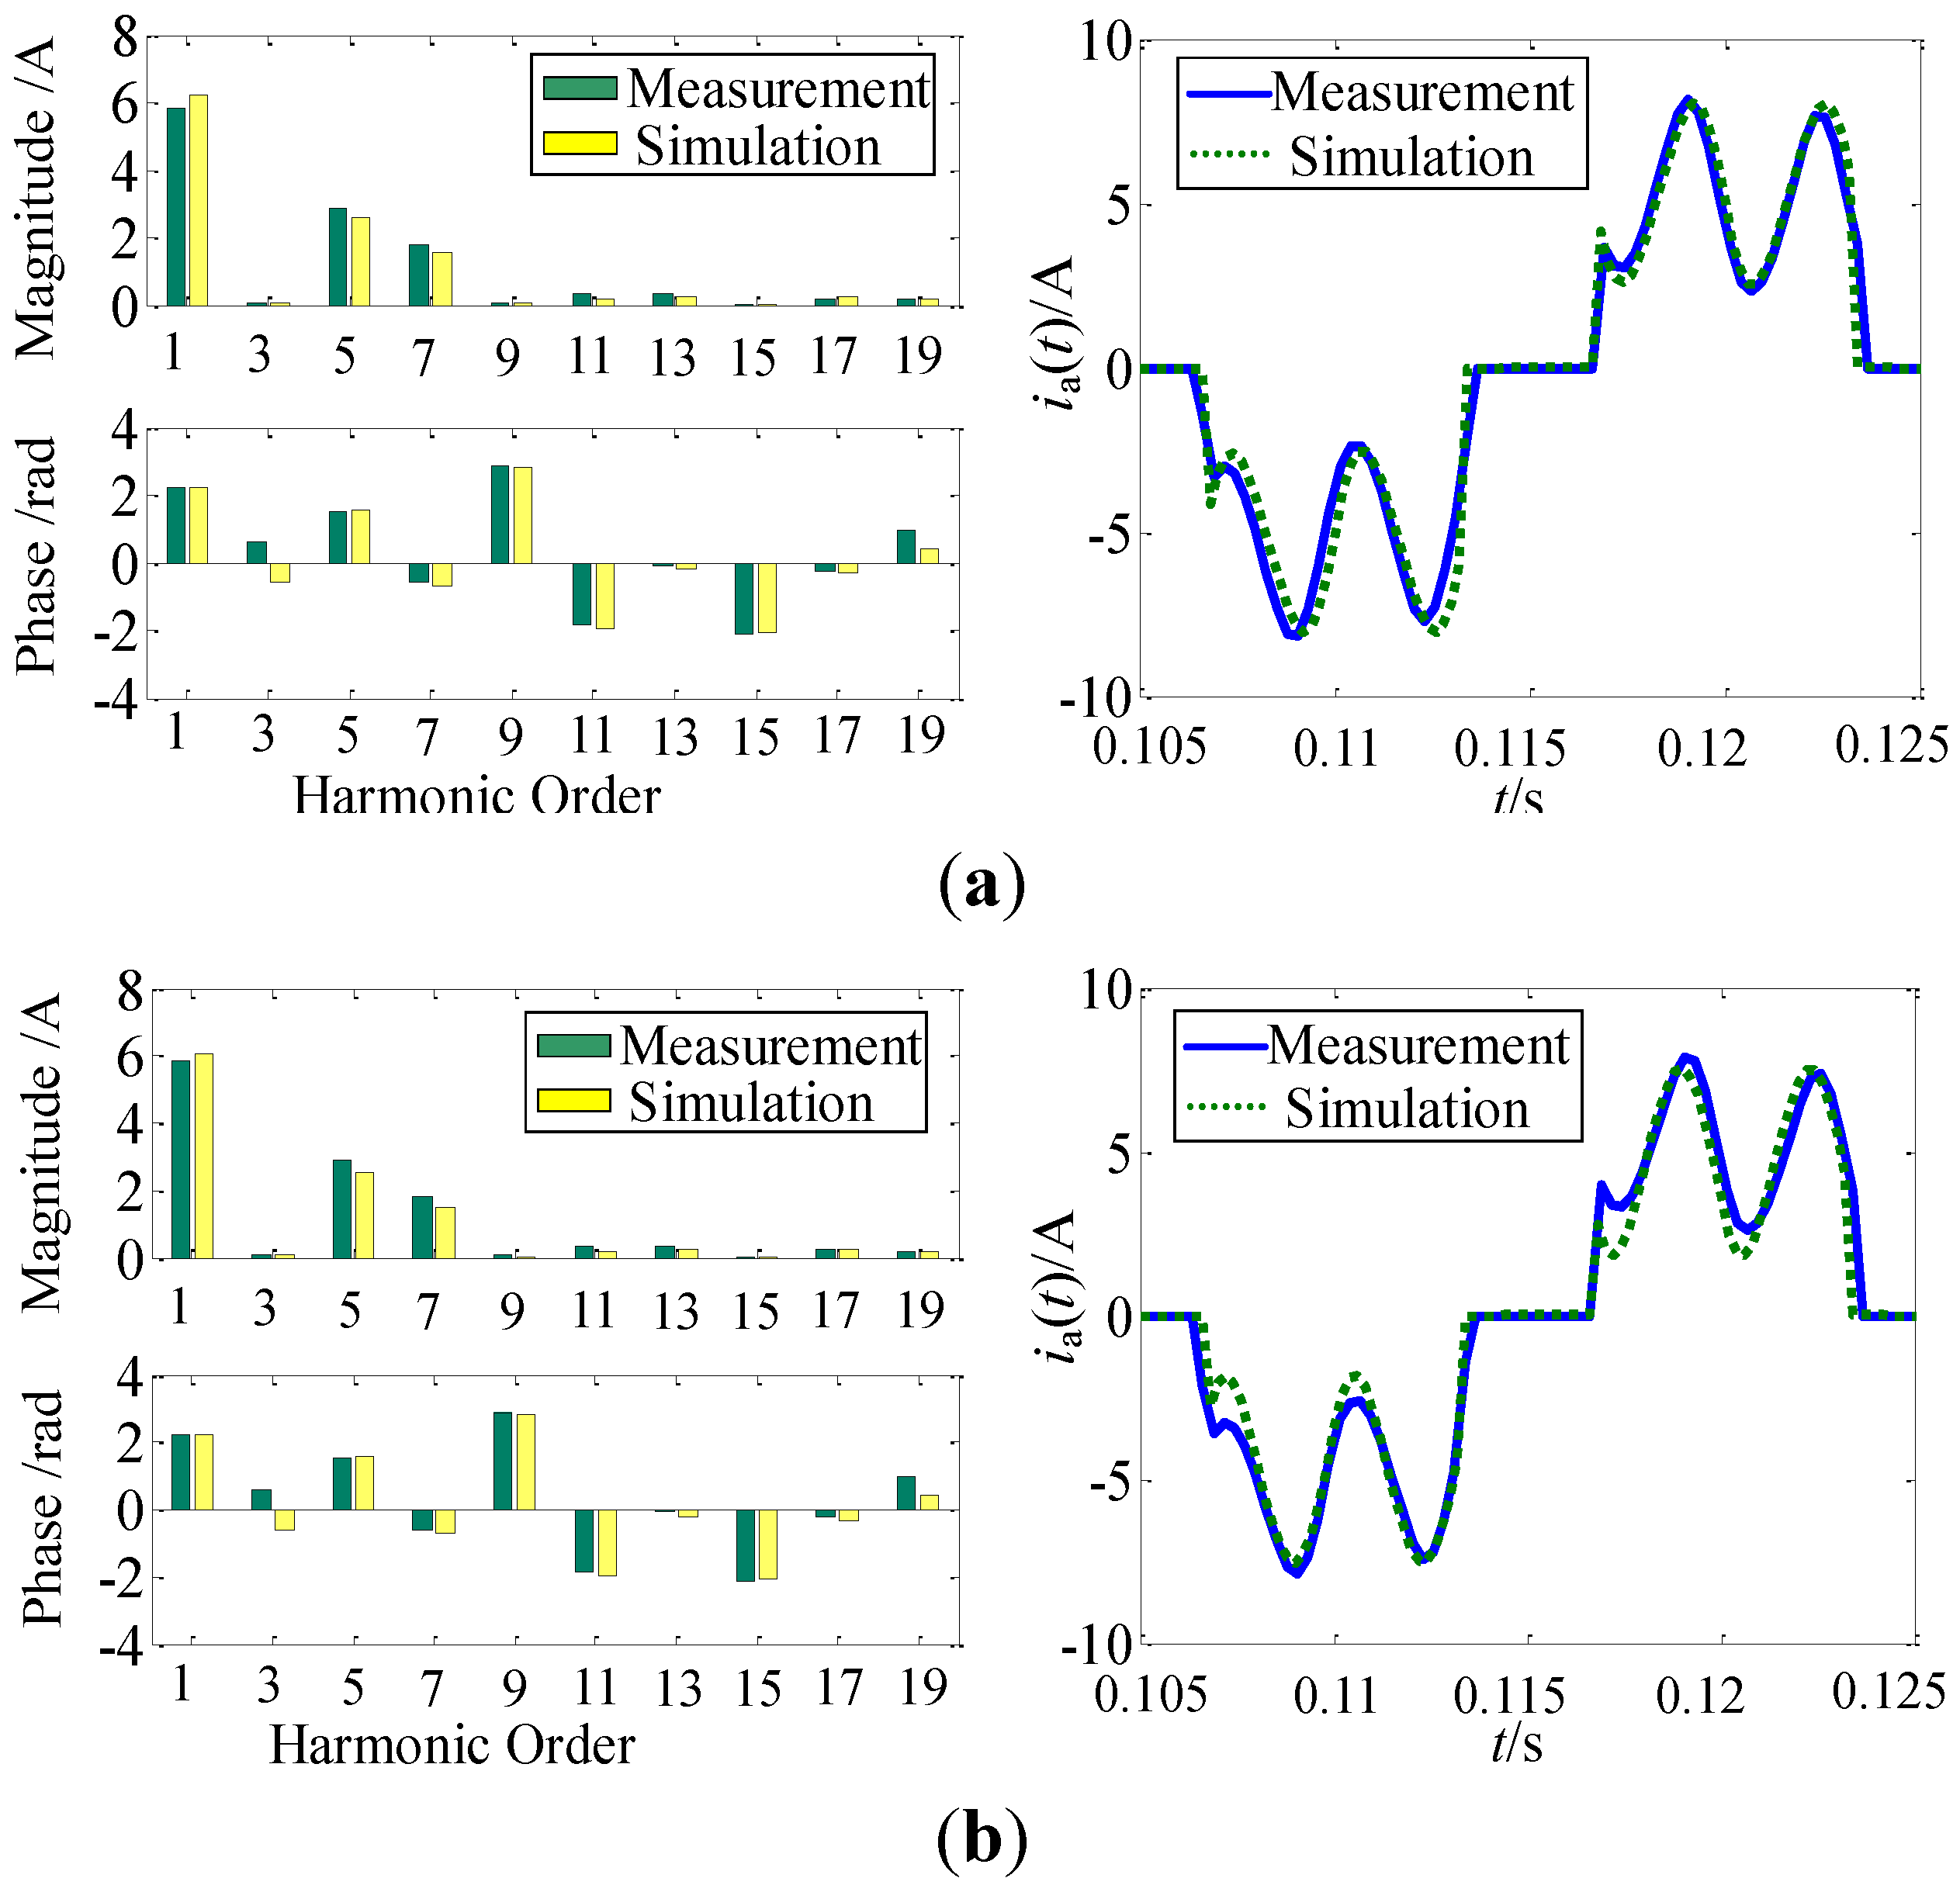
3. Verification and Sensitivity Analysis of the Charger Parameter Estimation

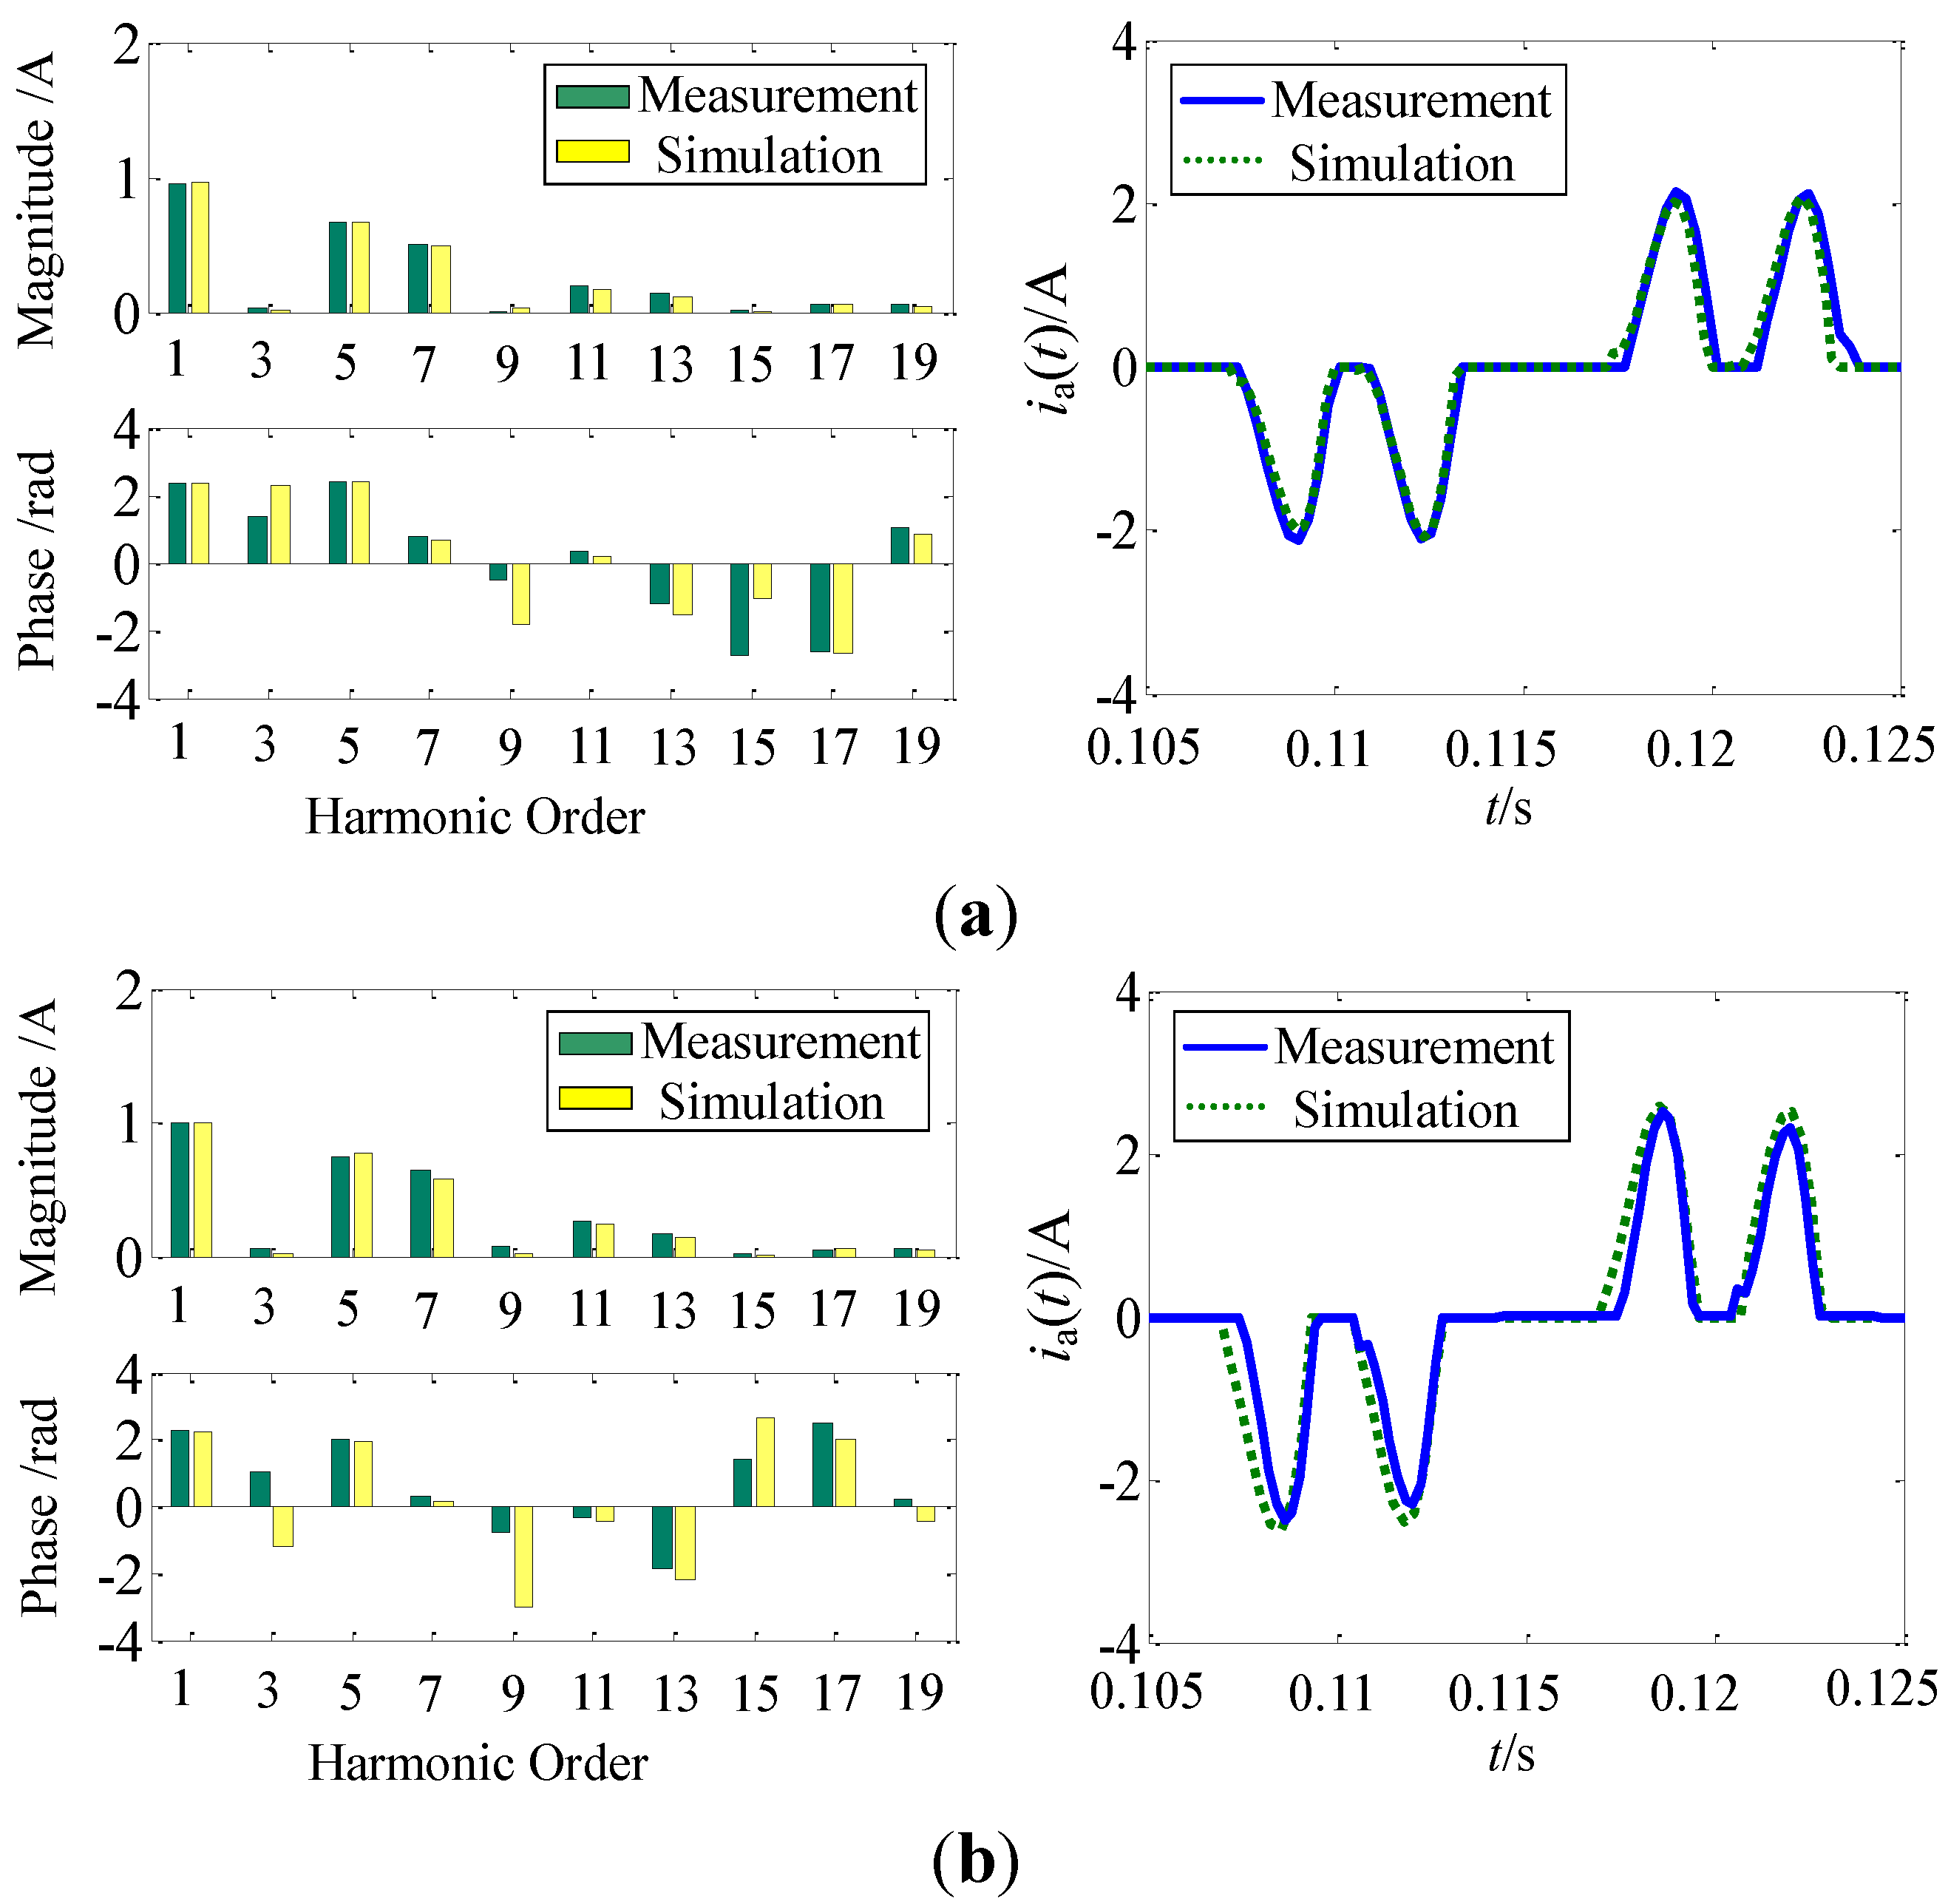
3.1. Verification of the Charger Parameter Estimation Method

To verify the effectiveness of the proposed parameter estimation method, an experimental platform of a three-phase uncontrolled rectification circuit is set up to simulate the electric vehicle charger, as shown in Figure 3. The discontinuous and continuous currents are obtained by adjusting the load resistance. The parameters used in the experiment are R = 128 Ω in DCM and R = 20 Ω in CCM. The terminal voltage of the charger in Figure 3 is provided by a Chroma 67103 programmable AC power source. A Fluke 435 three-phase power quality analyzer is used to measure the harmonics of the charging current. The harmonic magnitudes and phase angles in the two voltage conditions under which the measurements are taken are listed in Table 1. Due to the capacity limitations of the source, the magnitude of the fundamental component of the voltage in the experiment is 45 V and each harmonic phase angle refers to that of the fundamental voltage component.
Figure 3. Experimental test platform for electric vehicle charger.
Energies 07 05425 g003
Table 1. Harmonic components of measured voltage.
Harmonic OrderMagnitude/%Phase/RadHarmonic OrderMagnitude/%Phase/Rad
Case 130.51−1.52Case 233.56.57
50.32−2.8252.3−8.51
70.43−6.3672.1−8.36
90.412.3591.22.35
110.29−8.29110.4−14.49
The measured characteristic parameters of the voltage and current waveforms, as well as the equivalent charging circuit parameters in cases 1 and 2, are shown in Table 2 and Table 3, where the charging power in DCM and CCM are 0.1 kW and 0.5 kW, respectively. The estimated equivalent circuit parameters, which are based on the measured charging data, are highly similar to those of the experimental device. When the charging power is nearly the same, the estimated parameters of the charging circuit under the different voltage conditions are also similar. Therefore, the parameter estimation method proposed in this paper is adaptable for different voltage harmonic conditions.
Table 2. Characteristic parameters of measured curves.
CasePc/kWβ/radΔγ/radIm/AI0/AUmax/V
1DCM0.0910.8520.5022.1290110.3
CCM0.5561.0520.7228.1373.228
2DCM0.0950.7850.4812.5940112.1
CCM0.5571.0520.6917.913.61
Table 3. Estimated parameters of the equivalent circuit.
Caseα1/Radγ/RadUR/VRL/mHC/µF
1DCM2.3192.821106.0631252.2364
CCM2.1352.857104.01919.426
2DCM2.2962.777107.688122.0722.3347
CCM2.1352.826105.45019.964
Figure 4 and Figure 5 present the simulated and measured A-phase current results from the CCM and DCM, respectively. The three-phase charger current is mainly composed of the 6k ± 1 harmonics (k = 1, 2, 3,…), especially the fifth and seventh harmonics. Except for the third harmonic and its integer time harmonics, the measured phase angles and magnitudes of the harmonics are close to the simulation results. The simulation error in case 2 (of a large voltage harmonic) is greater than that in case 1 (of a low voltage harmonic) but still acceptable. The current harmonic results obtained from the simulation using the estimated parameters are largely consistent with the experimental results.
Figure 4. AC current comparison for the charger in discontinuous current mode: (a) case 1 and (b) case 2.
Energies 07 05425 g004
Figure 5. AC current comparison for the charger in continuous current mode: (a) case 1 and (b) case 2.
Energies 07 05425 g005

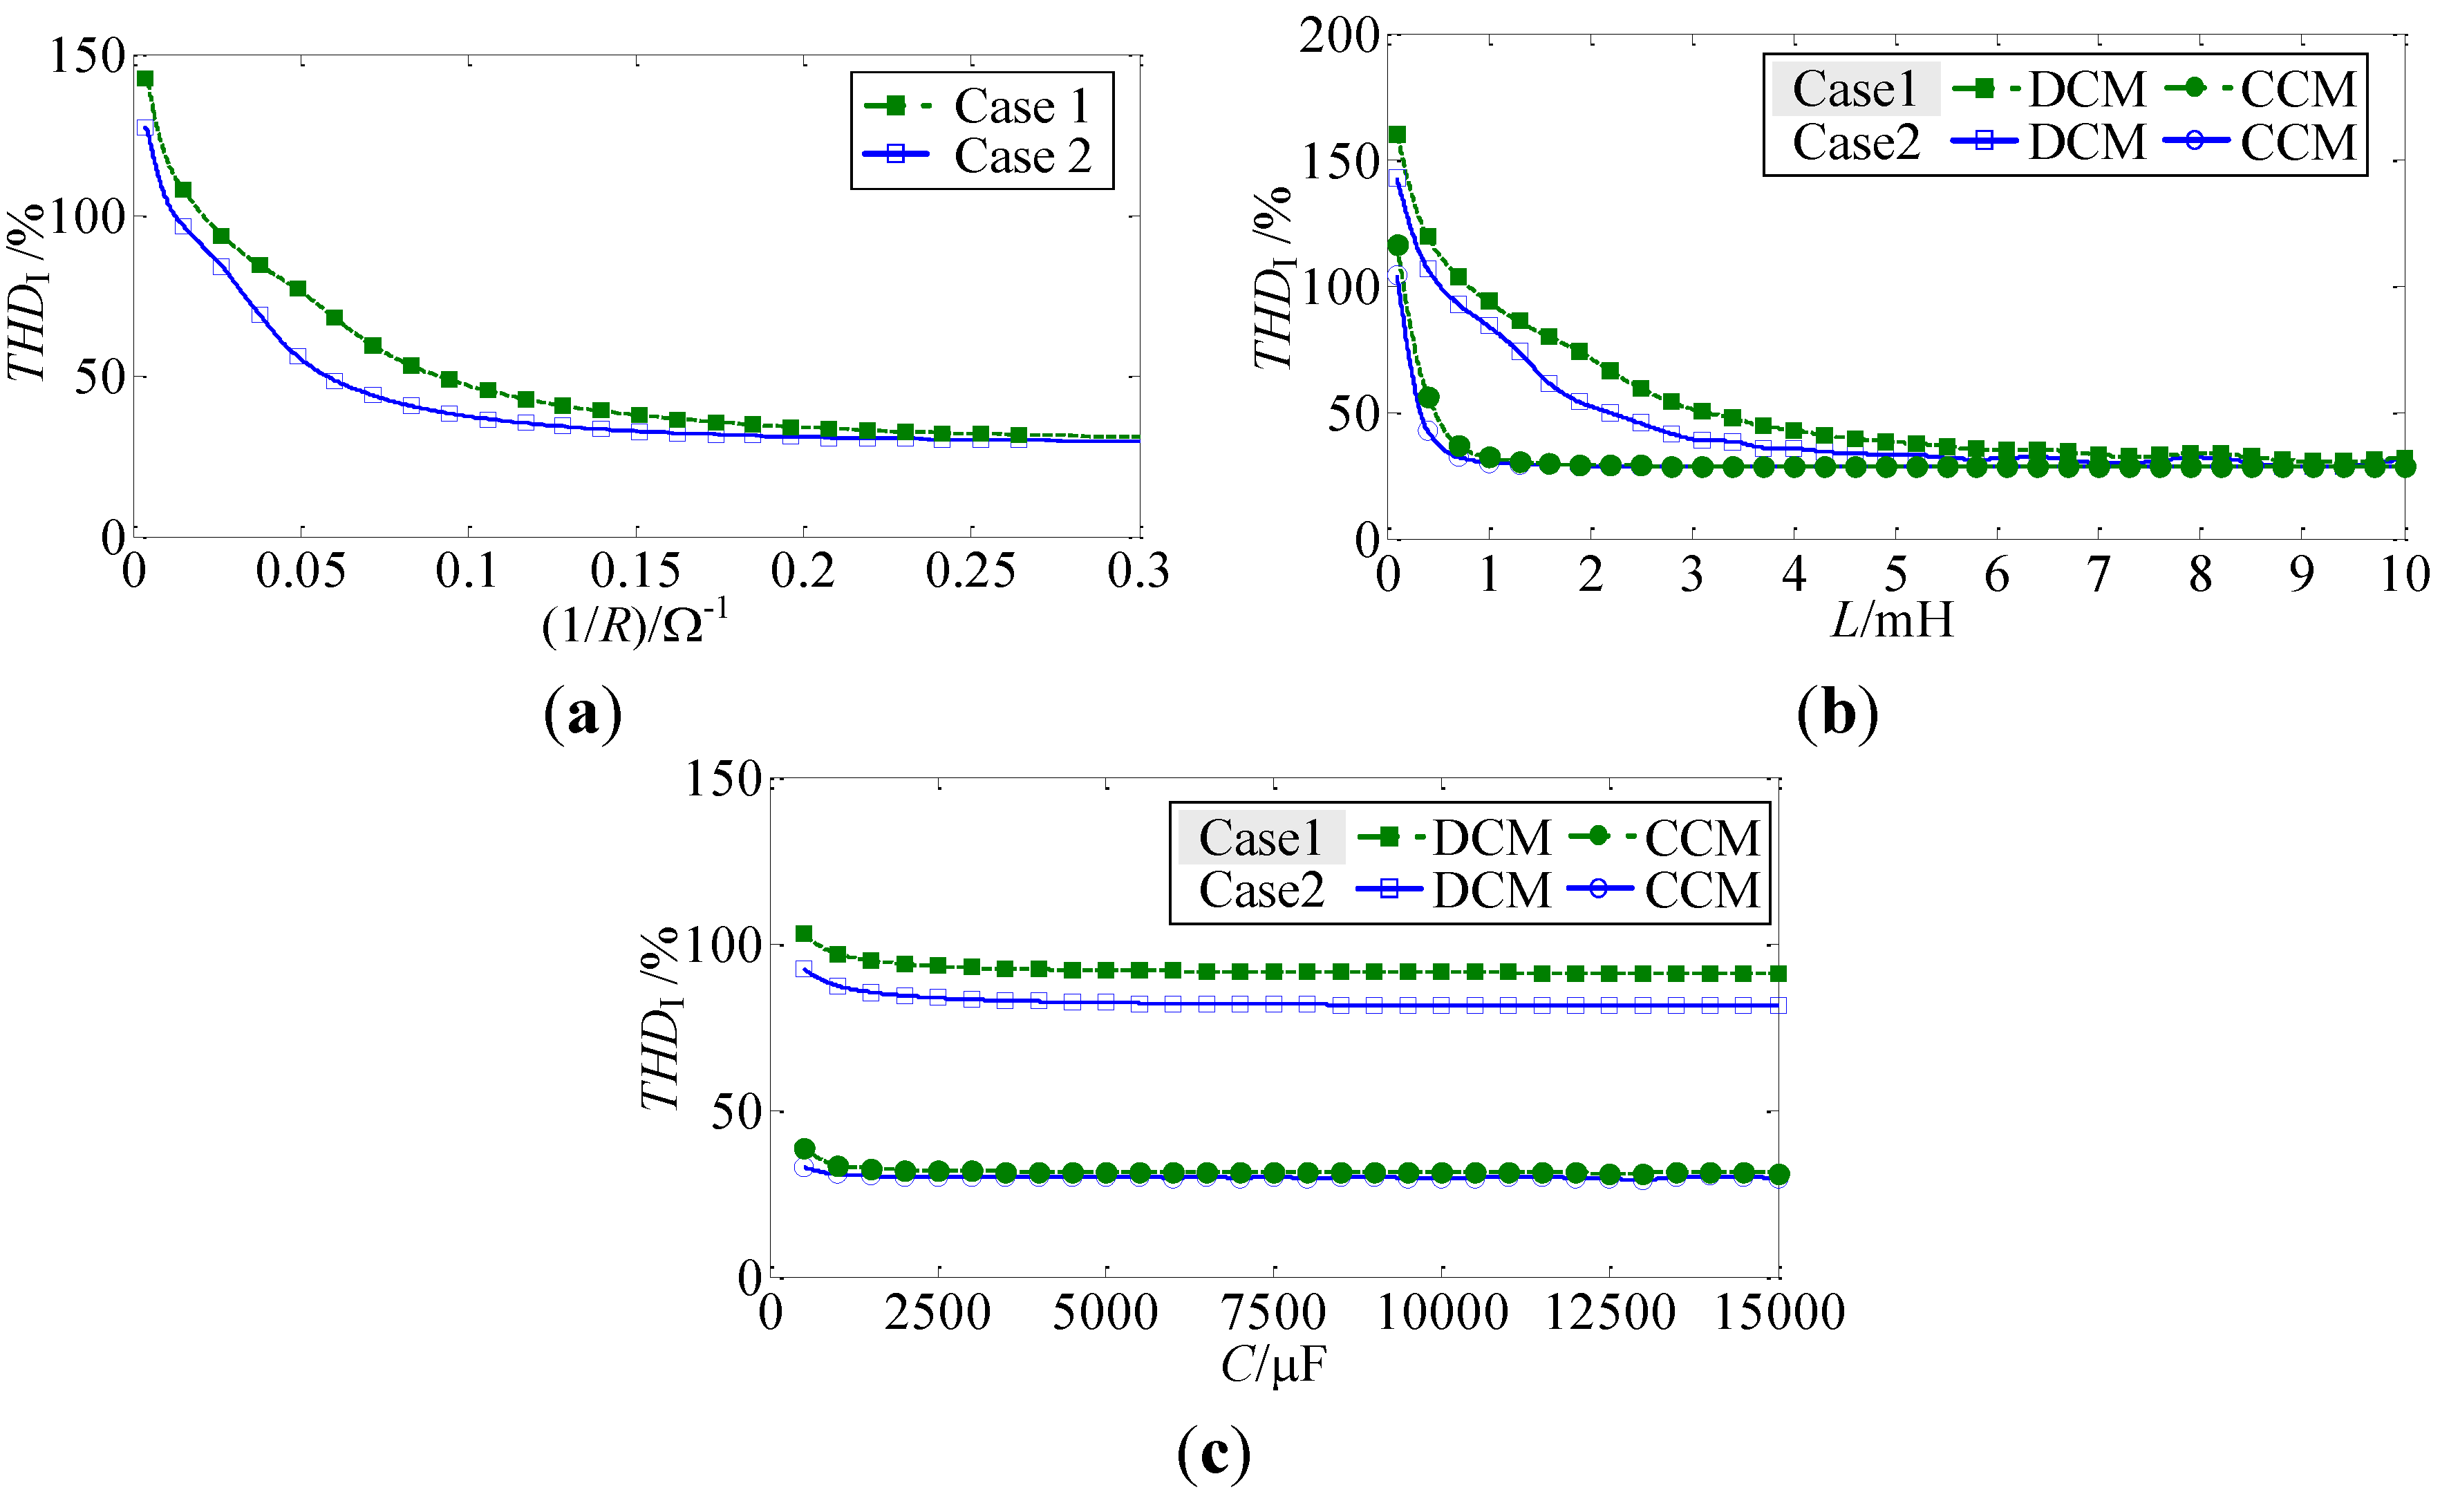
3.2. Sensitivity Analysis of the Harmonic Characteristics of the Charger

The harmonic characteristics of the charger will exhibit different trends as the equivalent circuit parameters R, L and C change. Figure 6a presents t he total harmonic current distortion (THDI) curve for the case in which the load resistance R changes while the other parameters are held constant (L = 1.5 mH and C = 2215 µF). As the load resistance decreases (which corresponds to an increase in the charging power), the charging current changes from discontinuous to continuous and the corresponding THDI exhibits a declining trend. When the resistance is less than 4 Ω (corresponding to a charging power greater than 65 kW), THDI approaches 30%. The trend of the THDI with load resistance is the same under different harmonic voltage conditions.
Figure 6. Sensitivity analysis of the circuit parameters of the charger: (a) load resistance; (b) filter inductance and (c) filter capacitance.
Energies 07 05425 g006
Figure 6b,c present the variation in THDI with the filter inductance L and capacitance C, respectively, where the load resistance R = 38 Ω and 4 Ω in DCM and CCM, respectively, and the other parameters are the same as in Figure 6a. Figure 6b illustrates that an increase in the filter inductance can effectively suppress the charging current harmonics. In the discontinuous and continuous charging current conditions, there is little difference in THDI for an inductance L greater than 1 and 6 mH, respectively. For a given THDI, L decreases as the charging power increases.
Figure 6c illustrates that increasing the filter capacitance appropriately is beneficial in suppressing the charging current harmonics. Compared to R and L, however, the filter capacitance C does not have a significant influence on the THDI. Additionally, from the THDI results in cases 1 and 2 in Figure 6, the THDI of the charging current will decrease when the terminal voltage harmonics of the charger increase. The operation of a shunt active power filter in the charging station can effectively reduce the terminal voltage harmonics of the charger, which will increase the charging current harmonics when the APF is operating. The harmonic current amplification effect of the charging station caused by the shunt active power filter will be discussed below.

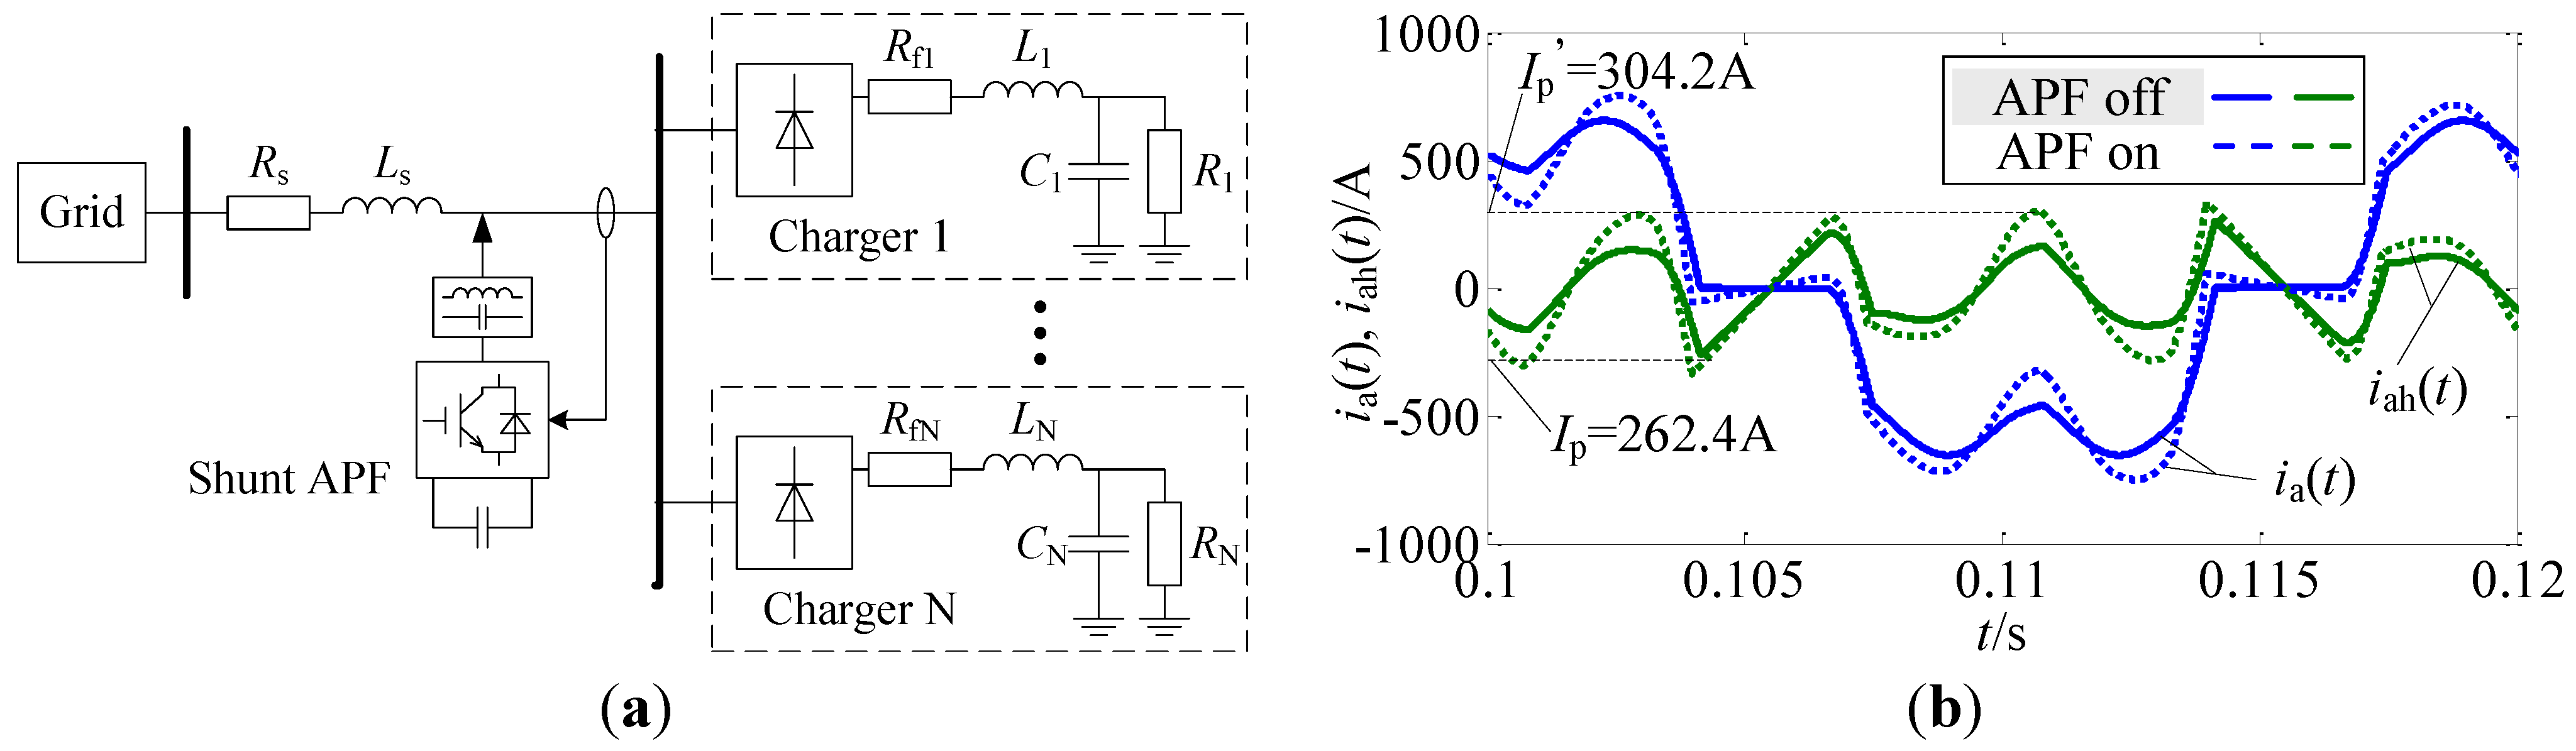
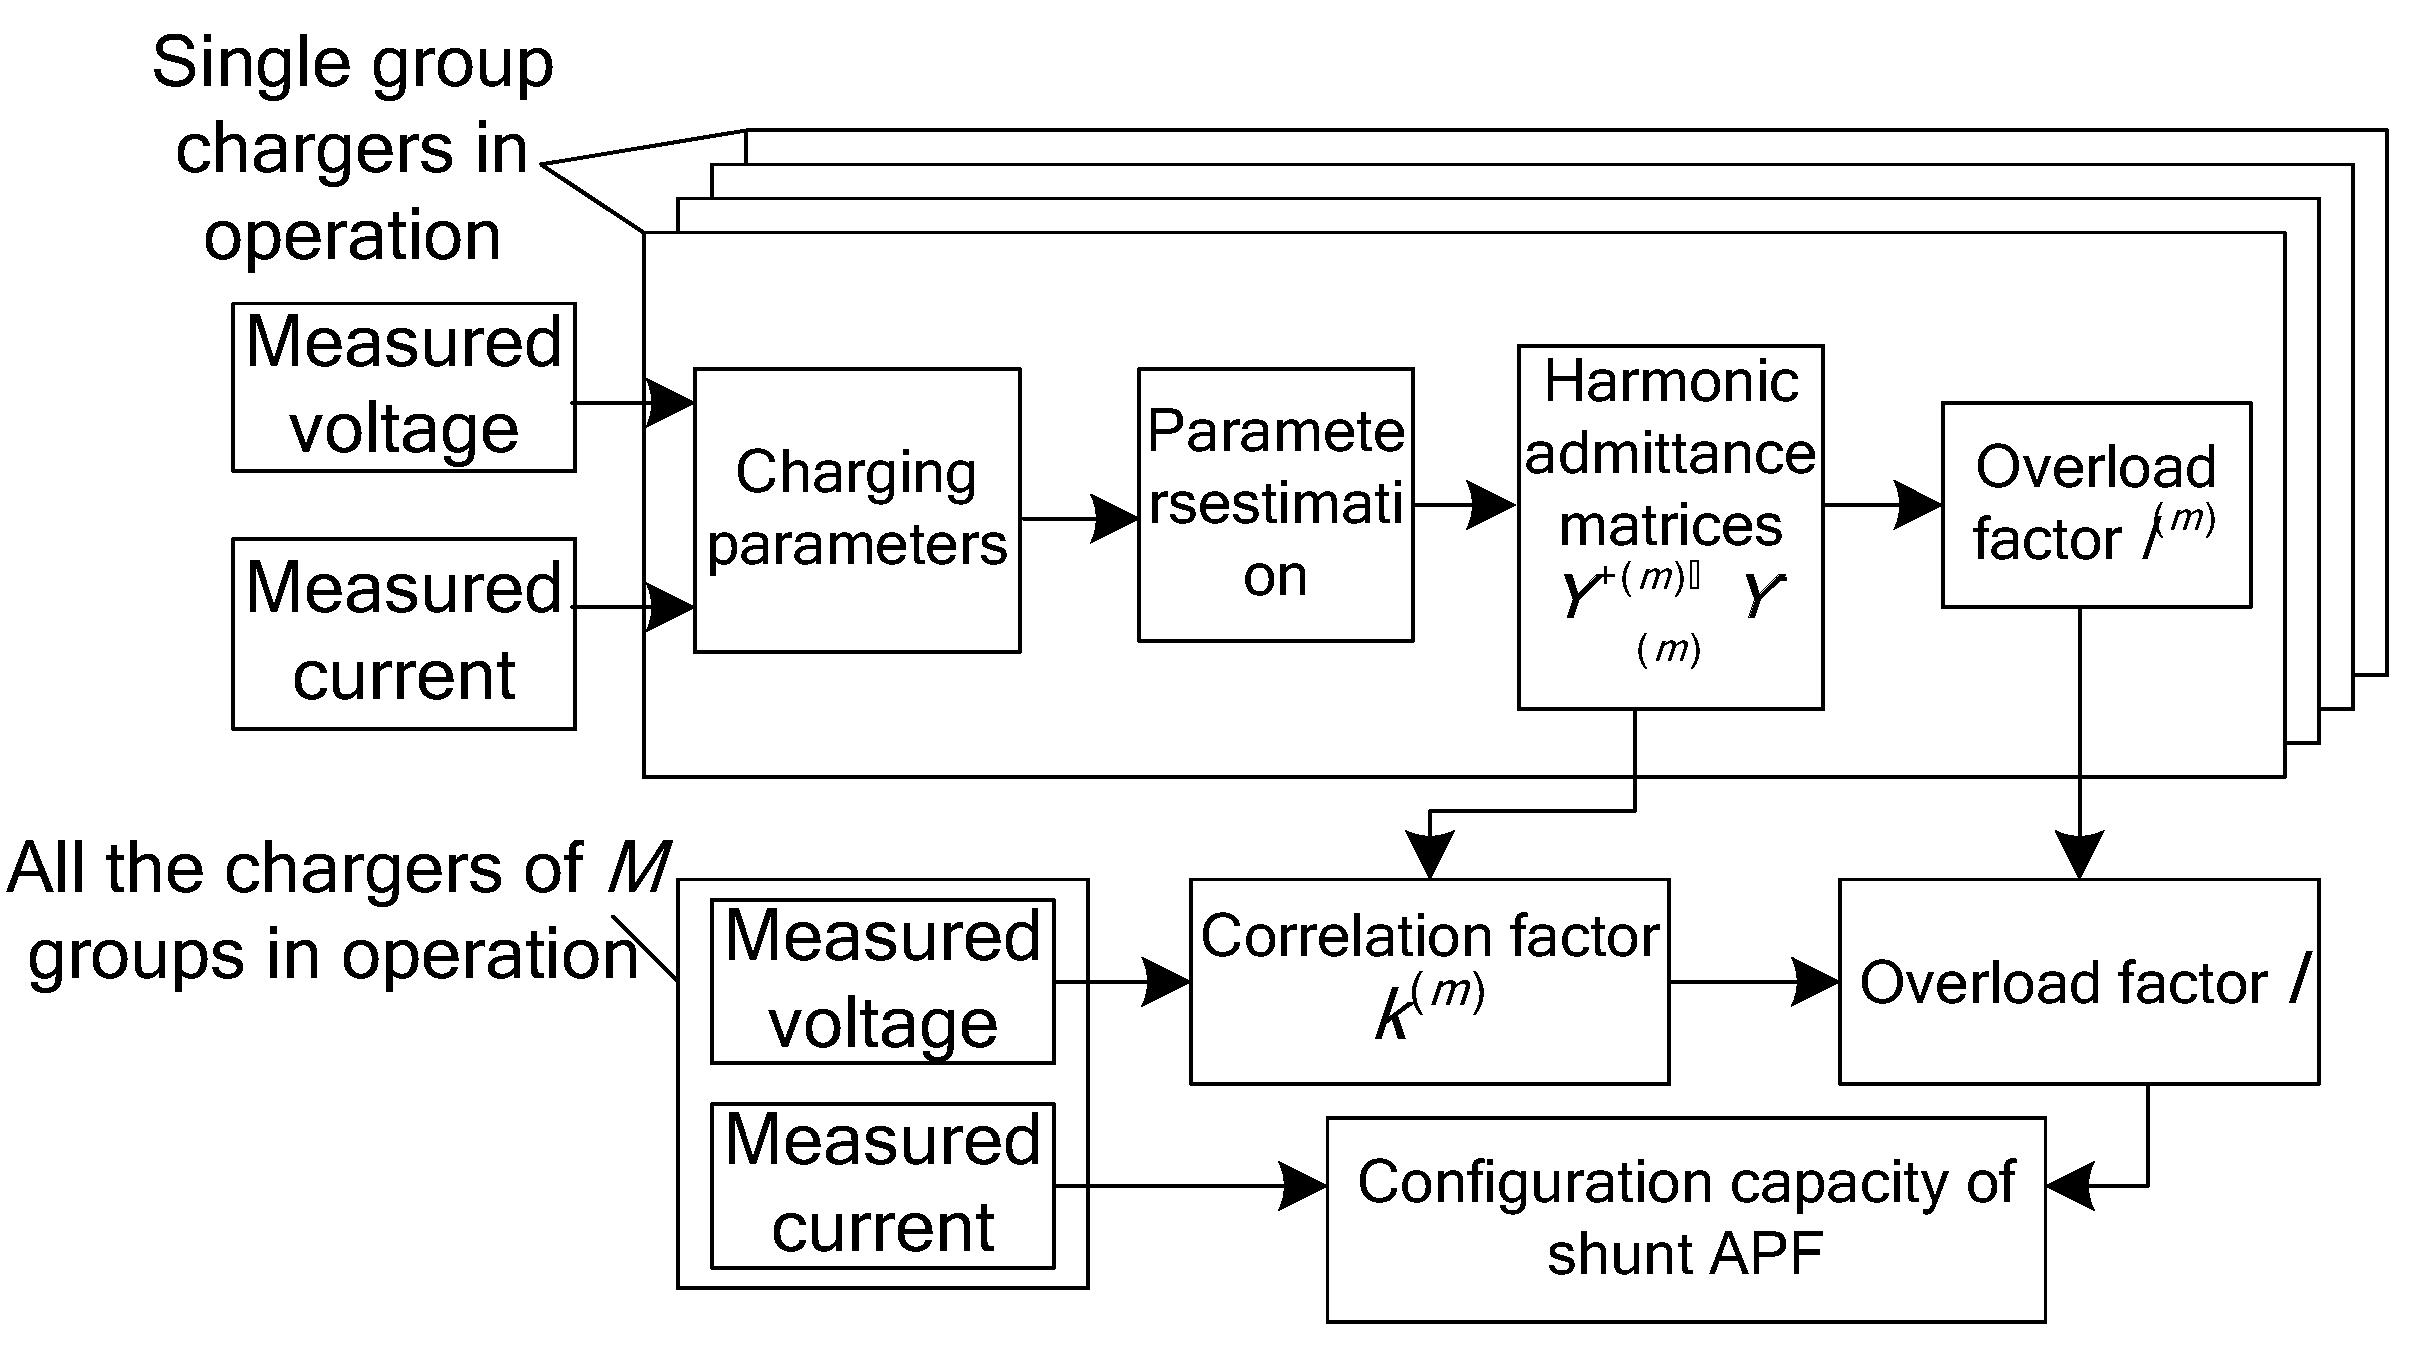
4. Capacity Correction for the Shunt Active Power Filter in a Charging Station Considering the Current Harmonic Amplification Effect

4.1. Charging Current Harmonic Amplification Effect and Frequency-Domain Harmonic Model of a Charging Station

In the example charging station shown in Figure 7a, there are five chargers with the same parameters (L = 1.5 mH, C = 2215 µF and R = 4 Ω) connected to a 380 V grid with a short-circuit capacity of 6 MVA and X/R = 5 (short circuit ratio) via a public bus. The shunt active power filter is configured at the point of common coupling. Figure 7b presents the simulation results of the A-phase charging current ia and its harmonic component iah for the five chargers in the charging station with and without the APF conditions, the operation of the APF increases the amplitude of the harmonic current from 262.4 A to 304.2 A. The interaction between the charging current and the grid impedance causes the terminal voltage of the charger to have harmonic components. The shunt APF can suppress the voltage harmonics, but it will cause the harmonic current of the charging station to be amplified compared to the case without APF.
Figure 7. Single line diagram and harmonic current amplification of charging station. (a) Single line diagram of charging station; (b) Charging current and its harmonic component for the charging station.
Energies 07 05425 g007

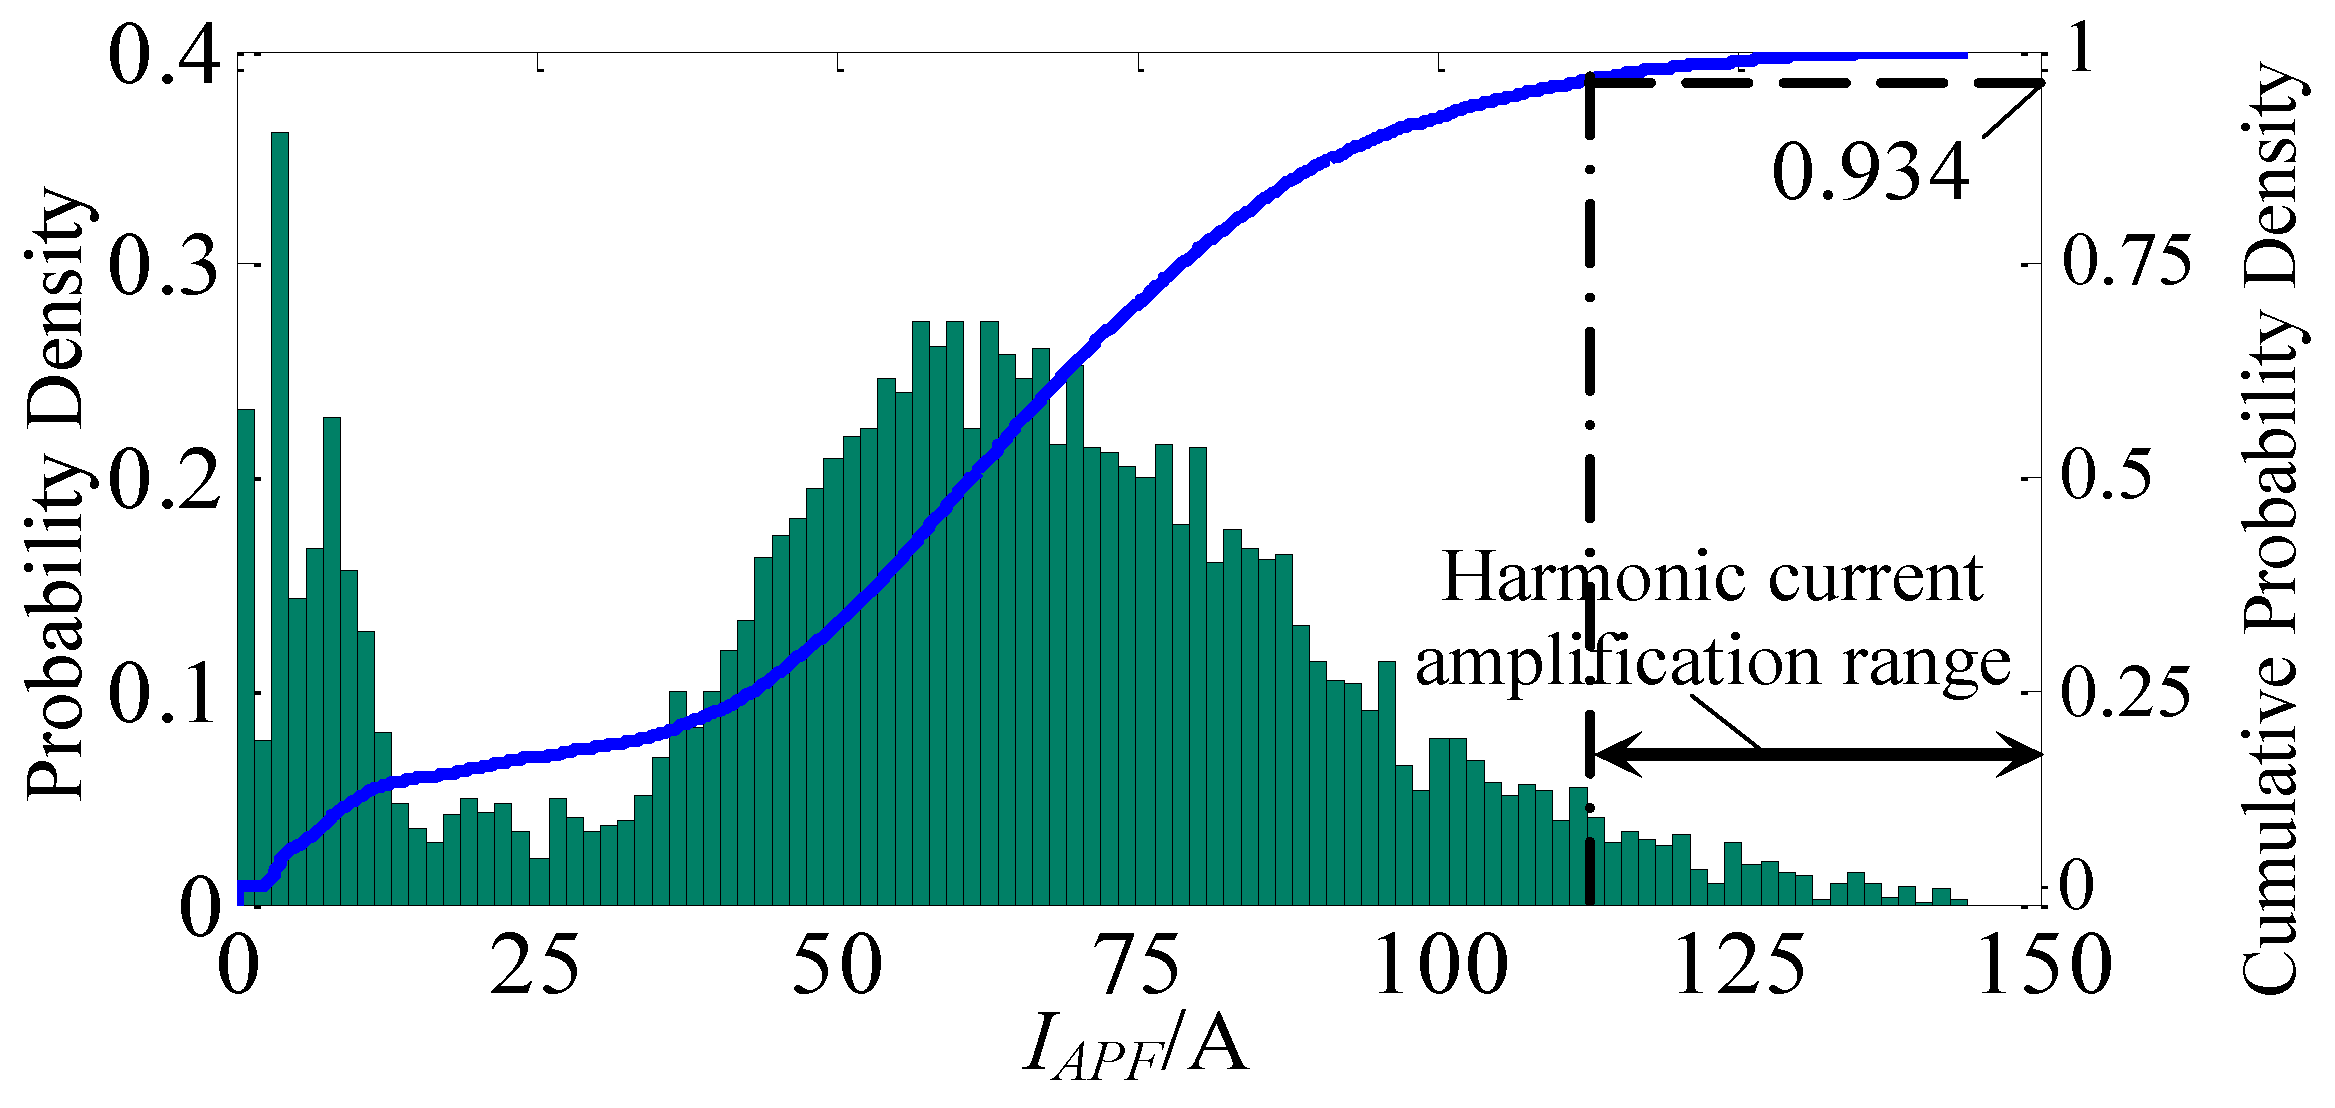
(1) Quantification of harmonic current amplification

To assess the degree of overload of the shunt APF caused by the harmonic amplification effect in the charging station, the overload factor is defined according to the RMS (Root Mean Square) values of the total harmonic current when the APF is connected and disconnected:
λ = I k 2 / I k 2 = ( I k I F k / I k 2 ) 2 = ( ω k I F k ) 2
where Ik and Ik are the RMS magnitudes of the kth harmonic current when the APF is connected and disconnected, respectively; IFk is the kth harmonic amplification factor, which is equal to Ik divided by Ik [18]; and ωk is the weighting for the kth harmonic current. When correcting the capacity of the APF, the overload factor λ is used to ensure that there is sufficient capacity for the shunt APF to provide harmonic compensation.
Based on the simulation results of Figure 7, the variation of the harmonic weightings ωk can be obtained as Figure 8a, and the variation of IF5, IF7 and λ with the compensation rate and the compensation phase difference of the APF are shown in Figure 8b. The weighting of the fifth current harmonic is the highest. The overload factor λ and amplification factor IF5 are highly similar under different compensation conditions; therefore, IF5 can be used as an approximation to estimate the overload level of the shunt APF in the charging station.

(2) Frequency-domain harmonic model of charger

After the parameters of the charger are estimated, the overload factor of the shunt APF in the charging station can be determined from simulation, but the overload factor cannot be determined analytically. Therefore, it is necessary to derive the frequency-domain harmonic model of the three-phase charger. According to the operating principles of the charger in Figure 1, taking the A-phase current as an example, the voltage and current balance equation in the conducting intervals [α1, δ1] and [α1 + π, δ1 + π] is:
C d u ba ( t ) d t + u ba ( t ) R = C L d 2 i a ( t ) d t 2 + L R d i a ( t ) d t + i a ( t )
Figure 8. Relation between the overload coefficient and amplification coefficient of the harmonic current. (a) Weighting of each current harmonic; (b) Variation of IFk and λ with the compensation rate and compensation phase difference.
Energies 07 05425 g008
Transforming Equation (10) into the complex frequency domain and substituting s = jhω, the A-phase current in [α1, δ1] and [α1 + π, δ1 + π] is:
i a ( t ) = h = 1 , 7 , ... H 6 U h G h cos ( h ω t + φ h + π 6 + θ h )   h = 5 , 11 , ... H 6 U h G h cos ( h ω t + φ h π 6 + θ h )  
where Gh and θh are the amplitude and phase angle, respectively, of the DC equivalent admittance. Similarly, the A-phase current in the conduction intervals [α2, δ2] and [α2 + π, δ2 + π] is:
i a ( t ) = h = 1 , 7 , ... H 6 U h G h cos ( h ω t + φ h π 6 + θ h ) h = 5 , 11 , ... H 6 U h G h cos ( h ω t + φ h + π 6 + θ h )  
Additionally, the charging current ia(t) in the rest region of the wave circle is 0. After the Fourier expansion of ia(t) through one cycle, we can calculate the kth harmonic vector I g ak , which can be written in matrix form [19,20] as:
I k = Y + U h + Y U h
where Ik is the vector of AC harmonic current, Uh and Uh* are the input harmonic voltage vector and its conjugate vector, respectively, and Y+ and Y are the coupled harmonic admittance matrices. The elements of Y+ and Y can be calculated using Equation (14) or Equation (15) according to the operating conditions of the charger. Using the estimation method from Section 2 to obtain the parameters of the charger equivalent circuit and the firing angle, the extinction angle of the harmonic analytical model and the coupled admittance matrix of the charger can be determined based on the measurements. The elements of the Y+ and Y matrices in DCM are:
Y k , h + = 3 G h π e j ( π 6 r + θ h ) e j ( h k ) δ 1 e j ( h k ) α 1 j ( h k ) 3 G h π e j ( π 6 r + θ h ) e j ( h k ) δ 2 e j ( h k ) α 2 j ( h k ) ,   h k  
Y k , h + = 3 G h π e j ( π 6 r + θ h ) ( δ 1 α 1 ) 3 G h π e j ( π 6 r + θ h ) ( δ 2 α 2 ) ,   h = k
Y k , h = 3 G h π e j ( π 6 r + θ h ) e j ( h + k ) δ 1 e j ( h + k ) α 1 j ( h + k ) + 3 G h π e j ( π 6 r + θ h ) e j ( h + k ) δ 2 e j ( h + k ) α 2 j ( h + k )  
The elements of the Y+ and Y matrices in CCM are:
Y k , h + = 3 G h π e j ( π 6 r + θ h ) e j ( h k ) α 2 e j ( h k ) α 1 j ( h k ) 3 G h π e j ( π 6 r + θ h ) e j ( h k ) δ 2 e j ( h k ) α 2 j ( h k ) ,   h k  
Y k , h + = 3 G h π e j ( π 6 r + θ h ) ( α 2 α 1 ) 3 G h π e j ( π 6 r + θ h ) ( δ 2 α 2 ) ,   h = k
Y k , h = 3 G h π e j ( π 6 r + θ h ) e j ( h + k ) α 2 e j ( h + k ) α 1 j ( h + k ) + 3 G h π e j ( π 6 r + θ h ) e j ( h + k ) δ 2 e j ( h + k ) α 2 j ( h + k )  

4.2. Capacity Correction Method for the Shunt APF in a Charging Station

From Figure 6a, when the charging power is greater than a certain value, the current total harmonic distortion is constant, but the harmonic current continues to increase, which means that the harmonic current of the charger increases to its maximum when the power is the rated power, and the overload factor of the charging current harmonic at this point can be used to correct the capacity of the shunt APF. Because it would increase the scale and complexity of computation to estimate the parameters and calculate the overload factor for each of the multiple chargers in a charging station, this paper establishes an equivalent model of multiple chargers of the same type, and a single equivalent charger circuit is created.
Assuming that there are M groups of chargers of different types, as shown in Figure 9, the instantaneous waveforms of the charging current i(m) and terminal voltage u(m), as well as the voltage harmonic vector Uh(m), can be obtained by measuring the data from the chargers of the mth group in operation alone. The harmonic matrices Y+(m) and Y−(m) can be calculated using the method presented, and the overload factor λ(m) for the chargers of the mth group operating alone can be described by:
λ ( m ) I F 5 ( m ) = I 5 ( m ) / I 5 ( m ) = [ y 51 + ( m ) + y 51 ( m ) ] U 1 ( m ) y 5 + ( m ) U h ( m ) + y 5 ( m ) U h ( m )
where y5+(m) and y5−(m) are the second row vectors of the matrices Y+(m) and Y−(m), respectively, and y51+(m) and y51−(m) are the elements of the second row and first column, respectively. The superscript m represents the chargers of the mth group. The terminal voltage of the chargers only contains the fundamental component U1(m) when the APF is connected.
Figure 9. Equivalent circuit of charging station.
Energies 07 05425 g009
Combining the voltage harmonic vector Uh measured at the coupling point when all the chargers are in operation with the harmonic matrices Y+(m) and Y−(m) obtained by testing a single group of chargers, the overload factor λ for the charging station can be obtained as:
λ I F 5 = m = 1 M [ y 51 + ( m ) + y 51 ( m ) ] U 1 m = 1 M y 5 + ( m ) U h + m = 1 M y 5 ( m ) U h = m = 1 M k ( m ) λ ( m )
where k(m) is the correlation factor between λ(m) of the mth group of chargers and the λ of the charging station:
k ( m ) = y 5 + ( m ) U h ( m ) U 1 ( m ) + y 5 ( m ) U h ( m ) U 1 ( m ) m = 1 M y 5 + ( m ) U h U 1 + m = 1 M y 5 ( m ) U h U 1
From the current harmonic vector Ik measured when all chargers are in operation, the capacity IAPF of the shunt APF, considering the harmonic amplification, can be determined by the product of Ik and the overload factor λ according to:
I APF = λ k = 5 K I k 2
Choosing a shunt APF with a maximum output harmonic current ImaxIAPF (and as close as possible to IAPF) will meet the harmonic current compensation demand of the charging station.
Figure 10 is the capacity correction flowchart for the shunt APF in a charging station. Firstly, the voltage and current, when a single group of chargers and the APF is disconnected (the mth group of chargers, m = 1, 2…M), can be measured. And the corresponding characteristic parameters are extracted based on the recorded curves. Thus, the equivalent circuit parameters of the mth group of chargers can be obtained by the parameter estimation method in Section 2. According to the harmonic analytical model in Section 4.1, the coupled harmonic admittance matrices Y+(m) and Y−(m) of the mth group of chargers can be established, then the overload factor λ(m) can be calculated from Equation (16). Secondly, the voltage and current curves when all of the chargers of the M groups are put into operation simultaneously can be measured, and the correlation factor k(m) can be obtained by Equation (18). Finally, the overload factor λ for the charging station can be gained by substituting λ(m) and k(m) into Equation (17). The capacity of the shunt APF can be determined by multiplying the result with the measured current harmonic components.
Figure 10. Flowchart for capacity correction of the shunt APF.
Energies 07 05425 g010

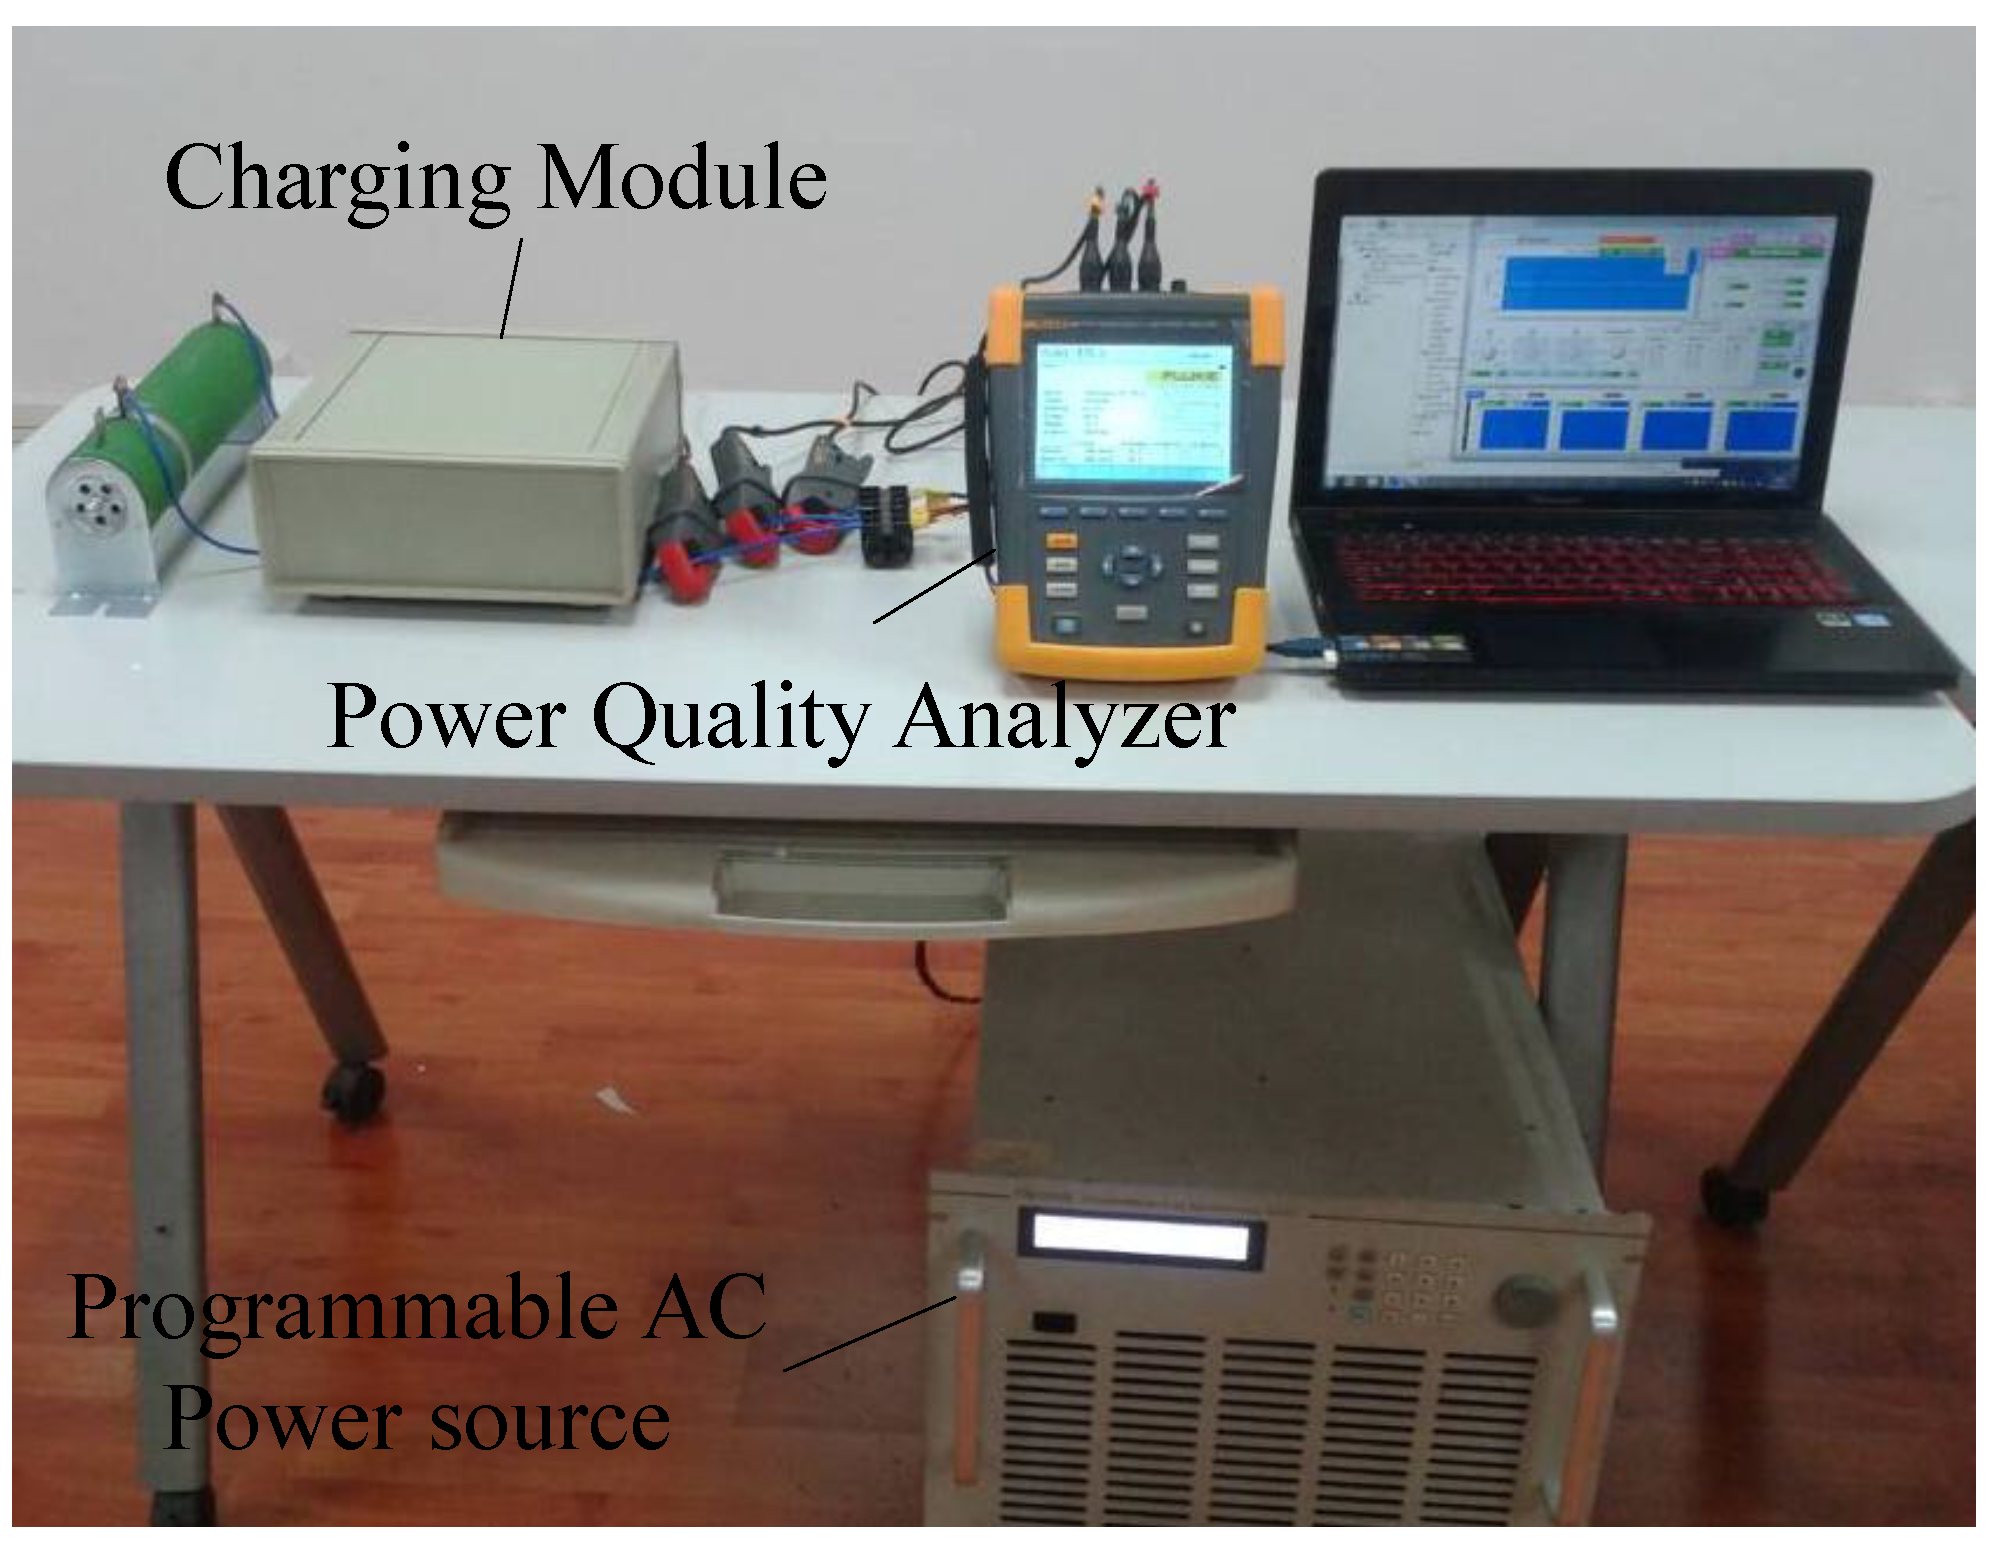
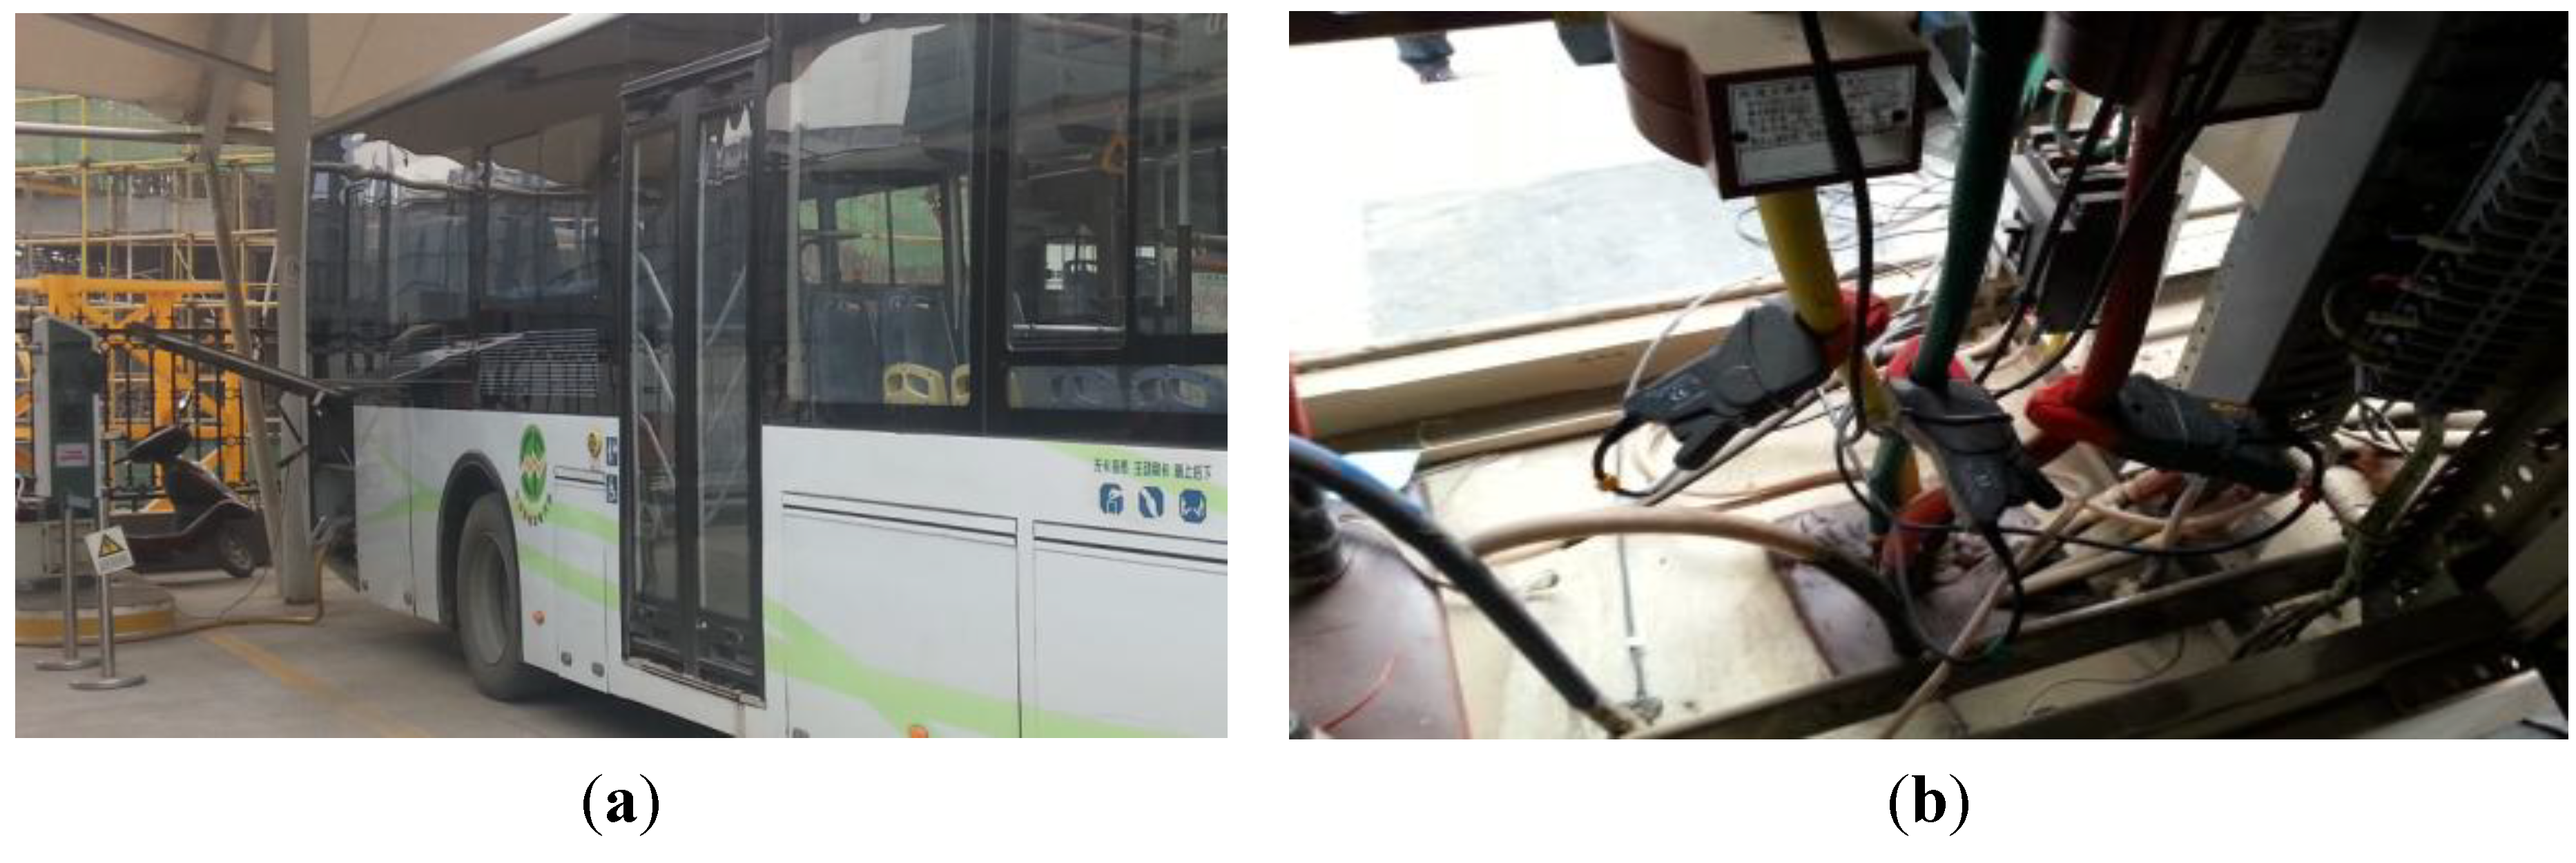
5. Field Test and Experimental Verification

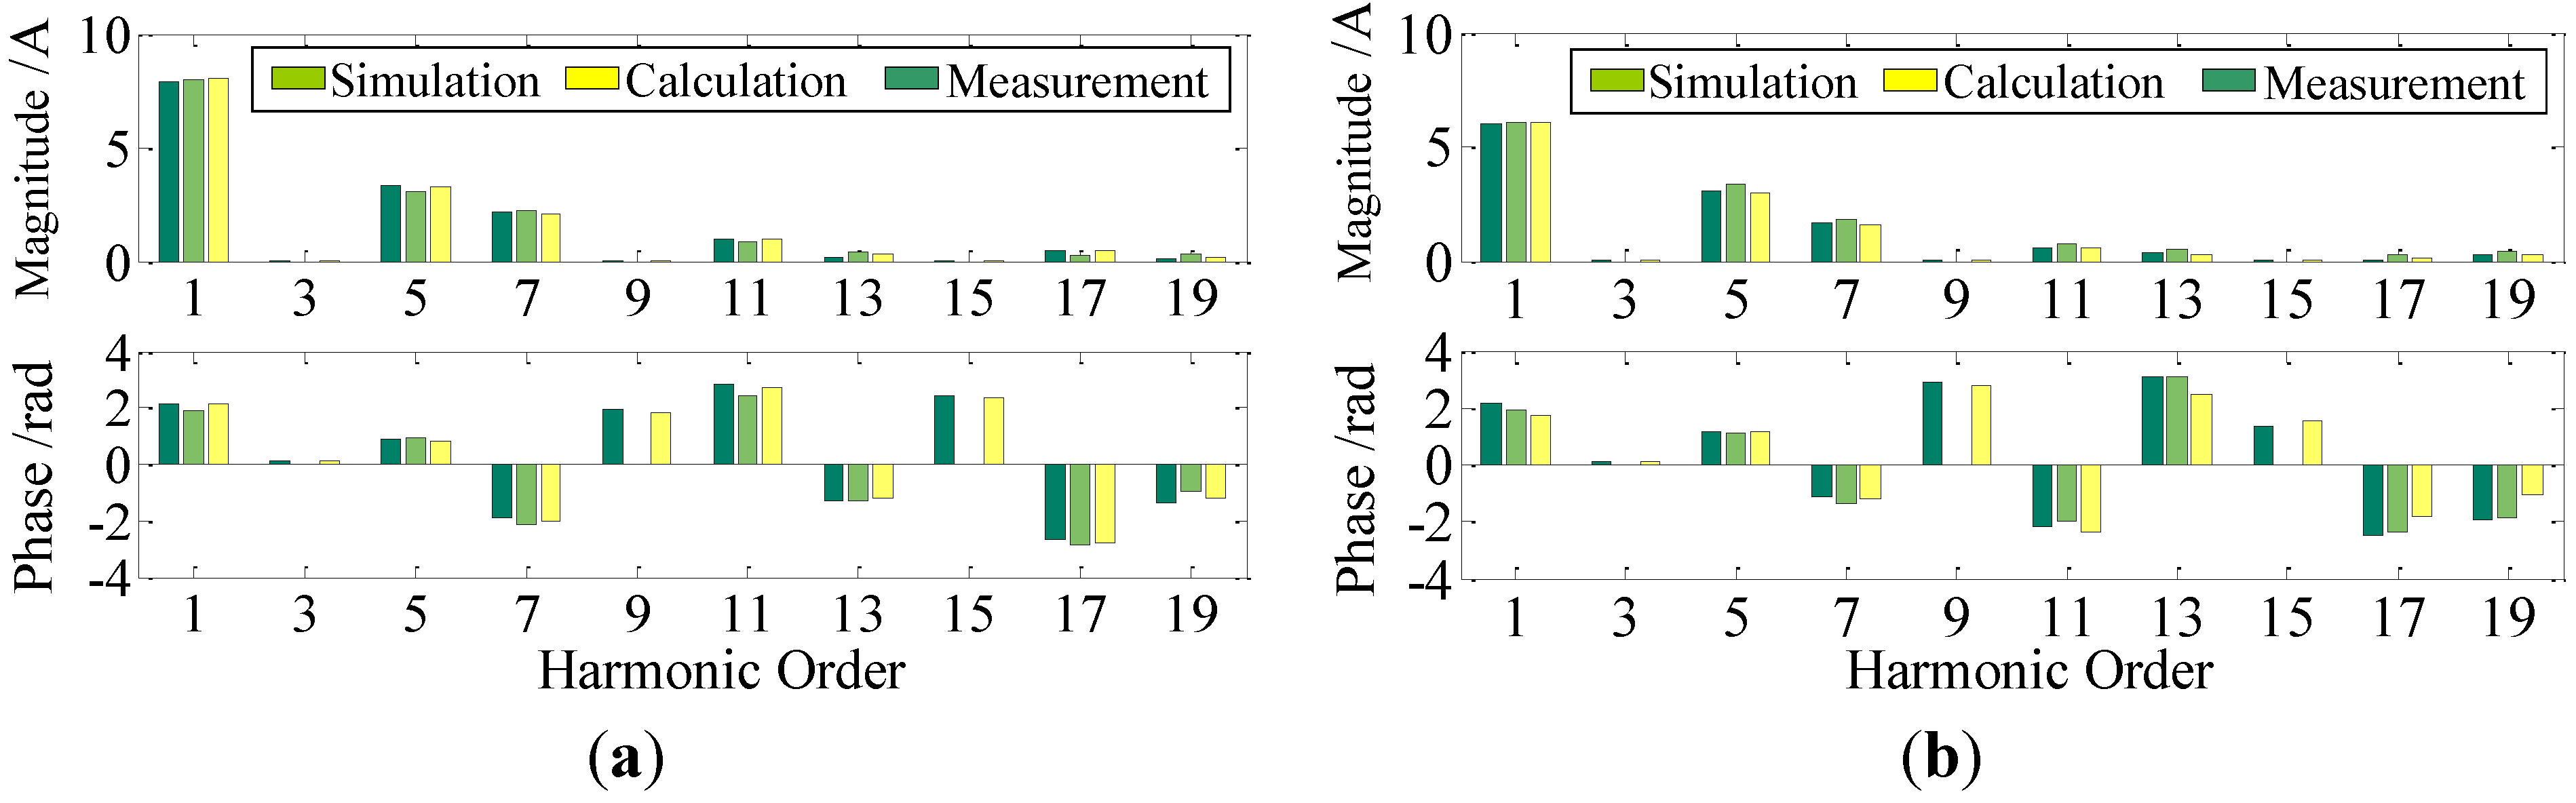
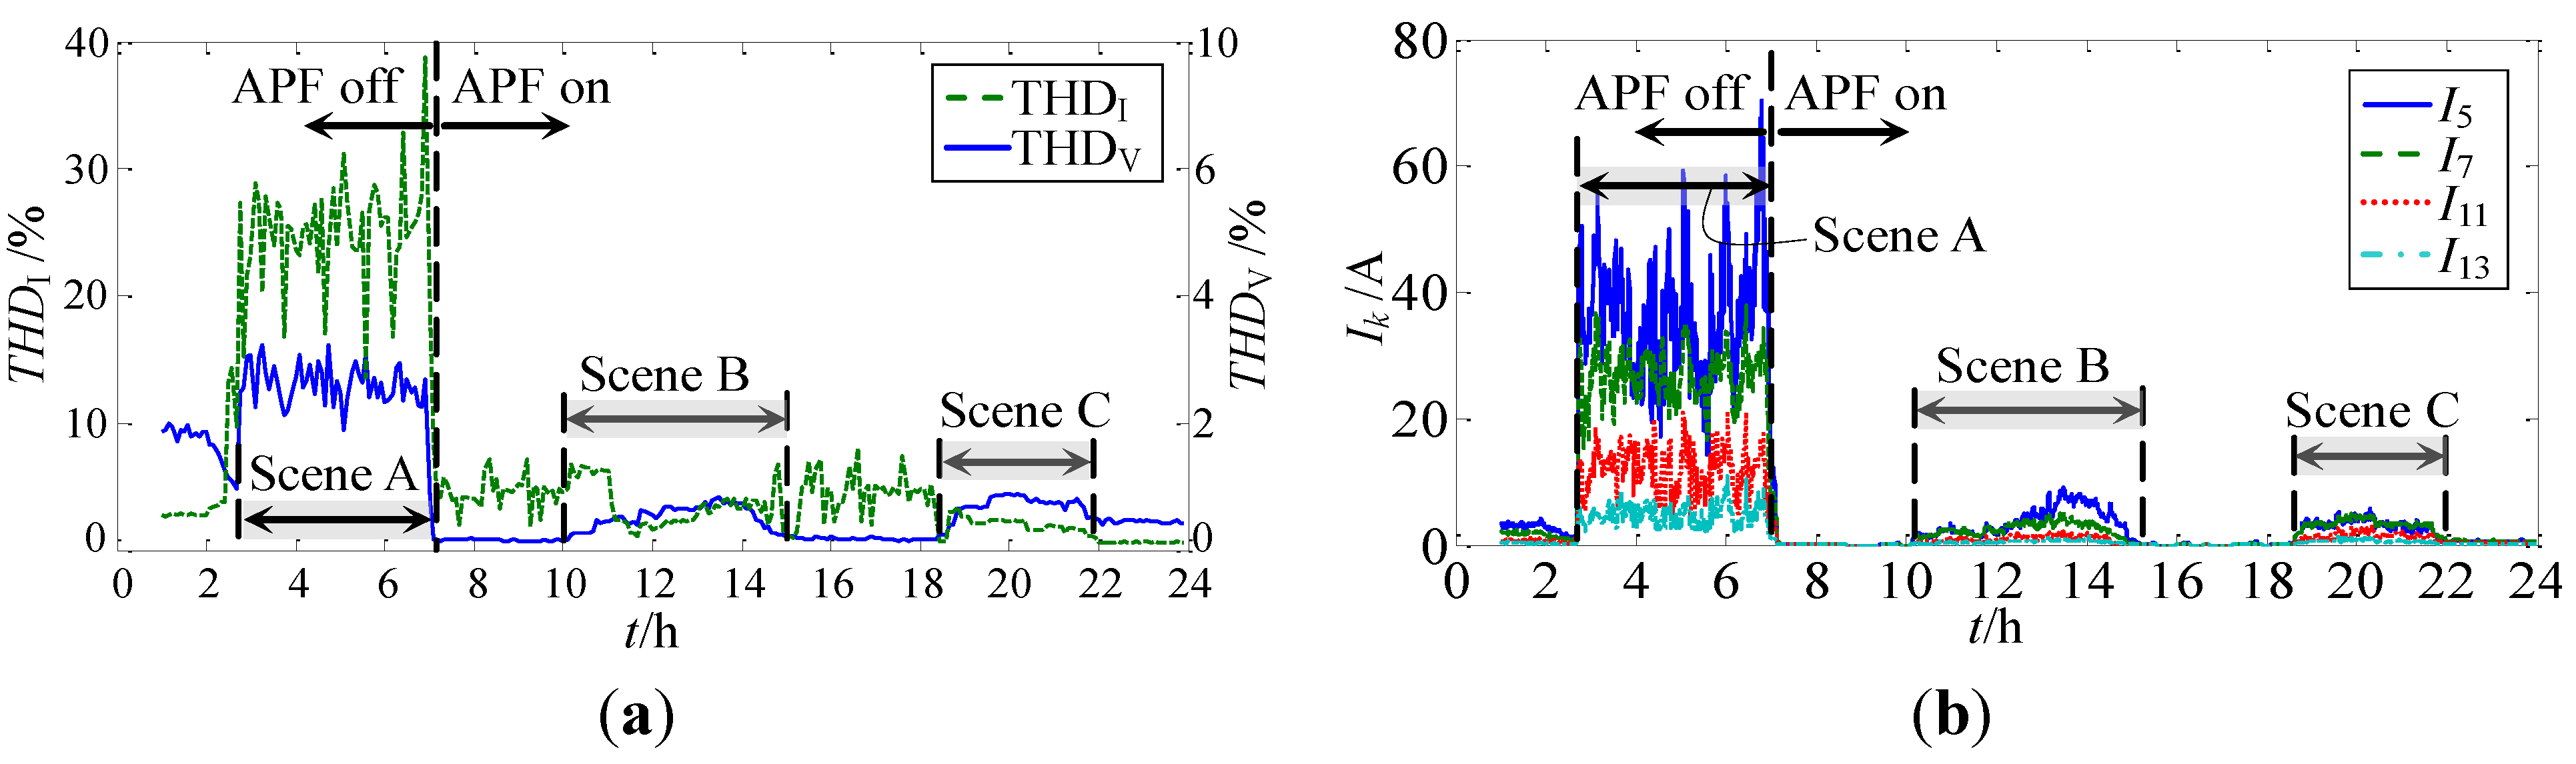
5.1. Verification of the Frequency-Domain Harmonic Model of A Charging Station

A circuit consisting of a charging station, which contains three chargers, is used for the experimental verification. The parameters of two of the chargers are L = 2 mH, C = 363 µF and R = 128 Ω, and the parameters of the other charger are L = 4 mH, C = 400 µF and R = 30 Ω. The circuit is tested using the voltage harmonic conditions in Table 1. Chargers with the same parameters are combined into the same group; therefore, the chargers in the experiment are divided into two groups. The estimated parameters and frequency-domain harmonic admittance matrices of the two groups can be obtained based on the measured voltage and current waveforms from each group.
The phase angles and magnitudes of each current harmonic are calculated using Equation (13). Figure 11 presents the measured results, the simulation results using the estimated parameters and the calculated results using the frequency-domain analytical model. The harmonics calculated using the frequency-domain analytical method and those obtained from the simulation are similar to the measured results in both voltage conditions. Thus, the harmonic model is validated.
Figure 11. Comparison of the harmonic current amplitude and phase of the charging station: (a) case 1 and (b) case 2.
Energies 07 05425 g011

5.2. Verification of the Capacity Correction Method for the Shunt APF in a Charging Station

The shunt APF capacity correction method is implemented in a charging and swap station for electric buses. Figure 12 presents the field test of the charging station, which contains five 20 kW three-phase chargers for plug-in hybrid electric buses, a 60 kW three-phase charger for purely electric buses charging at night and seven 10 kW branch box chargers to charge the battery boxes of purely electric buses. These three types of chargers are labeled as groups 1 to 3, respectively. The equivalent circuit parameters for each group of chargers are obtained from the measured parameters, as shown in Table 4. The table also shows the correlation factors and overload factors for each group of chargers.
Based on the measured data and Equation (17), and assuming that all chargers are in operation, the overload factor λ for the charging station is 1.235. Thus, the shunt APF capacity IAPF of the charging station is 1.235 × 118 = 145.7 A. Therefore, we choose a shunt APF with a capacity of 150 A. The harmonic data from the electric bus charging and swap station is recorded using a Fluke 435-II power analyzer. Figure 13 shows the total voltage, the current harmonic distortion rate and the harmonic current (using the three-phase average value) at the station coupling point with the APF disconnected and connected. Scene A is the situation in which the chargers of the first and third groups are charging simultaneously, scene B includes only the first group, and scene C includes the first and second groups. In Figure 13, the harmonic current in scenes B and C can be compensated effectively when the shunt APF is connected. During the period that the chargers are not running, the total harmonic distortion is greater because of the small fundamental current. The harmonic voltage of the coupling point and the harmonic current injected into the power grid can be effectively suppressed using the proposed method to allocate the capacity of the shunt APF in the charging station.
Figure 12. Field test of the bus charging and swap station. (a) An electric bus charging; (b) Common coupling point in the charging and swap station.
Energies 07 05425 g012
Table 4. Overload coefficients and estimated parameters.
GroupEstimated Parametersk(m)λ(m)
RL/mHC/µF
12.60.2680000.341.205
24.30.616000.321.347
33.80.2498000.321.233
Figure 13. Field test results with the APF disconnected and connected: (a) total harmonic distortion and (b) individual harmonic current.
Energies 07 05425 g013
The probability density curve of the compensation current can be obtained from data measured over a two-week period when the shunt APF was connected by sorting the RMS current between 0 and 150 A (at 1.5 A intervals), as shown in Figure 14. The harmonic amplification range is the region in which the current is greater than 118 A. When the harmonic amplification is not considered in determining the shunt APF capacity, the overload probability for the APF is 6.6%. The results of this long-term field test verify that the proposed method for selecting the shunt APF capacity can ensure adequate current harmonic compensation.
Figure 14. Statistical distribution of the APF current.
Energies 07 05425 g014

6. Conclusions

This paper proposes a measurement-based method for estimating the equivalent circuit parameters of a charger. The equivalent frequency-domain harmonic analytical model of a charging station is established by dividing chargers of the same type into groups. Then, the analytical formula of the APF overload factor to compensate for harmonic amplification is derived and used to correct the capacity of the APF in a charging station. The analysis of a charging station containing more than one charger shows that the fifth harmonic amplification factor can be used to approximately measure the degree of overload of the APF in the charging station and that the overload factor of the APF can be effectively calculated using the frequency-domain harmonic analytical model. Using the data measured from an electric bus charging and swap station, the feasibility of this method for correcting the shunt APF capacity is verified based on the harmonic test results during shunt APF compensation. Additionally, the proposed capacity correction method could be used to configure active power filter devices in other applications that produce harmonic pollution.

Acknowledgments

This work was supported by the National Natural Science Foundation of China (51277184) and the Scientific Research Foundation of the State Key Laboratory of Power Transmission Equipment and System Security (2007DA10512711209).

Author Contributions

The listed authors contributed together to achieve this research paper. Niancheng Zhou designed the overall layout of the work in the paper, Jiajia Wang did the modeling, simulation and writing of the paper, Qianggang Wang contributed to guide, modify and improve the paper, Nengqiao Wei did the experimental test, and Xiaoxuan Lou assisted in revising the typing errors and grammar mistakes.

Conflicts of Interest

The authors declare no conflict of interest.

References

  1. Baptista, P.C.; Silva, C.M.; Peças Lopes, J.A.; Soares, F.J.; Almeida, P.R. Evaluation of the benefits of the introduction of electricity powered vehicles in an island. Energy Convers. Manag. 2013, 76, 541–553. [Google Scholar] [CrossRef]
  2. Kuperman, A.; Levy, U.; Goren, J.; Zafransky, A.; Savernin, A. Battery charger for electric vehicle traction battery switch station. IEEE Trans. Ind. Electron. 2013, 60, 5391–5399. [Google Scholar] [CrossRef]
  3. Etezadi-Amoli, M.; Choma, K.; Stefani, J. Rapid-charge electric-vehicle stations. IEEE Trans. Power Del. 2010, 25, 1883–1887. [Google Scholar]
  4. Yilmaz, M.; Krein, P.T. Review of battery charger topologies, charging power levels, and infrastructure for plug-in electric and hybrid vehicles. IEEE Trans. Power Electron. 2013, 28, 2151–2169. [Google Scholar] [CrossRef]
  5. Jiang, J.; Bao, Y.; Wang, L.Y. Topology of a bidirectional converter for energy interaction between electric vehicles and the grid. Energies 2014, 7, 4858–4894. [Google Scholar] [CrossRef]
  6. Jiang, C.; Salles, D.; Xu, W. Method to assess the power-quality impact of plug-in electric vehicles. IEEE Trans. Power Del. 2014, 29, 958–965. [Google Scholar] [CrossRef]
  7. Lucas, A.; Neto, R.C.; Silva, C.A. Impact of energy supply infrastructure in life cycle analysis of hydrogen and electric systems applied to the Portuguese transportation sector. Int. J. Hydrog. Energy 2012, 15, 10973–10985. [Google Scholar] [CrossRef]
  8. Lucas, A.; Neto, R.C.; Silva, C.A. Energy supply infrastructure LCA model for electric and hydrogen transportation systems. Energy 2013, 56, 70–80. [Google Scholar] [CrossRef]
  9. International Electrotechnical Commission. Electromagnetic Compatibility (EMC)—Part 3-2: Limits—Limits for Harmonic Current Emissions (Equipment Input Current 16 A per Phase); IEC Standard 1000-3-2; International Electrotechnical Commission (IEC): Geneva, Switzerland, 2000. [Google Scholar]
  10. Society of Automotive Engineers (SAE). Power Quality Requirements for Plug-In Electric Vehicle Chargers; SAE Standard J2894; SAE International: Warrendale, PA, USA, 2010. [Google Scholar]
  11. Verma, A.K.; Singh, B.; Shahani, D.T. Electric vehicle and grid interface with modified PWM rectifier and DC-DC converter with power decoupling and unity power factor. In Proceedings of the 5th India International Conference Power Electronics (IICPE), Delhi, India, 6–8 December 2012.
  12. Roh, Y.S.; Moon, Y.J.; Gong, J.C.; Yoo, C. Active power factor correction (PFC) circuit with resistor-free zero-current detection. IEEE Trans. Power Electron. 2011, 26, 630–637. [Google Scholar] [CrossRef]
  13. Soeiro, T.B.; Friedli, T.; Kolar, J.W. Design and implementation of a three-phase buck-type third harmonic current injection PFC rectifier SR. IEEE Trans. Power Electron. 2013, 28, 1608–1621. [Google Scholar] [CrossRef]
  14. Wichakool, W.; Avestruz, A.T.; Cox, R.W.; Leeb, S.B. Modeling and estimating current harmonics of variable electronic loads. IEEE Trans. Power Electron. 2009, 24, 2803–2811. [Google Scholar] [CrossRef]
  15. Yoo, K.M.; Kim, K.D.; Lee, J.Y. Single-and three-phase PHEV onboard battery charger using small link capacitor. IEEE Trans. Ind. Electron. 2013, 60, 3136–3144. [Google Scholar]
  16. Crosier, R.; Wang, S. DQ-frame modeling of an active power filter integrated with a grid-connected, multifunctional electric vehicle charging station. IEEE Trans. Power Electron. 2013, 28, 5702–5716. [Google Scholar] [CrossRef]
  17. Hamad, M.S.; Masoud, M.I.; Ahmed, K.H.; Williams, B.W. A shunt active power filter for a medium-voltage 12-pulse current source converter using open loop control compensation. IEEE Trans. Ind. Electron. 2014, 61, 5840–5850. [Google Scholar] [CrossRef]
  18. Sainz, L.; Balcells, J. Harmonic interaction influence due to current source shunt filters in networks supplying nonlinear loads. IEEE Trans. Power Del. 2012, 27, 1385–1393. [Google Scholar] [CrossRef]
  19. Yong, J.; Chen, L.; Nassif, A.B.; Xu, W. A frequency-domain harmonic model for compact fluorescent lamps. IEEE Trans. Power Del. 2010, 25, 1182–1189. [Google Scholar] [CrossRef]
  20. Sun, Y.; Zhang, G.; Xu, W.; Mayordomo, J.G. A harmonically coupled admittance matrix model for AC/DC converters. IEEE Trans. Power Syst. 2007, 22, 1574–1582. [Google Scholar] [CrossRef]
  21. Yong, J.; Chen, L.; Chen, S.Y. Modeling of home appliances for power distribution system harmonic analysis. IEEE Trans. Power Del. 2010, 25, 3147–3155. [Google Scholar] [CrossRef]
  22. Ziari, I.; Jalilian, A. A new approach for allocation and sizing of multiple active power-line conditioners. IEEE Trans. Power Del. 2010, 25, 1026–1035. [Google Scholar] [CrossRef]
  23. Terciyanli, A.; Ermis, M.; Cadirci, I. A selective harmonic amplification method for reduction of kVA rating of current source converters in shunt active power filters. IEEE Trans. Power Del. 2011, 26, 65–78. [Google Scholar] [CrossRef]

