Article

Effect of Torrefaction on the Properties of Corn Stalk to Enhance Solid Fuel Qualities

1
Department of Mechanical Engineering, Kongju National University, 1223-24 Cheonan-Daero, Seobuk, Chungnam 330-717, Korea
2
Department of Environmental Engineering, Kongju National University, 1223-24 Cheonan-Daero, Seobuk, Chungnam 330-717, Korea
*
Author to whom correspondence should be addressed.
Energies 2014, 7(9), 5586-5600; https://doi.org/10.3390/en7095586
Submission received: 19 June 2014 / Revised: 11 August 2014 / Accepted: 21 August 2014 / Published: 27 August 2014

Abstract

:
This study presents the effects of torrefaction on the basic characteristics of corn stalks. Corn stalks were torrefied in a horizontal tubular reactor at temperatures ranging from 150 °C to 400 °C, for torrefaction periods varying from 0 min to 50 min. The torrefied corn stalk products were characterized in terms of their elemental composition, energy yield, ash content, and volatile fraction. The gaseous products were also analyzed. Thermogravimetric analysis (TGA) of the samples was carried out in order to obtain the apparent activation energy for the torrefaction of corn stalks. The weight loss data according to the degradation temperature were analyzed using three different methods. The energy and mass yield were found to decrease with an increase in the temperature, whereas the higher heating value (HHV) increased. From this work, it was found that the compounds with oxygen were emitted at a temperature lower than that for hydrocarbon gases and the temperatures of 290–330 °C were the optimum torrefaction temperatures for corn stalks.

Graphical Abstract

1. Introduction

Owing to the increasing impact of traditional energy usage on global climate patterns and the environment, stakeholders are turning their attention to renewable energy sources. Biomass is a primary type of renewable energy which is expected to be an important energy source in the coming years. Of the different non-conventional energy sources available (e.g., wind, solar, tidal, and nuclear), biomass is widely available and is considered to be carbon neutral, in that the net carbon emissions resulting from the burning of biomass are zero.
Raw biomass is generally characterized by its high moisture content and volatility, and by its lower higher heating value (HHV) and energy density levels compared to fossil fuels [1]. Biomass thus has some disadvantages when used as fuel, such as its low HHV, high moisture content, hygroscopic nature, smoke emission during combustion, its heterogeneous and uneven composition, and transport difficulties [2]. As an alternative energy source, biomass is also associated with the controversial issue of depleting food crop harvests and possibly natural forests which can be resolved by collecting farm waste [3]. Existing technologies to convert biomass to energy include thermochemical and biochemical processes [4]. The thermochemical conversion process is the most common technique, which include combustion, pyrolysis, gasification, and liquefaction [2,5]. The treatment of biomass at low temperatures ranging from 200 °C to 300 °C under an inert atmosphere was known to be effective for improving the energy density and shelf life of the biomass [2,6,7,8]. This treatment is referred to as “torrefaction”, and it has been widely applied to wood and grass biomass over the past few years. Torrefaction is a technology which allows the moisture and low-weight organic volatile components in biomass to be removed, producing a hydrophobic solid product with an increased energy density (on a mass basis) and greatly increased grindability [6,7,8]. It involves the slow pyrolysis of materials in the absence of oxygen, with the aim of maximizing the solid yield, thus producing a large fraction of bio char (70%–85%) for use in energy, metallurgical fuel, chemical, and fertilization applications [9]. The main improvements of torrefied biomass include reduced moisture and an increased energy density; a reduced oxygen-to-carbon (O/C) ratio, which increases the HHV; the strong fibers of the biomass becoming brittle, which improves grindability by reducing the cost and energy required for grinding; and the ignitability and reactivity is improved, which enhances the efficiency during gasification or pyrolysis [10,11].
Torrefaction can be incorporated into a combined drying, torrefaction, and pelletization process, with both economic and energy efficiency benefits [11]. However, this process requires a separate plant, the input of the process energy, and the production of gaseous and volatile streams, entailing capital costs, operating costs, and emission control efforts. A balance between these associated costs for fuels which are more grindable and have higher HHV is therefore critical for the future of torrefaction and requires thorough analysis and extensive, reliable data [11].
A considerable amount of corn stalk waste is produced annually, as corn is one of the most common staple crops worldwide [3]. However, very few studies have been carried out on the handling or reuse of cornstalk waste as biomass. In this research, the torrefaction of readily available cheap feedstock corn stalk waste was carried out in a horizontal tubular reactor in the presence of nitrogen gas. Alternative methods to treat corn stalk waste are conversion to alcohol and conversion to an organic fertilizer by means of a bio-treatment. However, these methods generate a large amount of waste. Very few studies have been published regarding the torrefaction of corn stalks. Most factors regarding the torrefaction of corn stalk waste remain to be studied. To provide deep insight into the technique of torrefaction, this study investigates the effects of the torrefaction temperature and the torrefaction holding time on the processing of corn stalk waste.

2. Experimental Section

2.1. Materials

Corn stalks collected after harvesting in August 2013 from a farm located in Cheonan, Korea were used as the raw material in this study. After collection, each sample was homogeneously mixed and dried at 105 °C for 24 h. Table 1 shows the properties of the corn stalk samples used in this study. The moisture content of the corn stalks was 13.2%, with 2.1% ash content. The HHV of the sample was determined to be 18.49 MJ/kg. Most of the “Others” components in Table 1 are inorganic materials.
Table 1. The properties of the corn stalk samples. HHV: higher heating value.
Elements (wt%)C44.79
H5.48
N0.34
O44.3
S0.04
Cl0.06
Others4.99
Moisture (%)13.2
Volatile fraction (%)84.7
Ash (%)2.1
HHV (MJ/kg)18.49

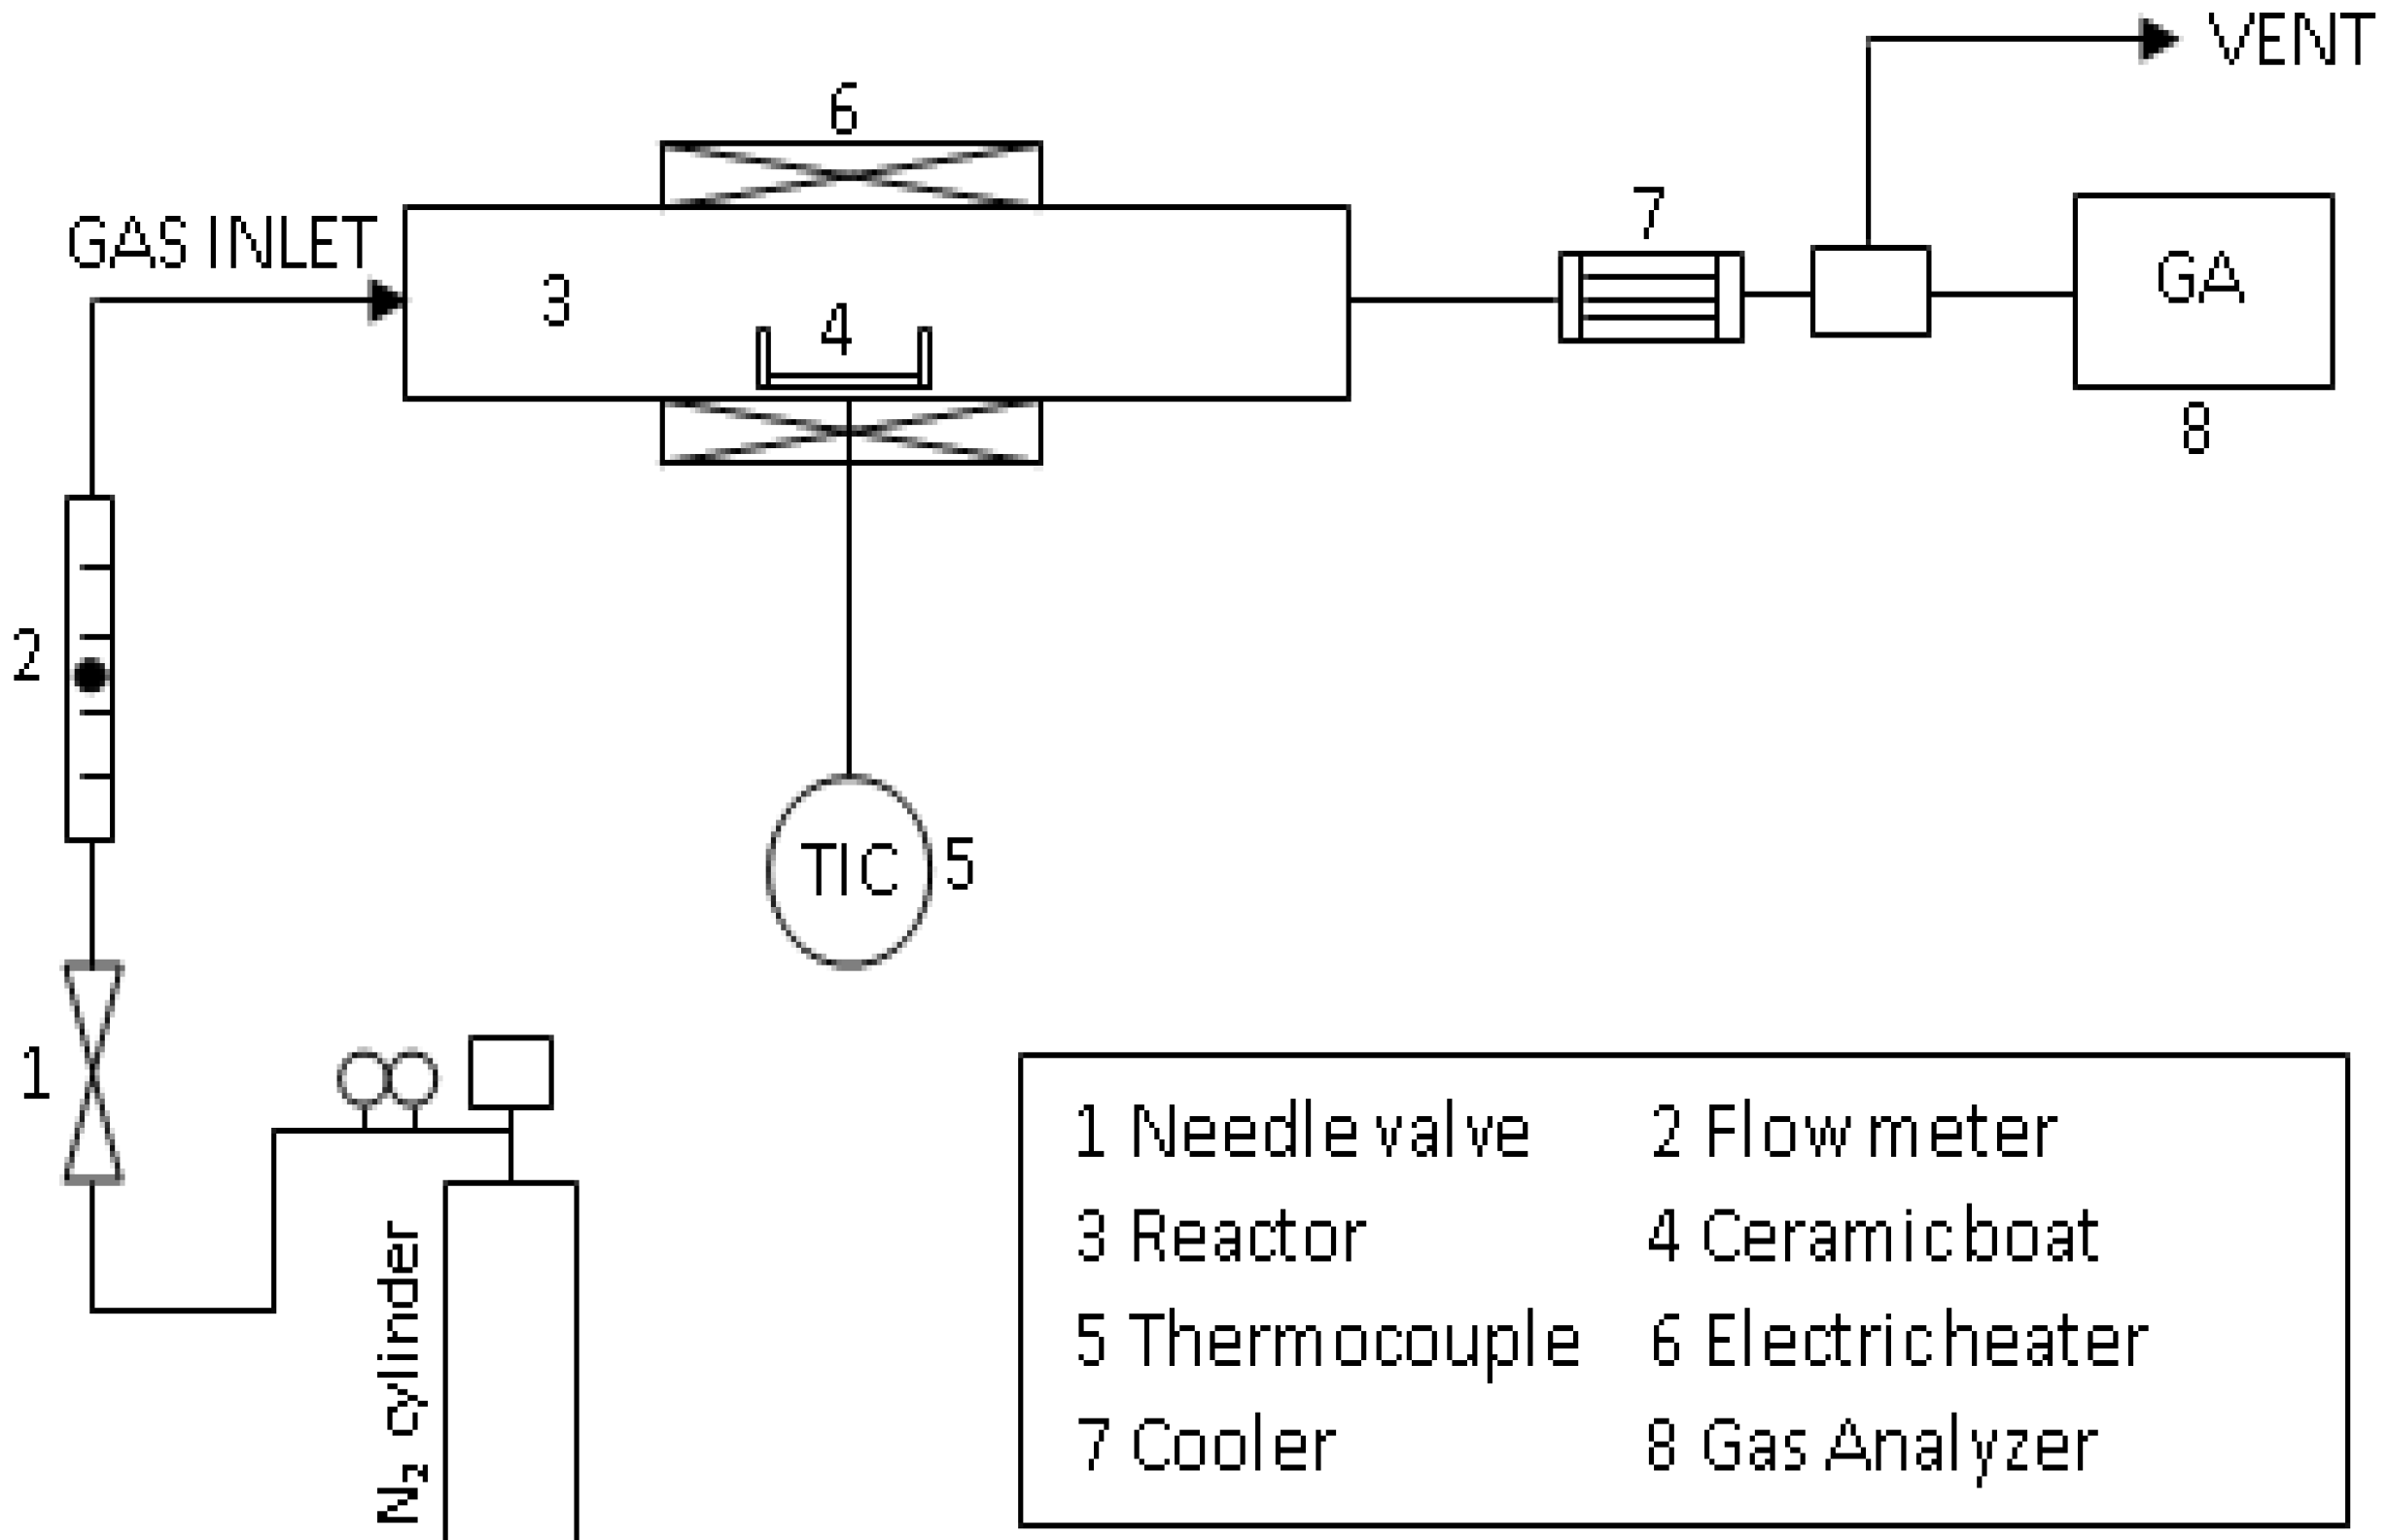
2.2. Experimental Device and Procedure

The dried sample was ground to ensure homogeneous experimental conditions. Each experiment was carried out with 5 g of sample at atmospheric pressure. In this study, a horizontal tubular reactor with an internal diameter of 150 mm and a length of 600 mm was used for torrefaction, as schematically shown in Figure 1. A prescribed amount of each sample was weighed and put in a crucible. Nitrogen flushing was done until the concentration of oxygen in reactor was less than 1%. After flushing the reactor with nitrogen (2 L/min) the temperatures of the reactor were raised to different desired temperatures ranging from 150 °C to 600 °C at a constant heating rate of 10 °C/min using an electric heater. When the torrefaction temperature reached the required experimental condition, the heating reactor was immediately stopped and the carrier gas was shut down. The torrefied sample was then instantly removed and was weighed. In order to investigate the influence of the residence time, the experiments for the torrefaction holding time have also been performed at various holding times varying from 0 min to 50 min for 250, 300 and 350 °C. In this experiment, the torrefaction holding time means the holding time after reaching the required temperature.
Figure 1. Schematic diagram of the horizontal tubular reactor.
Energies 07 05586 g001
For each experiment, the moisture content, HHV, volatile fraction, and ash content were measured. The HHV was measured using a bomb calorimeter (Parr Instrument Co., Model 1672, Moline, IL, USA). The ash content was determined by the standard method developed by National Renewable Energy Laboratory (NREL) [12]. Elemental analyses of the feedstock and torrefied sample were done by an elemental analyzer (Thermo FLASH 2000, Thermo Fisher Scientific Inc., Hudson, NH, USA). The emitted gas during the torrefaction of corn stalk was measured using a gas analyzer (Greenline MK2, Eurotron Instruments, Chelmsford, UK).
The mass and energy yields are defined by Equations (1) and (2), as used by Bridgeman et al. [11]:
Energies 07 05586 i001
Energies 07 05586 i002
To obtain the apparent activation energy of torrefaction, a thermogravimetric analysis (TGA) of the corn stalk waste was also conducted using a thermogravimetric analyzer (Q50, TA Instruments, New Castle, DE, USA). The sample was studied at various heating rates ranging from 10 °C/min to 30 °C/min and at temperatures ranging from ambient to 800 °C. The initial mass of each sample was 7.5 mg. All experiments were carried out in a nitrogen atmosphere under a flow rate of 60 mL/min.

2.3. Kinetic Analysis Methods

The basic rate equation of conversion, α, for thermal decomposition can be expressed in the Arrhenius form as:
Energies 07 05586 i003
where A, E, T, R, n, and α are the frequency factor (1/s), the activation energy (J/mol), the reaction temperature (K), the gas constant (8.314 J/mol·K), the overall reaction order, and the degree of conversion, respectively.
After taking the logarithm of Equation (3), the following equation can be obtained:
Energies 07 05586 i004
For a fixed value of α, the first term on the right-hand side of Equation (4) is constant. Thus, using Equation (4), it is possible to obtain values for E over a wide range of conversions from the slope (–E/R) by plotting ln(dα/dt) against 1/T. Thus, the apparent activation energy can be obtained from the average value of the activation energy for various values of α.
If the Equation (3) is used and a heating rate of β = dT/dt is employed, it can be shown that:
Energies 07 05586 i005
In an integration using a series of applications and simplifications [13], Equation (5) becomes:
Energies 07 05586 i006
where θ = TTs, and where Ts is defined as the temperature at which 1/(1 − α) = 1/exp = 0.368. With an unknown reaction order n, a generally applicable method for determining Ts is to find where d(1 − α)/dT is the maximum or where d2(1 − α)/dT2 = 0. When d2(1 − α)/dT2 = 0, Equation (6) becomes:
Energies 07 05586 i007
when θ = 0, and when (1 − α) =(1 − αs), Equation (7) yields:
Energies 07 05586 i008
In Equation (8), when αs is known, we can obtain the corresponding value of n. Integral approximations and logarithms of Equations (5) and (7) yield:
Energies 07 05586 i009
Energies 07 05586 i010
By plotting Energies 07 05586 i011 versus θ in Equation (9) and Y = ln[−ln(1 − α)] versus θ in Equation (10), we can obtain the activation energy, E, from the slope of the line.
The variables given in Equation (5) may also be separated and integrated to give a logarithmic form:
Energies 07 05586 i012
The apparent activation energy E can therefore be obtained from a plot of logβ against 1/T for a fixed degree of conversion, as the slope of such a line is given by 0.4567E/R. Among conventional non-isothermal thermogravimetric (TG) techniques, this technique is also known as the Ozawa method [14].

3. Results and Discussion

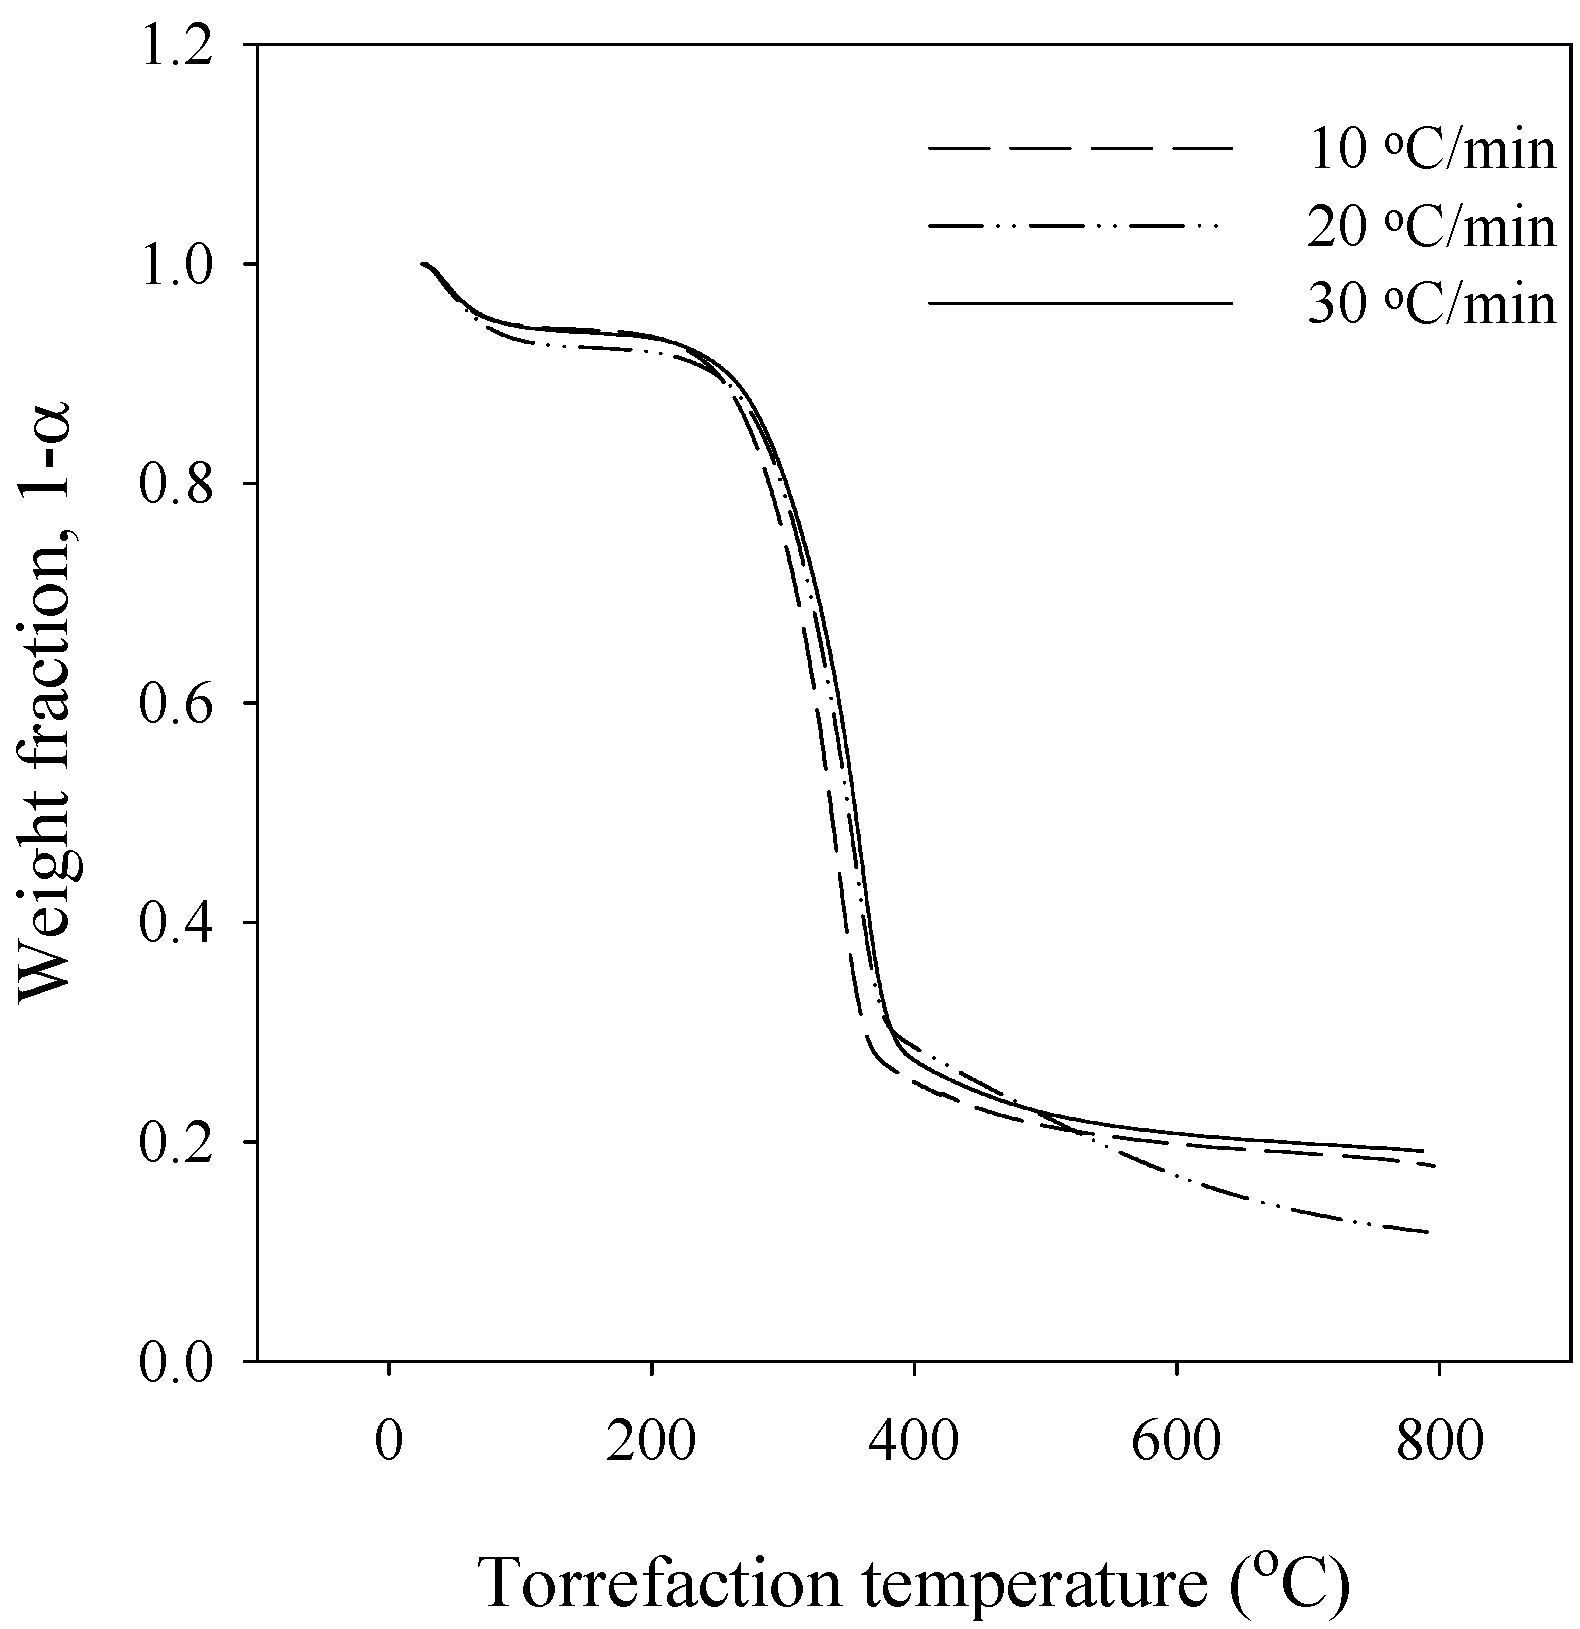
3.1. Thermogravimetric Analysis

Figure 2 shows the TG curves of a corn stalk sample in a nitrogen atmosphere. The decrease in the weight fraction up to 100 °C was attributed to moisture loss. The inception of torrefaction can be observed at temperatures around 250 °C upon the thermal degradation of the organic ingredients contained within the corn stalk. The thermal degradation of the corn stalk was completed at a temperature of approximately 400 °C. On further increasing the temperature, it was seen that there was the special tendency for heating rate of 20 °C/min after 400 °C. This is due to the difference of ash content caused by inhomogeneity of samples. Generally, it is difficult to determine the exact torrefaction temperature which shows the best technical and economic feasibility levels. Parameters such as the energy yield, the composition of the torrefied products, and the HHV must be considered to obtain the optimum torrefaction temperature. A lower mass yield results in a lower energy yield. Therefore, in this study, a kinetic analysis of the torrefaction of corn stalk waste was performed in the temperature range which led to a conversion of approximately 30%, after the complete removal of the moisture. It is well known that the kinetic investigation is very important to get information for rationally designing the reactor. There is no intention in this study to describe the fundamental chemical mechanisms for torrefaction of corn stalk waste. This study focuses on the measurement of apparent kinetic parameters useful for the engineering design of chemical processes.
Figure 2. Typical thermogravimetric (TG) curves of a corn stalk sample in an N2 atmosphere.
Energies 07 05586 g002
The calculated activation energies for each method are listed in Table 2. From Table 2, it can be seen that there are variations in the apparent activation energies depending on the mathematical approach used for kinetic analysis. These observations clearly indicate the problems in selecting and utilization the different analytical methods to describe the torrefaction of corn stalk. Equations (4) and (11) are the differential and the integral method using multiple heating rate experiments, respectively, whereas Equation (9) or (10) is the integral method using single heating rate experiment. The activation energies obtained from Equations (4) and (11) were similar as 193.0 kJ/mol and 184.1 kJ/mol, although the mathematical approaches are different from each other. However, the activation energies obtained from Equation (9) or (10) was lower than those of Equations (4) and (11). The calculated activation energies also varied with the heating rate. Therefore, it was concluded that the kinetic analysis methods using multiple heating rate experiments are more efficient compared to the use of a single heating rate.
Table 2. Summary of the apparent activation energies obtained.
MethodsApparent activation energy (kJ/mol)
Equation (4)193.0
Equation (9) or (10)Heating rate: 10 °C/min88.2
Heating rate: 20 °C/min72.9
Heating rate: 30 °C/min69.0
Average76.7
Equation (11)184.1

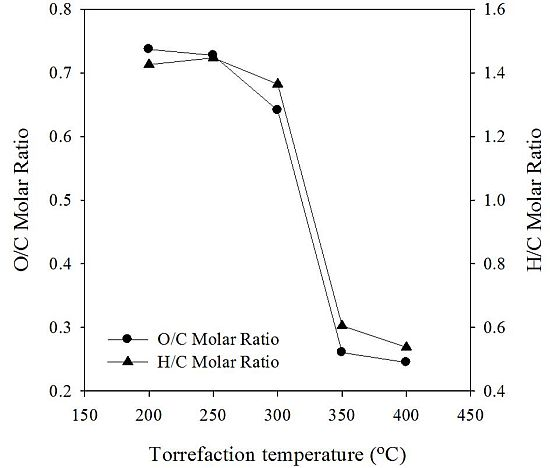
3.2. Elemental Analysis

The results of the elemental analysis of the torrefied products are shown in Figure 3. In this figure, the torrefaction holding times of all experiments were 0 min. From Figure 3a, it can be inferred that the weight percentage of C in the products increased with an increase in the torrefaction temperature. In contrast, the weight percentages of H and O had a decreasing trend. These decreases in hydrogen and oxygen are due to dehydration and de-carbon dioxide from the biomass during torrefaction [15,16]. It is clear that the emission of either CO2, CO or H2O will result in a decrease in the H and O contents of corn stalk waste. The increase in the carbon content is only an apparent increase due to the decrease in the oxygen content. These results indicate that the torrefaction method increases the energy density of the corn stalk by removing oxygen. From Figure 3b, it can be inferred that the nitrogen content increased slightly while the sulphur and chlorine contents did not vary much with an increase in the torrefaction temperature. This increase is a relative increase due to decreased level of oxygen.
Figure 3. Changes in element contents as a function of the torrefaction temperature: (a) C, H and O; and (b) N, S, and Cl.
Energies 07 05586 g003
Figure 4 shows the change in the O/C and H/C ratios with an increase in the torrefaction temperature. From this figure, it was found that the O/C ratio decreased with increasing torrefaction temperature after 250 °C. This decrease in the O/C ratio during torrefaction is attributed to the generation of volatiles rich in oxygen, such as CO, CO2 and H2O [16]. Further, it can be seen that the O/C ratios did not significantly change after 350 °C, as both C and O were lost in comparable quantities through devolatilization of hydrocarbon ingredients [17]. Also, the H/C ratio decreased with increasing temperature after 250 °C, while it did not significantly change after 350 °C, as in the case of O/C ratio. This is due to the fact that the carbon was relatively increased in comparison with the other elements by decreasing of oxygen at temperature of 250–350 °C, and the hydrocarbon gases containing hydrogen generated after 350 °C.
Figure 4. Profiles of the atomic oxygen-to-carbon (O/C) ratio vs. the O/C ratio of torrefied corn stalks.
Energies 07 05586 g004

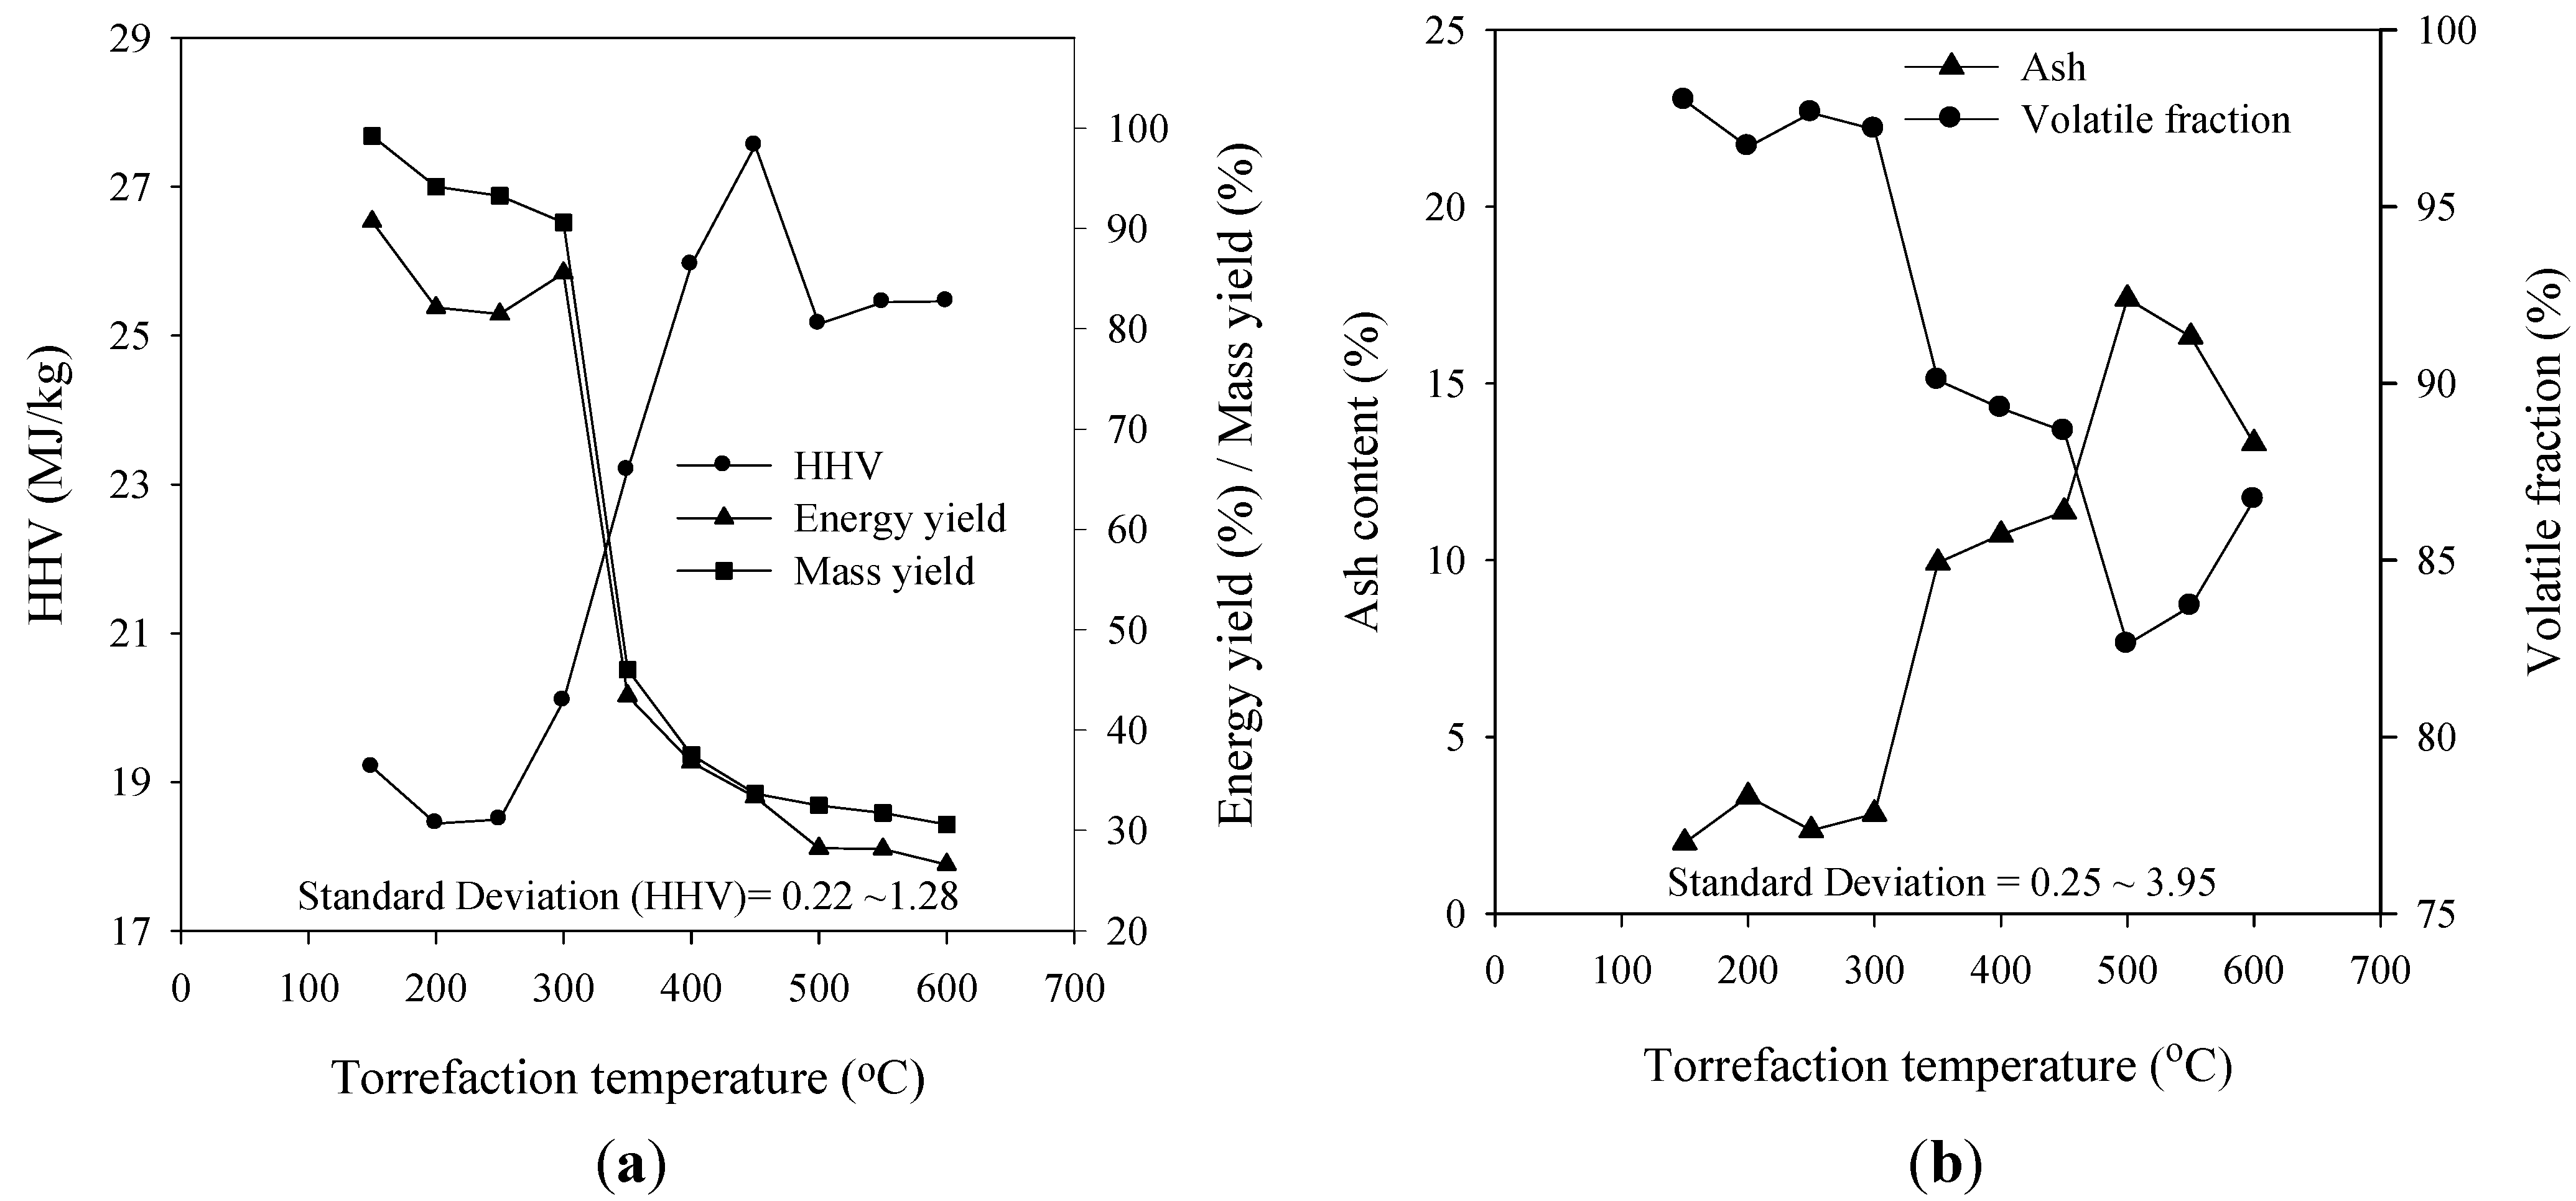
3.3. Energy Yield, Mass Yield, Higher Heating Value, Volatile Fraction, and Ash Content

The torrefaction of biomass is usually performed at temperature of around 300 °C, and the thermal treatment at higher temperature is referred to as pyrolysis. In this work, we want to find the optimum torrefaction temperature for corn stalk wastes, and tried to find a temperature range which changes from torrefaction to pyrolysis. Therefore, the experiments with respect to torrefaction temperature were performed at temperature of 150–600 °C. The relationship between the HHV, the energy yield and the mass yield with respect to the torrefaction temperature is shown in Figure 5a. The HHV of all samples increased with the torrefaction temperature. This tendency is consistent with those shown in previous works [2]. The increase in the HHV up to 450 °C is due to the removal of oxygen and hydrogen. A further increase in the temperature resulted in a decrease of the HHV. This is actually due to the pyrolysis reaction that occurred at a higher temperature.
The energy yield is a useful measure during this process. It can be calculated from the mass yield, as described by Bridgeman et al. [11]. Here, the energy yield decreased steadily from 90% to 25% with an increase in the temperature. The energy yield in the torrefaction range corresponds to the mass yield. The energy yield calculated in this study is based on the HHV. The mass yield of the torrefied products at temperatures up to 300 °C showed a decrease in mass nearly identical to that of the raw material. This indicated that the extent of torrefaction for the corn stalk up to 300 °C was negligible compared to these values at higher temperatures. There were two main causes of the decrease in mass of the dried or torrefied products. One is moisture loss, with the other being thermal decomposition to form volatile gaseous products such as H2O, CO, CO2, acetic acid and other organics [16]. The reduction in the mass yield is attributed to the thermal effects which resulted in the loss of moisture, followed by the depolymerization of the secondary cell-wall constituents, i.e., hemicellulose, cellulose and lignin [18]. The decrease in mass during torrefaction at a lower temperature is thought to be mainly caused by the loss of moisture. In other words, substantial torrefaction did not occur in the corn stalk sample at a temperature below 300 °C. For torrefaction at higher temperatures, the decrease is attributed to the thermal decomposition of the biomass [14,15]. The variations of the volatile fractions and ash contents are shown in Figure 5b. The volatile fraction content gradually decreased while the ash content increased with the torrefaction temperature up to 500 °C. However, the volatile fraction content increased while the ash content decreased with the temperature after 500 °C. The heating value is usually increased with the increase of volatile fraction and the decrease of ash content. From this figure, it can be seen that HHV slightly increased with temperature after 500 °C. This tendency of HHV with temperature was consistent with the result by Uemura et al. [19]. However, further investigation will be required to clarify this matter.
Figure 5. (a) The HHV, energy yield, mass yield; and (b) ash and volatile fraction contents of torrefied corn stalk waste as a function of the torrefaction temperature.
Energies 07 05586 g005

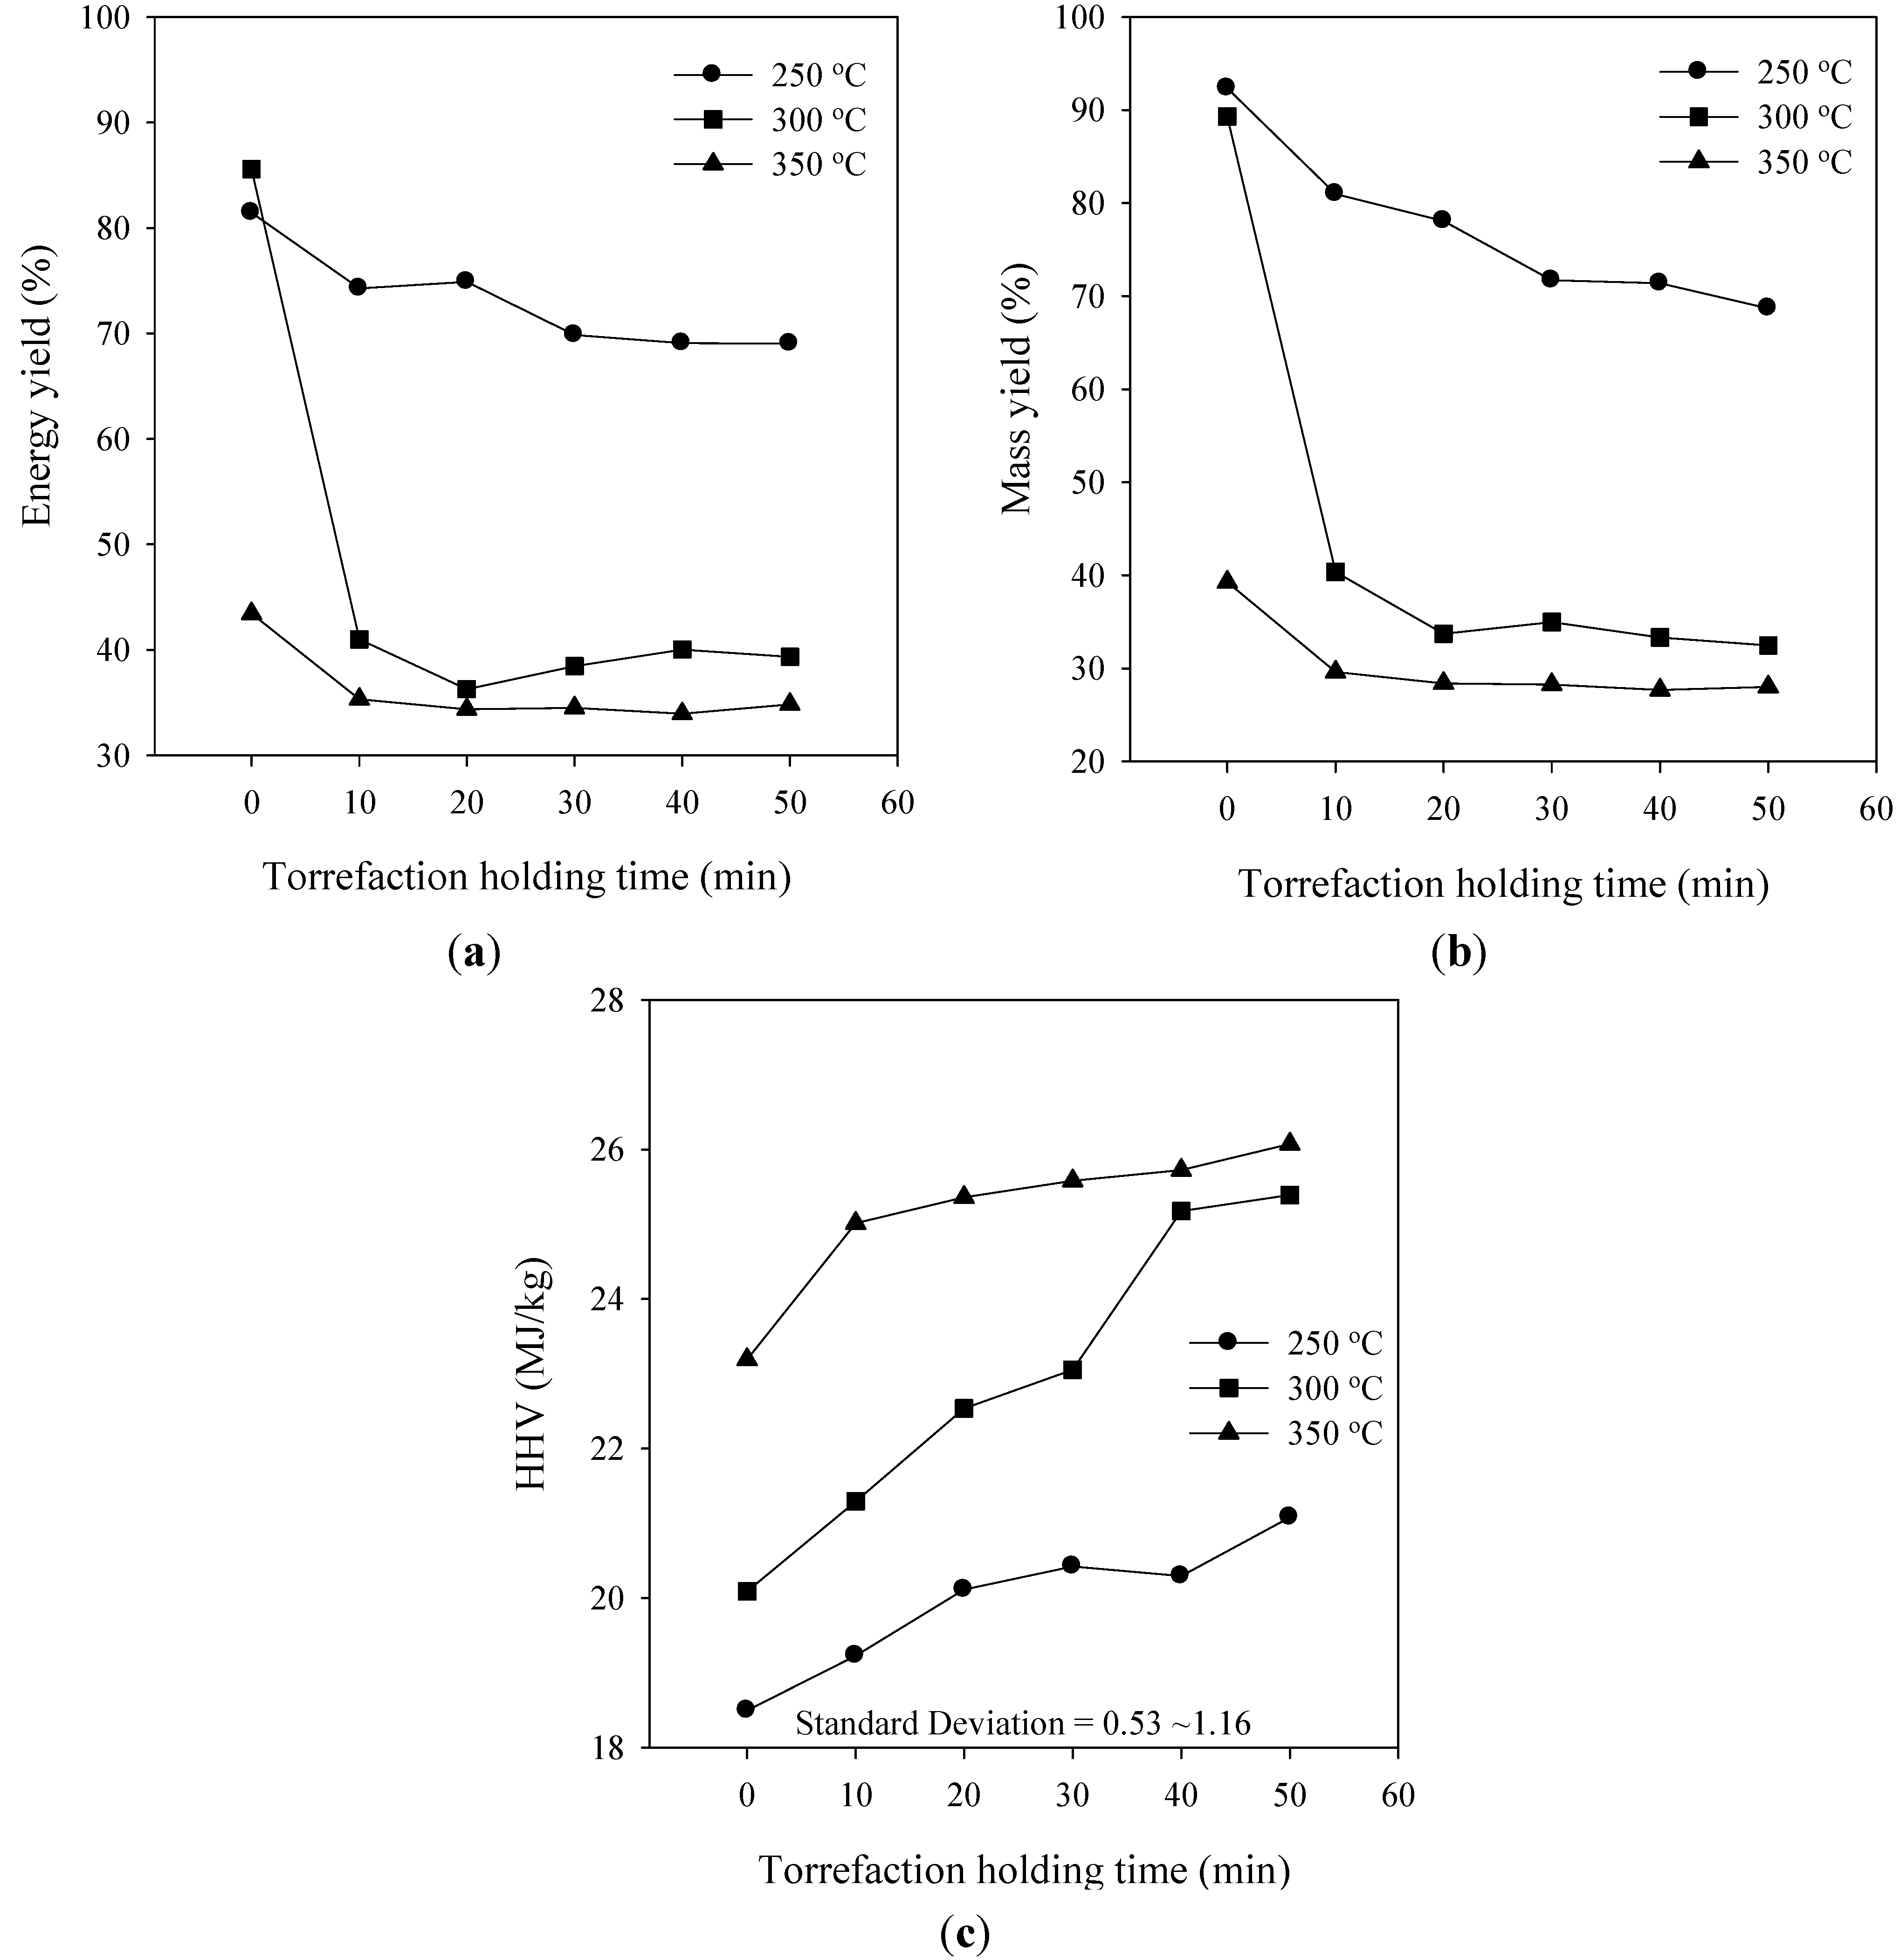
3.4. Effect of the Torrefaction Holding Time

From Figure 5a, it can be seen that torrefaction temperatures above 400 °C resulted in low energy and mass yields. Thus, the effect of the torrefaction time was studied for temperatures below 400 °C. Figure 6 shows the influence of the torrefaction holding time on the characteristics of corn stalk torrefaction. From this figures, it can be seen that the changes of the volatile fraction and the ash content with the torrefaction holding time were low in both cases although some of the experimental results showed a deviation. Therefore, it was found that the effect of torrefaction holding time on volatile fraction and ash content was less than torrefaction temperature.
Figure 6. Influence of the torrefaction holding time on the: (a) volatile fraction; and (b) ash content.
Energies 07 05586 g006
In Figure 7a,b, the energy and mass yield decreased with an increase in the torrefaction holding time. This could be explained by the decrease in the moisture content and volatile matter content of the biomass. However, there was a significant mass loss at the beginning of the torrefaction process while the change of mass yield was not significant with a longer torrefaction holding time. This is due to the decomposition of more reactive components at the beginning of the torrefaction, while with a longer torrefaction time, the mass loss can be attributed to the decomposition of the less reactive component [20]. It was also found that the mass yield decreased with torrefaction holding time. It can be inferred from Figure 7c that the HHV increased with an increase in the torrefaction time.
Several studies have investigated the influence of the torrefaction holding time on the torrefaction of biomass. Nevertheless, the torrefaction holding time has been shown to be less significant than the temperature in all experiments conducted thus far [20]. The minimum torrefaction holding time can vary depending on the torrefaction temperature, biomass type, the physical and chemical properties of the biomass, and its intended end use. However, there is a maximum torrefaction holding time after which any further increase does not affect the biomass properties significantly. Arias et al. [7] concluded that there was little improvement in biomass grindability at 240 °C if the torrefaction holding time was longer than 30 min. In a different study, Bergman et al. [21] concluded that torrefaction should be conducted for 17 min at 280 °C for co-firing applications.
Figure 7. Influence of the torrefaction holding time on the: (a) energy yield; (b) mass yield; and (c) HHV.
Energies 07 05586 g007

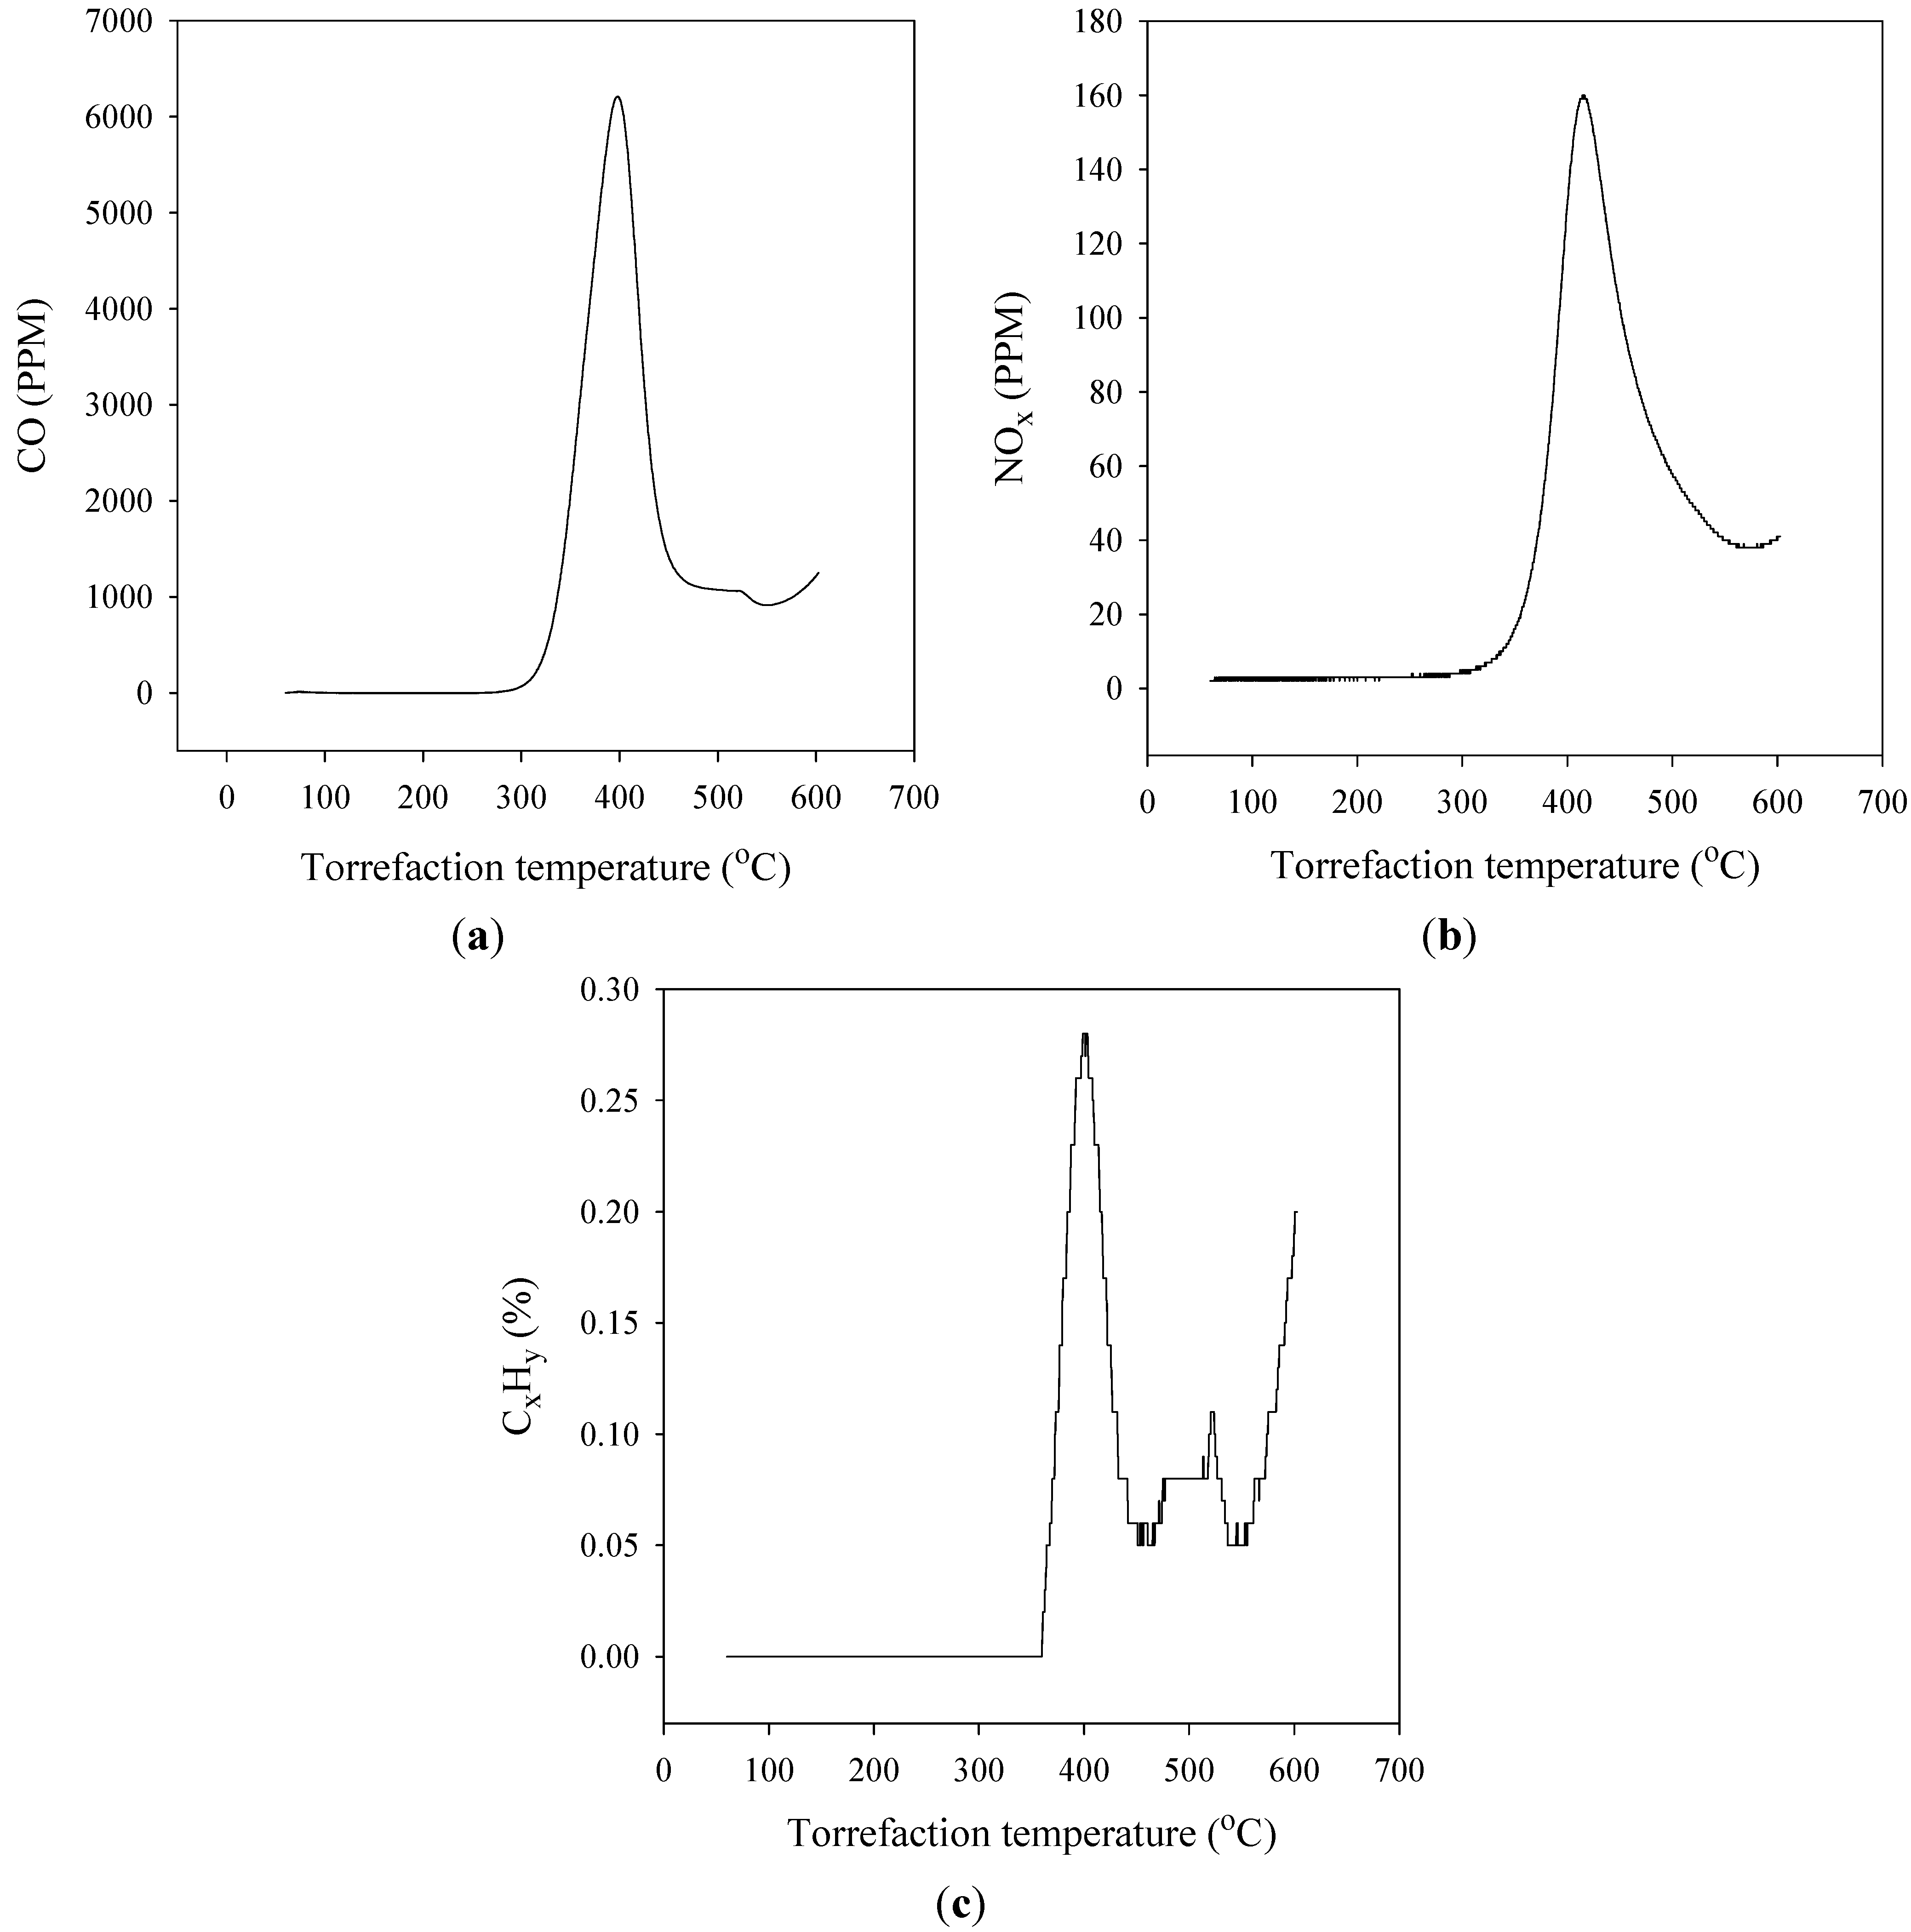
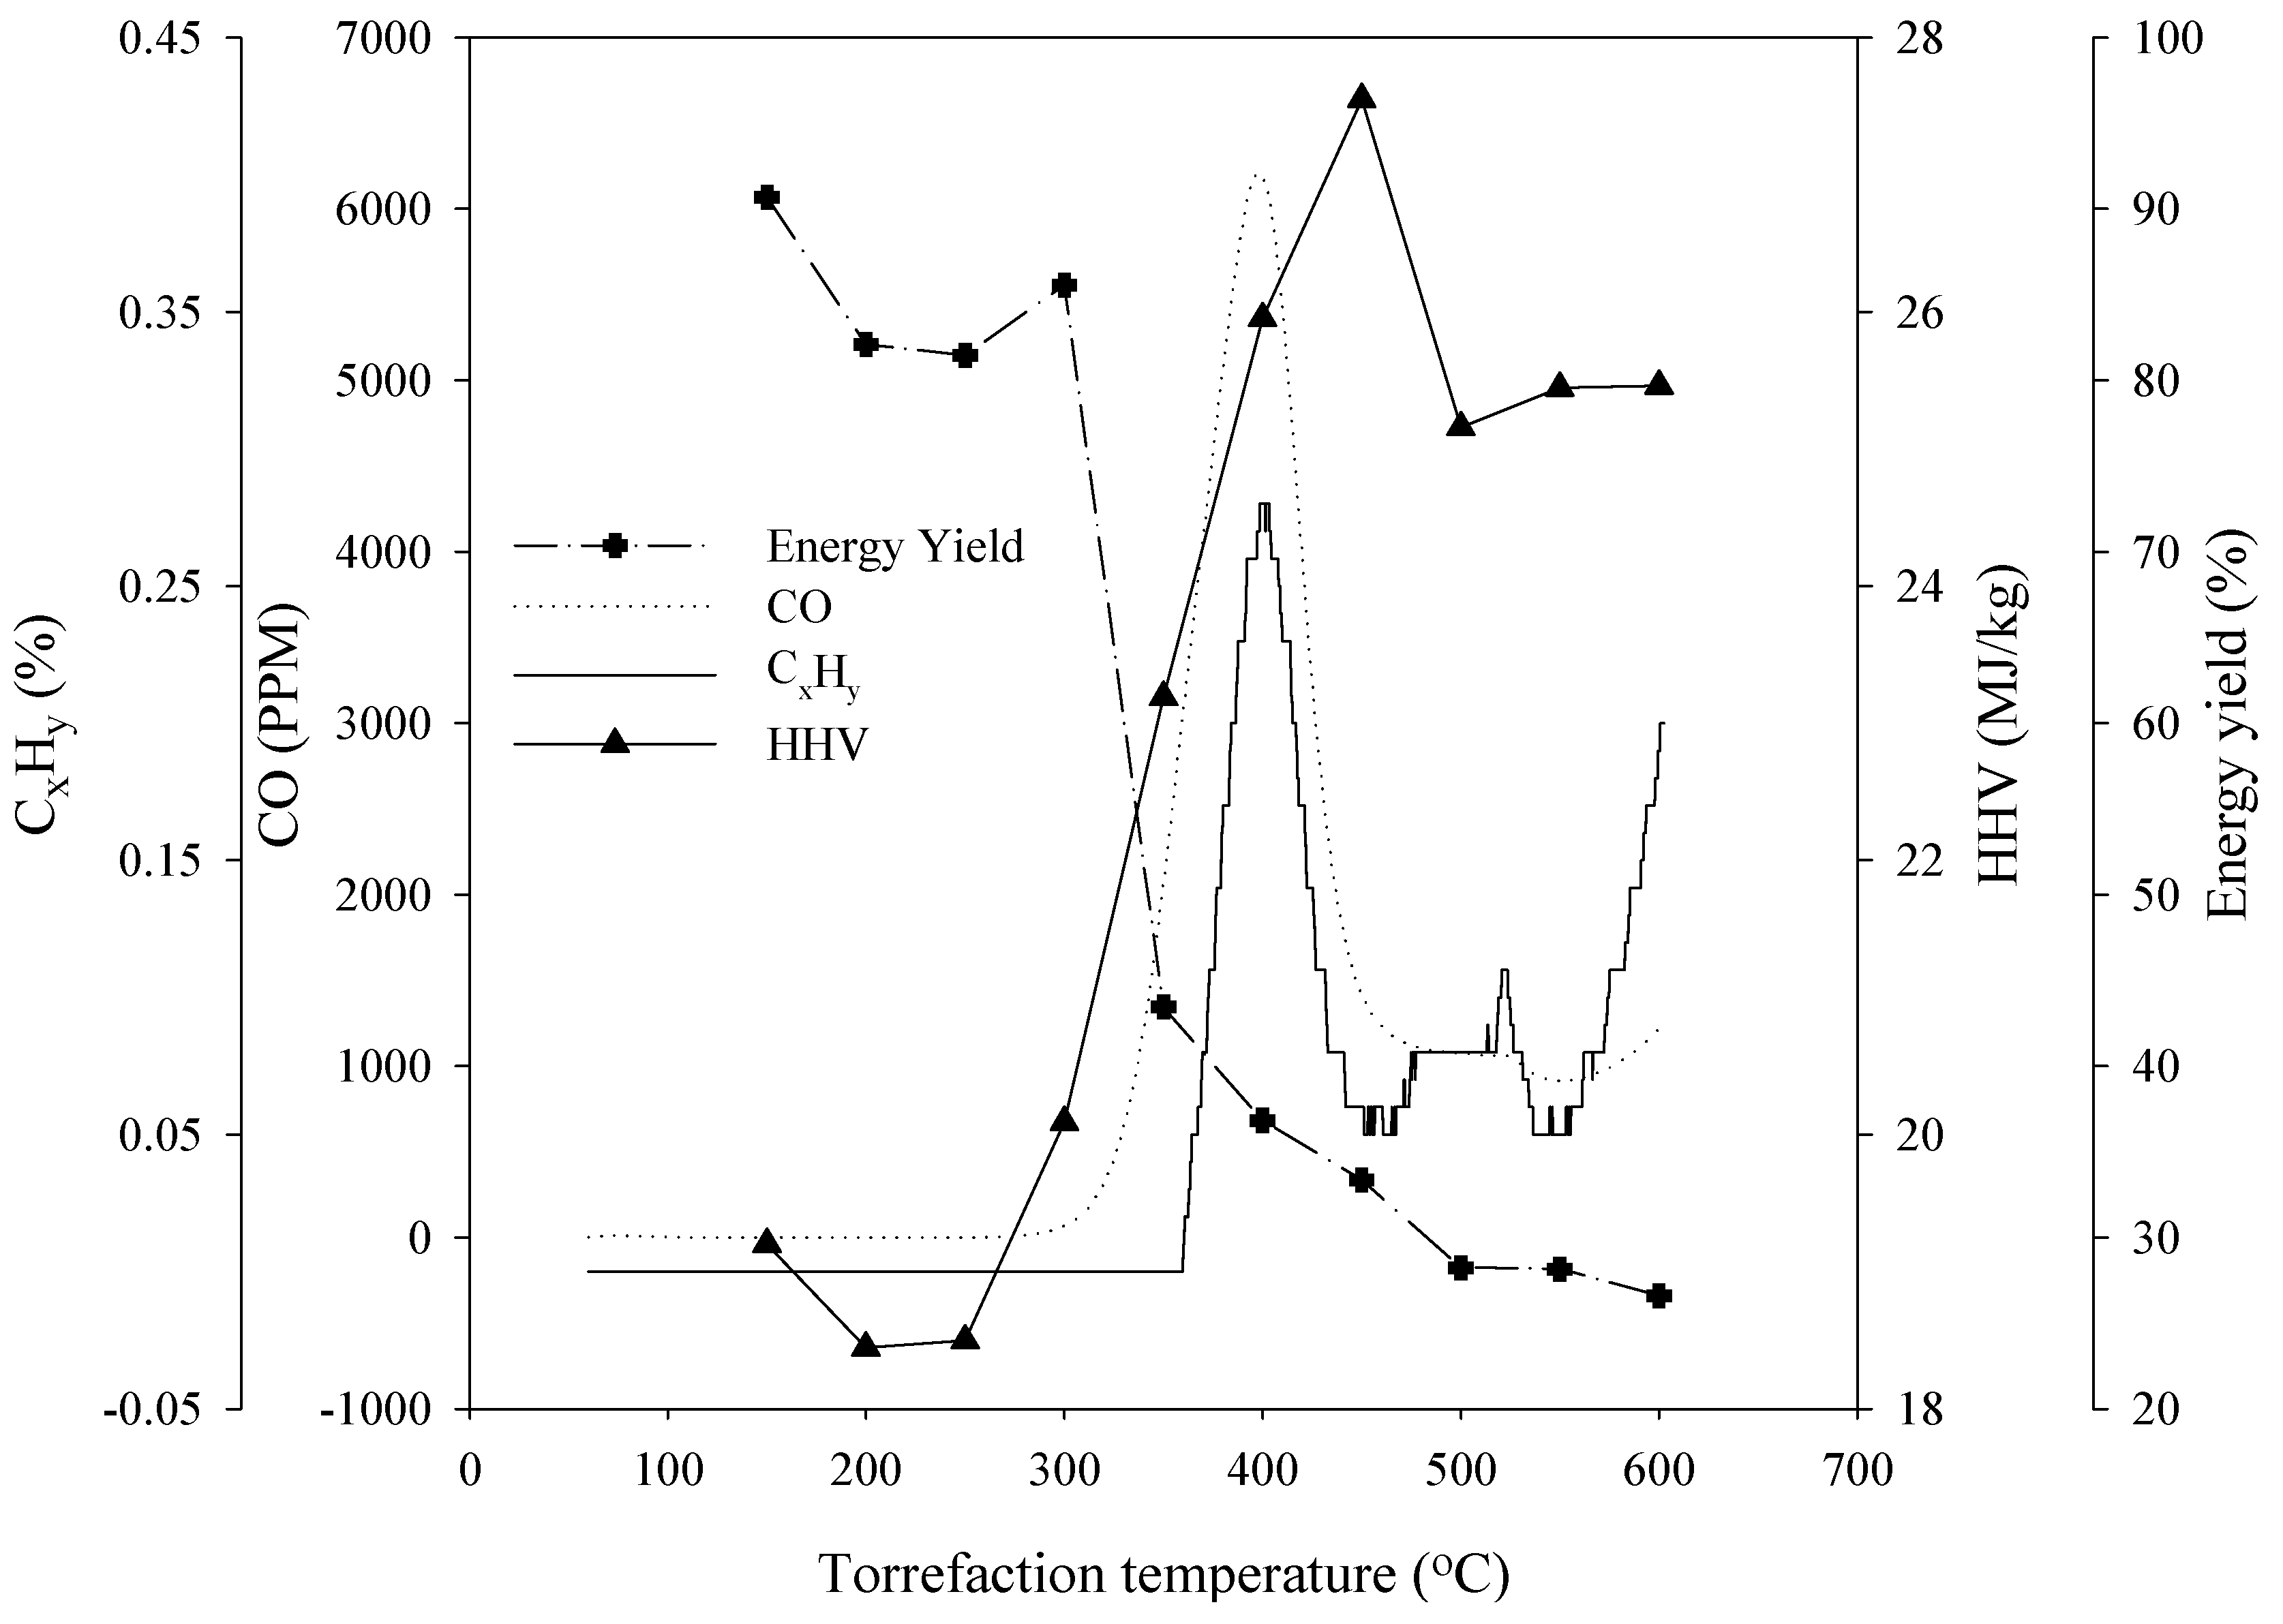
3.5. Composition of the Gaseous Products

Figure 8 shows the composition of the gaseous products obtained from the torrefaction of the corn stalks. The figures show that a higher torrefaction temperature favors the production of CO and NOx, which is first detected at a temperature of approximately 290 °C. The detection of hydrocarbon gases started at temperatures around 370 °C. This finding was attributed to the fact that compounds with oxygen are emitted at temperatures lower than those for hydrocarbon gases. These results show that the torrefaction of corn stalk waste at a temperature lower than 370 °C is preferred; above 370 °C, the emission of hydrocarbon gases begins, which has a negative impact on the energy yield.
Figure 8. Gas analysis for a torrefied corn stalk as a function of the temperature: (a) CO; (b) NOx; and (c) CxHy.
Energies 07 05586 g008
From Figure 9, temperatures between 290 °C and 330 °C were considered as the optimum torrefaction temperature for corn stalks. The HHV remained at 21 MJ/kg in this region and the energy yield remained above 70%. The tradeoff of the energy yield against the HHV limits the torrefaction region. However, the torrefaction region varies with the initial condition of the raw material, the heating rate, and the chemical composition.
Figure 9. Torrefaction region of corn stalks as obtained from the experiment.
Energies 07 05586 g009

4. Conclusions

The torrefaction of corn stalks was studied here in an effort to investigate the effects of the torrefaction temperature and time on the thermal and physical properties of the torrefied products. The kinetic analysis methods used in this study yielded apparent activation energies of 184.1 kJ/mol and 193.0 kJ/mol for the torrefaction of corn stalks. It was also concluded that the kinetic analysis methods using various heating rate results were more efficient than the method involving a single heating rate. The HHV increased with the torrefaction temperature, while the energy and mass yields decreased with an increase in the temperature. It was also found that the torrefaction temperature had more of an effect on the torrefaction of corn stalks compared to the torrefaction holding time. From an elemental analysis, the weight percentage of C in the corn stalks increased with an increase in the torrefaction temperature. On the other hand, the weight percentages of H and O tended to decrease. Therefore, the O/C and H/C ratios decreased with an increase in the torrefaction temperature. From an analysis of the gaseous products resulting from torrefaction, it was found that the compounds with oxygen were emitted at a temperature lower than that for hydrocarbon gases. From this study, temperatures between 290 °C and 330 °C are the optimum torrefaction temperatures for corn stalk, although the actual temperature can vary depending on the initial condition of the raw material, the heating rate, and the chemical composition of the raw material. Also it can be seen that the torrefaction at this temperature range has enhanced the solid fuel qualities of corn stalk by the decrease of O/C ratio and the increase of HHV.

Acknowledgments

This work was supported by a grant from the Human Resources Development Program (No. 20134030200230) and the New & Renewable Energy Technology Development Program (No. 20113010100010) of the Korea Institute of Energy Technology Evaluation and Planning (KETEP) funded by the Ministry of Trade, Industry and Energy of the Korean government.

Author Contributions

Sea Cheon Oh had the key role behind the research. Jeeban Poudel was responsible for the overall experiment. Both the authors were equally responsible for the analysis and documentation for finalizing the manuscript.

Conflicts of Interest

The authors declare no conflicts of interest.

References

  1. Werther, J.; Saenger, M.; Hartge, E.; Ogada, T.; Siagi, Z. Combustion of agricultural residues. Prog. Energy Combust. Sci. 2000, 26, 1–27. [Google Scholar]
  2. Uemura, Y.; Omar, W.N.; Tsutsui, T.; Yusup, S.B. Torrefaction of oil palm wastes. Fuel 2011, 90, 2585–2591. [Google Scholar] [CrossRef]
  3. Lu, J.J.; Chen, W.H. Product yields and characteristics of corncob waste under various torrefaction atmospheres. Energies 2014, 7, 13–27. [Google Scholar]
  4. Goyal, H.; Seal, D.; Saxena, R. Bio-fuels from thermochemical conversion of renewable resources: A review. Renew. Sustain. Energy Rev. 2008, 12, 504–517. [Google Scholar] [CrossRef]
  5. Zhang, L.; Xu, C.C.; Champagne, P. Overview of recent advances in thermo-chemical conversion of biomass. Energy Convers. Manag. 2010, 51, 969–982. [Google Scholar] [CrossRef]
  6. Couhert, C.; Salvador, S.; Commandre, J. Impact of torrefaction on syngas production from wood. Fuel 2009, 88, 2286–2290. [Google Scholar] [CrossRef]
  7. Arias, B.; Pevida, C.; Fermoso, J.; Plaza, M.; Rubiera, F.; Pis, J. Influence of torrefaction on the grindability and reactivity of woody biomass. Fuel Process. Technol. 2008, 89, 169–175. [Google Scholar] [CrossRef]
  8. Deng, J.; Wang, G.; Kuang, J.; Zhang, Y.; Luo, Y. Pretreatment of agricultural residues for co-gasification via torrefaction. J. Anal. Appl. Pyrolysis. 2009, 86, 331–337. [Google Scholar] [CrossRef]
  9. Li, H.; Liu, X.; Legros, R.; Bi, X.T.; Lim, C.; Sokhansanj, S. Torrefaction of sawdust in a fluidized bed reactor. Bioresour. Technol. 2012, 103, 453–458. [Google Scholar] [CrossRef]
  10. Chen, W.; Kuo, P. A study on torrefaction of various biomass materials and its impact on lignocellulosic structure simulated by a thermogravimetry. Energy 2010, 35, 2580–2586. [Google Scholar] [CrossRef]
  11. Bridgeman, T.; Jones, J.; Shield, I.; Williams, P. Torrefaction of reed canary grass, wheat straw and willow to enhance solid fuel qualities and combustion properties. Fuel 2008, 87, 844–856. [Google Scholar] [CrossRef]
  12. Sluiter, A.; Hames, B.; Ruiz, R.; Scarlata, C.; Sluiter, J.; Templeton, D. Determination of Ash inBiomass; Report No. TP-510-42622; National Renewable Energy Laboratory (NREL): Golden, CO, USA, 2008. [Google Scholar]
  13. Horowitz, H.H.; Metzger, G. A new analysis of thermogravimetric traces. Anal. Chem. 1963, 35, 1464–1468. [Google Scholar] [CrossRef]
  14. Ozawa, T. Kinetics of non-isothermal crystallization. Polymer 1971, 12, 150–158. [Google Scholar] [CrossRef]
  15. Prins, M.J.; Ptasinski, K.J.; Janssen, F.J. Torrefaction of wood: Part 2. Analysis of products. J. Anal. Appl. Pyrol. 2006, 77, 35–40. [Google Scholar] [CrossRef]
  16. Prins, M.J.; Ptasinski, K.J.; Janssen, F.J. More efficient biomass gasification via torrefaction. Energy 2006, 31, 3458–3470. [Google Scholar] [CrossRef]
  17. Medic, D.; Darr, M.; Shah, A.; Potter, B.; Zimmerman, J. Effects of torrefaction process parameters on biomass feedstock upgrading. Fuel 2011, 91, 147–154. [Google Scholar]
  18. Medic, D.; Darr, M.; Shah, A.; Rahn, S. The effects of particle size, different corn stover components, and gas torrefaction time on torrefaction of corn stover. Energies 2012, 5, 1199–1214. [Google Scholar] [CrossRef]
  19. Uemura, Y.; Omar, W.; Othman, N.A.; Yusup, S.; Tsutsui, T. Torrefaction of oil palm EFB in the presence of oxygen. Fuel 2013, 103, 156–160. [Google Scholar] [CrossRef]
  20. Sadaka, S.; Sharara, M.A.; Ashworth, A.; Keyser, P.; Allen, F.; Wright, A. Characterization of biochar from Switch grass carbonization. Energies 2014, 7, 548–567. [Google Scholar] [CrossRef]
  21. Bergman, P.; Boersma, A.; Zwart, R.; Kiel, J. Torrefaction for Biomass Co-Firing in Existing Coal-Fired Power Stations; Report No. ECN-C-05-013; Energy Research Centre of the Netherlands (ECN): Petten, The Netherlands, 2005. [Google Scholar]

