The Global Surge in Energy Innovation

Centre for Environmental Policy, Imperial College London, 13 Princes Gardens, London SW7 1NA, UK
*
Author to whom correspondence should be addressed.
Energies 2014, 7(9), 5601-5623; https://doi.org/10.3390/en7095601
Submission received: 26 June 2014
/
Revised: 8 August 2014
/
Accepted: 20 August 2014
/
Published: 27 August 2014
(This article belongs to the Special Issue Sustainable Energy Innovation: Strategies to Accelerate Progress)
Abstract
:Policymakers are seeking a transformation of the energy system driven by concerns about climate change, energy security and affordability. At the same time, emerging developments in underpinning science and engineering are opening up new possibilities across the whole technology spectrum covering renewables and other supply side technologies, energy demand and energy infrastructure. This paper reviews both the “policy pull” for energy innovation activities and the “science and technology push”. It explores the expectations of a variety of organisations in both the public and private sector regarding these pressures and possibilities by assessing various scenarios and outlook exercises that have been published since 2013. It reveals a wide range of beliefs about the future development of the energy system. The paper then moves on to analyse private sector expenditure on energy research and development (R&D) and public sector budgets for energy R&D and demonstration (RD&D). This analysis demonstrates significant divergences in patterns of innovation between the private and public sectors and leads to the hypothesis that the private sector is, broadly, taking measures to reinforce the existing energy paradigm while the public sector is focusing on new energy technologies that support wider policy objectives. This pattern is consistent with past technological transitions, with innovation efforts that would transform the energy system being counteracted by countervailing efforts that reinforce the existing fossil fuel-based paradigm.
1. Introduction
The global energy system provides, through a complex web of processes and interactions, the foundation for almost all modern human activities. Transportation, heating, light and the electronic systems which drive modern economies all depend on global energy supplies. These supplies are largely fossil-fuel based, with natural gas, liquid fuels and coal providing the input fuels for the vast majority of the world’s energy demands.
The energy sector is substantial, having made up almost 4% of total economic activity for reporting OECD (Organisation for Economic Co-operation and Development) countries in 2009 [1]. The energy system has historically been characterised as “mature”, displaying small, incremental technological improvements and low levels of both public and private research intensity. Consumers have traditionally played a passive role in energy markets, which tend to be dominated by large vertically-integrated firms competing on cost to provide largely undifferentiated products. Firms operating in such markets tend not to be research and development (R&D) intensive. The European Union (EU) Industrial R&D scoreboard [2] shows the average research intensity (R&D expenditure divided by total sales) of oil and gas producers and electricity producers to be 0.3% and 0.5% respectively. This compares with an industrial average of 3.2% and R&D intensities as high as 14% in sectors such as pharmaceuticals and biotechnology and 10% in software and computer services.
Over the past decade, the situation has been changing. Innovative activity in the energy sector has expanded in many countries as indicated both by new energy technologies coming to market and by increases in public R&D expenditure [3]. Public R&D has focused largely on renewable technologies, infrastructure and energy efficiency. As support grows for energy innovation so too does the need to understand the interactions between the commercial forces and public policy interventions currently driving energy innovation. This will help to manage efficiently and deploy the vast public and private expenditure currently occurring in this sector.
This paper examines the major factors associated with the revitalization of energy innovation, the changing distribution of energy R&D resources and the underlying scientific developments which are providing transformative energy opportunities. It analyses how different organisations in both the public and private sectors anticipate that these drivers will affect global energy markets in the coming decades. It then identifies trends in public and private sector research, development and demonstration (RD&D) based on data from the International Energy Agency (IEA) for the public sector and the European Union (EU) for the private sector. The different patterns of R&D effort suggest a tension between innovation aimed at transforming the energy system and innovations which could extend the resource base and improve the efficiency of the current fossil fuel-based paradigm.
Innovation systems theory provides the framework for the paper. Within this framework, innovation is seen as an evolutionary, non-linear process. Government policy can influence innovation through technology push and demand pull mechanisms [4]. In this paper, the notion of technology push is expanded to cover science and technology as we argue that fundamental scientific advances are opening up new opportunities in the energy sector. Science and technology push mechanisms affect the generation and development of new knowledge, whether this is scientific advancement or non-technical innovations such as new business models. These mechanisms include publicly-funded research, knowledge exchange programmes, education and training support and incentives for private sector organisations to invest in R&D. Demand pull can be influenced by policy mechanisms that shape the demand for new innovative products. These mechanisms are often divided into three categories: direct purchases, mainly government procurement schemes; regulatory and standardisation measures; and economic incentives, including tax breaks, subsidies and other measures.
To examine trends in both public and private expenditure on energy RD&D, we utilise datasets compiled by international organisations such as the OECD, IEA and World Bank. The limitations of these datasets should be kept in mind. They rely on the quality of submissions from member countries which, for example, may be missing for particular countries/years, and may not always use precisely the same definitions. However, these still represent the best data available and, if approached critically, can be used to identify major trends and formulate working hypotheses.
This paper is structured as follows. Section 2 provides an overview of policy developments currently influencing the energy sector, focusing mainly on climate change and energy security. Section 3 identifies several areas of basic science development which could provide transformative opportunities by enhancing or developing new technologies for use in the energy sector. Section 4 examines the way that different organisations anticipate that economic and social trends, policy-influenced demand pull and science and technology push could play out in the energy sector at the global level. This is done by analysing published scenarios and outlooks exploring the time horizon to 2040. Section 5 examines past and current trends in both public and private expenditure on energy RD&D. Section 6 assesses these patterns of expenditure within the frame of innovation theory. Section 7 provides some overall conclusions and points the way towards future research into energy innovation.
2. The Policy Pull
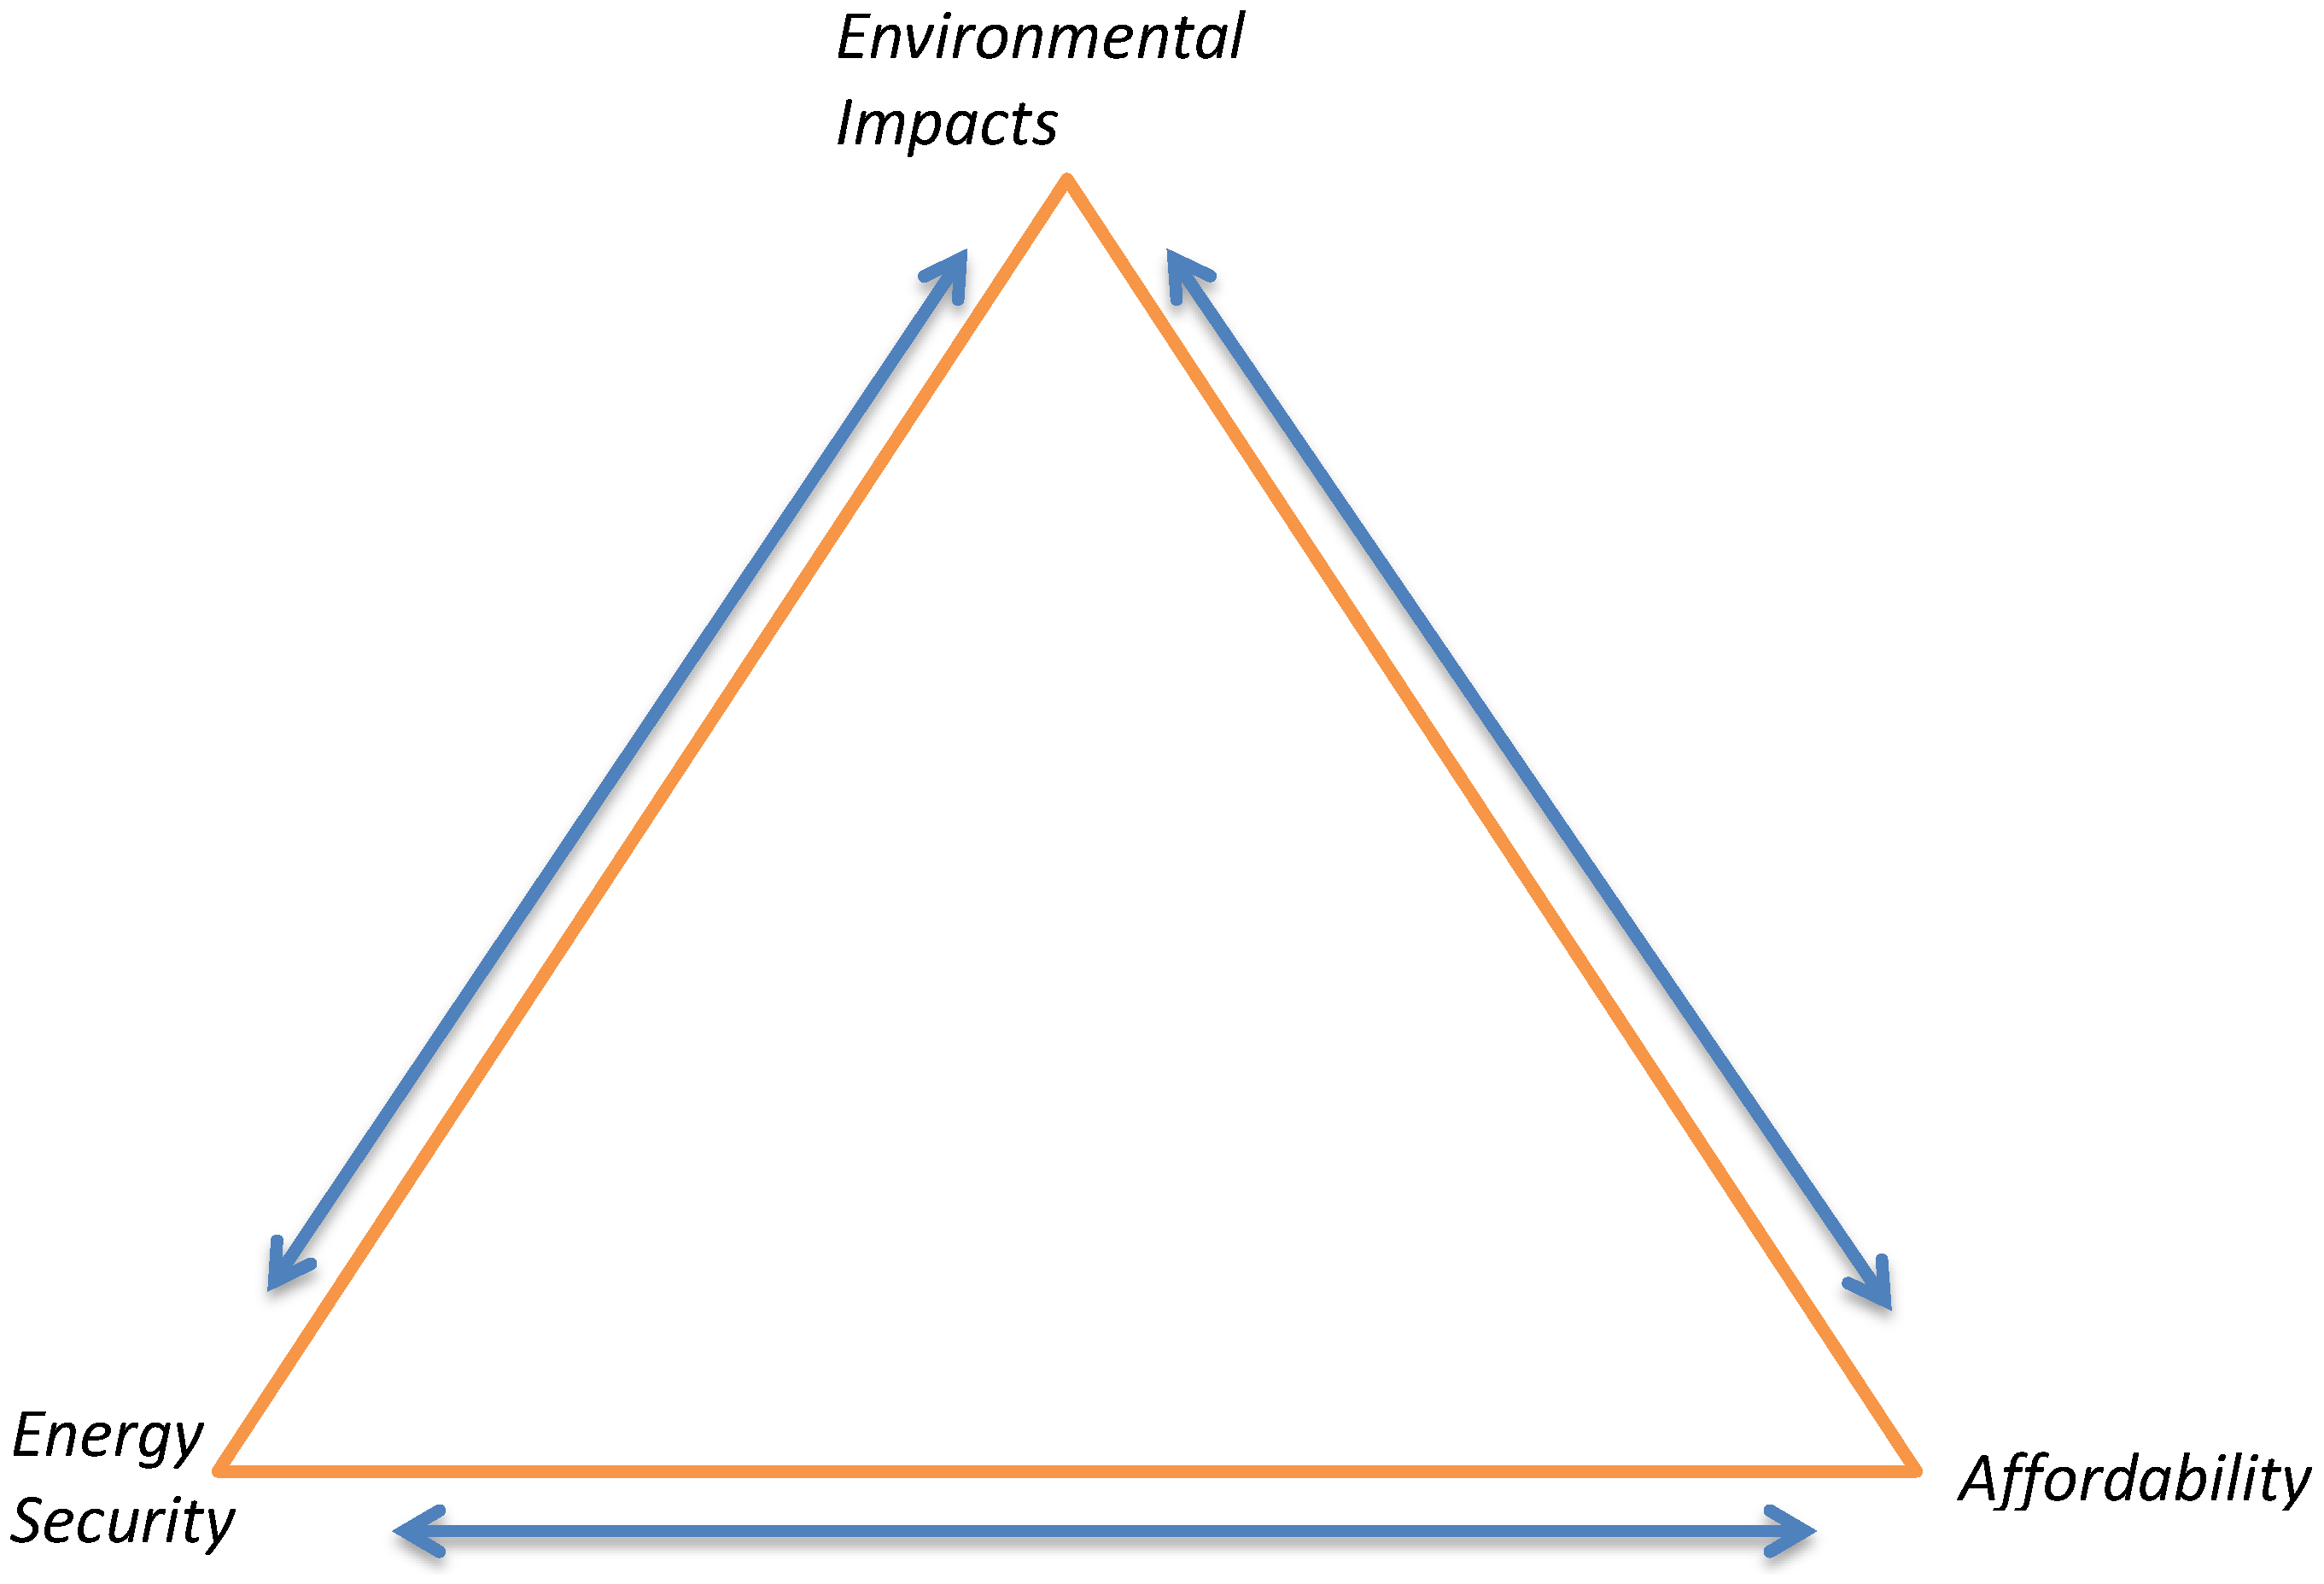
Ready access to cheap, abundant energy supplies is essential for the smooth operation and competitiveness of any modern economy. For this reason, and because strong elements of natural monopoly still exist, policymakers play a significant role in maintaining, altering and regulating energy markets. The energy policy challenge can be seen in terms of striking a balance between three broad objectives: energy security; affordability; and managing environmental impacts. These three policy drivers form what is commonly referred to as a “trilemma” (Figure 1), a triangle of forces both reinforcing and in tension with each other [5]. At times, the primary task of policymakers has been to balance the cost of energy to consumers with concerns regarding secure access to energy supplies. Currently, the significant contribution that conventional energy sources make to carbon dioxide (CO2) emissions and therefore climate change has become a major concern. In developing countries, there are also major concerns about air, water and land pollution. The trilemma is used as a means of both representing the direction of travel and relative weighting of each policy force at a given point in time [6].
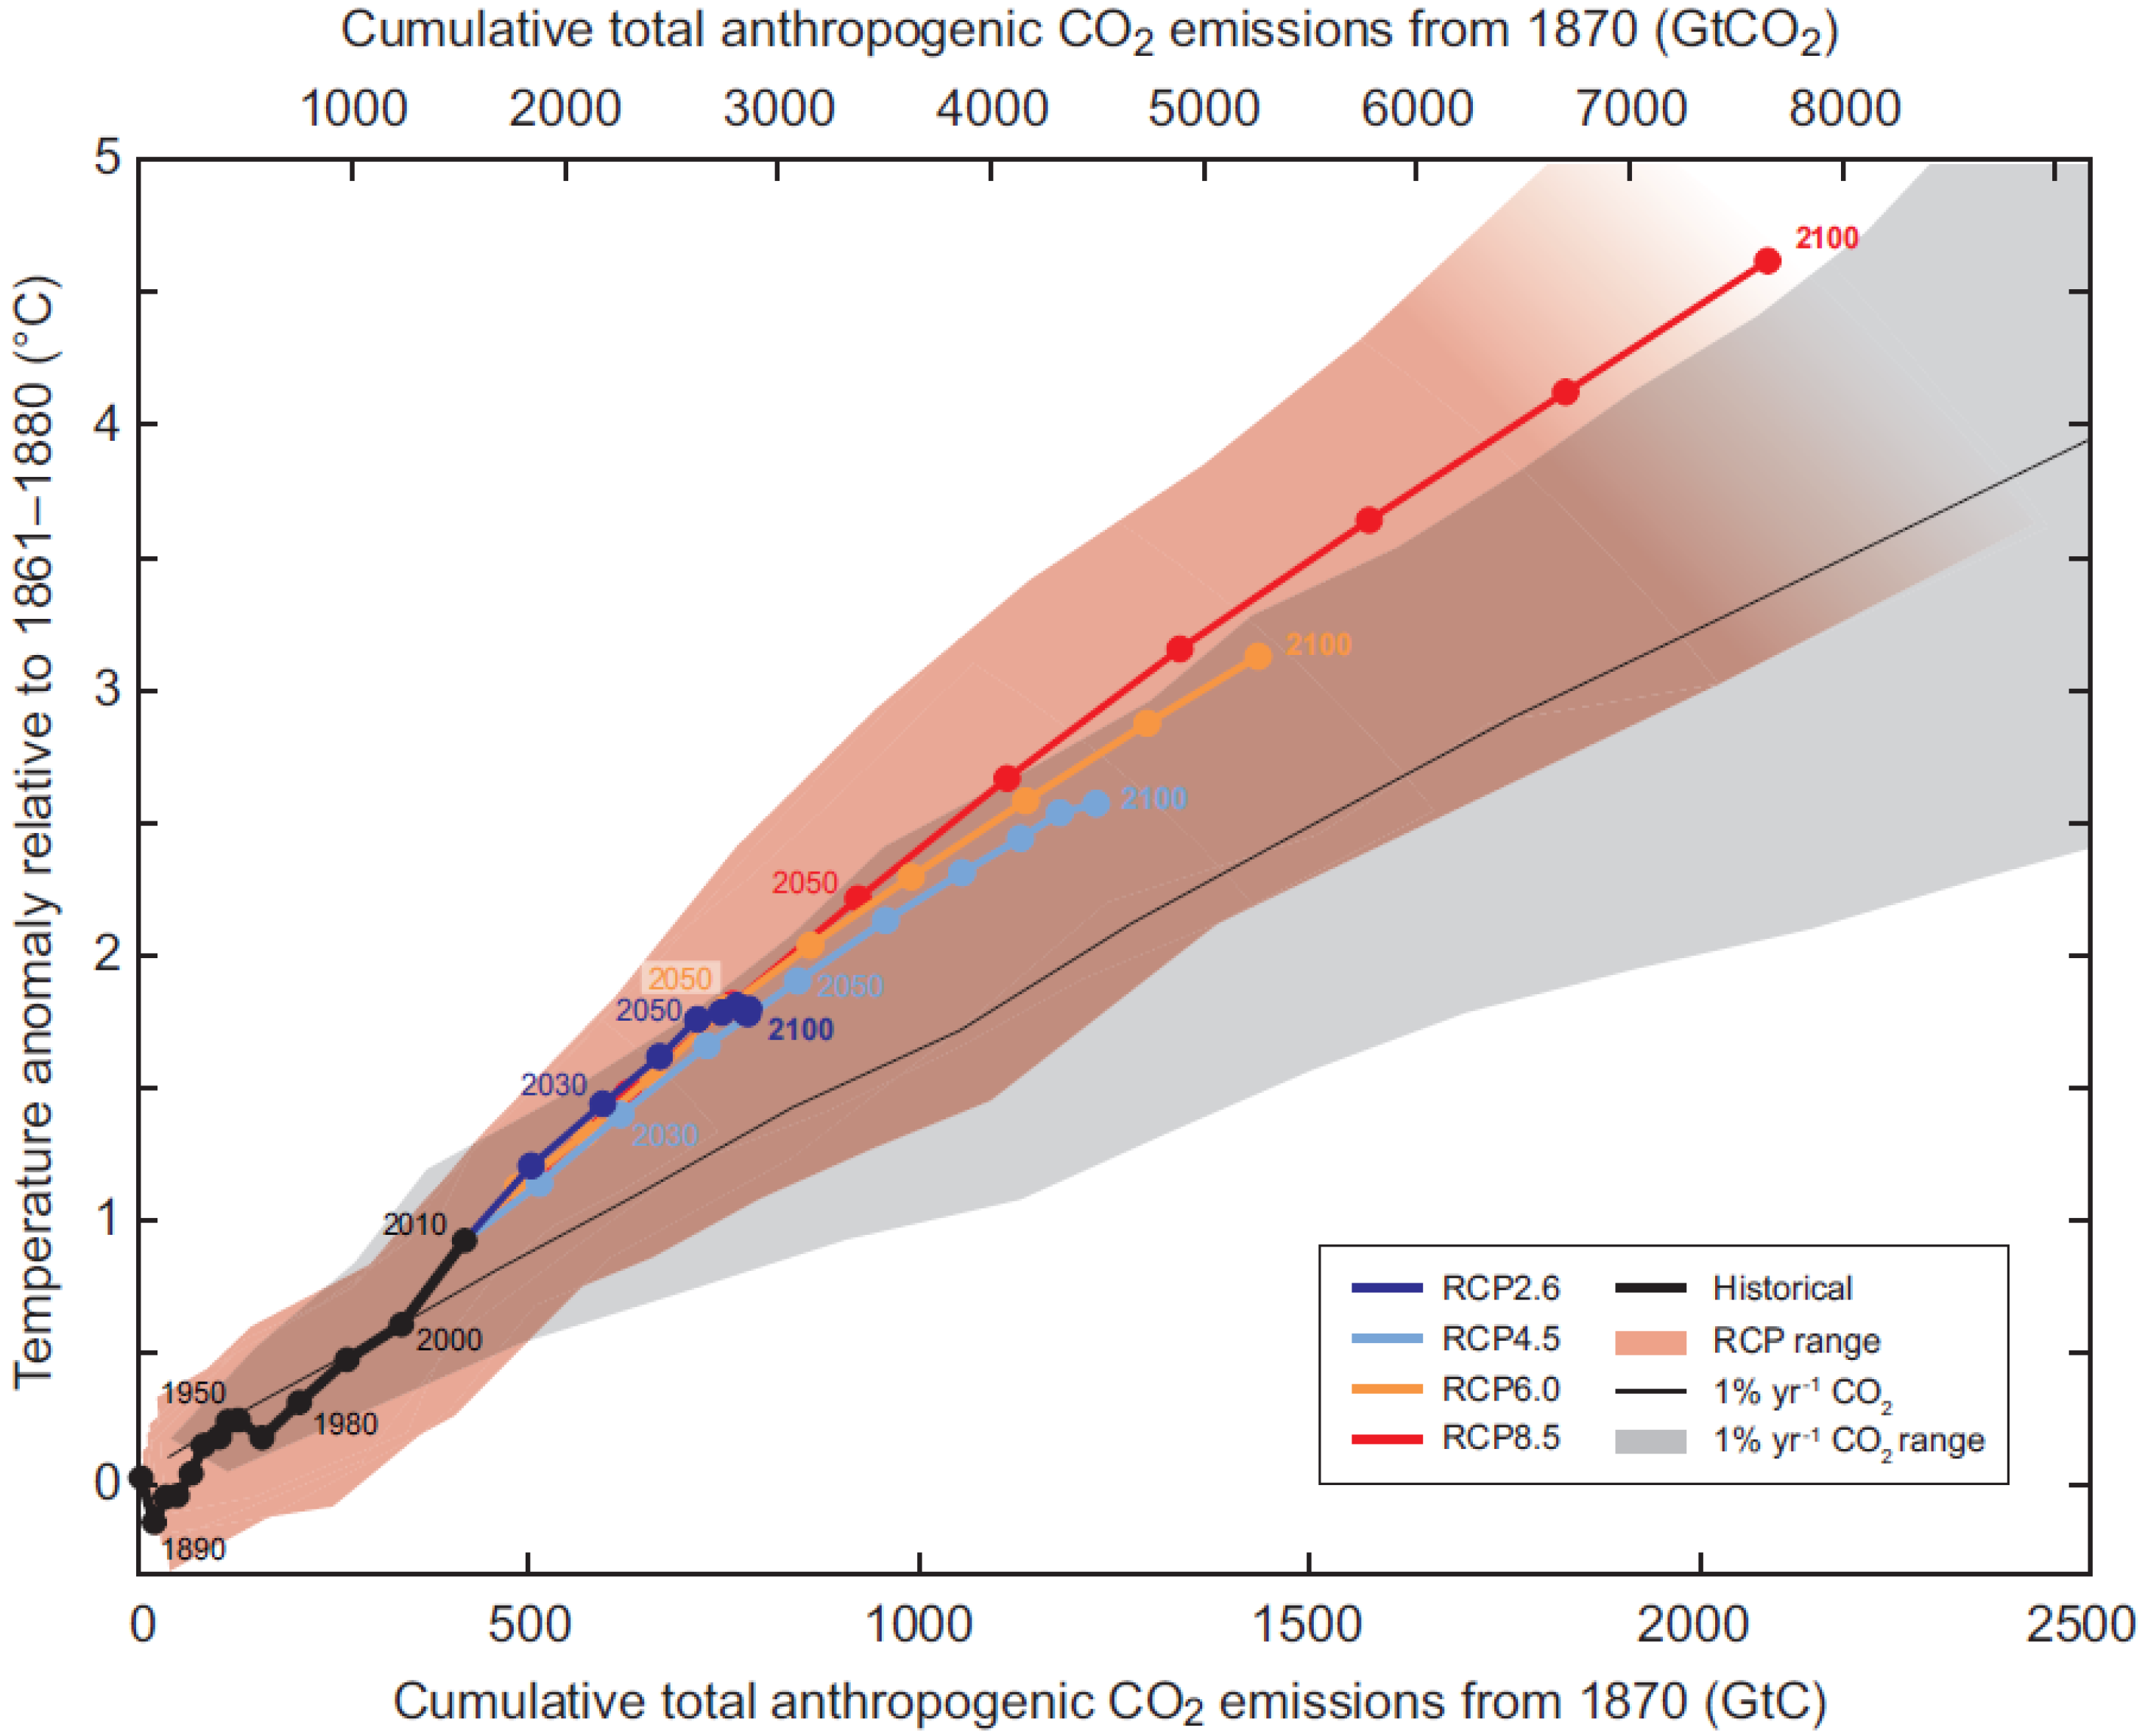
Members of the UN Framework Convention on Climate Change (UNFCCC) set the goal of holding global temperature increases to less than 2 °C above pre-industrial levels in Cancun in 2010 [7]. Figure 2 illustrates the relationship between cumulative carbon dioxide emissions and global temperature. The intention is to conclude a comprehensive global climate change agreement at the UNFCCC Conference of the Parties in Paris in 2015. The Intergovernmental Panel on Climate Change (IPCC) concluded in its Fifth Assessment Report that global emissions would need to be 40% to 70% lower in 2050 than in 2010 in order to make it likely that global temperature increases would remain lower than 2 °C above pre-industrial levels [8].
Figure 1.
The energy trilemma.

Figure 2.
Cumulative and projected CO2 emissions from 1870 to 2100 [8].
Figure 2.
Cumulative and projected CO2 emissions from 1870 to 2100 [8].

To hit this target will require a wholesale transformation of the global energy system and a radical change from current energy trends which, due to heavy usage of fossil fuels, are heavily linked to CO2 emissions. The IEA has concluded that the current energy technologies available to the market at scale are not capable of reducing CO2 levels to the level required to hit the 2 degree target [9]. It has argued for a “technological transformation” of the energy system, including significantly increased RD&D budgets over a sustained period of time, in order to support the technological advances needed to meet the 2 °C target. The IEA estimates the investment costs between now and 2050 of meeting the 2 °C target as being over $36 trillion more than would be the case in a scenario with no further carbon reduction policies. This would include a more than doubling of RD&D expenditure, [10] with the decarbonisation of the electricity sector absorbing a great deal of this resource.
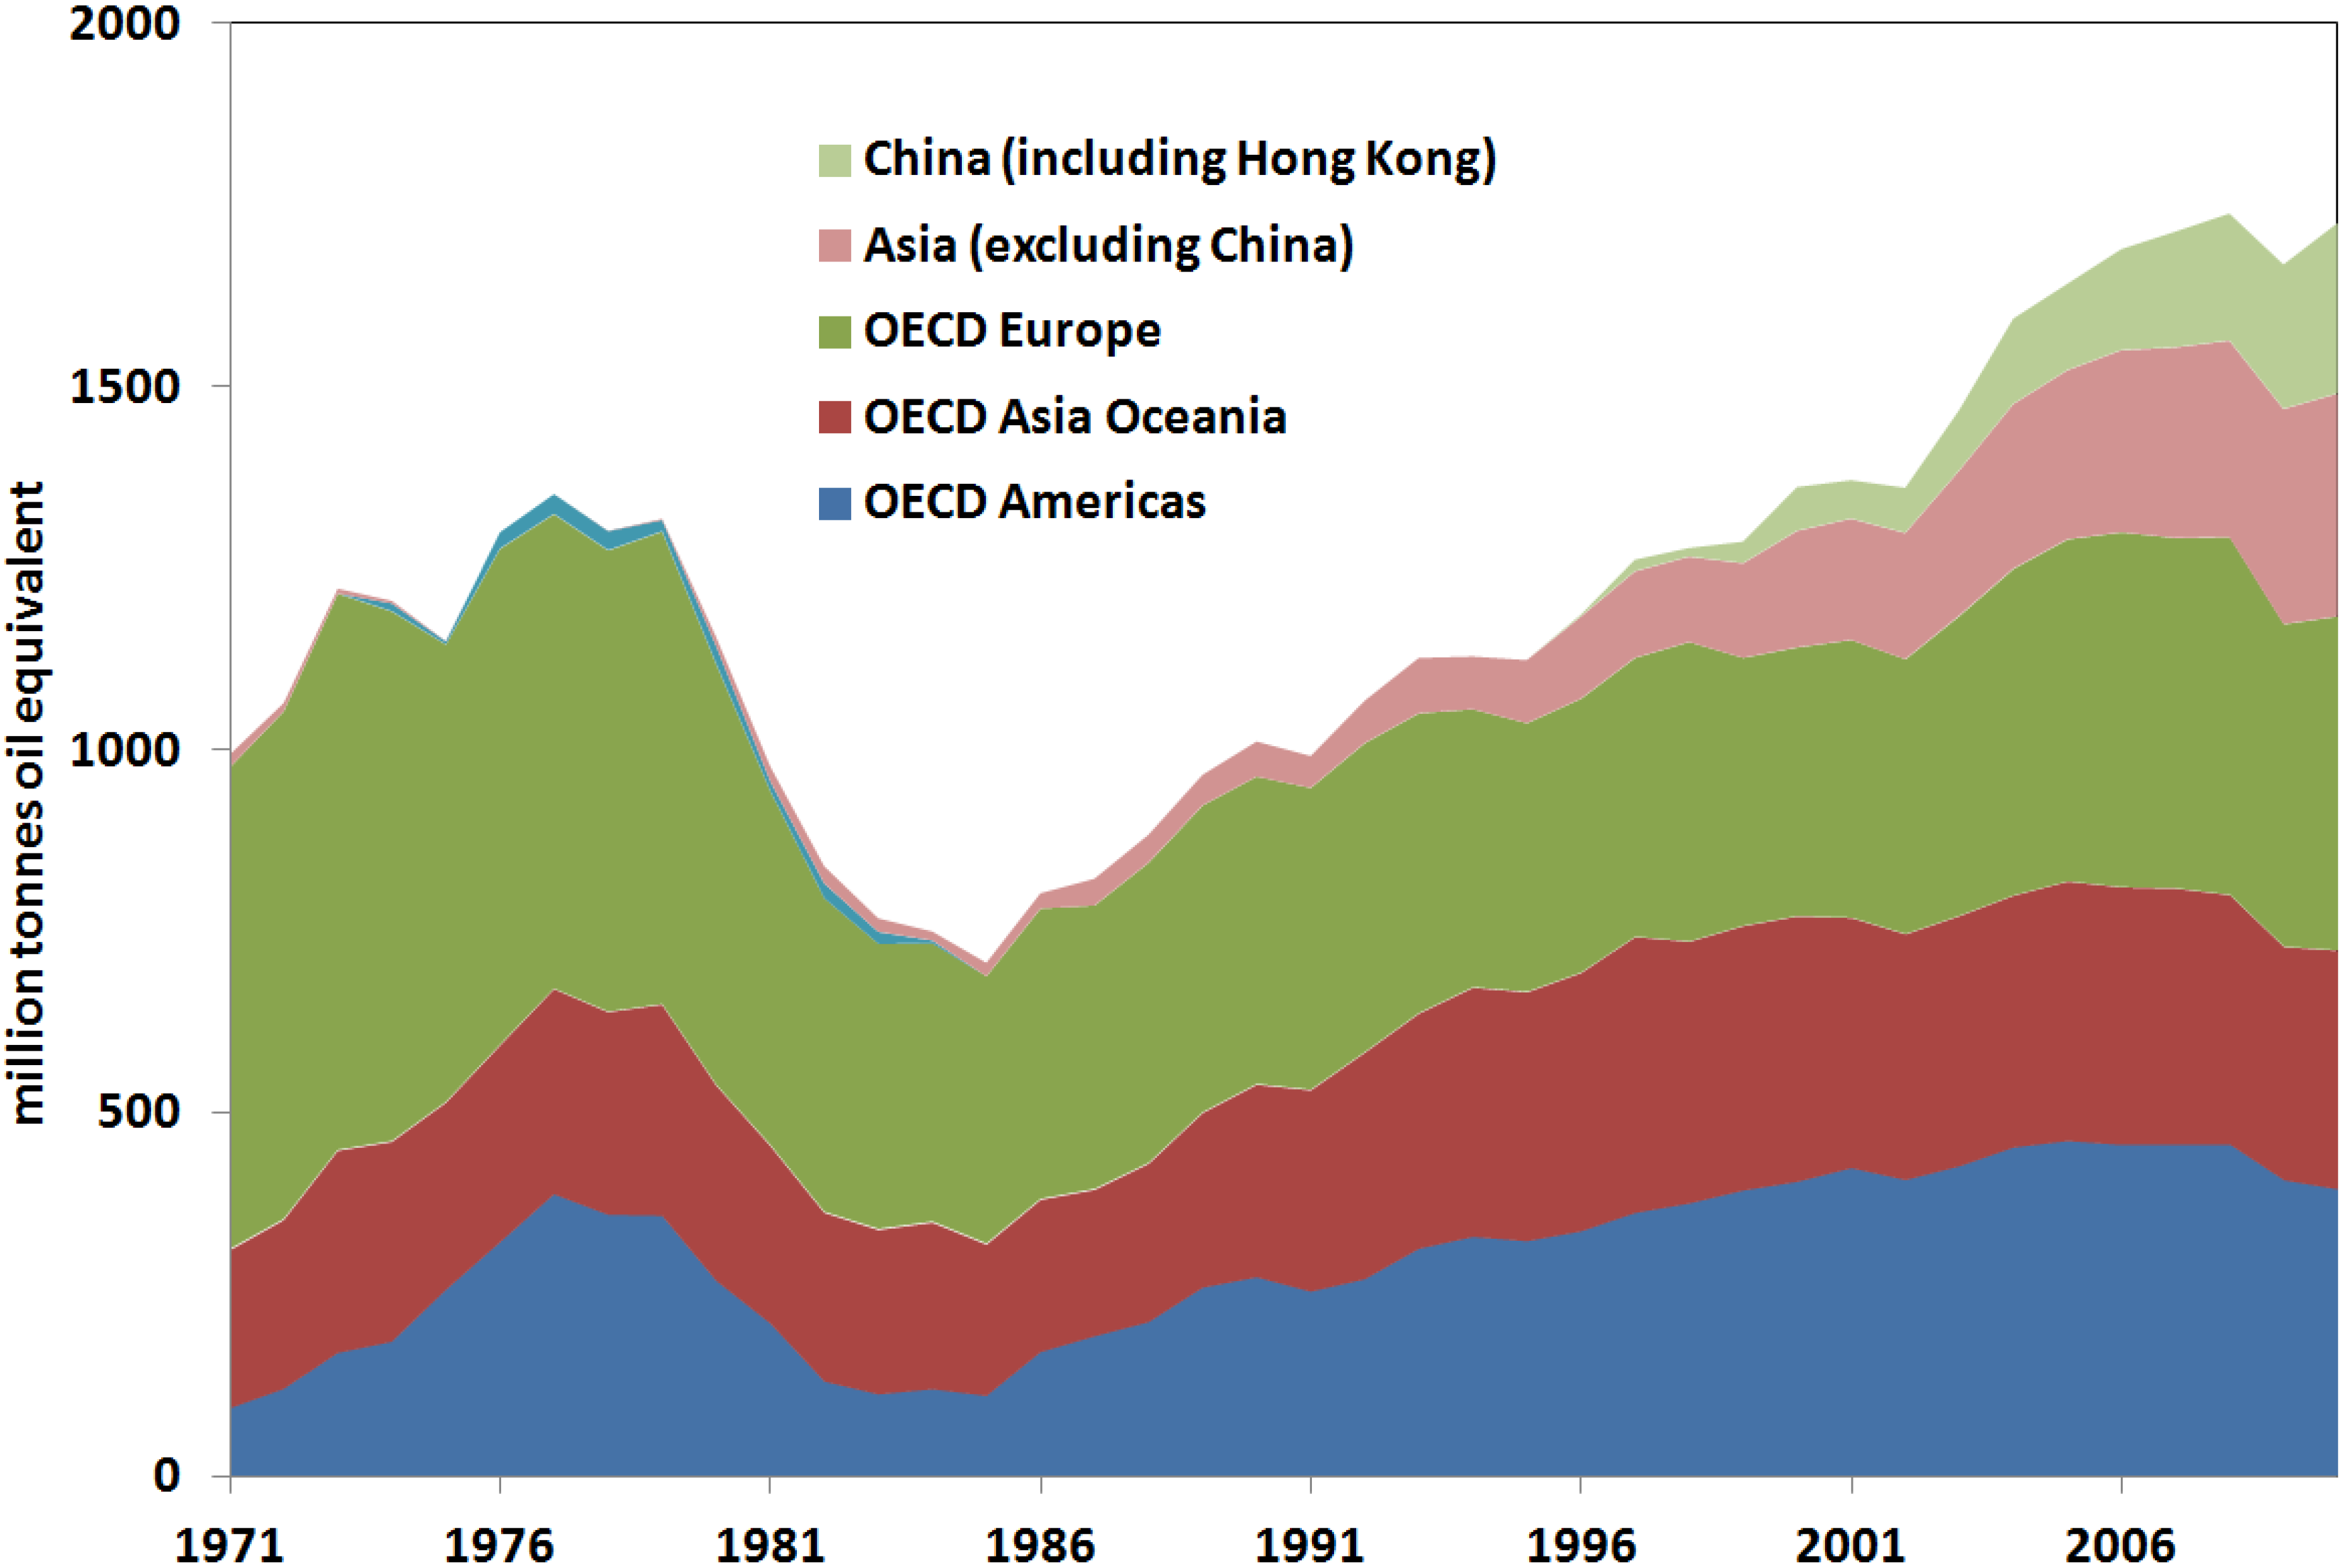
Energy security issues have also been of renewed concern to policymakers over the last decade. Supplies of primary energy resources are unevenly distributed at the global level and many developed and emerging economies are not energy self-sufficient. The increasing energy needs of large developing Asian countries such as China and India are increasing competition for supplies on world markets at the same time as developed nations are sourcing more of their primary energy resources internationally in response to dwindling domestic stocks, as shown in Figure 3. Another aspect of energy security is the need to access modern and reliable energy sources in low income countries. Decentralised renewable generation has advantages in such countries which often have poorly developed grid networks [11].
Figure 3.
Net crude oil imports 1971–2011 [12].
Figure 3.
Net crude oil imports 1971–2011 [12].

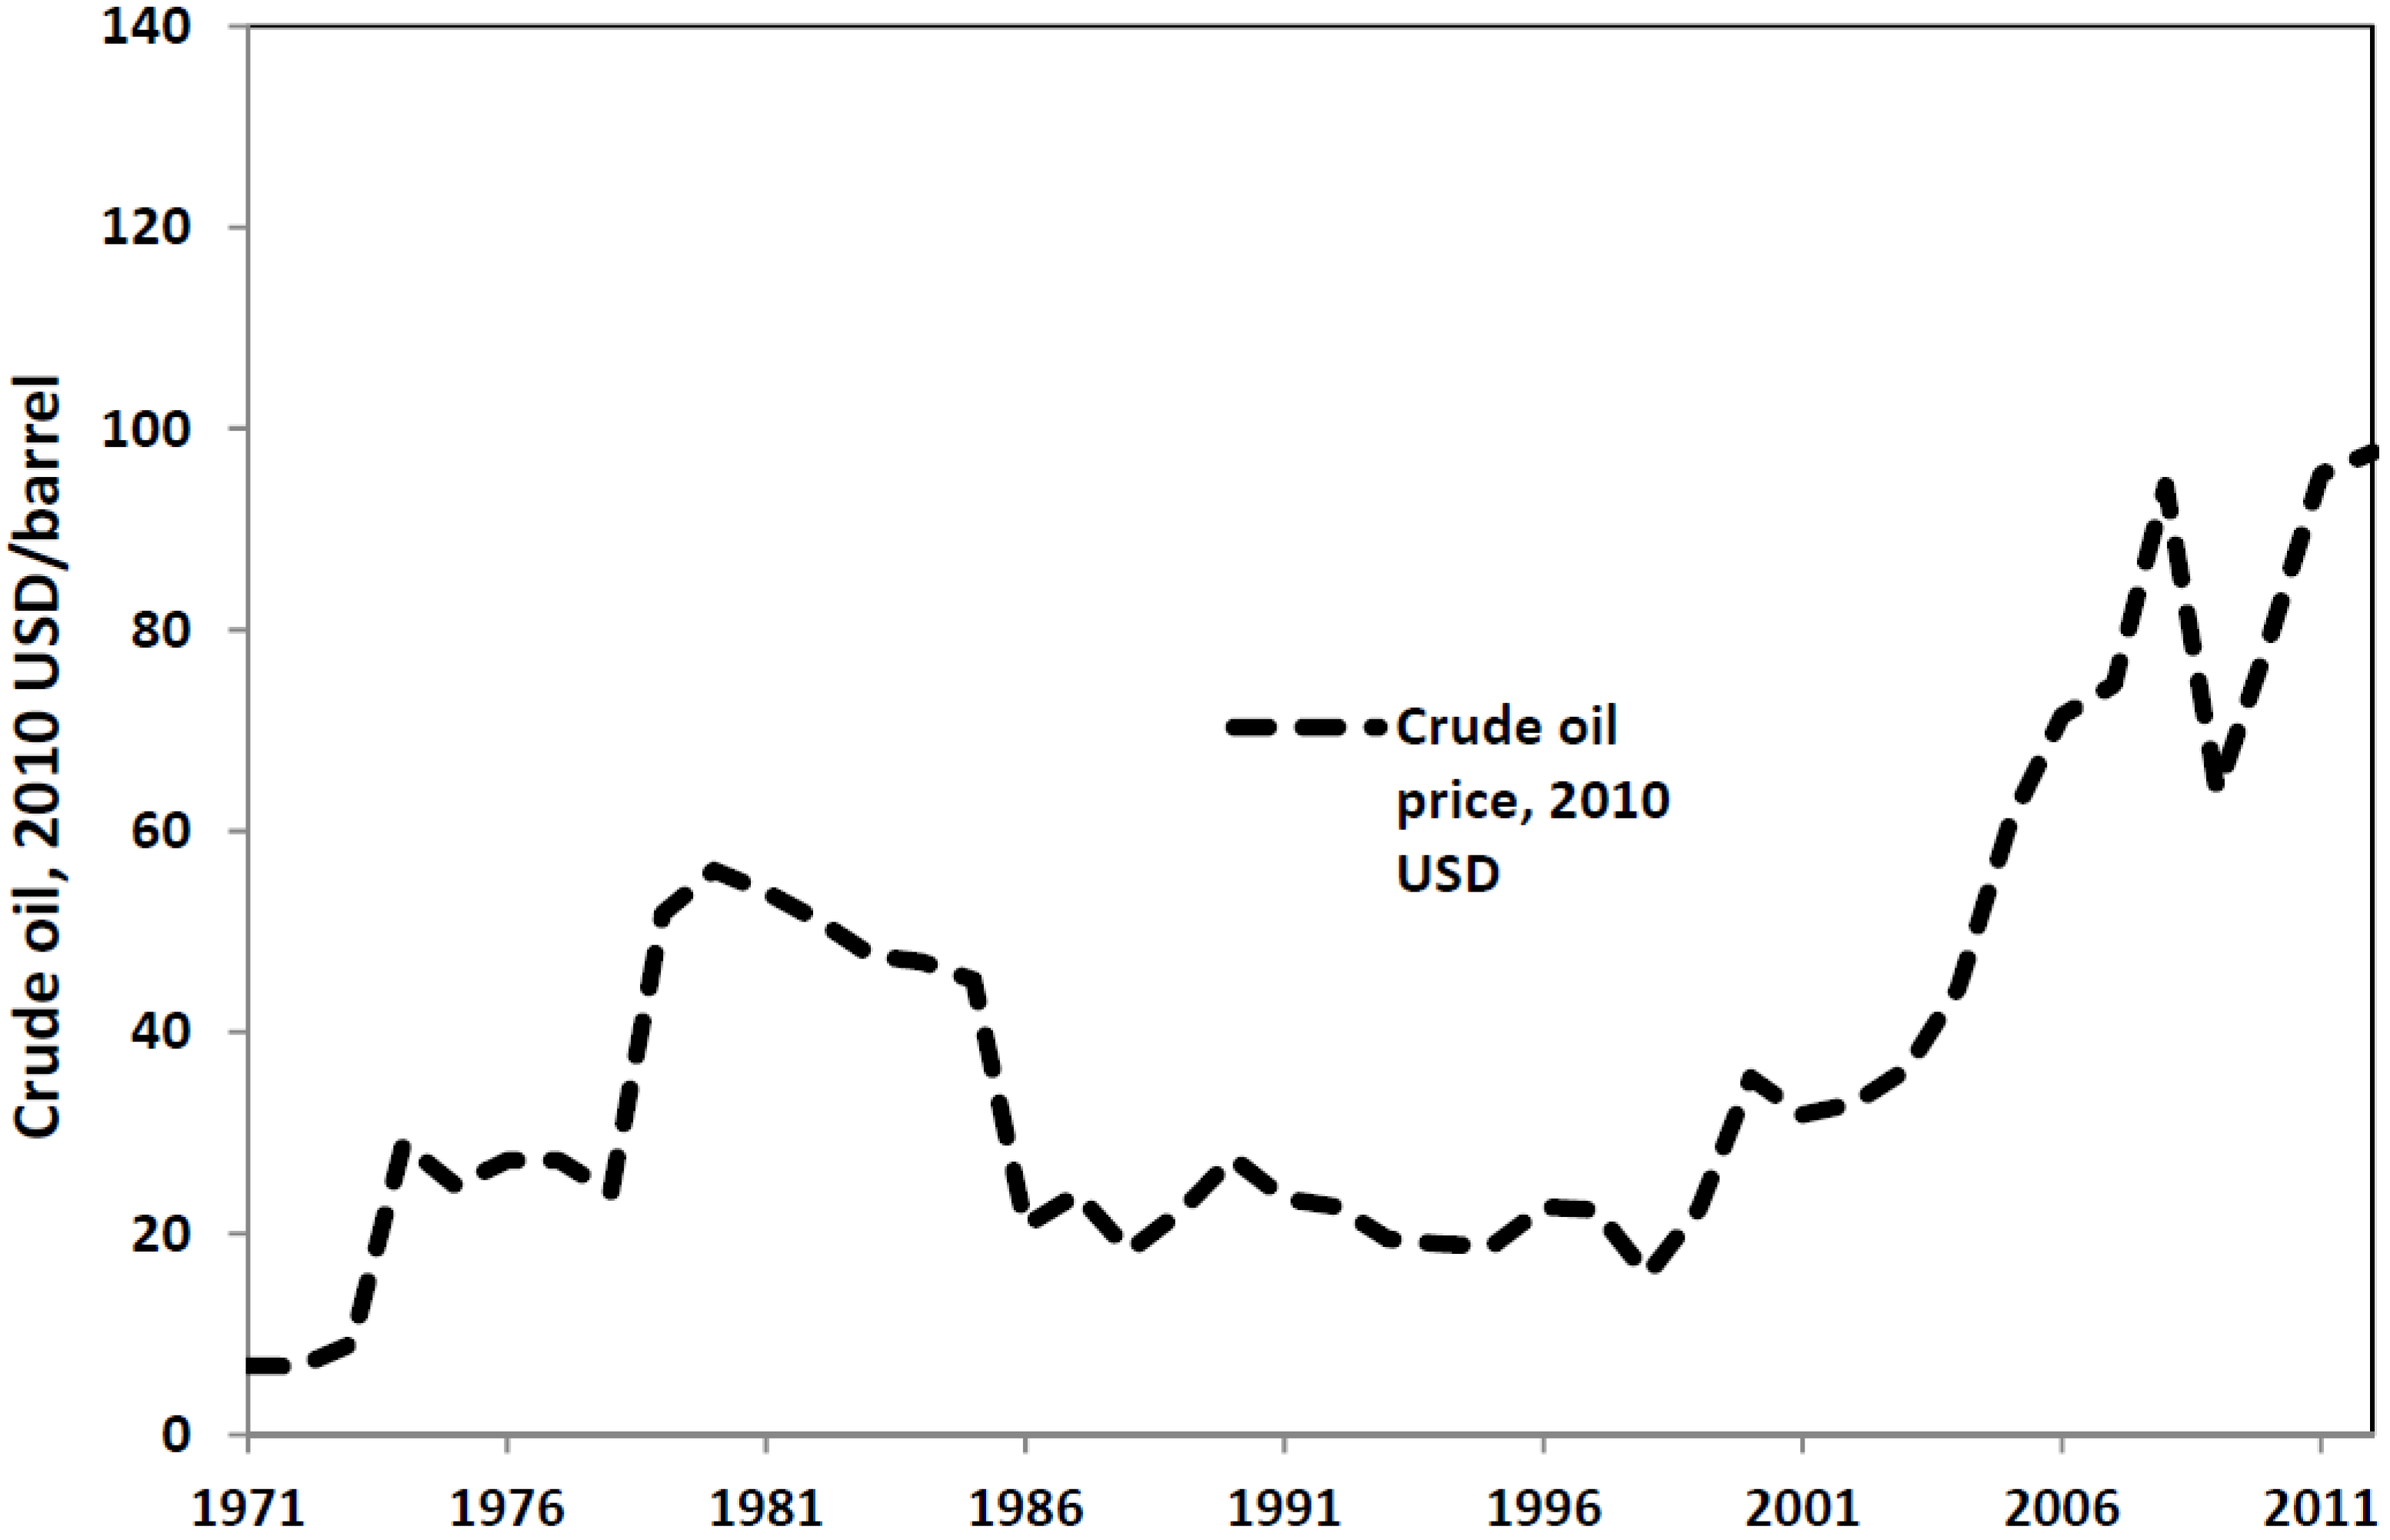
After a significant fall in exports from the Middle East following the 1970s oil crises, oil exports to developed countries have recovered to pre-crisis levels, even as the region experiences significant political instability [12]. Other global events such as the Fukushima disaster and the Ukraine crisis have raised prices and added volatility to global markets. Prices of crude oil averaged $108/barrel in 2013 (Brent), compared to average prices in the 1990s of under $20/barrel, as shown in Figure 4 [13]. The notion of energy independence, and the prospect of insulation from volatile global markets, is an enticing one for many policymakers. The recent boom in shale gas has raised the prospect of energy independence for the US. This has the potential to change the dynamics of the global energy system dramatically.
Figure 4.
Annual average crude oil prices 1971–2012 [14].
Figure 4.
Annual average crude oil prices 1971–2012 [14].

There are a number of synergies between two of the drivers in the energy trilemma, climate change and energy security. Many of the technologies available to decarbonise the electricity system for example, such as wind and solar power also promote energy self-sufficiency. However, measures to address these two drivers are often costlier than a business-as-usual approach and can therefore have a negative impact on affordability. Since the global financial crisis in 2008, measures to address climate change have faced greater political opposition, as exemplified by the repeal of the Australian carbon tax [15]. However, energy efficiency measures, some of the most cost-effective and immediate actions to reduce CO2 emissions, reduce primary energy demand thus improving energy security and enhance affordability by reducing energy costs.
The combined effect of the three policy drivers creates a strong “pull” effect on the energy innovation process, as policymakers seek to promote the development and deployment of new energy technologies that will help resolve the energy trilemma. However, it is also important to consider the “push” effect from developments in basic underpinning science that provide new opportunities for the development of potentially transformative technologies.
3. The Science and Technology Push
Innovation in the energy sector has tended to be incremental in recent decades, with small improvements in efficiency and reductions in the cost of existing system components. The current energy system relies on large assets with long payback times and is dominated by a small number of large industrial players. These factors encourage “lock-in” to existing technological paradigms [16]. This section shows that developments in basic science relevant to the energy sector can provide a “push” that has the potential for a more radical transformation of technology, new energy system innovations.
In November 2005, the IEA’s Ad-hoc Group on Science and Energy Technologies (AHGSET) held a workshop to investigate the critical connections between basic scientific programmes and applied energy programs [17]. This workshop identified several key technology challenges for the energy sector, chiefly improving the performance of energy storage, intelligent management of electricity networks to integrate distributed generation and intermittency, improving the performance of solar PV (photovoltaics) and bioenergy technologies and improving energy efficiency across buildings, transport and industry [18]. The IEA also identifies three key barriers preventing greater links between basic science and energy technology development: different goals, incentives and time horizons between basic and applied R&D; organisational and communication issues between teams; and intellectual property rights (IPR) concerns [19]. Emerging developments in several fields of basic science are showing great promise for the energy sector, and three of these are highlighted below: computational technologies; materials science; and the biosciences.
Information and communication technologies (ICT) have made major and transformative breakthroughs in many sectors over the past 20 years. The finance, retail, entertainment, news media, and health sectors are examples of areas that have undergone substantial change as a result of ICT applications. Indeed, the pace and magnitude of change have led many to refer to an “information revolution” [20]. This revolution has had limited direct effects on the energy sector to this point, with ICT generally being used in system modelling and monitoring applications. The concept of the “smart grid”, however, proposes to extend ICT capabilities throughout the electricity network, bringing a wealth of informational and control applications as well as allowing consumers direct access to the electricity market through smart metering and demand-side participation technologies [21].
Integrating these technologies into the existing network can therefore assist the resolution of issues such as the integration of large quantities of intermittent generation into the electricity system, as well as allowing smaller domestic consumers to become full and active participants into the electricity system. This can permit the full integration of distributed generation and energy storage into advanced concepts such as microgrids, which are localised grids connecting distributed generation, demand and storage units and have the ability to operate autonomously if required. It also enables virtual power plants (VPPs), aggregations of hundreds of units of distributed generation which can operate in the market as if they were a single dispatchable power plant [22].
The large increases in computational power seen over the last decade have also led to other technological solutions for the energy sector. Complex models of the energy system, on the regional, national and global scales, can be constructed to aid policymakers and system planners [23]. Supercomputers have the capabilities to model and design materials on the atomic and molecular scales, benefitting the development of new materials and electrochemical technologies.
The material sciences, assisted in part by the computational advances described above, are providing a series of transformative opportunities across the energy sector. It is now possible to “design” materials on an almost atom-by-atom basis. This has found application in the micro-electronics and flat-screen display technology sectors driven by requirements for increased efficiency and longevity. Potential applications in the energy sector include advances in the efficiency and cost-competitiveness of photovoltaic (PV) cells, fuel cells, large-scale batteries for energy storage and hydrogen storage and transportation applications. [24] Advances in large-scale materials manufacturing also have applications in the fabrication of power plants and electricity infrastructure. Pressure vessels for nuclear reactors and blades for wind turbines can be manufactured at greater size and with fewer structural flaws due to these advances.
Bioenergy could potentially benefit from a range of opportunities arising from advances in the biological sciences, including a greater understanding of microbiological processes underlying the photosynthetic process, plant growth and development and resistance to disease and extreme weather. Selective breeding and advances in genomics could allow the creation of bioenergy crops which are more precisely tailored to their environment and can utilise available non-arable land and limited water supplies in a more sustainable manner. For example, funding from the US Department of Energy has established the complete DNA sequence of the black cottonwood tree (a type of poplar), which could lead to better feedstocks for cellulosic ethanol [25]. The more efficient conversion of crops into biofuels, especially “second-generation” biofuels extracted from lignocellulosic (woody) parts of the plant or plant waste is also assisted by basic biological science advances [26]. The efficient processing of lignocellulosic material from “second generation” crops, which include willow and miscanthus, provides greater energy yields and lower emissions in comparison to first-generation biofuels manufactured from food crops, as well as avoiding the use of food crops for biofuel production.
Some of these scientific advances go back decades, but it is only now that technology is emerging to allow commercial application. There is typically a significant time lag between a basic research breakthrough and commercialisation. A considerable amount of work is needed to scale up technology, demonstrate feasibility at scale, establish a supply chain and reduce costs to an acceptable level for mass commercialisation. The lead time varies from sector to sector. ICT projects move to commercialisation relatively quickly, whereas new energy generation technologies such as solar and wind can take considerably longer. [27] For example, the first solar PV cell was demonstrated by Bell Labs in 1954, but mass deployment as a large scale energy resource did not begin until the 1990s [28].
In conclusion, there is currently a considerable “push” effect on energy technology innovation from recent scientific developments and many synergies with the policy-induced “demand-pull”.
4. Global Projections
The trends in global policy and basic science advances highlighted above illustrate a global energy system in flux, with a complex series of drivers and global priorities interacting with each other in often unpredictable ways. There is a tension between a continuation of the incremental technological change seen over recent decades and the more fundamental transformations made possible by developments in basic science. At the same time, there are differences in view about both the feasibility and the desirability of radical energy system change, particularly in response to the climate change challenge. These tensions and differences are reflected in the views taken by different organisations regarding the development of the energy system (Table 1). These views in turn form the basis of the R&D strategies that different organisations in both the private and public sectors are following. In this section, we assess different views of the future before addressing R&D strategies in Section 5.
These scenarios are underpinned by three main philosophical approaches. Normative scenarios take an assumptive endpoint, often the goal of holding global temperatures below 2 °C above pre-industrial temperatures, and “backcast” from this endpoint, modelling the policy and technology options for meeting this goal at the lowest cost. An example of this type is the two degrees (2DS) scenario found in the IEA’s Energy Technology Perspectives publication, which provides a normative scenario based around the attainment of the 2 °C target in 2050 [9]. Over 900 scenarios of this type have been collected and assessed by the Intergovernmental Panel on Climate Change (IPCC) as part of the Fifth Assessment Report [8].

| Scenario/Projection | Style | Final Demand for Electricity (EJ) | Energy-Related CO2 Emissions (billion·t) |
|---|---|---|---|
| 2011 baseline | - | 66 | 31 |
| IEA 2 degrees | Normative | 108 | 20 |
| IEA 4 degrees | Adopts Cancún pledges | 120 | 40 |
| IEA 6 degrees | BAU projection | 131 | 52 |
| EIA International Energy Outlook | Outlook | 127 | 45 |
| ExxonMobil Outlook for Energy | Outlook | 124 | 36 |
| Shell Mountains scenario | Exploratory | 131 | 37 |
| Shell Oceans scenario | Exploratory | 159 | 41 |
Many organisations develop outlooks, a catch-all term for the process of projecting current trends in the energy system along a path defined by foreseeable policy, economic and technological changes. These are often known as “business-as-usual” scenarios. They are generally incompatible with the 2 °C target. Outlooks are produced by public national and supranational organisations such as the US Energy Information Administration (EIA) [29], the Organisation of the Petroleum Exporting Countries (OPEC) [30] and the IEA with its 4DS and 6DS scenarios [9]. Large private-sector corporations such as ExxonMobil [31], and BP group [32] also produce outlooks to guide executives and investors. The time horizon for these outlooks commonly ranges from 2035 to 2040, with the IEA scenarios looking further out to 2050.
Shell’s scenarios [33] are exploratory in character and the latest versions provide two alternative qualitative “storylines”, focusing on different visions of the next fifty years. These extend to 2060 and are designed to ensure that Shell’s strategies are robust against a plausible range of futures.
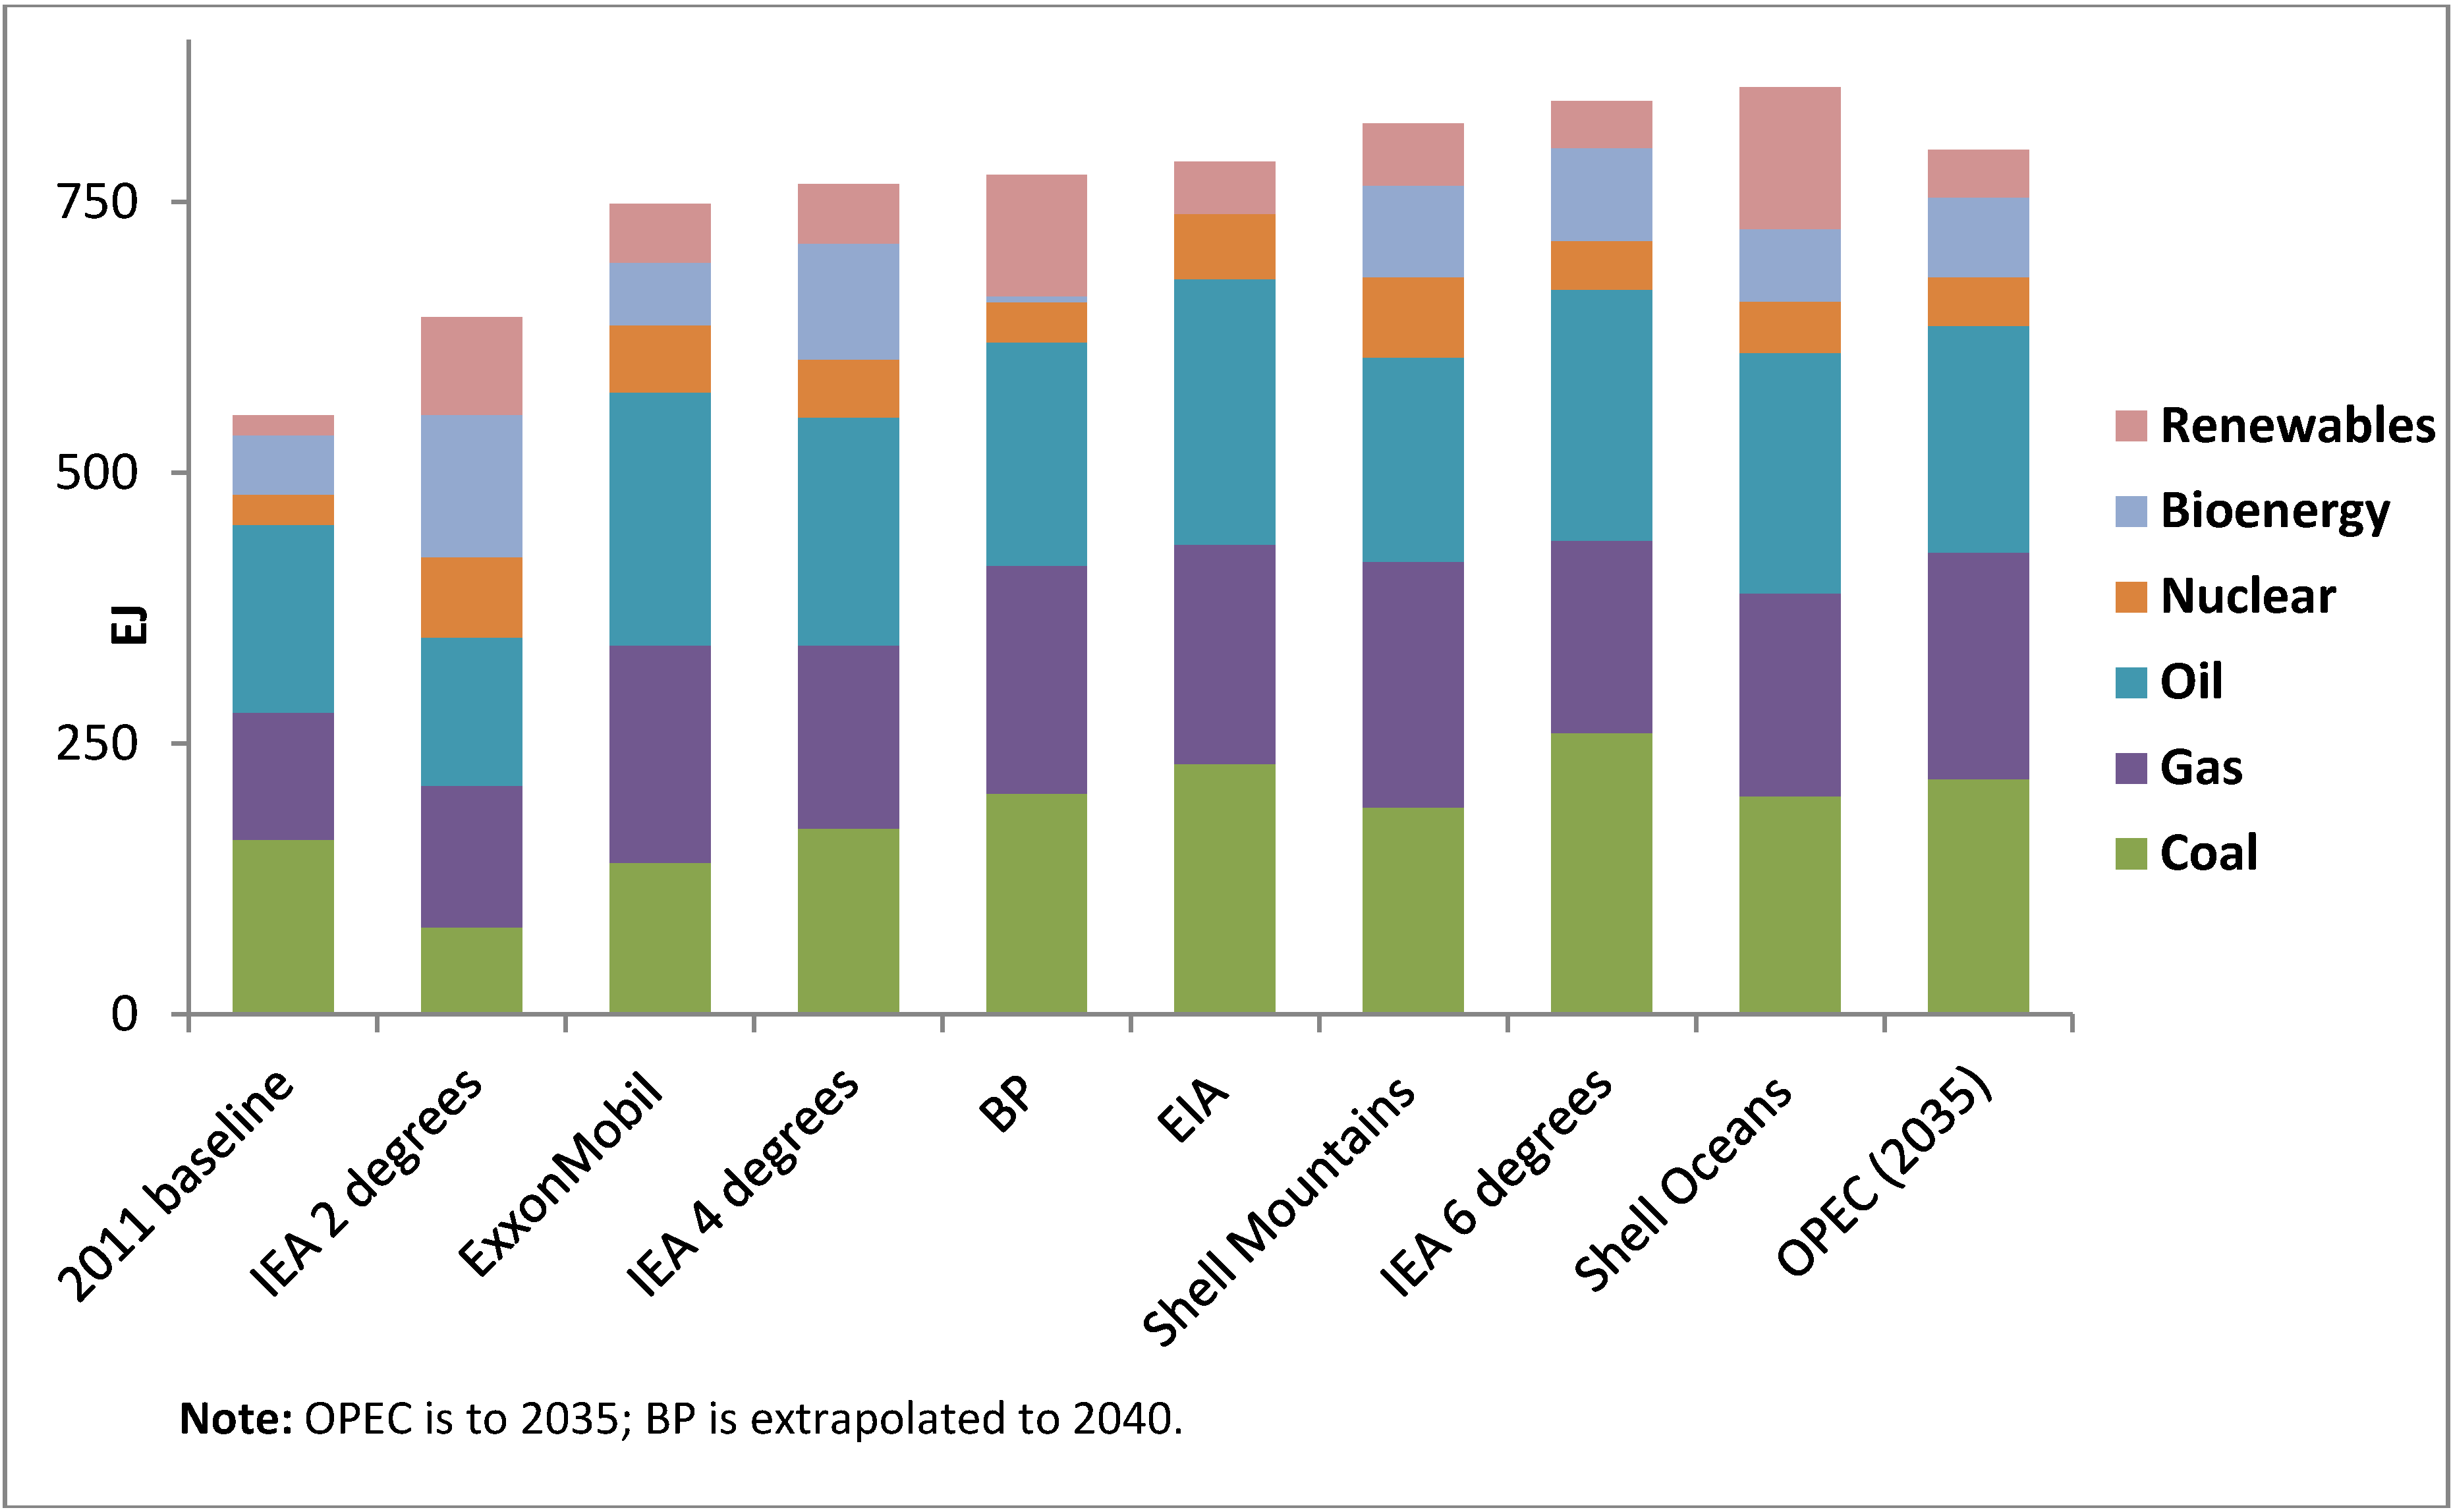
A comparison of the six scenarios referenced above from the IEA, EIA, OPEC, ExxonMobil, Shell and BP for 2040 reveals a considerable range of energy futures and thus deep uncertainty over the path the energy system will take. This comparison is represented in Figure 5. An important high-level message from the comparison is that “new” energy technologies such as electric vehicles and renewables play a role in all the scenarios, although with slower rollouts and reduced market share in the “business-as-usual” outlooks. All scenarios project a significant rise in energy demand from the 2011 baseline, though this is much less in the IEA 2DS scenario.
Several energy technologies are common across all scenarios. A large expansion in the role of natural gas is commonly accepted, with most of the outlooks also entailing substantive increases in the roles of coal and oil. This leads to growth in energy related CO2 emissions across all scenarios except the IEA 2DS scenario, which is normative and meets the 2 °C target. The other scenarios are unconstrained by the 2 °C target (though the IEA 4DS scenario takes the pledges made at the Cancun agreement into account) and therefore project both significantly higher levels of energy demand and a greater proportion of that demand being met from fossil fuels. Renewable energy grows in all scenarios, though it still makes up only a small proportion of total energy demand. The renewables share is greatest in the Shell Oceans scenario, which features a substantial growth in solar PV driven by large-scale cost reductions.
Figure 5.
Primary energy demand in different global energy scenarios/projections for 2040 [9,30,31,32,33].

There are also several key differences between the scenarios, with the IEA 2DS scenario differing most strongly from the others. The 2DS scenario projects a rapid expansion of all forms of renewable energy generation, nuclear power, carbon capture and storage (CCS) and energy efficiency measures. Oil and coal usage drops substantially from the 2011 baseline, and energy demand is substantially lower than the other scenarios. The role of bioenergy varies significantly with expansions seen in the IEA scenarios and Shell Mountains, but decreases seen in the ExxonMobil, BP and EIA scenarios. The growth of energy related CO2 emissions is lower in the ExxonMobil and Shell Mountains scenarios than the other outlooks. ExxonMobil foresees greater energy efficiency savings while the Shell Mountains scenario includes large-scale investments in CCS technology.
The next two sections explore how the thinking embodied in these scenarios has led to significant divergences in patterns of investment in R&D across organisations, notably divergences between those in the public and private sectors.
5. RD&D Patterns
5.1. Public R&D Trends
As discussed above, policymakers’ interest in energy innovation has sharply increased over the last decade, following a twenty-year slump after the end of the 1970s energy crises. The IEA collects annual data on public sector energy innovation budgets from its member countries. Data is collected using a questionnaire sent by the IEA to relevant government departments, allowing trends in historical data to be compiled. Due to potential differences in the scope and categorisation of data, cross-country comparisons in the level of spend should be taken as indicative.
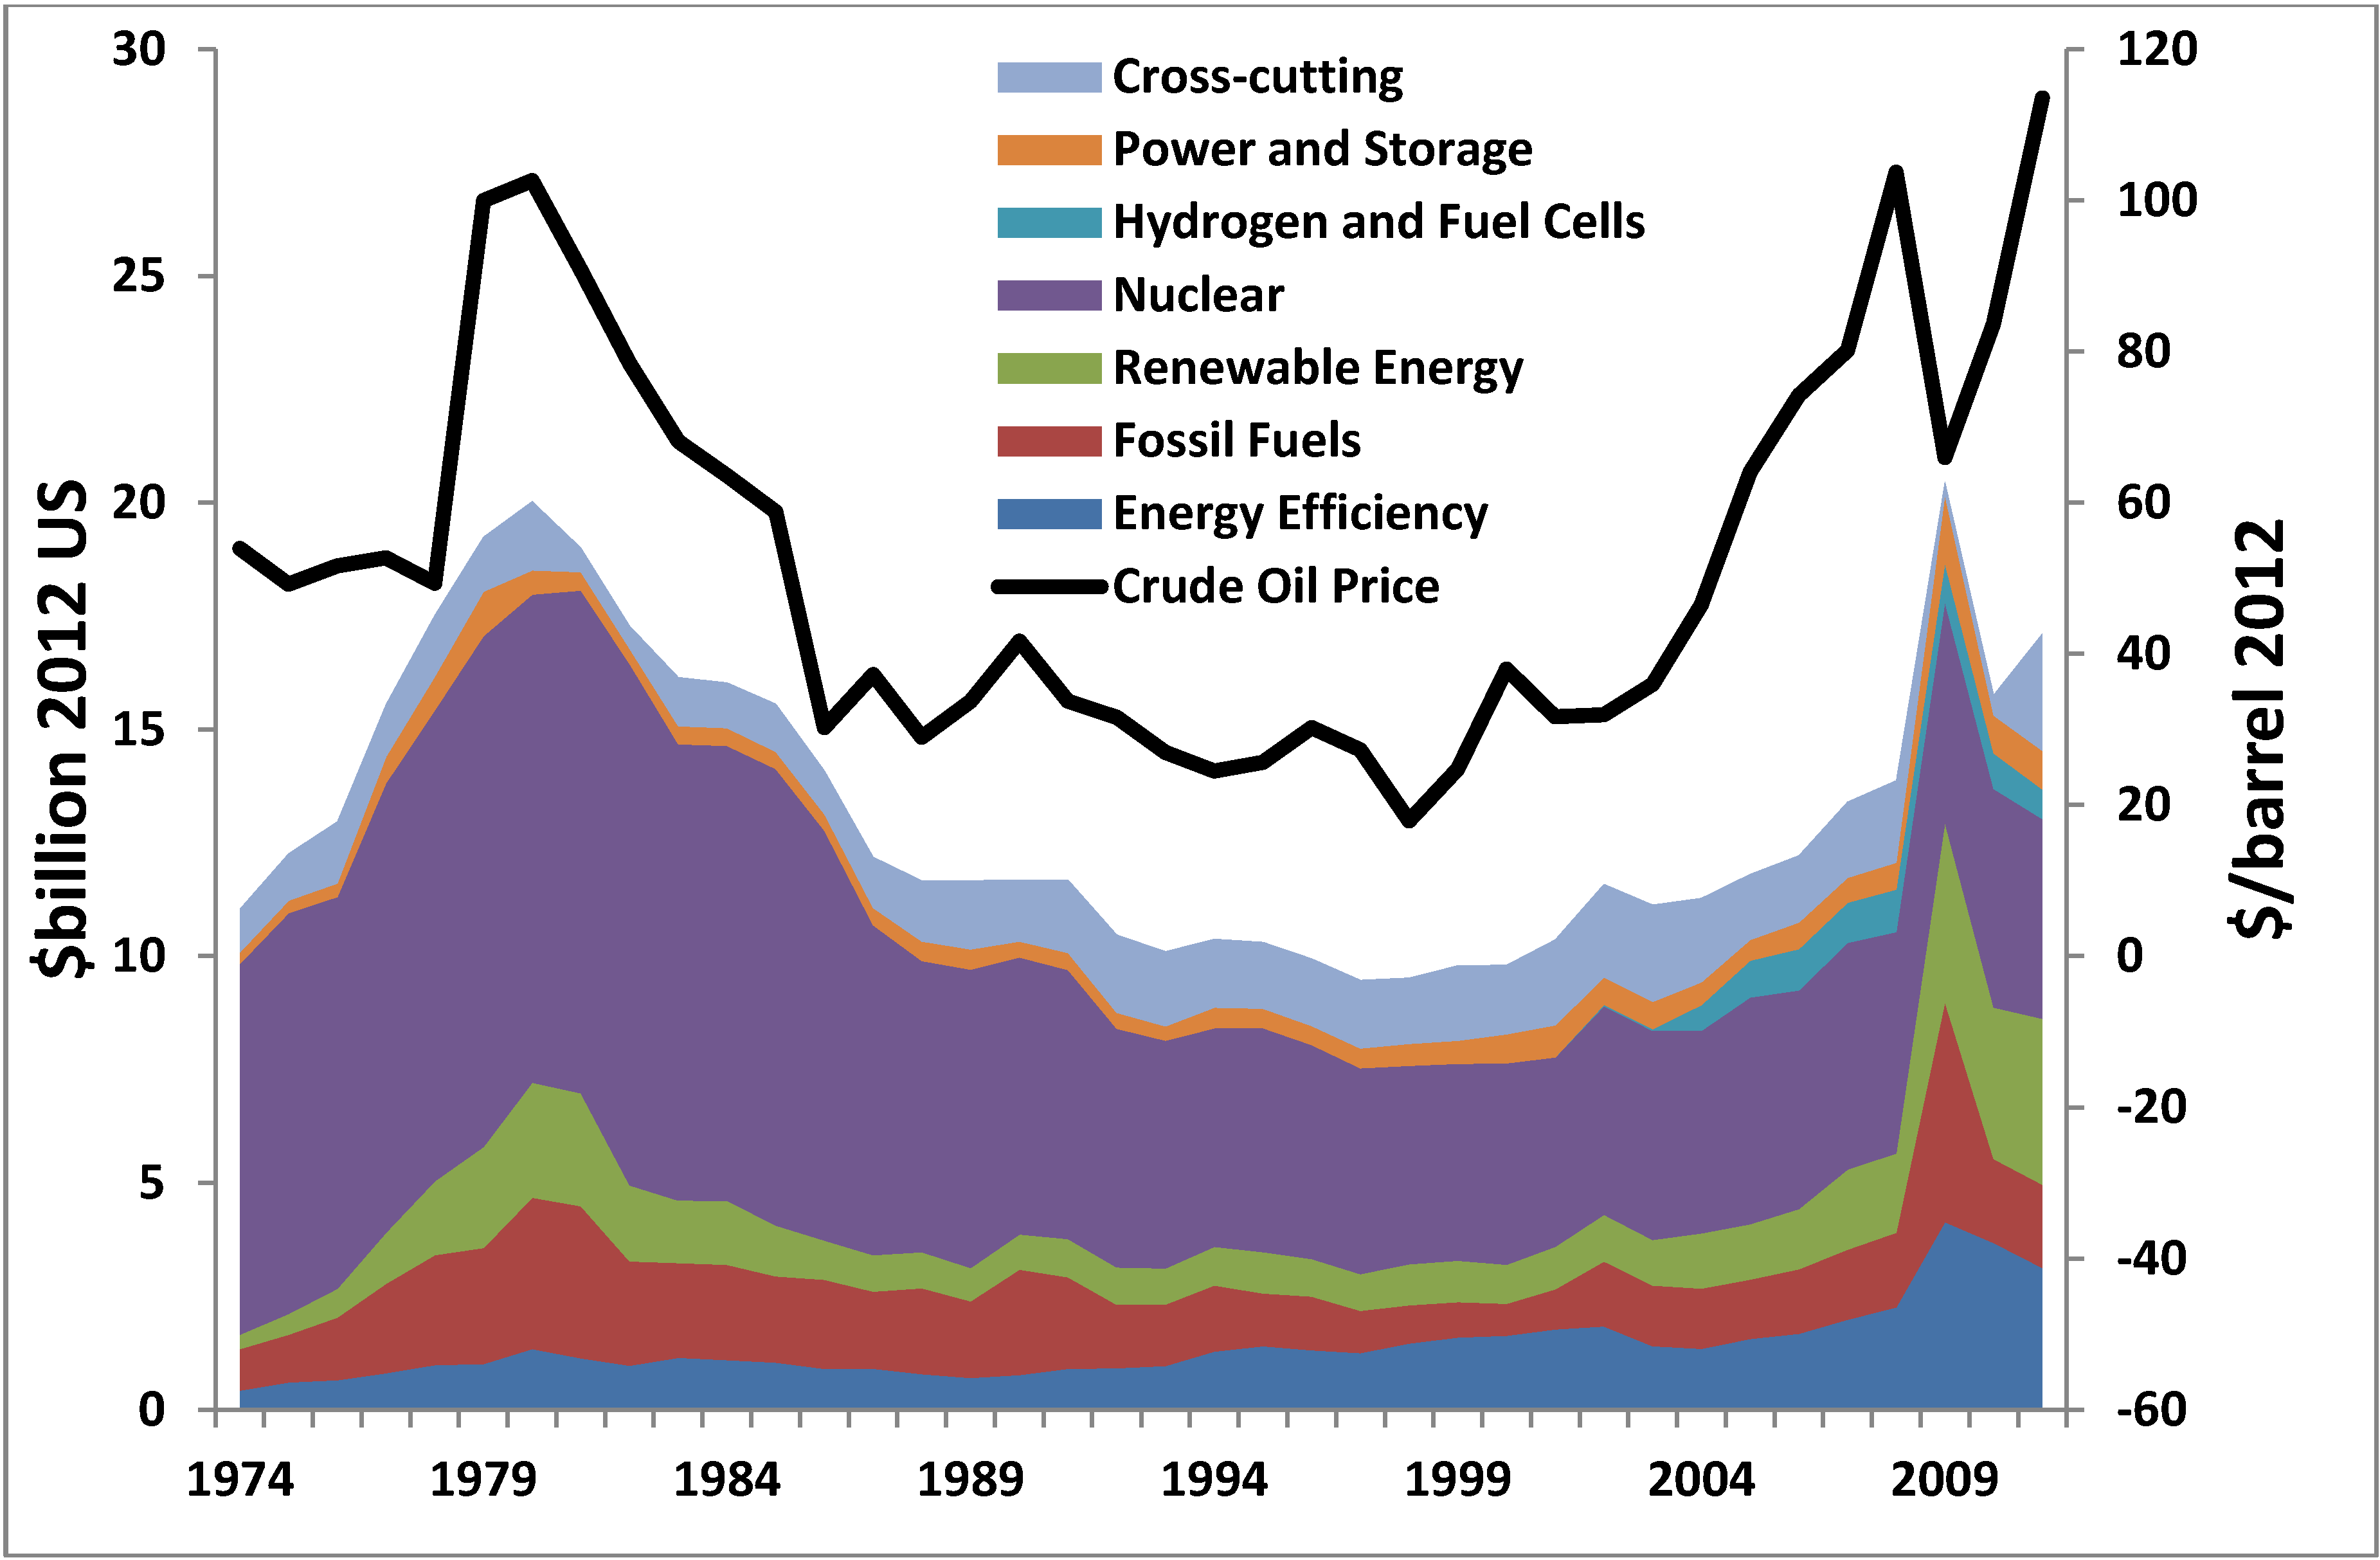
Figure 6 shows the total investment in RD&D in 2012 USD adjusted for purchasing power parity (PPP) across IEA countries 1974–2011 [3], with the average annual price of oil superimposed on the graph [14]. Table 2 shows the value of public sector RD&D spend across IEA countries in 2011.
Figure 6.
Investment in energy RD&D in IEA countries and average price of crude oil 1974–2011 [3,14].

Table 2.
Public sector RD&D spend in IEA countries 2011 [3].
| Area | Spend |
|---|---|
| Energy Efficiency | 3.1 |
| Fossil Fuels | 1.8 |
| Renewable Energy | 3.7 |
| Nuclear | 4.4 |
| Hydrogen and Fuel Cells | 0.7 |
| Power and Storage | 0.9 |
| Cross-cutting | 2.6 |
| Total | 17.2 |
This shows a strong correlation between the price of oil and the quantity of global public RD&D activity, with the caveat that a direct causal relationship should not necessarily be inferred. However, the high and volatile oil prices witnessed over the last decade have undoubtedly had some influence on policymakers. Of further interest is the shift between nuclear (both fission and fusion) and renewables RD&D activity which has occurred over the last few decades. While making up the bulk of energy RD&D activities in the late 1970 and early 80s, rising to a peak of $11 billion in 1981, the nuclear share of the total has decreased to roughly 30%, $4.4 billion, in 2011, driven by a shift away from nuclear fission in several European countries. A large share of public nuclear research resources are currently being spent on fusion development, much of it on the internationally-funded experimental ITER (the acronym ITER once stood for International Thermonuclear Experimental Reactor) reactor located in France. The shares of renewables, hydrogen and fuel cells, energy efficiency, cross-cutting research and basic science have increased sharply since the 2008 financial crisis, driven by stimulus packages in the US and increasing commercialisation and deployment of “new” and renewable energy sources.
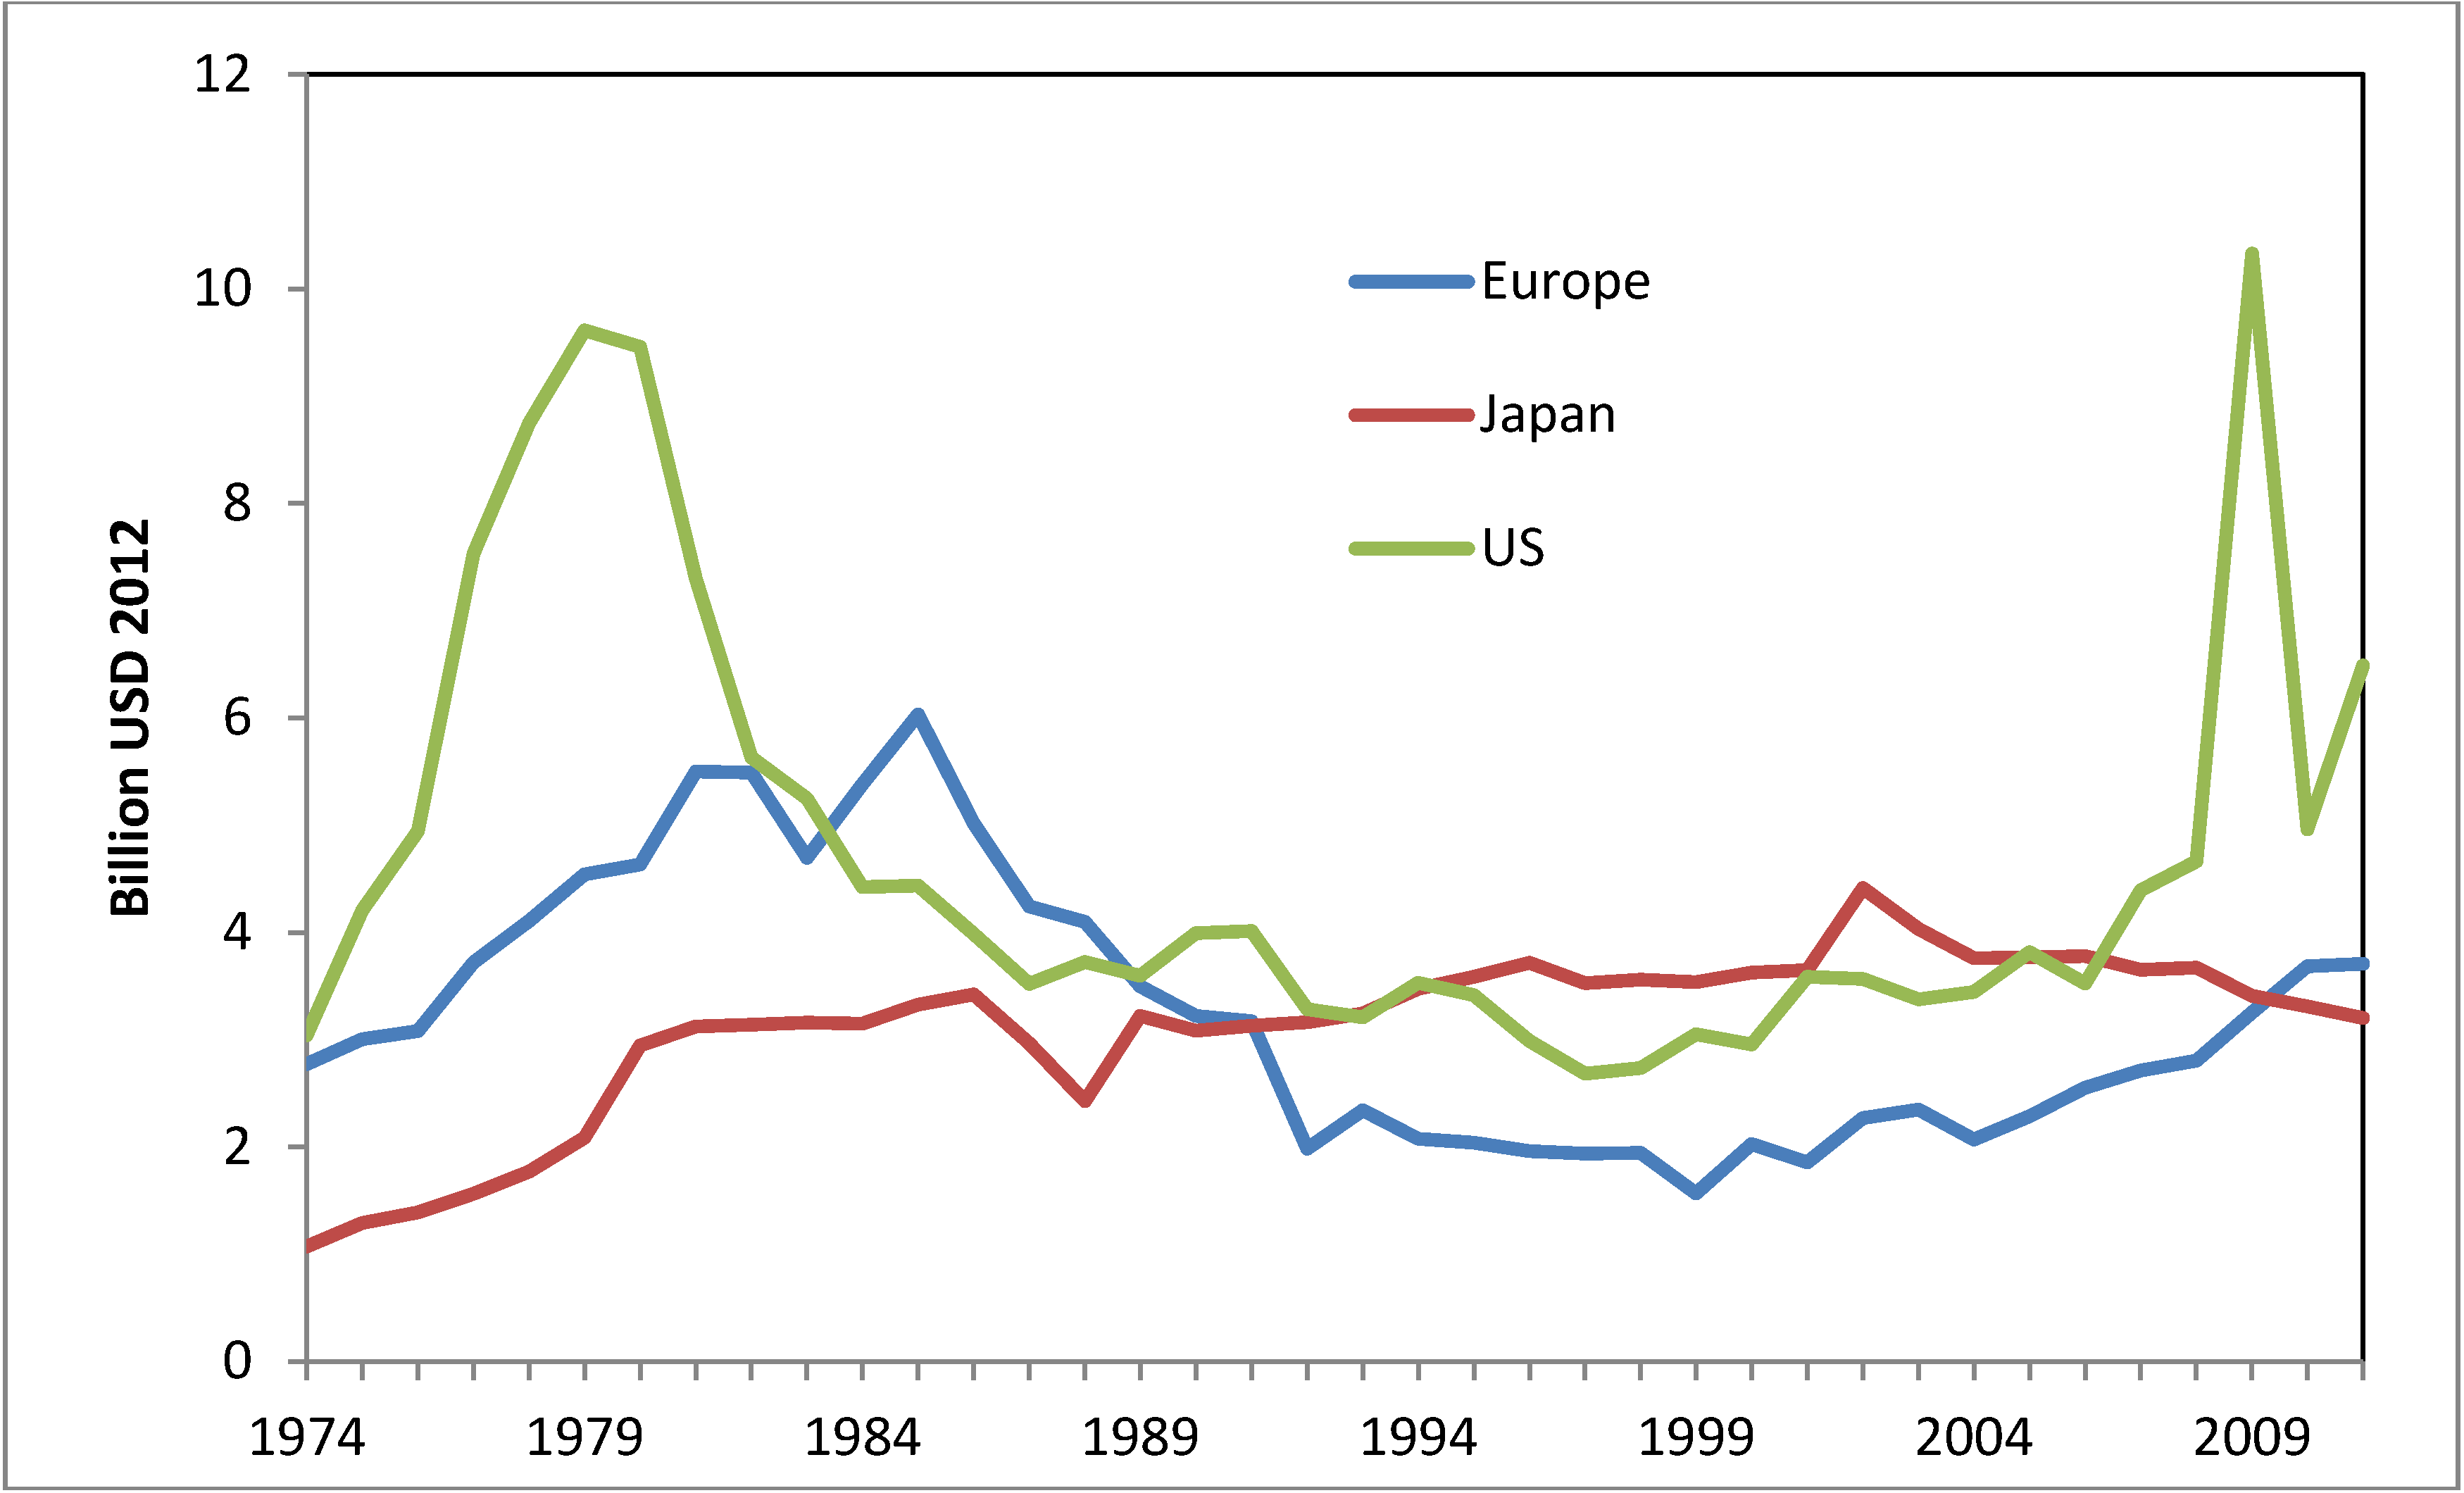
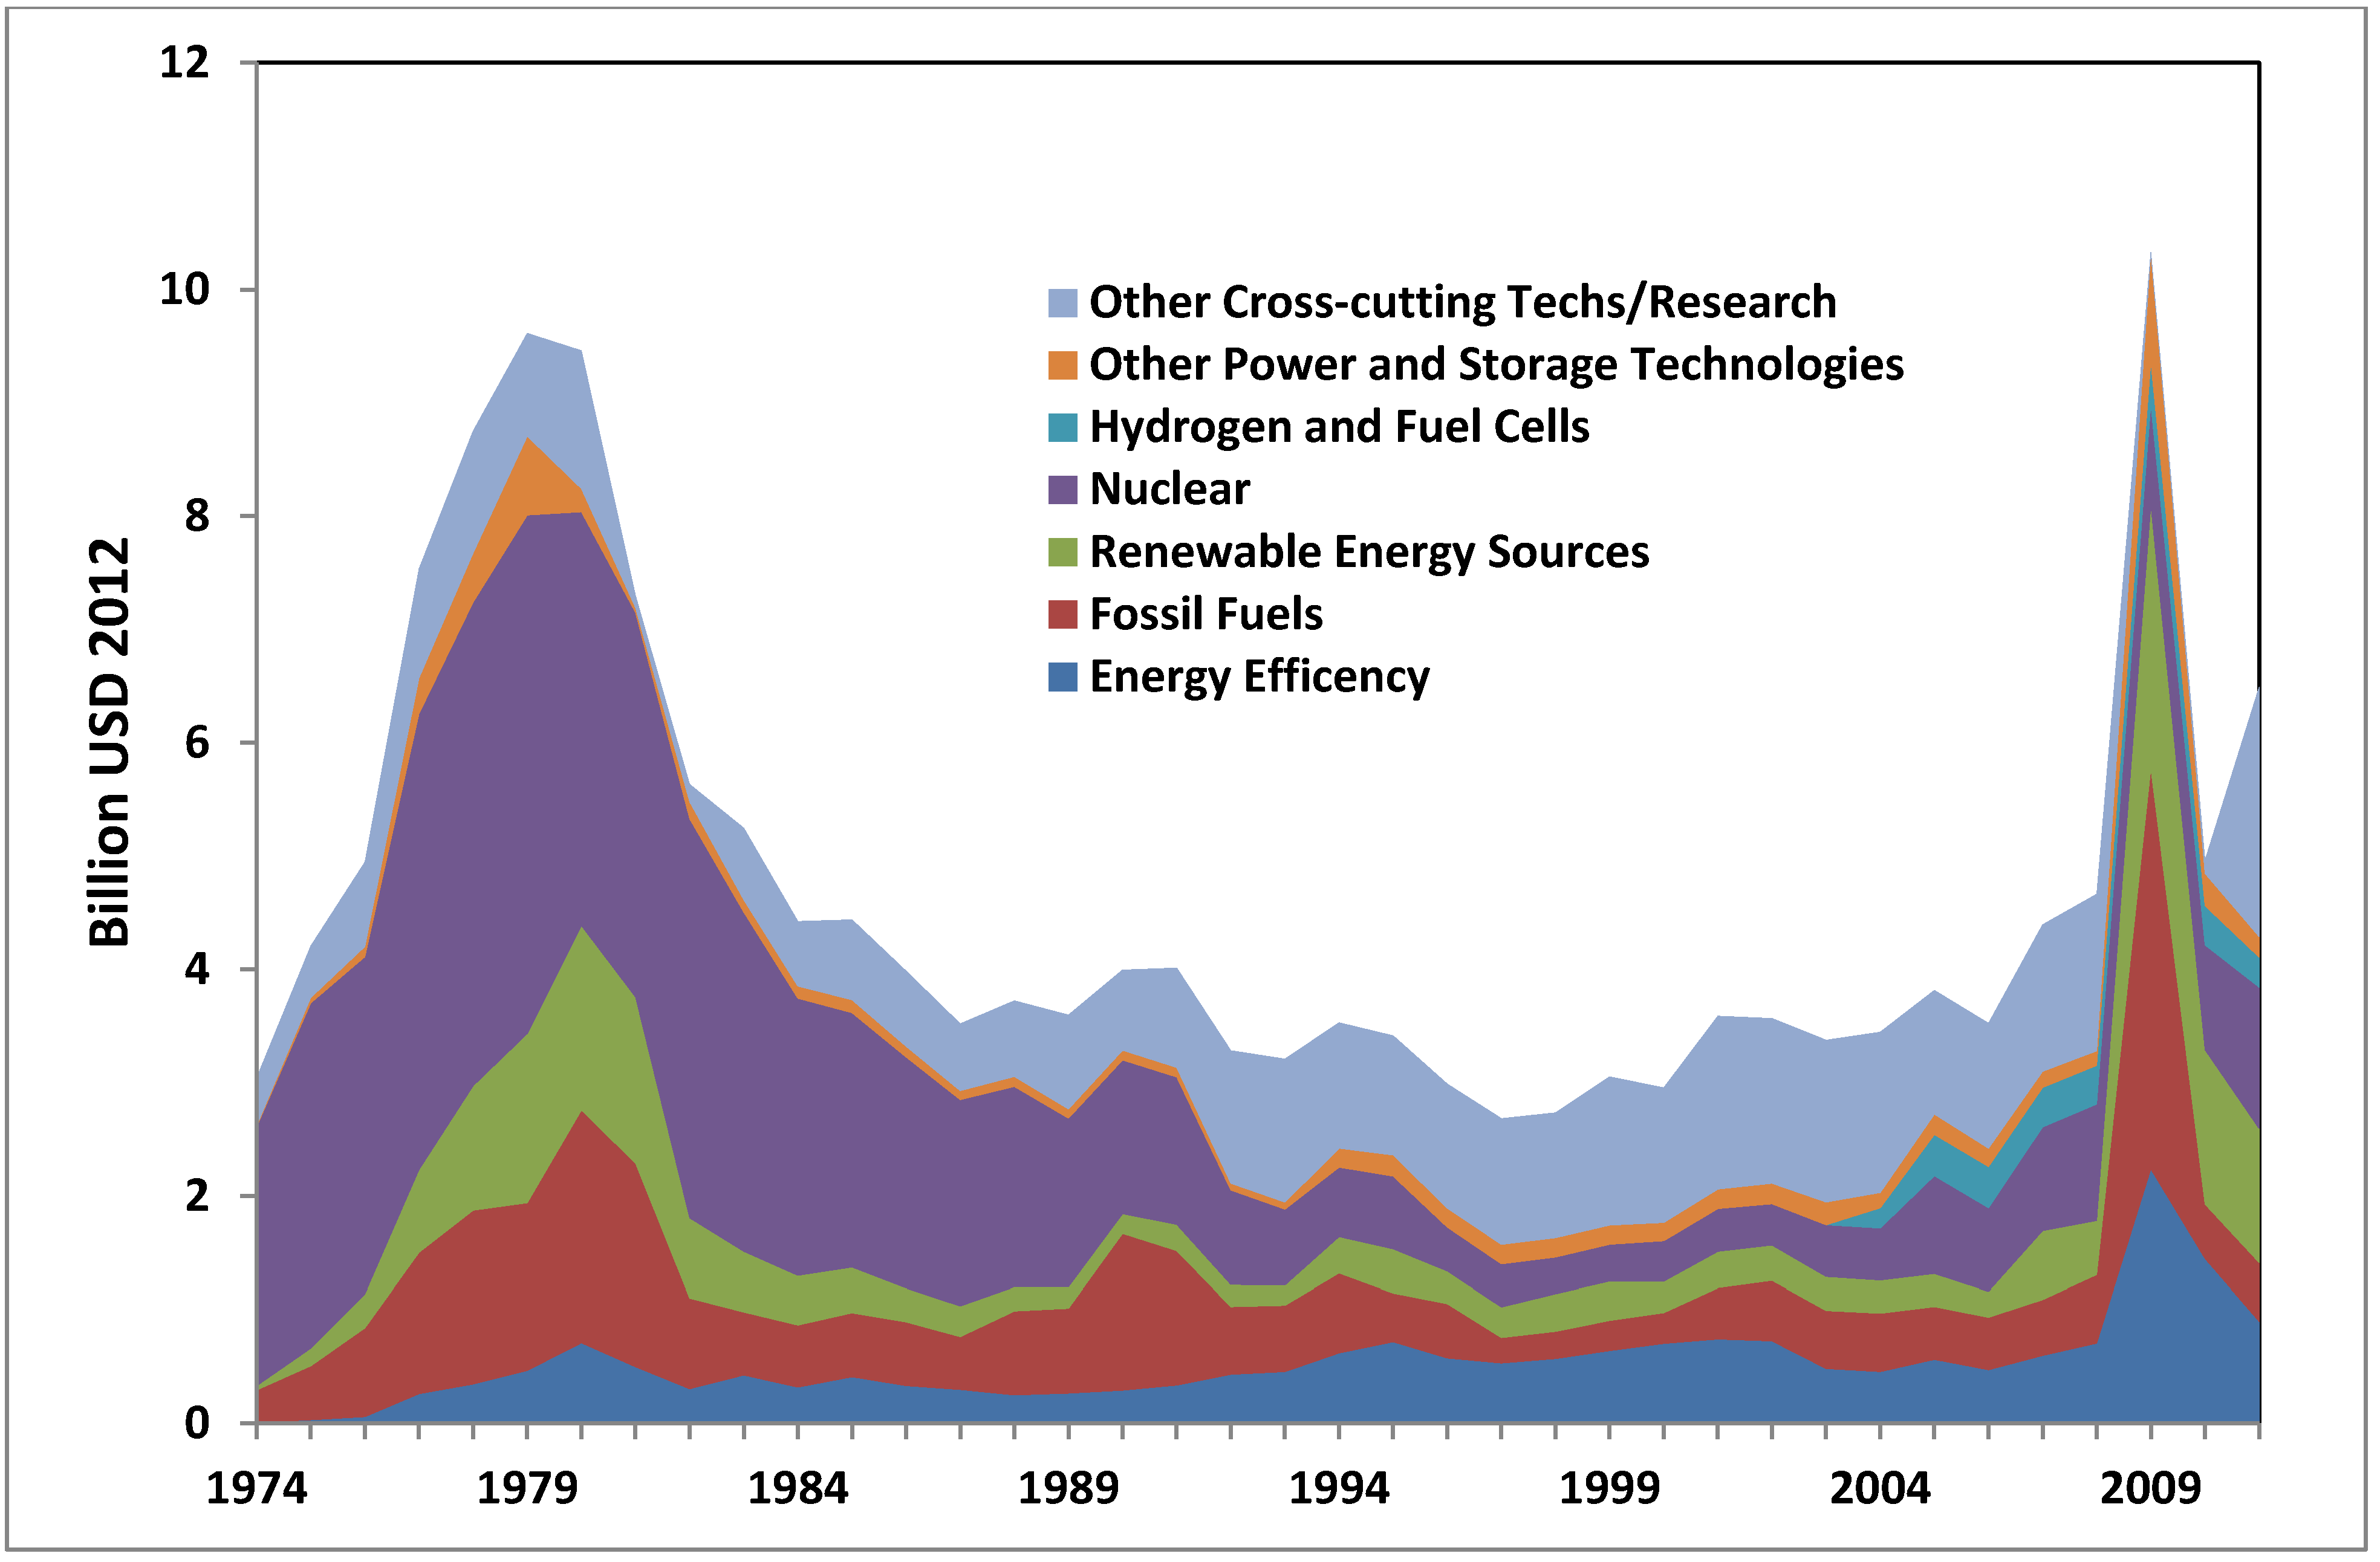
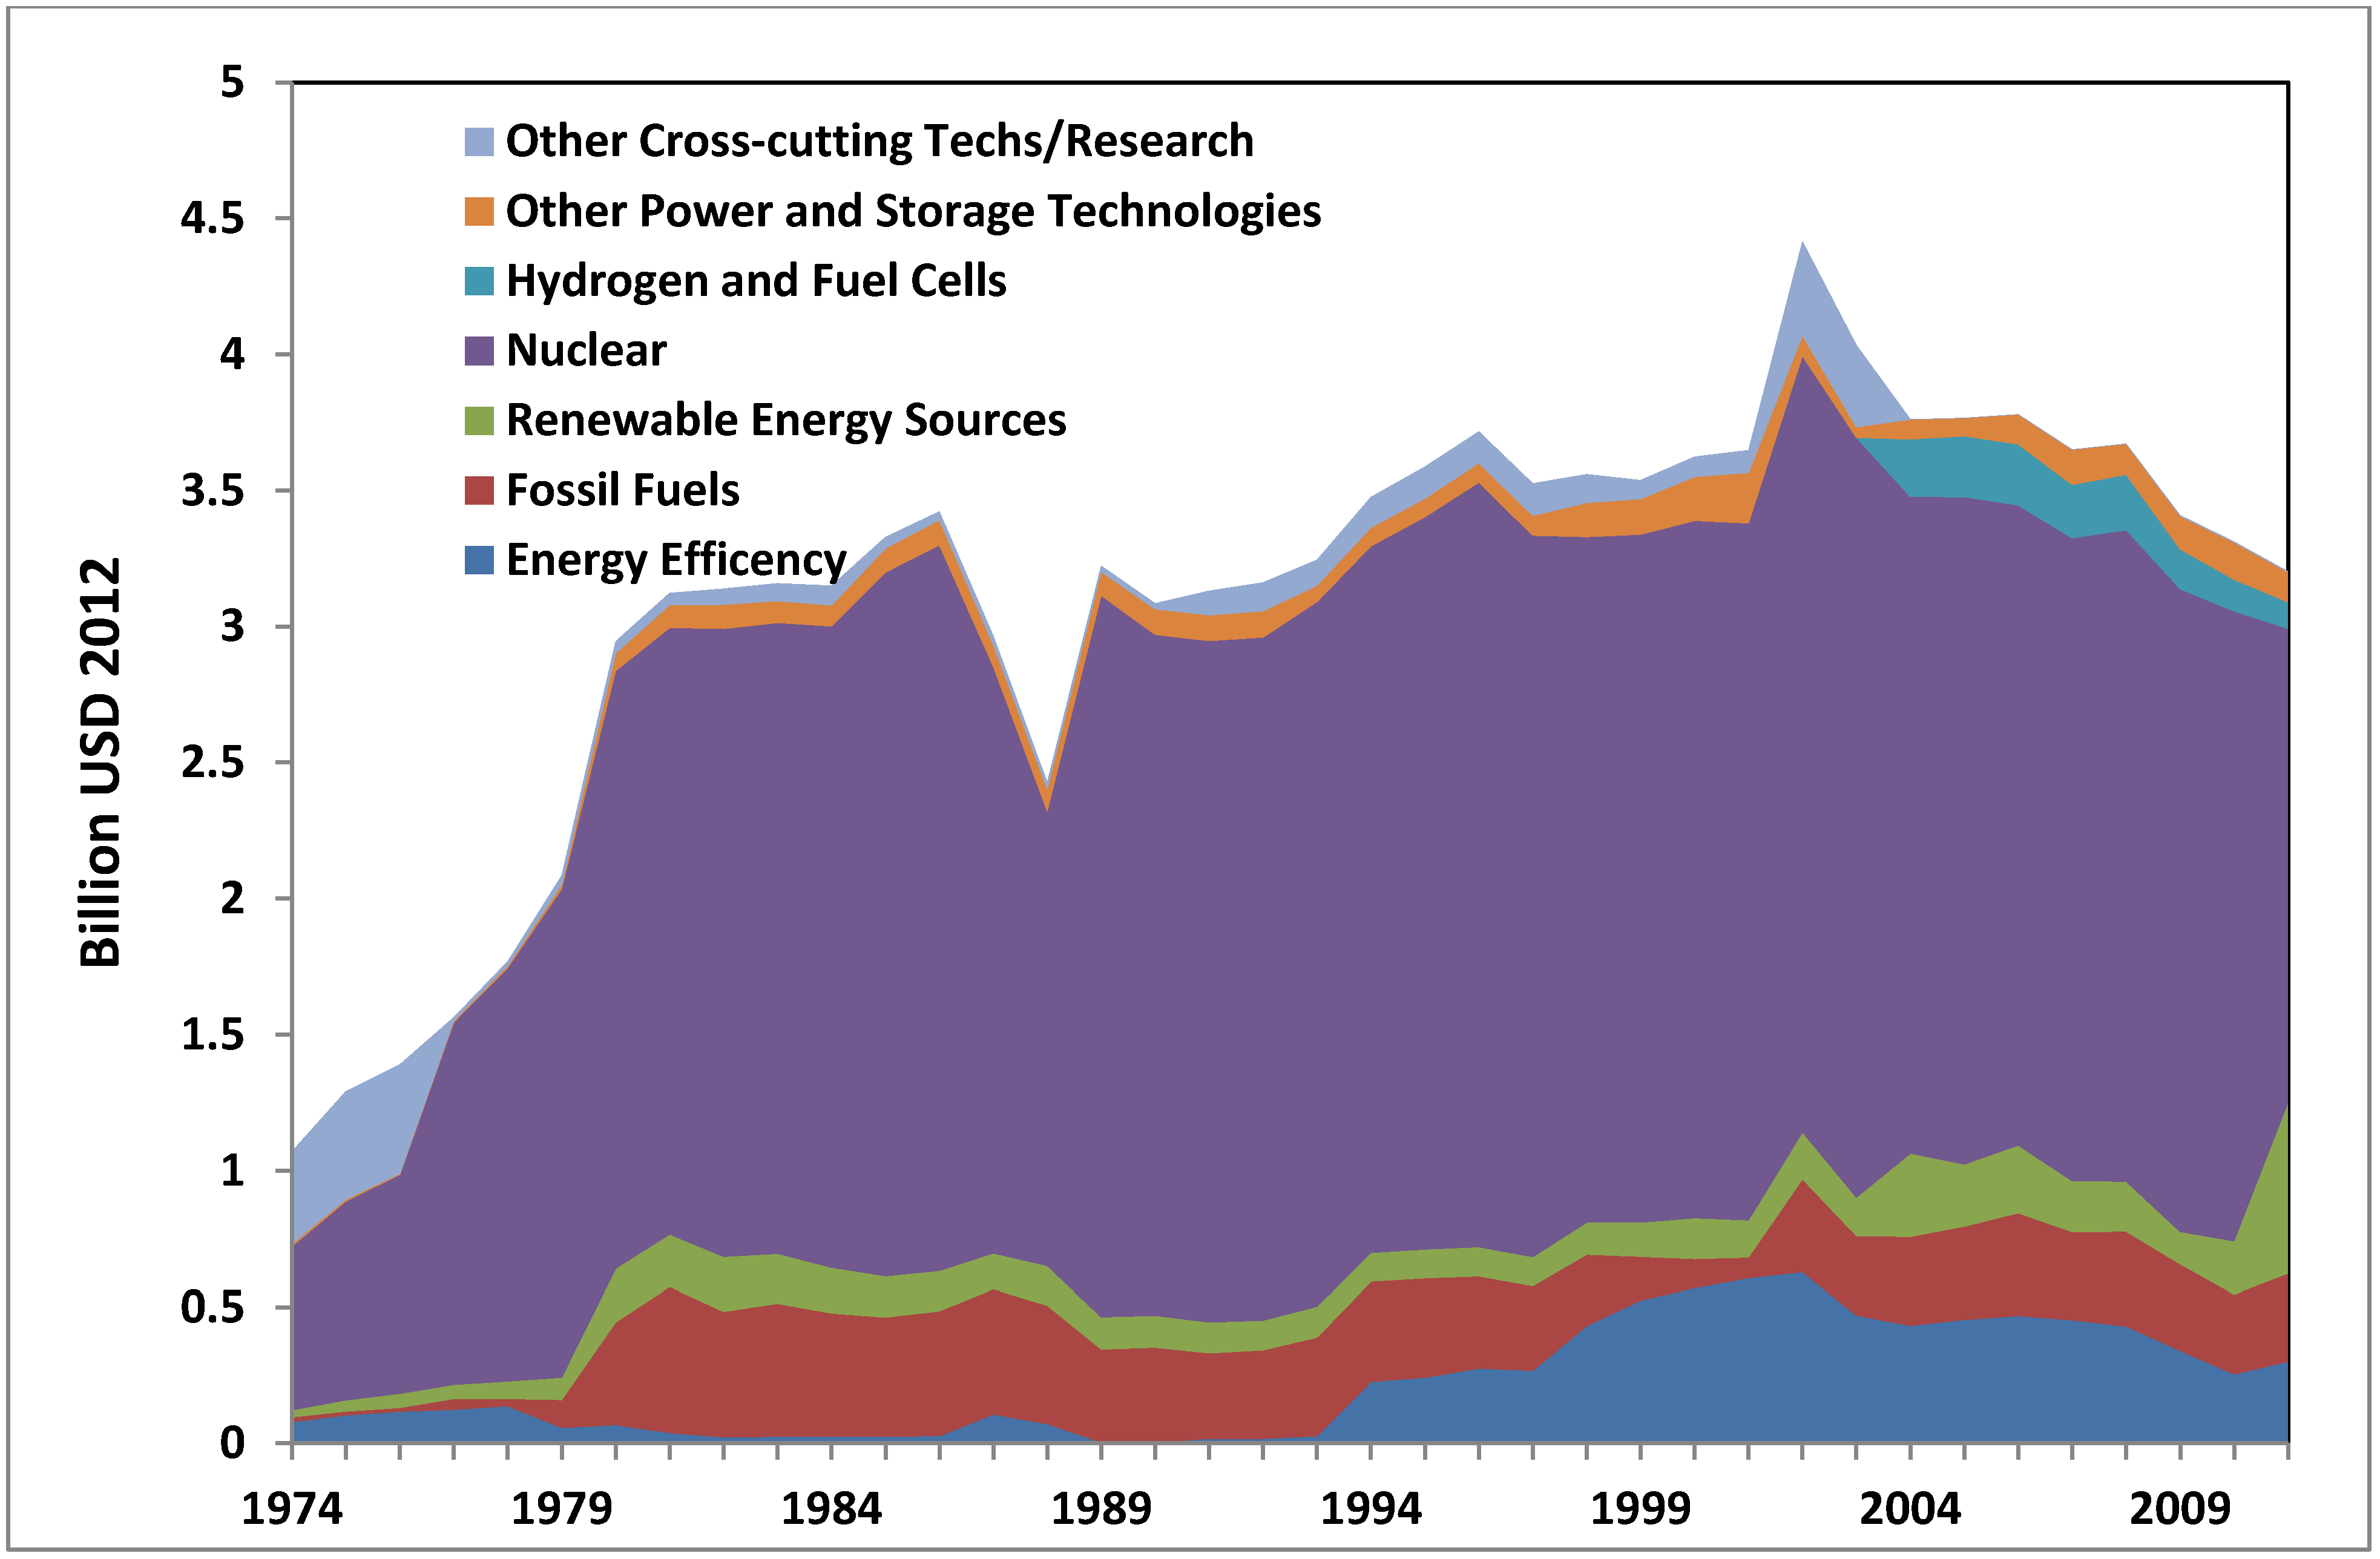
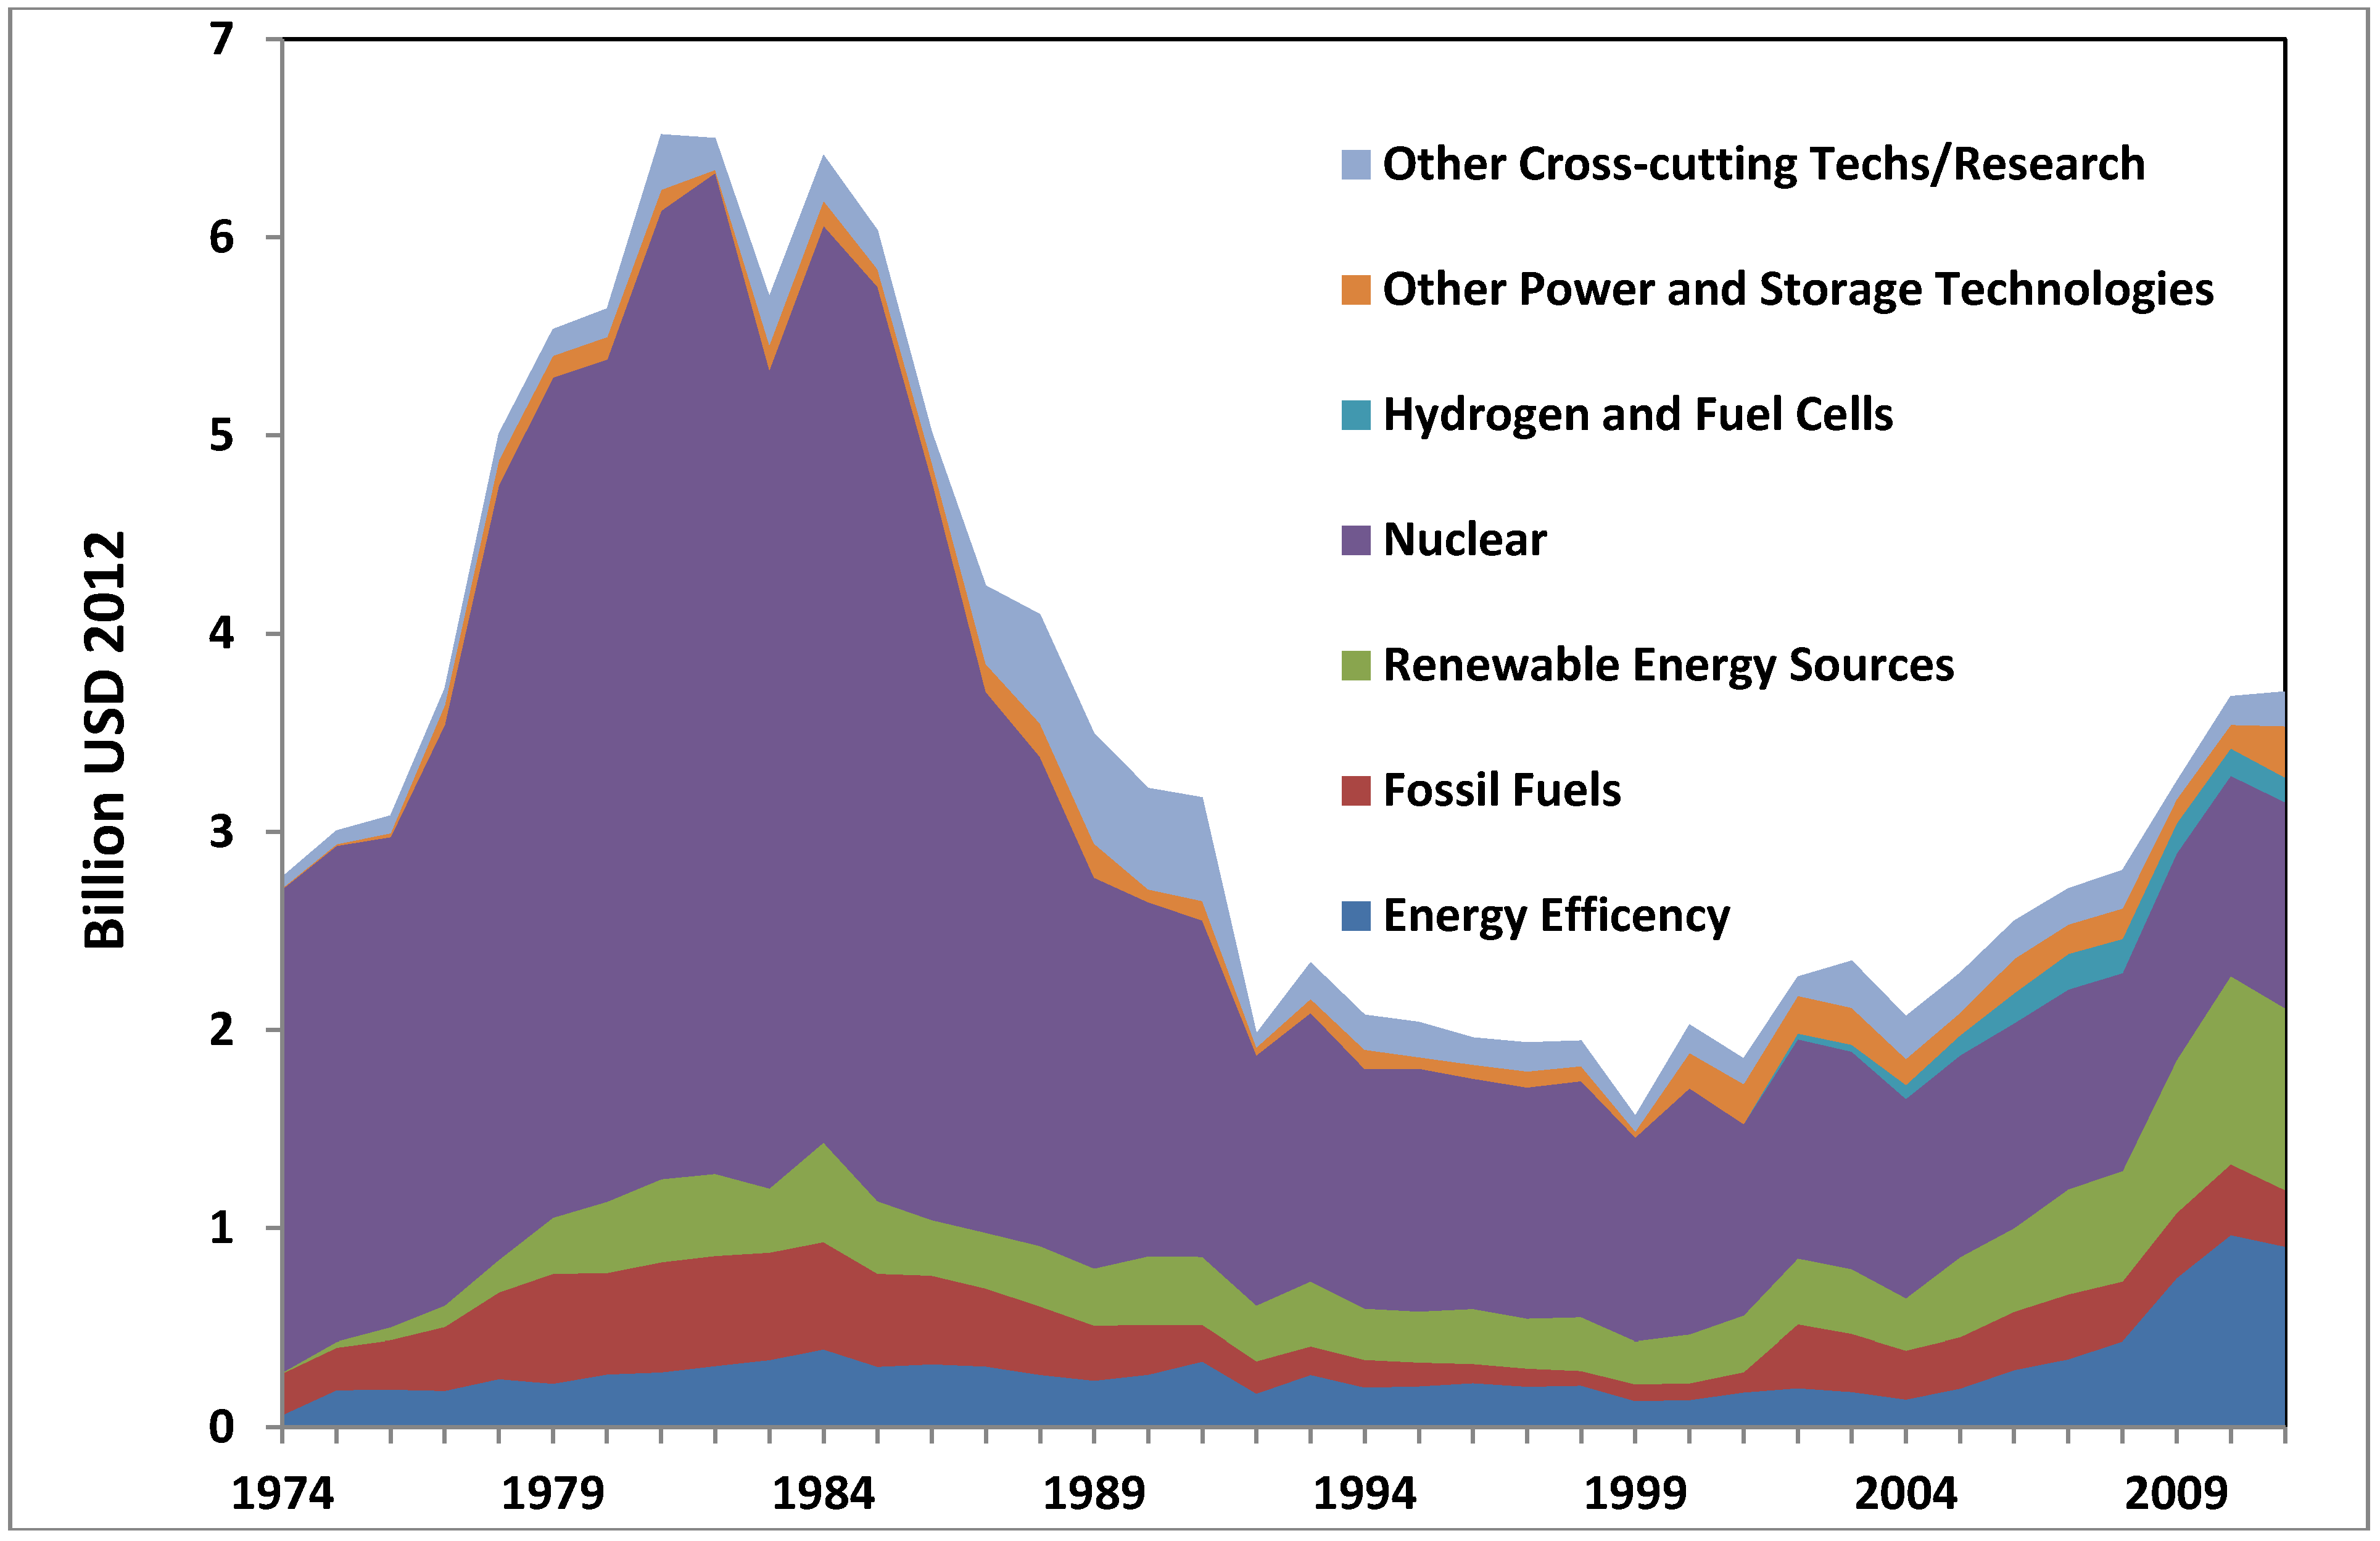
The figures for energy public RD&D in IEA member states are dominated by three regions: the US, Europe and Japan. The regional historical spend in public energy RD&D for these are detailed in Figure 7 (the European data covers the six largest funders of energy research: Germany, France, UK, Italy, Spain and The Netherlands. These were selected for the quality and continuity of their RD&D data. In 2011 these six countries covered 68% of EU/energy RD&D.). Figure 8, Figure 9 and Figure 10 present historical spend in each of the three regions by IEA technology grouping. The US Department of Energy (DOE) funds a large quantity of basic science and scientific facilities as part of its remit, accounting for much of the “Other” spend seen in Figure 8 [19].
Each of the three regions has had a significantly different spend profile. Japan, being heavily reliant on nuclear power due to a lack of indigenous fossil fuel resources, has a budget that is dominated by the nuclear sector. Japan funds an extensive programme of public spending on reactor design, maintenance and fuel reprocessing, as well as a substantial fusion programme. Europe’s profile has changed over the years, dominated by nuclear in the 1980s but becoming more balanced between renewables, efficiency and nuclear in the 2000s. The US has maintained a relatively balanced portfolio in recent years, but with a very high spend in 2009 due to the post-financial crisis stimulus package. Following high budgetary points in the late 1970s/early 1980s (for the US $9.6 billion in 1979, for Europe $6.5 billion in 1981) as a response to the 1970s energy crises, budgets for energy RD&D decreased rapidly and substantially over the 1980s in both the US and Europe. By 1992 budgets had decreased to $3.2 billion in the US and $2 billion in Europe. These reductions in public spending need to be seen in the context of sustained low oil prices, as shown in Figure 6, as well as liberalisation and privatisation in the energy sector. Japan’s budget for energy RD&D, on the contrary, remained fairly constant throughout this period at an average of approximately $3.2 billion.
As discussed in Section 2, the last decade has seen a step change in the policy measures deployed to mitigate climate change as well as steep rises in the price of oil driven by tightening supplies and increasing demand from developed nations. This has been associated with considerable increases and changes in the spend profile of public energy RD&D budgets. Table 3 shows the change in budget allocations for different research areas between 2000 and 2011. Global trends show a considerable increase across the board for budgets for renewable energy sources, fossil fuels, including carbon capture and storage (CCS) technology, and the hydrogen and fuel cell sector. There are also some interesting regional trends.
Figure 7.
Historic Public Energy RD&D Spend in the US, Japan and major European economies 1974–2011. [3].
Figure 7.
Historic Public Energy RD&D Spend in the US, Japan and major European economies 1974–2011. [3].

Figure 8.
Historic Public Energy Spend by Sector for the US 1974–2011 [3].
Figure 8.
Historic Public Energy Spend by Sector for the US 1974–2011 [3].

Figure 9.
Historic Public Energy Spend by Sector for Japan 1974–2011 [3].
Figure 9.
Historic Public Energy Spend by Sector for Japan 1974–2011 [3].

Figure 10.
Historic Public Energy Spend by Sector for the major European economies 1974–2011 [3].
Figure 10.
Historic Public Energy Spend by Sector for the major European economies 1974–2011 [3].

Table 3.
RD&D Budgets and percentage changes for research areas 2000–2011 [3].
| Research Area | US | Japan | Major European Economies | ||||||
|---|---|---|---|---|---|---|---|---|---|
| 2000 | 2011 | % Change | 2000 | 2011 | % Change | 2000 | 2011 | % Change | |
| 1. Energy Efficiency | 702 | 898 | 128 | 570 | 301 | −47 | 137 | 908 | 664 |
| 2. Fossil Fuels | 270 | 514 | 190 | 106 | 323 | 304 | 84 | 286 | 339 |
| 3. Renewable Energy Sources | 275 | 1182 | 430 | 150 | 627 | 418 | 244 | 918 | 376 |
| 4. Nuclear | 356 | 1248 | 351 | 2563 | 1742 | −32 | 1242 | 1039 | -16 |
| 5. Hydrogen and Fuel Cells | 0 | 265 | - | 0 | 97 | - | 0 | 124 | - |
| 6. Other Power and Storage Technologies | 161 | 182 | 113 | 162 | 110 | −32 | 178 | 258 | 145 |
| 7. Other Cross-cutting research | 1190 | 2200 | 185 | 74 | 2 | −97 | 142 | 174 | 123 |
| Total | 2955 | 6489 | 220 | 3624 | 3203 | −12 | 2021 | 3708 | 183 |
US budgets increased by the largest amount over the period, with a total increase of 220%. Note that the figures for 2011 do not cover the “spike” associated with the stimulus programme in 2009 when energy RD&D budgets totalled $10.3 billion. Only the US increased nuclear budgets over this period, with an increase of 351% between 2001 and 2011.
Japan has seen a small decrease of 12% in its total RD&D budget. The nuclear sector still remains the dominant segment of this budget with a total allocation of $1.7 billion in 2011. However this represents a 32% decrease in funding since 2000. This funding has been reallocated to diversify Japan’s portfolio into unconventional fossil fuels and CCS as well as renewable energy, with increases of 304% and 418% respectively. In stark contrast with the other two regions, energy efficiency research has dropped by almost half in Japan.
Total energy RD&D budgets for the major European economies during this period rose from $2 billion to $3.7 billion, with dramatic increases in renewable energy and energy efficiency. Budgets for renewable energy sources rose from $244 million in 2000 to $918 million in 2011, an increase of 376%. Budgets for energy efficiency expanded by 664% from $137 million in 2000 to $907 million in 2011. This rise for energy efficiency RD&D is by far the greatest seen across the three regions and. Europe is also investing heavily in CCS technology, fuelling a steep rise in fossil fuel research budgets.
These policy shifts and RD&D budgets have been associated with exponential growth in the deployment of renewable generation, chiefly wind and solar PV, over the last decade (Figure 11). Between 2004 and 2012, global wind power capacity grew 660% from an installed capacity of 48 GW in 2004 to 318 GW in 2012. Solar PV grew more strongly from a lower base, increasing 2600% from 3.9GW in 2004 to 102 GW in 2012. Capacity continued growing strongly throughout the financial crisis.
Overall, the picture of global public RD&D budgets is one of substantial and transformative change. Spending on renewable generation technologies and energy efficiency has increased rapidly and greatly, while spending on hydrogen, fuel cells and energy storage technologies has likewise increased. Public RD&D associated with CCS technology has driven steep rises in the fossil fuel sector, especially in Europe. Total public energy RD&D efforts have approximately doubled in the US and Europe even through a time of financial crisis. This suggests that policymakers see energy as a critical issue and RD&D as an important use of public funds. This all adds up into a picture of public innovation effort, an attempt to shift the established paradigm of the energy system towards diversified, low-carbon supply and high levels of efficiency.

5.2. Private Sector Energy R&D Patterns
The availability of data on private sector energy R&D is less than that for the public sector. This section relies on the EU Industrial R&D Scoreboard [2] which covers a panel of between 1200 and 1500 global companies, depending on year, with the largest R&D spend. The data is gathered by assessing annual reports and other corporate information in the public domain. We have used the data to produce a snapshot of expenditure patterns in 2011 and have derived indicative trends for the period 2004–2012. Although this data is extensive, it has limitations:
- (a)
- While the scoreboard has been published annually since 2004, referring to data in the previous year, the composition of the panel has changed. The number of companies covered has risen, from 1000 in the 2003 survey published in 2004 to 2000 in the 2009 survey published in 2010. Until 2010, the scoreboard covered equal numbers of EU and non-EU companies. Since 2011, a single panel covering both EU and non-EU companies has been used.
- (b)
- It is difficult to attribute all relevant R&D activity specifically to energy. The scoreboard identifies separately: oil and gas producers; oil equipment, services and distribution; electricity; gas, water and multi-utilities; and alternative energy. However, much energy R&D takes place in the electronic and electrical equipment sector and in general industrials (e.g., Siemens, General Electric) which cover products, e.g., transport equipment, extending beyond energy. R&D relevant to energy demand is particularly hard to attribute since it is embedded in wider R&D efforts in sectors such as automobiles and construction. Toyota, for example, is the world’s largest investor in R&D (over $10 billion in 2011). Manufacturers of appliances and electronic equipment are very R&D intensive (spending over 5% of revenue) and the total R&D expenditure of $50 billion vastly exceeds the $3 billion spent on energy efficiency RD&D by the public sector in IEA countries.
In addition, it should be noted that public sector data focuses on budgets rather than actual spend and includes demonstration activities which are not covered by the R&D scoreboard. Despite these limitations, the data highlights striking differences between patterns of research activity in the public and private sectors.
Table 4 shows that global spend on identifiable energy R&D spend in the 2000 top R&D companies in 2012 was $21.6 billion, $14.1 billion of which was in OECD countries. The pattern of spend across sectors contrasts heavily with that for the public sector. For example, $15.8 billion of private sector spend is associated with oil and gas activities. This represents 0.3% of sales revenue and is a factor of five higher than all public RD&D on fossil fuels (which largely focuses on coal and CCS). $6.4 billion of this spend is associated with OECD-based producers and $3.6 billion of that is from four companies (BP, Chevron, ExxonMobil and Shell) based in the US or the UK. The UK and the US report negligible public spend on non-CCS oil and gas related RD&D. This OECD spend is matched by a group of oil and gas companies based in non-OECD economies, notably PetroChina, Brasiliero and Gazprom.
Table 4.
Industry Energy R&D Spend among the 2000 Top R&D Companies 2012 ($ billion) [2].
| Sector | OECD | Non-OECD | Total |
|---|---|---|---|
| Oil & gas producers | 6.4 | 6.1 | 12.5 |
| Oil equipment, services & distribution | 2.6 | 0.3 | 2.9 |
| Electricity | 2.9 | 0.6 | 3.5 |
| Gas, water & multi-utilities | 1.4 | 0.1 | 1.5 |
| Alternative energy | 0.8 | 0.0 | 0.8 |
The strong role of the private sector is associated with the unique role of oil within energy markets. During the 1970s, there was a strong drive to substitute oil with alternative fuels where this was technically and economically feasible. This substitution took place autonomously through higher prices and market pressures and through policy drivers associated with the reduction of import dependence. Nuclear and coal (and later natural gas) replaced oil in electricity generation while coal and gas substituted for oil in industry. Oil enjoys a huge advantage in transport markets as a result of its high energy density and ease of storage. In 2011, 45% of oil used for energy purposes in IEA countries went to transport compared to 77% in 1974.
The $3.5 billion spend in the electricity sector is highly concentrated. EDF (Électricité de France) and Areva, both French companies, plus Korea Electric Power account for just under half the spend, much of it devoted to nuclear R&D. Public sector and industrial R&D spend in the nuclear arena are broadly equal. Electricity companies spend 0.5% of their revenue on R&D.
“Alternative energy” R&D aligns fairly well with public RD&D on “renewable energy” and hydrogen and fuel cells. Private sector R&D spend on alternative energy was $0.8 billion in 2012. Being less mature, most forms of alternative energy cannot yet compete with traditional forms of energy. Alternative technologies that have already achieved widespread deployment, such as wind and PV, have received the greatest support from business. Support has come not from traditional energy companies but from specialised companies (e.g., Vestas) and diversified engineering companies. For alternative energy, the public sector has been the major driver.
Trends in private sector R&D spend are harder to infer. The EU scoreboard used equal sized EU and non-EU panels up to 2010 with the R&D spend being generally lower in the EU panel. The following paragraphs and Figure 12 and Figure 13 are based on a slightly smaller, but consistent, panel derived by including only companies spending more than $76 m2012 on R&D annually in both the EU and non-EU panels. While this neglects the possibility that the balance of R&D effort between larger and smaller companies may have been shifting, it does provide a broad indicator of trends.
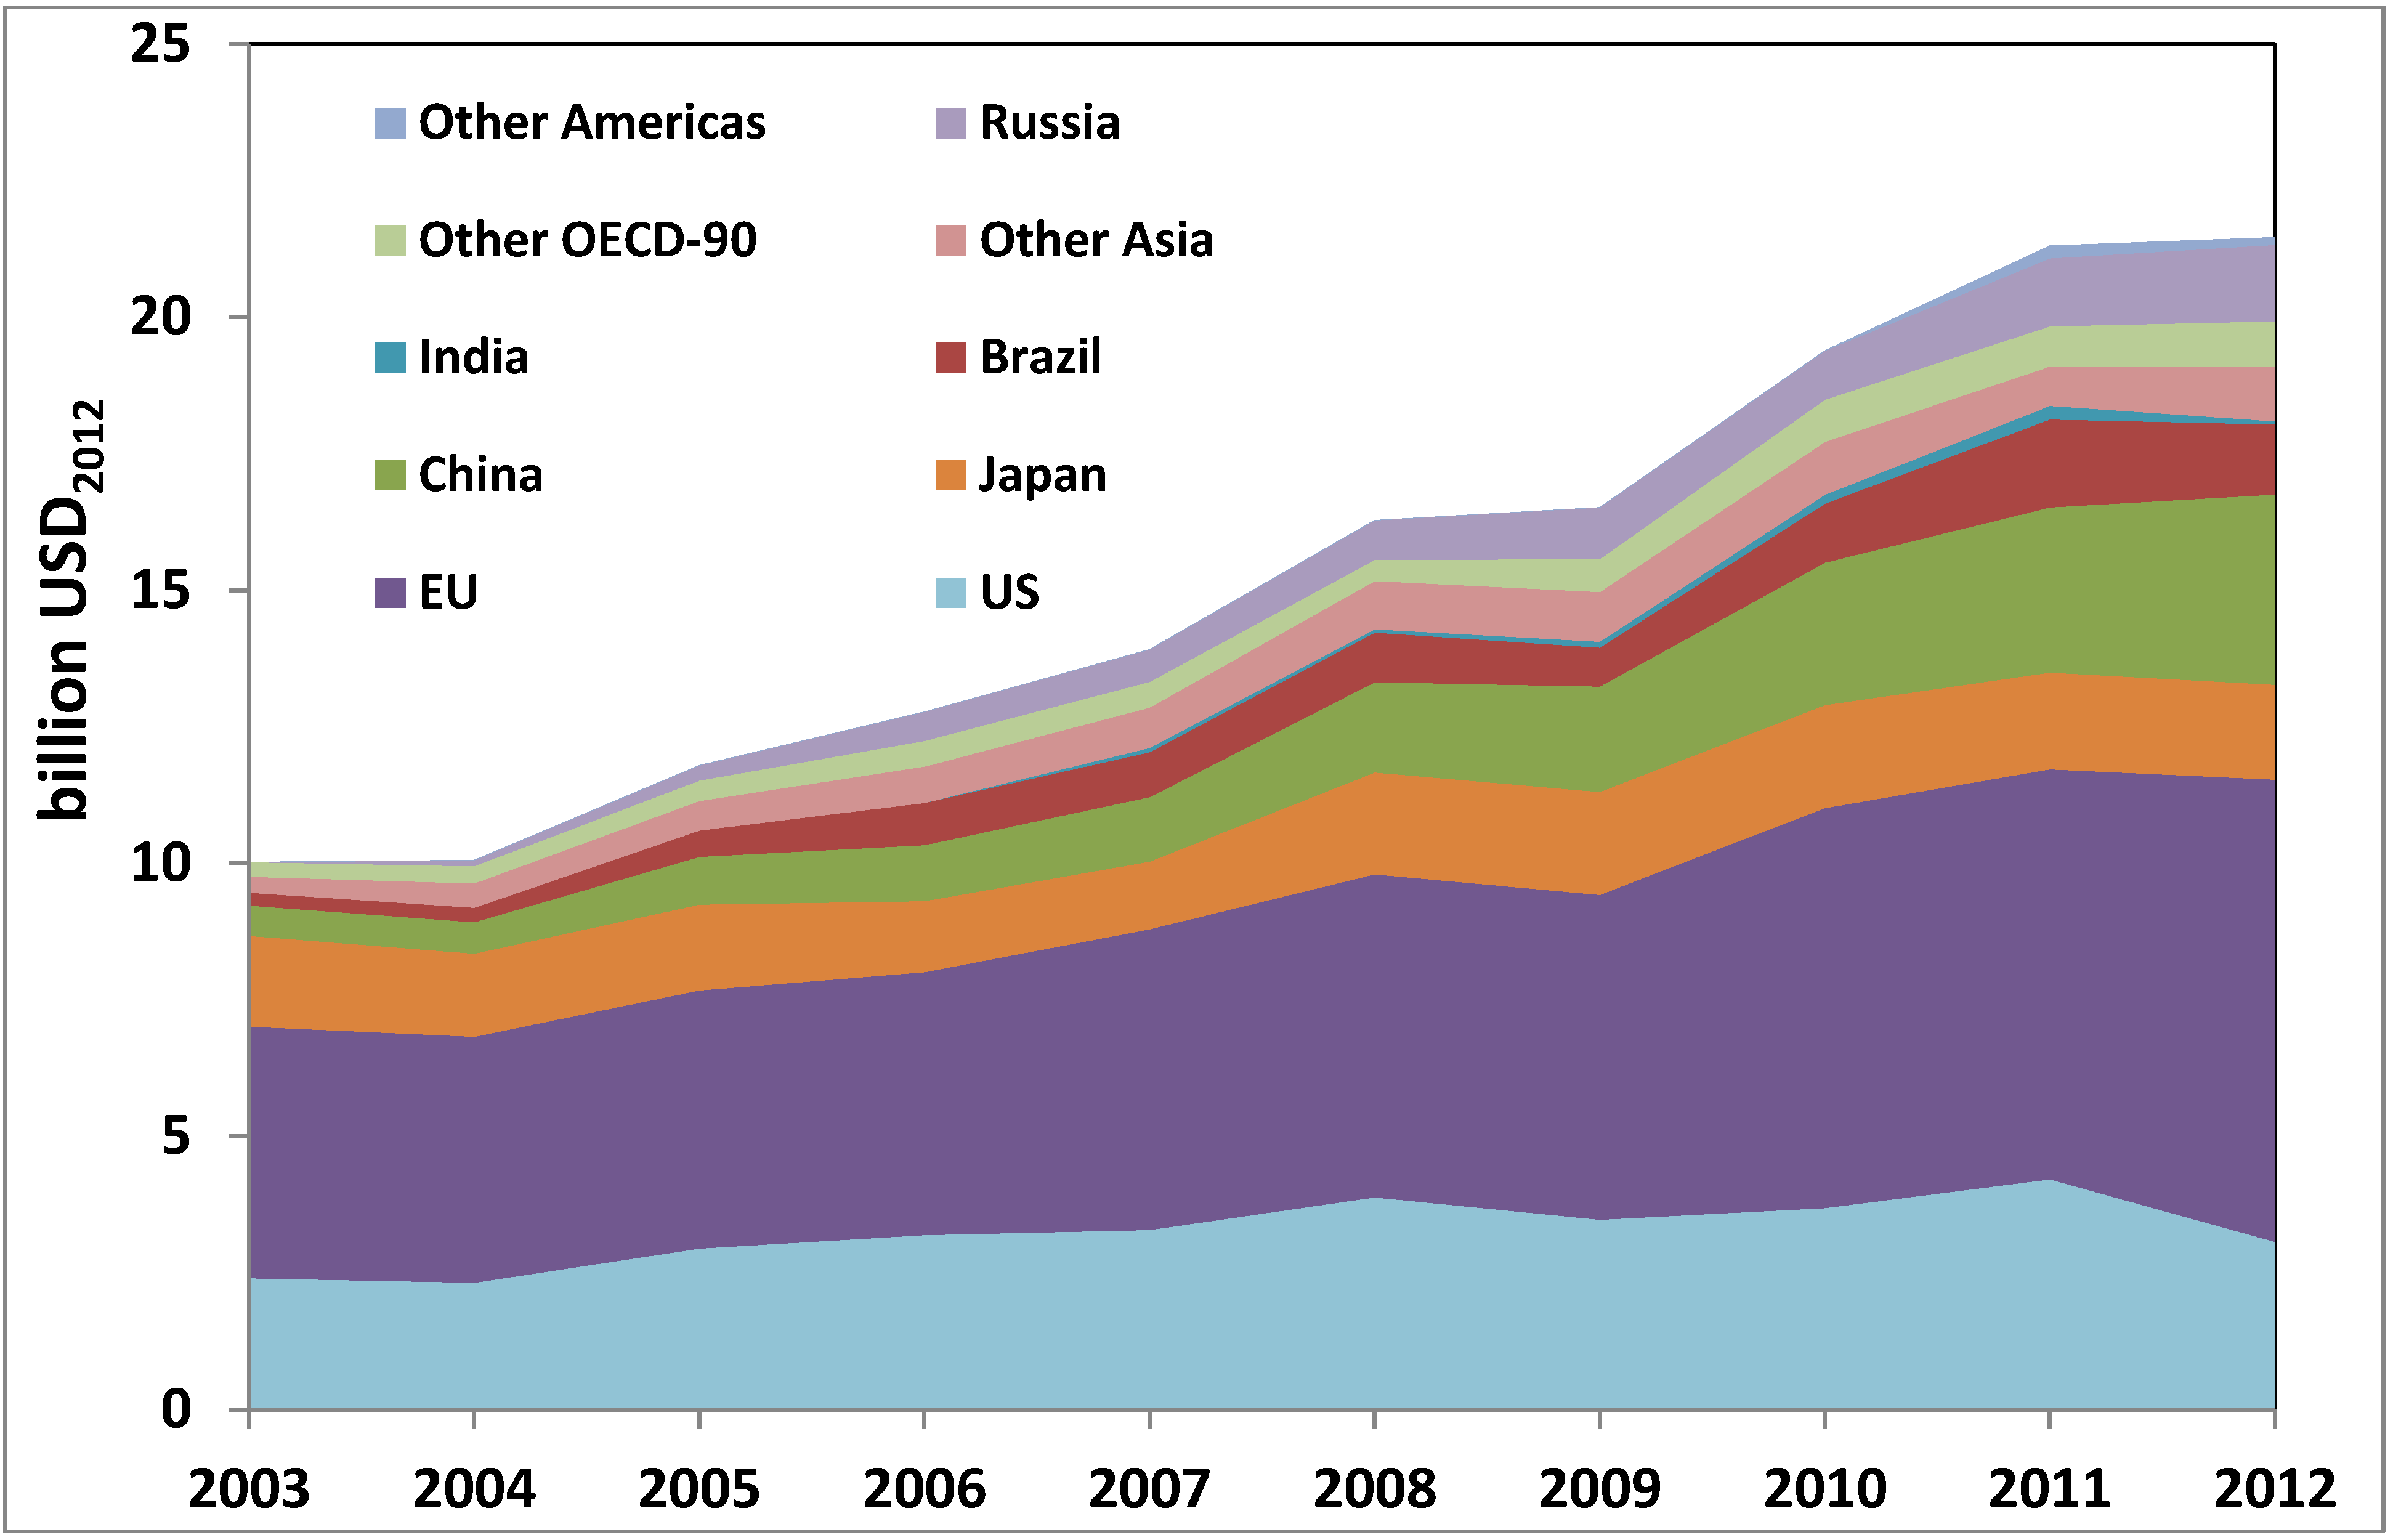
On this basis, private sector energy R&D spend more than doubled from $10.1 billion in 2003 to $21.6 billion in 2012 (Figure 12). Private sector spend has been static in Japan, but has grown in other regions. The US spend grew from $2.4 billion in 2003 to $4.2 billion in 2012, a 75% increase, before declining by more than a quarter in 2012. Spend in the EU region grew from $4.6 billion in 2003 to $8.5 billion in 2012, an 84% increase. By far the greatest increase was in China, which recorded a 527% increase from $0.6 billion in 2003 to $3.5 billion in 2012. The 2008 financial crisis arrested growth in 2009, but spend profiles recovered in 2010 and 2011. However, the aggregate spend stabilised in 2012, with growth in the EU and China compensated by falls in the US and Brazil.
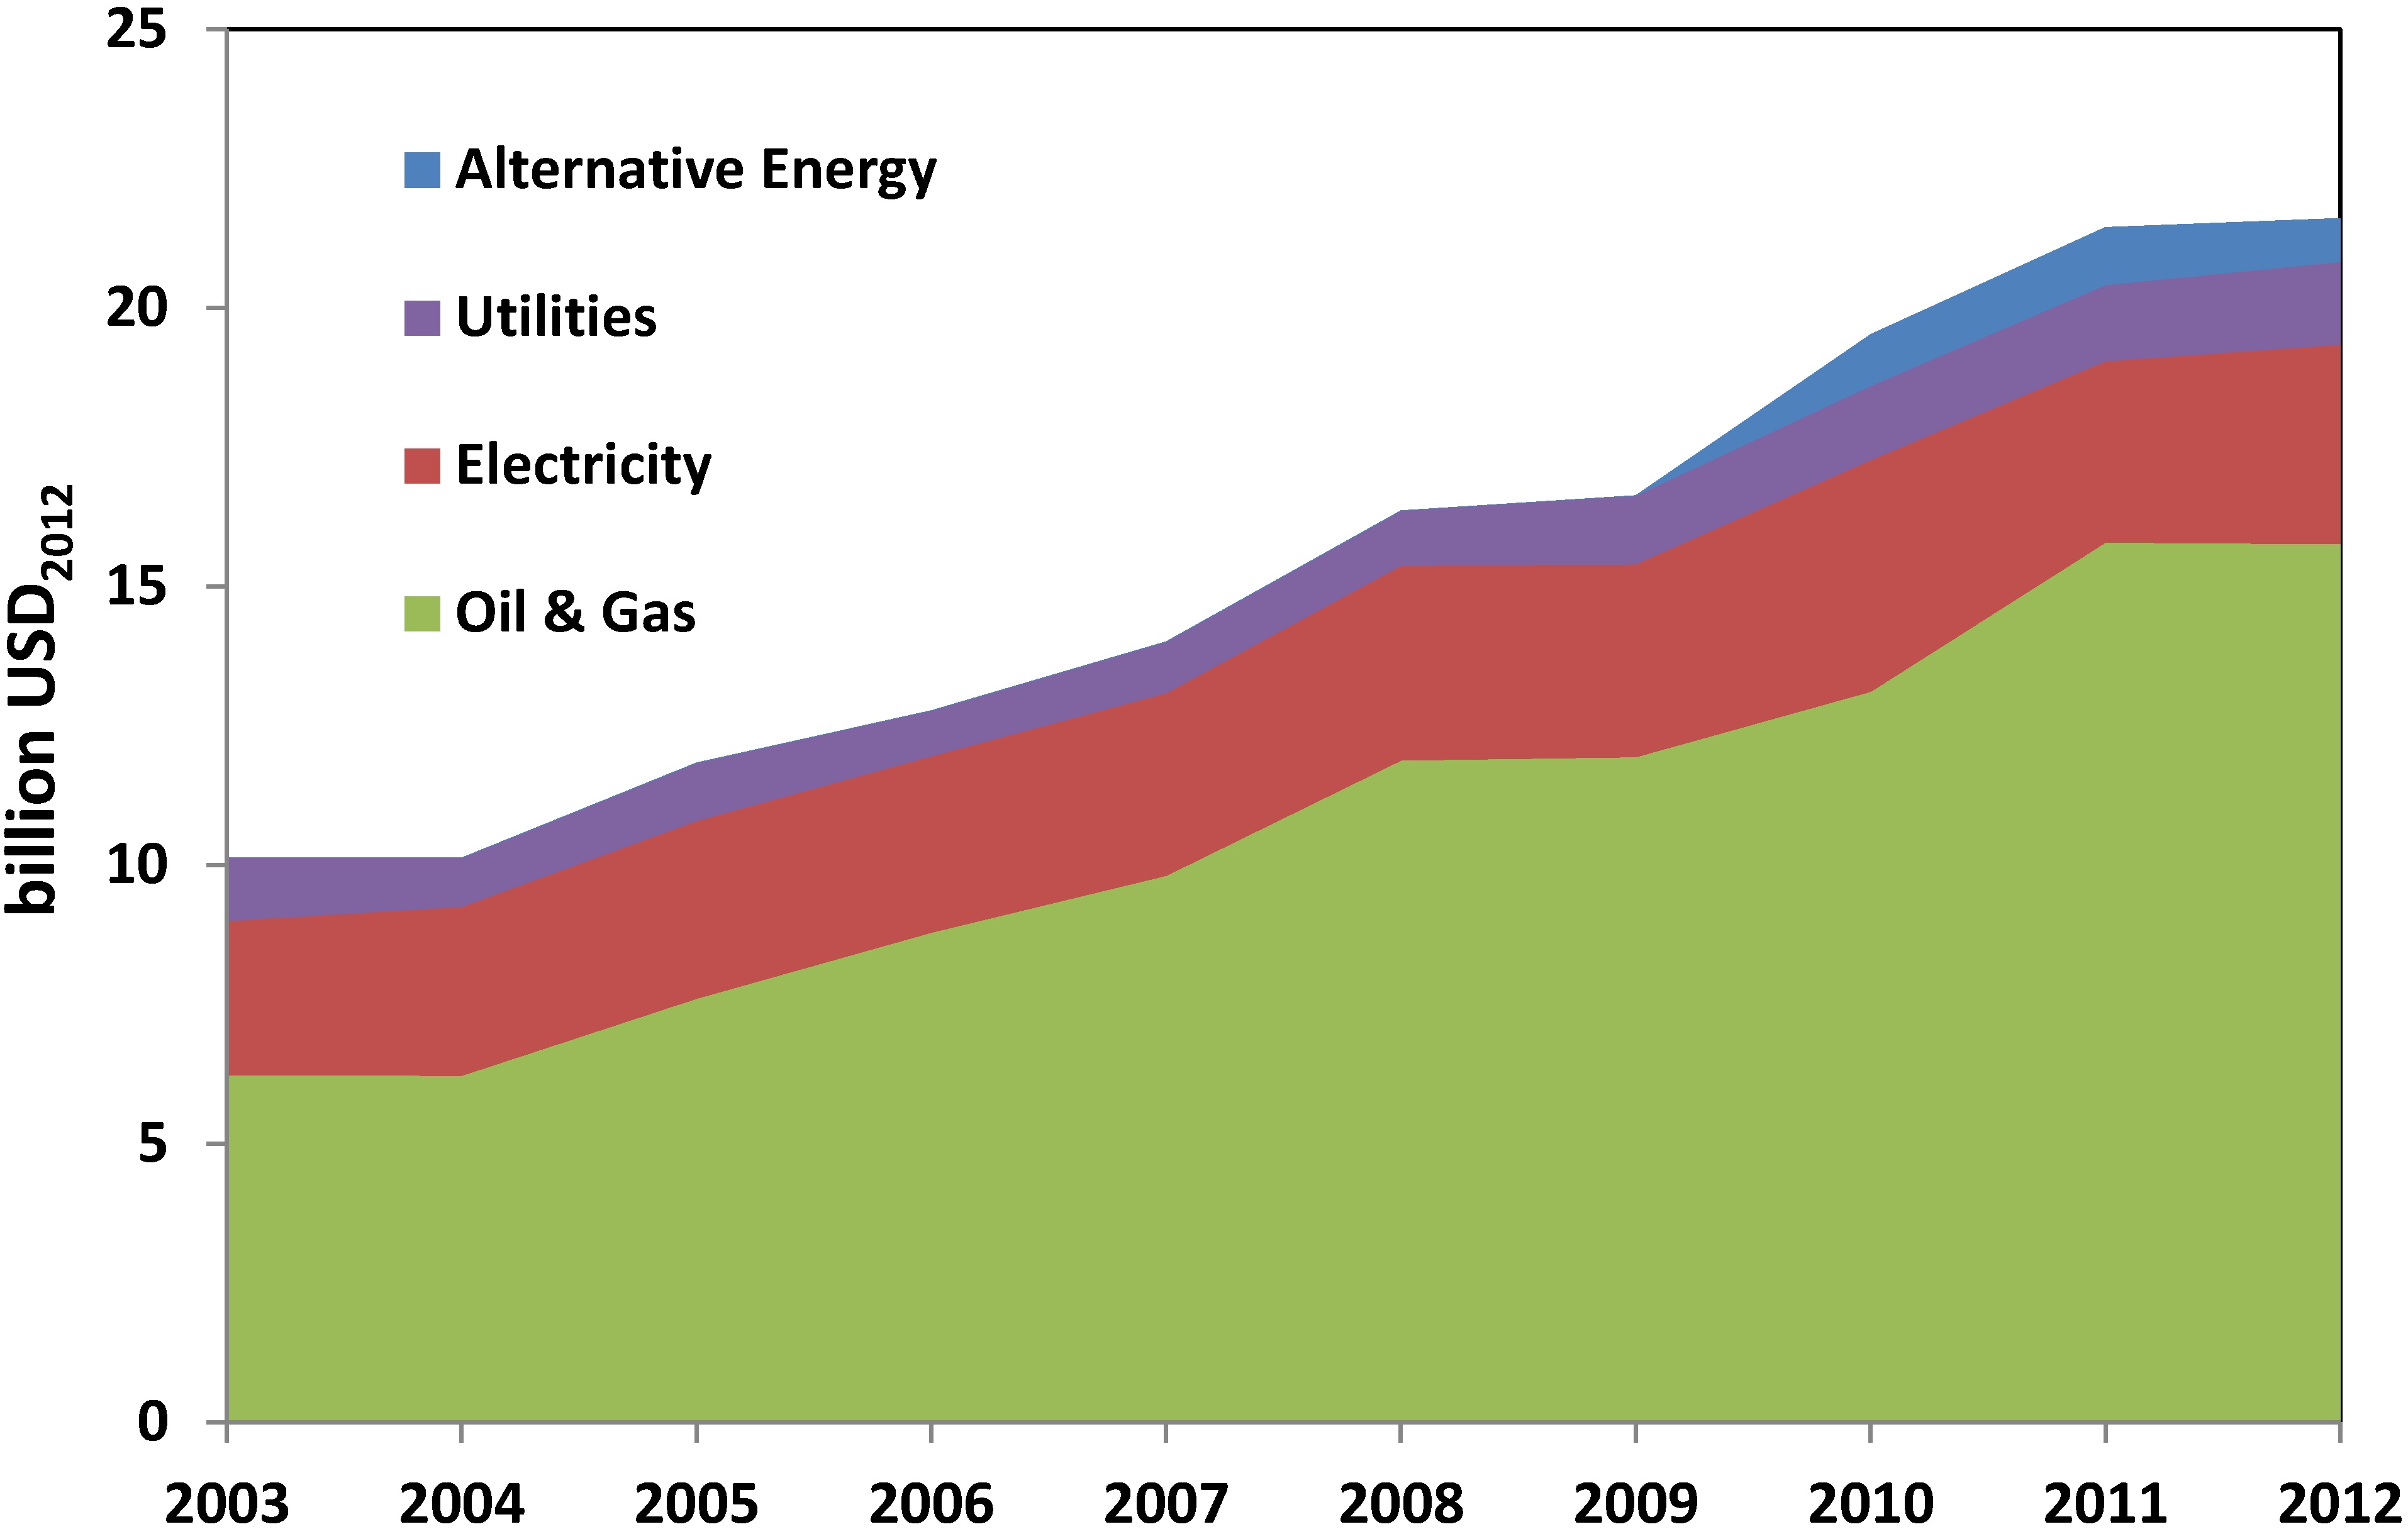
Figure 13 breaks down spend over the 2003–2012 period by sector. Spend was static in the electricity and other utility sectors, but there was a very large increase in oil and gas R&D spend, rising from $6.2 billion in 2003 to $15.8 billion in 2012, an increase of 255%.
As discussed more fully in the following section, patterns of R&D spend strongly suggest that the private sector focus is on extending the resource base and reinforcing the current energy paradigm while the public sector focus is on technologies that will break the existing paradigm in response to wider policy drivers.
Figure 12.
Private sector energy R&D spend over the period 2003–2012, by region [2]. (Includes only companies spending more than $76 m2012 annually on R&D.)
Figure 12.
Private sector energy R&D spend over the period 2003–2012, by region [2]. (Includes only companies spending more than $76 m2012 annually on R&D.)

Figure 13.
Industry energy R&D spend over the period 2003–2012, by sector [2]. (Includes only companies spending more than $76 m2012 annually on R&D.)
Figure 13.
Industry energy R&D spend over the period 2003–2012, by sector [2]. (Includes only companies spending more than $76 m2012 annually on R&D.)

6. Discussion
The previous sections have described the policy and scientific drivers currently spurring energy innovation, as well as contrasting several scenarios from the public and private sectors with divergent views of the global energy future. The same tension regarding energy futures can be seen in the comparison of public and private sector RD&D spend patterns as reflected in dramatically different technological priorities and resource spend. Through the lens of innovation studies, this can be considered as a classic scenario following the historical pattern of a technological paradigm shift. When a traditional technological regime is threatened by transformative innovations, actors invested in the original regime can respond by driving innovation efforts that improve and strengthen the existing paradigm [36]. For instance, sailing ship technology improved in response to the rise of steam-powered ships in the 19th century. The response of LCD display manufacturers to the development of organic light-emitting diode (OLED) displays provides a contemporary example.
When seen through this lens, public policy concerns on energy security and climate change can be interpreted as driving investment into transformative low-carbon technologies, whereas private sector energy actors broadly conduct R&D that reinforces the existing energy paradigm by exploiting new and unconventional fossil fuel resources and reducing the costs of utilising existing sources. It can be argued that some technologies, such as carbon capture and storage (CCS), help to “bridge” this gap by enabling a low-carbon way to utilise existing fossil fuel resources. Developments such as the shale gas revolution seen in the US could also help to ease policy pressures by reducing concerns around energy security and affordability, and could reduce greenhouse gas emissions in countries heavily reliant on coal-fired electricity generation.
The difference between private and public sector R&D investment patterns is largely reflected in contrasting scenarios of the global energy future (Section 4). These show substantive differences in energy demand, GHG (Greenhouse Gases) emissions, and the mix of primary energy sources between the IEA 2DS scenario, a normative scenario which aims to meet the objective of keeping global temperature rises below 2 °C, and the energy company outlooks, which reflect the extrapolation of current social and economic trends. Although most of the low-carbon technologies deployed at scale in the 2DS scenario appear in the energy company outlooks, they are deployed later in time and to a lesser extent. This suggests that public R&D efforts will not necessarily lead to “stranded” technological assets in the event the global energy future is closer to private sector predictions. However, it does raise the question as to whether public sector funds are being spent in the most effective and cost-effective manner.
There is disagreement in the academic literature as how to develop the most optimal strategy for innovation in the energy sector. One view is that, due to the long lead times from basic research to deployment, high capital costs and long payback periods for investors of many new energy technologies, there is a significant “valley of death” in the development of new energy technologies in which sufficient private finance to continue commercialisation is difficult to obtain, stifling innovation. Addressing this challenge would entail targeted support from the public sector to sustain the development of promising new technologies through this gap, allowing experience to be built up from “learning-by-doing”, and allowing economies of scale for new technologies to be more easily achieved [37]. The view that the public sector plays an essential role in providing long-term funding for new technologies, assuming much of the risk of developing new sectors, is gaining ground outside the energy innovation debate [38]. The alternative view is that the public sector should not try to “pick winners”, and should therefore put in place policies designed to achieve government aims and targets in a technology-neutral way. A tax on carbon emissions is an example of a technology-neutral policy. Under this view, governments should provide greater funding for general early-stage R&D, with the private sector better placed to identify promising technologies and develop these further [39].
7. Conclusions and Further Questions
This paper has used a range of public and private sector data to test the hypothesis that the energy sector is currently seeing a pace of innovative activity unseen since the late 1970s. In this light, fundamental divergences in view over the future development of the global energy system can be seen as part of a dynamic reinforcing higher levels of effort. The current state of the energy sector, in a state of tension between two diverging viewpoints of a public policy-led transformative effort and reinforcing efforts led by the private sector, provides an interesting opportunity to investigate how urgent public policy concerns affect the development and commercialisation of new technological solutions.
Current developments in energy innovation suggest a rich research agenda for both innovation scholars and those with an applied research interest in energy policy. Within an overarching narrative about system transformation and reinforcement of the existing paradigm, there is scope to study, inter alia: innovation systems for different types of technology in terms of degrees of innovation, the engineering scale of technologies (from complex systems to commodity products); systemic technologies (e.g., smart grids); organisation and priority-setting processes for public sector innovation in different countries and jurisdictions; and the structure of transnational innovation systems characterised by the operations of global companies and the mobility of human capital. Further work to establish the theory of a strong technology push in this area would include the analysis of returns on investment in R&D in the private sector, both in a commercial sense and by utilising other metrics such as market penetration or energy efficiency improvements and whether these returns are increasing or decreasing with time. Data to answer this question would be very difficult to obtain, but if possible it would be a rewarding avenue of study.
This paper has also not discussed the role of the public sectors emerging economies such as China, India and Brazil due to the absence of relevant data. This is however an important part of the debate, given the large and increasing role these countries are playing in the global energy system. Further work in this area to assess the extent of the role these emerging economies are playing in the innovation process would be of considerable interest.
Acknowledgments
The authors would like to thank Iris Kammerer for assistance in preparing the datasets and figures and the reviewers and editors for their helpful and constructive comments.
This research was funded by the UK Engineering and Physical Sciences Research Council (EPSRC) under grant EP/K00154X/1.
Author Contributions
Aidan Rhodes prepared the manuscript and undertook the majority of data analysis in the paper. Jim Skea analyzed the private sector data and reviewed the manuscript. Matthew Hannon reviewed the manuscript.
Conflicts of Interest
The authors declare no conflict of interest.
References
- OECD. STAN Database for Structural Analysis. Available online: http://stats.oecd.org/Index.aspx?DataSetCode=STAN08BIS (accessed on 28 May 2014).
- EU Industrial R&D Investment Scoreboard 2013; European Commission, Joint Research Centre: Seville, Spain, 2013.
- International Energy Agency (IEA). Energy Technology Research and Development Database 2013; IEA: Paris, France, 2013. [Google Scholar]
- Gallagher, K.S.; Grübler, A.; Kuhl, L.; Nemet, G.; Wilson, C. The energy technology innovation system. Annu. Rev. Environ. Resour. 2012, 37, 137–162. [Google Scholar]
- McGowan, F. The single energy market and energy policy: Conflicting agendas? Energy Policy 1989, 17, 547–553. [Google Scholar] [CrossRef]
- The World Energy Council (WEC). Time to Get Real—The Case for Sustainable Energy Investment; WEC: London, UK, 2013. [Google Scholar]
- Repert of the Conference of the Parties on its Sixteenth Session, Held in Cancun from 29 November to 10 December 2010. Available online: http://unfccc.int/resource/docs/2010/cop16/eng/07a01.pdf (accessed on 25 August 2014).
- Intergovernmental Panel on Climate Change (IPCC). Climate Change 2014: Mitigation of Climate Change—Summary for Policymakers; IPCC: Geneva, Switzerland, 2014; p. 31. [Google Scholar]
- International Energy Agency (IEA). Energy Technology Perspectives 2012: Pathways to a Clean Energy System; IEA: Paris, France, 2012; pp. 56–59. [Google Scholar]
- International Energy Agency (IEA). Energy Technology Perspectives 2008; IEA: Paris, France, 2008; p. 650. [Google Scholar]
- Cabraal, R. Experiences and lessons from 15 years of World Bank support for photovoltaics for off-grid electrification. In Proceedings of the 2nd International Conference on the Developments in Renewable Energy Technology (ICDRET), Dhaka, Bangladesh, 5–7 January 2012; pp. 1–4.
- International Energy Agency World Energy Balances. Available online: http://www.esds.ac.uk/international/doipages/ieaweb.asp (accessed on 25 August 2014).
- U.S. Energy Information Administration. Short-Term Energy Outlook. Available online: http://www.eia.gov/forecasts/steo/report/prices.cfm (accessed on 30 May 2014).
- British Petroleum (BP). BP Statistical Review of World Energy; BP: London, UK, 2014; p. 48. [Google Scholar]
- Repealing the Carbon Tax. Available online: http://www.environment.gov.au/climate-change/repealing-carbon-tax (accessed on 8 August 2014).
- Foxon, T.J. Technological lock-in and the role of innovation. In Handbook of Sustainable Development; Atkinson, G., Dietz, S., Neumayer, E., Eds.; Edward Elgar Publishing: Cheltenham, UK; p. 140.
- International Energy Agency (IEA). Science for Today’s Energy Challenges: Accelerating Progress for a Sustainable Energy Future; IEA: Paris, France, 2006; p. 20. [Google Scholar]
- UK Energy Research Centre. Transforming Our Energy Future: Meeting Report. Available online: http://www.ukerc.ac.uk (accessed on 18 June 2014).
- International Energy Agency (IEA). Reviewing R&D Policies; IEA: Paris, France, 2007; p. 79. [Google Scholar]
- Freeman, C.; Louçã, F. As Time Goes By: From the Industrial Revolutions to the Information Revolution; Oxford University Press: Oxford, UK, 2001; p. 424. [Google Scholar]
- Teh, N.J.; Rhodes, A. UK Smart Grid Capabilities Development Programme; UK Energy Research Centre: London, UK, 2014; p. 80. [Google Scholar]
- Asmus, P. Microgrids, virtual power plants and our distributed energy future. Electr. J. 2010, 23, 72–82. [Google Scholar]
- Loulou, R. Documentation for the MARKAL Family of Models; International Energy Agency (IEA): Paris, France, 2004. [Google Scholar]
- Rhodes, A.; Skea, J.; Hannon, M. Electrochemical Energy Technologies and Energy Storage: RCUK Energy Strategy Fellowship Energy Research and Training Prospectus Report 6; Imperial College London: London, UK, 2014. [Google Scholar]
- DOE Joint Genome Institute. The First Tree Genome is Published. Available online: http://jgi.doe.gov/news_9_14_06/ (accessed on 25 June 2014).
- Skea, J.; Rhodes, A.; Hannon, M. Bioenergy: RCUK Energy Strategy Fellowship Energy Research and Training Prospectus Report 8; Imperial College London: London, UK, 2014. [Google Scholar]
- Stern, N. Research and Development, Demonstration and Deployment and Skills. In The Stern Review; Government Equalities Office: London, UK, 2006; pp. 216–234. [Google Scholar]
- Sunlight Electric History of Photovoltaics. Available online: http://www.sunlightelectric.com/pvhistory.php (accessed on 5 August 2014).
- U.S. Energy Information Administration. Annual Energy Outlook 2014; U.S. Energy Information Administration (EIA): Washington, DC, USA, 2014; p. 269.
- Organisation of the Petroleum Exporting Countries (OPEC). World Oil Outlook 2013; OPEC: Vienna, Austria, 2013; p. 318. [Google Scholar]
- ExxonMobil. The Outlook for Energy: A View to 2040; ExxonMobil: Irving, TX, USA, 2014; p. 58. [Google Scholar]
- British Petroleum (BP). BP Energy Outlook 2035; BP: London, UK, 2014. [Google Scholar]
- Shell Scenarios Team. Shell New Lens Scenarios; Shell Global: Hague, The Netherlands, 2013. [Google Scholar]
- Global Wind Energy Council (GWEC). Global Wind Statistics 2013; GWEC: Brussels, Belgium, 2014; pp. 2–3. [Google Scholar]
- EurObserv’er. PV Barometer 2012; EurObserv’er: Paris, France, 2012. [Google Scholar]
- Geels, F.W. Technological Transitions and System Innovations; Edward Elgar Publishing: Cheltenham, UK, 2005; p. 318. [Google Scholar]
- Gross, R.; Stern, J.; Charles, C.; Nicholls, J.; Candelise, C.; Heptonstall, P.; Greenacre, P. On Picking Winners: The Need for Targeted Support for Renewable Energy; Imperial College of London: London, UK, 2012; p. 28. [Google Scholar]
- Mazzucato, M. The Entrepreneurial State: Debunking Public vs. Private Sector Myths; Anthem Press: London, UK, 2013; p. 266. [Google Scholar]
- Helm, D. The Carbon Crunch: How We’re Getting Climate Change Wrong—And How to Fix it; Yale University Press: New Haven, CT, USA, 2012. [Google Scholar]
© 2014 by the authors; licensee MDPI, Basel, Switzerland. This article is an open access article distributed under the terms and conditions of the Creative Commons Attribution license (http://creativecommons.org/licenses/by/3.0/).
Share and Cite
MDPI and ACS Style
Rhodes, A.; Skea, J.; Hannon, M. The Global Surge in Energy Innovation. Energies 2014, 7, 5601-5623. https://doi.org/10.3390/en7095601
AMA Style
Rhodes A, Skea J, Hannon M. The Global Surge in Energy Innovation. Energies. 2014; 7(9):5601-5623. https://doi.org/10.3390/en7095601
Chicago/Turabian StyleRhodes, Aidan, Jim Skea, and Matthew Hannon. 2014. "The Global Surge in Energy Innovation" Energies 7, no. 9: 5601-5623. https://doi.org/10.3390/en7095601