1. Introduction
Understanding the relationship between energy consumption and economic growth is essential for dealing with the major challenges faced today in the field of energy, such as global warming, energy security and the possibility of peak oil. Historical trends and driving forces in this relationship can inform us about the potential for making large energy transitions today, and what might be the requirements and consequences.
Energy intensity is a key indicator for the relationship between energy and economic activity, and in this article we deal with its long-run trajectory in Europe. The most familiar stylized proposition on energy intensity, put forward by Reddy and Goldemberg, is that its pattern looks like an inverted U, but with peaks at different levels and years depending on local patterns of development and uptake of technology [
1]. Research has demonstrated that in fact for several countries in Western Europe energy intensity is rather stable or else declining over the last two hundred years when traditional energy carriers like wood and muscle power are included in the calculations [
2]. However, on the European aggregate level the inverted-U has recently been confirmed [
3]. In the 19th century aggregate European energy intensity rose, followed by a declining trend during the 20th century. The increase during the 19th century was almost entirely driven by two large coal consuming countries: Germany and Britain, while the declining trend in the 20th century is a more widespread phenomena across Western Europe. This decline was further augmented around 1970, when energy consumption
per capita stabilized in Europe. This article discusses the possible explanations for the declining trend during the 20th century and explores the role of energy quality as expressed in energy prices. Special attention is given to the period after 1970. Alternative explanations for the declining trend are also discussed such as the role of structural change
vs. technical change, especially the role of service transition; trade balances of energy embodied in goods; oil crises (driving higher oil prices), and the Information and Communication Technology (ICT) revolution [
3].
We use the same definition of energy quality as Cleveland
et al.: “the relative economic usefulness per heat equivalent of different fuels” [
4]. The crucial word for us in this definition is “economic”, although this is certainly related to physical qualities. Different energy carriers have different energy qualities. Energy carriers are the different physical forms of matter that “carry” energy, such as coal, oil, muscles or electricity: “the substance-like physical quantity which flows while energy is flowing ‘carries’ the energy. It is an energy-carrier”. [
5] In principle the declining trend in energy intensity may be explained partly or totally by an increasing quality of the energy carriers, as more oil and electricity enter the system. Higher quality could compensate for lower quantity. Theoretically, one mechanism by which energy quality could compensate for energy quantity could be through a higher ratio of useful energy (motion, light, heat) in relation to energy inputs. For instance, the diesel engine has much higher ratio of useful energy to energy inputs than steam engines. Another mechanism is that energy carriers with multiple usages like electricity can improve the economic productivity in factories through improved working conditions and the adoption of the relatively flexible production system based on unit drives [
6,
7,
8]. This all meant that higher economic value could be achieved from a certain amount of energy, and energy intensity had a tendency to go down.
Quality is thus related to intrinsic properties of the energy carriers themselves, but cannot be reduced to these properties. The intrinsic or physical properties of energy carriers are for instance the state in which the energy carrier is delivered: for fuels as liquids, solids or gas. Other intrinsic properties are how energy dense the energy carrier is, in relation to volume or weight. These aspects matter for how easily the energy carriers can be transported and stored, which is related in turn to handling costs for costumers. Reynolds suggested that oil is an energy carrier that scores highly in the economic utility of these physical properties and thus has a quality that goes beyond the other fuels [
9]. In our view it is not sufficient to adopt a physical approach to energy quality. Energy quality must be regarded from the side of the consumer. It is related to the different number of particular applications for which an energy carrier can be used. An energy carrier that can be used for several purposes like light, motion and heat is naturally of higher value to consumers than an energy carrier that can only be used for one or two purposes. Electricity is thus of higher quality than coal. Energy carriers compete in different markets where the price elasticity of demand differs in line with the number of competitors. This means that energy carriers are not perfect substitutes for each other; it also means that over time, with technical innovations that open up new usages for the energy carrier its quality increases.
Thus the “quality” of an energy carrier in economic terms is related both to its intrinsic properties and to the possible uses to which it can be put, and hence will vary over time and between countries. The liquid nature of oil represents an intrinsic quality of great potential economic advantage, for transportation. Nevertheless this advantage only held fully after the invention of the Internal Combustion Engine as a technology of great utility that was reliant on liquid fuels. Before this time the liquidity of oil made it, if anything, more difficult to transfer and store. Quality is by necessity a relative concept, despite its relationship with intrinsic properties, which varies according to the technological possibilities available at any time and place.
Energy prices can inform us about the quality of energy carriers, at least in relative terms. Consumers will pay more for quality, and energy carriers with a higher quality are priced higher than carriers with lower quality. For instance the price of oil, which can be divided into many products with various uses, has been higher than the price of coal after the break-through of the car-based society in the 1950s; and the price of petrol is typically four times higher than the price of heating oil, since there are many substitutes for heating oil but not for petrol [
10]. Electricity in turn has typically been more expensive than oil in modern times, since it can be used for more purposes. Consequently the ordinal quality of energy carriers should be reflected in relative prices (the price of one energy carrier compared to others). Two caveats must be added to this statement. First, prices of course do not only reflect demand for the energy carrier, but also reflect production costs, and hence supply-side conditions, especially when their delivery is dependent on the creation and maintenance of infrastructure (such as gas pipelines or electricity grids). The second caveat is that retail prices also reflect local regulatory and taxation regimes, designed to raise revenue, reduce pollution or discourage undesirable behaviour.
We would not then expect to find the relative economic qualities of different carriers to necessarily show a consistent ratio between nations or over time. As Stern [
11] has argued, a measure of “pure” energy quality can only be isolated under conditions of a high degree of substitutability, which is seldom the case for actual energy carriers in real life.
We have constructed an aggregate energy quality indicator (see
Section 3), based on the argument that the ordinal ranking of the quality of a particular energy carriers is given by its price relative to the price of other energy carriers. The energy quality indicator we have constructed informs us about the compositional changes in the energy carrier system given the emergence of new technical applications for different energy carriers over time. We do not consider all sudden price increases of different energy carriers to reflect quality, nor inflation to be a sign of quality improvements, and our quality index is deflated with an energy price index (see
Section 3). This means that price shocks, driven by the supply side, such as the oil price shocks of the 1970s will not turn up as increased quality in our indicator. Indeed, as volume is also included in the aggregate quality indicator (see
Section 3), changing relative prices of individual carriers will also be reflected in shifts in demand, such as the reduction in the use of fuel oil, and increases in gas, coal and primary electricity in the European energy system after 1973.
The role of energy quality in the long-run decline in energy intensity is not clear. Here we compare the development of energy intensity and energy quality in two countries: Sweden and Britain. For the first time a complete set of national energy retail prices covering two centuries has been constructed and used for Britain (see online
supplementary material on Joint Center for History and Economics [
12]), while the energy price data previously available for Sweden until 2000 [
10] has been updated to 2009 (see online
supplementary material). Using this material we investigate the relationship between aggregate energy quality and energy intensity in the period 1800–2009. More specifically, we investigate whether we find some common conclusions for countries across time or at least discern special periods with stylized relations.
The article is structured as follows:
Section 2 summarizes the results of energy intensity analyses previously undertaken in the book
Power to the People by two of the authors [
3];
Section 3 describes the method,
Section 4 provides results,
Section 5 contains a concluding discussion where we broaden the scope of the paper to also depict the energy cost shares for Sweden and Britain and
Section 6 describes our data.
2. Previous Research
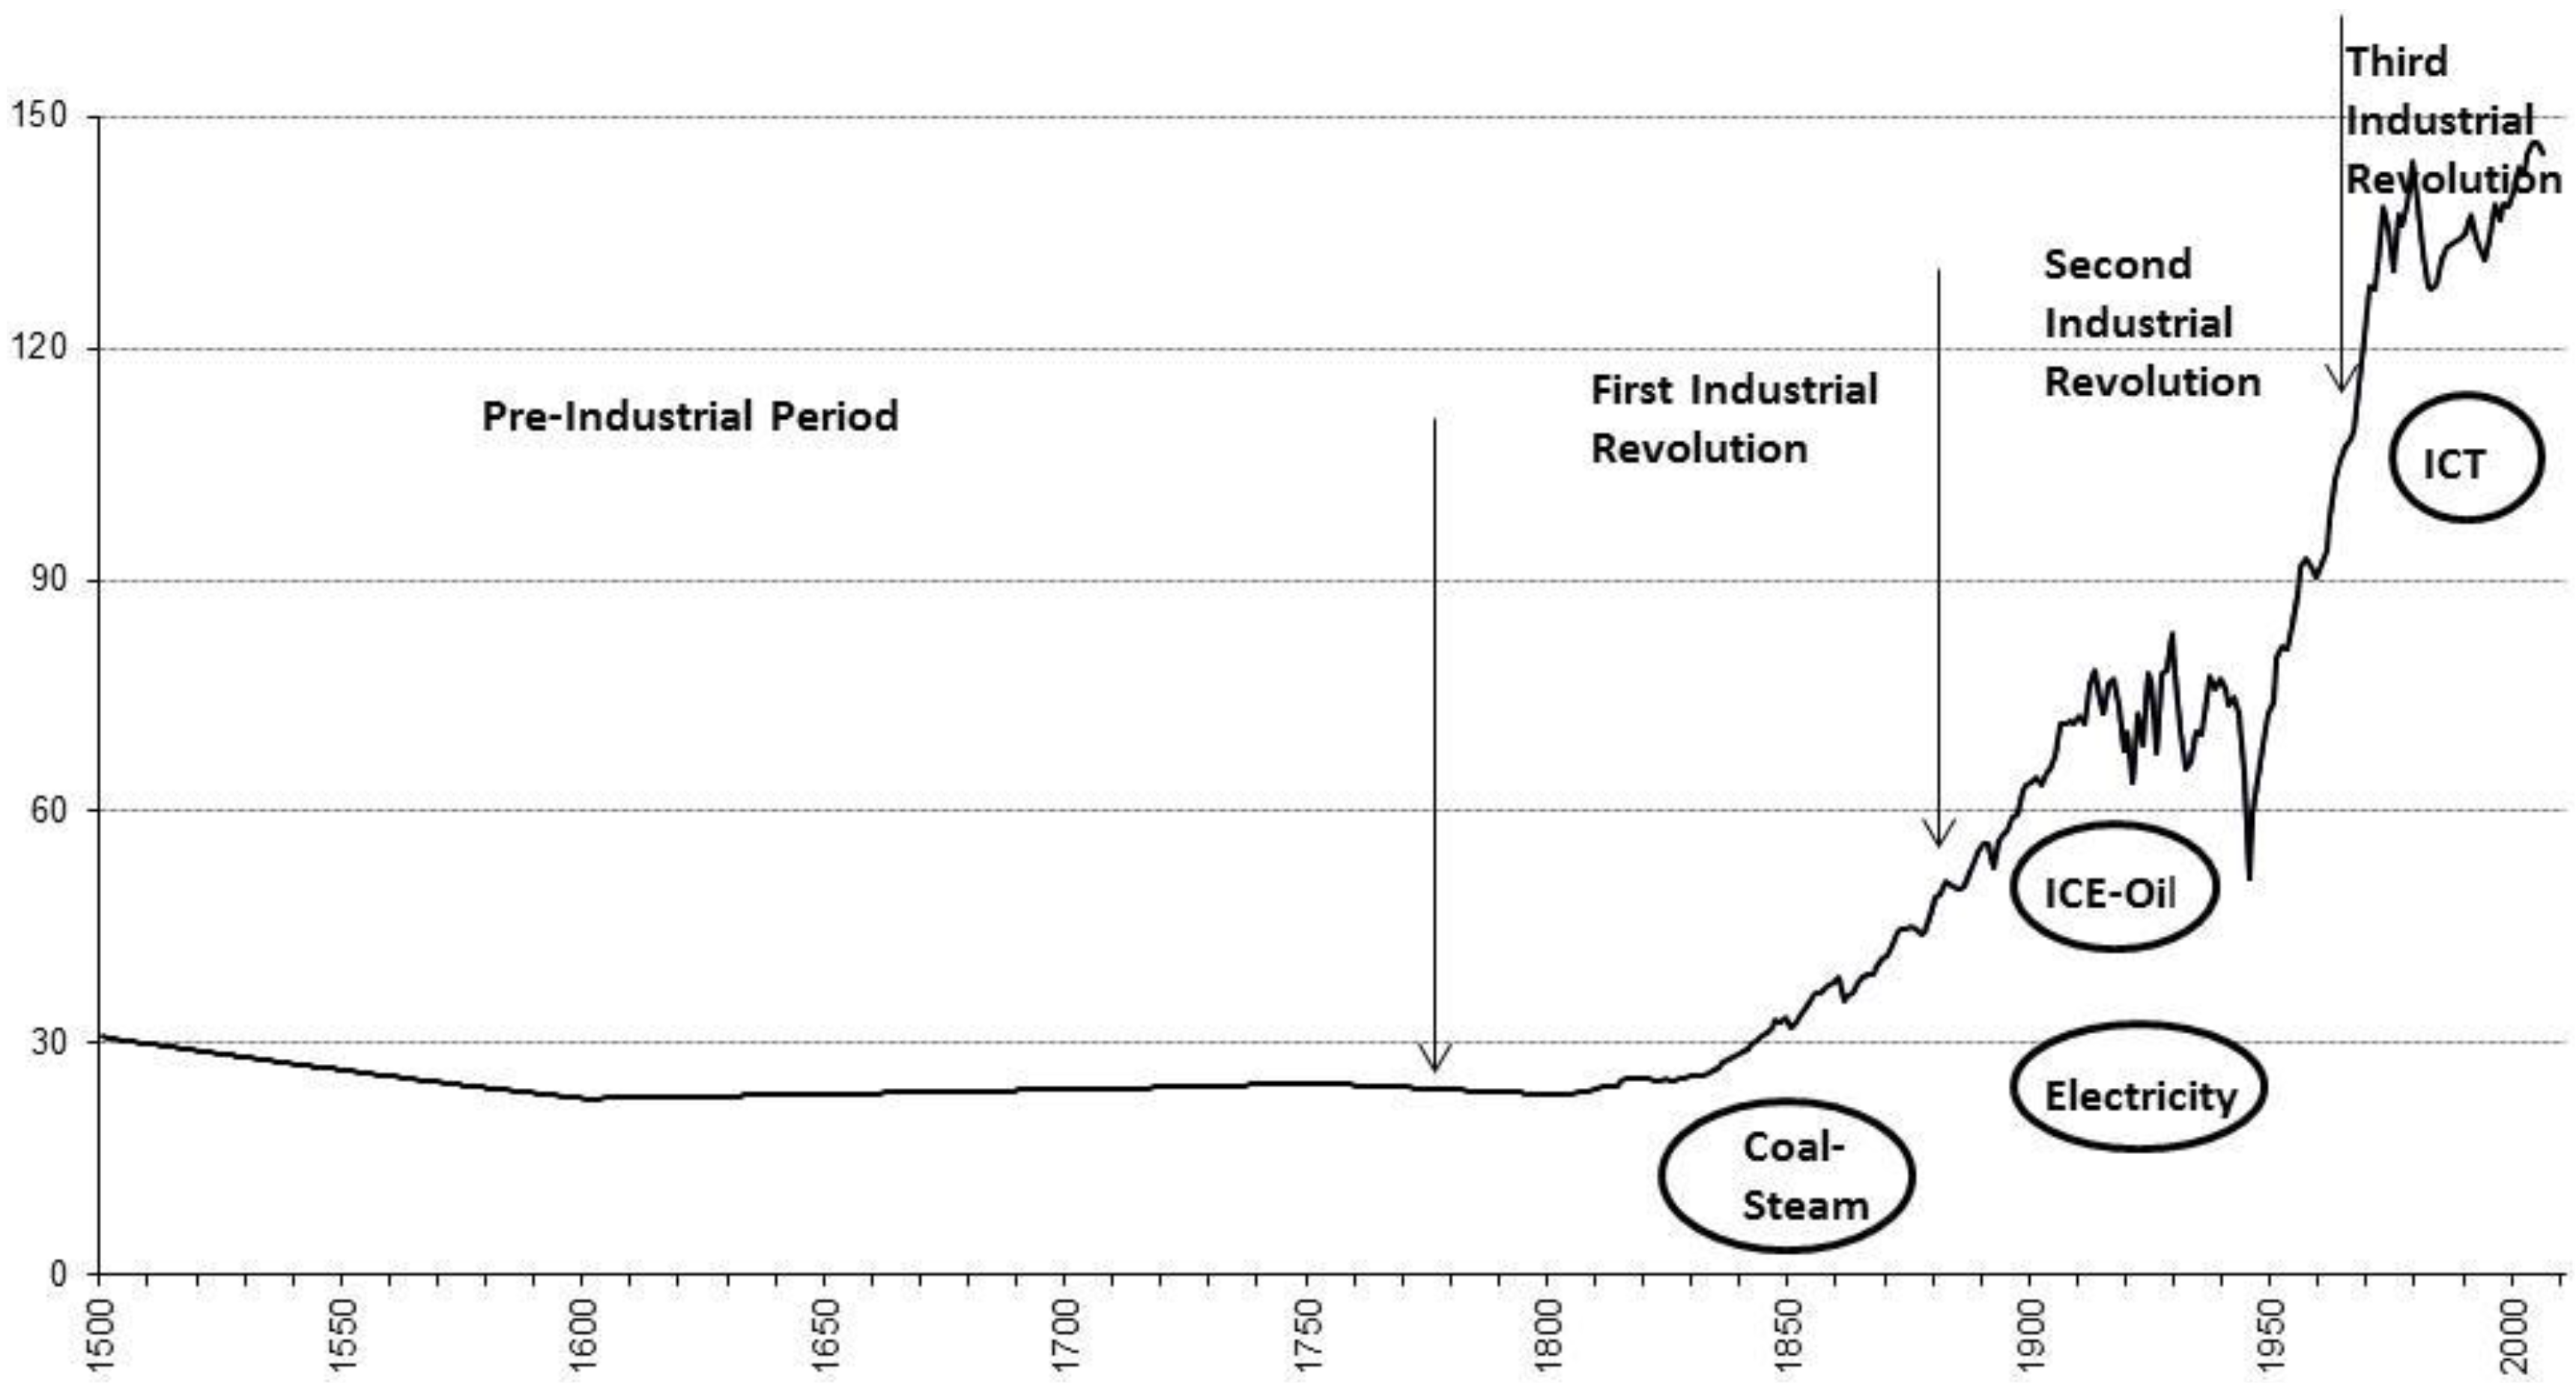
The story of energy consumption in Europe over the last five centuries is not a story of steadily increasing energy consumption (see
Figure 1). Instead it is marked by a period of constant, or even falling energy consumption per capita during the pre-industrial period, when energy supply was scarce due to limited land availability. This was followed by a clear take-off period during the first industrial revolution, when coal broke the land constraint of the organic economy and the steam engine overcame the constraint of limited power at workers’ disposal. The rapid growth in energy consumption continued up until the 1970s, later being driven by the internal combustion engine (ICE) run by oil, and electricity. Only during the two world wars and the economic crises of the interwar period was there a concomitant stall in the growth of energy consumption. Around 1970 however there was an apparent change in the trend in energy consumption
per capita; it flattened out and as a consequence total energy consumption grew less rapidly, simply keeping pace with population. A number of hypotheses can be put forward to explain this phenomenon. These are treated only briefly here, but more extensively in
Power to the People [
3]: (1) deindustrialisation, or the transition to a service economy; (2) increasing net-imports of industrial products; (3) the technological shift of the third industrial revolution that has seen rapid growth of information and communication technology (ICT); (4) the impact of the oil crises; (5) or simply being due to a changing mix of the energy carriers with an increasingly larger share of high-quality carriers, so that lower quantities can satisfy demand. We have previously argued that most of the decline was driven by the technological shift of the third industrial revolution, based on ICT, where information rather than energy was the main driver behind growth [
3,
13]. We were not earlier able to really assess hypothesis 5, because we lacked prices for Britain, and this is the aim of this article. ICT also permitted a “surprisingly larger energy productivity benefit” beyond the immediate growth in electricity demands from ICT itself [
14]. These large improvements in energy productivity are due both to ICT being used to improve thermal efficiency and material flows in traditional manufacturing industries, and to structural changes in production by which energy lighter branches, such as electronics and pharmaceuticals, have come to make up a larger share of the manufacturing industry today than in the 1970s.
Figure 1 provides a schematic illustration of the trends and arguments elaborated in
Power to the People [
3] and around which the book is structured.
Figure 1.
The long run energy consumption in Europe 1500–2010 in relation to three industrial revolutions (GJ
per capita). Source: [
3] The sample includes Britain, France, Germany, Italy, the Netherlands, Portugal, Spain, and Sweden. The circles indicate the main technological influences on the
changes in energy use associated with each revolution. There was also some continuity from older developments during these revolutions.
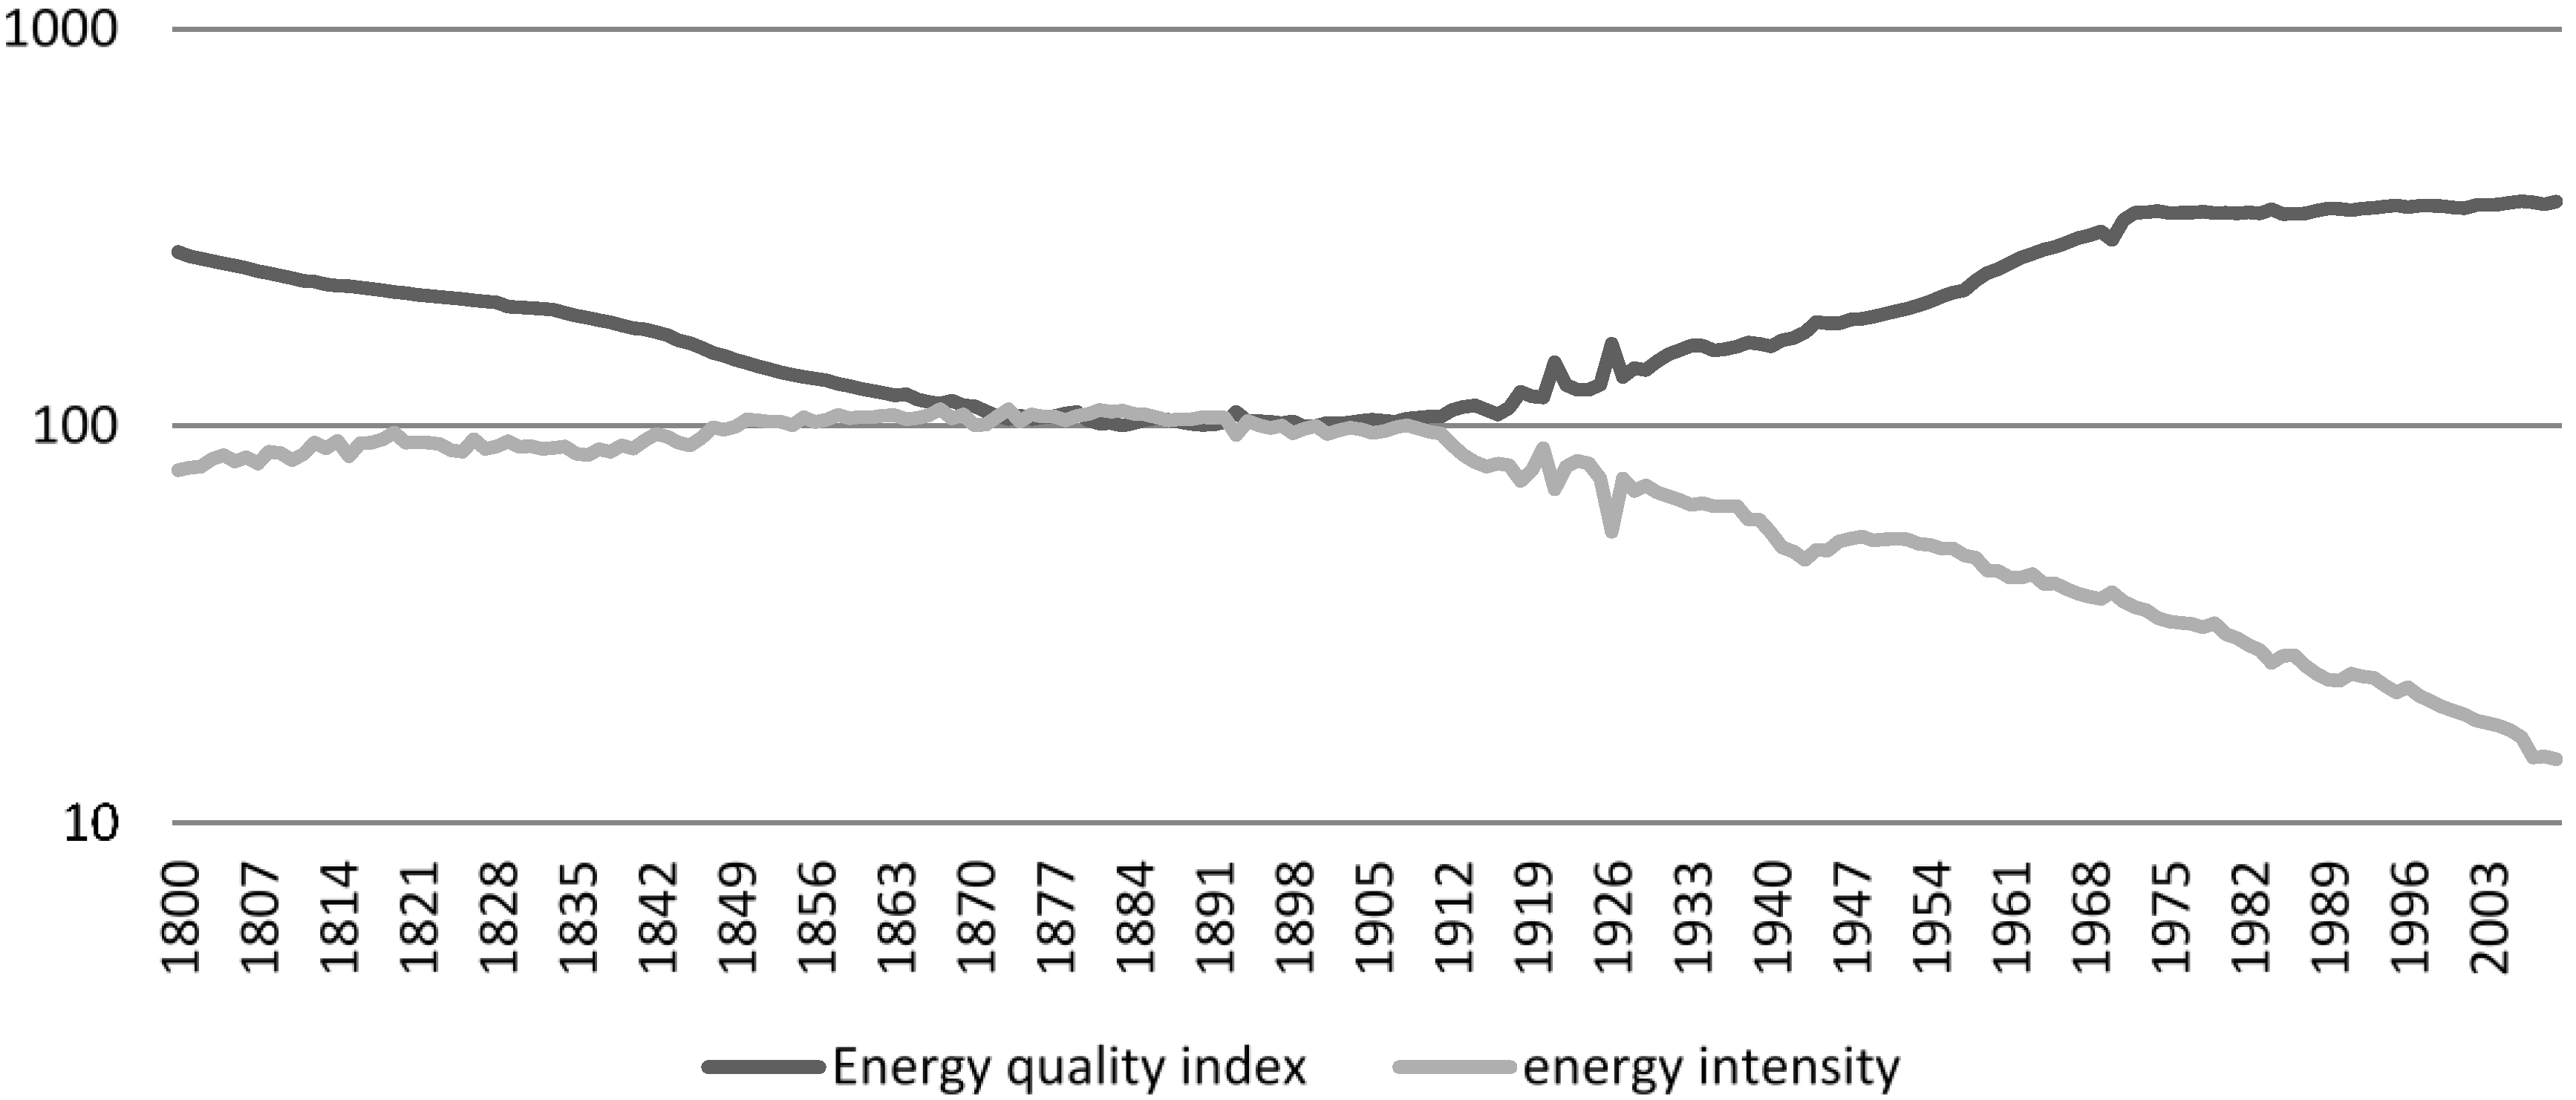
The relationship between economic growth and energy, as indicated by energy intensity, also showed distinct phases over the long run. Over the last two hundred years energy intensity (energy/GDP) in Western Europe displayed an inverted U-shape curve (see
Figure 2). This appears to confirm the stylised proposition of an inverted-U by Reddy and Goldemberg [
1], but contrasts with the results for a more limited set of four European countries: Spain, Sweden, Netherlands and Italy [
2], for which energy intensity fell drastically or modestly over the long run. The difference in the aggregate European trend is a result of including the two largest coal consuming countries; Britain and Germany. These were the only countries for which there was a marked tendency for an upward bending curve in the 19th century, most decisively so for Germany and less clearly so for Britain. Thus Britain and Germany are the only two European countries in our sample for which there is an inverted U-shape curve over this period.
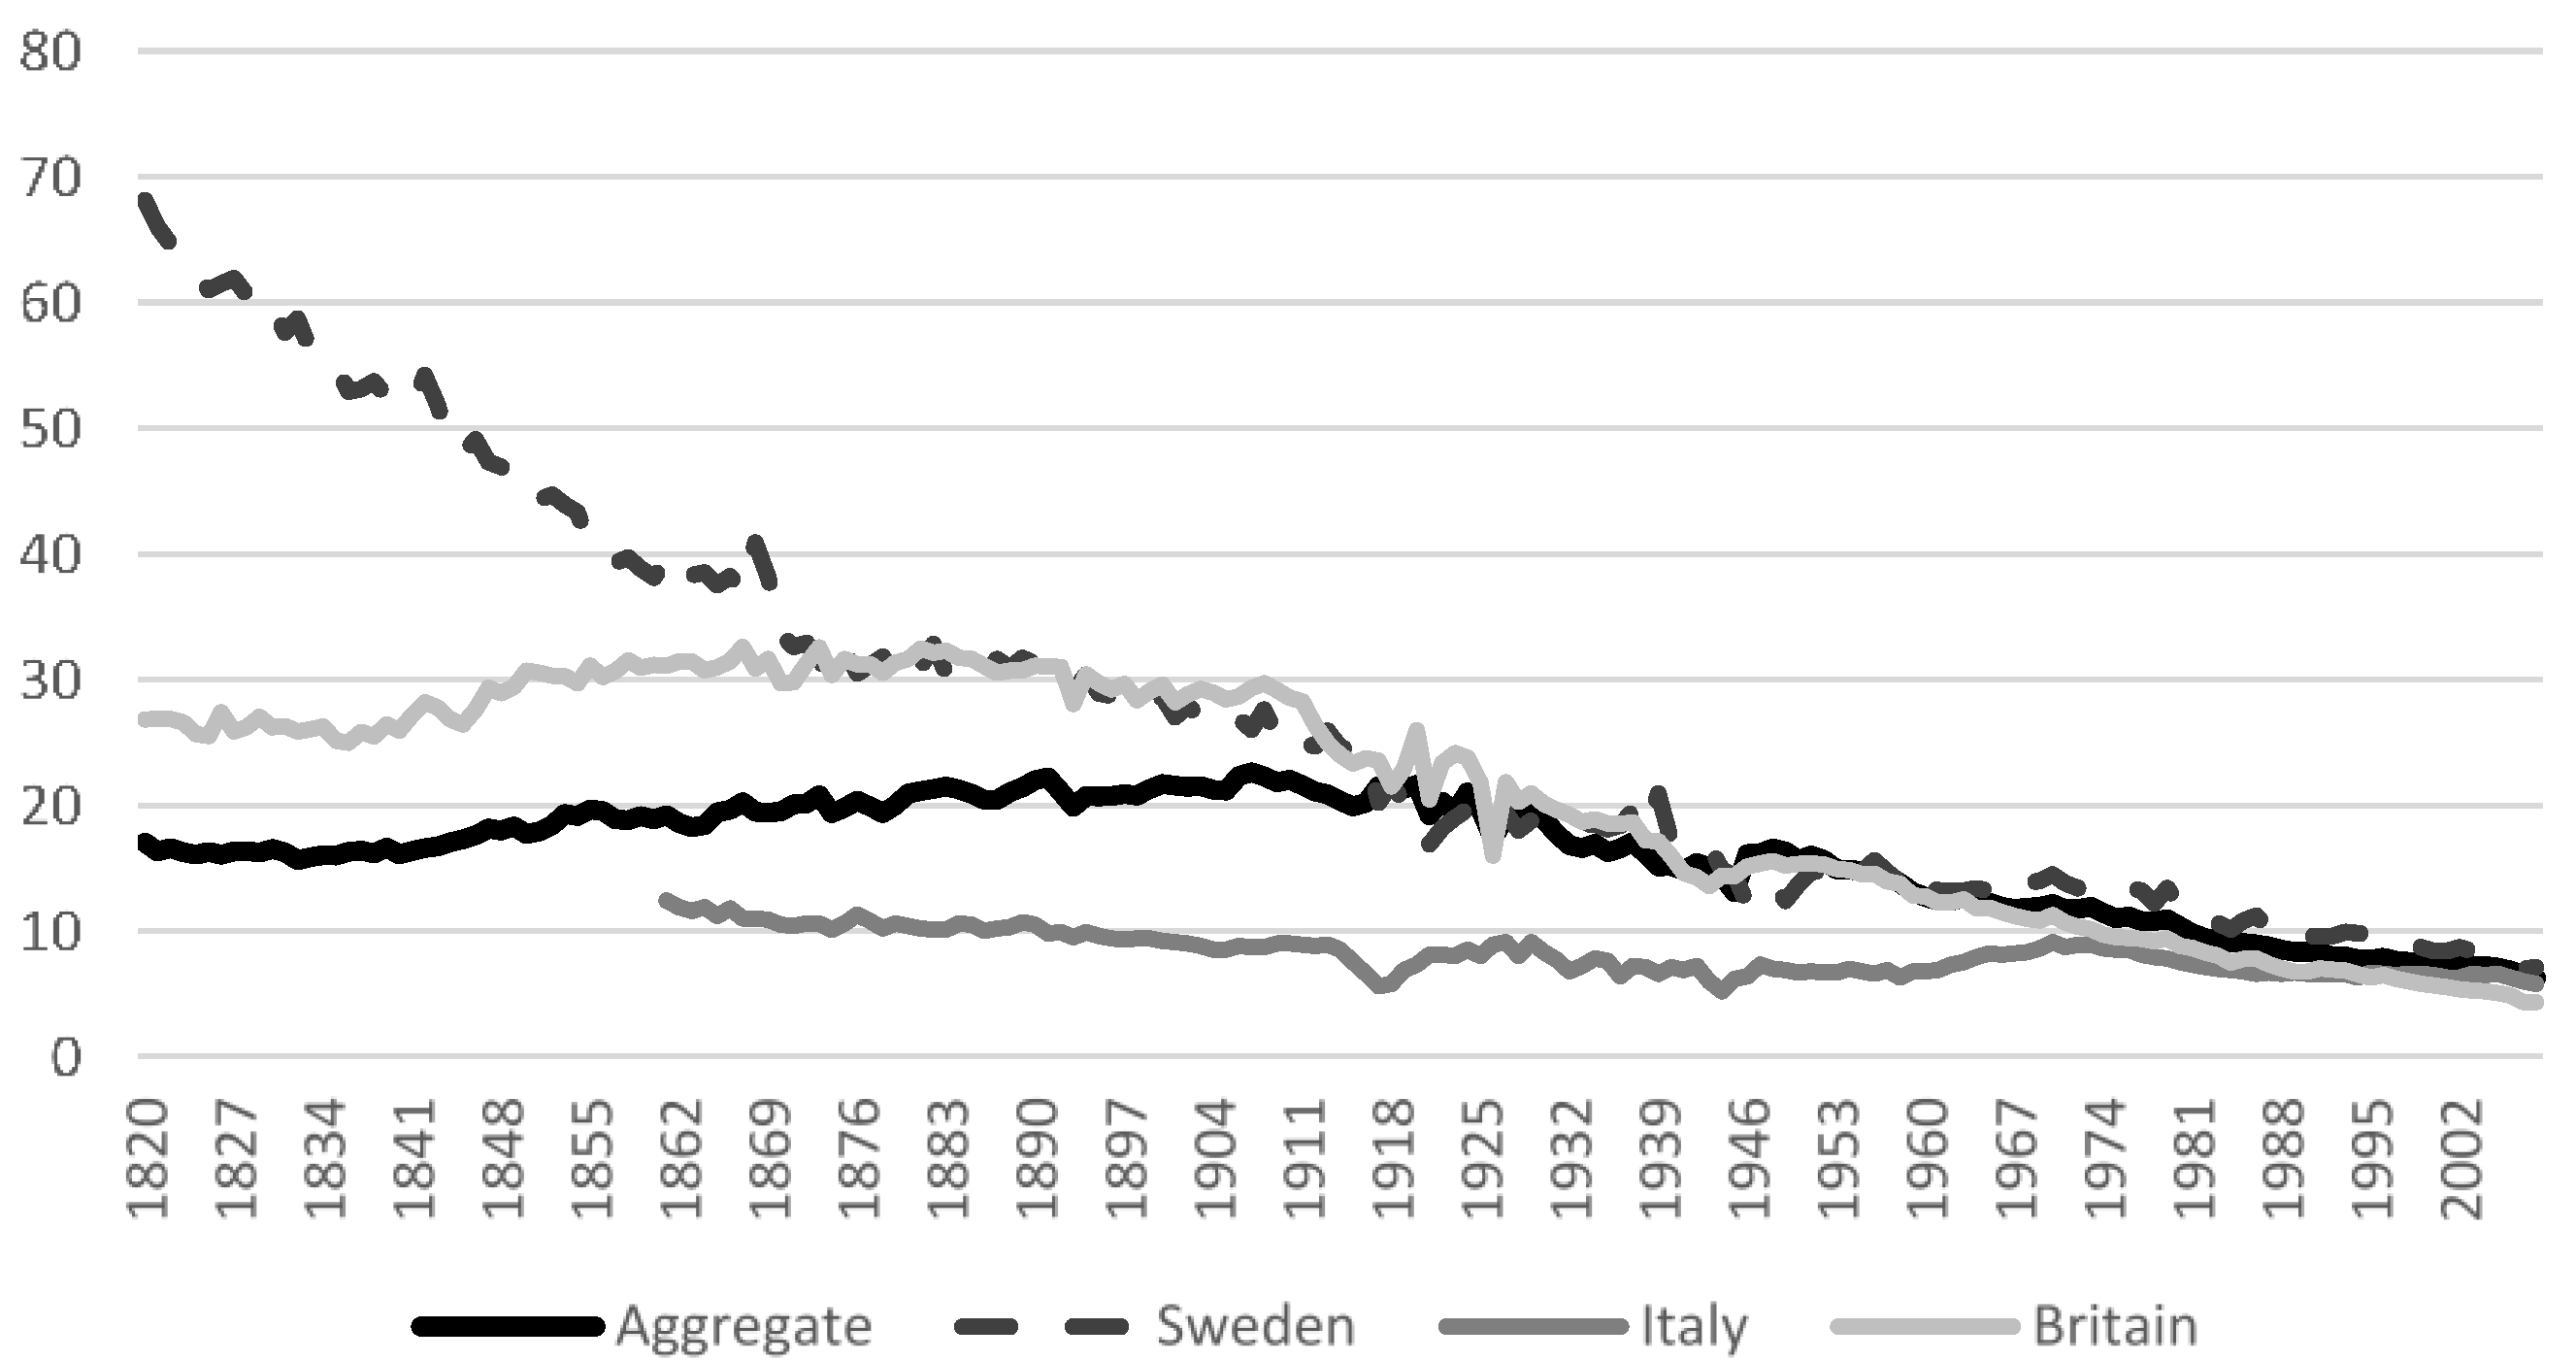
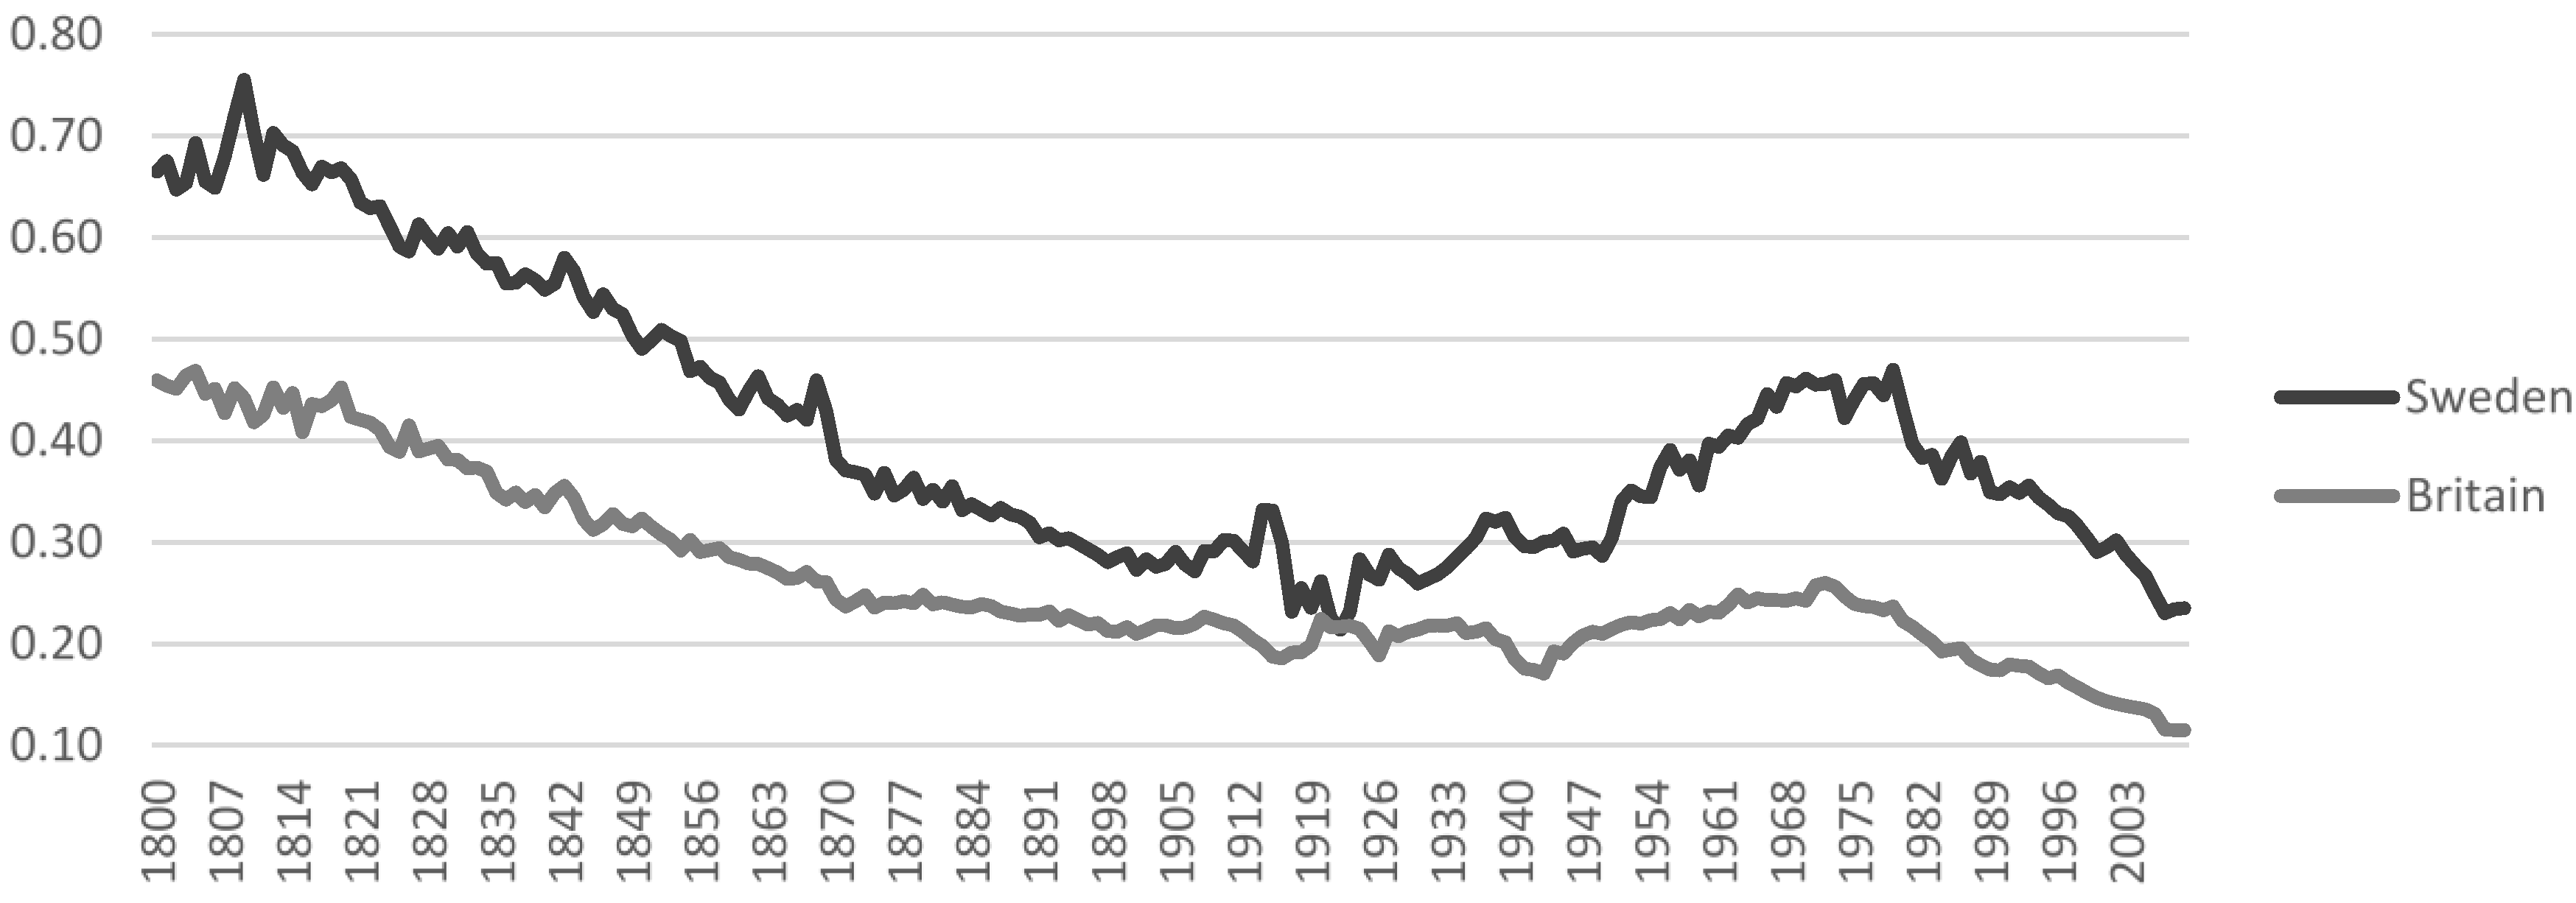
In this article we focus on Britain and Sweden, two very different countries when it comes to energy history. Britain was a coal-rich country, while Sweden had very little access to domestic coal. Still, their energy intensity development has in fact looked largely similar since the 1870s (see
Figure 3), with a drastic decline over the last 160 years.
Figure 2.
Energy intensity for Europe 1820–2009, MJ/international dollar in 1990 prices. Source: [
3,
15] The aggregate energy intensity includes Britain, France, Germany, Italy, the Netherlands, Portugal, Spain, and Sweden. Prices are in constant international dollars, calculated at PPP (purchasing power parity) in 1990.
Figure 3.
Energy intensity for Britain and Sweden, 1800-2009. Energy consumption divided by real GDP in 1913 price level. GBP are calculated to SEK in 1913 exchange rate. Expressed in GJ/SEK. Sources: energy data: [
12]; Swedish GDP: [
16]; British GDP: [
17,
18]; exchange rate: [
19].
Figure 3.
Energy intensity for Britain and Sweden, 1800-2009. Energy consumption divided by real GDP in 1913 price level. GBP are calculated to SEK in 1913 exchange rate. Expressed in GJ/SEK. Sources: energy data: [
12]; Swedish GDP: [
16]; British GDP: [
17,
18]; exchange rate: [
19].
In Britain there was however first a period of increasing energy intensity from at least the beginning of the 19th century, which may have extended much further into the past. After 1970 the rate of decline in energy intensity accelerated in both countries. Britain and Sweden follow the European aggregate energy intensity very closely. Identifying the drivers of energy intensity in the two countries is therefore important for understanding the drivers on aggregate level.
The relationship between energy and the economy may change for a number of different reasons. One possible reason is structural change (hypothesis 1 above). During a period of industrialization we might expect increasing energy demands in relation to GDP, simply because industrial activities generally require more energy than traditional agriculture, and the secondary sector is expanding. Unless thermal efficiency increases outweigh these structural changes towards a larger share of high-energy-activities in the economy, the overall effect on energy intensity will be an increase, as we see for Britain before 1875. The general expectation is that industrialization is a structural shift that increases energy intensity, while the transition to a service economy or deindustrialisation will have the opposite effect, see
Figure 4 [
20].
Figure 4.
The role of structural change for energy intensity development. Source: [
21].
Figure 4.
The role of structural change for energy intensity development. Source: [
21].
However, there is reason to be somewhat skeptical about the idea that deindustrialization or the transition to a service economy will bring about dematerialization of production and consequent environmental improvement. This is because the shift to a service economy is largely an illusion in terms of real production, but is instead generated by the fall in the price of manufacturing goods relative to services, which is in turn caused by more rapid productivity growth in manufacturing than in services. In one sense we can certainly observe deindustrialization in Europe: thousands of jobs have been lost in the manufacturing sector over recent decades, with profound social consequences. These facts do not however mean that physical output has fallen in manufacturing industry. On the contrary, workers have been equipped with greater amounts of capital, increasing labour productivity and leading to a decline in the prices of manufactured goods relative to personal services, which cannot be automated to the same degree. This while deindustrialization appears to be a social fact, from the viewpoint of real output and the associated environmental burdens, the transition to the service economy is largely a price illusion, driven by “Baumol”s cost disease’. That is, personal services (playing a major role in the service sector) become more expensive relative to goods where innovation can lower the total (and especially labour) costs [
21,
22]. The latter kind of goods predominate in the industrial sector, and so by itself this price effect will change the structure of the economy as expressed in current prices,. However, in terms of real output the service share of GDP in European countries did not grow nearly as much as the service share in current prices or the service sector employment after 1970 (see
Table 1). Thus the impact from the service transition, or deindustrialisation, on energy consumption and energy intensity was much more modest than might be expected (although different countries have different experiences in this regard).
A second explanation for the trend break in the 1970s may be that the advanced countries increased their net imports of industrial goods from less developed countries (hypothesis 2 above). This question requires more investigation, but case studies demonstrate that at least Sweden and Netherlands did not increase the net imports of industrial products [
23,
24]. We can thus rule out increased net imports of industrial products being a general explanation for the trend break in energy consumption in the 1970s even though it still might be significant in particular countries and possibly even at an aggregated level.
A further possible explanation is that energy was saved as an effect of ICT. The industrial sector actually saved energy to considerable degree due to ICT (hypothesis 3 above) [
25], This worked due both to a structural shift as “light” branches like pharmaceuticals and software took market shares from chemicals, machinery and equipment; and from energy savings within traditional industries as their production was fine-tuned through process computers [
22,
26,
27]. This argument is more extensively elaborated in
Power to the People.
Table 1.
Service sector share (of GDP in current and constant prices, in employment), 1950, 1971, 1990 and 2005.
Table 1.
Service sector share (of GDP in current and constant prices, in employment), 1950, 1971, 1990 and 2005.
| Countries | Employment (%) | Services current prices | Services constant prices 1995 |
|---|
| 1950 | 1971 | 1990 | 2005 | 1950 | 1971 | 1990 | 2005 | 1950 | 1971 | 1990 | 2005 |
|---|
| France | 42 | 51 | 67 | 76 | n.a. | 57 | 69 | 77 | 68 | 64 | 71 | 73 |
| Germany | 34 | 45 | 59 | 72 | n.a. | 50 | 61 | 70 | 56 | 53 | 62 | 69 |
| Italy a | 27 | 42 | 60 | 67 | n.a. | 53 | 64 | 71 | 71 | 66 | 66 | 69 |
| Japan b | 31 | 46 | 58 | 68 | 44 | 52 | 59 | 69 | 55 | 60 | 61 | 66 |
| Netherlands | 50 | 60 | 72 | 79 | n.a. | 58 | 66 | 74 | 72 | 65 | 68 | 73 |
| Portugal c | 27 | 41 | 48 | 59 | n.a. | 61 | 62 | 73 | n.a | 58 | 64 | 69 |
| Spain | 33 | 42 | 59 | 65 | n.a. | 47 | 58 | 67 | 68 | 63 | 62 | 65 |
| Sweden | 39 | 56 | 69 | 75 | n.a. | 60 | 66 | 71 | 64 | 64 | 68 | 63 |
| UK | 49 | 56 | 70 | 80 | n.a. | 53 | 63 | 76 | 63 | 59 | 65 | 73 |
| USA | 58 | 67 | 76 | 81 | 54 | 63 | 70 | 74 | 63 | 65 | 72 | 72 |
Another possibility is that the oil crises of the 1970s stimulated policy shifts and energy savings (hypothesis 4 above). At least in Sweden, this was certainly true in domestic housing, which became better insulated. But the bulk of energy savings after 1970 took place within the manufacturing sector, and it appears as the relation between energy and economic growth actually changed in the 1970s [
13,
21]. Another indication that energy became less important for economic growth after 1970 is found in
Figure 5, which shows the estimates of Warr
et al. [
28] as to the amount of energy services (that is, “work done” or energy that was converted into and directly used as heat, light, motion, and electricity) utilised in advanced economies in relation to their GDP. According to this approach, up until the 1970s increasing energy services were clearly strongly associated with economic growth, and the fact that this association is found very widely suggested that they were a necessary condition of the kind of growth found at this time. However, after 1970 this ceased to be the case.
Figure 5.
The energy services in relation to GDP. Source: [
28] Note: GJ of useful work/1000 US dollars GDP, constant 1990 prices.
Figure 5.
The energy services in relation to GDP. Source: [
28] Note: GJ of useful work/1000 US dollars GDP, constant 1990 prices.
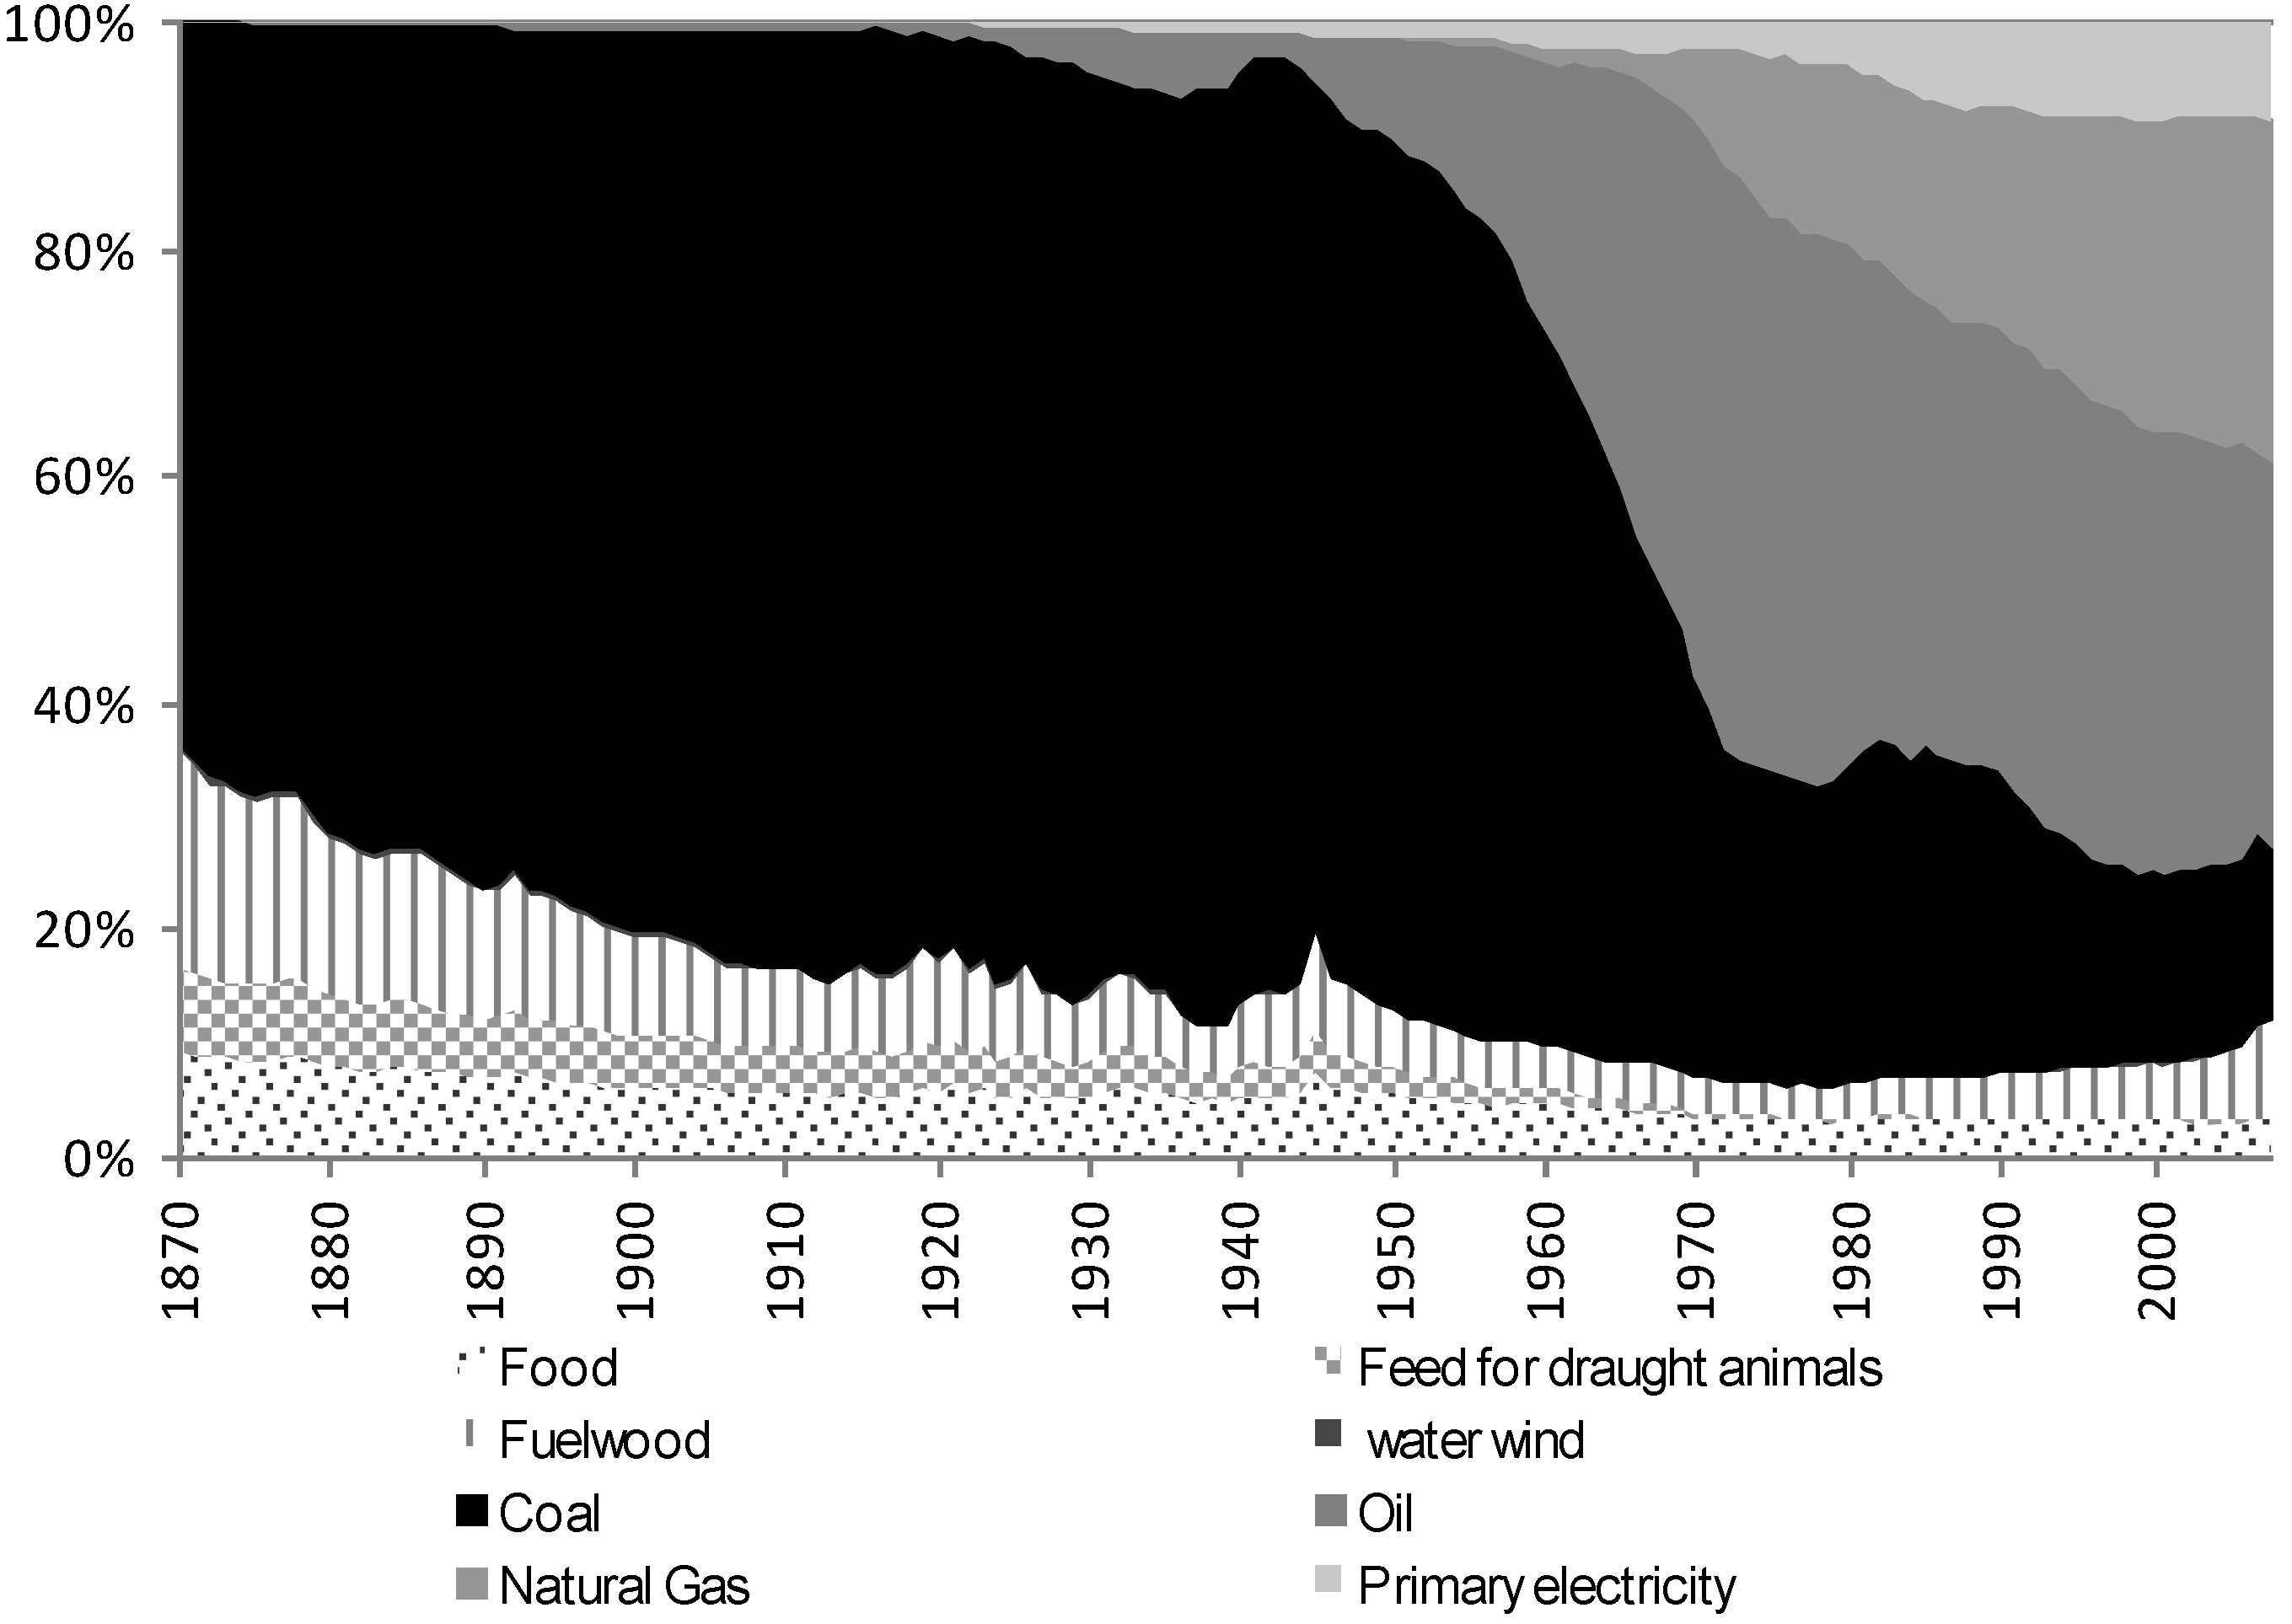
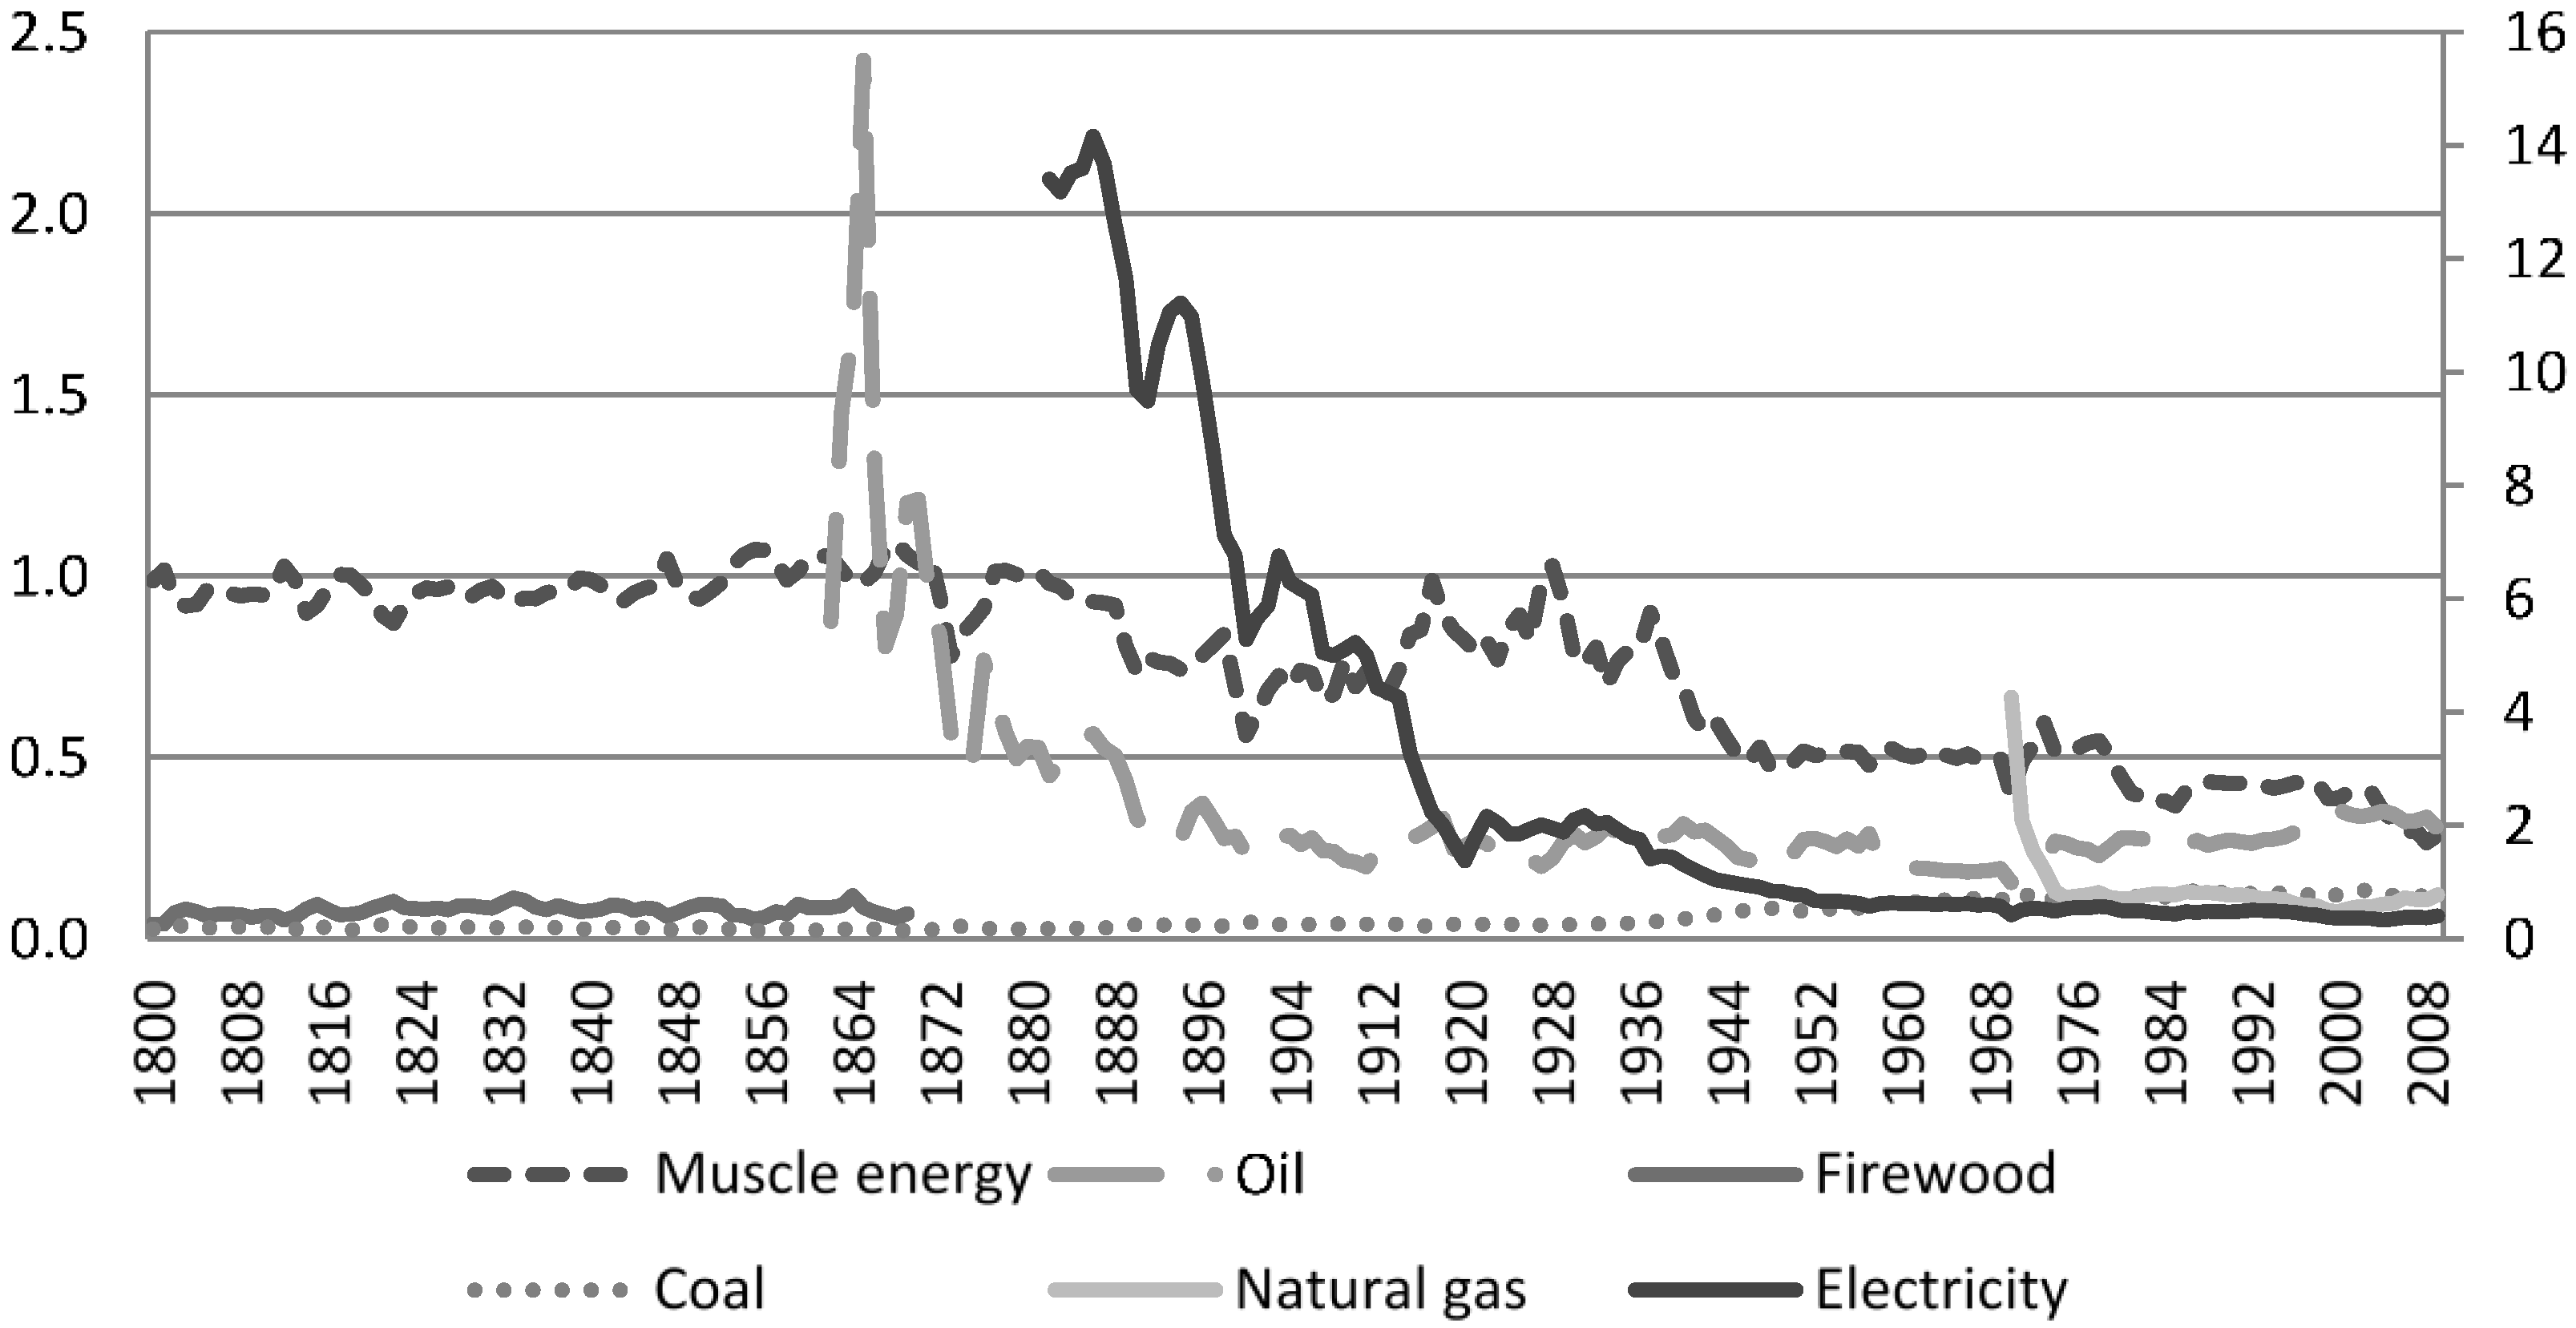
A final possible reason for profound changes in the relationship between energy and the economic activity rests with structural changes among the energy carriers themselves (hypothesis 5 above). Energy carriers of higher quality have taken larger market shares over time [
9]. The mix of energy carriers is not the same today as it was in 1870 (see
Figure 6). The energy carriers that dominated the scene in 1870 over much of the continent were still land-based sources such as food, fodder and fuelwood. The transition to coal had begun, but in Sweden, for example, it only made up around 10% of the primary energy input. In Britain this figure was already around 95%, and was accelerating rapidly in Germany. Transitions to oil and electricity marked 20th century Europe, especially after World War Two. Both these energy carriers are of high economic quality compared to solid fuels such as wood or coal [
9]. Obviously, you can run a computer on electricity, but not on wood; you can drive your car on petrol but not on coal (even if expensive synfuels can be produced from coal). Consequently, oil and electricity may have stimulated a further decline in energy intensity, although decline was clearly underway long before either carrier became significant in aggregate consumption. The already established downward trend almost certainly to some degree reflected improvements in coal-using technology, such as the development of far more efficient steam turbines and engines, and smelting processes.
The rest of this paper will deal with the role of aggregate energy quality increases in the 20th century. Were these quality improvements on the aggregate country level large enough to offer an explanation for the entire energy intensity decline in Britain and Sweden, or is there still a need for other explanations as outlined above?
Figure 6.
Shares of different energy carriers in primary energy inputs in Europe 1870–2009. Note: Primary electricity refers to electrical energy of geothermal, hydro, nuclear, tide, wind, wave/ocean and solar origin. Its production is assessed as the heat value of electricity [
29]. As this figure displays primary energy inputs, only primary electricity is included used to avoid double-counting of fuels used for electricity production. Electricity produced from fuels such as coal or gas is considered to be secondary electricity. Consequently, water and wind here refer only to direct use of the kinetic energy in wind and water mills or sail boats.
3. Method
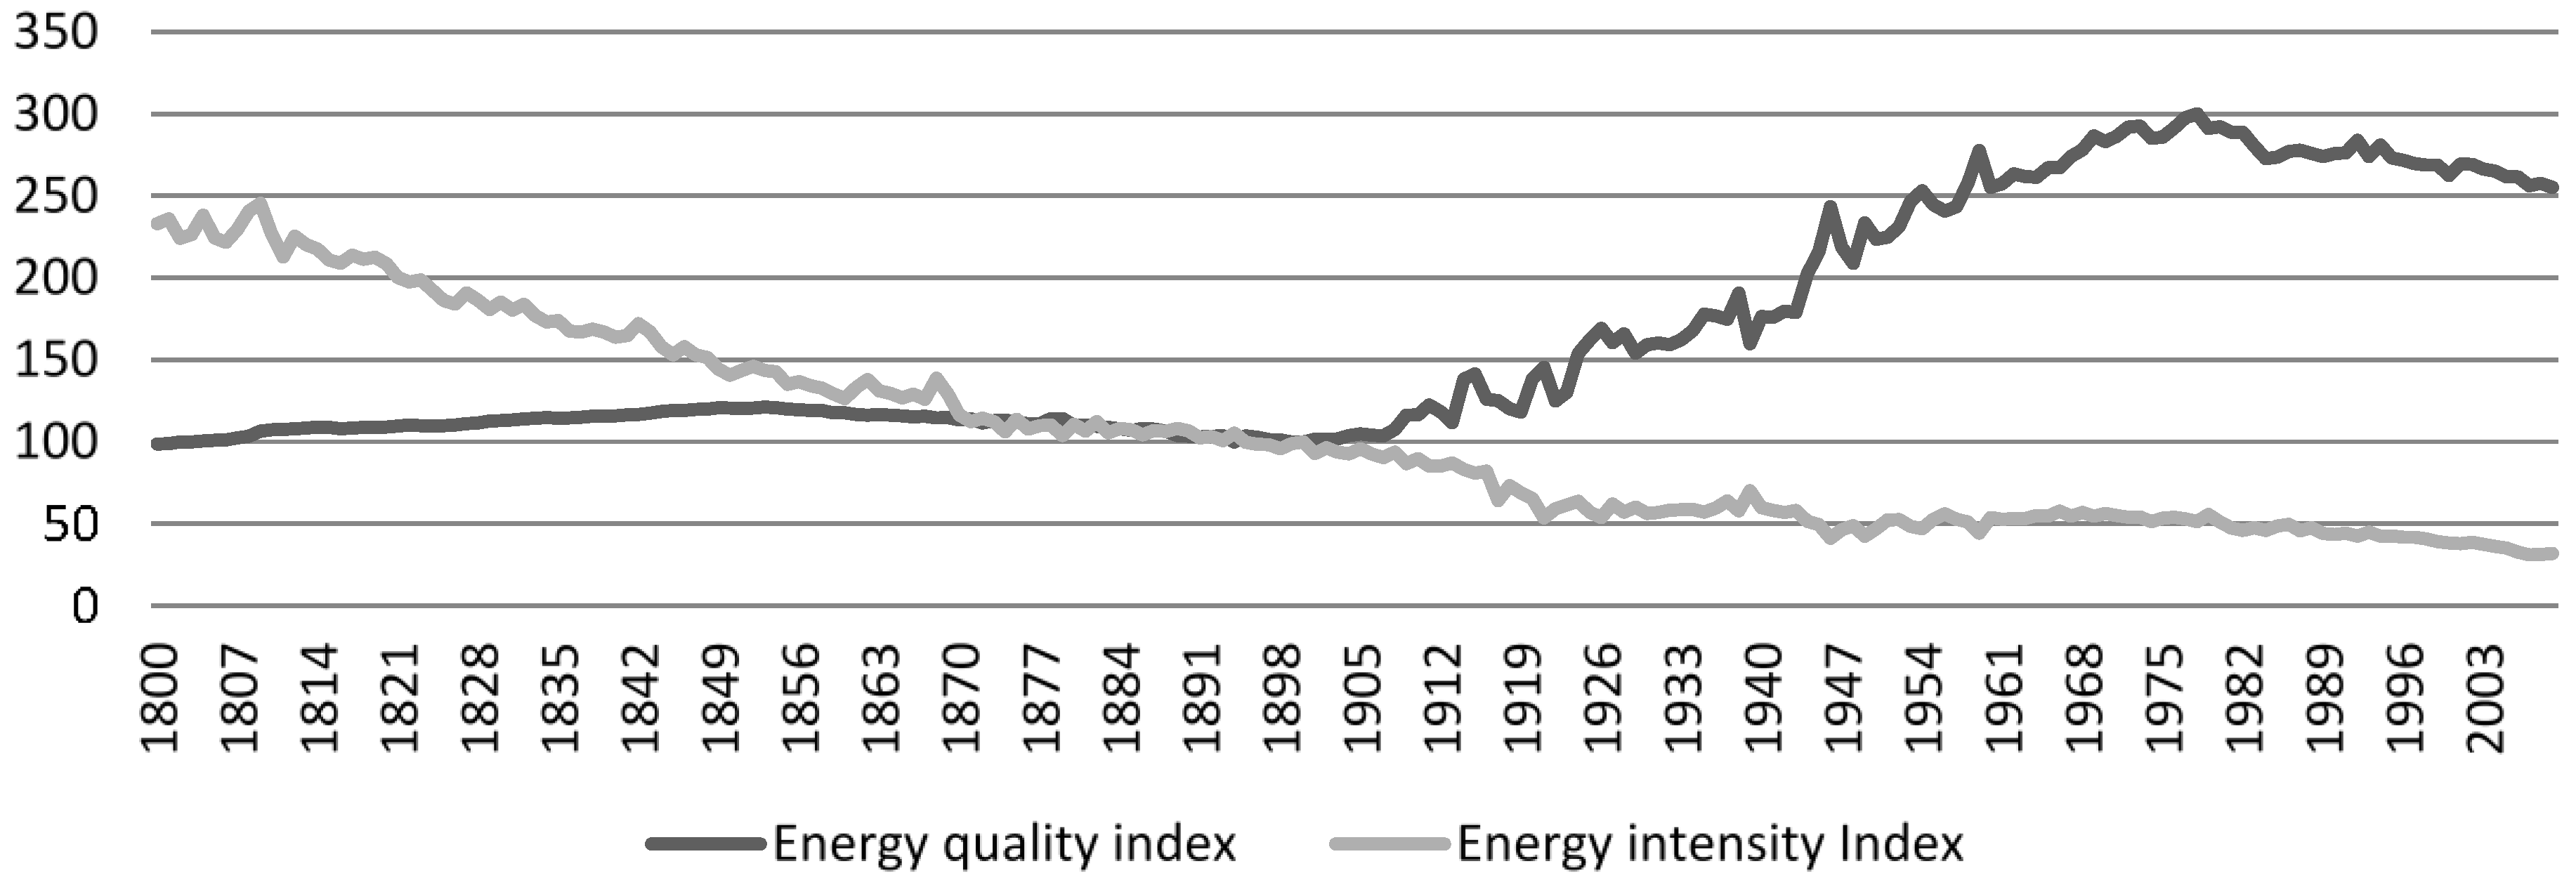
We investigate the role of energy quality changes by constructing an aggregate energy quality index to compare with the trajectory of energy intensity. If the aggregate quality of the energy carriers goes up, it is reasonable to assume that this exerts a downward pressure on energy intensity. If, on the other hand aggregate energy quality deteriorates, this may lead to increases in energy intensity (unless there are other efficiency increasing forces strong enough to counteract such an increase).
Energy carriers are in, some cases like oil, themselves divided into different fractions, such as heating oil, petrol and diesel. These all have their different market structures and different prices. More expensive carriers will be employed only in niche markets (e.g., petrol for internal combustion engines) where substitutability is lower, and hence reflected in their higher price. The price of an energy carrier with its focus on the economic value of utilisation thus also relates to the particular combination of the structures of demand and supply at any one time across a series of partially segmented markets within the national energy economy. This is why we need to have nationally weighted prices of the energy carriers, using both the price of heating oil and petrol weighted by their consumption at any point in time, see
Section 6. Similarly, because economic value (and quality) is determined at the point of retail for consumption, both to avoid double-counting and to create an economic measure of quality we must remove from our data fuels that are used for the generation of electricity (some of which is produced “directly” through water or wind turbines, but much through the combustion of coal, oil or natural gas). In practice the price of electricity will, of course, in part be determined by the cost structure of the forms of generation, some of which may serve other markets (fuel oil, coal, natural gas) and others that do not (nuclear power and renewables), although independent prices for different forms of generation are not readily available. However, while the mix of these alternatives over time is partly shaped by regulation, they must all in the end be retailed at a price that equates to the consumers’ valuation of the qualities of electricity. Our construction of the aggregate energy quality index is laid out in Equations (1)–(4). The value of energy consumed in current prices (EV
t) can be written:
where
Eit is the quantity of the various energy carriers (in joules) and
Pit is the corresponding price of each energy carrier. Over time this index will grow simply because of inflationary price increases that do not reflect any true energy quality increase. To get an idea of the real energy quality increase, we must therefore deflate
EVt by a price index for energy.
We have constructed the energy price index (
EPIt) as a standard Paasche price index with annual links:
The value of energy in constant prices (
) is calculated according to Equation (3):
EVt* is the energy value expressed in constant prices for the subset energy. The next step in constructing the indicator of aggregate energy quality,
qt is to divide the energy value in constant prices by the aggregate energy quantity (in joules):
Berndt [
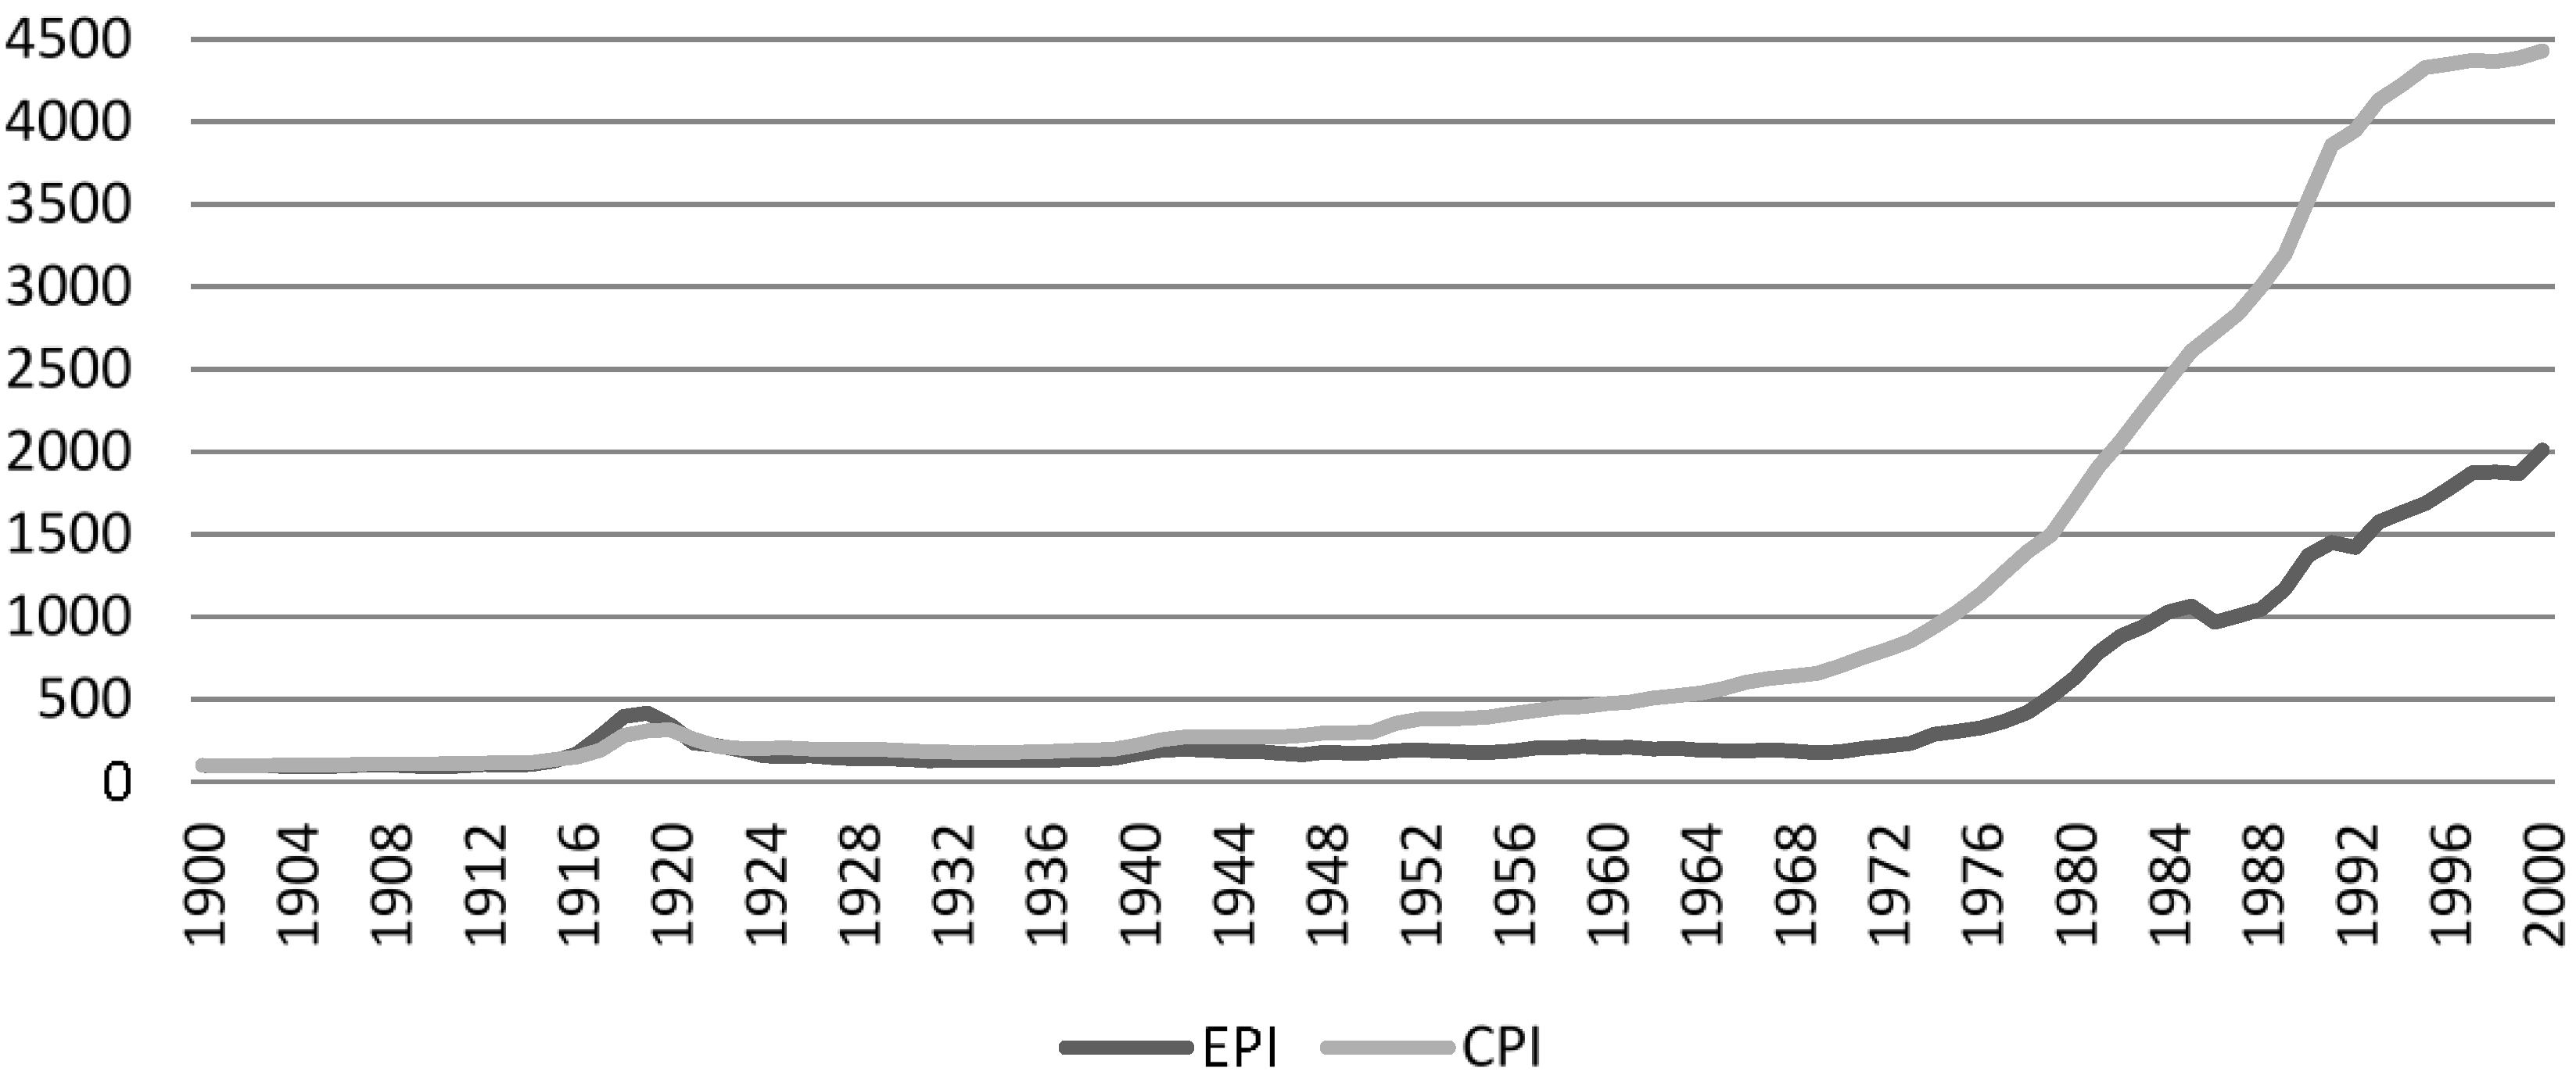
30] uses a similar approach to estimate aggregate energy quality by using energy prices relative to a numeraire (such as the coal price or oil price). Besides the arbitrary choice of the numeraire, which will affect the trends, he uses a consumer price index (CPI) to remove the inflationary effect on energy prices. Berndt’s method assumes that energy prices follow the rest of the prices in the economy, but this is not the case over long periods of time (see
Figure 7 and
Figure 8). Energy prices increased much less than consumer prices during the 20th century both in Sweden and in Britain. Using the CPI instead of an EPI to deflate our energy value would therefore bias both the value of energy in constant prices and the energy quality indicator
q downwards.
Figure 7.
Development of CPI and EPI in Britain between 1900 and 2009 (1900 = 100).
Figure 7.
Development of CPI and EPI in Britain between 1900 and 2009 (1900 = 100).
Figure 8.
Development of CPI and EPI in Sweden between 1900 and 2009 (1900 = 100).
Figure 8.
Development of CPI and EPI in Sweden between 1900 and 2009 (1900 = 100).
5. Concluding Discussion and Remarks
In conclusion, higher energy quality may have stimulated the declining energy intensity in Britain and Sweden over the 20th century, but is not the sole or even main reason for the decline. This is proven by the strongly declining trend in energy intensity after 1970, despite energy quality not improving in Sweden or Britain. Rather, increased economic efficiency in the use of energy services seems to have been the main driver for the decline after 1970 [
3,
22]. We hypothesise that the major influence on growth in this later period was ICT, which needs information services and electricity but did not substantially increase demand for the latter energy carrier. Meanwhile, the economy still requires substantial amounts of energy to maintain old infrastructure [
3].
With this study we have for the first time access to complete national energy retail price series for the last two hundred years for both countries, weighted by the respective shares of the different energy carriers. If both the value of energy and GDP are constructed in constant prices, and divided by each other, this ratio can be considered a complementary way to assess the importance of energy quality for energy intensity. Namely, if the ratio of energy value in constant prices divided by GDP in constant prices stays constant over time, then change in aggregate energy quality is all that drives the inverted U-shaped curve.
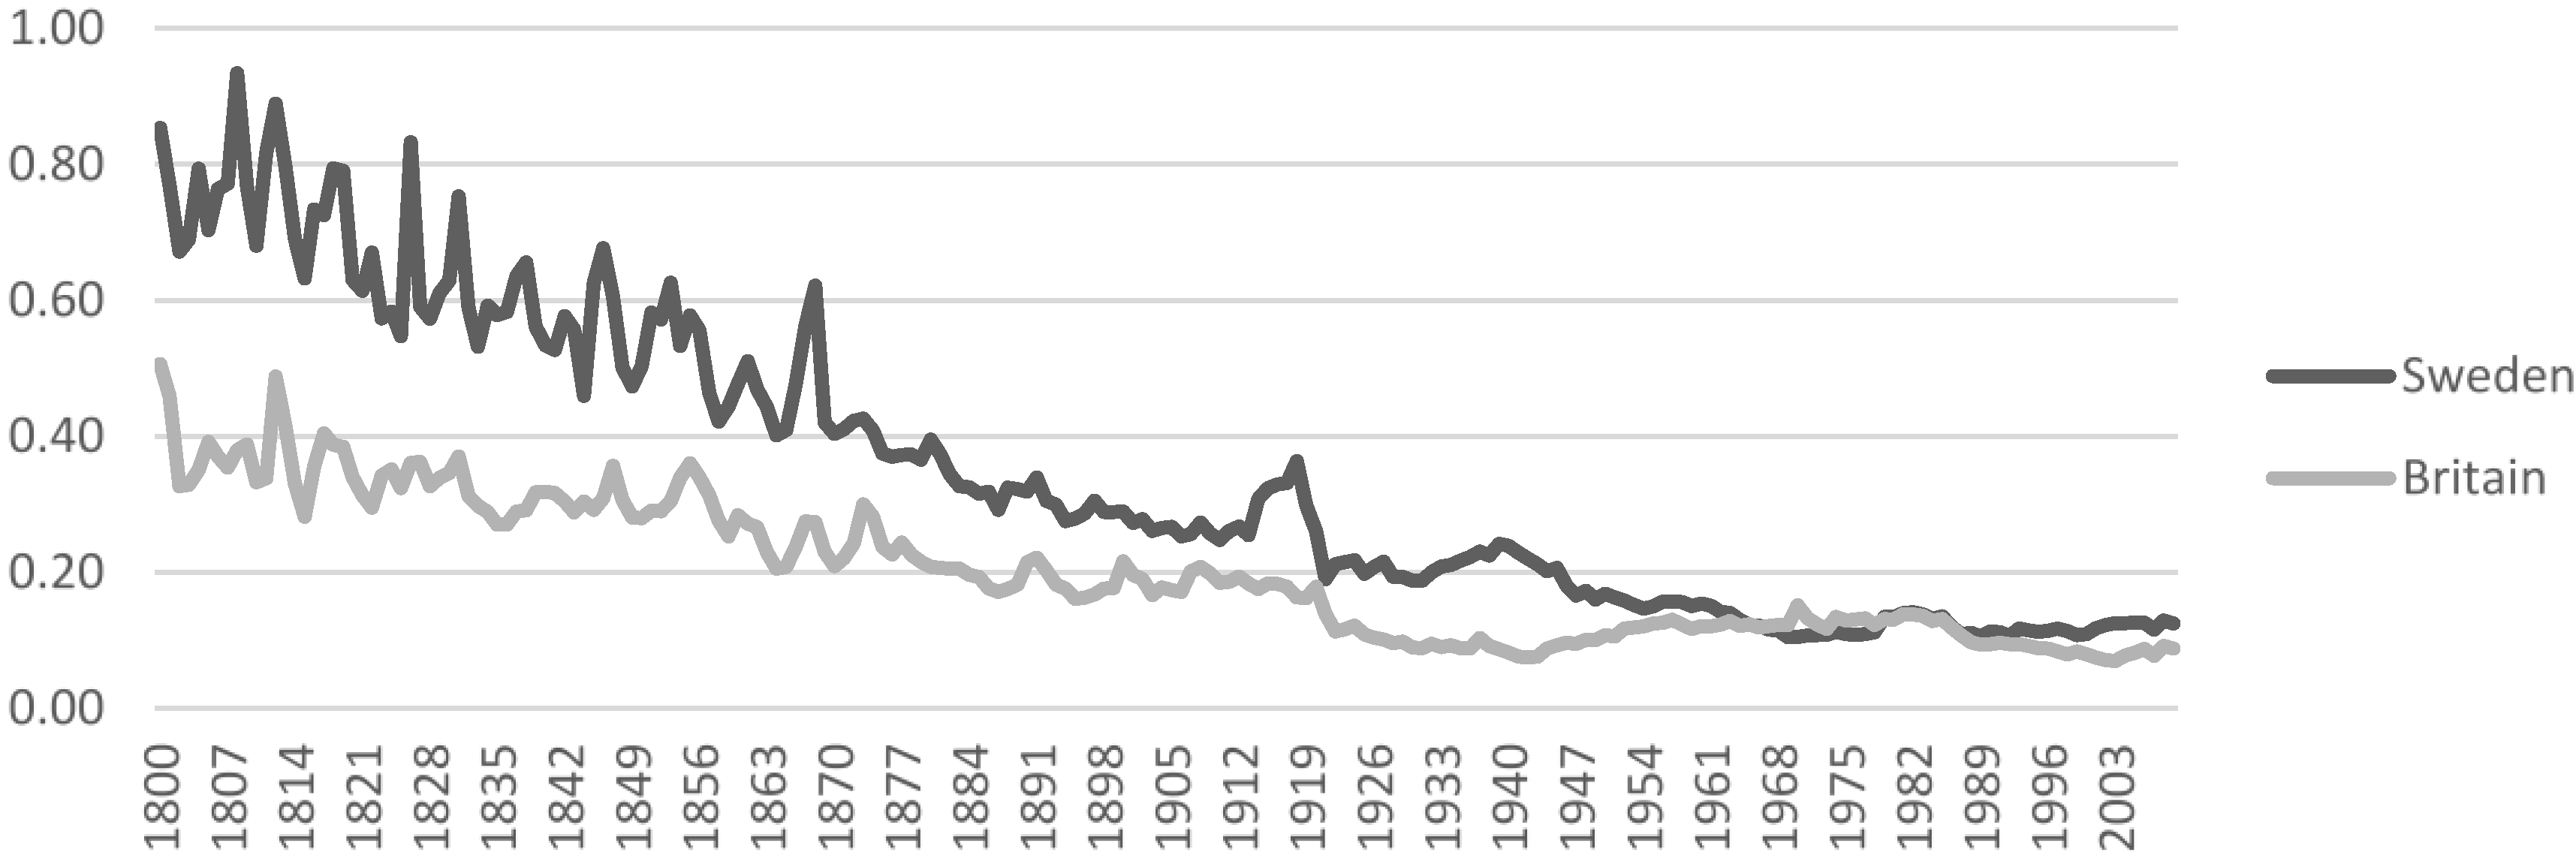
Figure 11 shows this ratio, and unsurprisingly given our previous analyses in this paper, the ratio is not constant over time.
Figure 11.
Energy value in constant prices divided by GDP in constant prices, 1900 price level year, for Britain and Sweden.
Figure 11.
Energy value in constant prices divided by GDP in constant prices, 1900 price level year, for Britain and Sweden.
It should be stated that the ratio depicted in
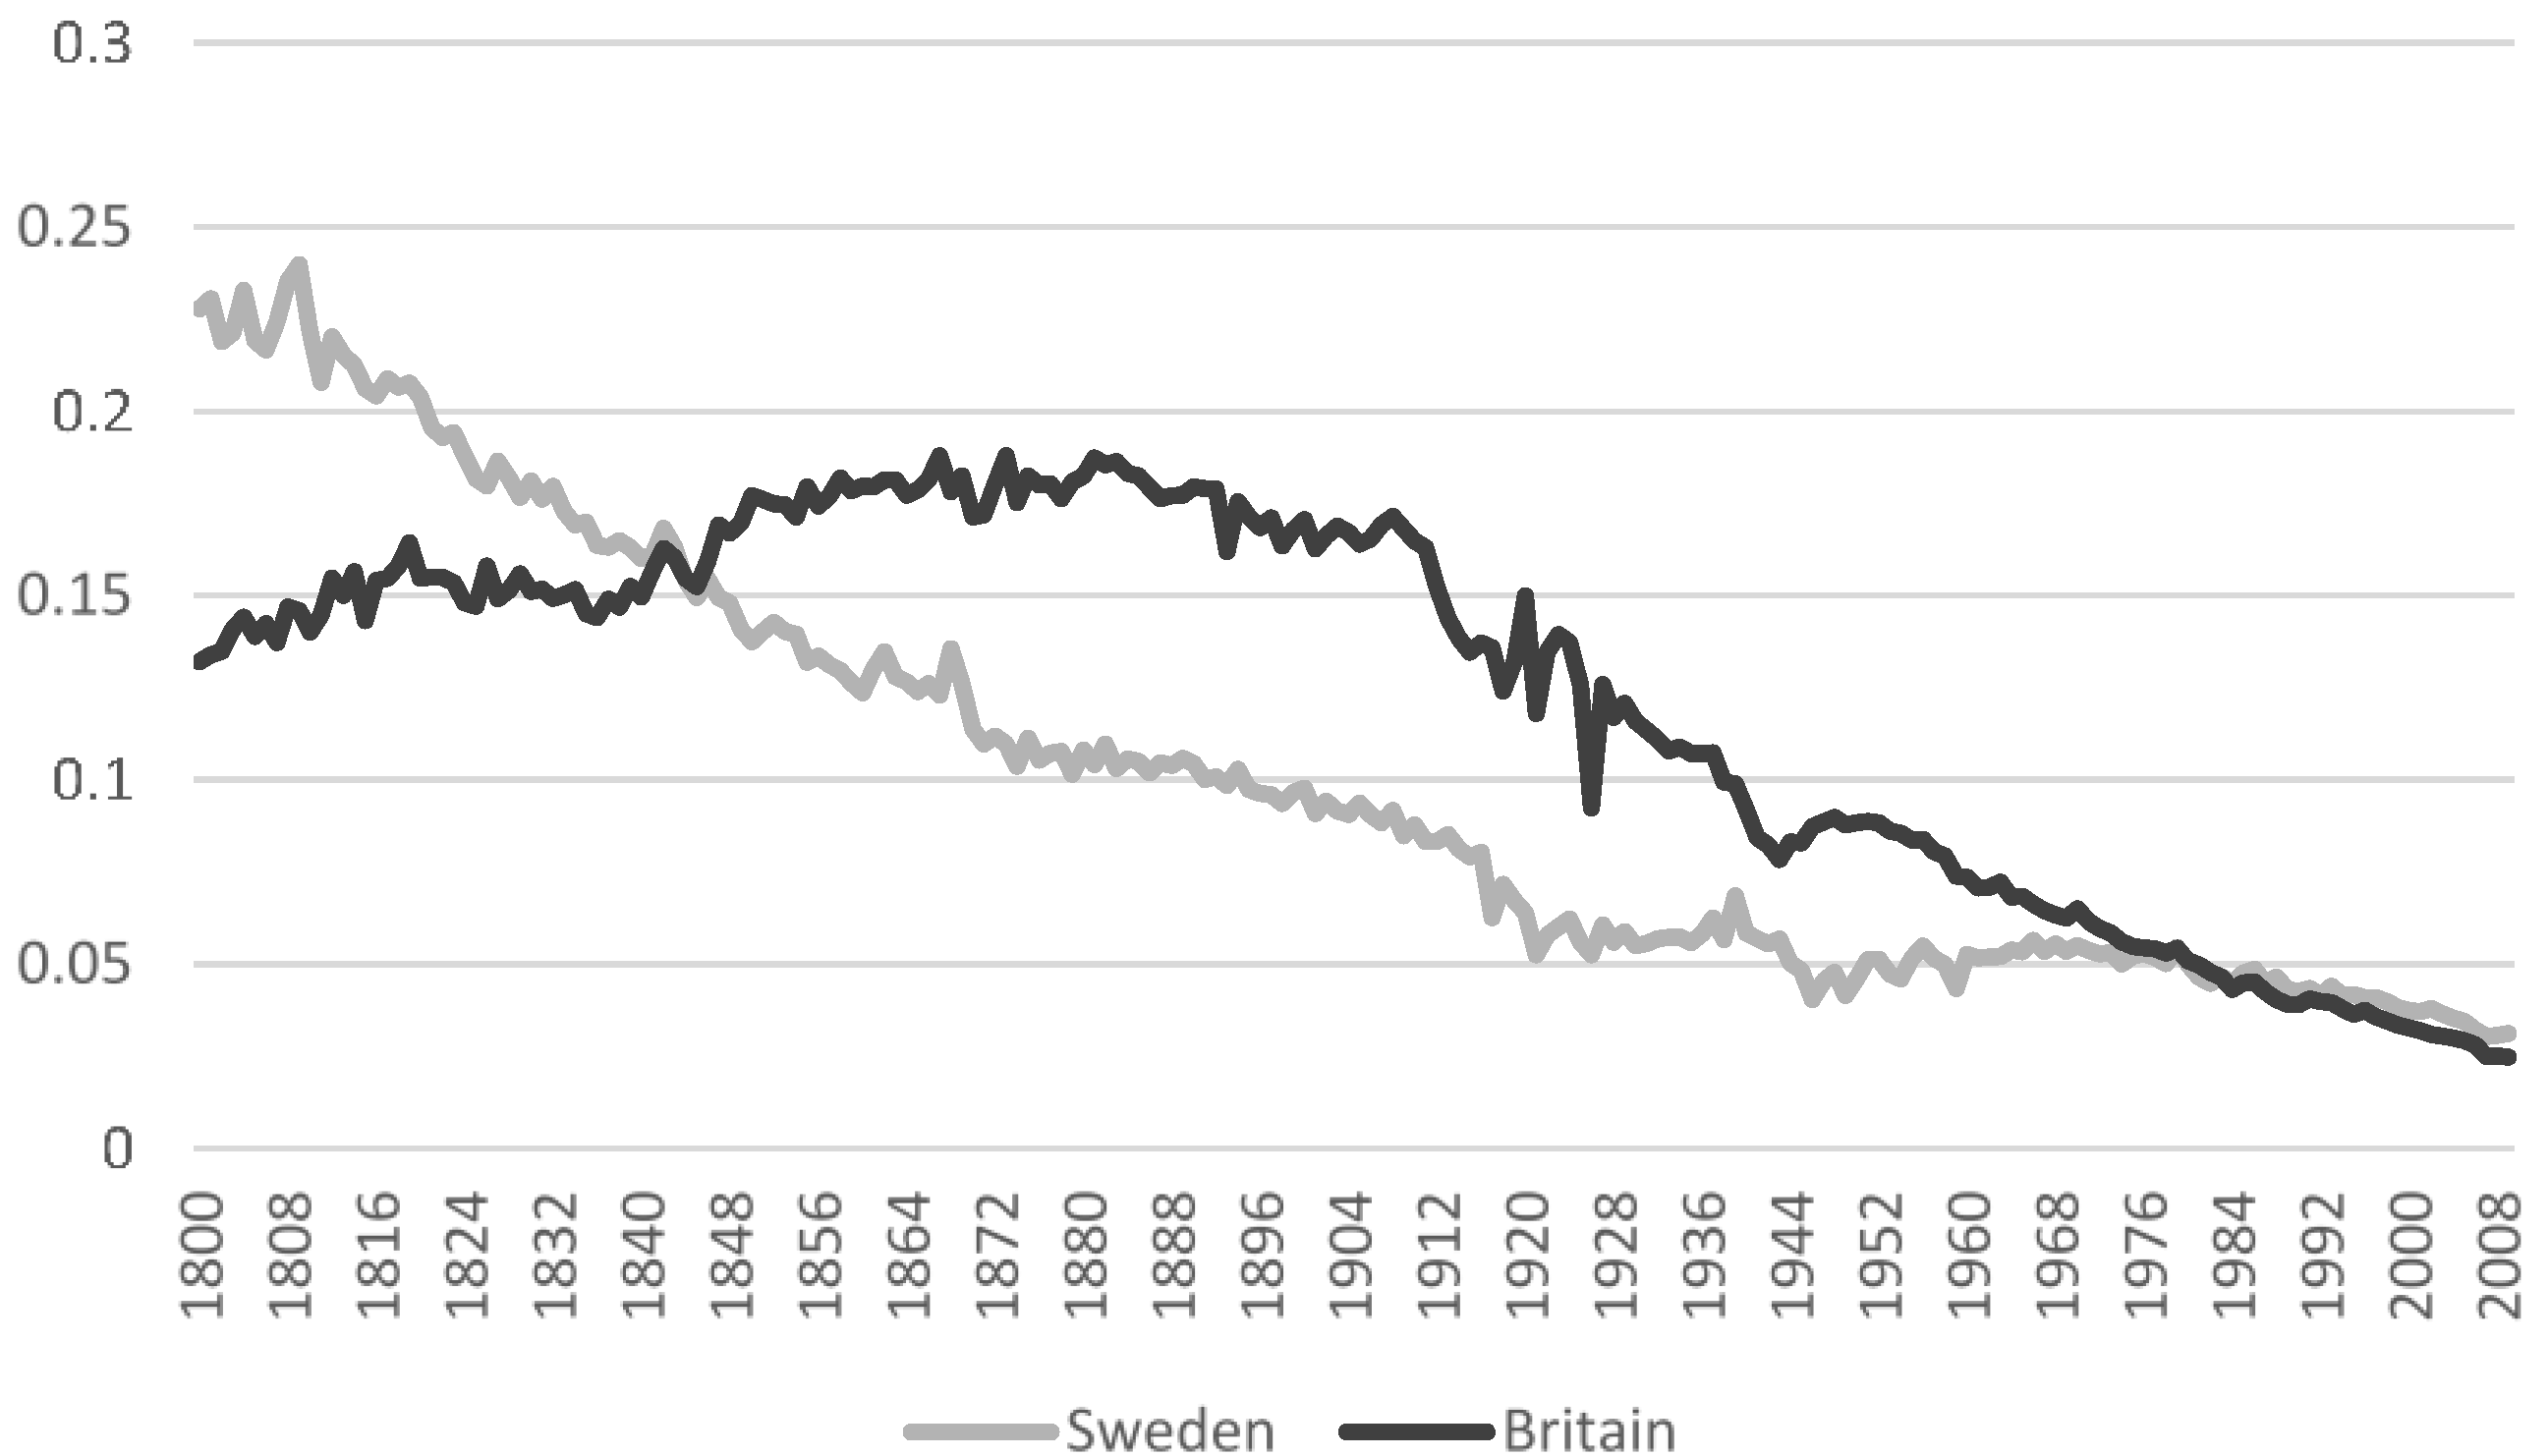
Figure 11 is not the same thing as the conventional energy cost share, which is normally constructed in nominal prices. The reason why these two ratios are not the same is because for our measure we use separate price indices to deflate GDP and energy value. If instead we had deflated both series with the same price index then obviously the ratio would have been identical to the energy cost share. The energy cost share reflects how large the energy costs incurred to the economy looked like at every point in time. This ratio is of importance for models that analyse the relationship between energy and growth. Most models take a constant cost share relation for granted, based on recent decades, but if this is not the case in the long run there is a need for alternative models [
13]. Kander [
10] has already shown that the energy cost share for Sweden declined drastically since the 19th century. With our new data we are able to show that Britain also saw a decline in cost share, see
Figure 12, albeit not as large as in Sweden.
In summary, we have demonstrated that while energy quality improvements may have mattered for energy intensity decline over much of the 20th century, the development during the 19th century and after 1970 shows that there is much more to the story.
Figure 12.
Energy cost share to GDP in Sweden and Britain, nominal prices.
Figure 12.
Energy cost share to GDP in Sweden and Britain, nominal prices.
6. Data
Calculations of energy quality are based on final consumption and retail prices. As a substantial portion of primary energy inputs may take the form of fuels used for secondary electricity generation (such as coal, oil and natural gas), fuels used for these purposes must be deducted from data on primary inputs.
Swedish data for energy prices and energy consumption are taken from Kander [
10] and were updated to 2009 on the basis of prices from Statistics Sweden [
32] and energy consumption data from the Swedish Energy Agency [
33]. Swedish GDP figures are from Krantz and Schön [
34].
British GDP data is taken from Hills
et al. [
17] with adjustments made to remove Ireland from the UK series on the basis of Crafts [
35] with the assumption that the ratio between British and Irish per capita GDP remains stable between 1855 and 1870; and after 1921, on a population basis to remove Northern Ireland.
Data on energy consumption in Britain is an updated version of Warde [
36] on England and Wales with adjustments made to create a dataset for Great Britain rather than the UK. In the case of most carriers, it is assumed that
per capita consumption in Scotland was the same as in England & Wales. Early oil consumption is allocated on a GDP basis. In all series, after 1921, Northern Ireland is deducted from UK figures on a population basis, except for primary electricity, as all of Northern Ireland’s electricity is coal-fired.
Price data is available for download and is described in detail on the website of the Joint Center for History and Economics [
12]. A brief description is included below. Where prices are only available for England and Wales, they are assumed to be the same for Britain.
Coal prices in the 19th century take returns from gas companies as a departure point [
37,
38,
39,
40]. The data is available for 1821–1865 and is extended to a retail price survey of 1905 using the ratio of this national price series to local wholesale prices [
41,
42], and pithead prices [
43]. (Clark [
44] has provided a price series for the rest of England up until 1869 on-line. The sources cited do not however provide any indication of the way it was produced or how local data was weighted. We find Clark’s series to be rather high prior to the mid-1840s, which may indicate a bias towards the south of England. Alternative series are discussed in the
supplementary on-line material). This is then linked to further surveys of retail prices, both national and regional to establish national benchmarks with interpolated trends using pithead data. From 1925 until 1937, with a relatively integrated national market, London retail prices can be used [
42,
45,
46,
47,
48]. Retail Price Index data for solid fuels is available since 1948 [
49]. We use January prices anchored to a national price level established by a national household survey of 1953 [
48]. (Roger Fouquet [
50] provides series of energy prices deflated by a CPI. For the period prior to 1866 he used Clark [
44] and between 1866 and 1966, price series for London and exports found in Mitchell [
51]. In contrast, we have used national retail price data). It should be noted that prices paid by different consumers varied somewhat after 1948 due to the policies of the nationalized industries and subsidies [
52]. We have consistently used retail prices as being the best indicator of market value and hence quality.
Oil prices from 1954 onwards are primarily retrieved from DUKES [
53]. In order to extend the oil price series backwards, we employ retail petrol prices from Jenkins [
54] and import price series covering 1862–1937 [
45,
55,
56,
57,
58,
59,
60,
61].
The electricity prices series is constructed combining data from Department of Energy & Climate Change [
62] and Hannah [
63]. Wood prices in England are obtained from Clark [
44]. Data on natural gas prices for the period between 1970 and 2009 for UK is available from DUKES [
64].
Grain prices are assumed a good proxy for the cost of muscle energy, that is the price of the energy from both the labor force directly, and animals providing traction. Prices of grain production in England and Wales in 1800–1938 are available in Thirsk [
65,
66] and in the Parliamentary Papers [
45,
60,
61]. From 1938, by which date the muscle energy provided from animals becomes negligible in aggregate terms, the series is based on retail food prices from Office of National Statistics [
67,
68].
Fuel price development in Britain and Sweden are plotted in
Figure 13 and
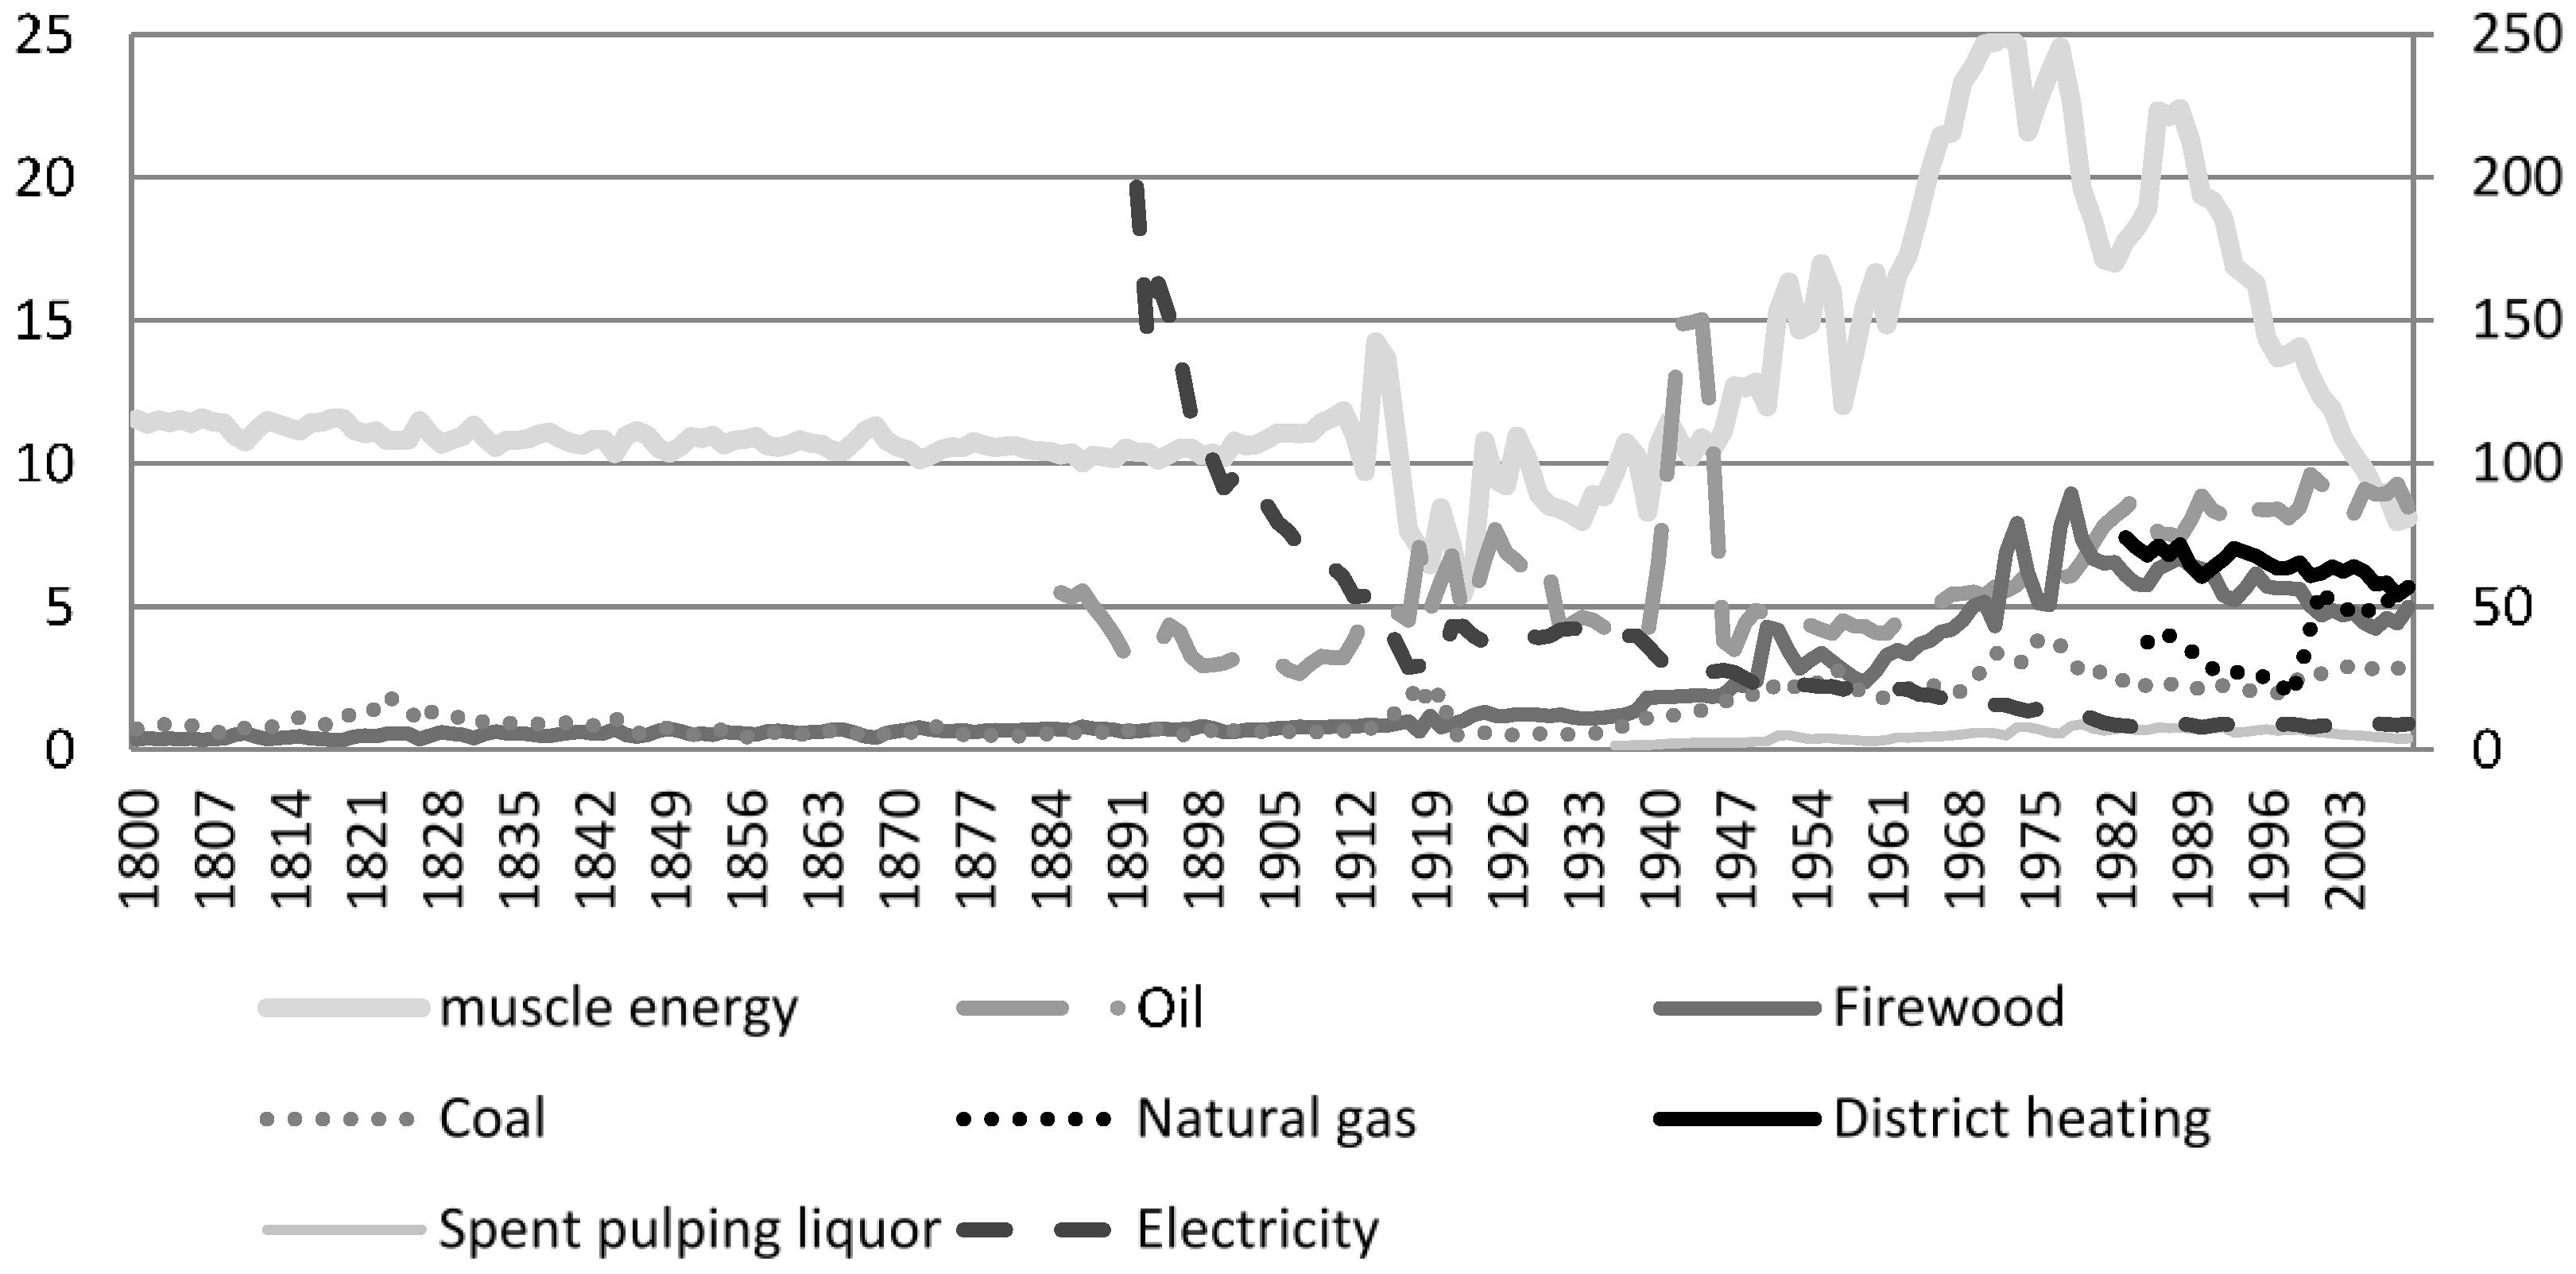
Figure 14. The prices are deflated with the Energy Price Index for each country, expressed at the level of 1900 prices. (The prices are deflated with a price index with an annually changing base year, which makes them into constant prices. We have chosen to express all the series at 1900 price level. These series are thus suitable for trend analyses and comparisons of trends over time, but not for level comparisons, because the choice of price level year affects the relative levels between the energy carriers. In 1900 electricity was still very expensive compared to coal for instance, but this difference has shrunk over time. Choosing another price level year would thus change the levels).
This allows a comparison of:
- (a)
The relative qualities of each energy carrier. We can see, for example, how oil (consumed as petrol) and electricity are much more expensive than coal (remembering that the price of electricity is displayed on the right axis in
Figure 13 and
Figure 14).
- (b)
Change in relative quality as expressed by price over time. Hence, prices reflect the limited (high-value) uses and cost conditions when fuels are first introduced, such as oil when primarily used for lighting in the late 19th century, and electricity when largely confined to very localised distribution systems.
- (c)
Difference in the relative prices and their trends between the two countries (shown in
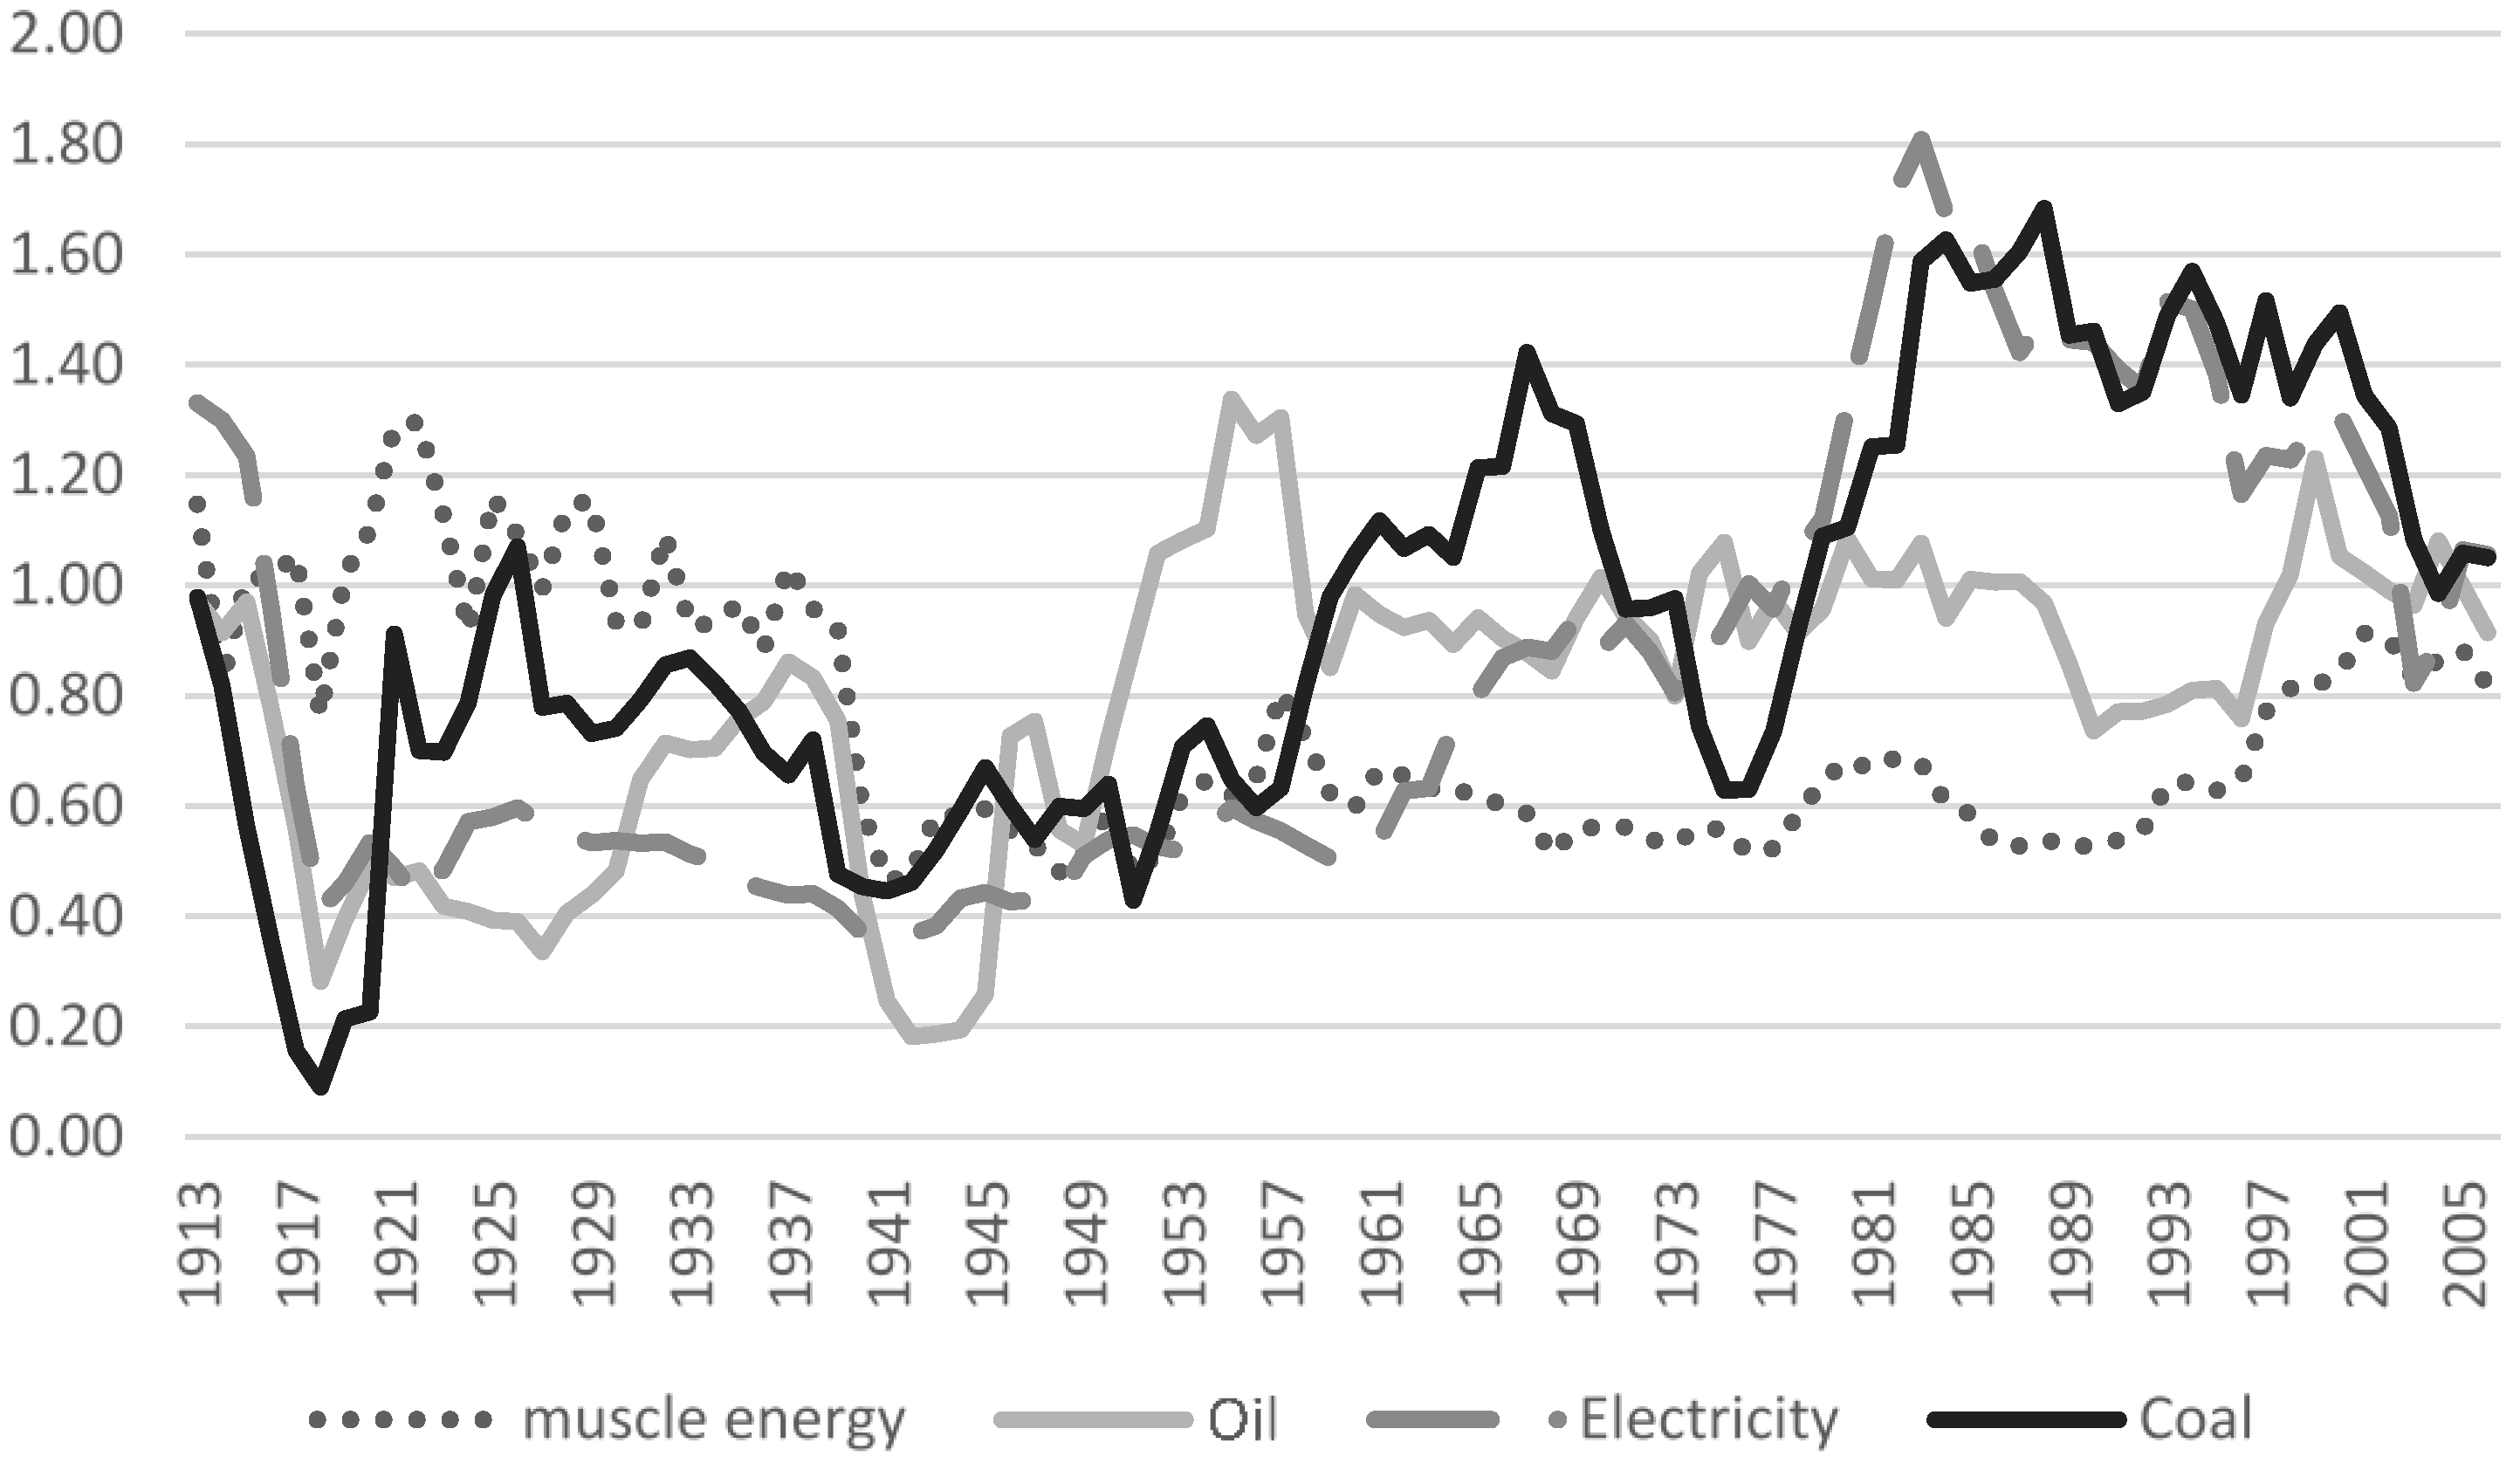
Figure 15). Here we can see that generally speaking energy was more expensive in Sweden in the first half of the 20th century, but this situation altered in the post-war years. The internationally-traded oil has been priced similarly in each country, but coal (only a small part of the Swedish market) and electricity retailed at lower prices in Sweden, while muscle energy (
i.e., food) was rather more expensive. The 21st century has seen a convergence in price levels.
Figure 13.
Development of prices in Britain (mln£/PJ, constant prices with the price level 1900), electricity price on the right axis.
Figure 13.
Development of prices in Britain (mln£/PJ, constant prices with the price level 1900), electricity price on the right axis.
Figure 14.
Development of prices in Sweden (mlnSEK/PJ, constant prices with the price level 1900), electricity price on the right axis. Note: “District heating is a system of centralised heat production and distribution typically employed in urban areas. The systems usually consist of heat plants (often producing heat and electricity simultaneously) and a network of distribution and return pipes” [
69]. In the case of Sweden it often includes spill energy from industrial plants.
Figure 15.
Ratio between nominal energy prices in Britain and Sweden. Source: Exchange rate from [
19] and own calculations.
Figure 15.
Ratio between nominal energy prices in Britain and Sweden. Source: Exchange rate from [
19] and own calculations.


