
Anaerobic Digestion and Biogas Potential: Simulation of Lab and Industrial-Scale Processes


Abstract
:1. Introduction
2. Background
3. Methodology
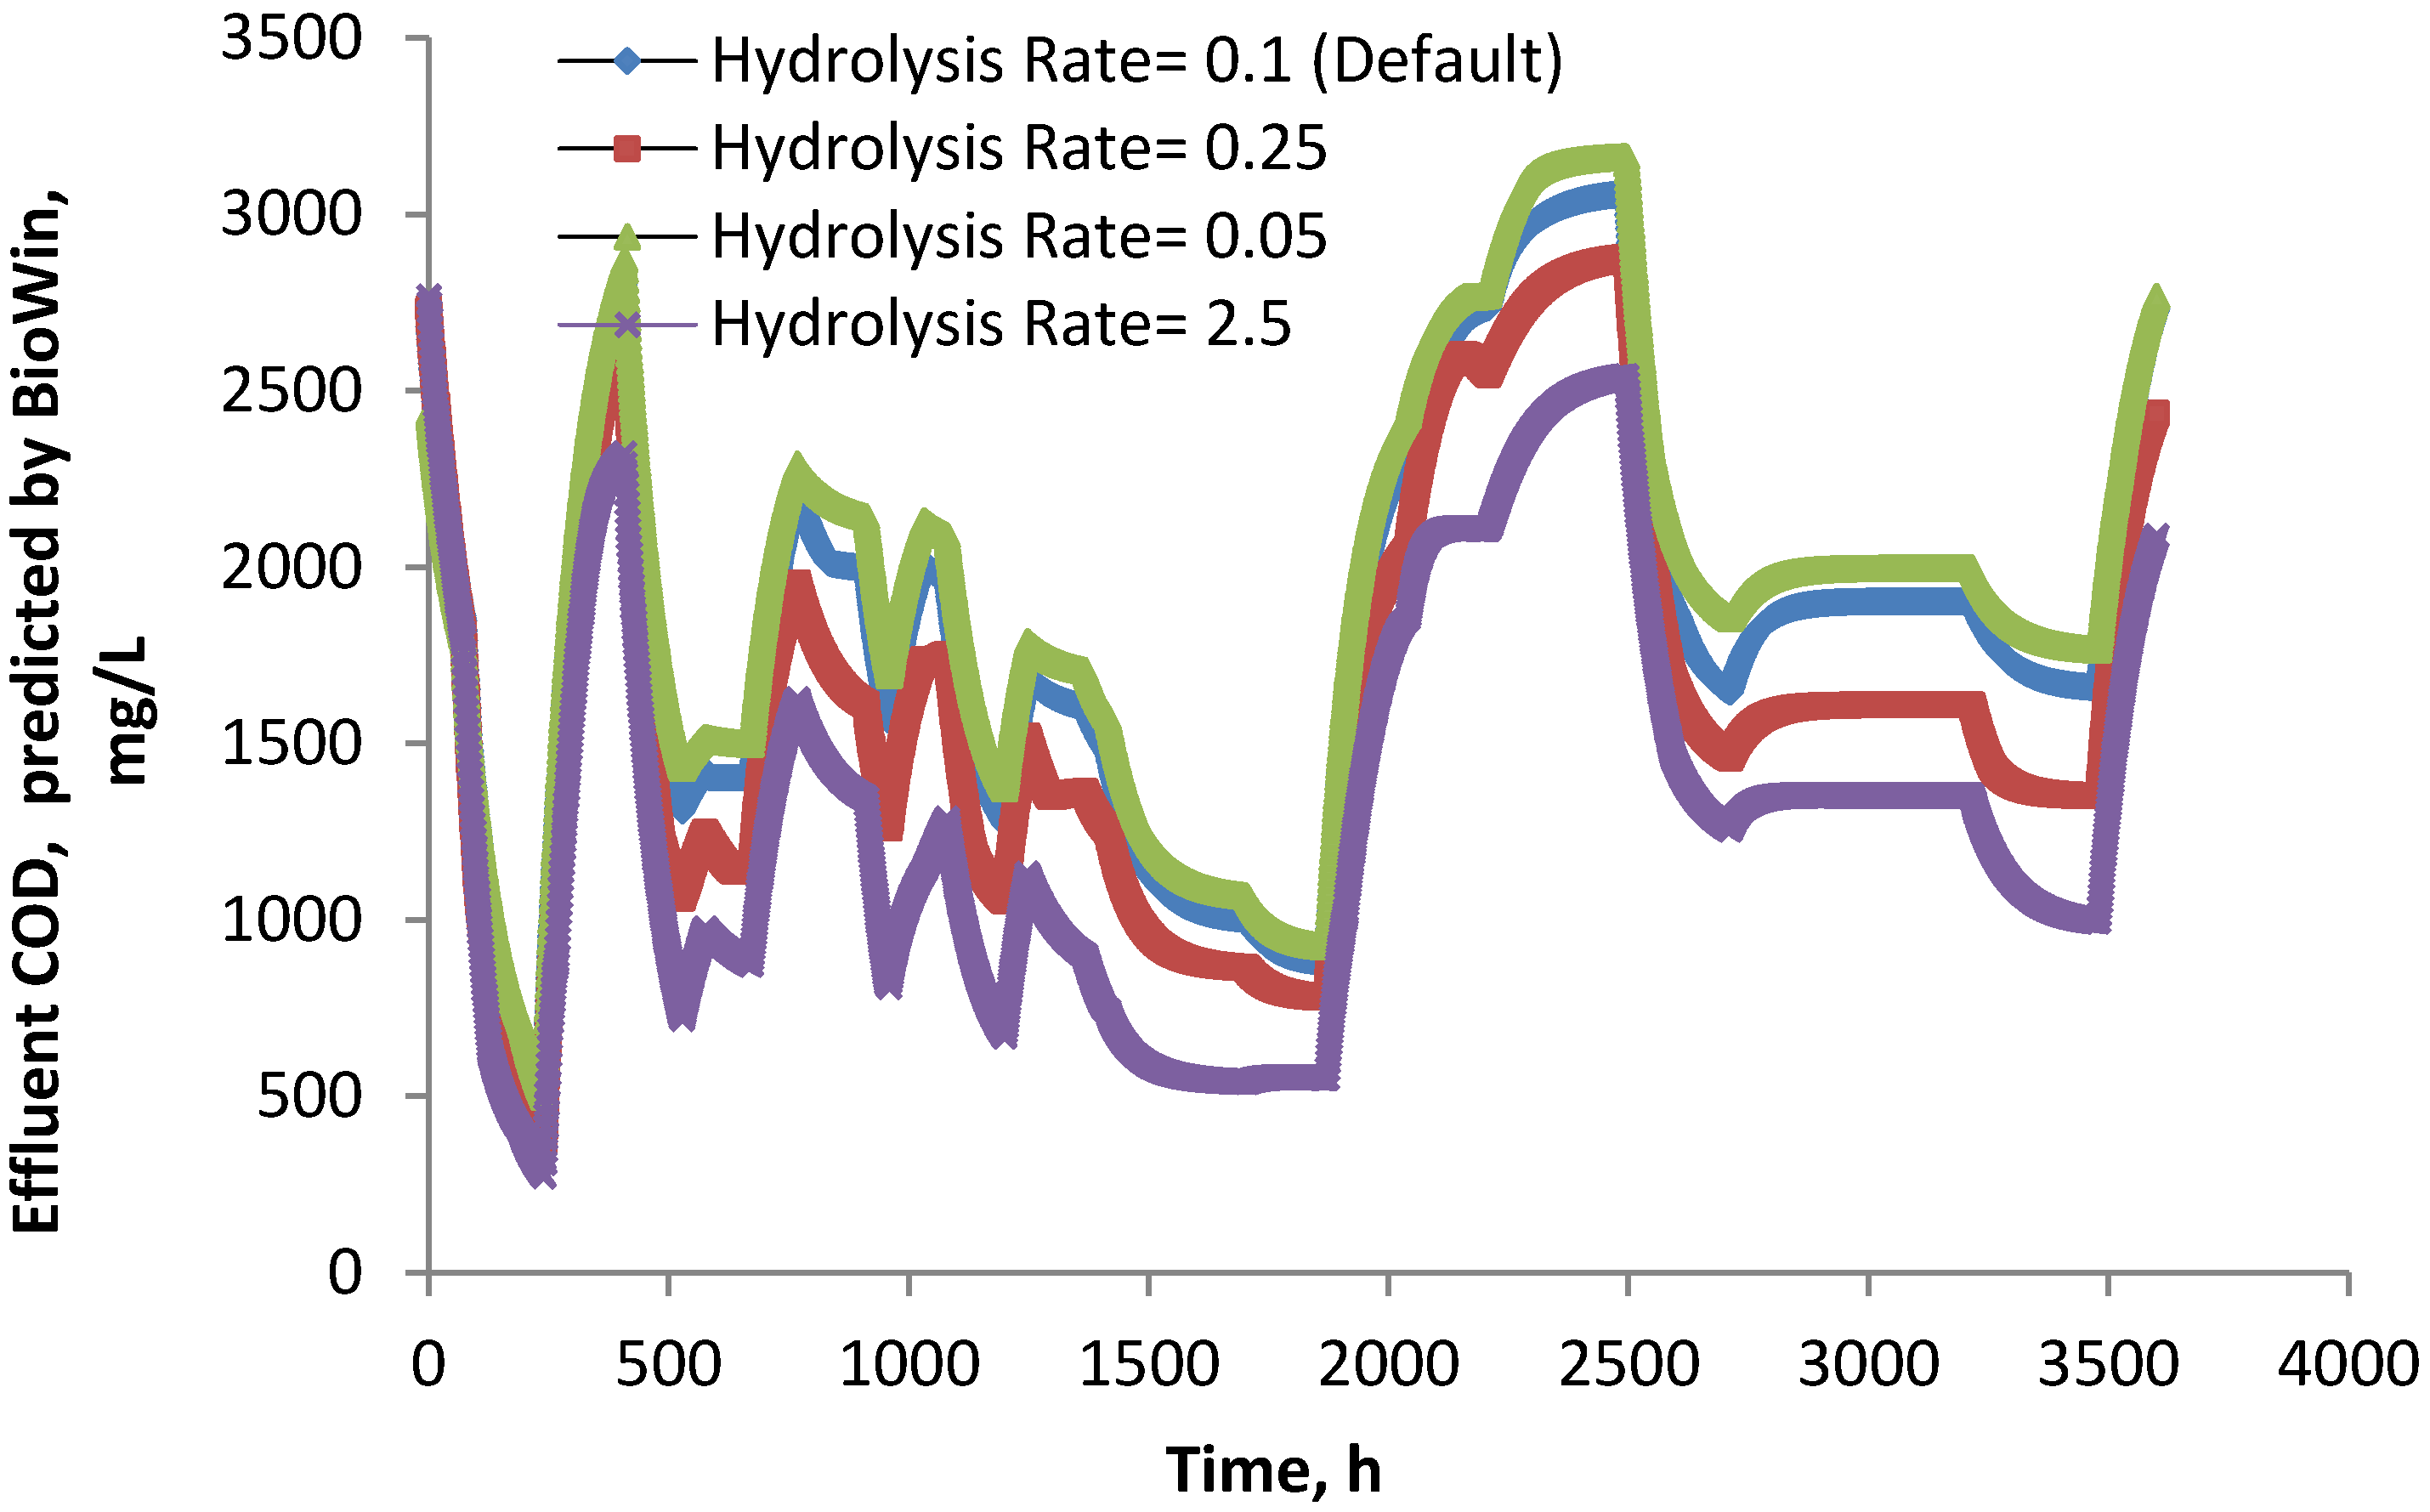
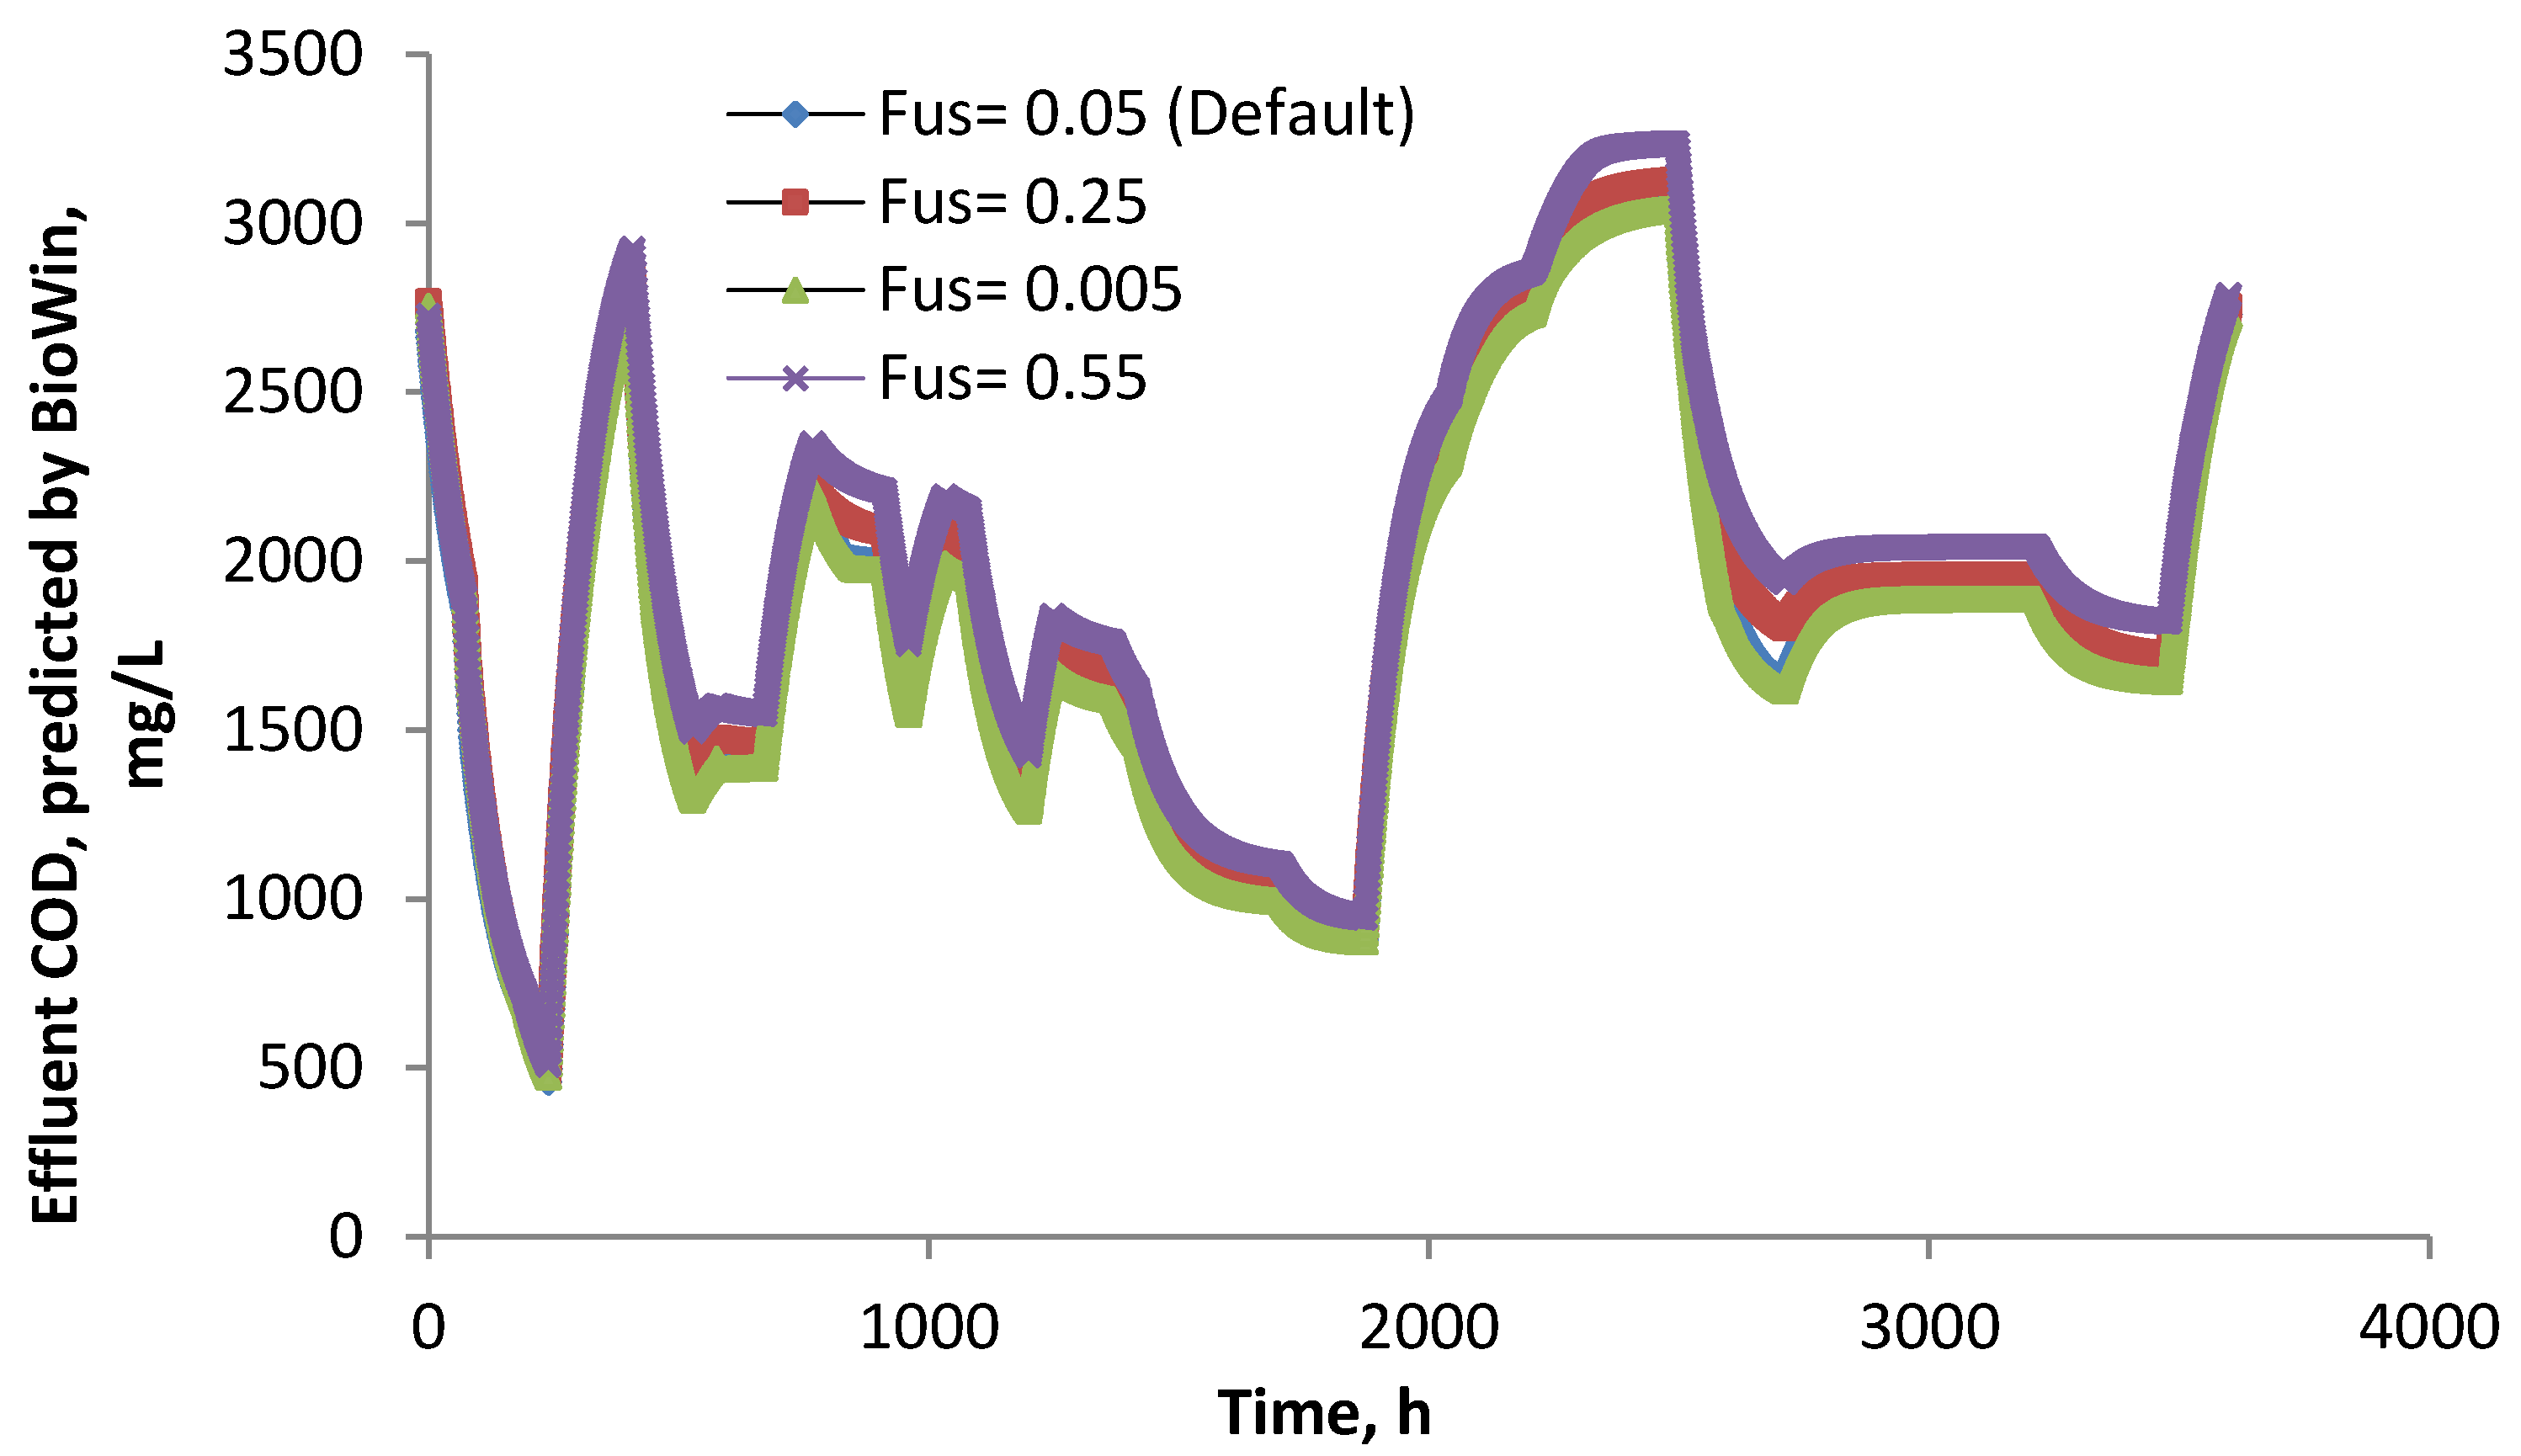
3.1. Sensitivity Analysis


| Parameter | Description | Sensitivity |
|---|---|---|
| Kinetic, hydrolysis rate (AD) | 1/day | High, limiting step |
| Wastewater fraction, Fus | Unbiodegradable soluble gm COD/gm of total COD | Low |
| Wastewater fraction, Fup | Unbiodegradable particle gm COD/gm of total COD | Low |
| Wastewater fraction, Fbs | Readily biodegradable (including acetate) gm COD/gm of total COD | High |
| Wastewater fraction, Fxp | Non-colloidal slowly biodegradable gm COD/gm of slowly degradable COD | Low |
| Wastewater fraction, Fac | Acetate gm COD/gm of readily biodegradable COD | Low |
| Operation, seed sludge age | In days | Low |
3.2. Model Calibration Methods
3.3. Description of the Two Anaerobic Systems
3.3.1. Scenario 1: Industrial-Scale Anaerobic Continuous Lagoon
- ▪
- Working days in the plant are 5 days;
- ▪
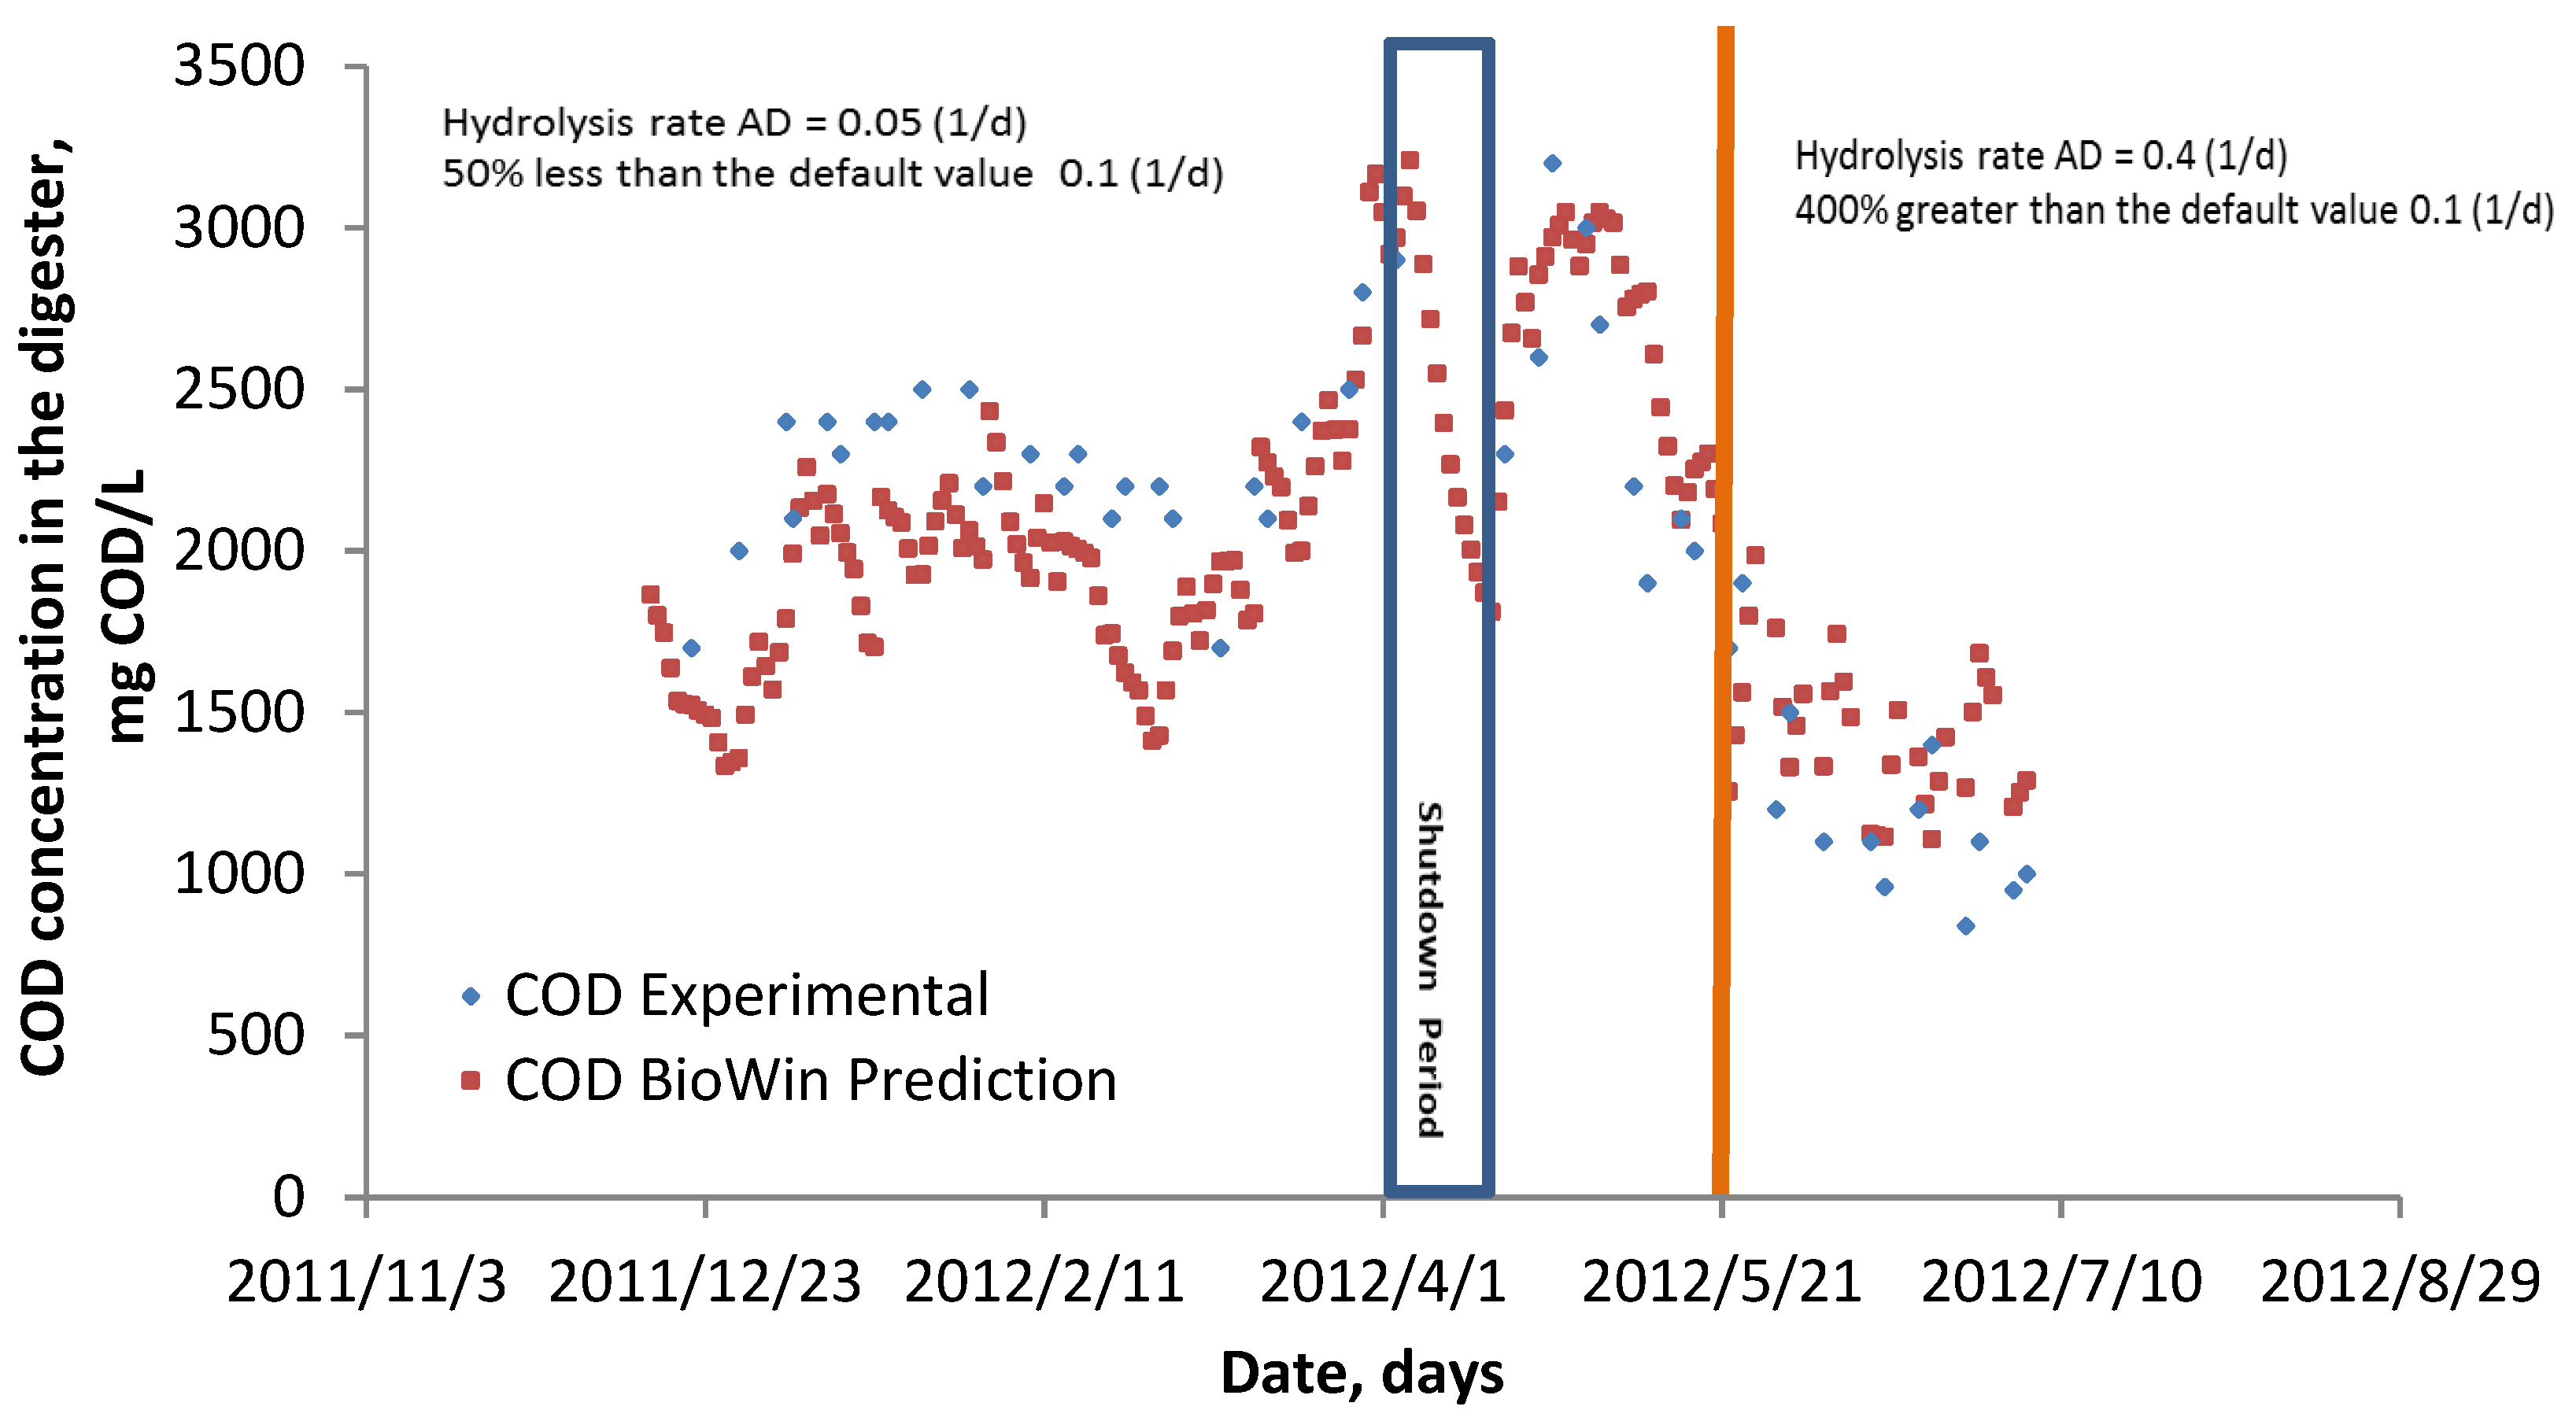
- Plant shutdown happened from 5 to 16 April (no flow of wastewater to the lagoon);
- ▪
- Temperature variation during the whole monitoring period;
- ▪
- Change in the flow rate from 290 m3/day to 350 m3/day in late February.
| Parameter | Unit | Mean values for different periods over 30 days | Comments | |||
|---|---|---|---|---|---|---|
| 15 December 2011–24 February 2012 | 27 February–4 April 2012 | Shut down 5–16 April 2012 | 17 April–5 July 2012 | Every Saturday and Sunday | ||
| Flow rate | m3/day | 290 | 350 | 0 | 350 | 0 |
| Total COD | mg COD/L | 2200–7800 | 2200–7400 | 0 | 1600–5500 | 0 |
| TKN | mgN/L | 130–350 | 150–450 | 0 | 130–450 | 0 |
| TP | mgP/L | 23 | 23 | 0 | 23 | 0 |
| Nitrate N | mgN/L | 0 | 0 | 0 | 0 | 0 |
| pH | - | 8.39–6.97 | 8.26–6.7 | 0 | 6.93–8.68 | 0 |
| Alkalinity | mmol/L | 13 | 13 | 0 | 13 | 0 |
| ISS * | mgs/L | 200 | 200 | 0 | 200 | 0 |
| Ca | mg/L | 115 | 115 | 0 | 115 | 0 |
| Mg | mg/L | 20 | 20 | 0 | 20 | 0 |
| DO | mg/L | 0 | 0 | 0 | 0 | 0 |
| Parameters | Unit | Value |
|---|---|---|
| Volume | m3 | 2700 |
| Depth | m | 5 |
| Temperature | °C | 14.4–43.1 |
3.3.2. Scenario 2: Laboratory-Scale Batch Reactor
| Time (day) | Flow rate (m3/day) | TCOD (mg COD/L) | TKN (mg N/L) | TP (mg P/L) | Nitrate N (mg N/L) | pH | Alkalinity (mmol/L) | ISS (mg SS/L) | Ca (mg/L) | Mg (mg/L) | DO (mg/L) |
|---|---|---|---|---|---|---|---|---|---|---|---|
| 1 | 0.0024 | 2700 | 280 | 38.6 | 55 | 7 | 4.86 | 45 | 80 | 15 | 0 |
| 2 | 0 | 0 | 0 | 0 | 0 | 0 | 0 | 0 | 0 | 0 | 0 |
| -- | 0 | 0 | 0 | 0 | 0 | 0 | 0 | 0 | 0 | 0 | 0 |
| -- | 0 | 0 | 0 | 0 | 0 | 0 | 0 | 0 | 0 | 0 | 0 |
| 30 | 0 | 0 | 0 | 0 | 0 | 0 | 0 | 0 | 0 | 0 | 0 |
| Parameters | Unit | Value |
|---|---|---|
| Volume | m3 | 0.0024 |
| Depth | m | 1.07 |
| Temperature | °C | 30 |
4. Results and Discussions
4.1. Scenario 1: Industrial-Scale Continues Lagoon


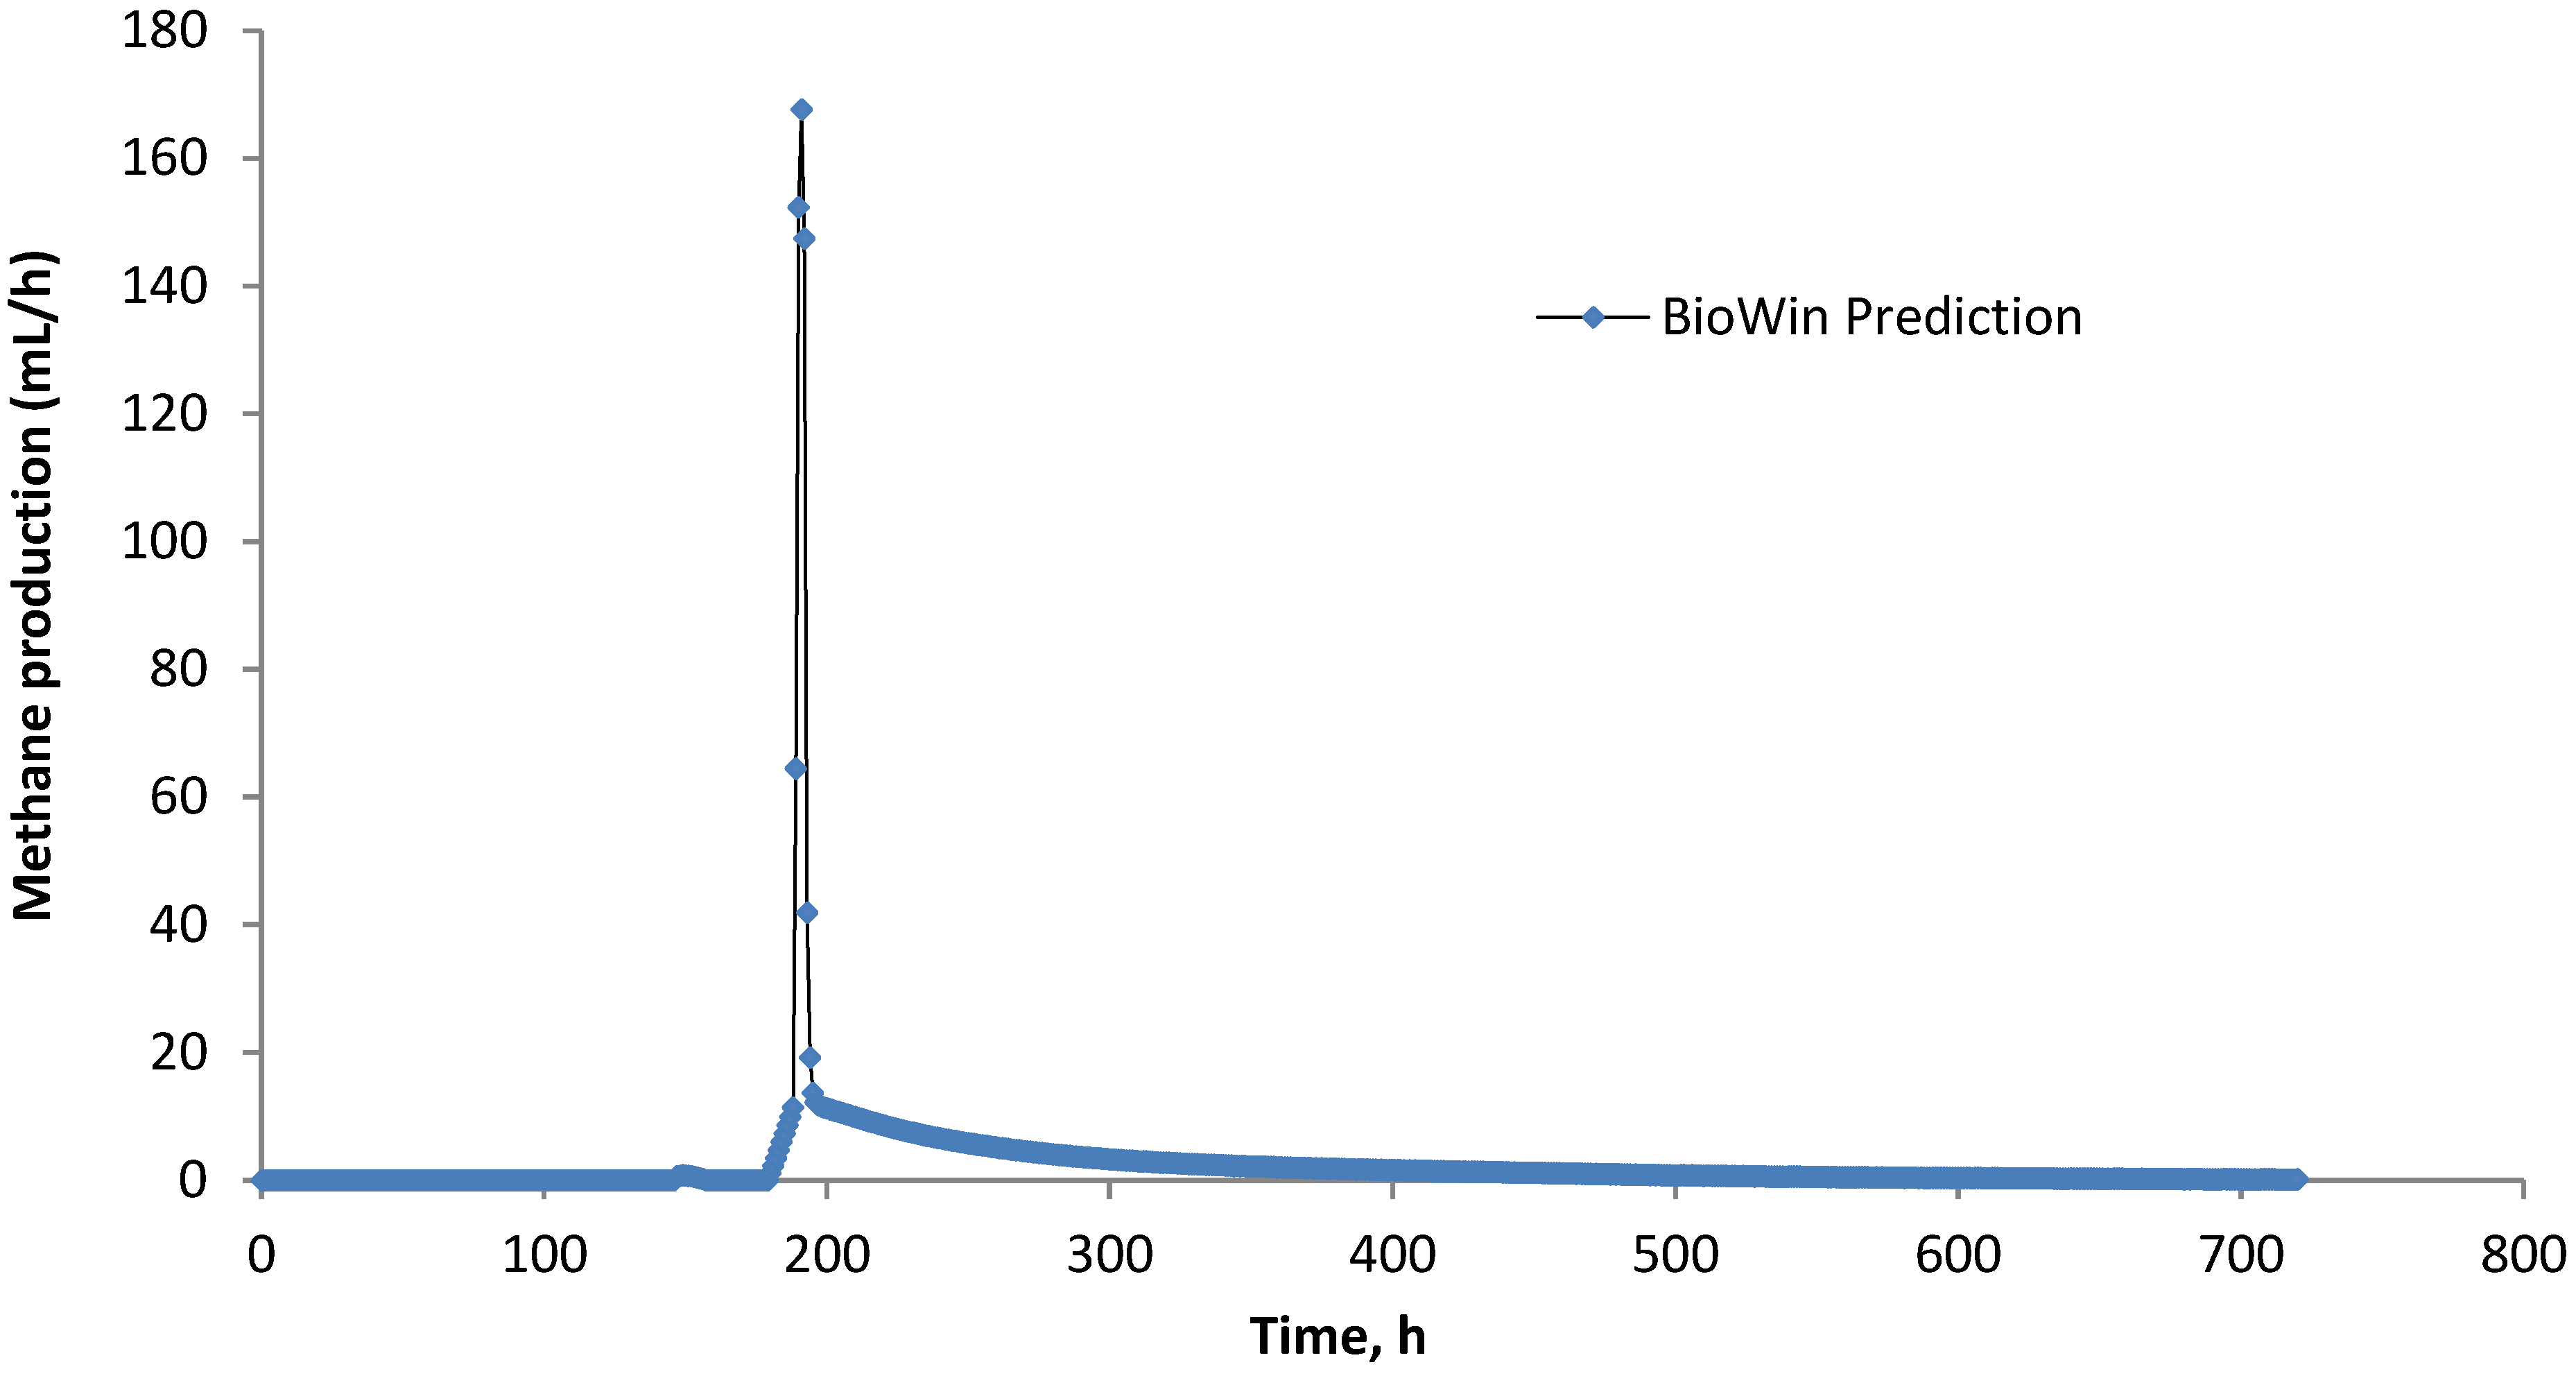
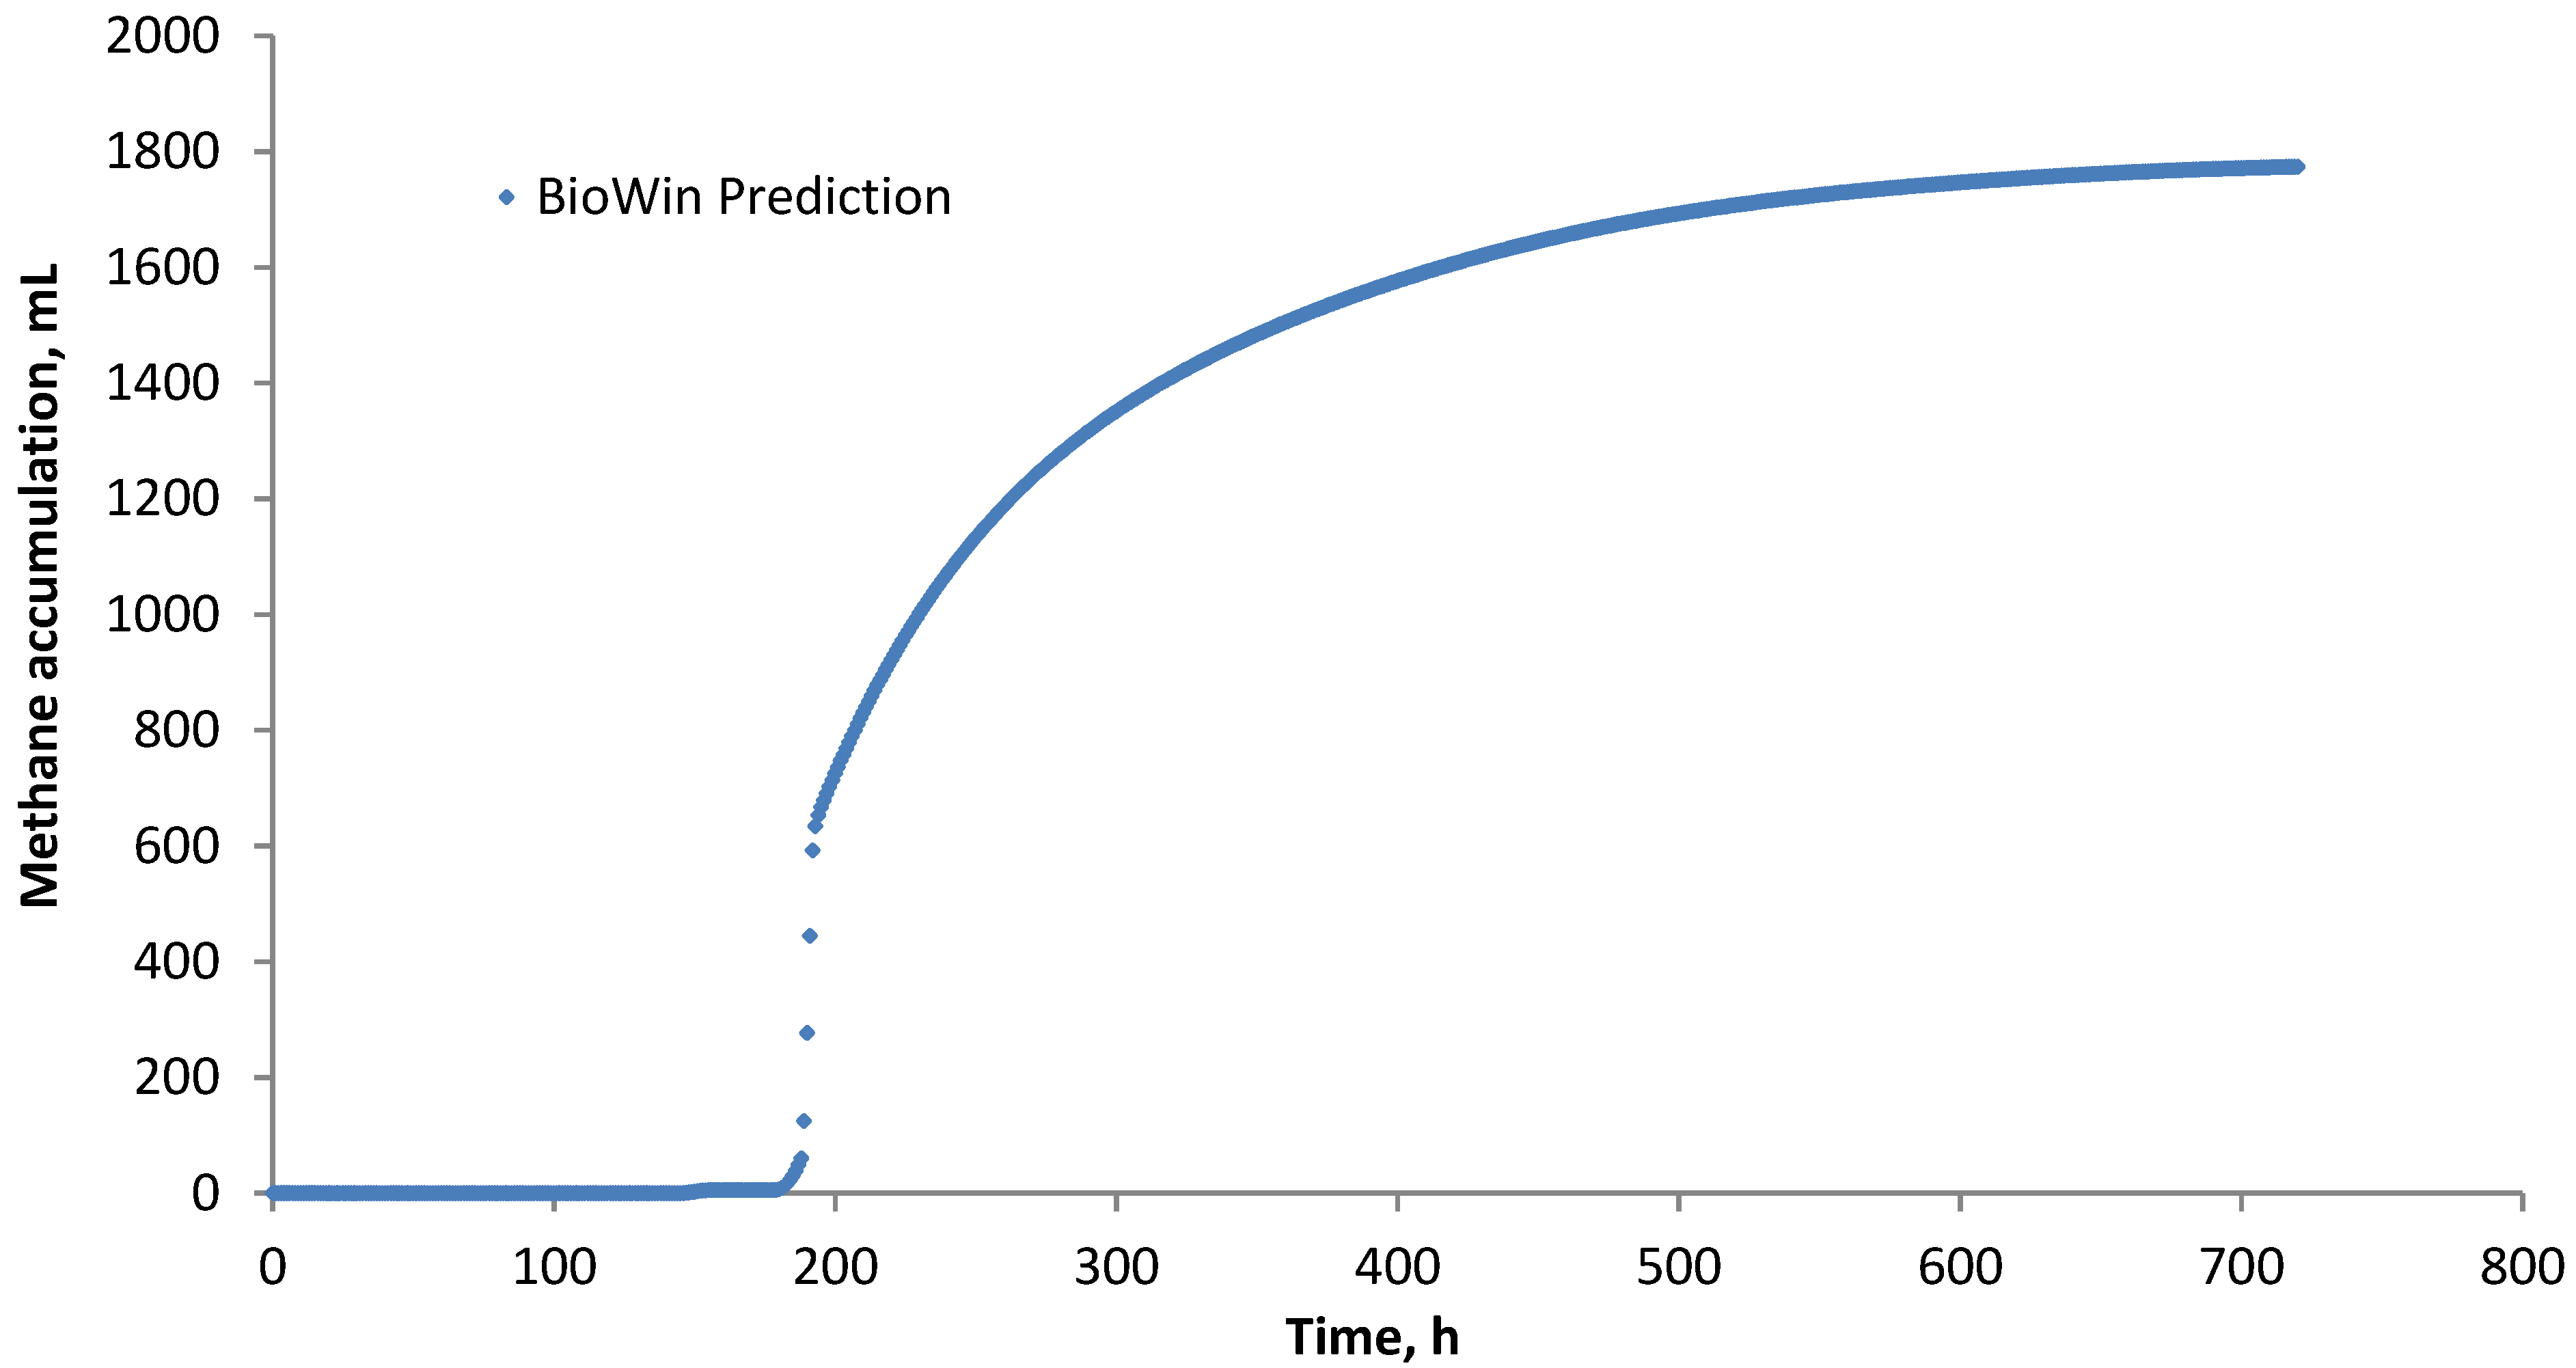
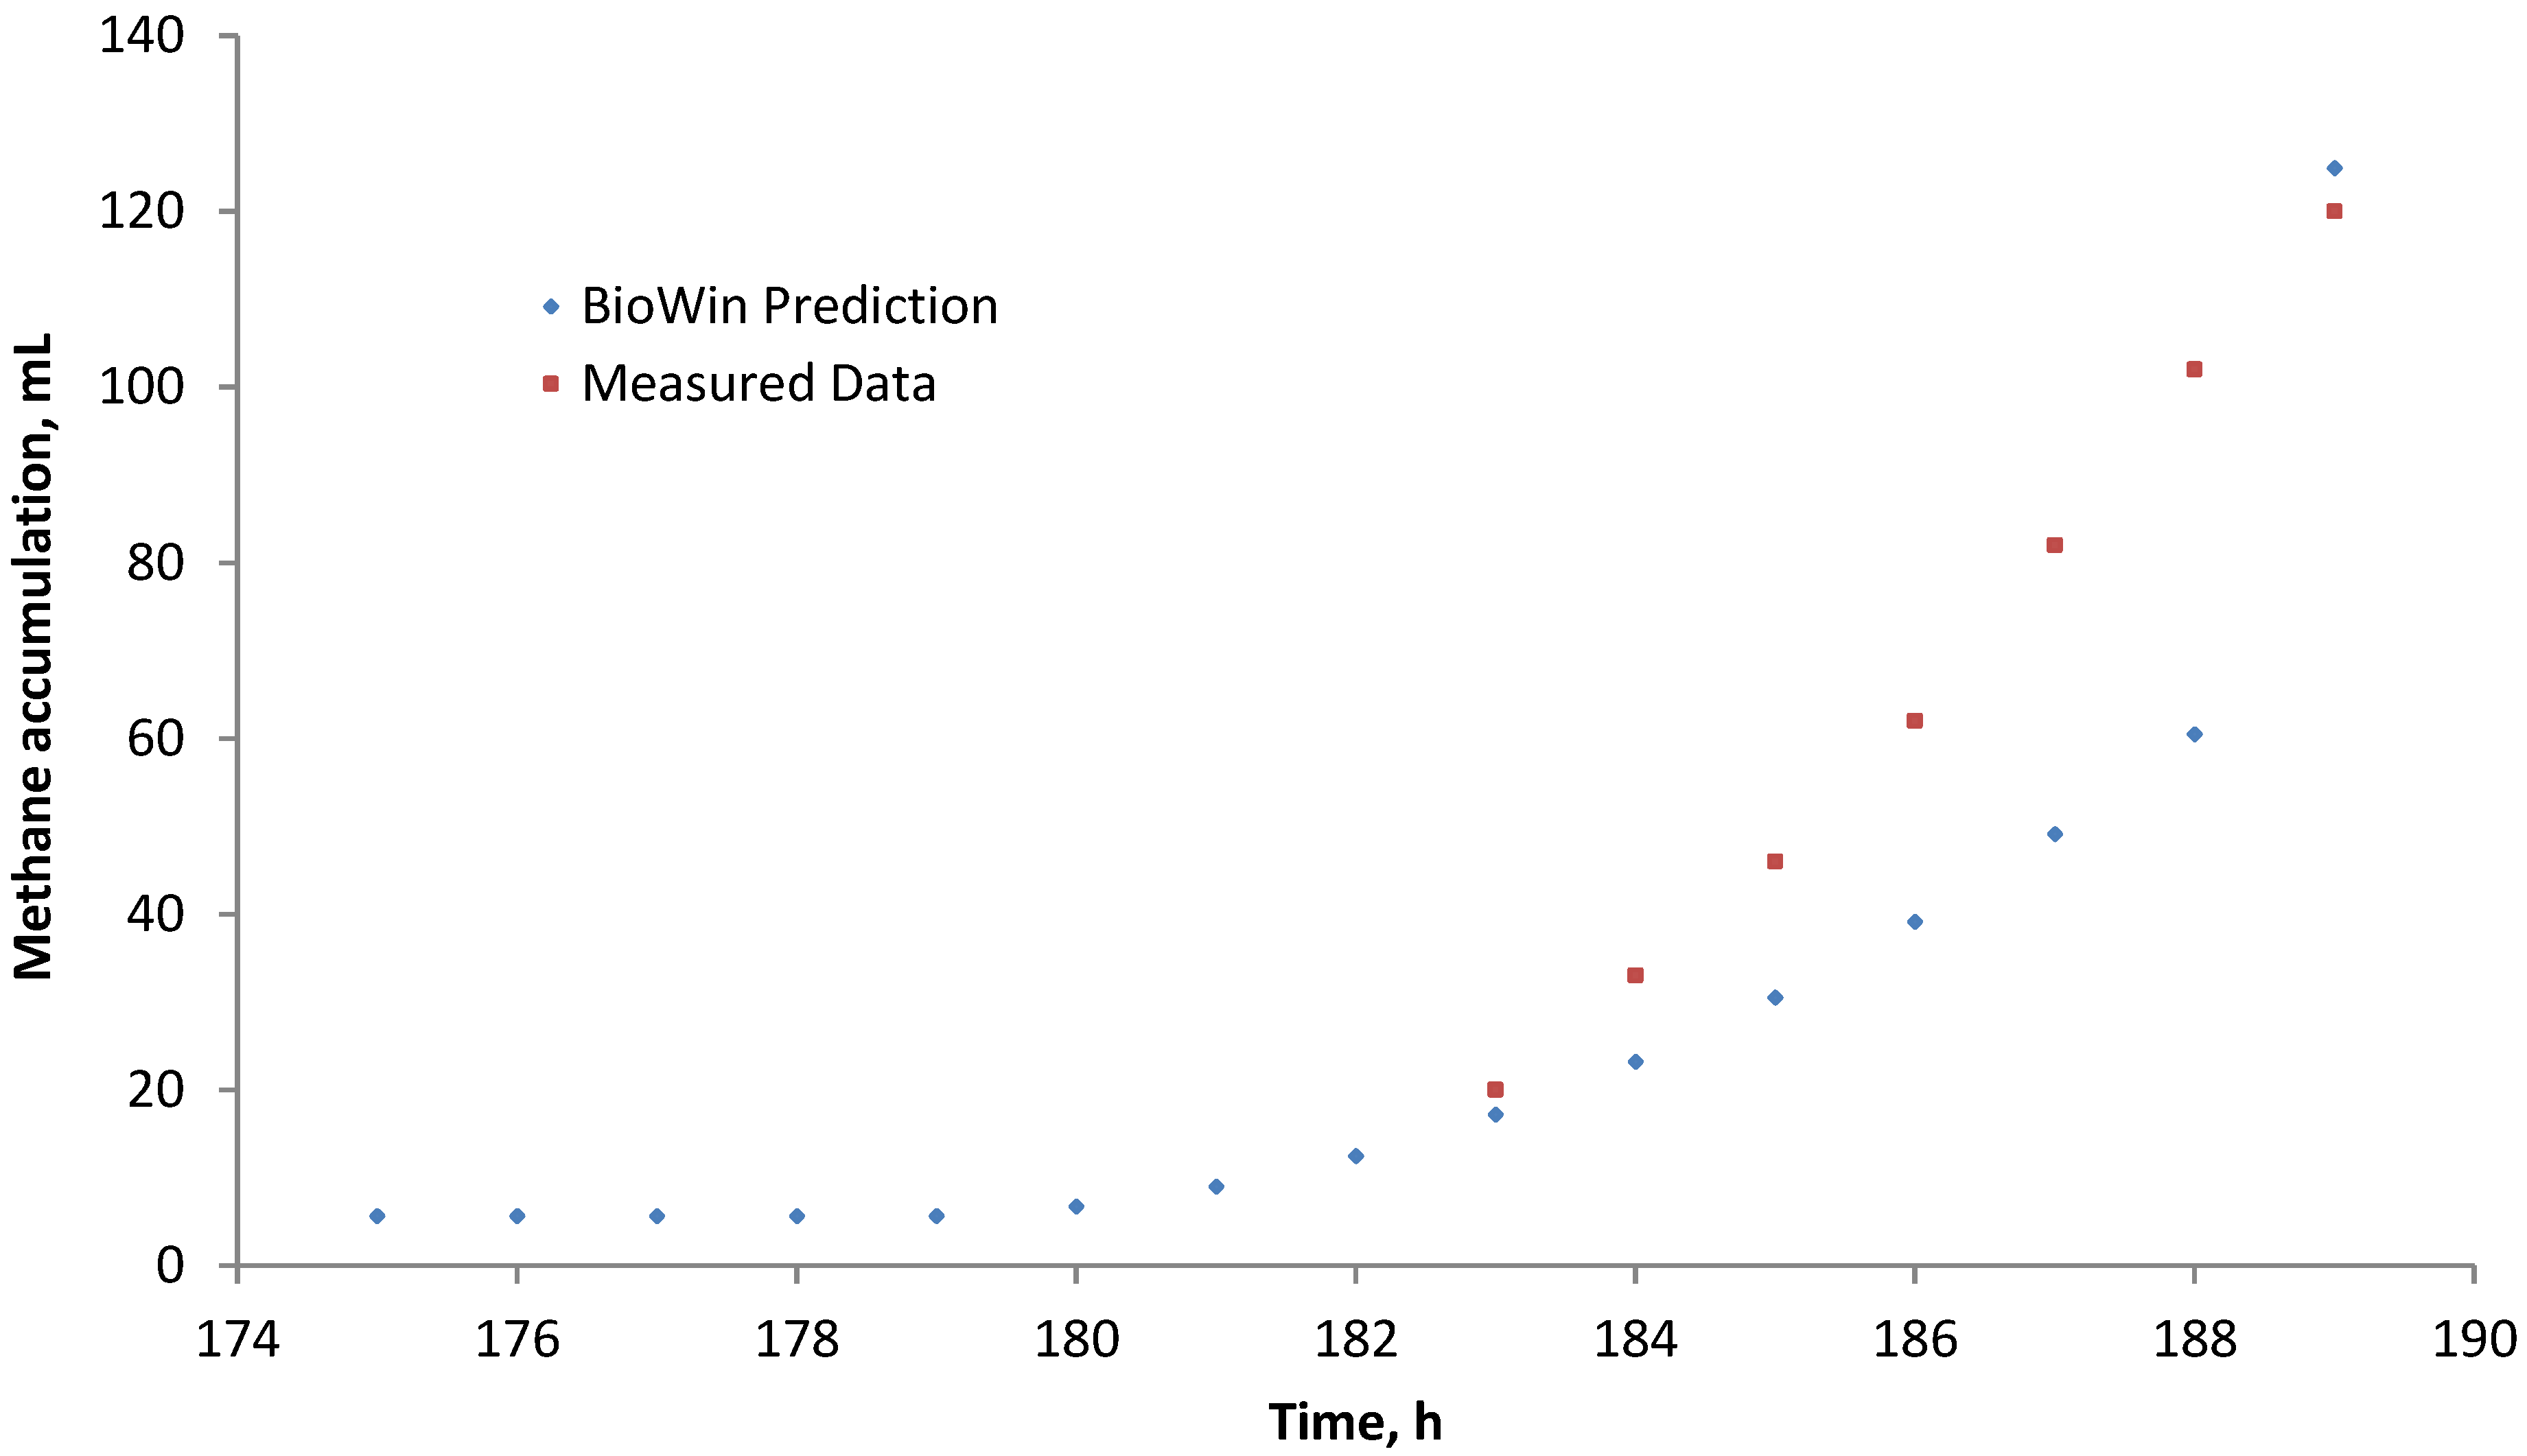
4.2. Scenario 2: Laboratory-Scale Batch Reactor


5. Statistical Analysis of Agreement
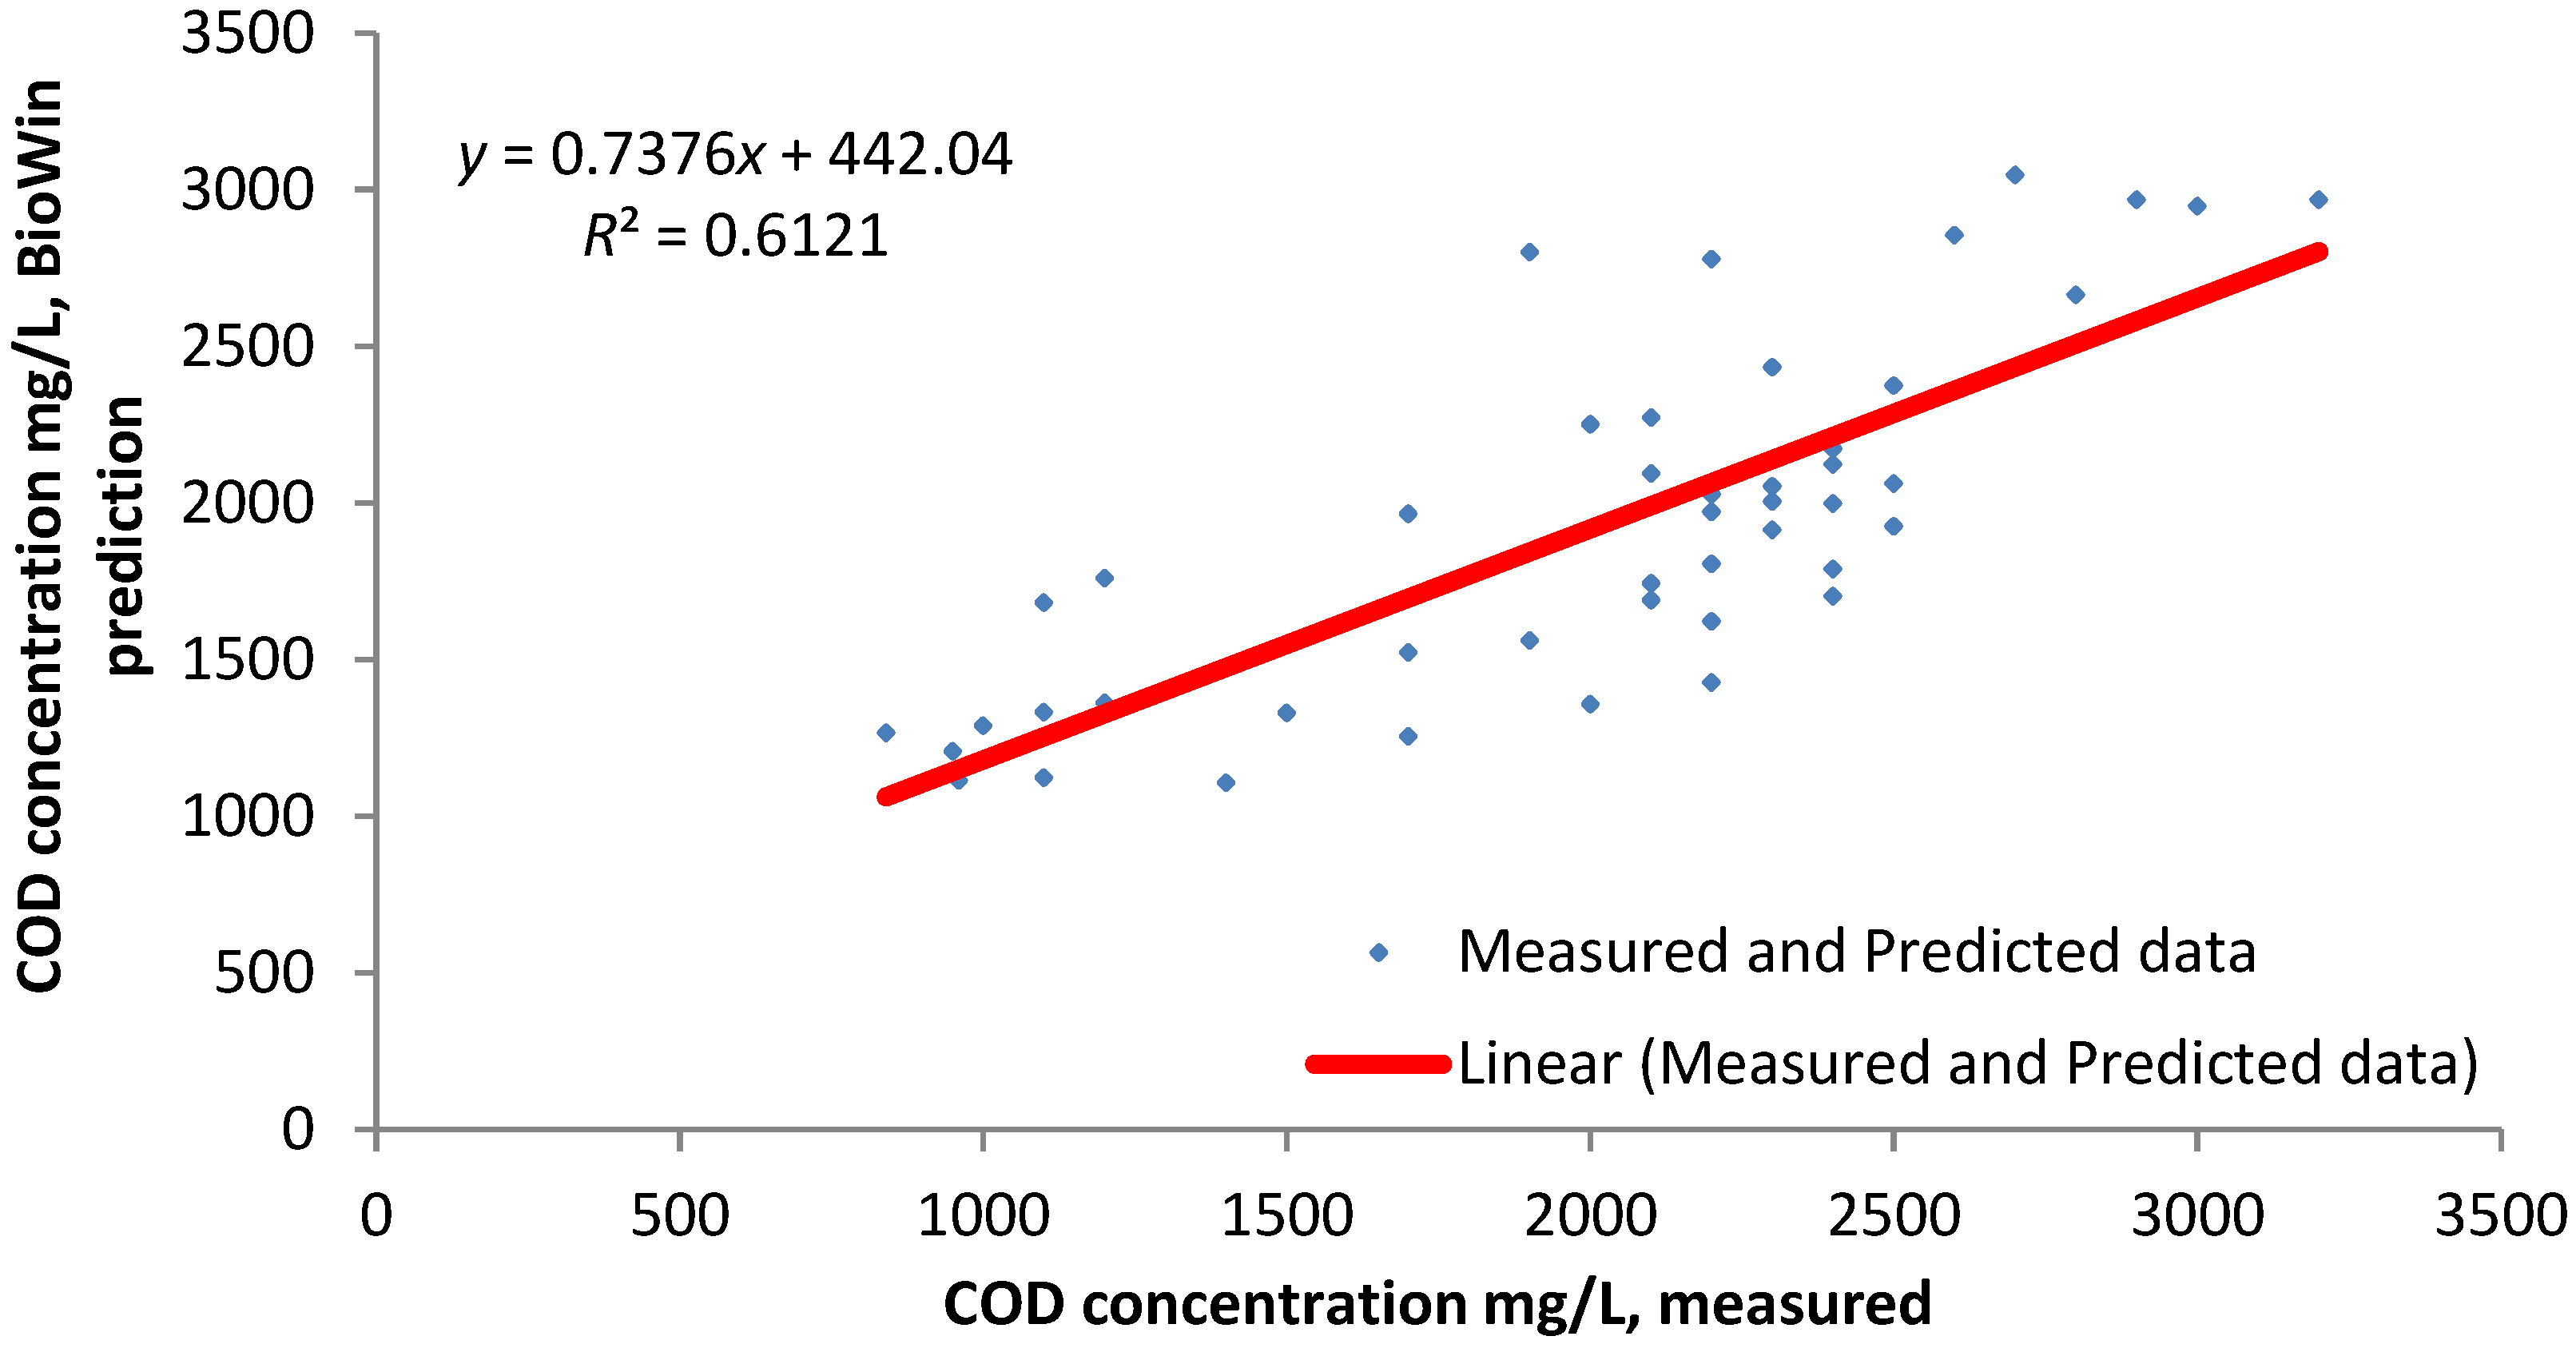
| Data | Number of points | R-squared | r | p | Willmott index of agreement |
|---|---|---|---|---|---|
| Figure 3 | 48 | 0.61 | 0.78 | 0.0001 | 0.85 |
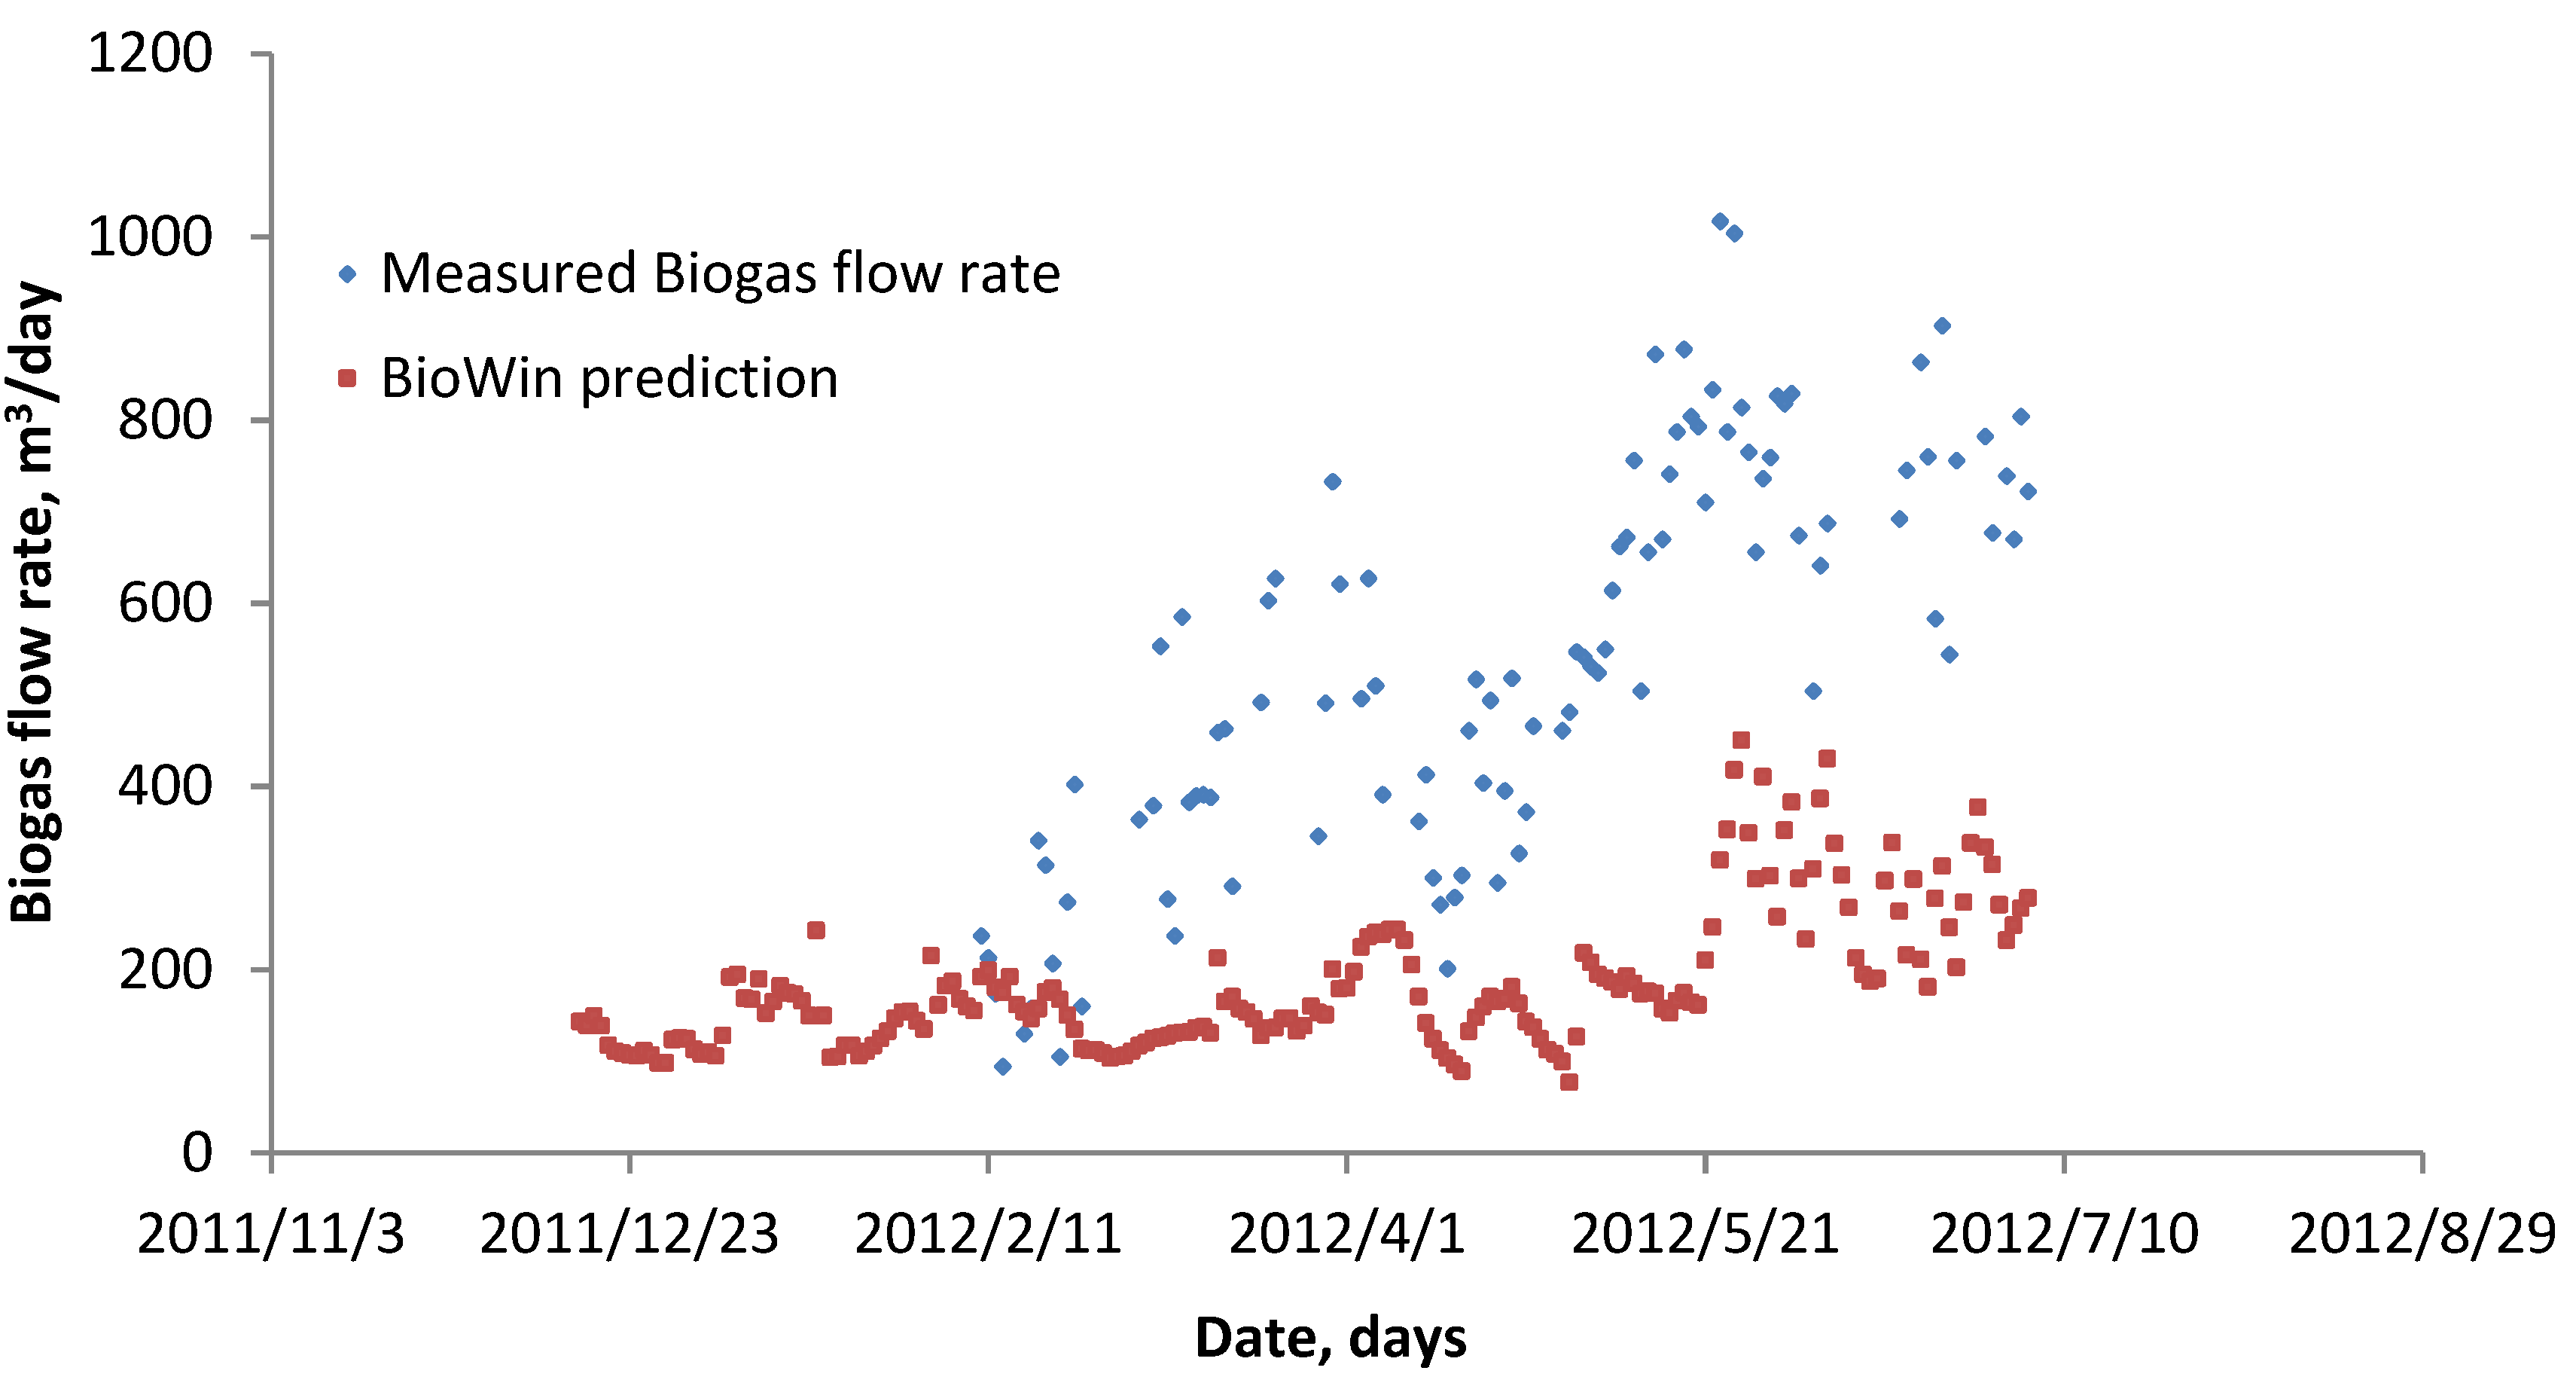
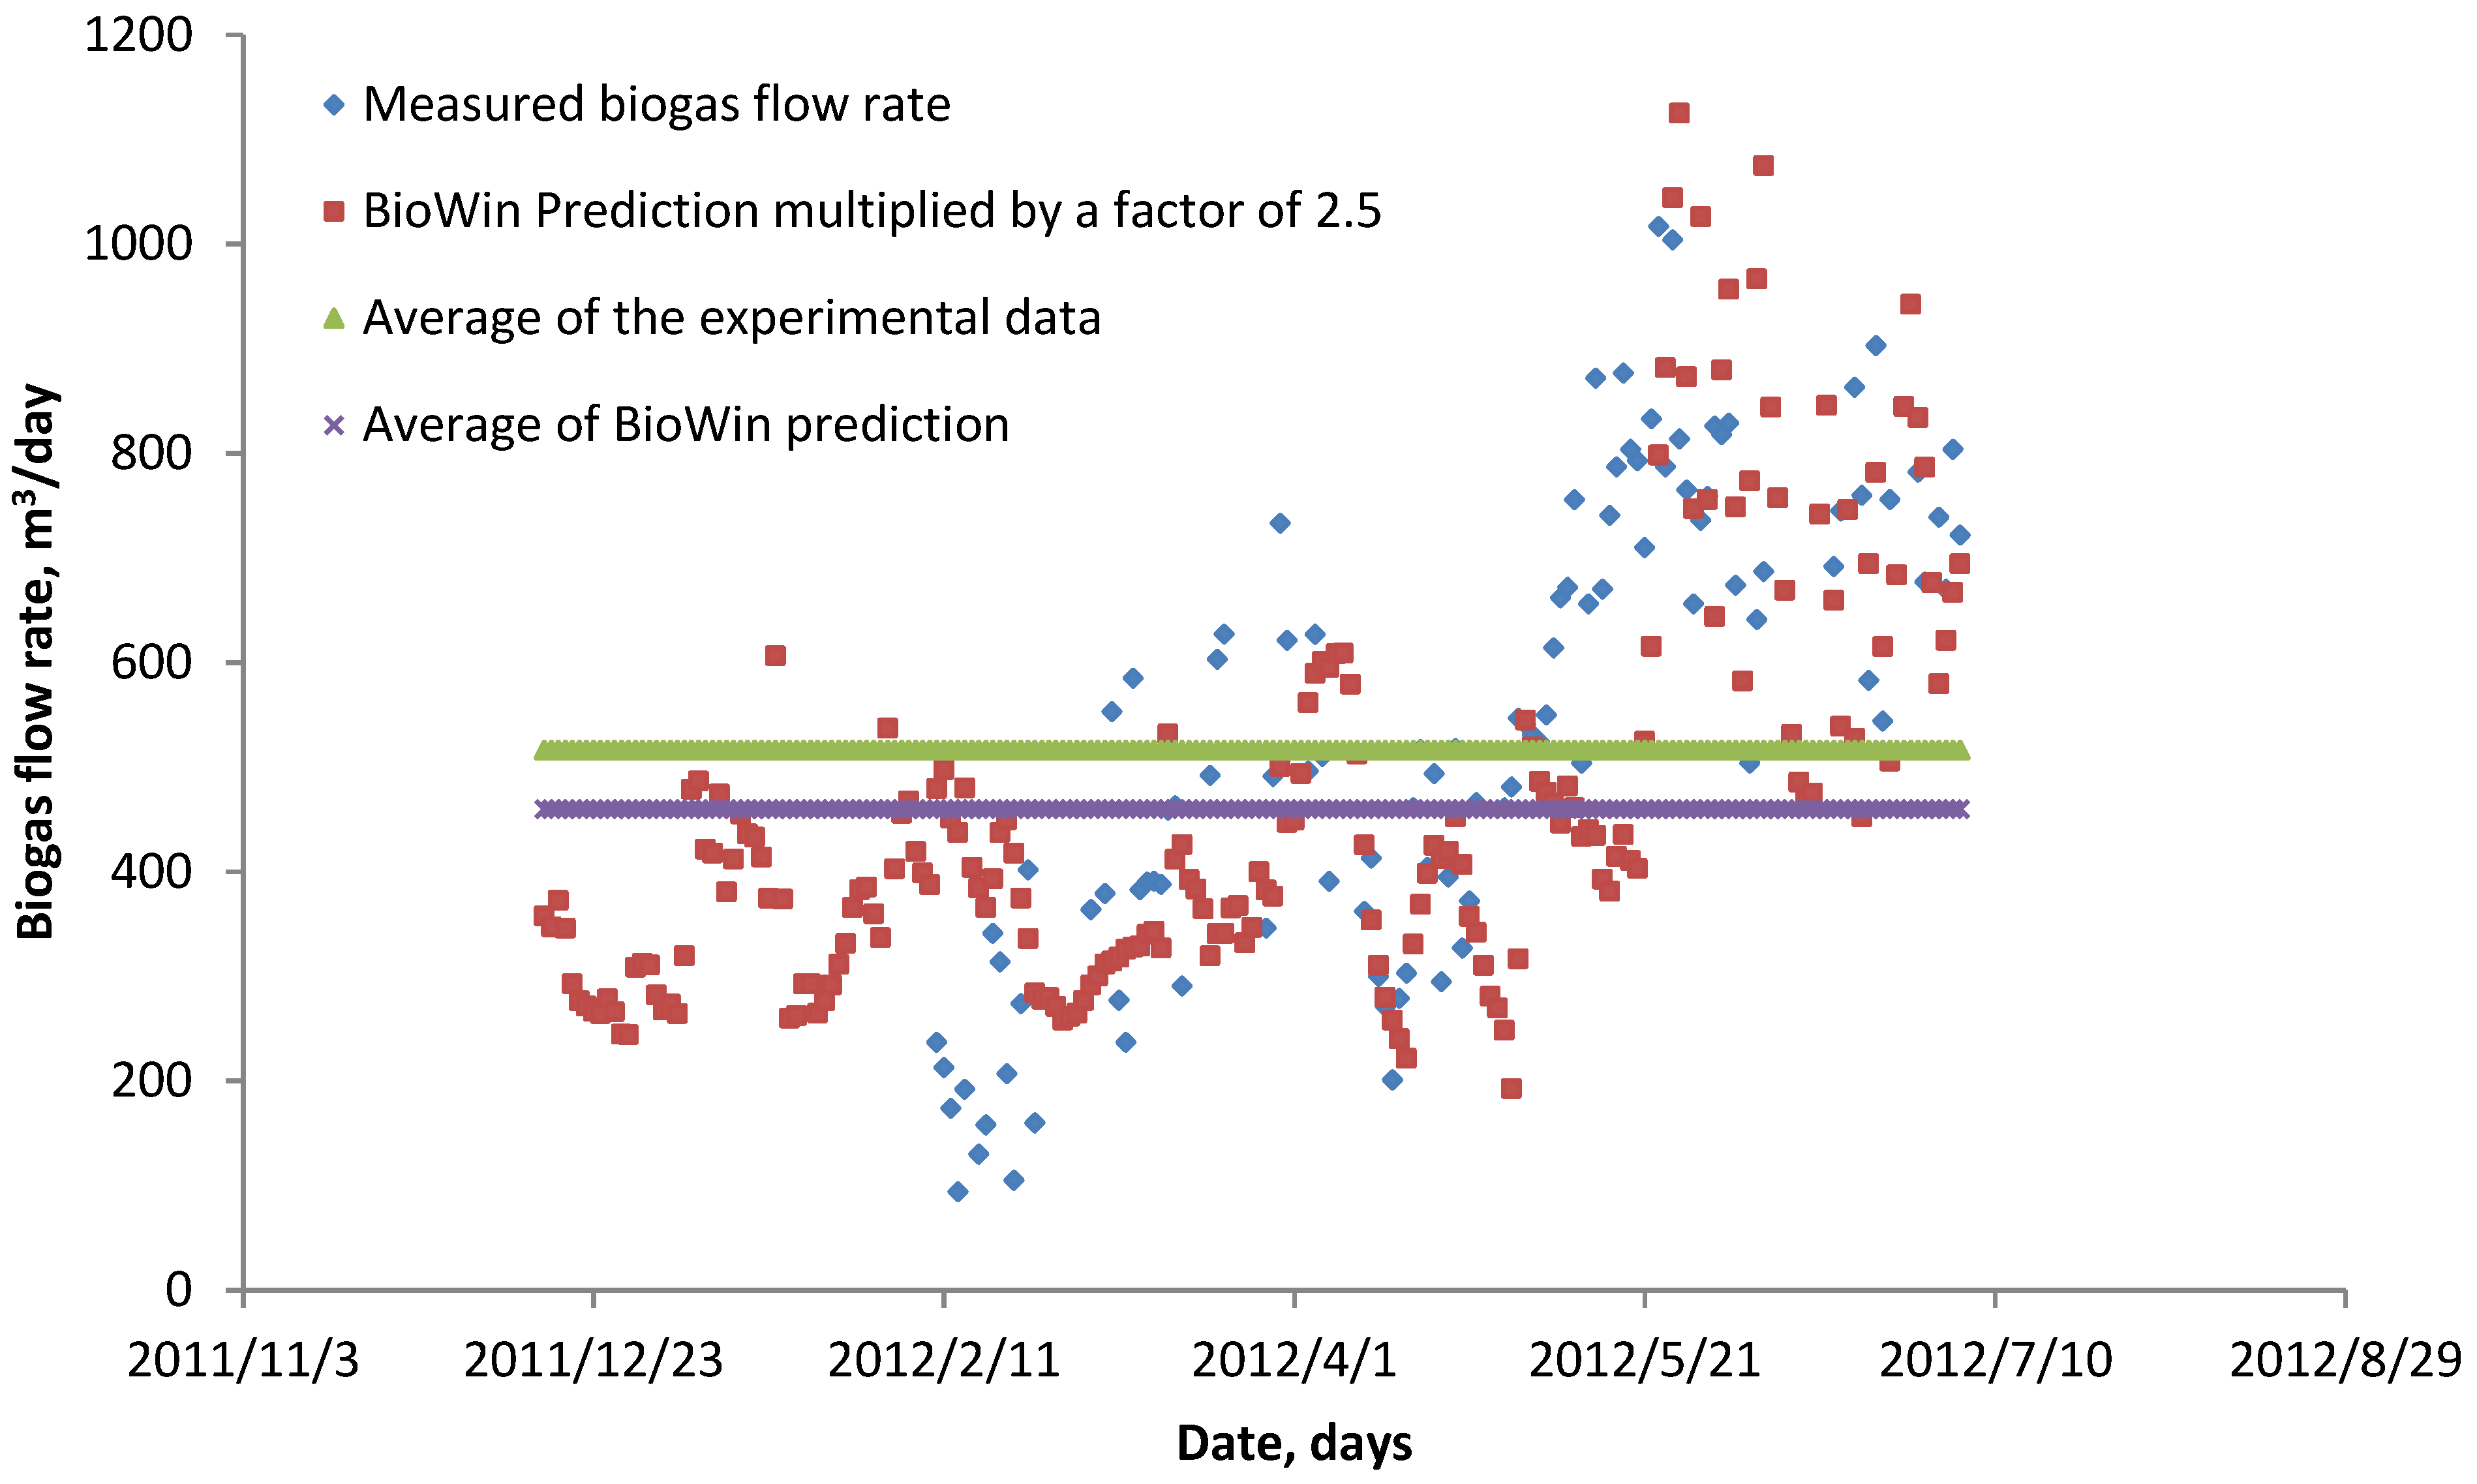
| Figure 6 | 135 | 0.46 | 0.66 | 0.0001 | 0.996 |
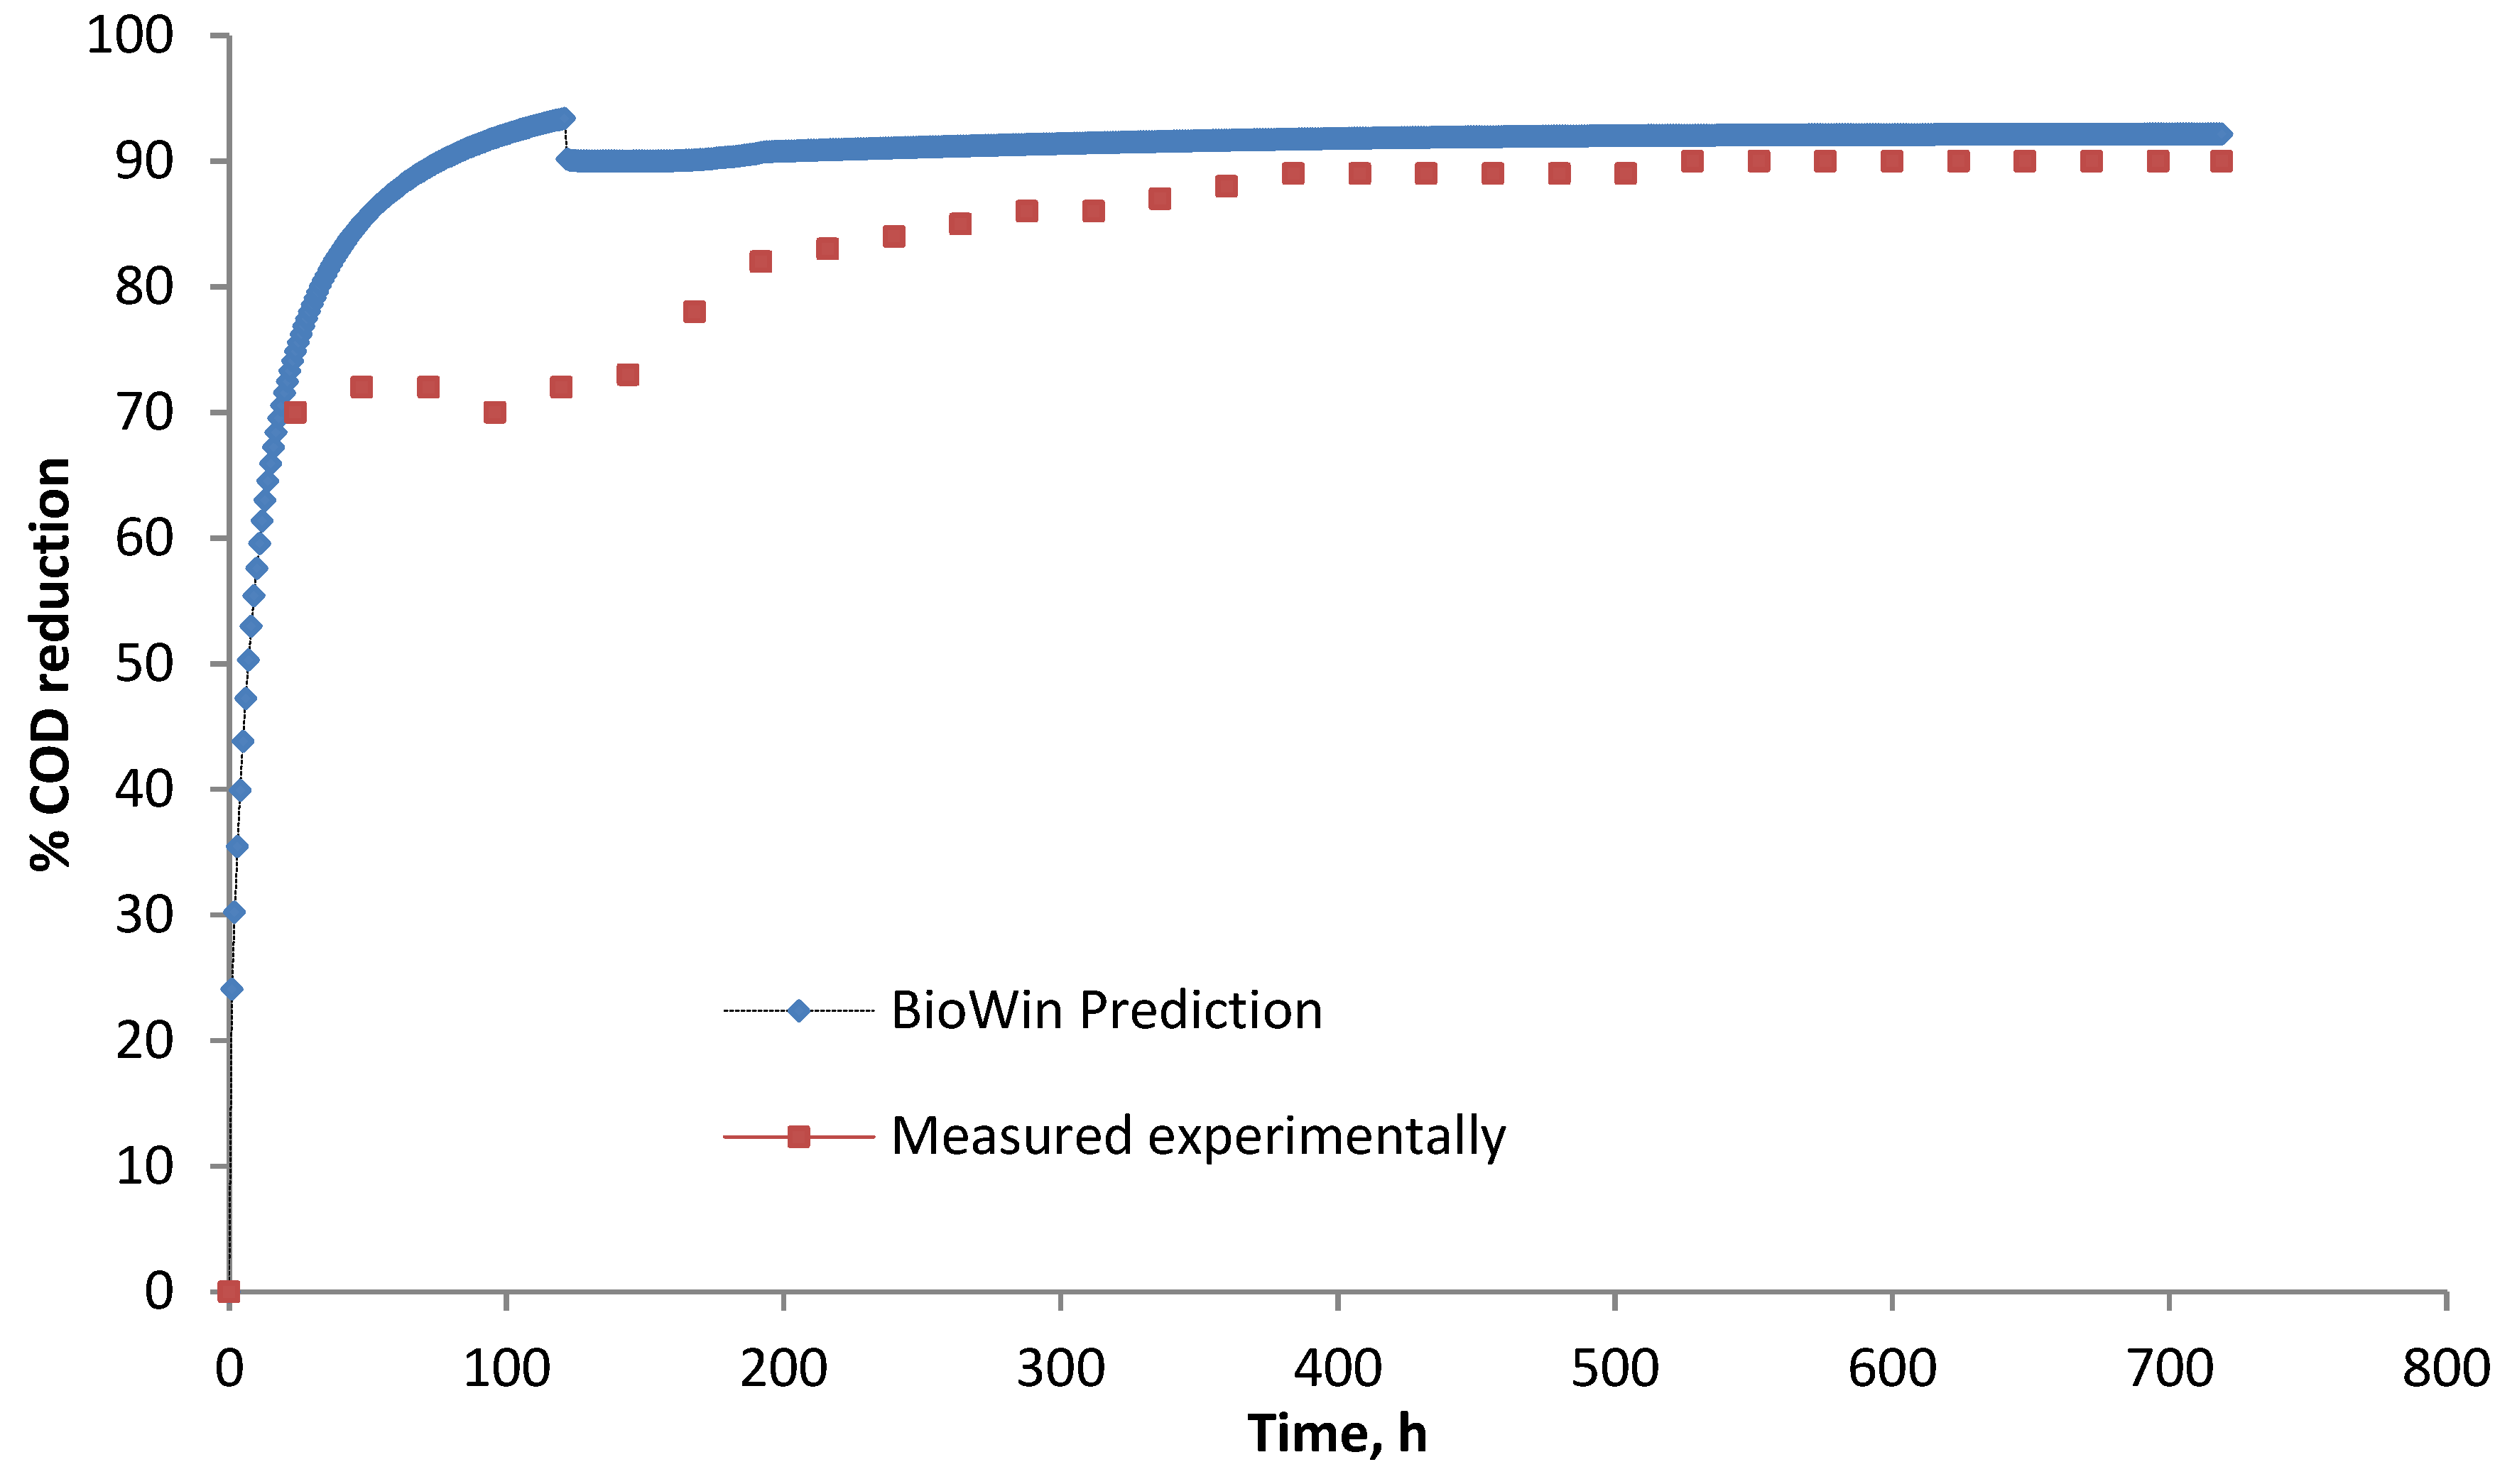
| Figure 8 | 30 | 0.88 | 0.997 | 0.0001 | 0.999 |
| Figure 11 | 7 | 0.81 | 0.98 | 0.0001 | 0.999 |
6. Conclusions
Acknowledgments
Author Contributions
Nomenclature
| BMP | Biochemical methane potential |
| R-squared | Coefficient of determination |
| r | Correlation coefficient |
| p | Probability |
| SD | Standard deviation |
| CSG | Coal seam gas |
| BOD | Biological oxygen demands |
| GHGs | Greenhouse gases |
| COD | Chemical oxygen demand |
| FOG | Fat, oil and grease |
| AD | Anaerobic digestion |
| ASDM | Activated sludge/anaerobic digestion models |
| IWA | International Water Association |
| WWTP | Wastewater treatment plants |
| TSS | Total suspended solids |
| TKN | Total Kjeldahl nitrogen |
| NH4-N | Ammonium nitrogen |
| NO3-N | Nitrate |
| TP | Total phosphorus |
| PO4-P | Orthophosphate |
| VSS | Volatile suspended solids |
| MAPE | Mean absolute percentage error where {xi} is the actual observation time series, {} is the estimated or forecasted time series, and N is the number of data points |
| CSTR | Continuous stirred tank reactors |
| SRT | Solid retention time |
| HRT | Hydraulic retention time |
| DAF | Diffuse air flotation |
| MLA | Meat Livestock Australia |
| ISS | Inorganic suspended solids |
| VFA | Volatile fatty acid |
| TA | Total alkalinity |
| EGSB | Expanded granular sludge bed |
| DO | Dissolved oxygen |
| Fus | Unbiodegradable soluble gm COD/gm of total COD |
| Fbs | Readily biodegradable (including acetate) gm COD/gm of total COD |
| Fup | Unbiodegradable particle gm COD/gm of total COD |
| Fxp | Non-colloidal slowly biodegradable gm COD/gm of slowly degradable COD |
| Fac | Acetate gm COD/gm of readily biodegradable COD |
Conflicts of Interest
References
- Igoni, A.H.; Ayotamuno, M.J.; Eze, C.L.; Ogaji, S.O.T.; Probert, S.D. Designs of anaerobic digesters for producing biogas from municipal solid-waste. Appl. Energy 2008, 85, 430–438. [Google Scholar] [CrossRef]
- Bruni, E.; Jensen, A.P.; Pedersen, E.S.; Angelidaki, I. Anaerobic digestion of maize focusing on variety, harvest time and pretreatment. Appl. Energy 2010, 87, 2212–2217. [Google Scholar] [CrossRef]
- Hamawand, I.; Yusaf, T.; Hamawand, S. Coal seam gas and associated water: A review paper. Renew. Sustain. Energy Rev. 2013, 22, 550–560. [Google Scholar] [CrossRef]
- Hamawand, I.; Yusaf, T.; Hamawand, S. Growing algae using water from coal seam gas industry and harvesting using an innovative technique: A review and a potential. Fuel 2014, 117, 422–430. [Google Scholar] [CrossRef]
- Pöschl, M.; Ward, S.; Owende, P. Evaluation of energy efficiency of various biogas production and utilization pathways. Appl. Energy 2010, 87, 3305–3321. [Google Scholar] [CrossRef]
- Khanal, S.K. Anaerobic Biotechnology for Bioenergy Production (Principle and Applications); Wiley-Blackwell Publishing: Ames, IA, USA, 2008. [Google Scholar]
- McCabe, B.; Hamawand, I.; Baillie, C. Investigating wastewater modelling as a tool to predict anaerobic decomposition and biogas yield of abattoir effluent. J. Environ. Chem. Eng. 2013, 1, 1375–1379. [Google Scholar] [CrossRef]
- McCabe, B.; Hamawand, I.; Peter, H.; Baillie, C.; Yusaf, T. A case study for biogas generation from covered anaerobic ponds treating abattoir wastewater: Investigation of pond performance and potential biogas production. Appl. Energy 2014, 114, 798–808. [Google Scholar] [CrossRef]
- Petruy, R.; Lettinga, G. Digestion of a milk-fat emulsion. Bioresour. Technol. 1997, 61, 141–149. [Google Scholar] [CrossRef]
- Green, J. Effluent Treatment Ponds; CSIRO Meat Research Laboratoy: Melbourne, Australia, 1990. [Google Scholar]
- UNSW-CRC for Waste Management & Pollution Control. In Treatment of Abattoir Wastewater Using a Covered Anaerobic Lagoon; Meat &Livestock Australia Limited MLA: Sydney, Australia, 1998.
- Lidholm, O.; Ossiansson, E. Modeling Anaerobic Digestion—Validation and Calibration of the Siegrist Model with Uncertainty and Sensitivity Analysis. Master’s Thesis, Lunds University, Lund, Sweden, 2008. [Google Scholar]
- Esposito, G.; Frunzo, L.; Panico, A.; Pirozzi, F. Modelling the effect of the OLR and OFMSW particle size on the performances of an anaerobic co-digestion reactor. Process Biochem. 2011, 46, 557–565. [Google Scholar] [CrossRef]
- Esposito, G.; Frunzo, L.; Panico, A.; Pirozzi, F. Model calibration and validation for OFMSW and sewage sludge co-digestion reactors. Waste Manag. 2011, 31, 2527–2535. [Google Scholar] [CrossRef] [PubMed]
- Marcos, A.; Al-Kassir, A.; Mohamad, A.A.; Cuadros, F.; Lopez-Rodriguez, F. Combustible gas production (methane) and biodegradation of solid and liquid mixtures of meat industry wastes. Appl. Energy 2010, 87, 1729–1735. [Google Scholar] [CrossRef]
- Thorin, E.; Lindmark, J.; ENordlander, E.; Odlare, M.; Dahlquist, E.; Kastensson, J.; Leksell, N.; Pettersson, C.-M. Performance optimization of the Växtkraft biogas production plant. Appl. Energy 2012, 97, 503–508. [Google Scholar] [CrossRef]
- Olsson, G.; Carlsson, B.; Comas, J.; Copp, J.; Gernaey, K.V.; Ingildsen, P.; Jeppsson, U.; Kim, C.; Rieger, L.; Rodríguez-Roda, I.; et al. Instrumentation, Control and Automation in wastewater—From London 1973 to Narbonne 2013. In Proceedings of the 11th IWA Conference on Instrumentation, Control and Automation (ICA2013), Narbonne, France, 18–20 September 2013.
- Claeys, F. A Generic Software Framework for Modelling and Virtual Experimentation with Complex Biological Systems. Ph.D. Thesis, Department of Applied Mathematics, Biometrics and Process Control, Ghent University, Ghent, Belgium, 2008; p. 303. [Google Scholar]
- De Hass, D.W.; Wentzel, M.C. Calibration of the BioWin model for N removal: Part 1, desktop study. Water J. 2002, 29, 62–66. [Google Scholar]
- Elbeshbishy, E.; Nakevski, A.; Hafez, H.; Ray, M.; Nakhla, G. Simulation of the impact of SRT on anaerobic digestability of ultrasonicated hog manure. Energies 2010, 3, 974–988. [Google Scholar] [CrossRef]
- Lei, L.; Gharagozian, A.; Start, B.; Roth, G.; Emmett, R. Process alternative comparisons assisted with biowin modeling. Proc. Water Environ. Fed. 2006. [Google Scholar] [CrossRef]
- Musson, S.E.; Campo, P.; Tolaymat, T.; Suidan, M.; Townsend, T.G. Assessment of the anaerobic degradation of six active pharmaceutical ingredients. Sci. Total Environ. 2010, 408, 2068–2074. [Google Scholar] [CrossRef] [PubMed]
- Dhar, B.R.; Elbeshbishy, E.; Hafez, H.; Nakhla, G.; Madhumita, B.R. Thermo-oxidative pretreatment of municipal waste activated sludge for volatile sulfur compounds removal and enhanced anaerobic digestion. Chem. Eng. J. 2011, 174, 166–174. [Google Scholar] [CrossRef]
- Eldyasti, A.; Andalib, M.; Hafez, H.; Nakhla, G.; Zhu, J. Comparative modeling of biological nutrient removal from landfill leachate using a circulating fluidized bed bioreactor (CFBBR). J. Hazard. Mater. 2011, 187, 140–149. [Google Scholar] [CrossRef] [PubMed]
- Hafez, H.; El-Naggar, M.H.; Nakhla, G. Steady-state and dynamic modeling of biohydrogen production in an integrated biohydrogen reactor clarifier system. Int. J. Hydrog. 2010, 35, 6634–6645. [Google Scholar] [CrossRef]
- Blair, B.D.; Crago, J.P.; Hedman, C.J.; Treguer, R.J.F.; Magruder, C.; Royer, L.S.; Klaper, R.D. Evaluation of a model for the removal of pharmaceuticals, personal care products, and hormones from wastewater. Sci. Total Environ. 2013, 444, 515–521. [Google Scholar] [CrossRef] [PubMed]
- Sedran, M.A.; Mehrotra, A.S.; Pincince, A.B. The dangers of uncalibrated activated sludge simulation packages. Proc. Water Environ. Fed. 2006. [Google Scholar] [CrossRef]
- Liwarska-Bizukojc, E.; Olejnik, D.; Biernacki, R.; Ledakowicz, S. Calibration of a complex activated sludge model for the full-scale wastewater treatment plant. Bioprocess Biosyst. Eng. 2011, 34, 659–670. [Google Scholar] [CrossRef] [PubMed]
- Rao, P.V.; Baral, S.S.; Dey, R.; Mutnuri, S. Biogas generation potential by anaerobic digestion for sustainable energy development in India. Renew. Sustain. Energy Rev. 2010, 14, 2086–2094. [Google Scholar] [CrossRef]
- White, T.; Johns, M.; Butler, B. Methane Recovery and Use at a Meat Processing Facility—King Island; Publication No. 13-027; Rural Industries Research and Development Corporation (RIRDC): Barton, Australia, 2013. [Google Scholar]
- Kuglarz, M.; Mrowiec, B.; Bohdziewicz, J. Influence of Kitchen Biowaste Addition on the Effectiveness of Animal Manure Digestion in Continuous Condition. Available online: http://www.wis.pk.edu.pl/media/file/konferencje/Kuglarz_Mrowiec.pdf (accessed on 1 March 2014).
- Appels, L.; Baeyens, J.; Degreve, J.; Dewil, R. Principles and potential of the anaerobic digestion of waste-activated sludge. Prog. Energy Combust. Sci. 2008, 34, 755–781. [Google Scholar] [CrossRef]
- Esposito, G.; Frunzo, L.; Liotta, F.; Panico, A.; Pirozzi, F. Bio-methane potential tests to measure the biogas production from the digestion and co-digestion of complex organic substrates. Open Environ. Eng. J. 2012, 5, 1–8. [Google Scholar] [CrossRef]
© 2015 by the authors; licensee MDPI, Basel, Switzerland. This article is an open access article distributed under the terms and conditions of the Creative Commons Attribution license (http://creativecommons.org/licenses/by/4.0/).
Share and Cite
Hamawand, I.; Baillie, C. Anaerobic Digestion and Biogas Potential: Simulation of Lab and Industrial-Scale Processes. Energies 2015, 8, 454-474. https://doi.org/10.3390/en8010454
Hamawand I, Baillie C. Anaerobic Digestion and Biogas Potential: Simulation of Lab and Industrial-Scale Processes. Energies. 2015; 8(1):454-474. https://doi.org/10.3390/en8010454
Chicago/Turabian StyleHamawand, Ihsan, and Craig Baillie. 2015. "Anaerobic Digestion and Biogas Potential: Simulation of Lab and Industrial-Scale Processes" Energies 8, no. 1: 454-474. https://doi.org/10.3390/en8010454