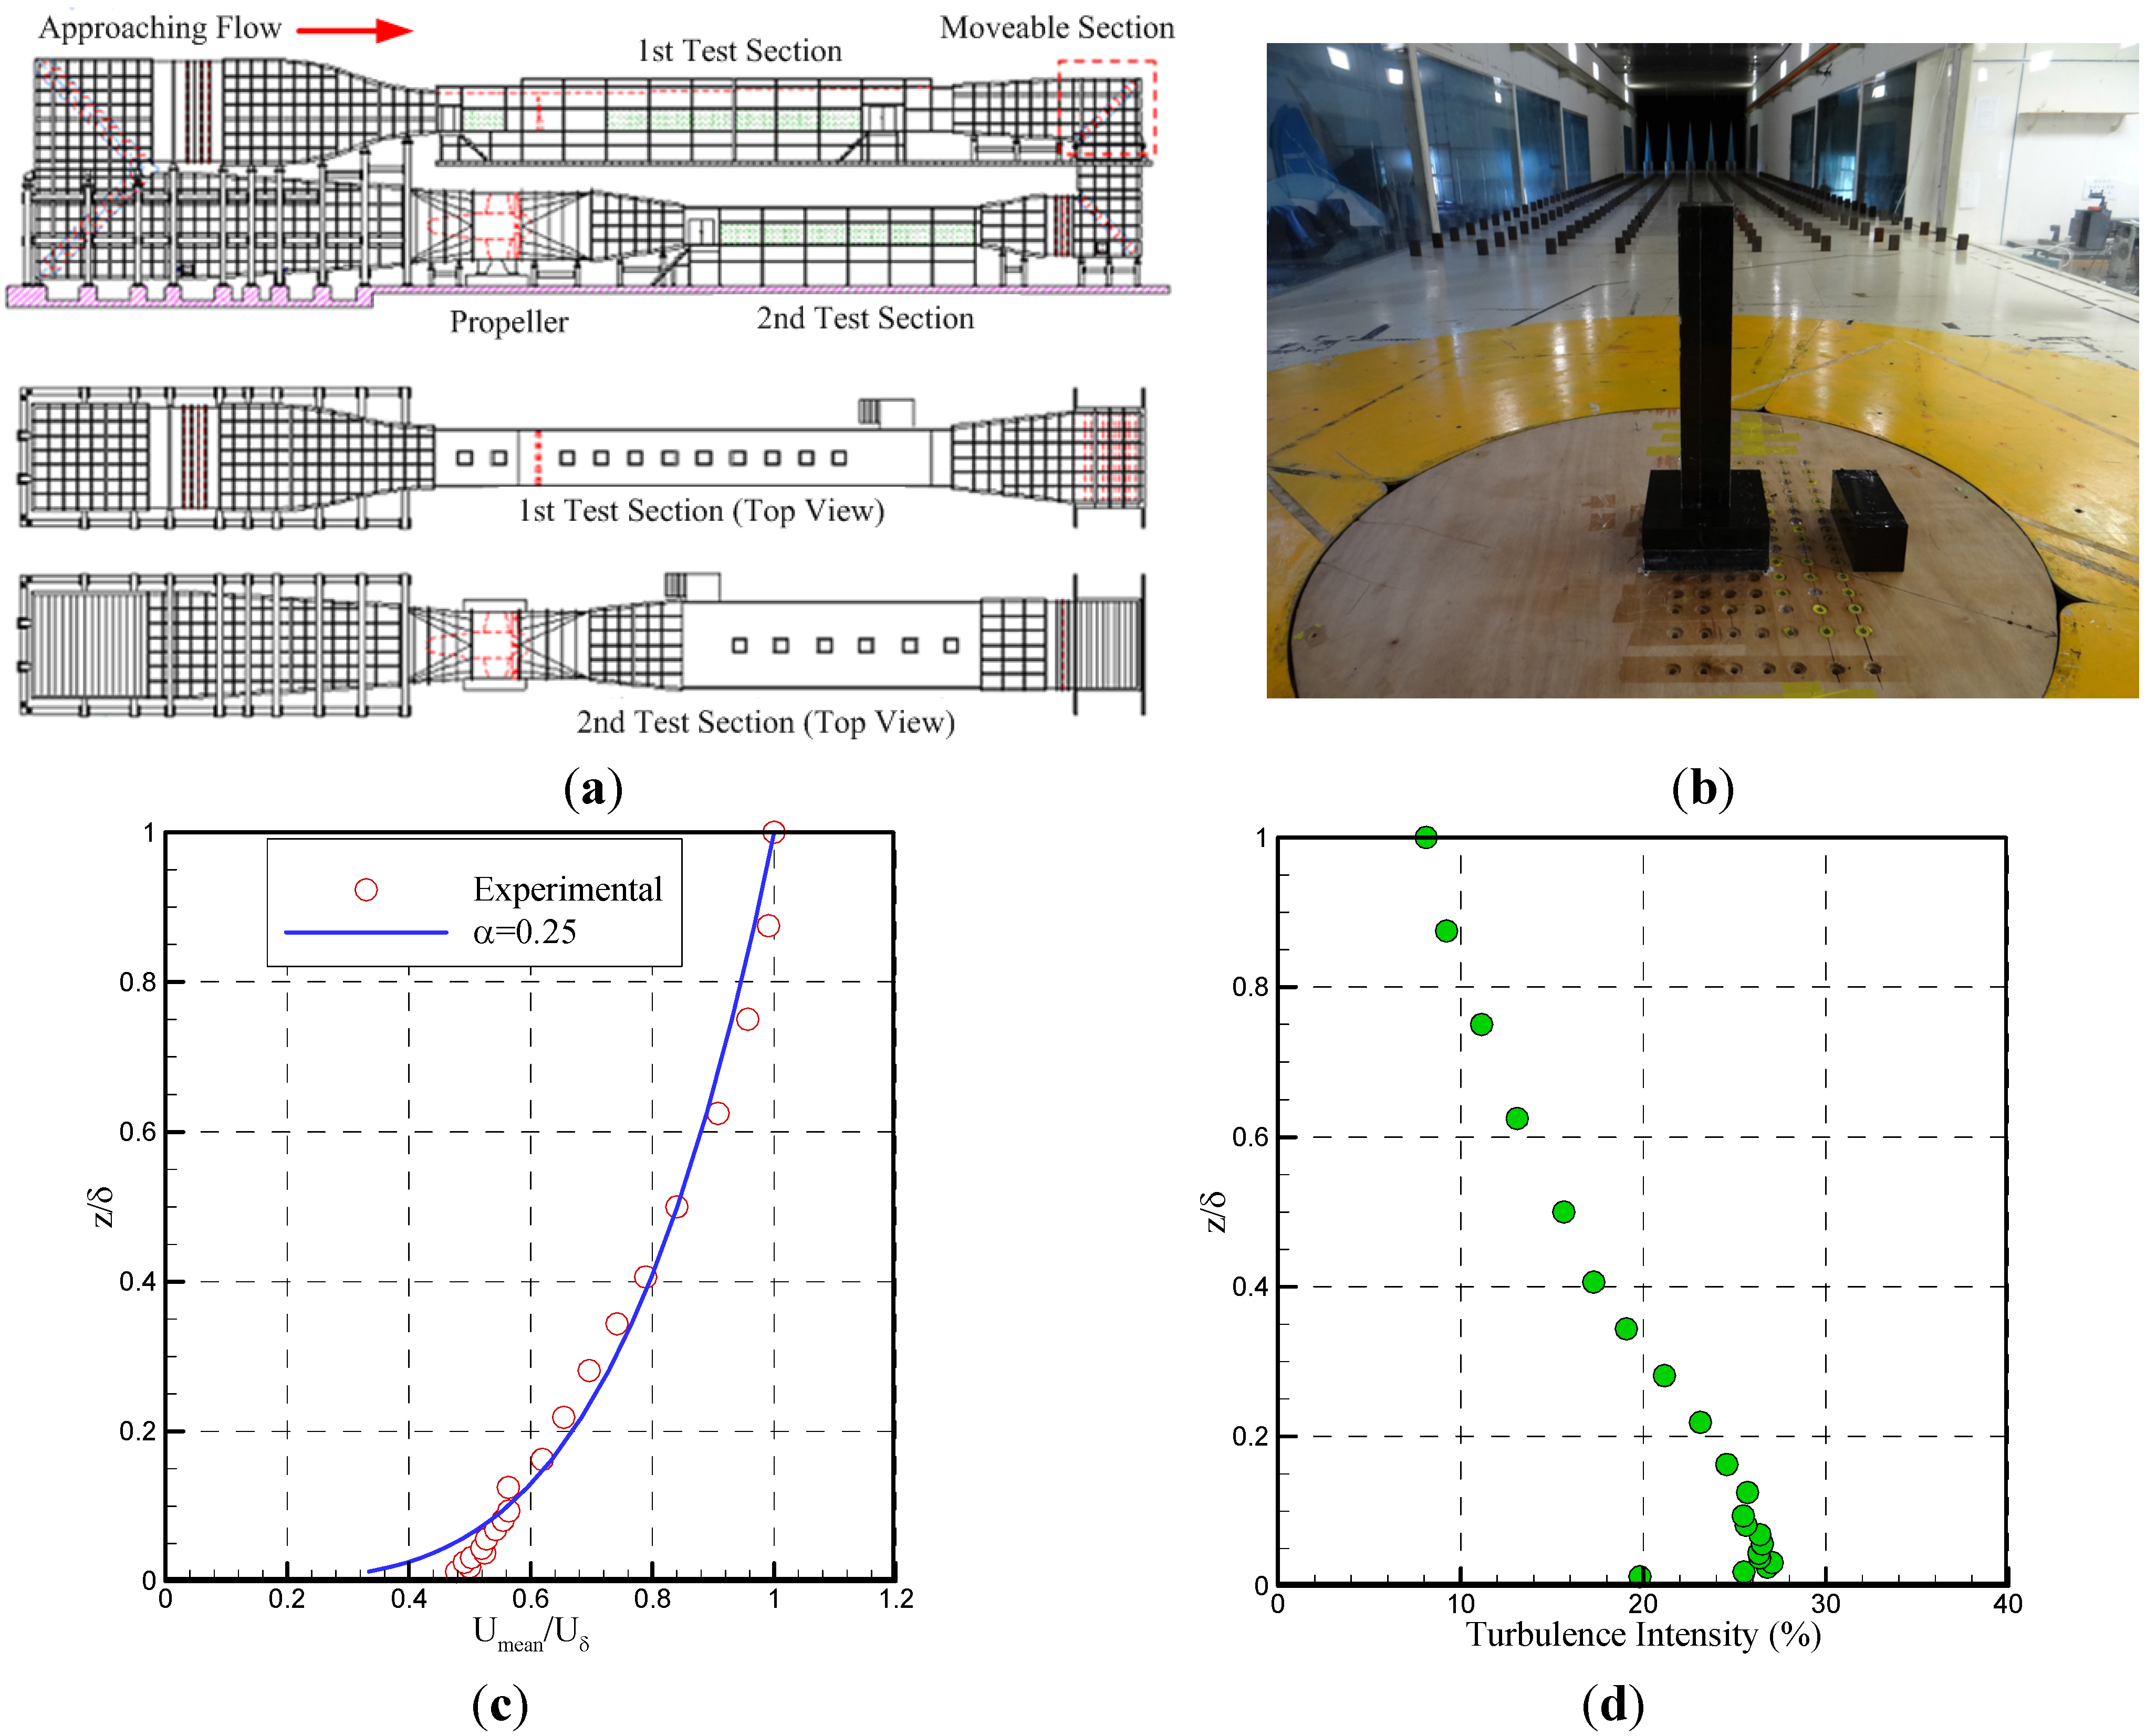
All of the study outcomes use the free stream wind speed outside the modeled atmospheric boundary layer as the reference speed (Uh); the mean wind speed of each measurement point was divided by Uh to obtain the dimensionless mean wind speed of each measurement point (Ui/Uh).
3.1. Effect of the Street Canyon Width
The pedestrian-level wind flows of the street canyon center position are shown in
Figure 3. Dimensionless mean wind speed and root-mean-square (RMS) results of the case with
S = 0.375
D are provided in
Table 1.
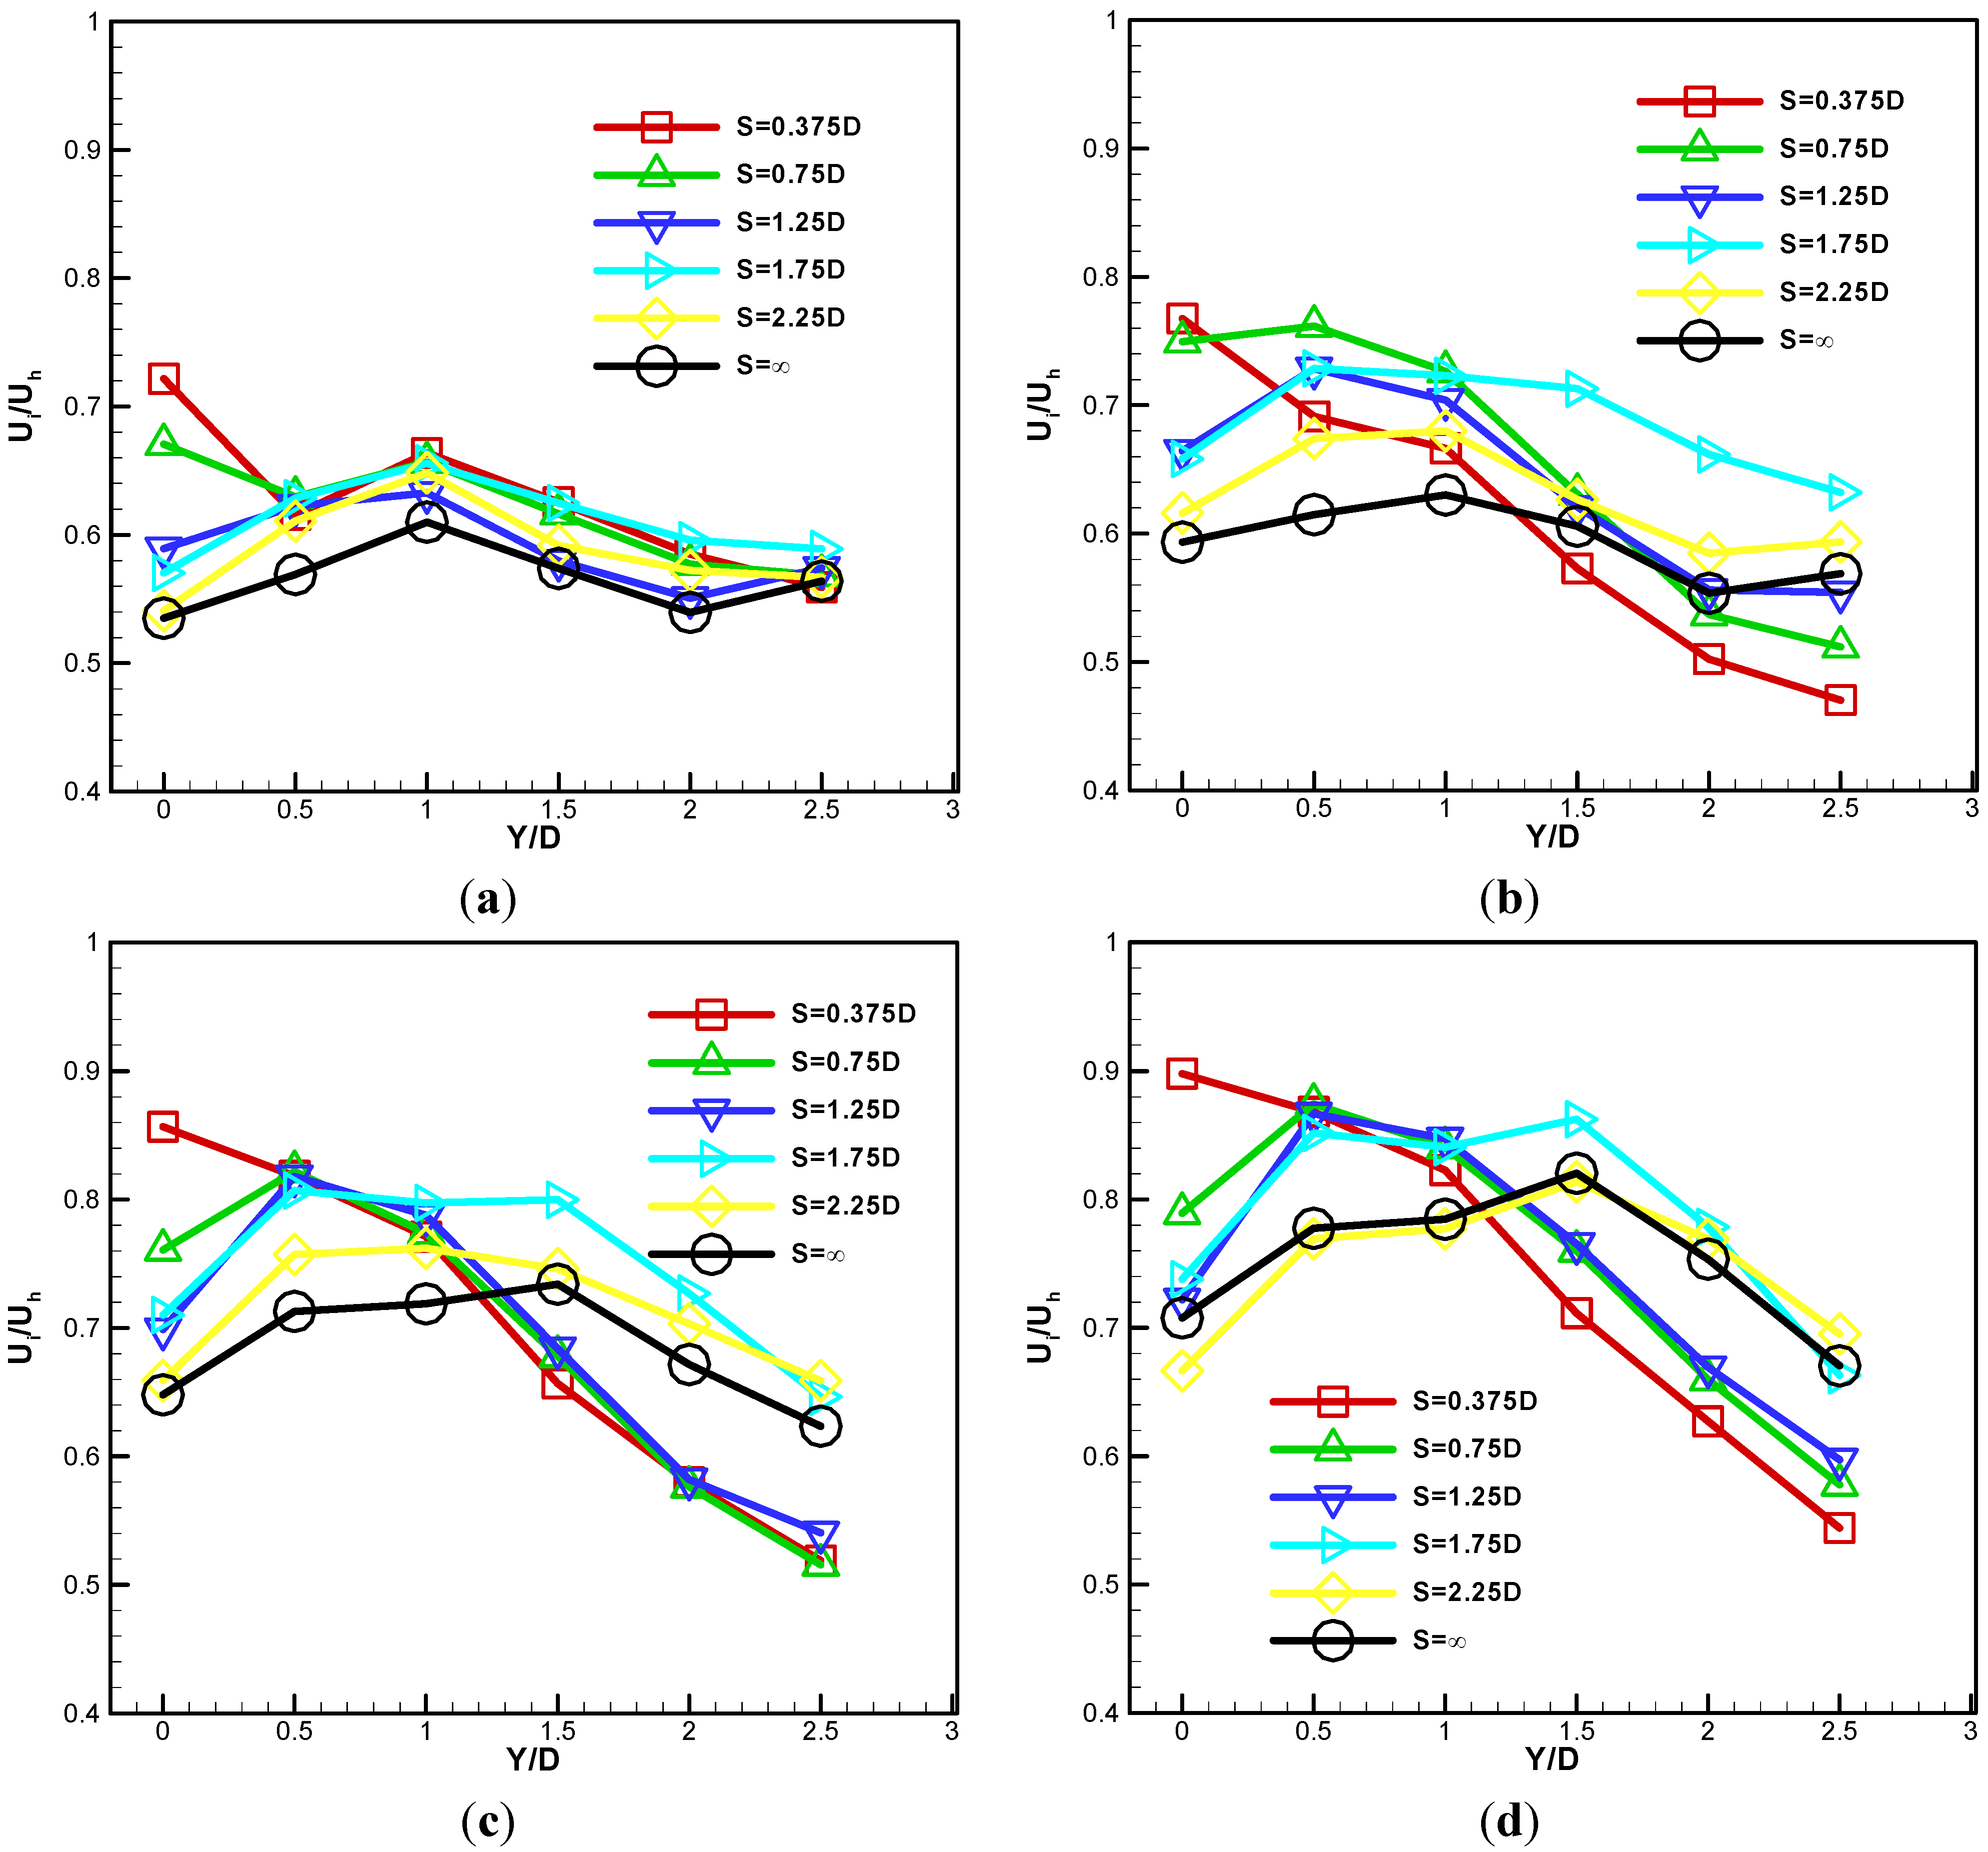
Figure 3.
(a) S = 0.375D; (b) S = 0.75D; (c) S = 1.25D; (d) S = 1.75D; and (e) S = 2.25D. Relationships between the dimensionless pedestrian-level mean wind speed and the podium height, street canyon width, and measurement positions when the wind angle is θ = 0°.
Figure 3.
(a) S = 0.375D; (b) S = 0.75D; (c) S = 1.25D; (d) S = 1.75D; and (e) S = 2.25D. Relationships between the dimensionless pedestrian-level mean wind speed and the podium height, street canyon width, and measurement positions when the wind angle is θ = 0°.
Table 1.
Dimensionless mean wind speed and root-mean-square (RMS) results in the case with S = 0.375D.
Table 1.
Dimensionless mean wind speed and root-mean-square (RMS) results in the case with S = 0.375D.
| Y/D | 0 | 0.5 | 1 | 1.5 | 2 | 2.5 |
|---|
| Ph/D | 0.5 | Mean | 0.722 | 0.616 | 0.664 | 0.626 | 0.585 | 0.559 |
| RMS | 0.427 | 0.245 | 0.163 | 0.206 | 0.298 | 0.292 |
| 1 | Mean | 0.767 | 0.691 | 0.666 | 0.573 | 0.502 | 0.470 |
| RMS | 0.394 | 0.251 | 0.178 | 0.239 | 0.317 | 0.280 |
| 1.5 | Mean | 0.857 | 0.818 | 0.771 | 0.657 | 0.580 | 0.519 |
| RMS | 0.406 | 0.332 | 0.275 | 0.364 | 0.455 | 0.373 |
| 2 | Mean | 0.898 | 0.868 | 0.823 | 0.711 | 0.627 | 0.544 |
| RMS | 0.454 | 0.376 | 0.352 | 0.422 | 0.507 | 0.421 |
Blocken
et al. [
3] proposed that three different regimes can be distinguished at the pedestrian level: (1) resistance flow; (2) interaction flow; and (3) isolated flow. Resistance flows occur in narrow passages (e.g., 2 m in [
3]) with high flow resistance in the passage. No flow separation in the passage is observed. Interaction flows occur in wide passages (e.g., 10 m in [
3]), indicating that the two corner streams originating and separating at the passage entrance corners interact and merge together into a single wide passage jet, causing amplification factors higher than those in a single corner stream. Isolated flows (e.g., 30 m in [
3]) mean that there is no interaction of the corner streams in the passage. As revealed from
Figure 3a, when
S = 0.375 and
D = 7.5 m, the maximum dimensionless mean speed is near the entrance of the street, and the wind speed reduced gradually toward the downstream of the street canyon. This trend is similar to the patterns in the study of Blocken
et al. [
3] when
W = 2 m, which is classified as resistance flow. Although the wind speed measurement results of
S = 0.75
D = 15 m and
S = 1.25
D = 25 m are classified as interaction flow, the maximum wind speeds appeared near the entrance to the street canyon, and the locations were at approximately
Y = 0.5
D (
Y is the length of the street canyon), slightly toward the downstream compared to the previous resistance flow. The phenomena were identical to the interaction flow pattern reported in the study [
3], as shown in
Figure 3b,c. The flow patterns at
S = 1.75
D = 35 m and
S = 2.25
D = 45 m are classified as isolation flow. As shown in
Figure 3d,e, the figure patterns were relatively smooth; due to the larger street canyon width, the wind flows of the center row position were not affected by the buildings on both sides. When comparing the resistance flow and the interaction flow, there was no phenomenon of a sudden increase in the wind speed.
In previous findings, resistance flow existed when the street canyon width was
S = 0.375
D = 7.5 m; interaction flow existed when the widths of the street canyon were
S = 0.75
D and 1.25
D = 15 m and 25 m; and isolation flow existed when the widths of the street canyon were
S = 1.75
D = 35 m and 2.25
D = 45 m. However, the definitions for the street canyon width are different from those in the previous study [
3]. The main reason is that the buildings simulated along the two sides of the street canyon in this study had façades of different sizes (asymmetry), whereas Blocken
et al. [
3] adopted symmetrical facades. In [
3], when the wind flows are blocked from moving toward the street canyon by buildings, two corner vortexes with the same impact ability will converge at the entrance and then enter the street canyon. In this study, when the wind flows enter a street canyon with asymmetrical facades, the corner vortexes formed also have different impact ranges because the two buildings have upwind facades with different dimensions. Therefore, the asymmetrical corner vortexes in this study would naturally vary in the wind flow inside the street canyon compared to the symmetrical corner vortexes presented in the literature.
3.2. Effect of the Podium Height
When outdoor air flows by a high-rise building, a flow separation occurs at a certain height of the building facade. Part of the airflow crosses upward over the building; some part moves toward both sides; and another large part of the flow moves downward and forms a downwash flow, and a horseshoe vortex is subsequently generated at the bottom of the upwind side, moving toward both sides of the corner. This vortex and another wind flow at the corner combine and generate instantaneous strong wind. This strong corner wind will become stronger with increasing building height.
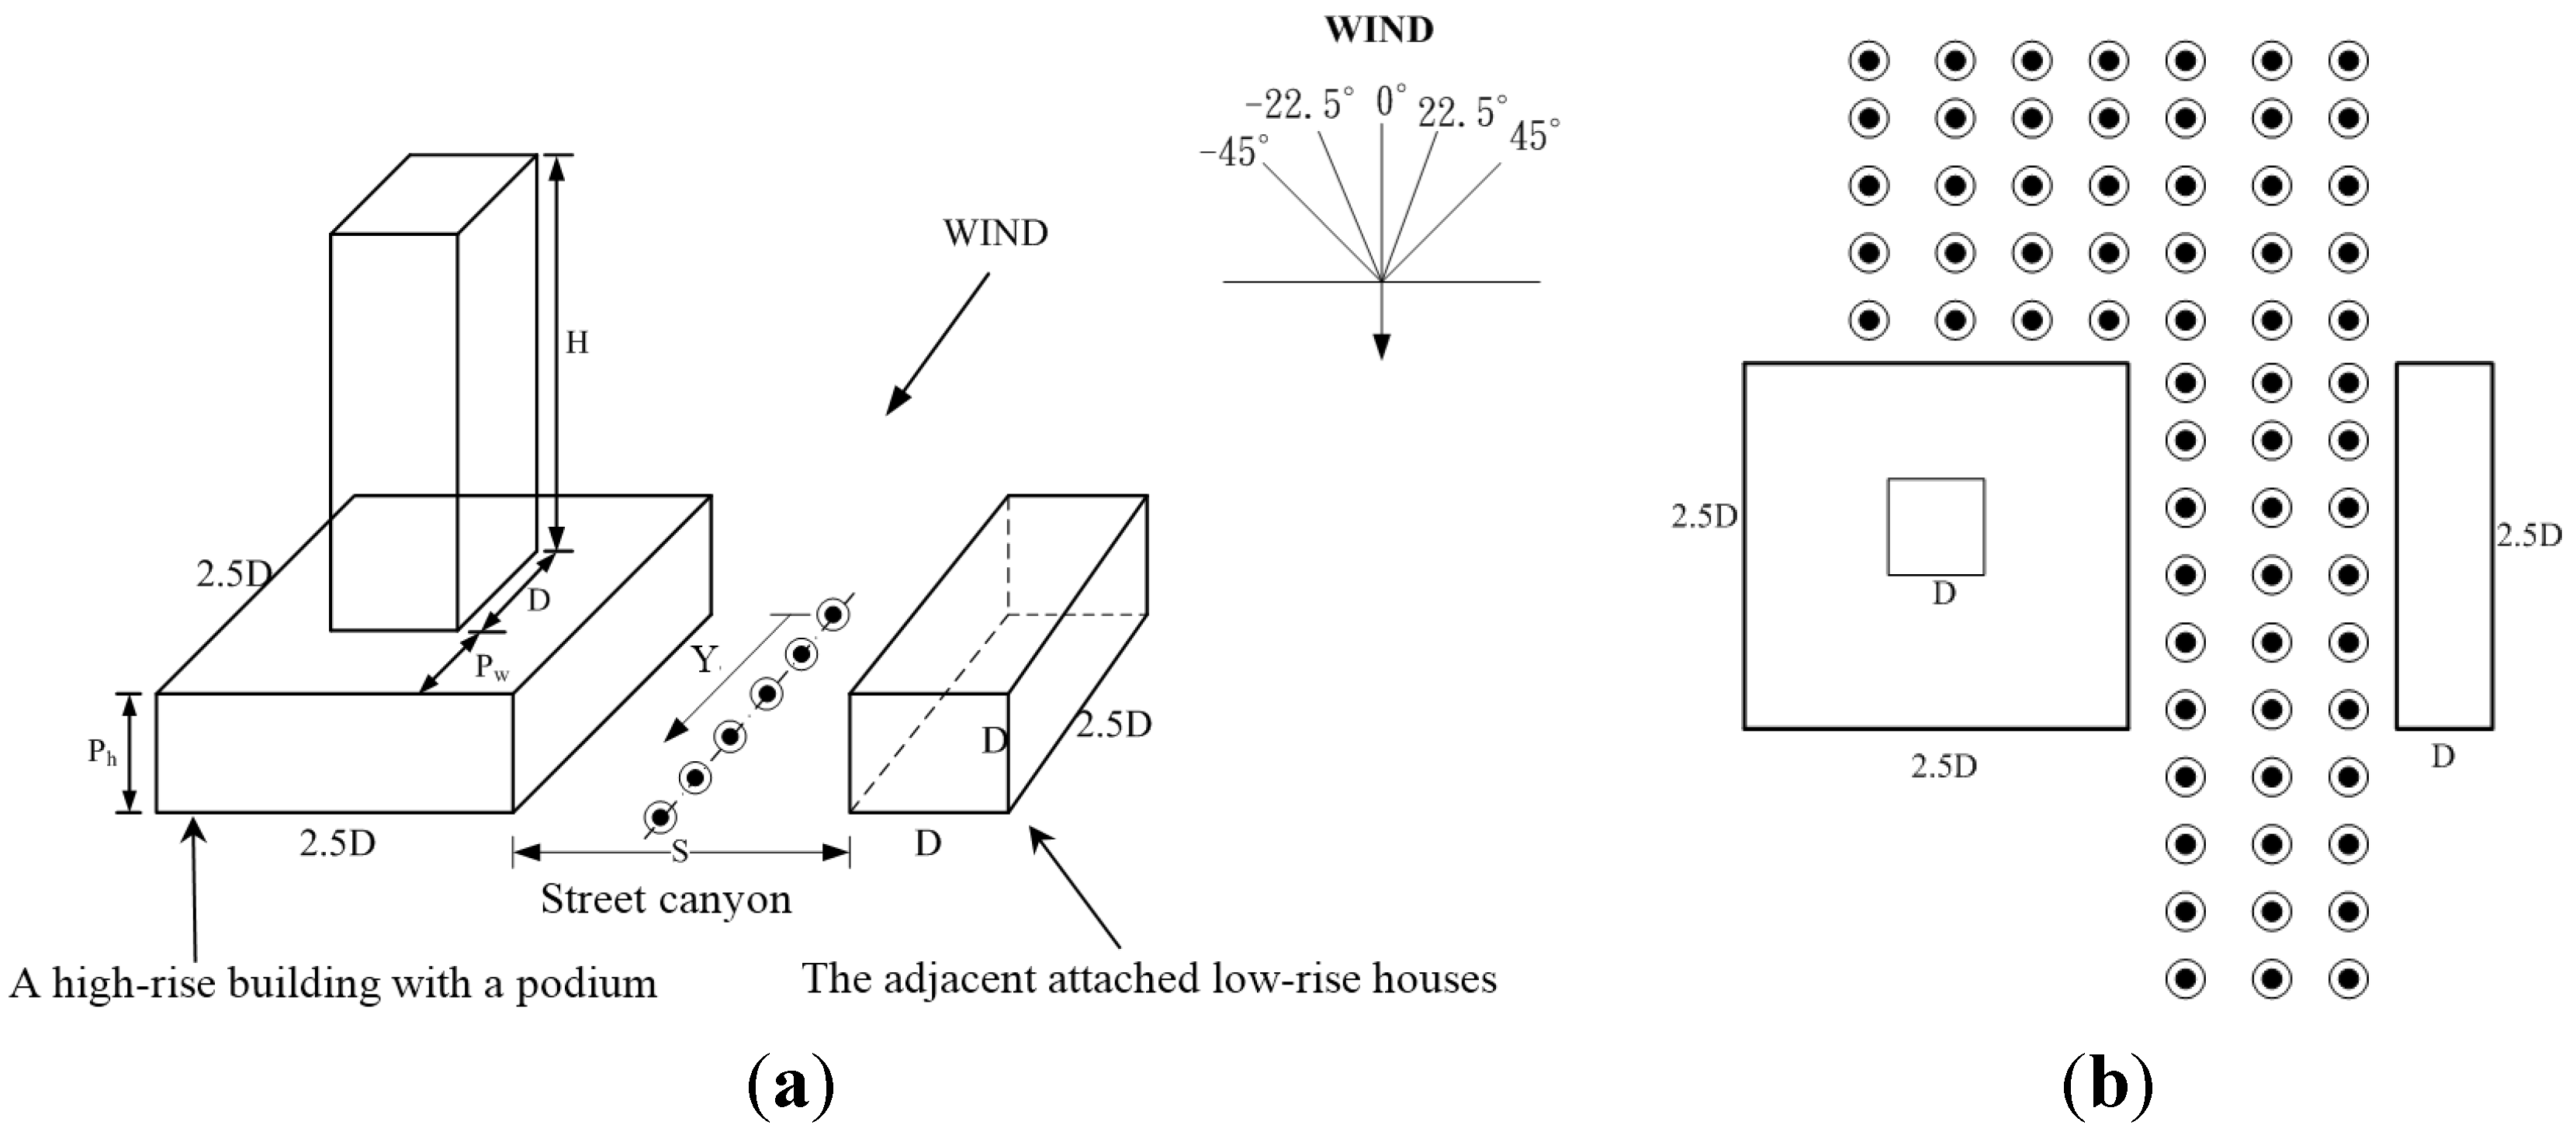
In this study, the podium width of the main building was 2.5
D; the width of the attached house was 1
D. If the street canyon width was under the aforementioned interaction flow, after the approaching wind enters the street canyon, it will be drawn into the street canyon by the corner vortex of the podium. This corner vortex intensity will be affected by the height of the podium (or high-rise building), causing different wind speed changes inside the street canyon.
Figure 4 shows the changes in the pedestrian-level wind speed inside the street canyon when the podium heights (
Ph = 0.5
D, 1
D, 1.5
D, and 2
D) and the widths of the street canyons are different;
S = ∞ indicates that the test conditions have no adjacent low-rise buildings. Our observation shows that as the podium height increases, the magnitude of the overall wind speed inside the street canyon increases accordingly. The effects of the street canyon width on the wind speed are more apparent when
Ph ≥ 1
D.
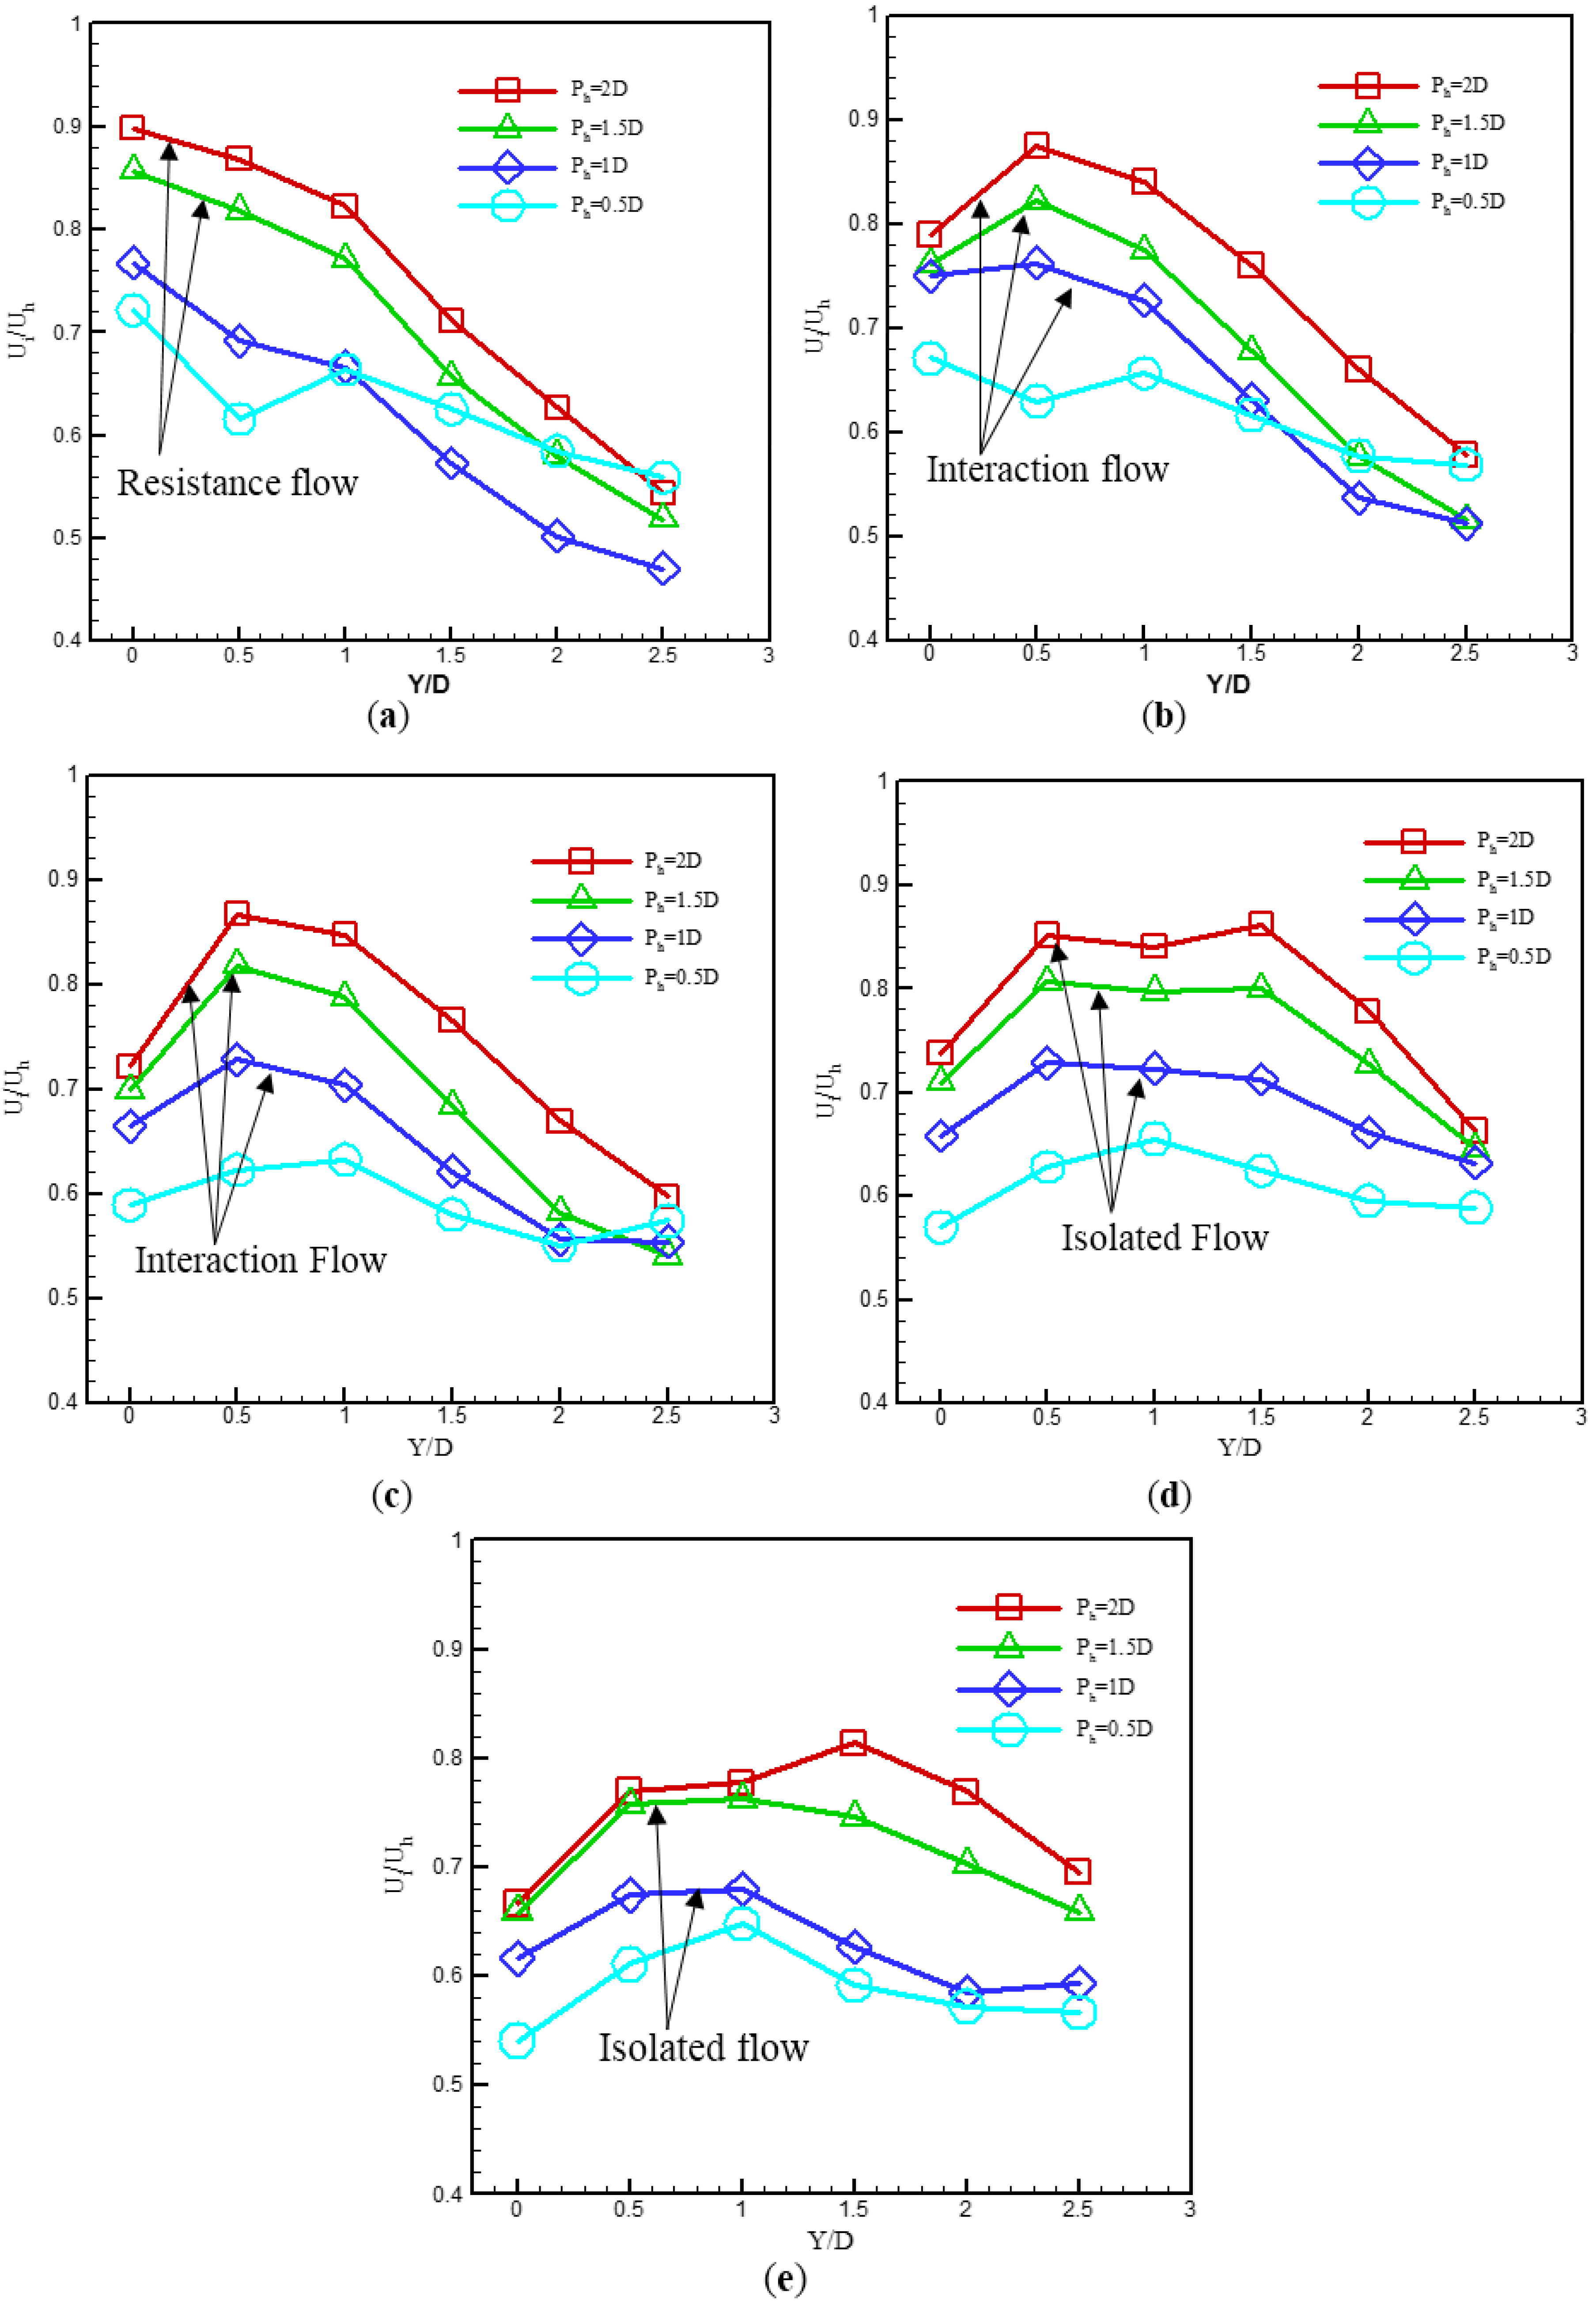
Figure 4a shows the results for
Ph = 0.5
D, in which the podium height is lower than the height of the attached houses. The dimensionless mean wind speed for the street canyon entrance decreases with increasing street canyon width, whereas the wind speed inside the street canyon downstream was not affected by the street canyon width. The corner vortexes collectively entering the street canyon were relatively weak due to the approaching upwind airflow that mainly crossed over the podium. Two adjacent parallel buildings formed a resistance when the street canyon width was small.
Figure 4b shows the results for
Ph = 1
D, in which the podium height is equal to the height of the attached low-rise houses. Compared to
Figure 4a (
Ph = 0.5
D),
Figure 4b shows that there were slight changes in the wind flow characteristic of the street canyon with different widths. The wind speed in the entire street canyon increase, and the downstream wind speed inside the street canyon began to change. When the street canyon width was
S = 0.375
D, the mean wind speed was the highest at the entrance and gradually decreased as it approached the downstream of the street canyon. The mean wind speeds at the street canyon entrance were lower when the widths of the street canyon were
S = 0.75
D and 1.25
D; the wind speeds were the highest at the distance of
Y = 0.5
D away from the entrance and then gradually decreased along the street canyon downstream.
Figure 4.
(a) Ph = 0.5D; (b) Ph= 1D; (c) Ph= 1.5D; and (d) Ph= 2D. Relationships between the dimensionless mean wind speed and the podium height, street canyon width, and measurement position when the wind direction is θ = 0° (continued).
Figure 4.
(a) Ph = 0.5D; (b) Ph= 1D; (c) Ph= 1.5D; and (d) Ph= 2D. Relationships between the dimensionless mean wind speed and the podium height, street canyon width, and measurement position when the wind direction is θ = 0° (continued).
When the widths of the street canyon were
S = 1.75
D and 2.25
D, the wind speed characteristics were distinctively different from those in the aforementioned widths. In the midstream of the street canyon, there were segments between 0.5
D and 1.5
D where the wind speeds were higher than those upstream and downstream. When
Ph = 2.5
D and
Ph = 2
D, the wind speed characteristics inside each type of street canyon width were similar; however, as the podium height in the case of
Ph = 2.5
D has the highest wind speed, the wind flow generated by the corner vortexes entering the street canyon were relatively high and all of the aforementioned wind speed characteristics were more distinctive, as shown in
Figure 4d. When the street canyon widths were
S = 2.25
D and
S = ∞, the wind speed plot lines were nearly overlapping; this phenomenon also once again confirms that when the street canyon width was
S = 2.25
D = 45 m, the flow was completely not affected by the attached low-rise house and was thus isolation flow.
To comprehensively understand the pedestrian-level wind flow characteristics in the street canyon, this study took the contour plots to represent the wind speed distributions at the upstream, midstream, and downstream areas. As shown in
Figure 5,
Figure 6,
Figure 7,
Figure 8,
Figure 9 and
Figure 10, the numbers in the plots represent dimensionless mean wind speed, colors closer to blue indicate lower wind speeds, and colors closer to red indicate stronger wind speeds.
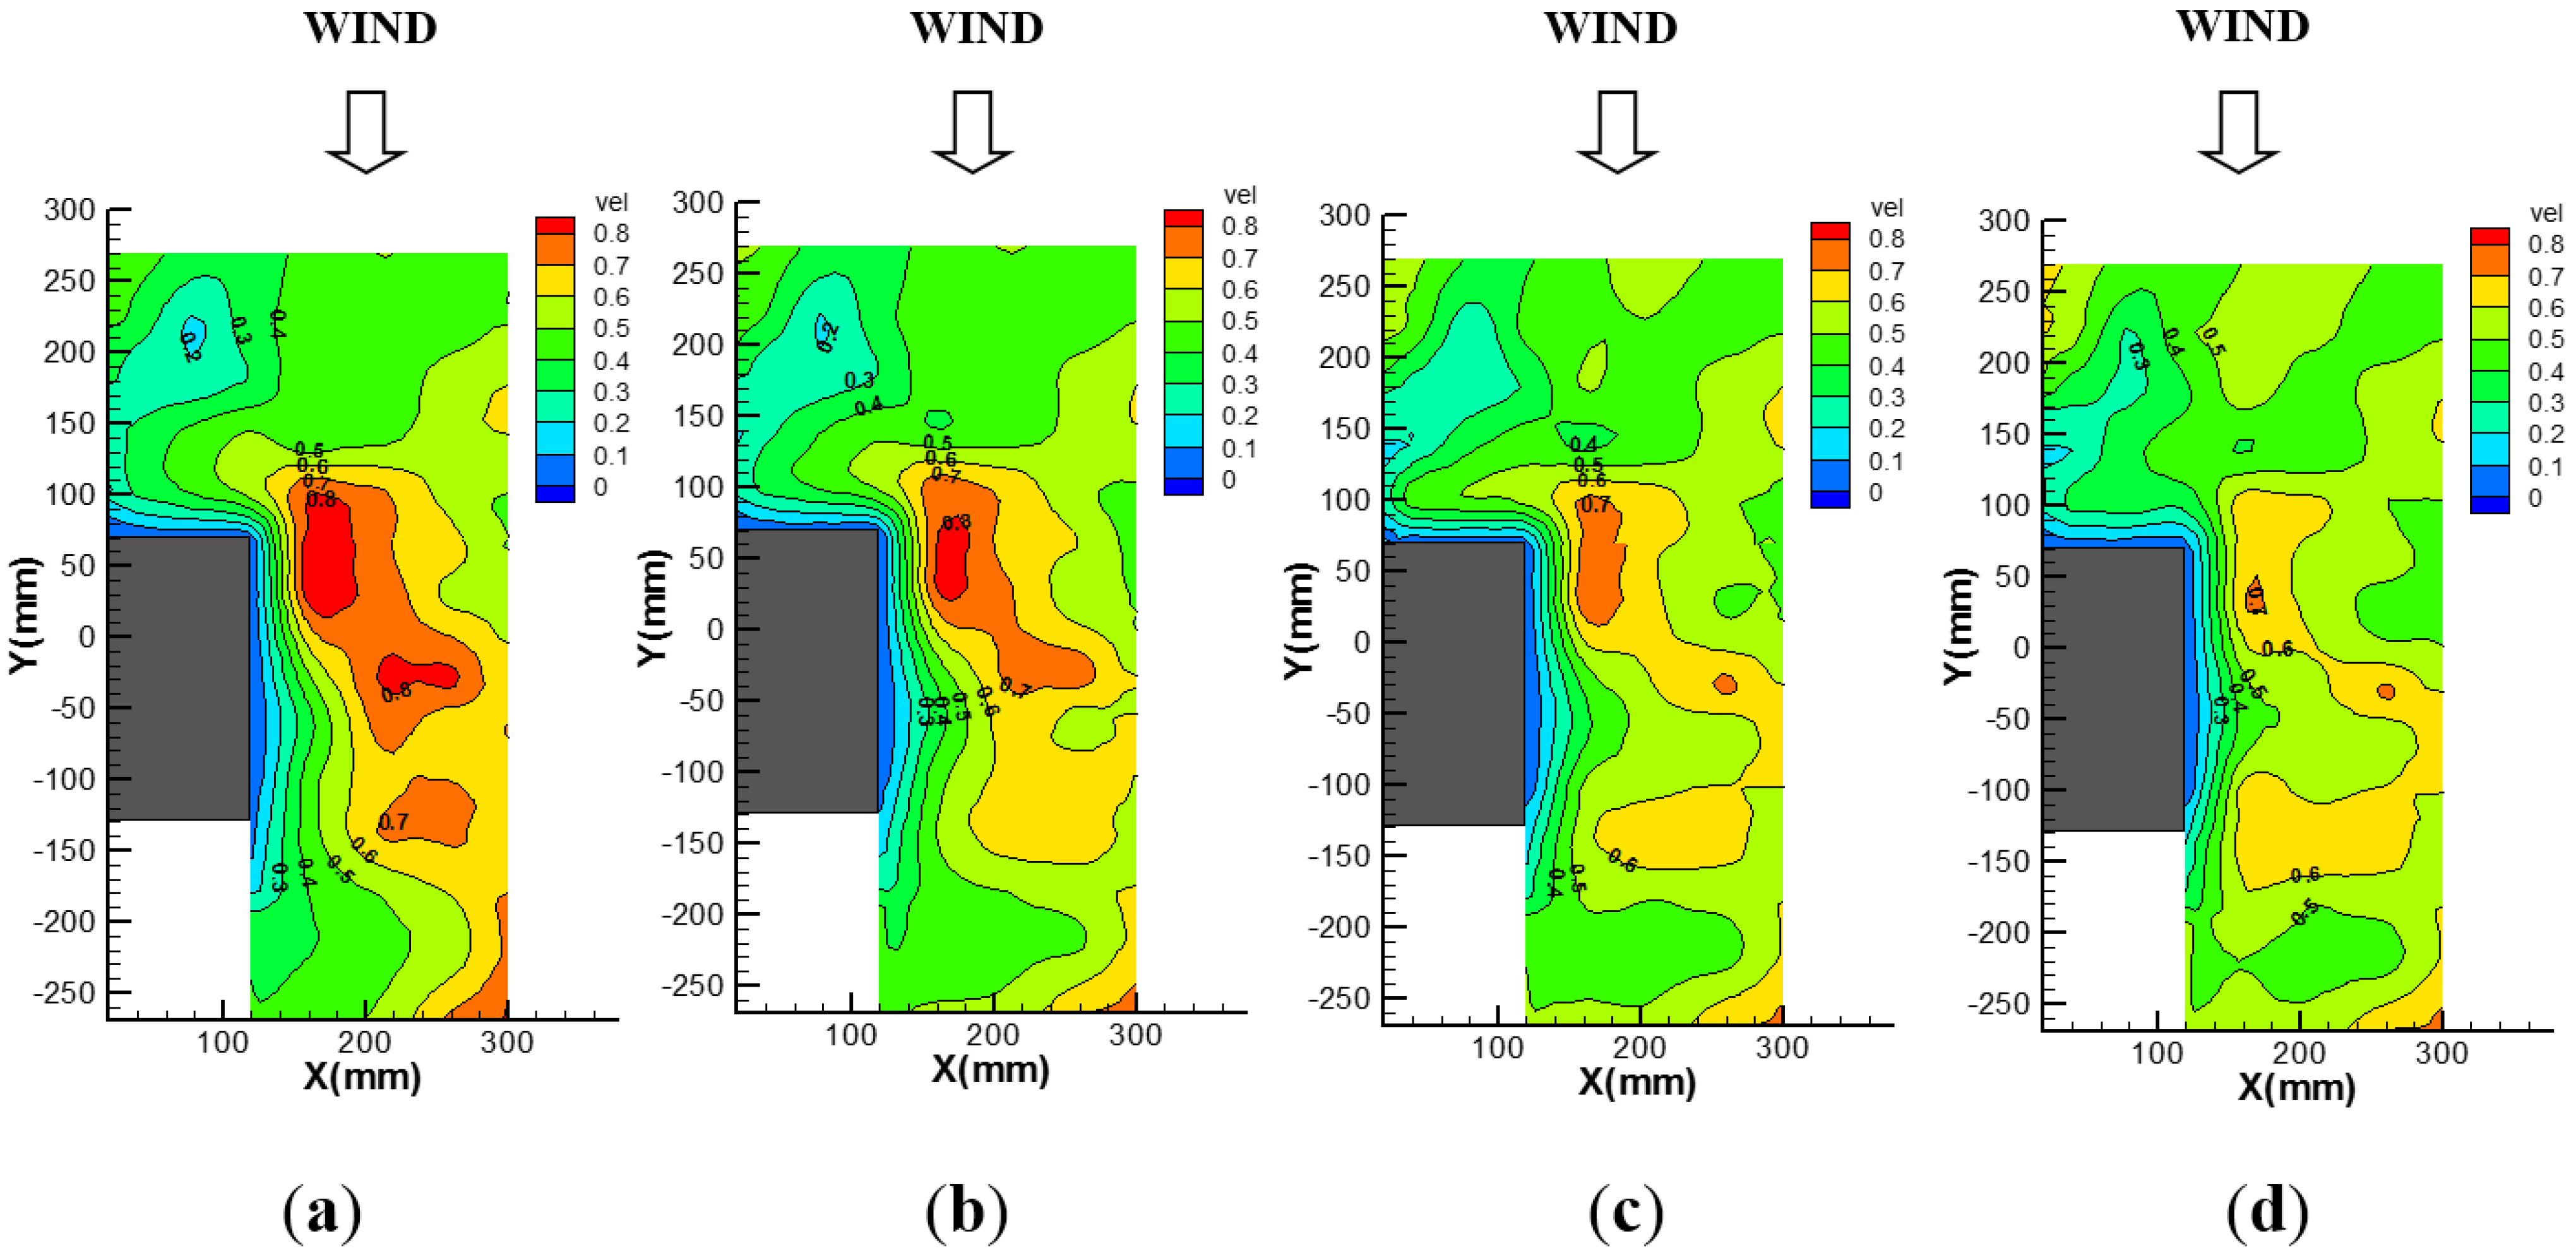
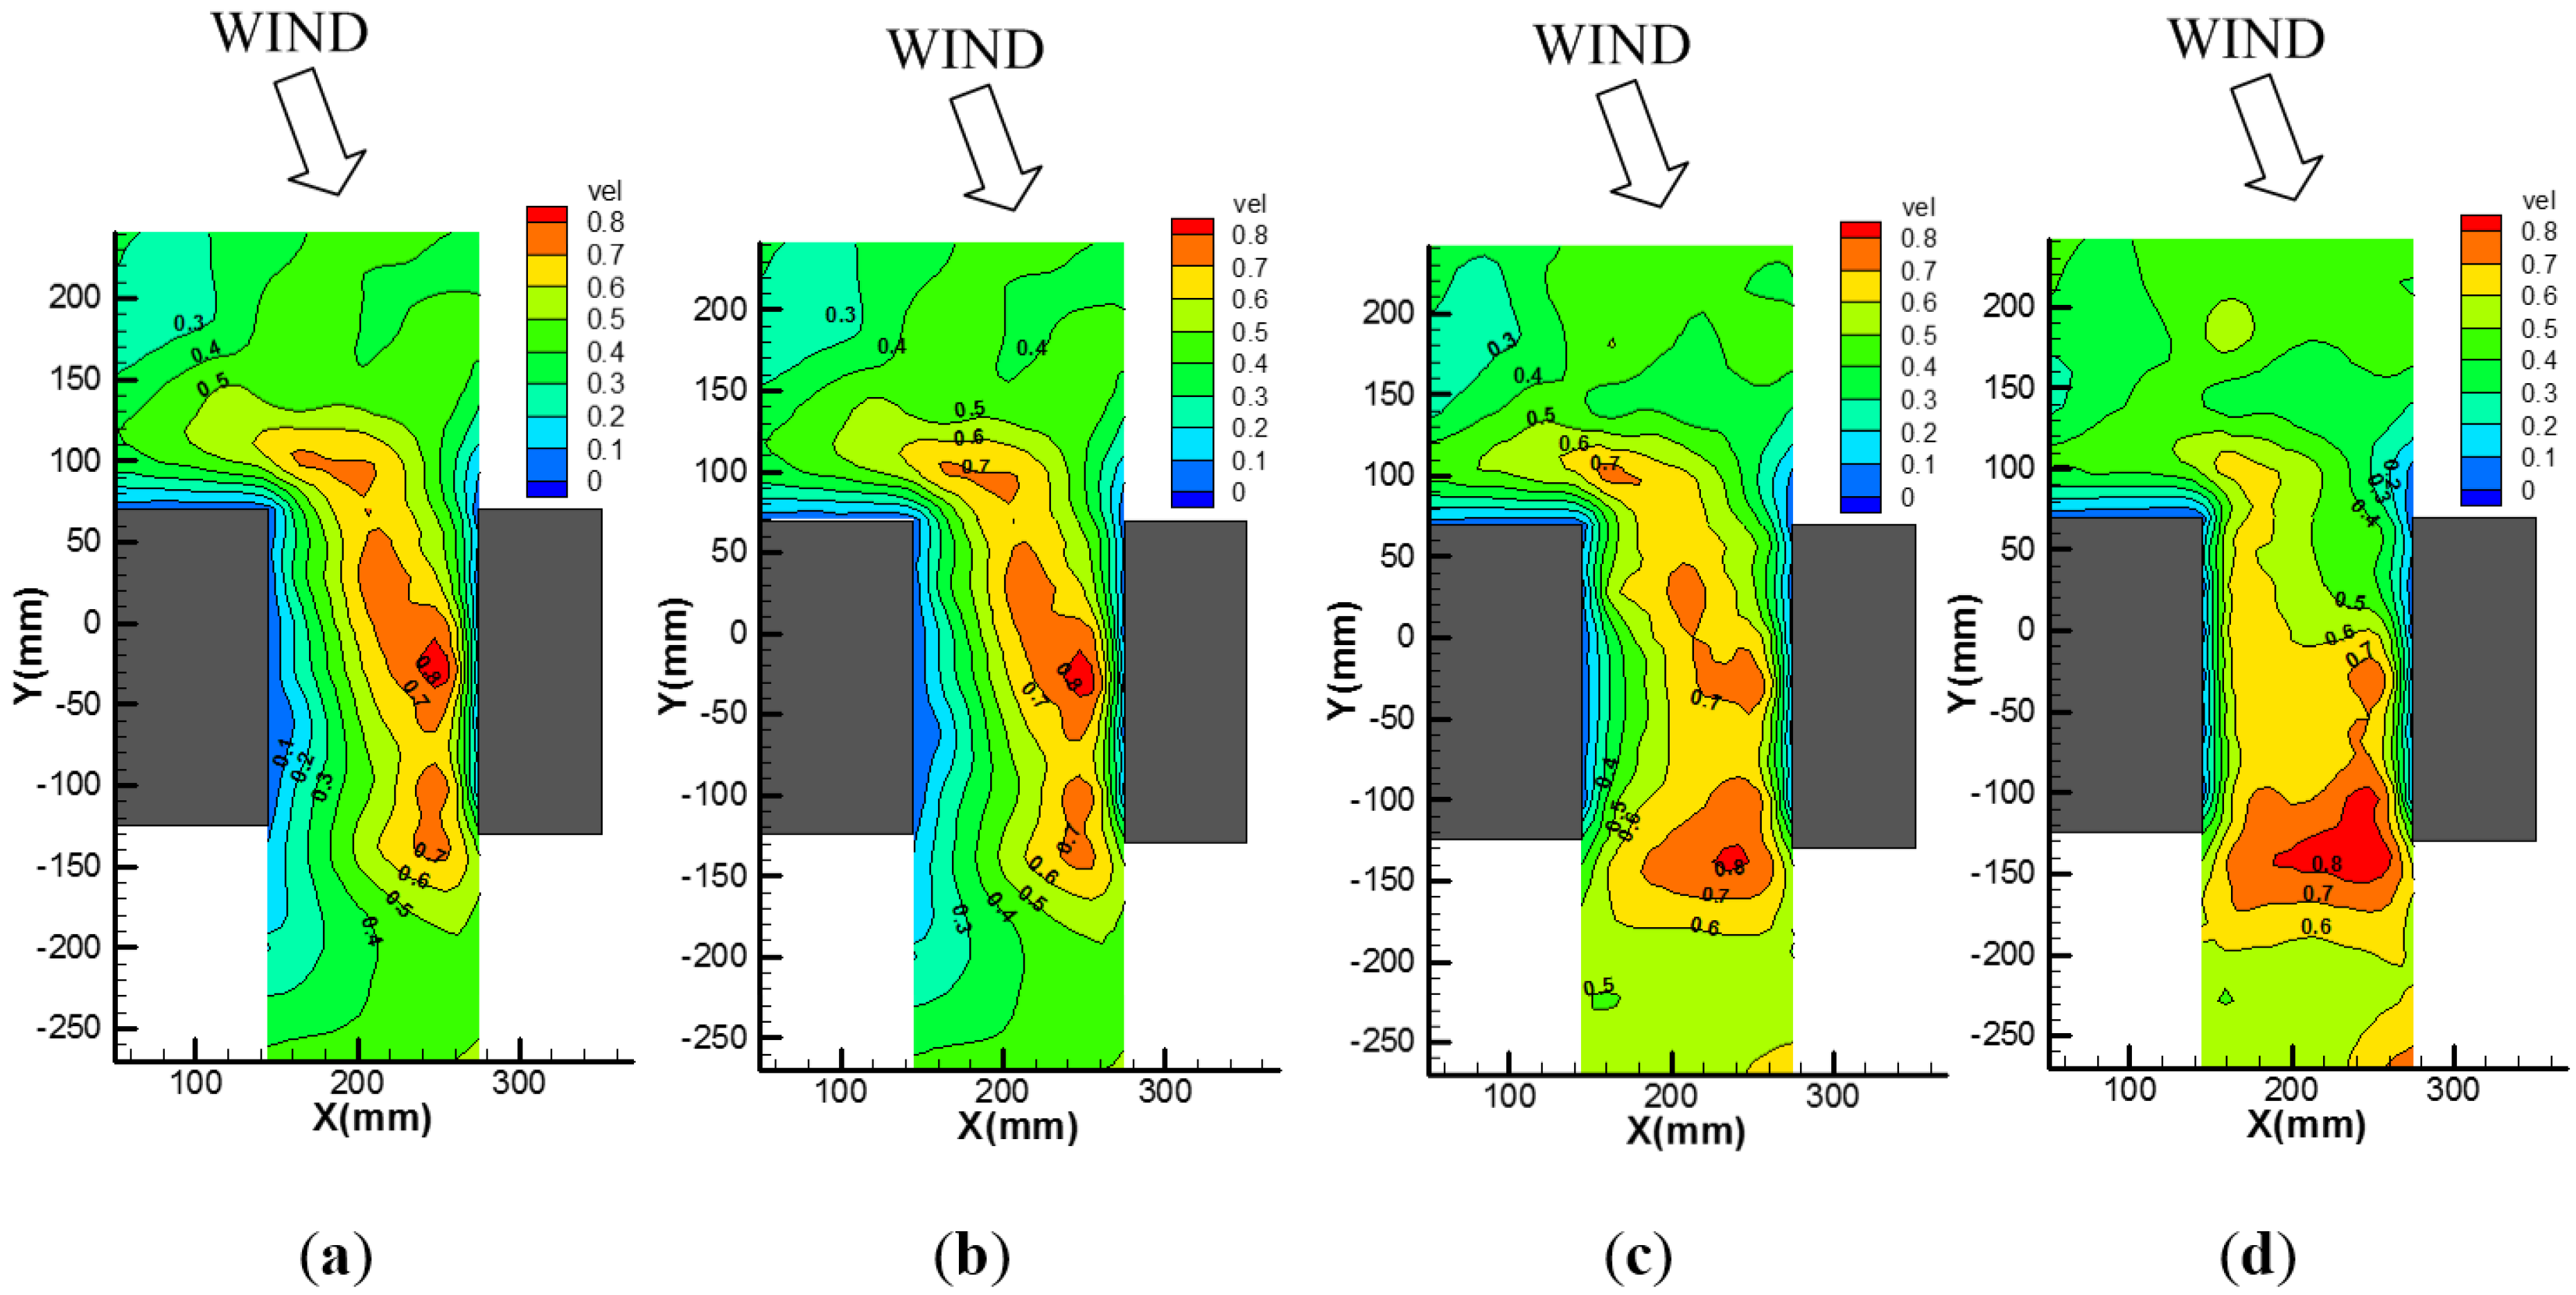
Figure 5.
Dimensionless mean wind speed distributions when there is no street canyon on the side and θ = 0°: (a) Ph = 2D; (b) Ph = 1.5D; (c) Ph = 1D; and (d) Ph = 0.5D.
Figure 5.
Dimensionless mean wind speed distributions when there is no street canyon on the side and θ = 0°: (a) Ph = 2D; (b) Ph = 1.5D; (c) Ph = 1D; and (d) Ph = 0.5D.
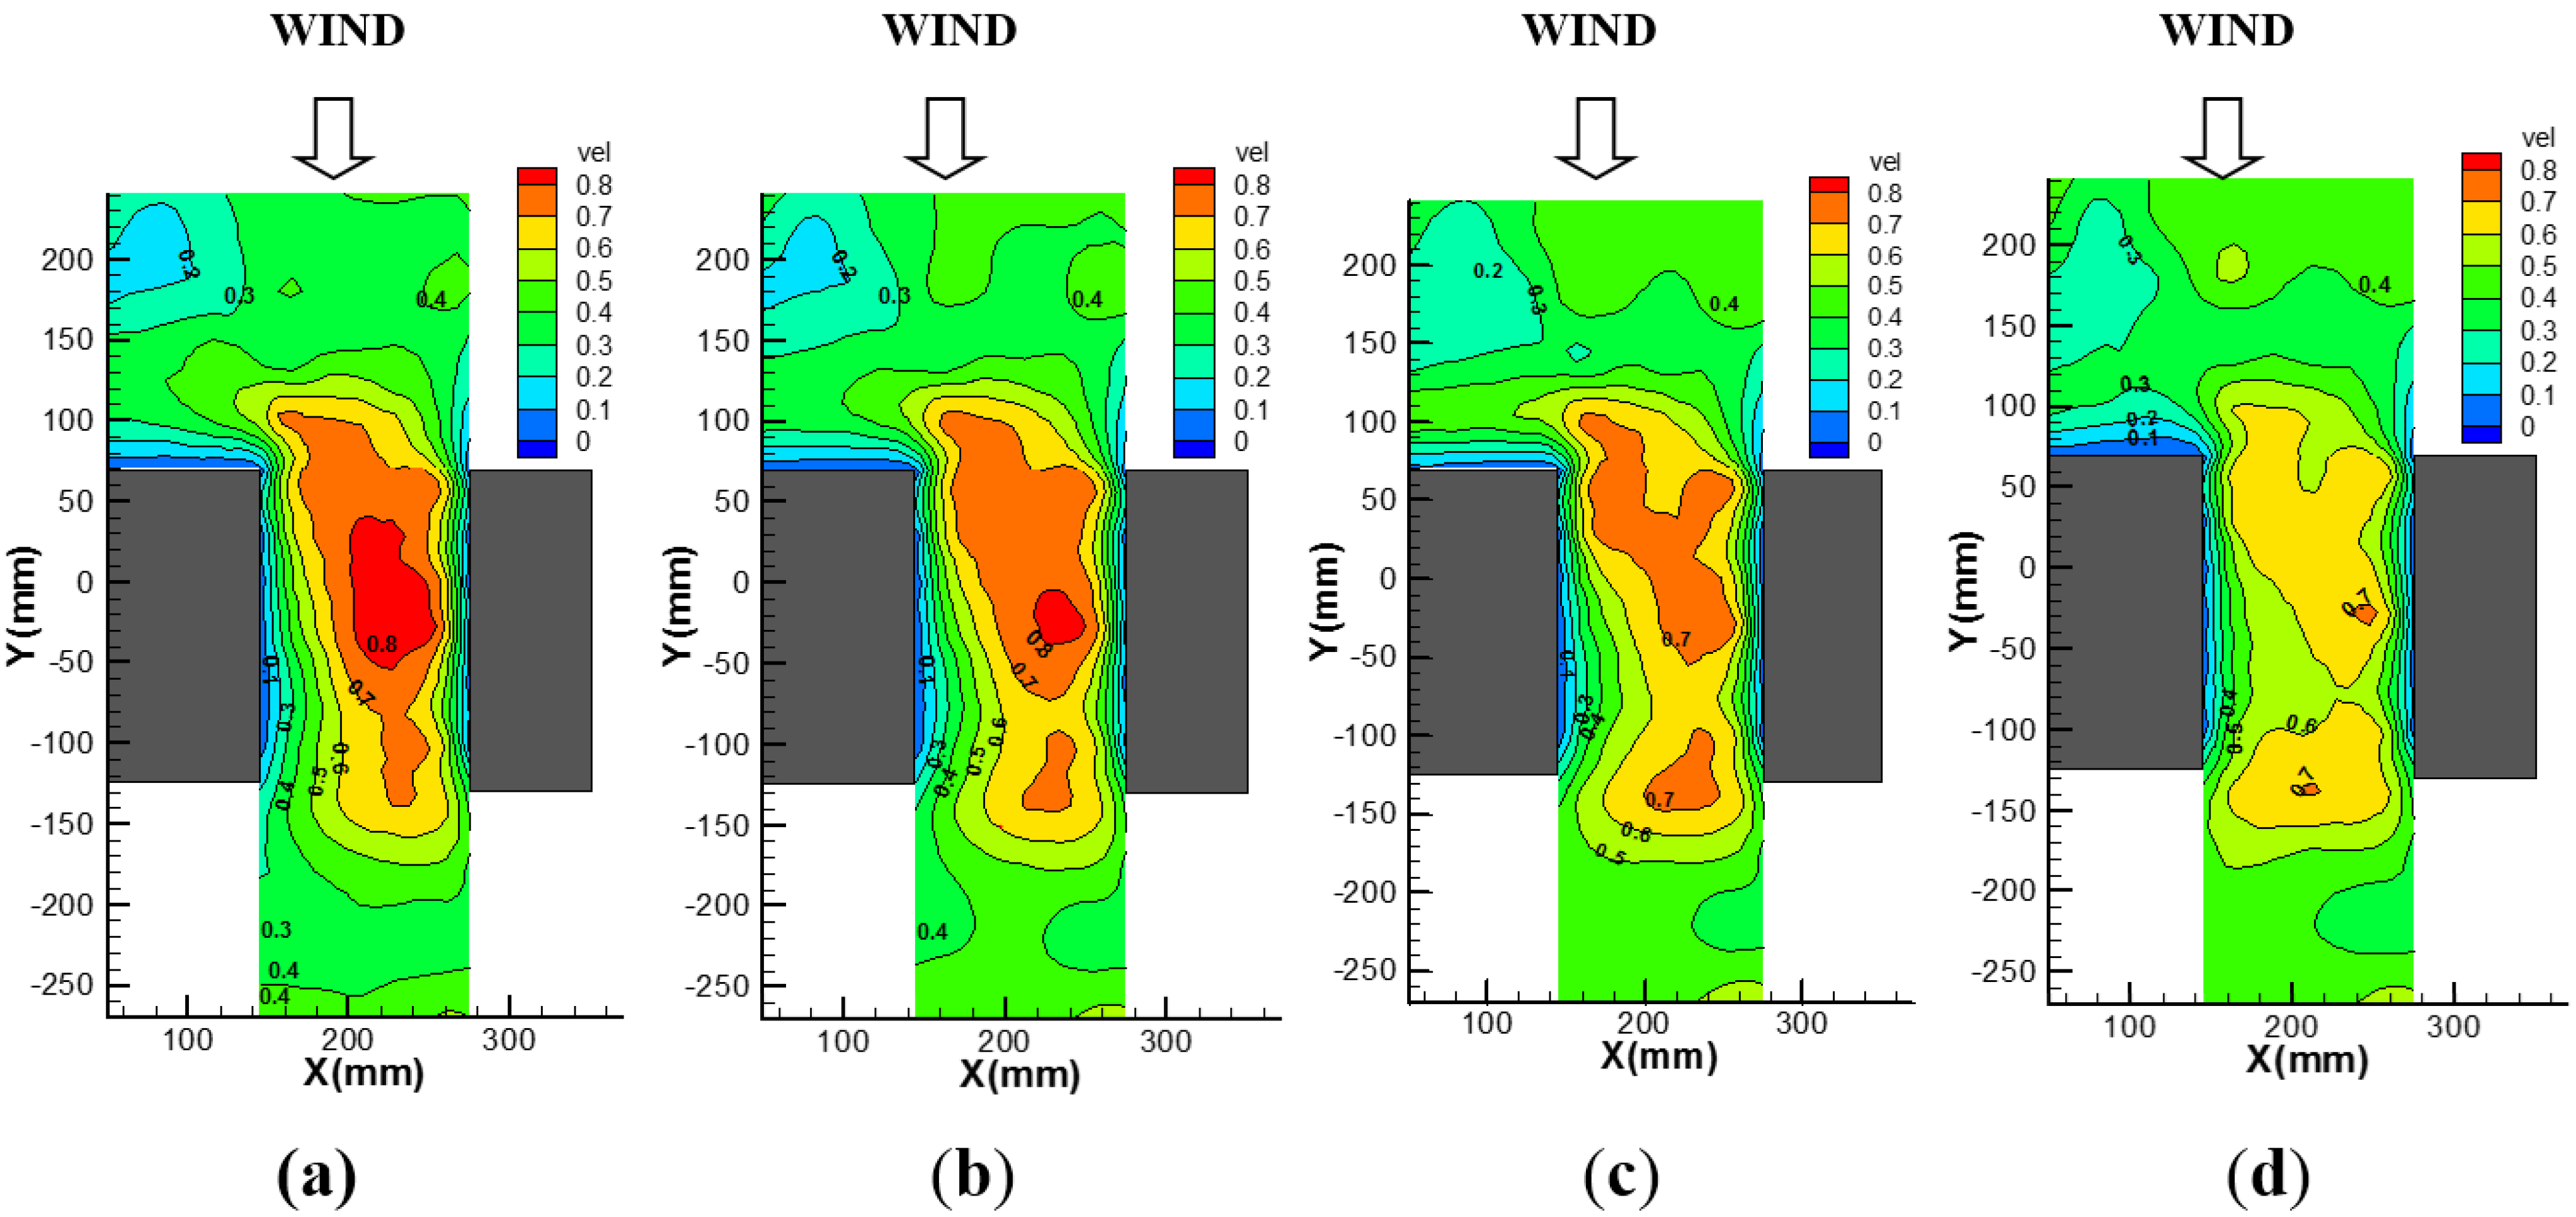
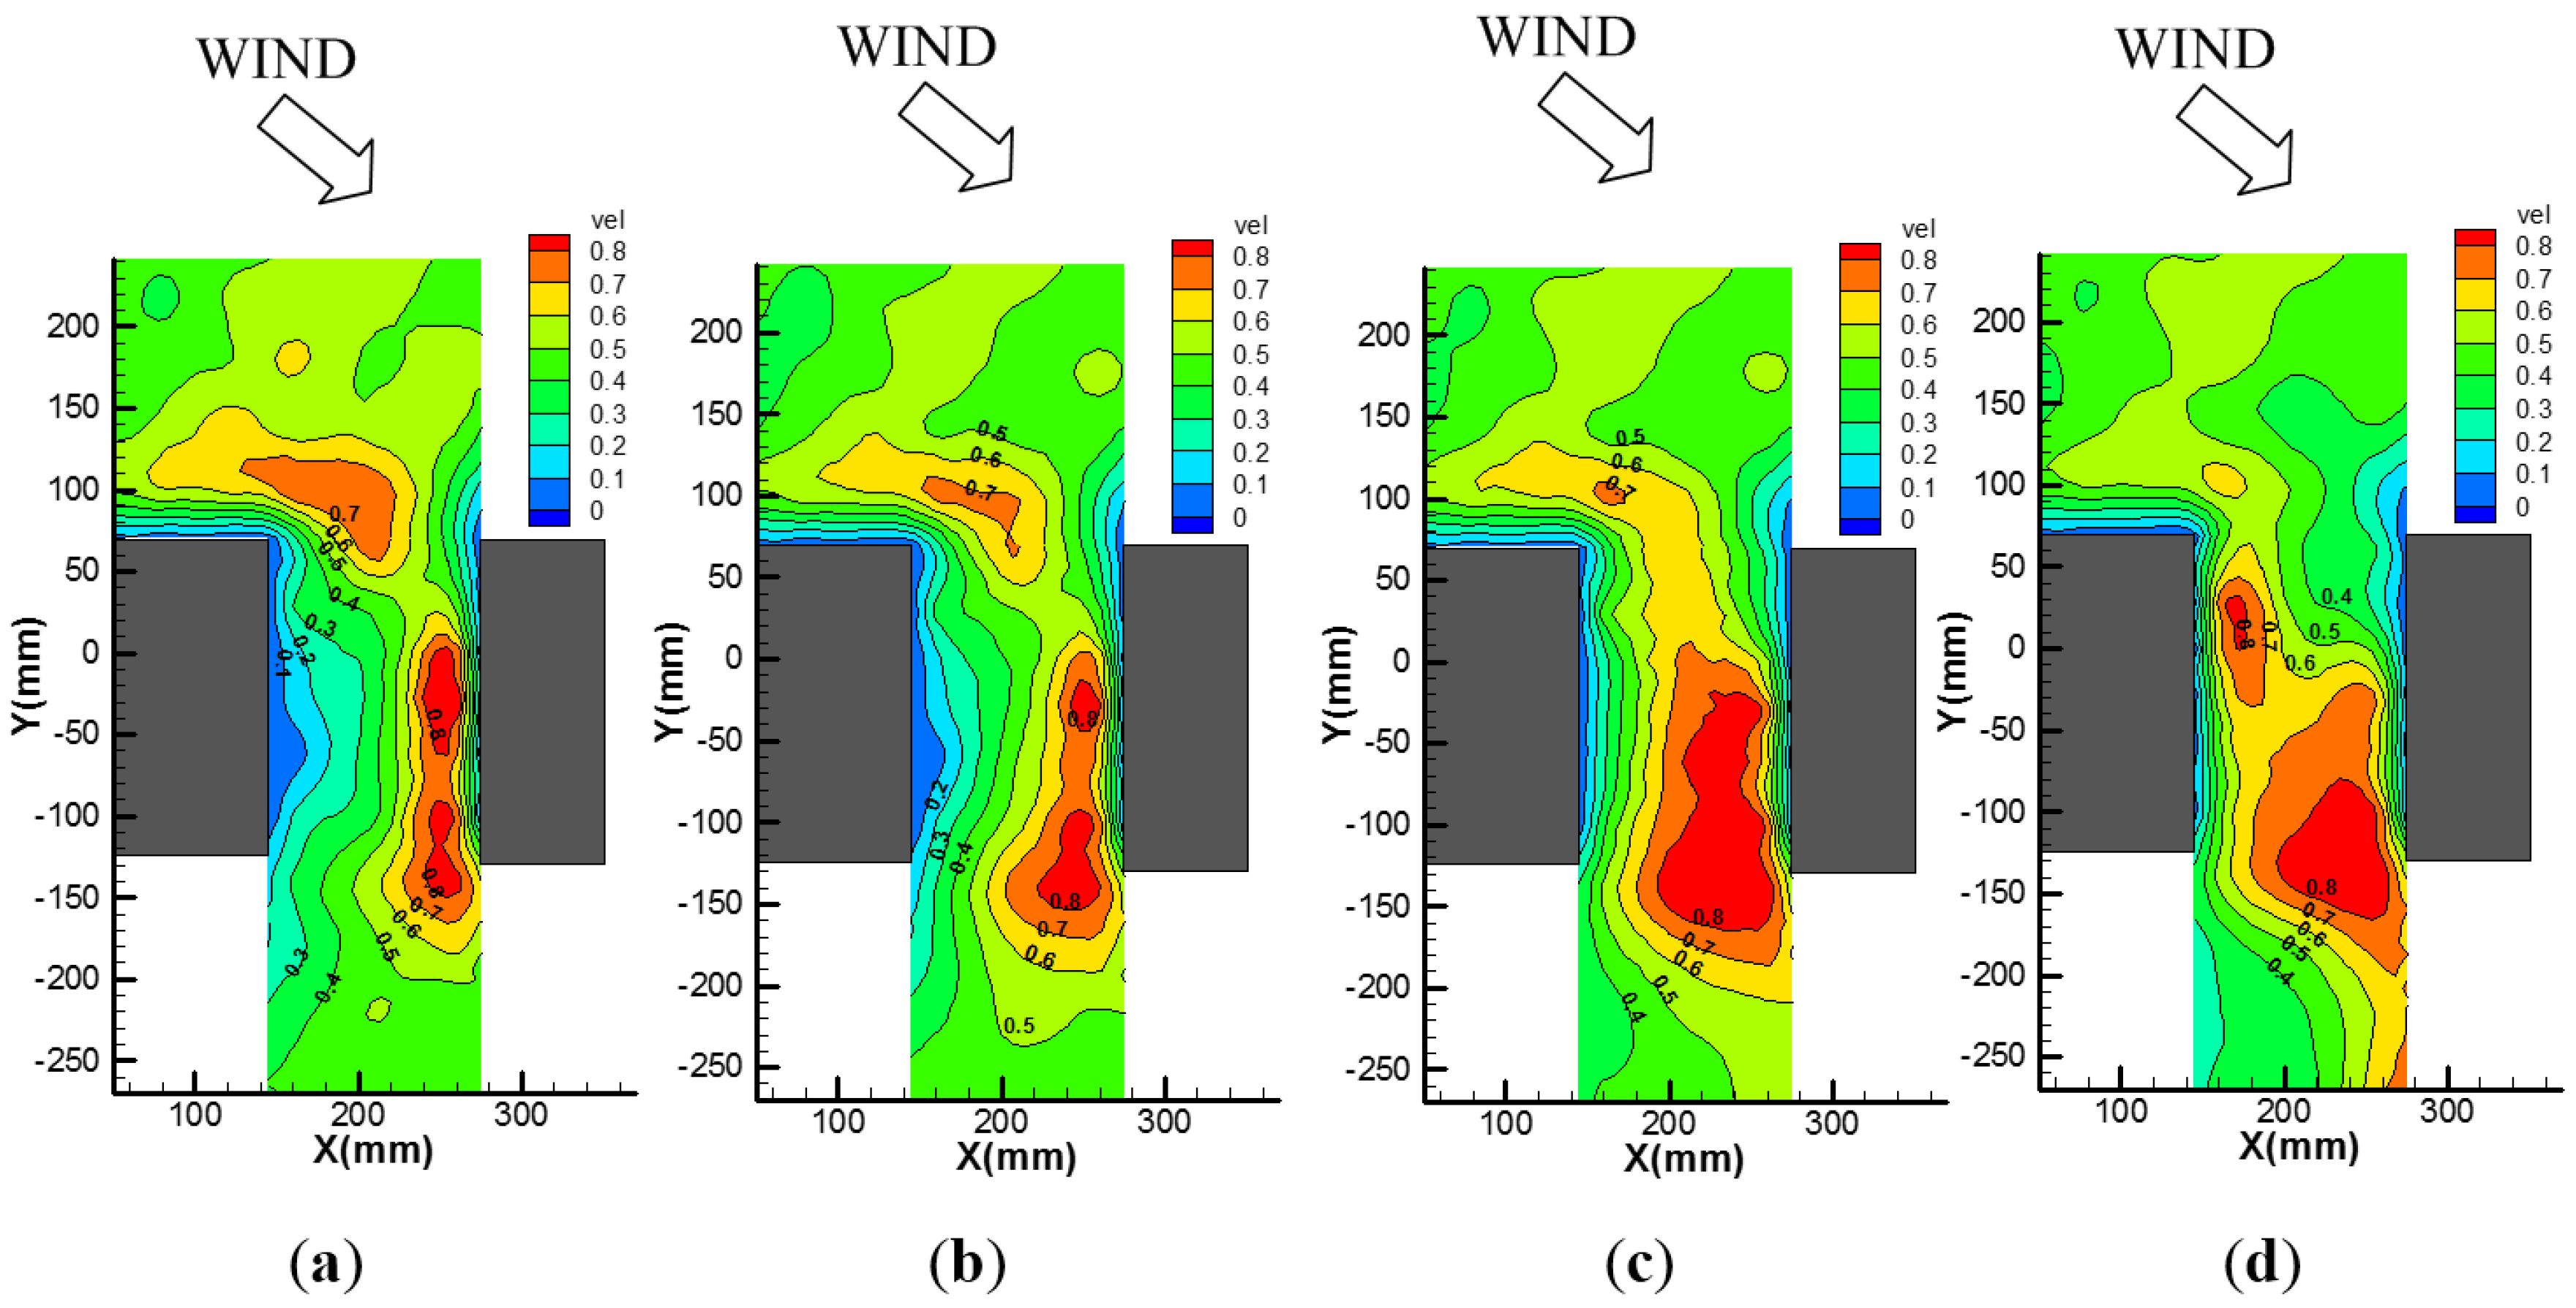
Figure 6.
(a) Ph = 2D; (b) Ph = 1.5D; (c) Ph = 1D; and (d) Ph = 0.5D. Dimensionless mean wind speed distributions when S = 1.75D and θ = 0°.
Figure 6.
(a) Ph = 2D; (b) Ph = 1.5D; (c) Ph = 1D; and (d) Ph = 0.5D. Dimensionless mean wind speed distributions when S = 1.75D and θ = 0°.
Figure 5 shows the wind speed contours for a standalone high-rise building with a podium at an angle of 0°.
Figure 6 shows the pedestrian-level wind flow characteristics in the street canyon when
S = 1.75
D. The podium height in
Figure 6a was the highest, so the zone of emerging high wind speed in the street canyon was the largest; the wind speed also decreases with a lower podium height (
Figure 6b–d). The high wind speed positions in
Figure 5 and
Figure 6 were slightly different. In
Figure 5, the main high wind speed focus area was at the corner, whereas in
Figure 6, it appeared inside the street canyon. The main reason for this difference is the narrowness of the street canyon. The wind speed inside the smaller passage was suddenly accelerated because of the Venturi effect, causing the so-called channeling effect.
3.3. Effect of the Approaching Wind Direction
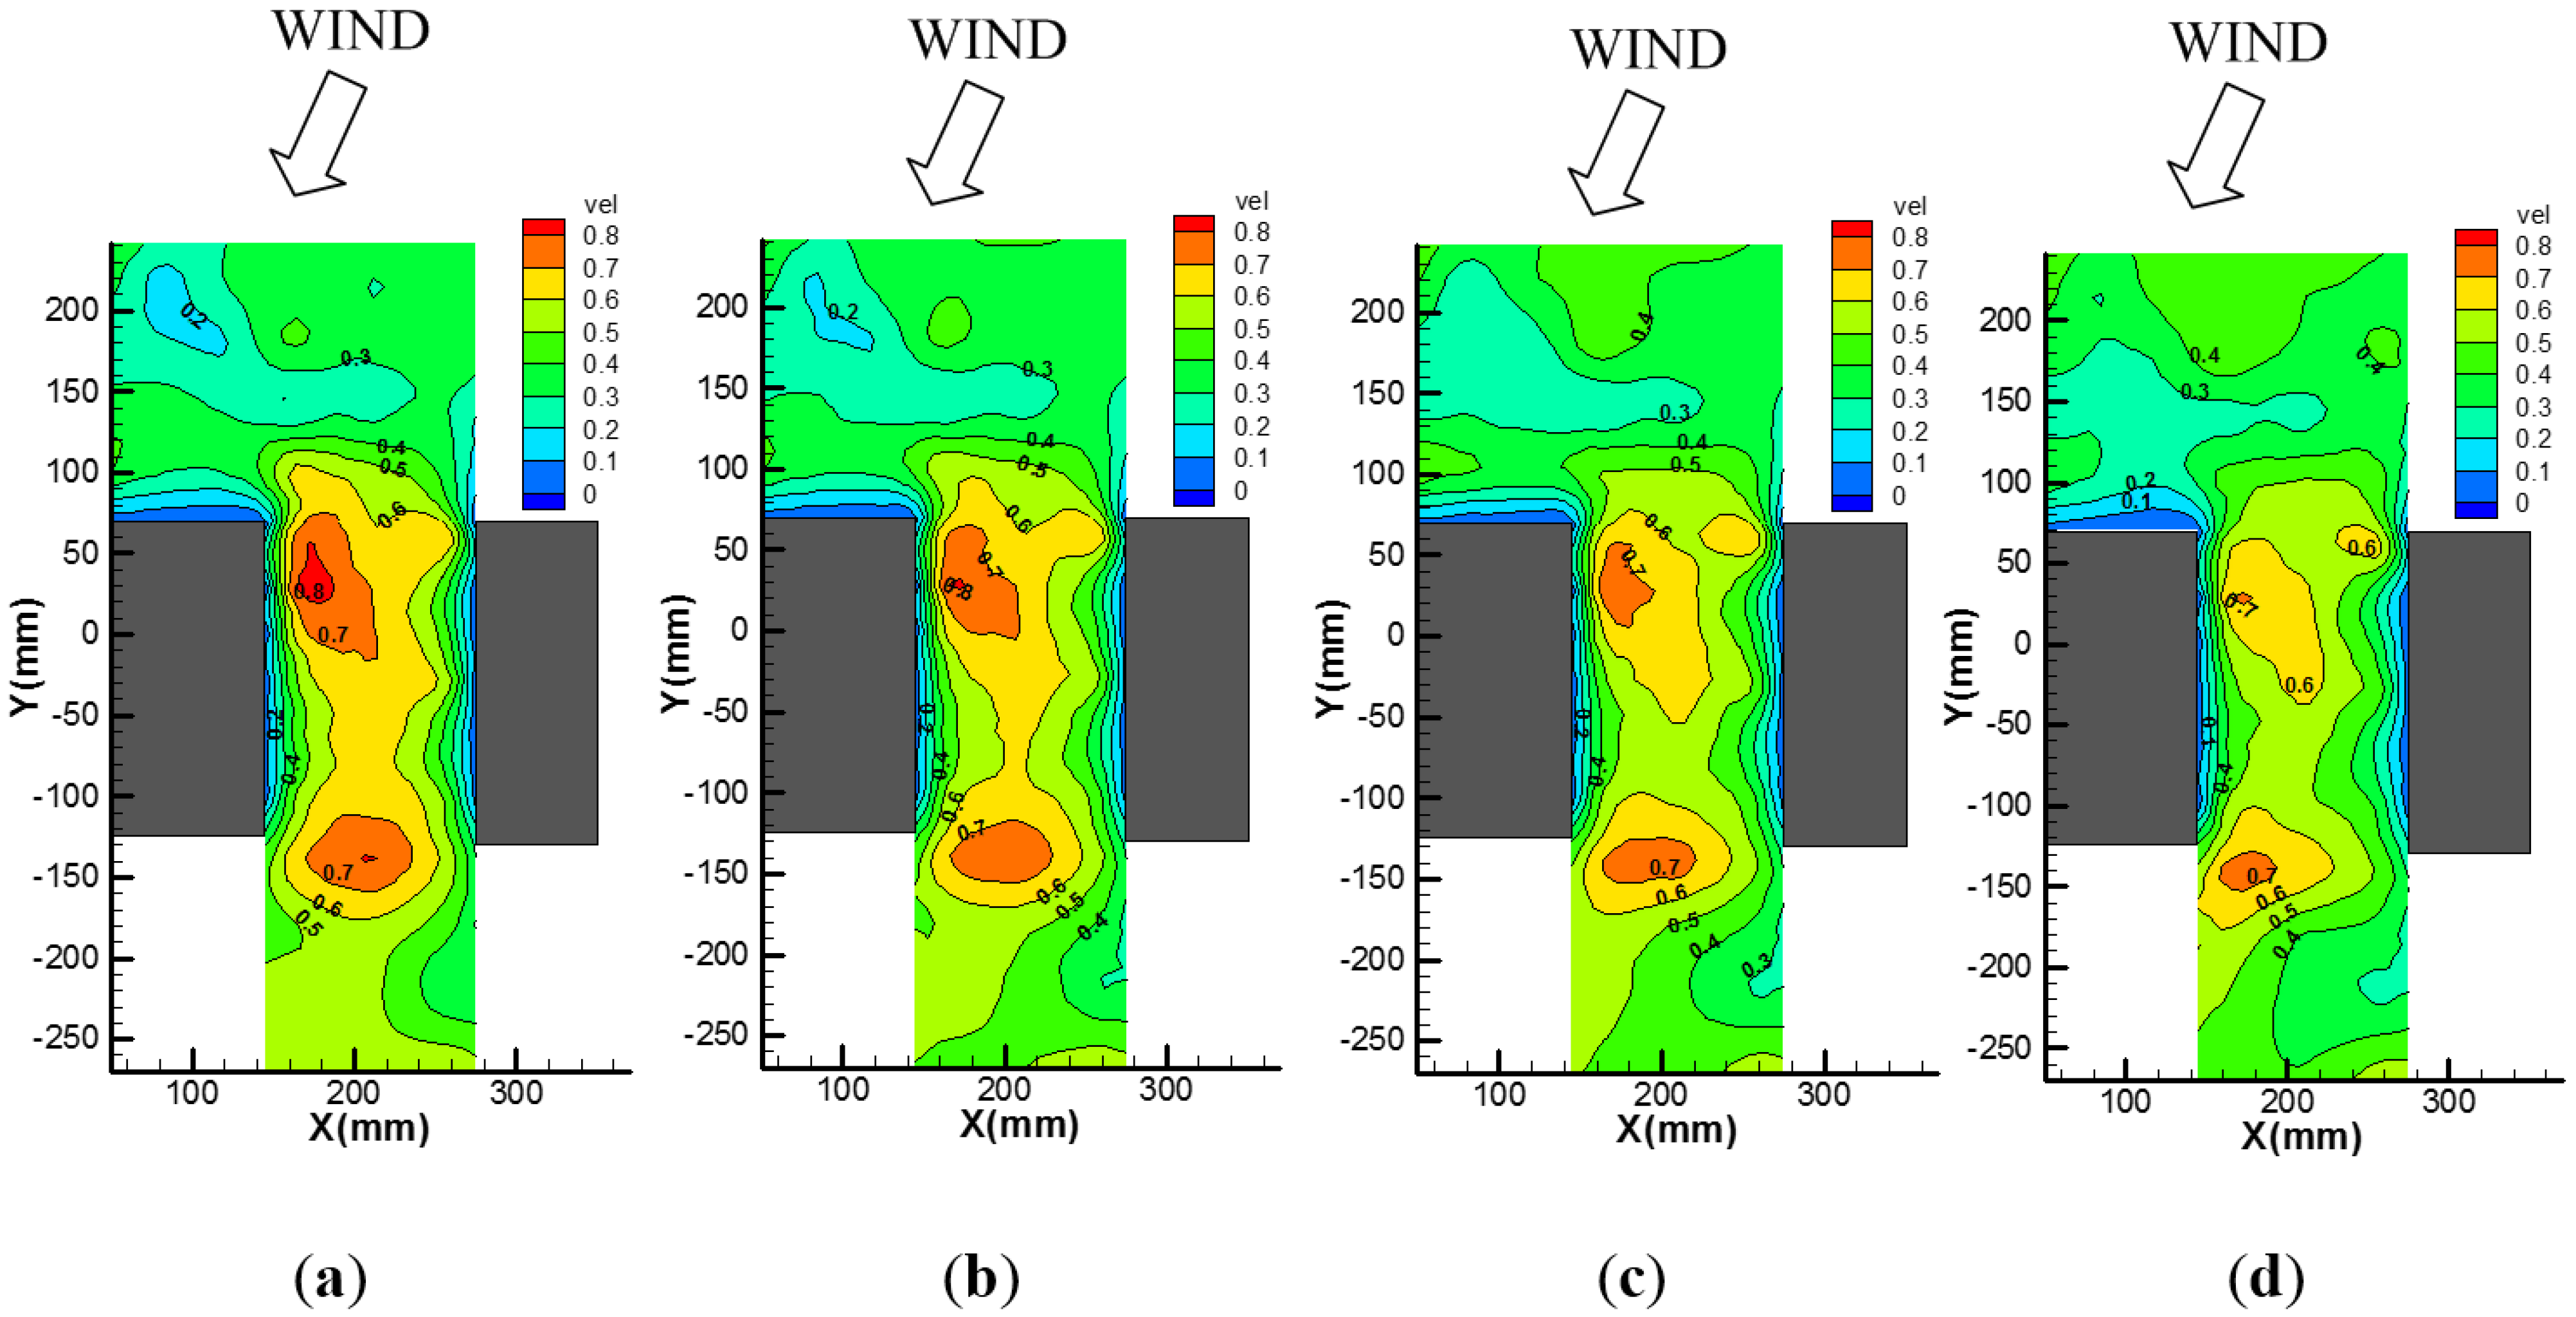
Figure 7 shows the wind speed distributions for the street canyon of
S = 1.75
D and θ = 22.5°. Because the downwash flow intensity on the upwind side became smaller, the approaching flow entering the street corner was not parallel to the street canyon, so the wind speed at the street canyon upstream zone was significantly weaker than that when θ = 0°. Moreover, the side of the podium formed a barrier to the approaching wind. Part of the wind flow moved along the side of podium toward the street canyon downstream, whereas the other parts formed the downwash flow, leading to a higher wind speed in the street canyon downstream. The intensity and range of this wind flow were controlled by the podium height; a higher podium resulted in greater downwash flow.
Figure 7.
Dimensionless wind speed distributions when S = 1.75D and θ = 22.5°: (a) Ph = 2D; (b) Ph = 1.5D; (c) Ph = 1D; and (d) Ph = 0.5D.
Figure 7.
Dimensionless wind speed distributions when S = 1.75D and θ = 22.5°: (a) Ph = 2D; (b) Ph = 1.5D; (c) Ph = 1D; and (d) Ph = 0.5D.
Figure 7a,b shows the scenarios when the podium height was greater than the height of the adjacent low-rise attached houses; the wind flow formed scenarios similar to the vertical horseshoe vortex in the street canyon downstream. In contrast,
Figure 7c,d shows the scenarios when the podium height was lower than or equal to those of the adjacent attached houses. For the street canyon downstream, there was no downwash flow; the wind flow only took a 22.5° angle to cut through the adjacent attached houses, which is why the range of the high wind speed zone was smaller.
The aforementioned wind flow characteristics in street canyons downstream were more significant when the wind direction was at θ = 45°. The blockage formed by the side of the podium on the approaching wind flow was larger; the downwash flow generated was also stronger. When the podium was higher than the adjacent low-rise attached houses, a stronger wind speed field was generated downstream of the street canyon. As shown in
Figure 8a,b, the mean wind speeds were significantly higher than those in
Figure 7a,b and the affecting ranges were greater. In
Figure 8b,c, the downwash flow effects generated by the podium obstruction were smaller because the podium heights were higher than or equal to the height of the adjacent attached houses, respectively.
Figure 8.
Dimensionless mean wind speed distributions when S = 1.75D and θ = 45°: (a) Ph = 2D; (b) Ph = 1.5D; (c) Ph = 1D; and (d) Ph = 0.5D.
Figure 8.
Dimensionless mean wind speed distributions when S = 1.75D and θ = 45°: (a) Ph = 2D; (b) Ph = 1.5D; (c) Ph = 1D; and (d) Ph = 0.5D.
Figure 9 shows the interaction of approaching wind on the upwind side of the building at −22.5°. The wind flow obstructed by the podium flowed into the street canyon along the podium, but the wind was guided toward the outside when the wind flow encountered the adjacent attached low-rise houses. The wind flow entering the street canyon is affected by the podium, but it is weaker than in the scenario of θ = 0°. Most of the wind flow in the street canyon upstream moved along the front end of the podium entering into the street canyon, and the corner vortexes were also affected by the podium height. As shown in
Figure 9, as the podium height decreased, the wind speeds of the street canyon upstream also gradually decreased. However, the wind flow in the street canyon downstream had the opposite trend. In terms of a wind direction of −22.5°, the podium formed a blockage on the wind flow, forcing the wind to channel through the passage following a long side of the attached houses toward the downstream, as shown in
Figure 9a,b. However, when the podium height was gradually decreased, the wind could flow across the podium at the street canyon exit and the flow collection inside the street canyon was as shown in
Figure 9c. When the podium height was less than the adjacent attached houses, the wind flow over the podium was blocked and deflected by the adjacent attached houses, creating high wind and turbulence, as shown in
Figure 9d.
Figure 9.
Dimensionless mean wind speed distributions when S = 1.75D and θ = −22.5°: (a) Ph = 2D; (b) Ph = 1.5D; (c) Ph = 1D; and (d) Ph = 0.5D.
Figure 9.
Dimensionless mean wind speed distributions when S = 1.75D and θ = −22.5°: (a) Ph = 2D; (b) Ph = 1.5D; (c) Ph = 1D; and (d) Ph = 0.5D.
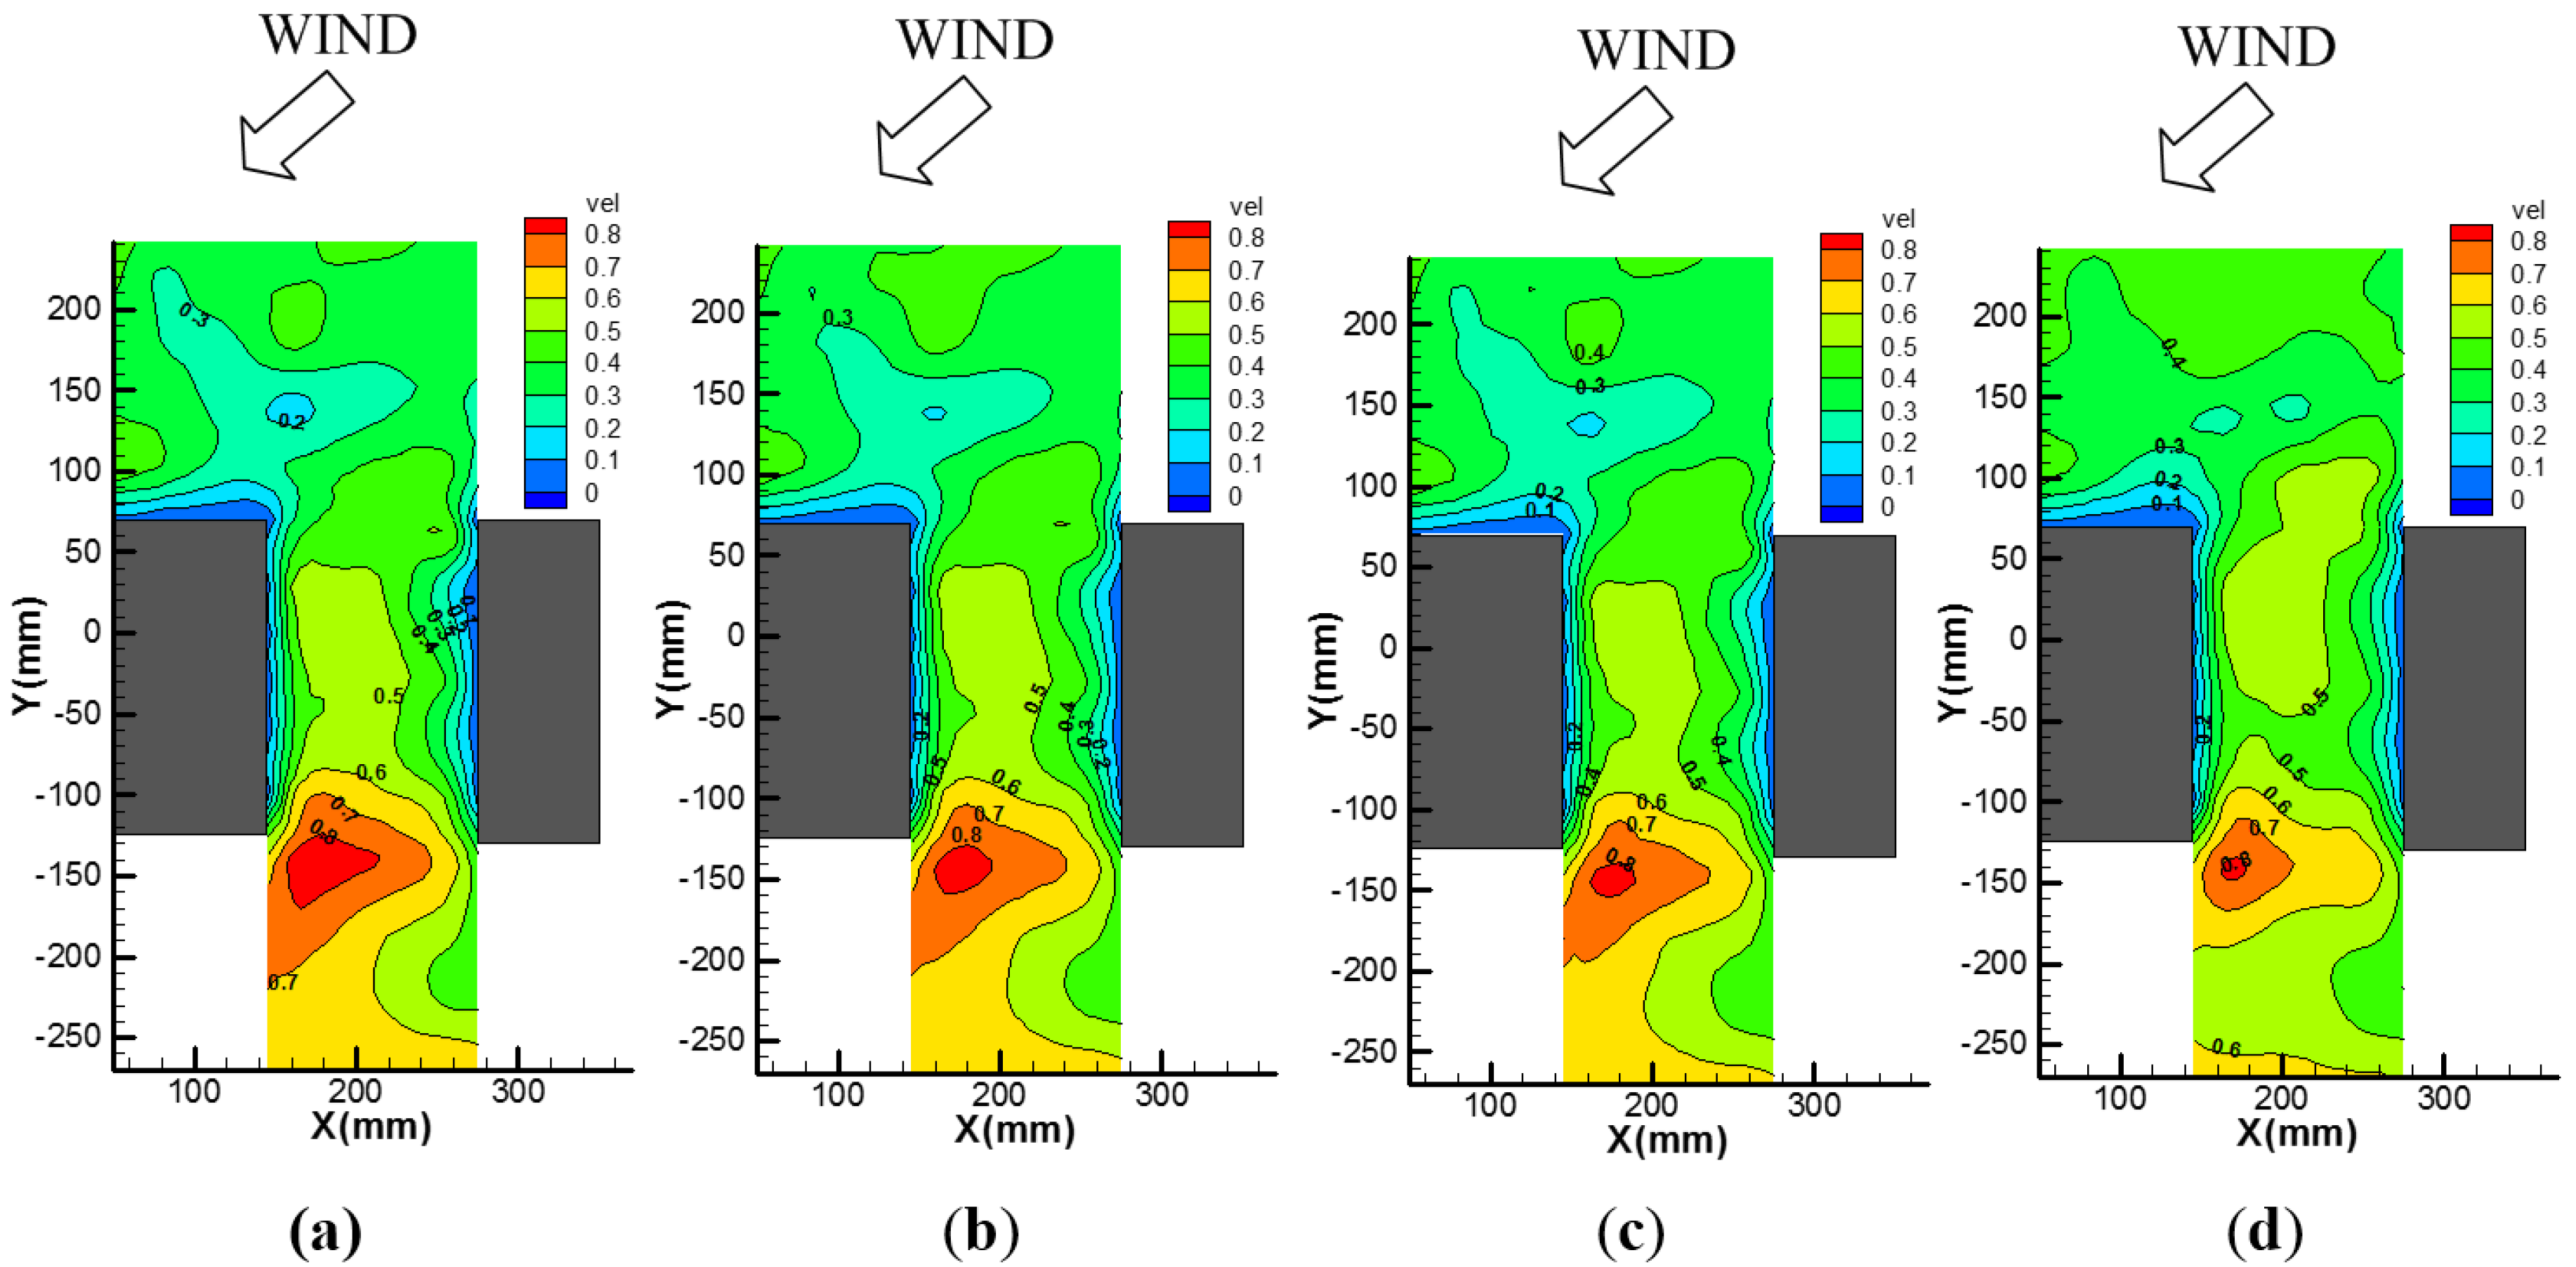
When the wind direction was changed to −45°, as shown as
Figure 10, the downwash flows of the upwind side were stronger than those with the wind direction of −22.5°. Therefore, a higher wind speed area appeared both upstream and downstream. Moreover, comparing
Figure 9 and
Figure 10, when the wind direction of −45° was larger, the high wind speed in the street canyon moved further toward the adjacent attached low-rise houses.
Figure 10.
(a) Ph = 2D; (b) Ph = 1.5D; (c) Ph = 1D; and (d) Ph = 0.5D. Dimensionless mean wind speed distributions when S = 1.75D and θ = −45°.
Figure 10.
(a) Ph = 2D; (b) Ph = 1.5D; (c) Ph = 1D; and (d) Ph = 0.5D. Dimensionless mean wind speed distributions when S = 1.75D and θ = −45°.


