1. Introduction
The environmental impact of fossil fuel exploitation is promoting the development of energetic conversion processes of renewable energy sources, such as biomass. The use of biomass helps to reduce the dependence on fossil fuels as well as the carbon dioxide emissions responsible for the greenhouse effect, due to its CO
2 neutrality [
1]. Microalgae have been identified as one of the most promising biomass sources of energy [
2]. In comparison with traditional terrestrial crops, microalgae do not require arable lands and can be produced all year round at high growth rate with a reduced use of fertilizers and pesticides [
3,
4]. In particular, microalgae have been appointed as ideal biodiesel feedstock in virtue of their high lipids content up to 80% of dry biomass mass [
5]. Microalgae biomass can be converted into energy by means of thermochemical processes, such as pyrolysis, gasification and combustion. However to be economically viable, microalgae cultures need very large areas (lakes, ponds or water surfaces).
On the other hand, economic motivations push to the exploitation of resources previously considered unprofitable both for low energy content and specific environmental concerns. In this case, it is mandatory the application of environmentally compatible technologies, generally accepted by local communities. The sub-bituminous coal of the Sulcis basin can be an example where gasification and pyrolysis could contribute to the exploitation of this energetic source.
Pyrolysis represents one of the most important steps in all the thermochemical processes, so understanding and modeling its mechanism are a fundamental prerequisite to predicting the behavior of the fuel during the whole process and thus to design a suitable reactor [
6]. During pyrolysis, fuel is decomposed into volatiles, which constitute the larger part of the pyrolysis products, and into a solid residue, the char. Volatiles consist of light gaseous (CH
4, CO
2, CO, C
2H
4 and others) and condensable species (tar, with no predictable composition). Moreover, pyrolysis is a complex process whose kinetic parameters are difficult to obtain through models due to the high number of products, not easily identifiable in experiments. Pyrolysis can be generally described as a two-step process [
7,
8]: a primary step occurring in a lower temperature range, where light gas and tar are released, and a secondary one, at higher temperatures, where the release of light gas continues and the aromatization of the biomass macromolecules leads to char production. A large number of kinetic models were proposed in the literature [
9,
10]. Pyrolysis can be modeled with a detailed kinetic model that takes into account the evolution of a selected number of species or, as in this work, with a global kinetic mechanism that considers the evolution of a unique species, defined as C
xH
yO
z, representing all the volatiles.
In this work, the distributed activation energy model (DAEM) is used to model the pyrolysis of two fuels with very different chemical structure:
Chlorella vulgaris microalgae and Sulcis sub-bituminous coal. The DAEM assumes that a series of first-order parallel reactions occurs, sharing the same pre-exponential factor and characterized by a continuous distribution of the activation energies, In the literature different forms of activation energy distribution can be found: Gaussian [
11], Weibull [
12] or Gamma [
13] distributions; in this study the Gaussian one was adopted.
The DAEM has been extensively applied in modeling algae and coal pyrolysis with good results, as reported in literature [
14,
15,
16]. However, one of the major problems arising in the DAEM application is the intrinsic interpretation of pyrolysis as a single step process, because its classical formulation is not able to distinguish between the different pyrolysis steps. To circumvent such a limitation, in a previous work focused on coal pyrolysis, the authors proposed an extended model able to catch the kinetic parameters of both the steps by including a second Gaussian distribution (2-DAEM) [
17]. This multi-Gaussian approach was also used by Zhang
et al. [
18] to model biomass pyrolysis and gasification considering different distribution of activation energy for each class of reactions that share the same pre-exponential factor. In this paper, the multi-Gaussian model is applied to predict the behavior of the selected fuels and the results are compared with those obtained with the single DAEM (1-DAEM). Both the models were used in interpreting the experimental data obtained by thermogravimetric analysis (TGA).
2. Mathematical Model
The equation that represents the total volatile yield as a function of time/temperature for the original distributed activation energy model is:
where
v and
v* are the volatile yield and the total amount of volatiles, respectively,
k0 is the pre-exponential factor, α the heating rate and
T the temperature.
f(
E) is the distribution curve of the activation energy
E which satisfies the condition:
In this work, as already said, the
f(
E) function is modeled as Gaussian distribution:
where
E0 is the mean activation energy and σ
E the corresponding standard deviation. The focus of the analysis is to estimate
E0, σ
E and
k0 from recorded experimental data. However, as already noticed in literature [
19], regression algorithms show a strong correlation between
k0 and
E0 leading to a non-uniqueness of kinetic parameters that is called compensation effect [
20]. So to overcome this drawback, one choice is to fix
k0 at a defined value that must be consistent with the transition-state theory, which indicates values in the range 10
11–10
16 s
−1 [
18]. However, to obtain kinetic parameters comparable with the ones reported in the literature, a value of 10
13 s
−1 was selected for the biomass [
15] and a value of 8 × 10
12 s
−1 for the Sulcis coal [
21].
In the double-Gaussian model, two distributions of activation energy, sharing the same pre-exponential factor are considered, so the classical DAEM equation becomes:
where
fi(
E) are Gaussian functions related to the two considered pyrolysis steps, defined in the form:
and
w is a parameter ranging between 0 and 1, which weights the occurrence of the two reaction classes. This parameter describes how many volatiles are released during the primary and the secondary pyrolysis step. The value of w would be 0 if all the volatiles were produced during the secondary phase of pyrolysis and 1 if they were totally released during the primary one. In this model, the parameters to be estimated are 5: two mean activation energies
E01 and
E02 coupled with two standard deviations σ
E1 and σ
E2, each couple of these parameters characterizing the single Gaussian distribution, and the weighting parameter w.
To fit the experimental data, a C++ program was written and run in the ROOT environment [
22], an object-oriented data analysis program, using the routine MINUIT for the minimization of the χ function selected for the fitting:
where
N is the number of data points, and
yis and
y(
Ti) are the experimental and the calculated data, respectively. In each step of the minimization process, the DAEM equation is integrated numerically with the method of Gaussian quadrature.
3. Experimental Section
Chlorella vulgaris cultures were grown in BG-11 medium (NaNO3: 1.50 g·L−1, K2HPO4: 0.04 g·L−1, MgSO4·7H2O: 75.0 mg·L−1, CaCl2·2H2O: 36.0 mg·L−1, citric acid (C6H8O7·1H2O): 6.0 mg·L−1, ferric ammonium citrate (C12H22FeN3O14): 6.0 mg·L−1, Na2CO3: 20.0 mg·L−1, Na-EDTA: 1.0 mg·L−1, H3BO3: 2.86 mg·L−1, MnCl2·4H2O: 1.81 mg·L−1, ZnSO4·7H2O: 0.22 mg·L−1, Na2MoO4·2H2O: 0.39 mg·L−1, CuSO4·5H2O: 79.0 μg·L−1, Co(NO3)2·6H2O: 49.4 μg·L−1). All the cultures were conducted in 5.0 L flat-plate photobioreactors maintained at 25 ± 1 °C and exposed to a light intensity of 150 mmol photons m−2·s−1 provided by phytostimulant fluorescent tubes, with a light/dark photoperiod of 12:12 h.
The coal selected is an Italian sub-bituminous coal (Sulcis), which, during pyrolysis, shows a loss of weight of about 45%.
In
Table 1 and
Table 2 the properties of the
Chlorella vulgaris biomass and of the Sulcis coal are reported. The proximate analysis was performed by TG analysis according to the ASTM D5142/02 method. The elemental composition was carried out using an EA3000 (Eurovector) elemental analyzer.
Table 1.
Chemical and physical properties of Chlorella vulgaris biomass and Sulcis coal.
Table 1.
Chemical and physical properties of Chlorella vulgaris biomass and Sulcis coal.
| Proximate analysis (wt%) | Biomass | Coal |
|---|
| Moisture | - | 5.1 |
| Volatiles (%dry) | 73.4 | 42.7 |
| Fixed carbon (%dry) | 21.9 | 41.9 |
| Ashes (%dry) | 4.7 | 15.4 |
| Ultimate analysis (wt% daf) | | |
| C | 41.1 | 74.7 |
| H | 6.4 | 5.5 |
| N | 7.3 | 1.3 |
| S | 0 | 8.3 |
| O (diff) | 40.5 | 10.2 |
To measure the biochemical composition of the biomass, the lipids were extracted according to the protocol described by Bligh and Dyer [
23] and the lipids content was determined gravimetrically by evaporating the solvents under vacuum and drying the extract for 4 h at 80 °C. Protein content was approximated by multiplying elemental nitrogen concentrations by a factor of 6.25 [
24].
Table 2.
Biochemical composition of Chlorella vulgaris biomass.
Table 2.
Biochemical composition of Chlorella vulgaris biomass.
| Proximate analysis (dry basis) | (wt%) |
|---|
| Lipids | 16.2 |
| Proteins | 45.6 |
| Carbohydrates (by difference) | 38.2 |
The pyrolysis experimental tests were performed with a thermogravimetric analyzer TA Instruments SDT Q600 (New Castle, DE, USA). Before the TG analysis, the biomass and the coal were dried, ground and sieved to select the particles with diameter ranging from 50–100 μm for biomass and 50–80 µm for coal, in order to avoid diffusional intraparticle effects. Small samples, approximately 7 mg, were used to ensure uniform heating and to minimize the transport phenomena resistance through the sample bed in the crucible. For each experimental test, the samples were heated in a N2 inert atmosphere, with a N2 flux of 100 mL/min, at 10, 20 and 40 K·min−1 (from 5 up to 100 K·min−1 for coal) up to a temperature of 1223 K and then maintained at this temperature for 10 min.
4. Results and Discussion
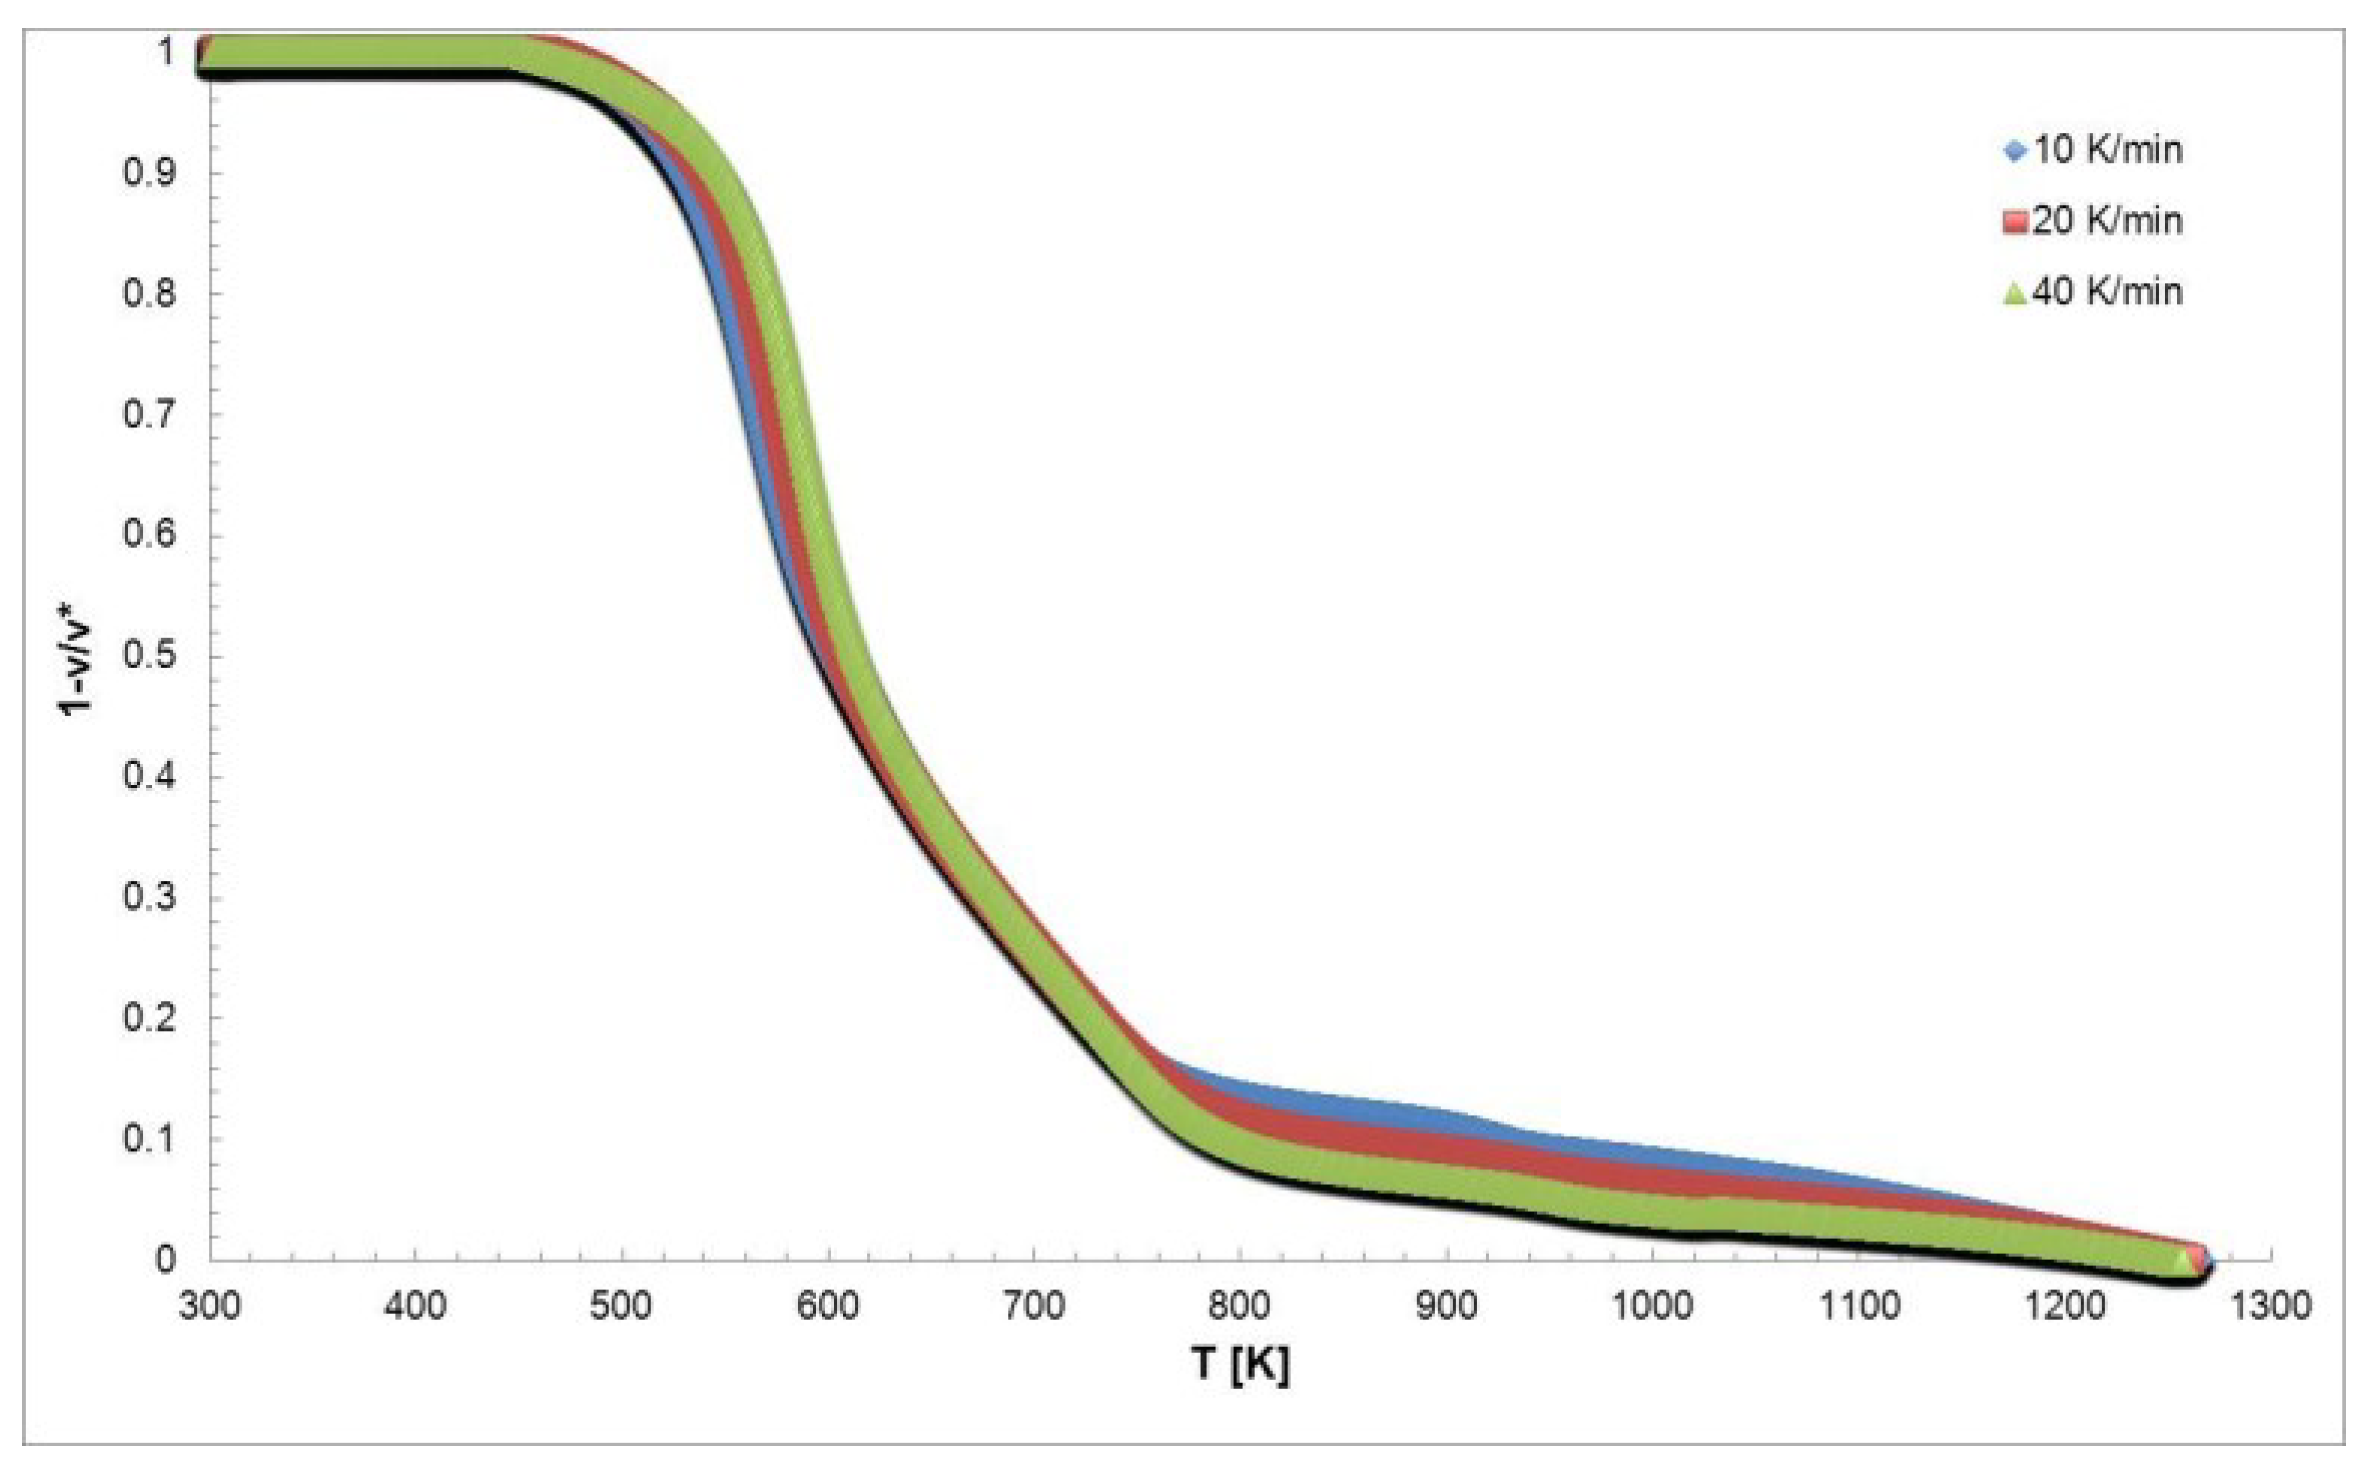
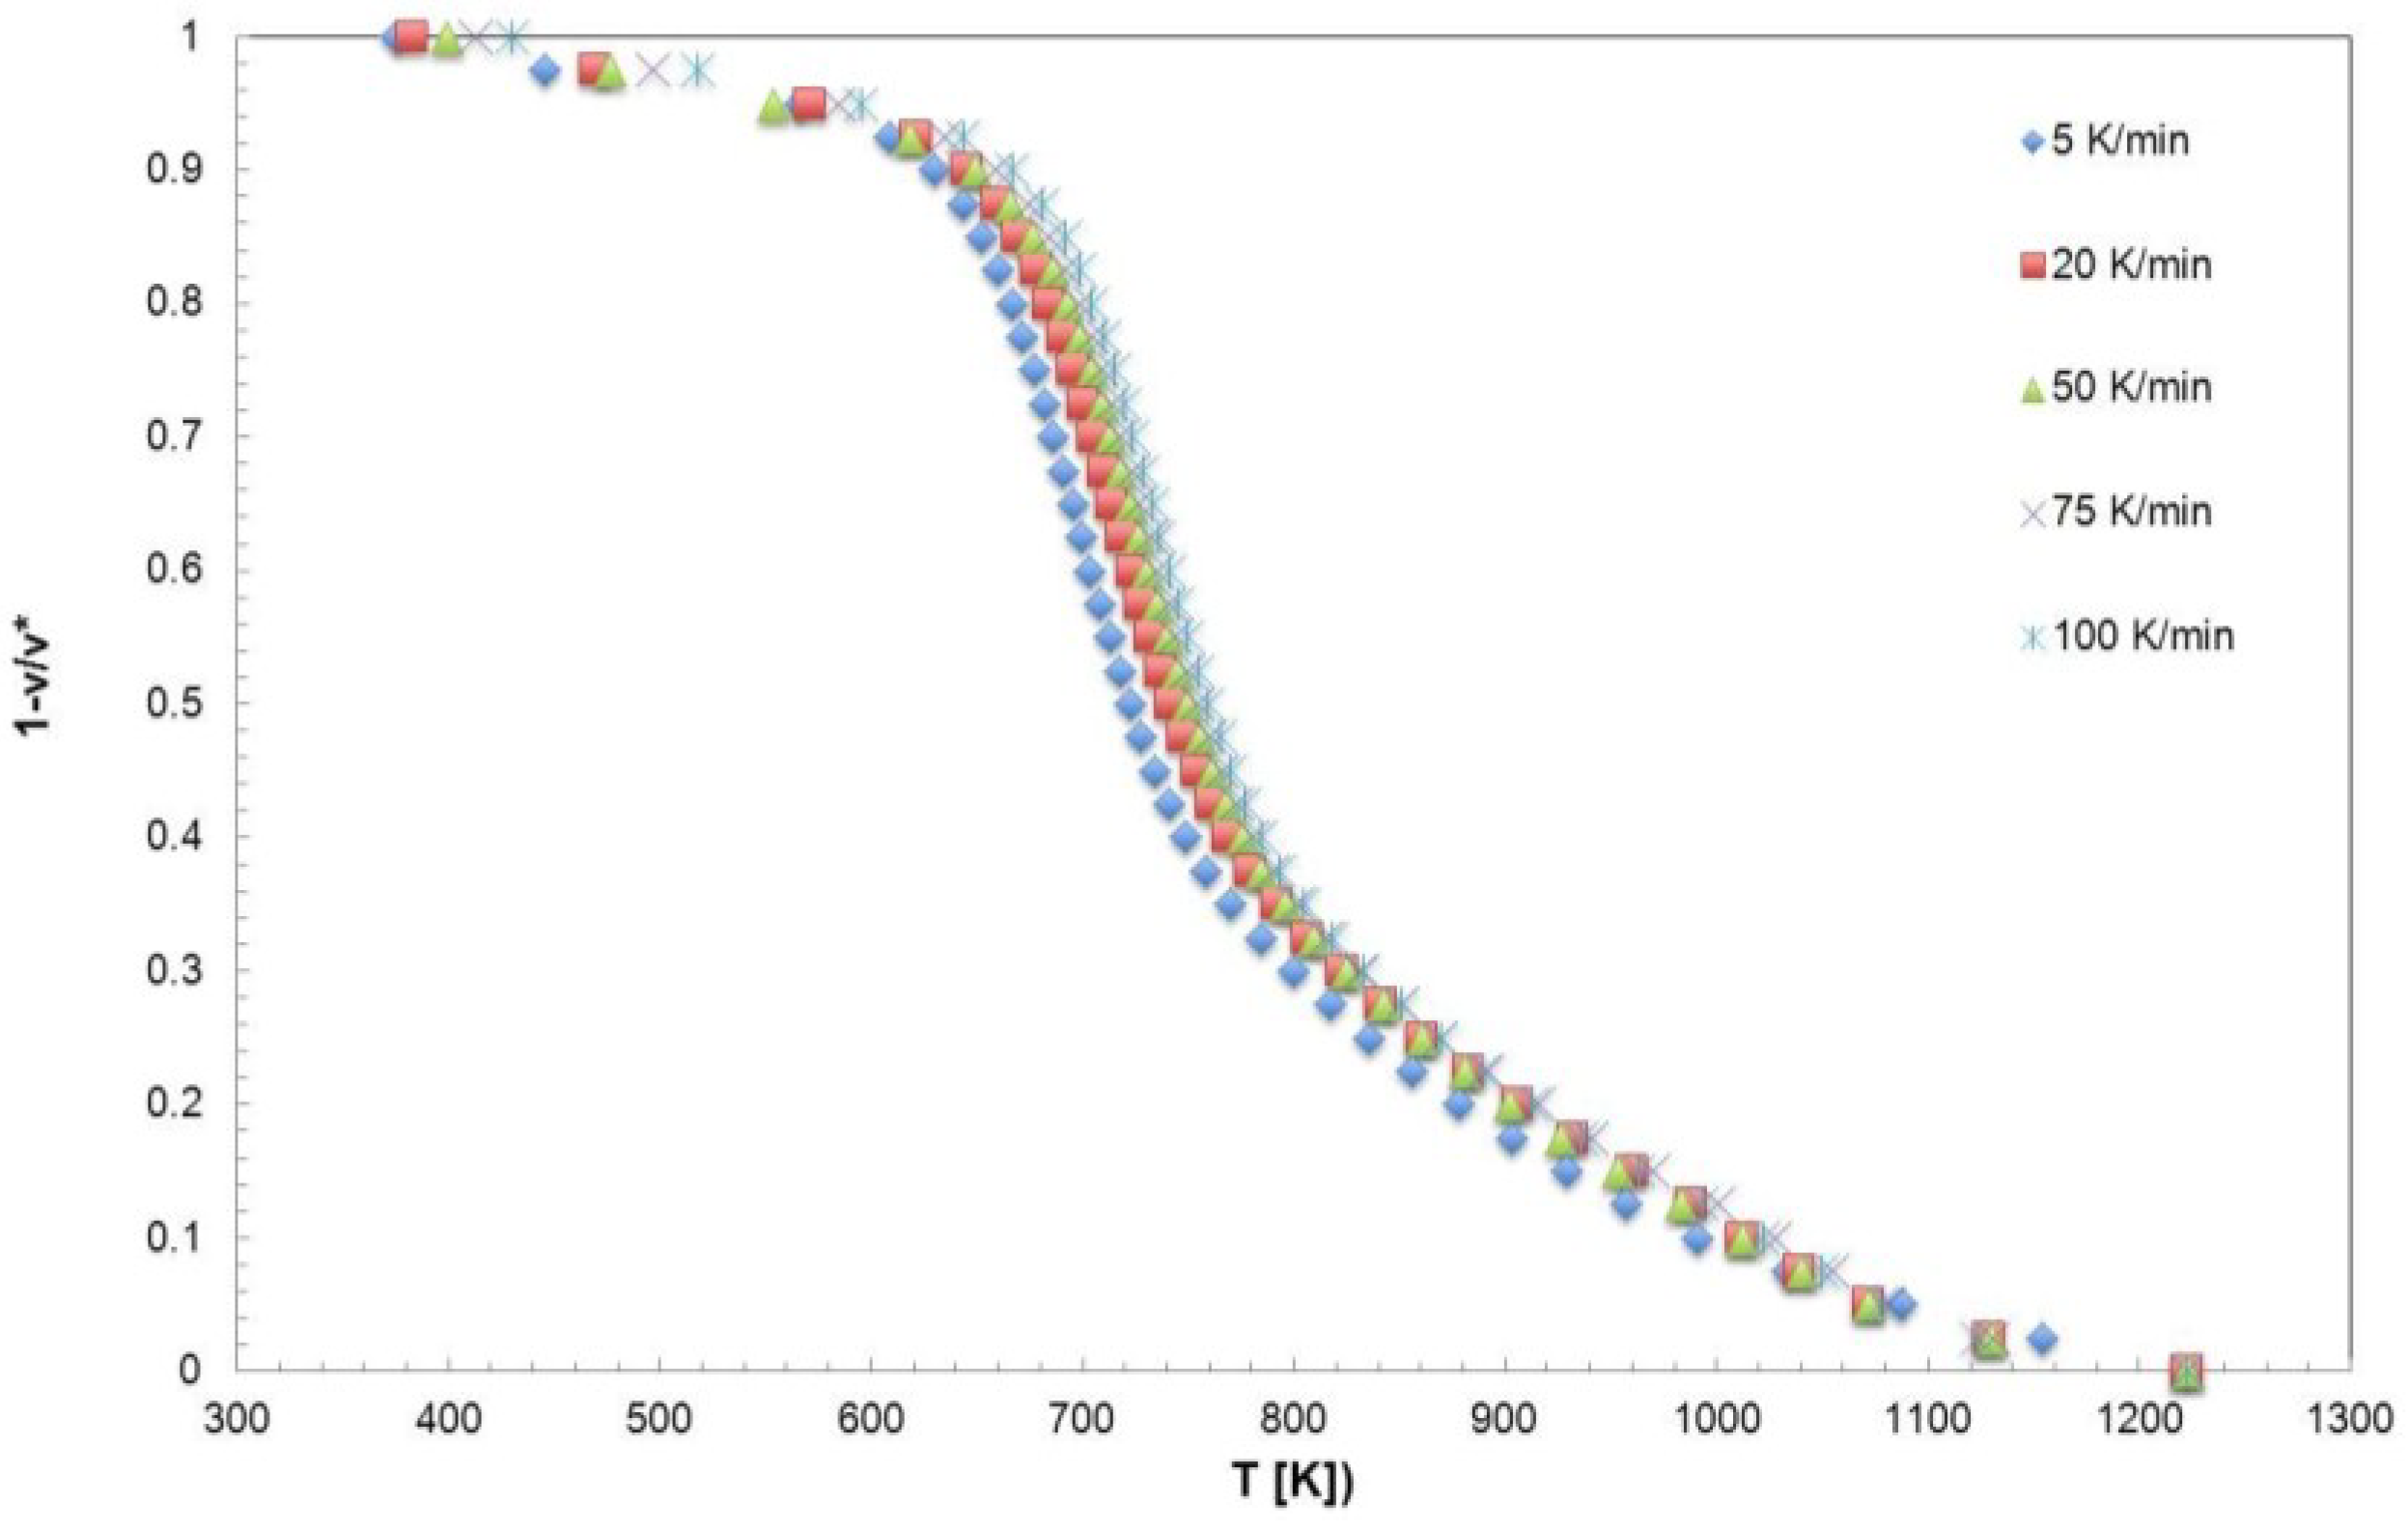
In
Figure 1 and
Figure 2 the TG curves of the
Chlorella vulgaris microalgae and Sulcis coal pyrolysis are reported for the three and the five selected heating rates, respectively.
From the TG curves of both materials, the two steps of the pyrolysis are clearly visible, the first referring to the primary pyrolysis and occurring at lower temperatures (450–700 K) and the second at higher ones (500–1200 K) and corresponding to the secondary pyrolysis. In the latter case, the repolymerization of the residue solid macromolecule, to form char, occurs with a further release of volatiles.
Figure 1.
TG curves of the Chlorella vulgaris microalgae at different heating rates.
Figure 1.
TG curves of the Chlorella vulgaris microalgae at different heating rates.
The two considered materials show different behaviors. When biomass is considered, the primary pyrolysis is the predominant step where almost 80% of the volatiles are released. In the Sulcis coal case, the primary and secondary pyrolysis seems to have the same weight in the overall process. To better investigate these differences the two models were applied.
To show the improvement achievable using the 2-DAEM, the results obtained with this model are compared with those of the original DAEM. First the results obtained with the improved model for
Chlorella vulgaris biomass are reported and then a comparison is made with those achieved for the Sulcis coal [
17].
Figure 2.
TG curves of the Sulcis coal pyrolysis at different heating rates.
Figure 2.
TG curves of the Sulcis coal pyrolysis at different heating rates.
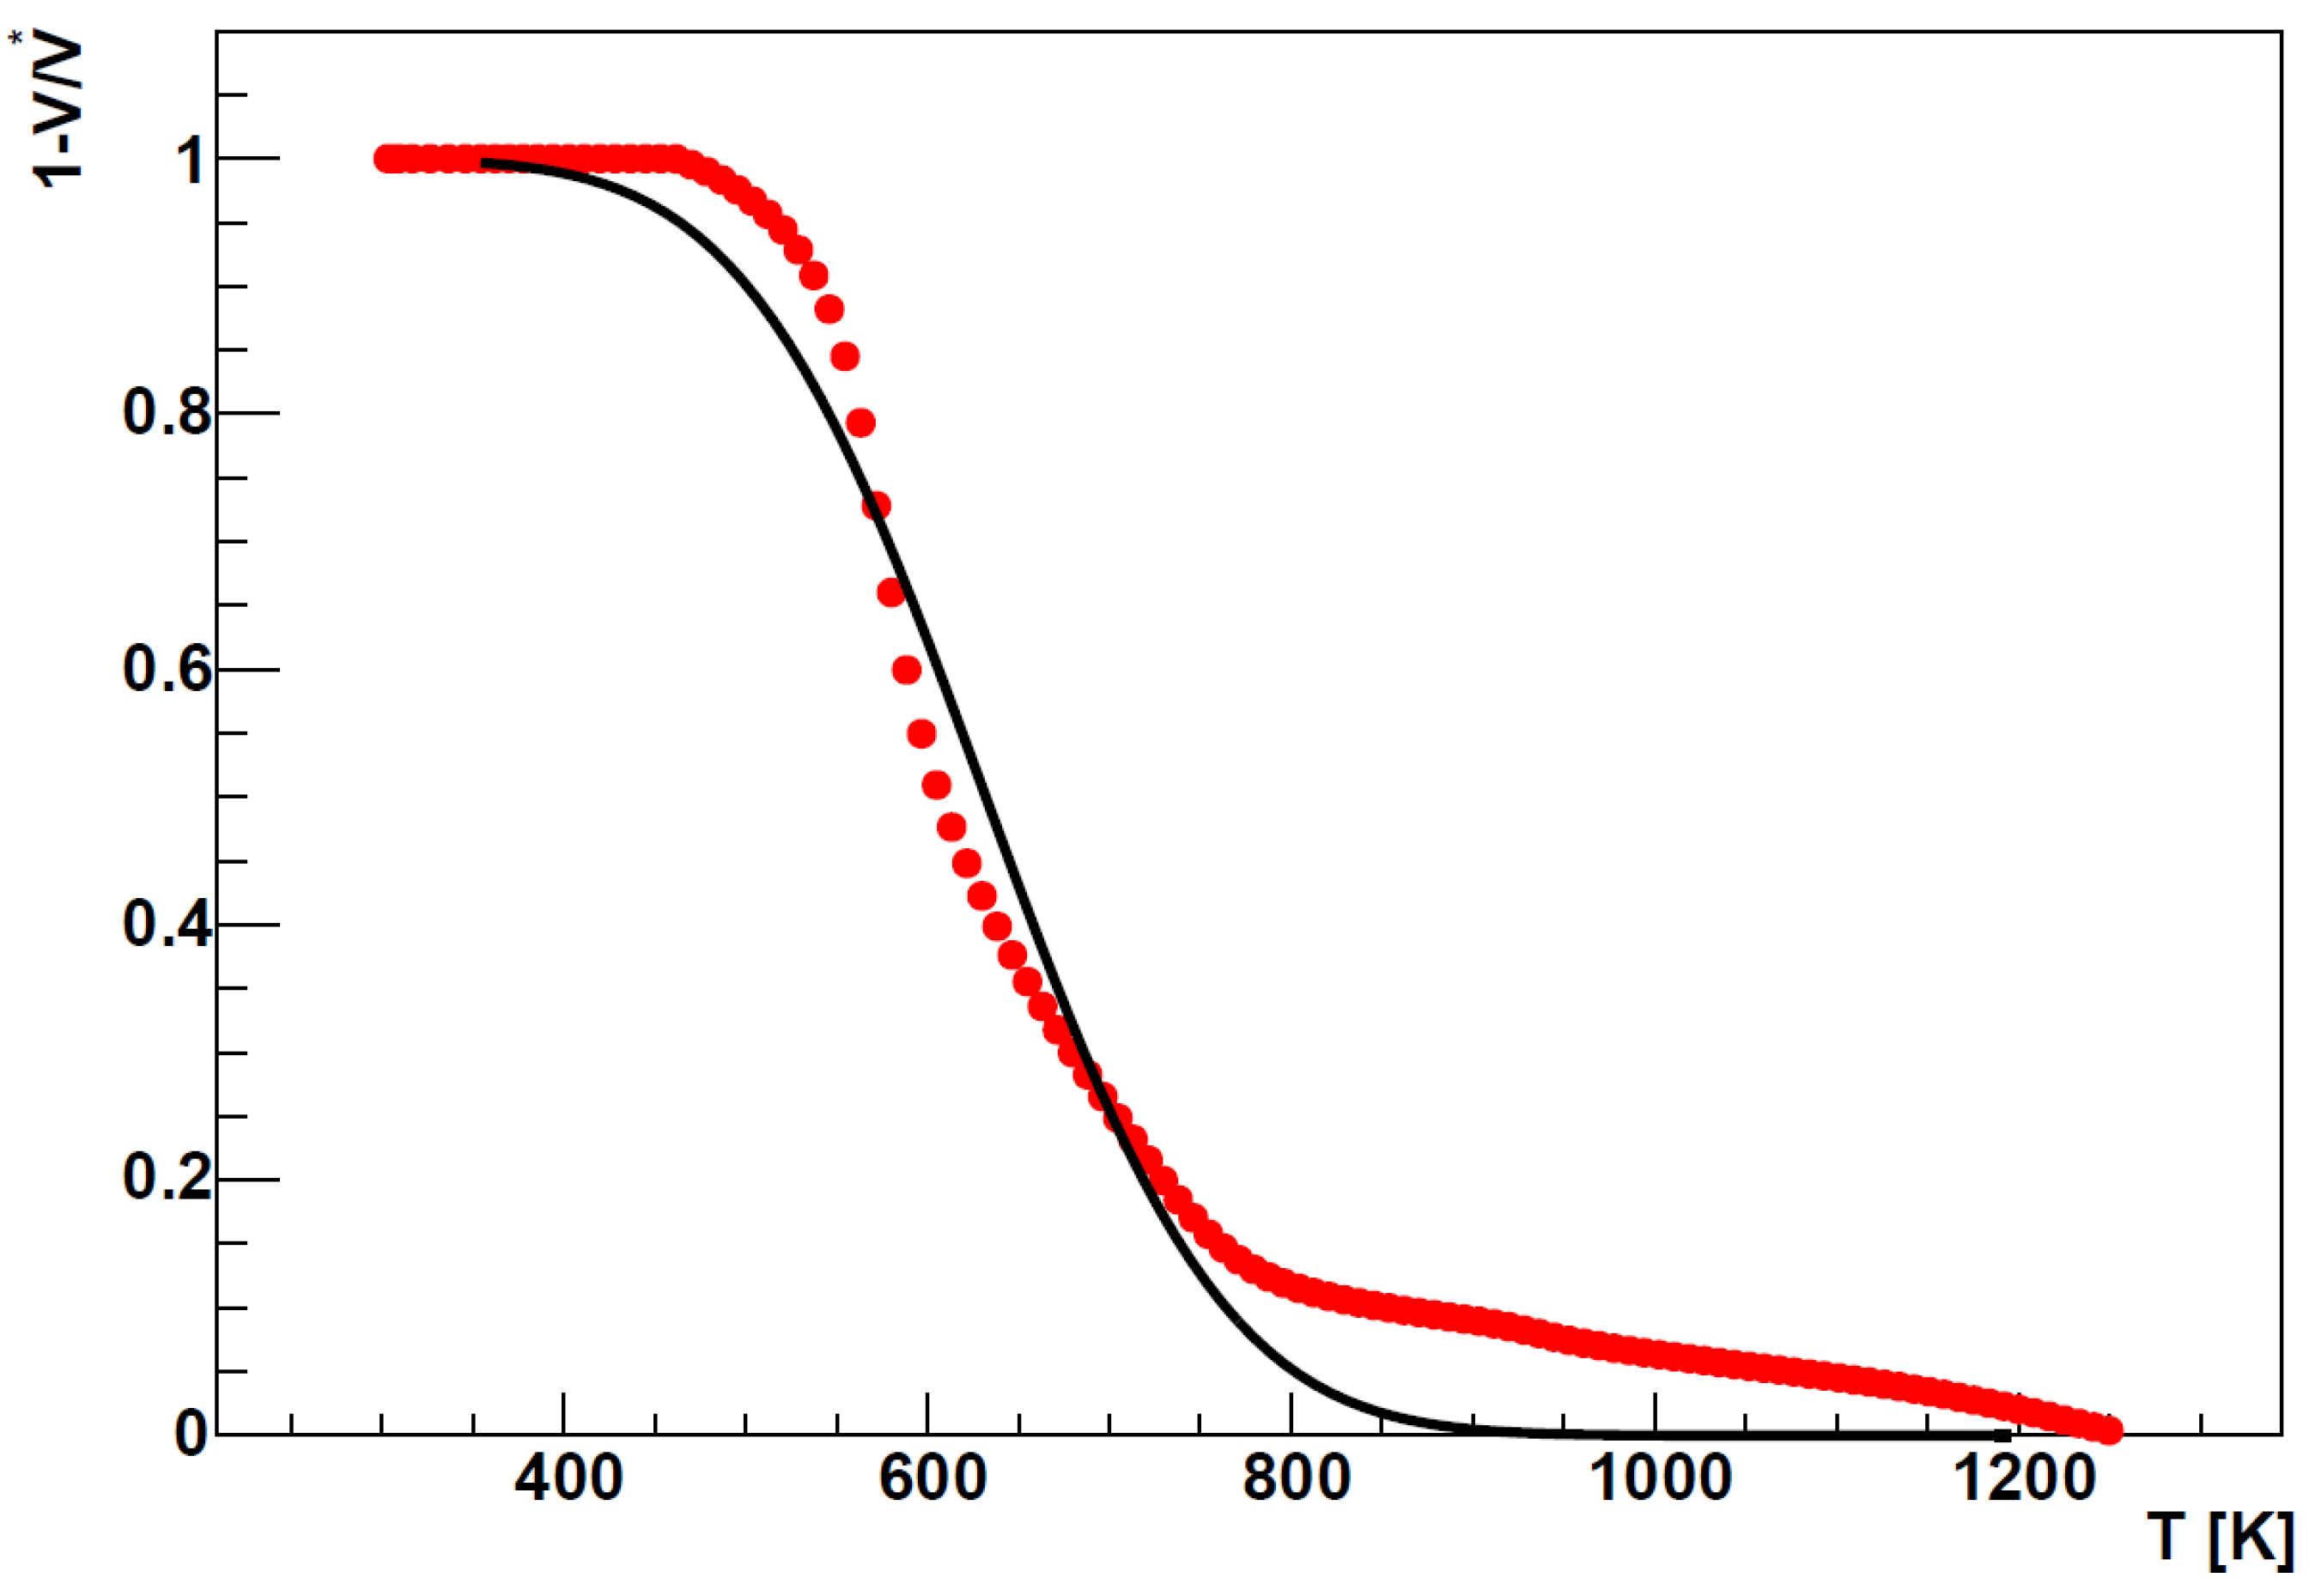
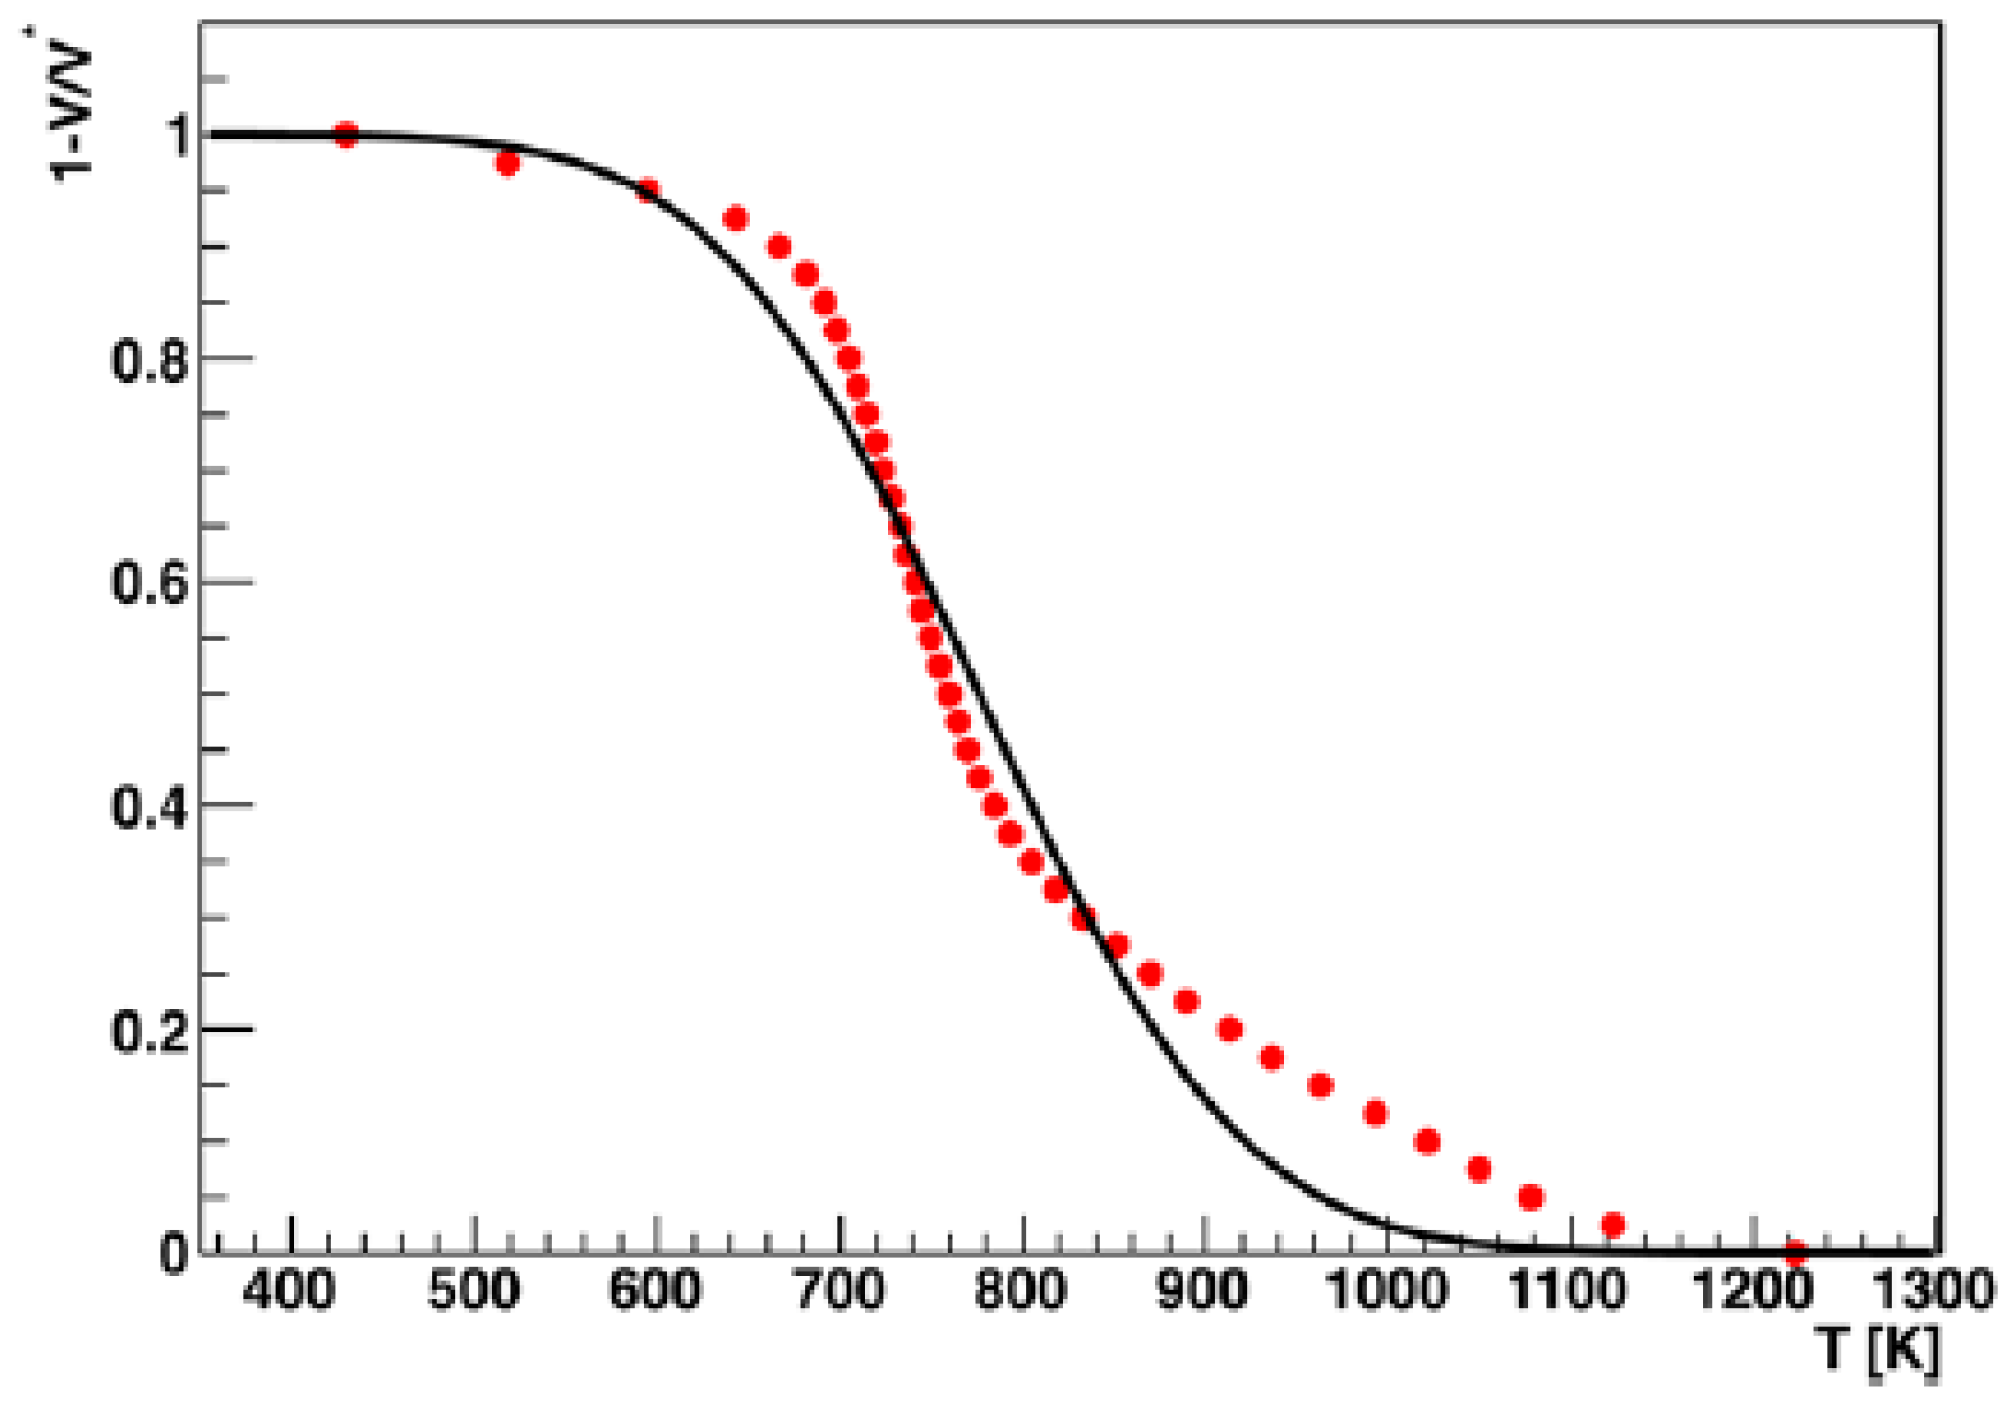
As shown in
Figure 3, the 1-DAEM represents well the main step of the
Chlorella vulgaris pyrolysis process, that in the present case is the predominant part coinciding with the primary step, as evidenced in the DTG curves. However, the 1-DAEM is not able to properly catch the second step. The reported fitting curve, indeed, shows a poor representation of the experimental data along the whole temperature range.
Figure 3.
Comparison between the biomass experimental data (red points) and the 1-DAEM fitting (black line) at 20 K·min−1.
Figure 3.
Comparison between the biomass experimental data (red points) and the 1-DAEM fitting (black line) at 20 K·min−1.
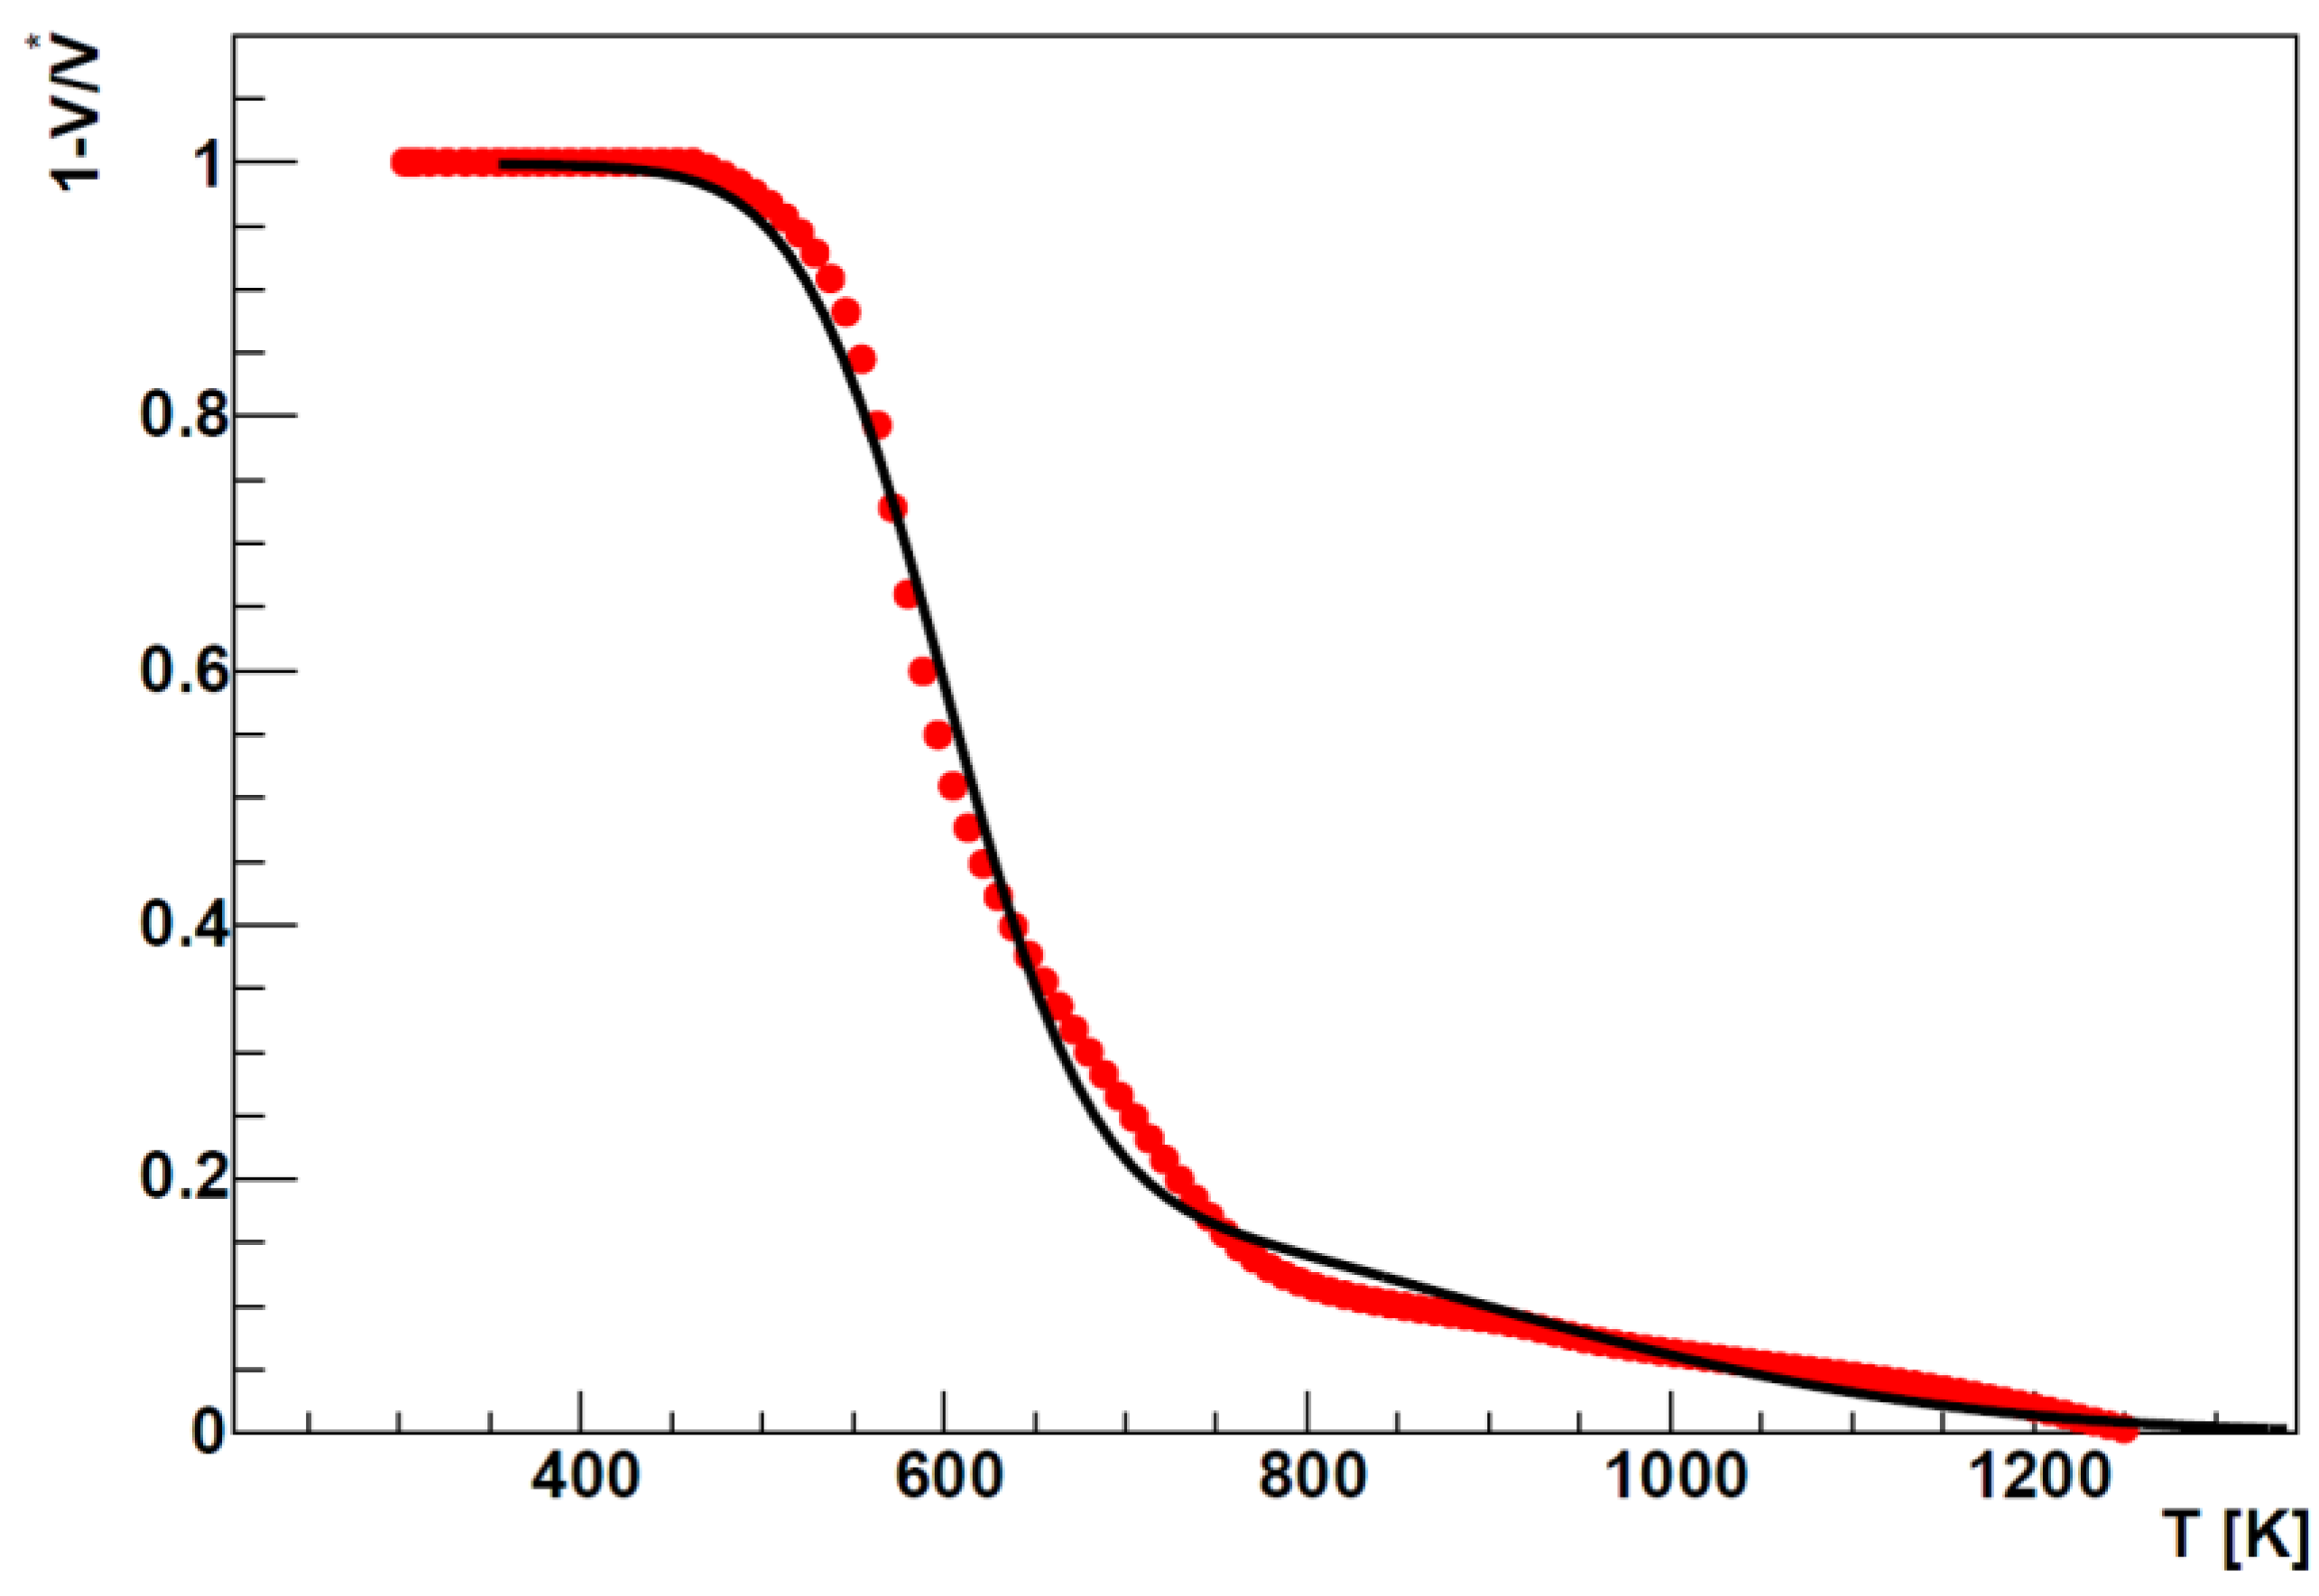
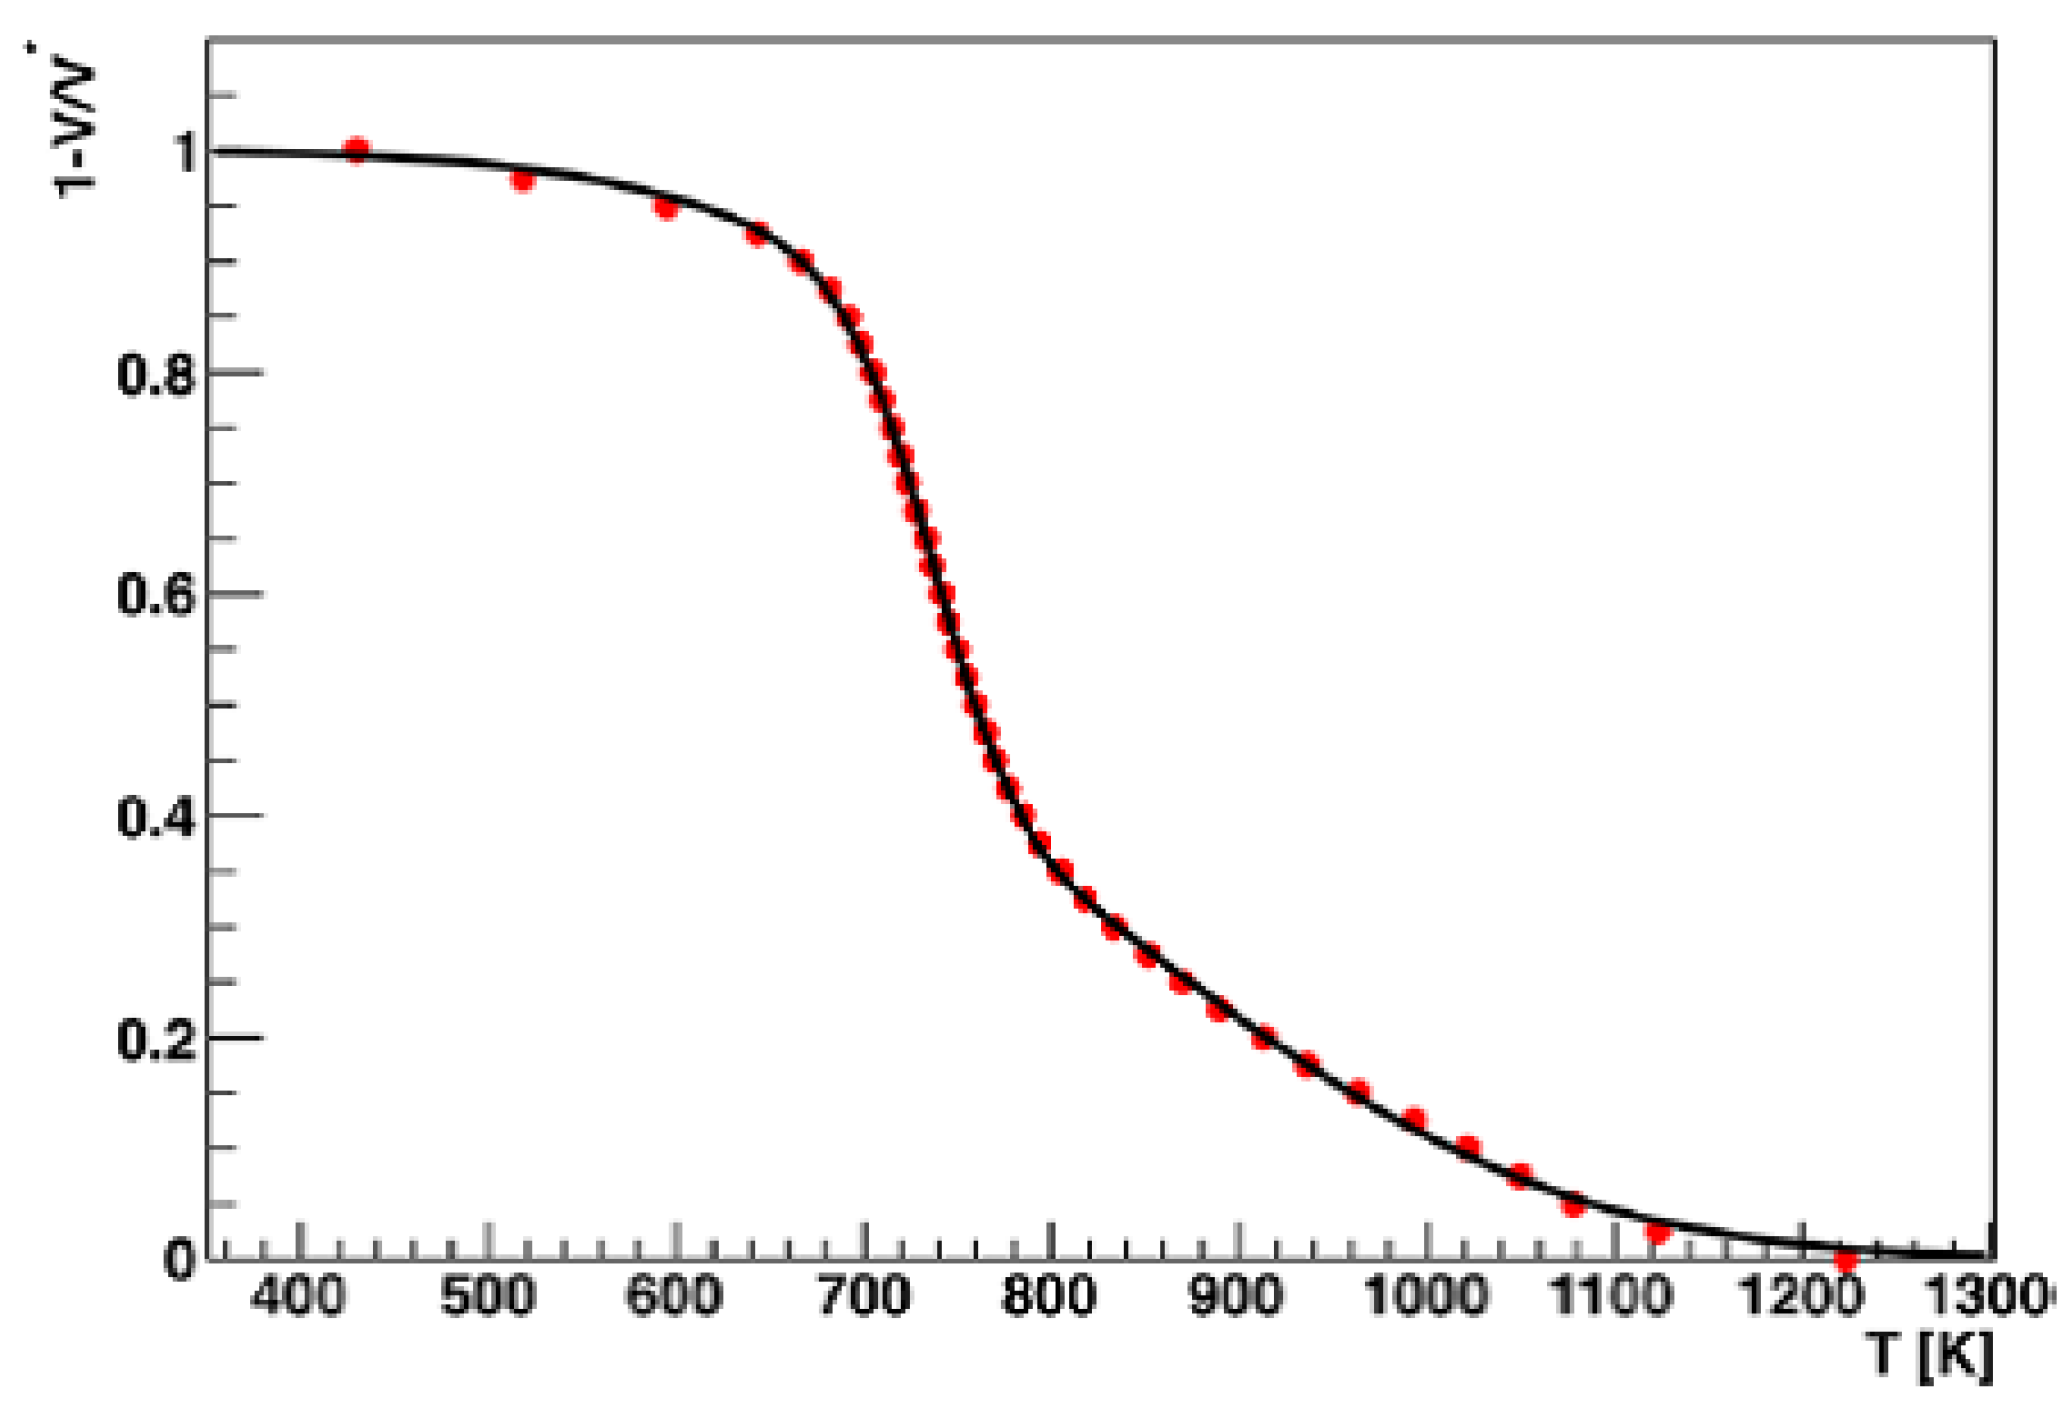
Looking at
Figure 4, where the result of the fitting performed with the 2-DAEM is reported, a great improvement on the agreement with experimental data is obtained. In this case, the model is able to grasp the two steps of the biomass pyrolysis.
Figure 4.
Comparison between the biomass experimental data (red points) and the 2-DAEM fitting (black line) data at 20 K·min−1 for the biomass.
Figure 4.
Comparison between the biomass experimental data (red points) and the 2-DAEM fitting (black line) data at 20 K·min−1 for the biomass.
From the comparison of the numerical value of the kinetic parameters (
Table 3), it is clear that the 1-DAEM returns approximately an average value of the activation energy and of the standard deviation of the process.
Table 3.
Kinetic parameters obtained with the 1-DAEM and 2-DAEM at 20 K·min−1 for the biomass.
Table 3.
Kinetic parameters obtained with the 1-DAEM and 2-DAEM at 20 K·min−1 for the biomass.
| Parameter | 1-DAEM | 2-DAEM |
|---|
| k0 [s−1] fixed | 1013 | 1013 |
| E01 [kJ·mol−1] | 184.0 | 174.5 |
| σE1[kJ·mol−1] | 30.0 | 17.3 |
| E02 [kJ·mol−1] | - | 220 |
| σE2 [kJ·mol−1] | - | 55.3 |
| w | - | 0.78 |
For what concerns the 1-DAEM, the numerical results confirm the hypothesis made looking only at the plot of
Figure 3. The value of the activation energy is included in the interval of the
E01 and
E02 given by the 2-DAEM, even if it is very similar to the
E01, confirming that the 1-DAEM grasps only the predominant step.
In the 2-DAEM, the w parameter assumes particular importance explaining how many volatiles are released during the primary and the secondary pyrolysis step. In the present case, the value is quite high (w = 0.78) indicating that, as expected, the primary step is the predominant mechanism. Furthermore, the 2-DAEM limits the first step of pyrolysis in a narrow interval of activation energy (σE1 = 17.3 kJ·mol−1), meaning that the process is faster and confined in a narrower temperature interval.
The value of
E02 is considerably higher than that of
E01. This behavior can be explained considering that
Chlorella vulgaris is constituted mainly by carbohydrates and proteins, which start undergoing thermal cracking at temperature about 250 °C [
25] with the breakage of the weakest chemical bonds. The thermal degradation of the residual molecules continues at higher temperatures in the second pyrolysis step, when the repolymerization of carbonaceous substrates forms char with further volatiles production (secondary pyrolysis) [
26]. This step requires the rupture of stronger bonds to extract the hydrogen from the hydroaromatic and aliphatic groups increasing the aromatic carbon content of the solid residue.
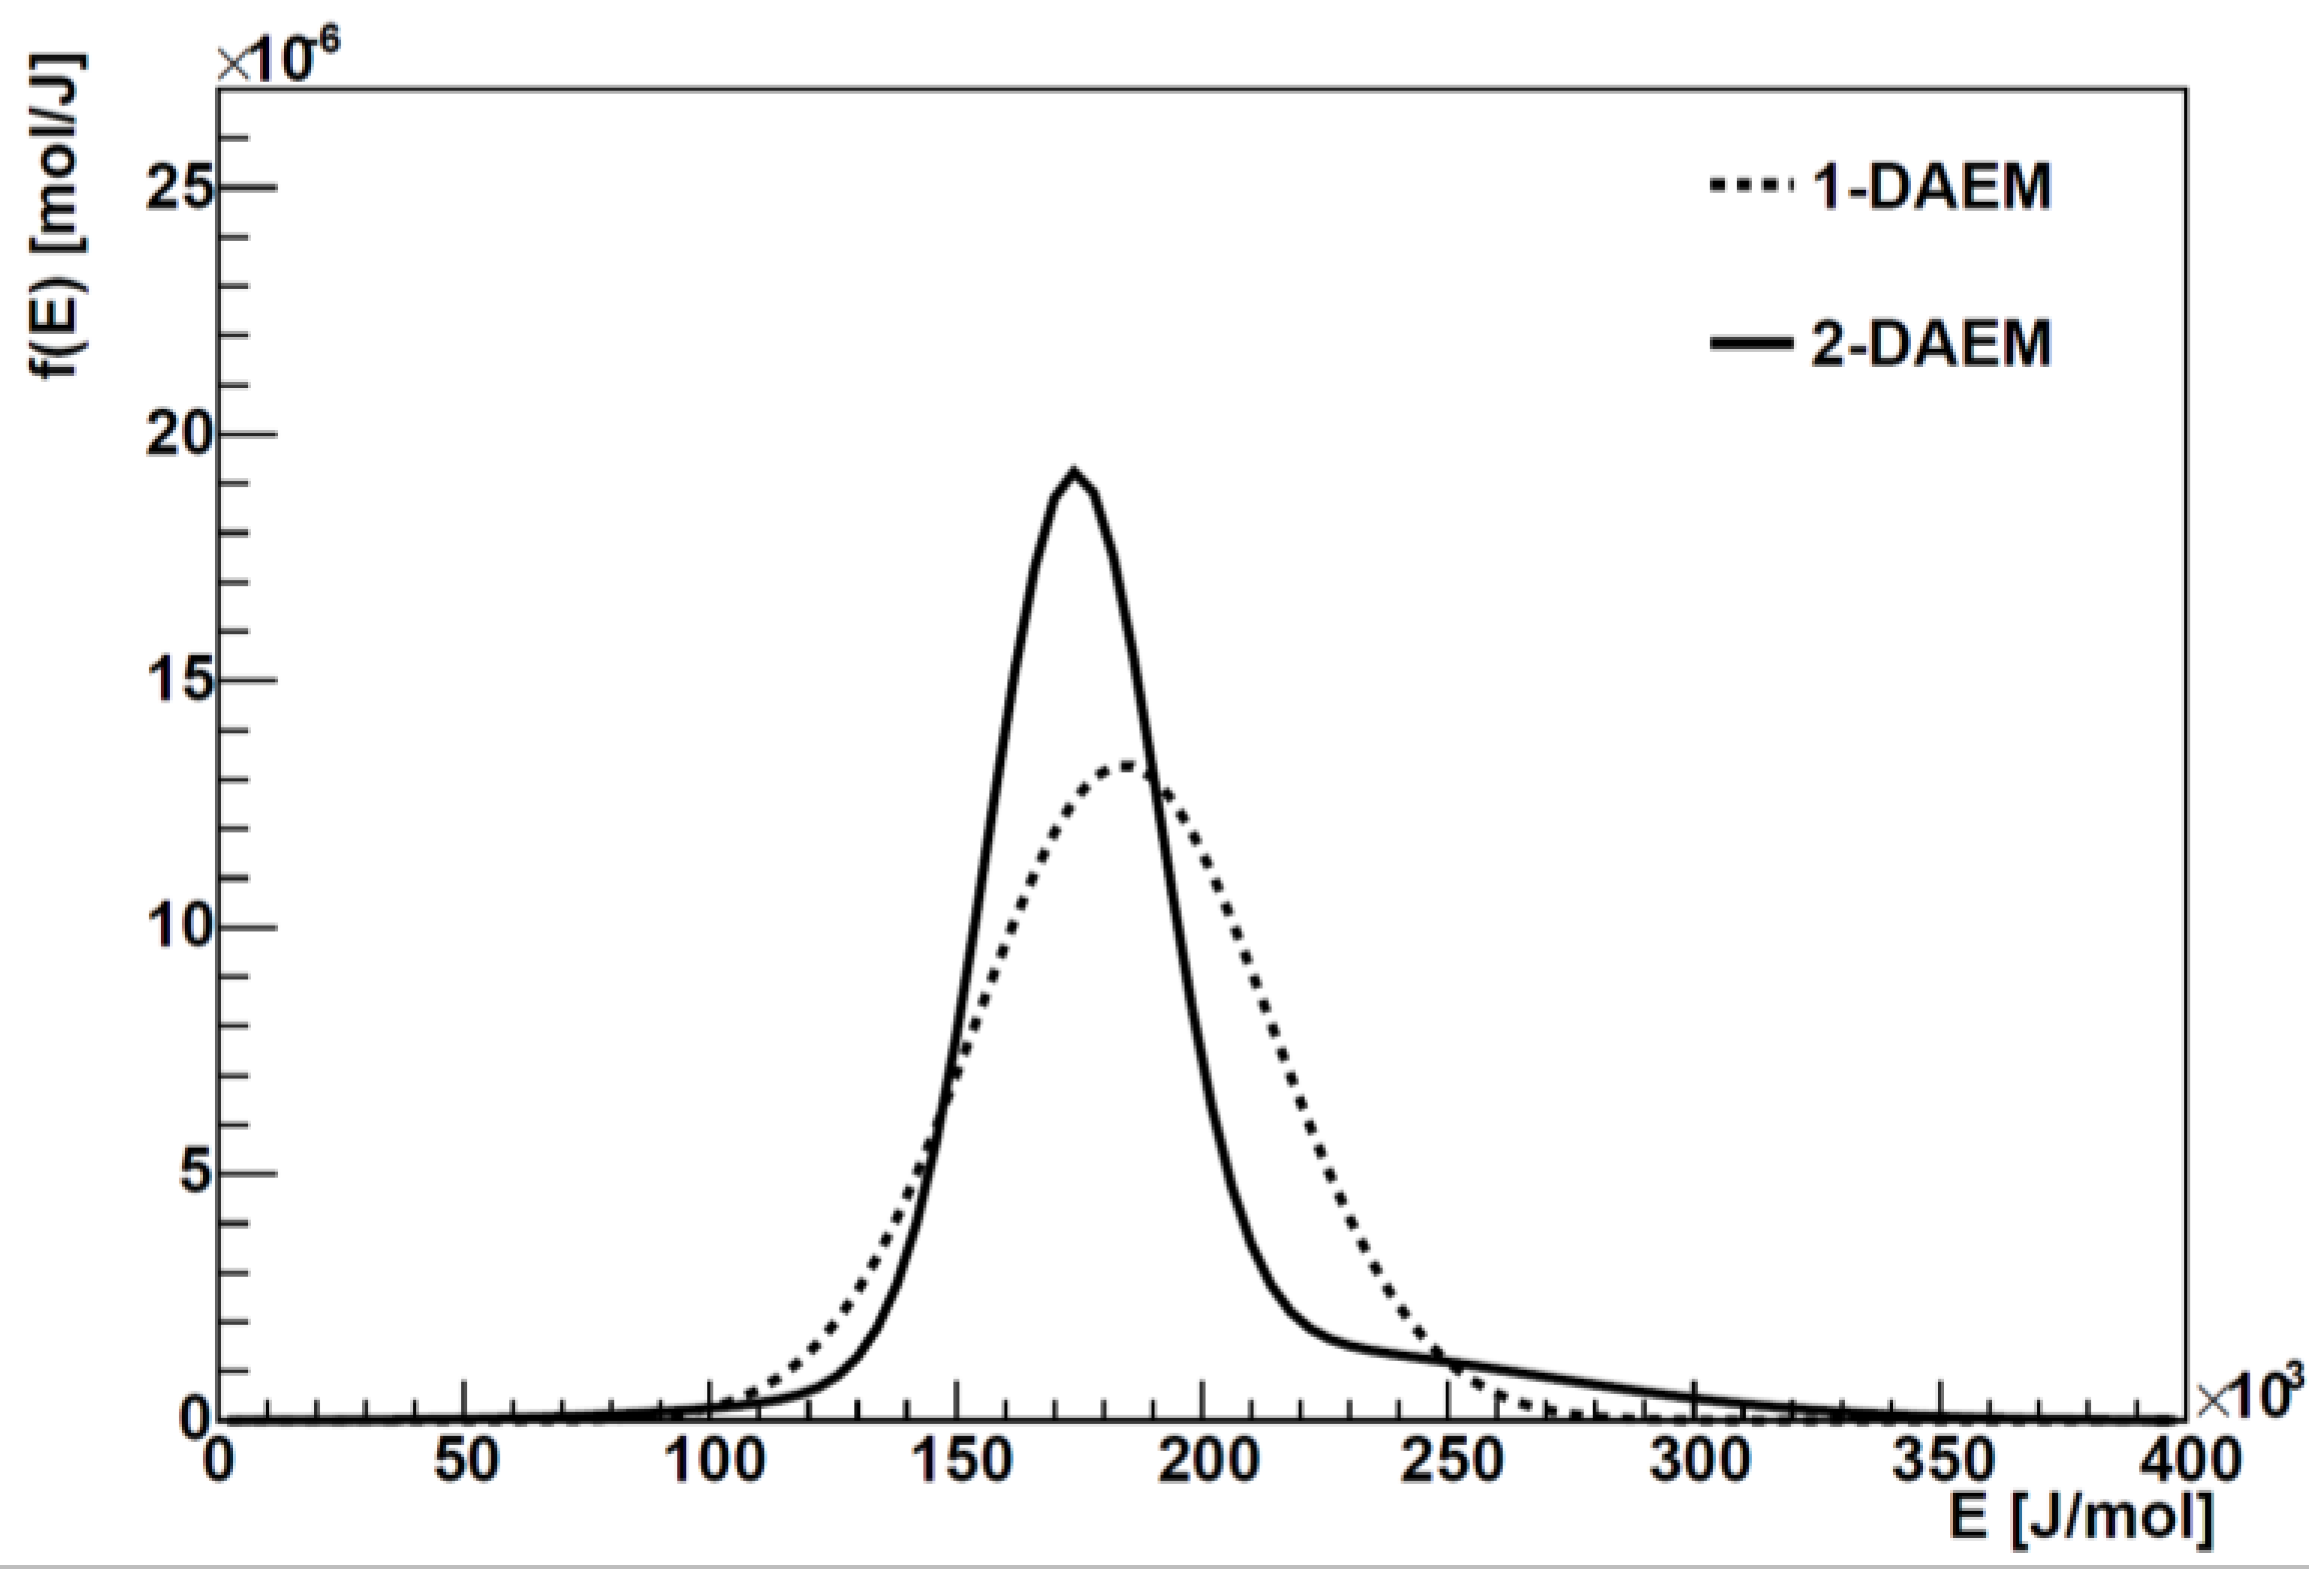
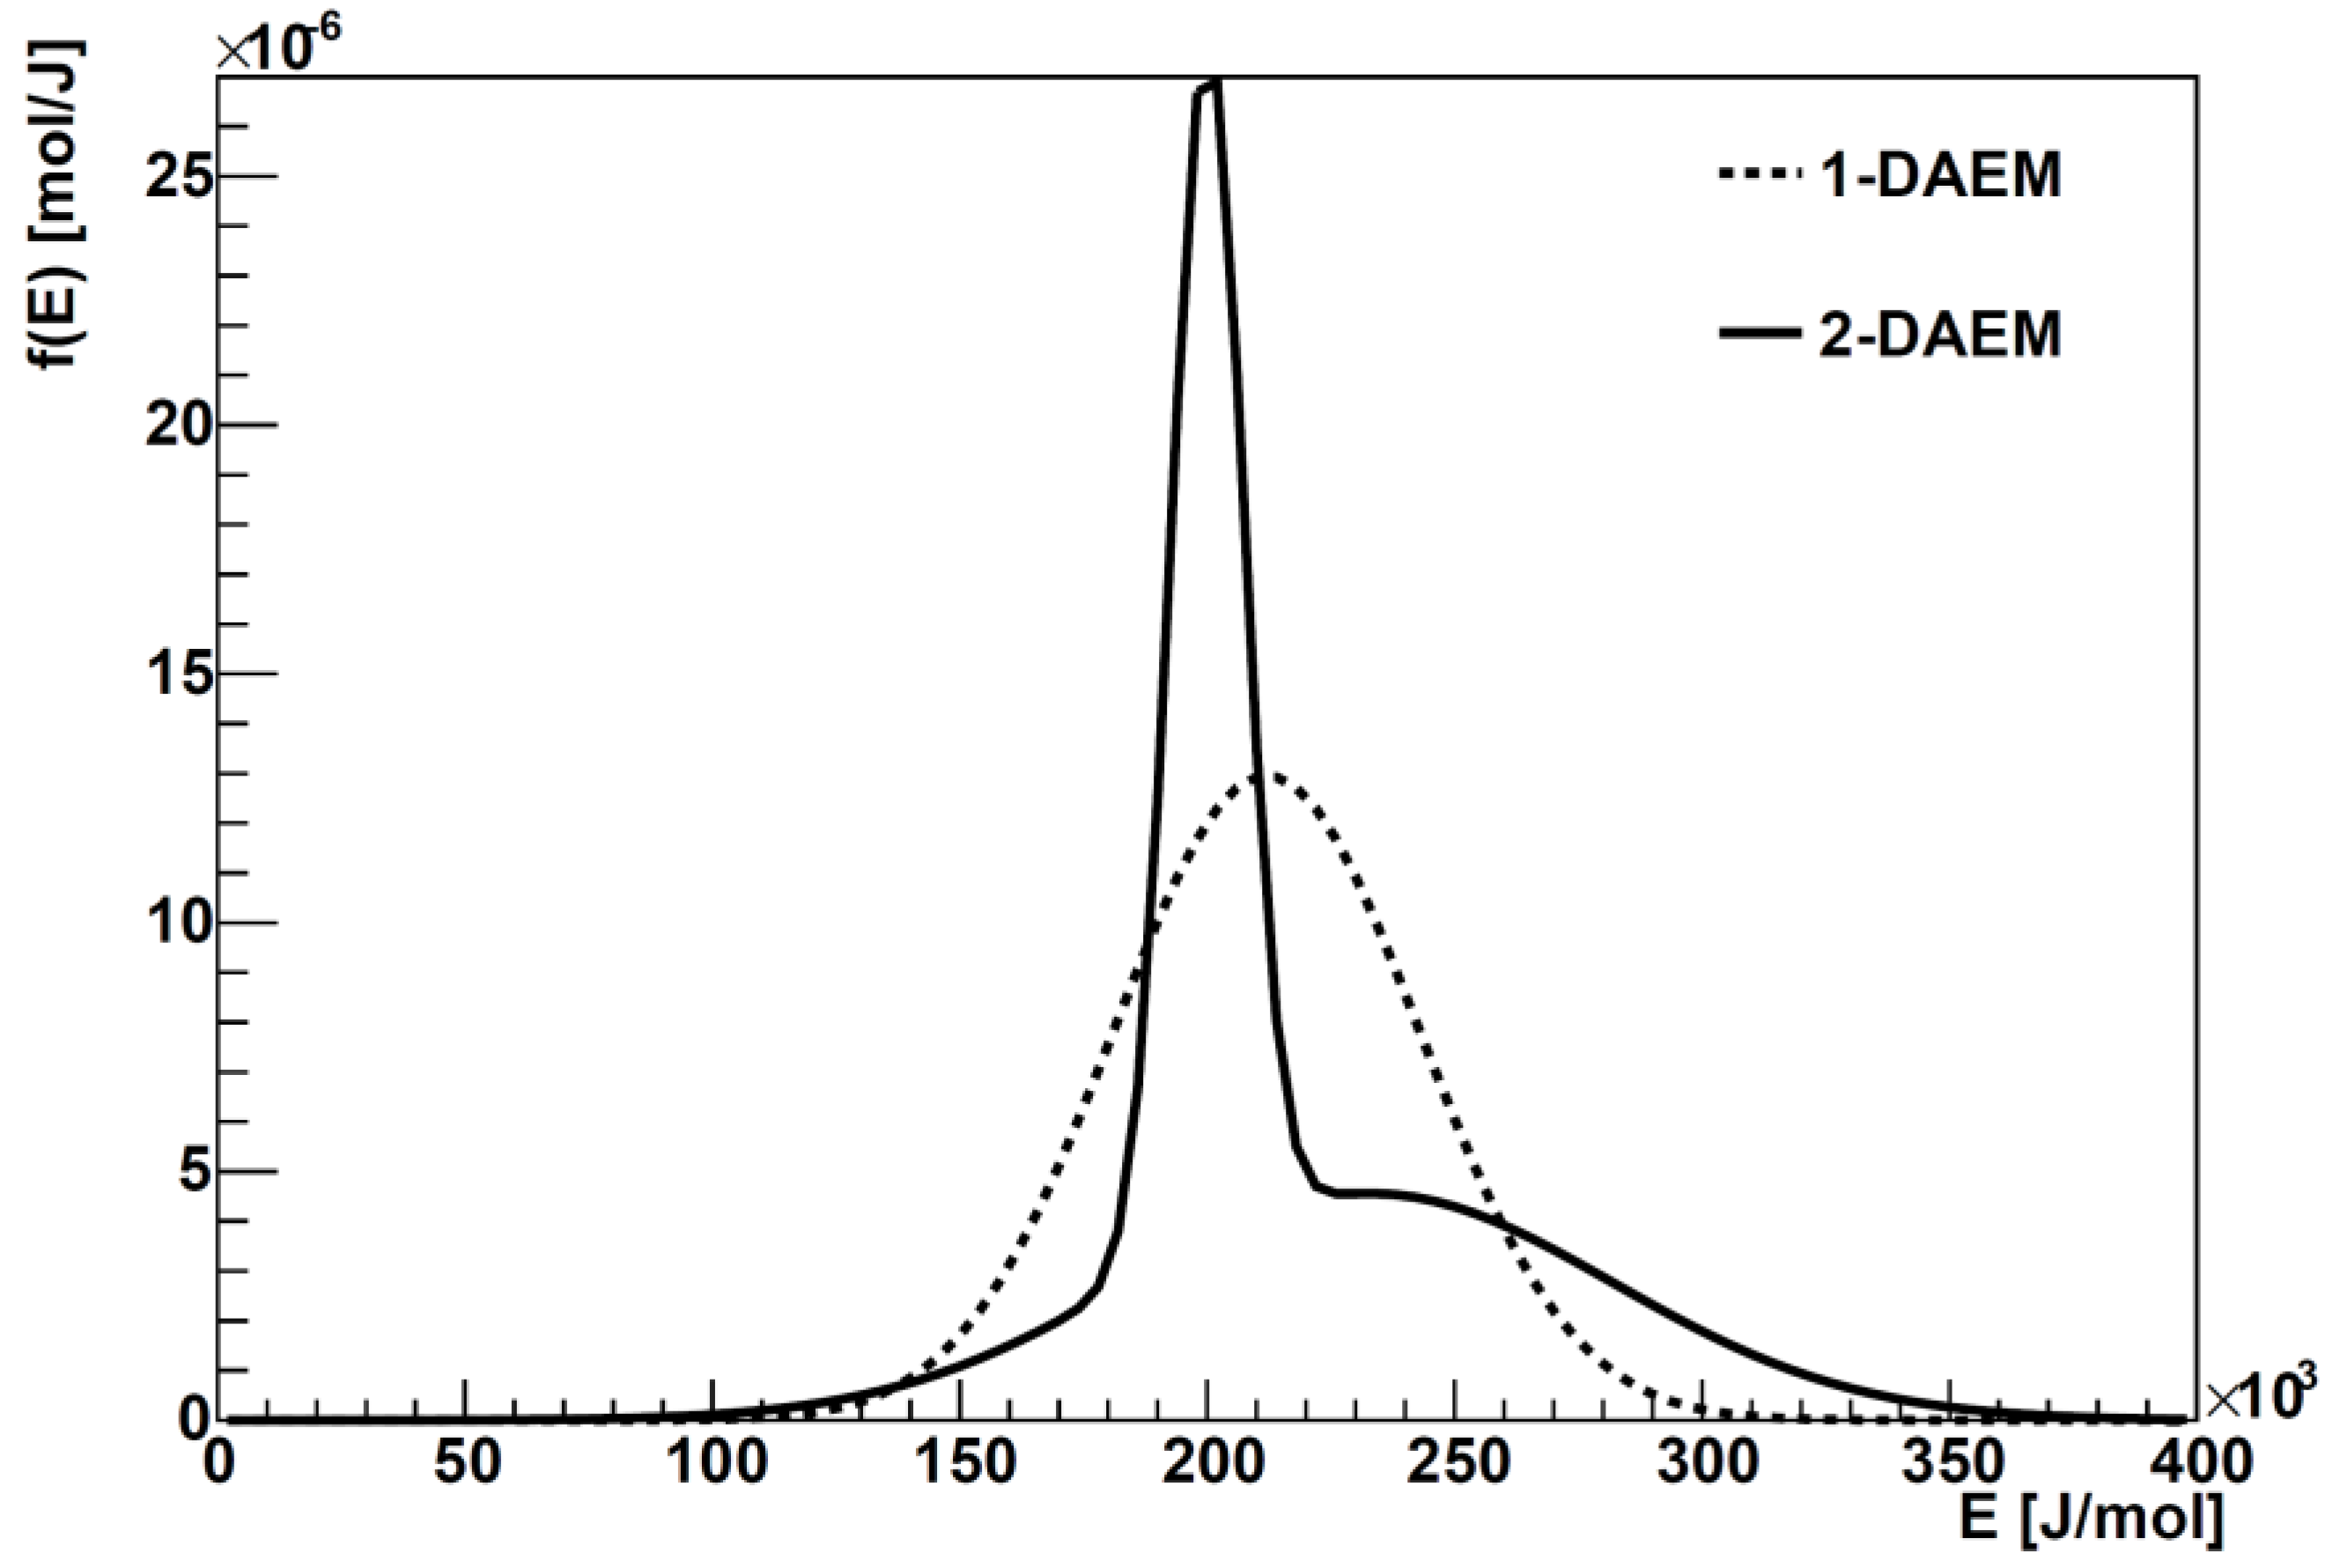
In
Figure 5 the
f(
E) functions for the 1-DAEM and the 2-DAEM are reported. As already discussed, the single Gaussian model is able to give an average representation of the process focusing on the predominant mechanism. The
f(
E) function of the double Gaussian model shows that the two pyrolysis steps are partly superimposed, since the repolymerization reactions begin to occur when the reactions of the primary pyrolysis are still ongoing. This behavior was expected, considering that the value of σ
E2 (55.3 kJ·mol
−1) is higher than the value of σ
E1. The first pyrolysis, represented by the first peak of the
f(
E) curve, is faster and dominates the whole process as pointed out also from the estimation of the
w parameter.
Figure 5.
Comparison between the f(E) functions carried out with the 1-DAEM and the 2-DAEM for the biomass.
Figure 5.
Comparison between the f(E) functions carried out with the 1-DAEM and the 2-DAEM for the biomass.
One major problem in the application of the 2-DAEM is the correlation between the kinetics parameters, which determines correlation coefficients with a mean value of 0.49. Above all, the
w parameter presents a correlation with the mean activation energy as high as 0.72. To de-correlate the parameters, it was tried to fit simultaneously sets of data taken at different heating rates [
27,
28]. In the regression code, a function, such as that reported in Equation (6), was created for each set of data, fixing the heating rate to the proper value. The minimization algorithm was then configured to find the model parameters, which, at the same time, better reproduced the different sets of data. With the simultaneous fit, the correlation between the parameters is lowered to a mean value of 0.27. The improvement is not impressive, but it seems that performing a simultaneous fit with data taken at different heating rates makes the solution more independent.
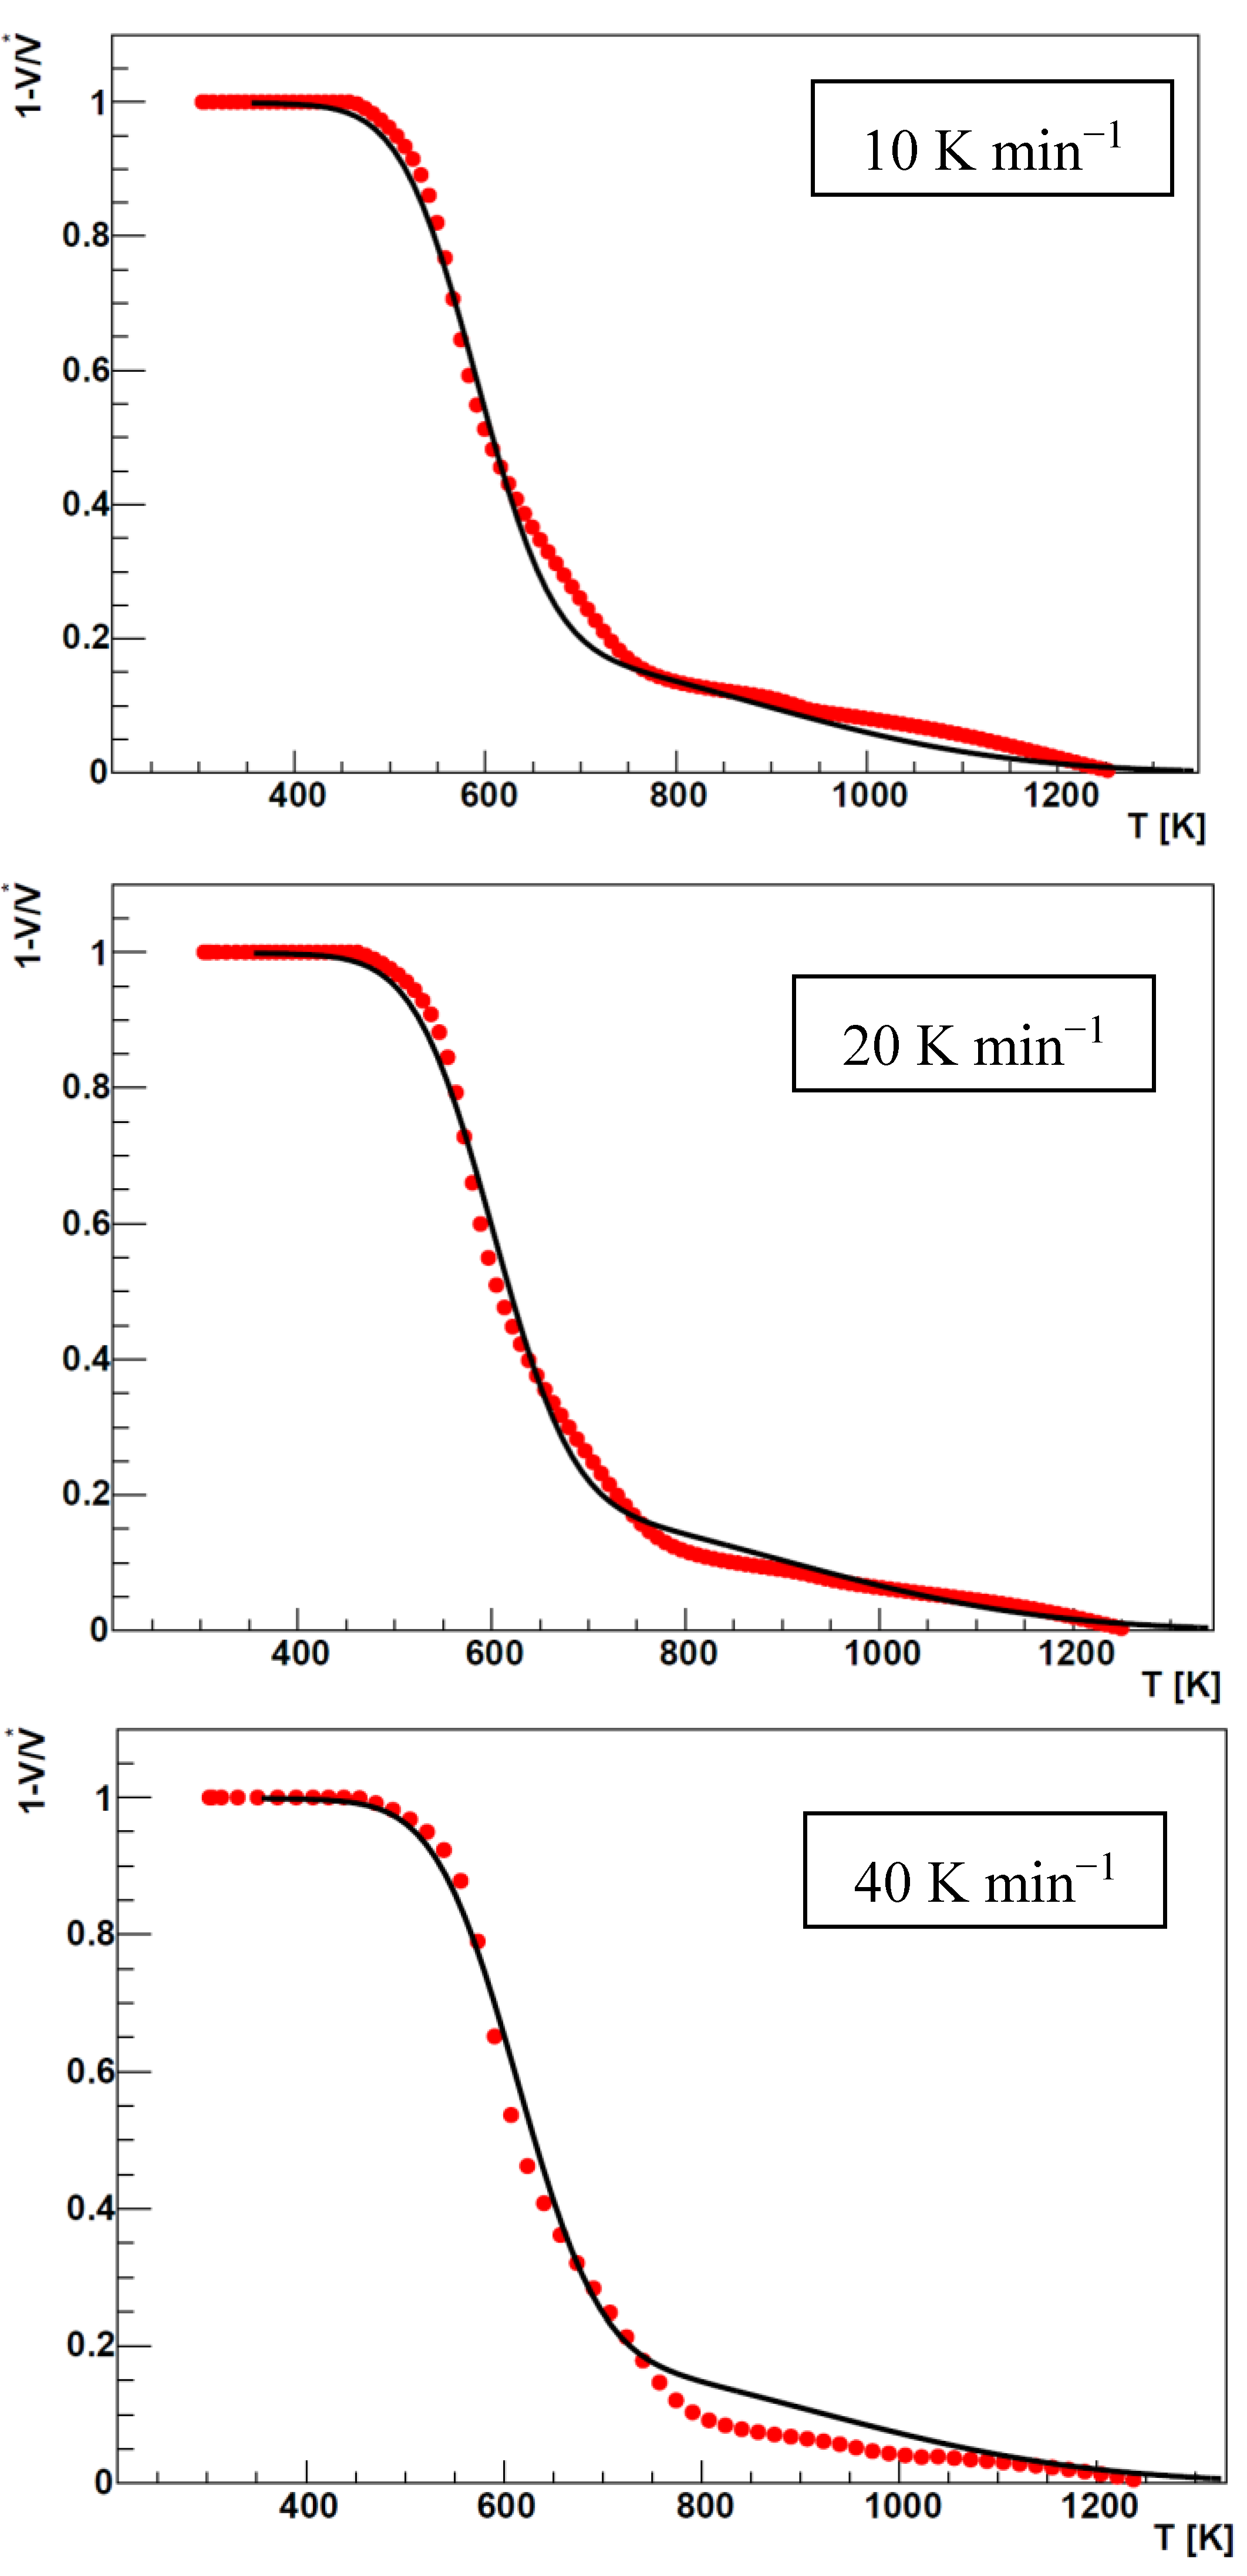
The simultaneous fit was also performed in order to evaluate the independence of the kinetic parameters from the heating rate. The simultaneous fit gives anyway good results for the three heating rates (
Figure 6) and the values reported in
Table 4 show that the obtained kinetic parameters can be considered consistent in the range of the heating rates tested being almost the same of those obtained in the single fit.
Figure 6.
Comparison between experimental data taken at different heating rate (red points) and 2-DAEM simultaneous fit (black line) for the biomass.
Figure 6.
Comparison between experimental data taken at different heating rate (red points) and 2-DAEM simultaneous fit (black line) for the biomass.
The application of the 1-DAEM and 2-DAEM in processing the Sulcis coal experimental data produces the fitting results reported in
Table 5.
Table 4.
Kinetic parameters obtained with the simultaneous fit for the biomass.
Table 4.
Kinetic parameters obtained with the simultaneous fit for the biomass.
| Parameter | 2-DAEM |
|---|
| k0 [s−1] fixed | 1013 |
| E01 [kJ·mol−1] | 175.0 |
| σE1 [kJ·mol−1] | 17.9 |
| E02 [kJ·mol−1] | 221.0 |
| σE2 [kJ·mol−1] | 56.1 |
| w | 0.79 |
Table 5.
Kinetic parameters obtained with the 1-DAEM and 2-DAEM at 100 K·min−1 for the Sulcis coal.
Table 5.
Kinetic parameters obtained with the 1-DAEM and 2-DAEM at 100 K·min−1 for the Sulcis coal.
| Parameter | 1-DAEM | 2-DAEM | 2-DAEM (Simultaneous Fit) |
|---|
| k0 [s−1] fixed | 8 × 10¹² | 8 × 10¹² | 8 × 10¹² |
| E01 [kJ·mol−1] | 212.0 | 200.0 | 202.0 |
| σE1 [kJ·mol−1] | 30.8 | 7.3 | 7.3 |
| E02 [kJ·mol−1] | - | 233.0 | 237.0 |
| σE2 [kJ·mol−1] | - | 49.0 | 52.0 |
| w | - | 0.44 | 0.44 |
From
Figure 7, it can be seen that the agreement between the model and the experimental data is poor when 1-DAEM is applied, showing that the model is not able to catch the two different slopes of the volatiles production curves.
Figure 7.
Comparison between experimental data (red points) and 1-DAEM fit (black line) for Sulcis coal at 100 K·min−1.
Figure 7.
Comparison between experimental data (red points) and 1-DAEM fit (black line) for Sulcis coal at 100 K·min−1.
As expected, the value of the Sulcis coal mean activation energy is low, quite lower than that of a typical anthracite rank coal [
17] due to the much more consistent amount of volatiles in the sub-bituminous coal. This behavior can be explained by considering that the Sulcis coal macromolecule is composed by functional groups and aromatic and hydroaromatic clusters linked by aliphatic bridges. During the pyrolysis, the functional groups are decomposed to form light gas, and the aliphatic bridges, which are weaker than the aromatic ones, are broken producing lighter fragments (tar) [
29]. These fragments extract hydrogen from the hydroaromatic and aliphatic groups increasing the aromatic carbon content of the initial coal. Since we are considering a global kinetics that includes the transport phenomena, in the Sulcis coal, the light gas are facilitated in the transition to the gas phase as the particle becomes more and more porous.
The 2-DAEM application regresses with a high accuracy the coal experimental data (
Figure 2), as shown in
Figure 8 which reports the fitting results at the heating rate of 100 K·min
−1, while the results at the remaining considered heating rates can be found in [
17].
Figure 8.
Comparison between experimental data (red points) and 2-DAEM fit (black line) for Sulcis coal at 100 K·min−1.
Figure 8.
Comparison between experimental data (red points) and 2-DAEM fit (black line) for Sulcis coal at 100 K·min−1.
The activation energy values attributed to the two pyrolysis steps are in this case quite similar (
Table 5). This behavior is even more evidenced looking at the plots in
Figure 9 where the corresponding
f(
E) functions
vs. activation energy computed for the two model are reported.
Figure 9.
Distribution activation energy curves vs. activation energy for 1-DAEM and 2-DAEM applied to Sulcis coal experimental data.
Figure 9.
Distribution activation energy curves vs. activation energy for 1-DAEM and 2-DAEM applied to Sulcis coal experimental data.
Sulcis primary pyrolysis occurs in a small interval of activation energy (σE1 = 7.33 kJ·mol−1) and therefore is confined in a narrow temperature range (650–750 K); this process is fast, and the energy required to break both functional group and aliphatic bonds is similar. The secondary pyrolysis stage, where the dehydrogenation of the hydroaromatic clusters and aliphatic groups, the char condensation, and cross-linking take place, is slower and requires more energy to be accomplished. The two Gaussians are partly superimposed as the cross-linking reactions and char condensation begin at the same time of the primary pyrolysis.
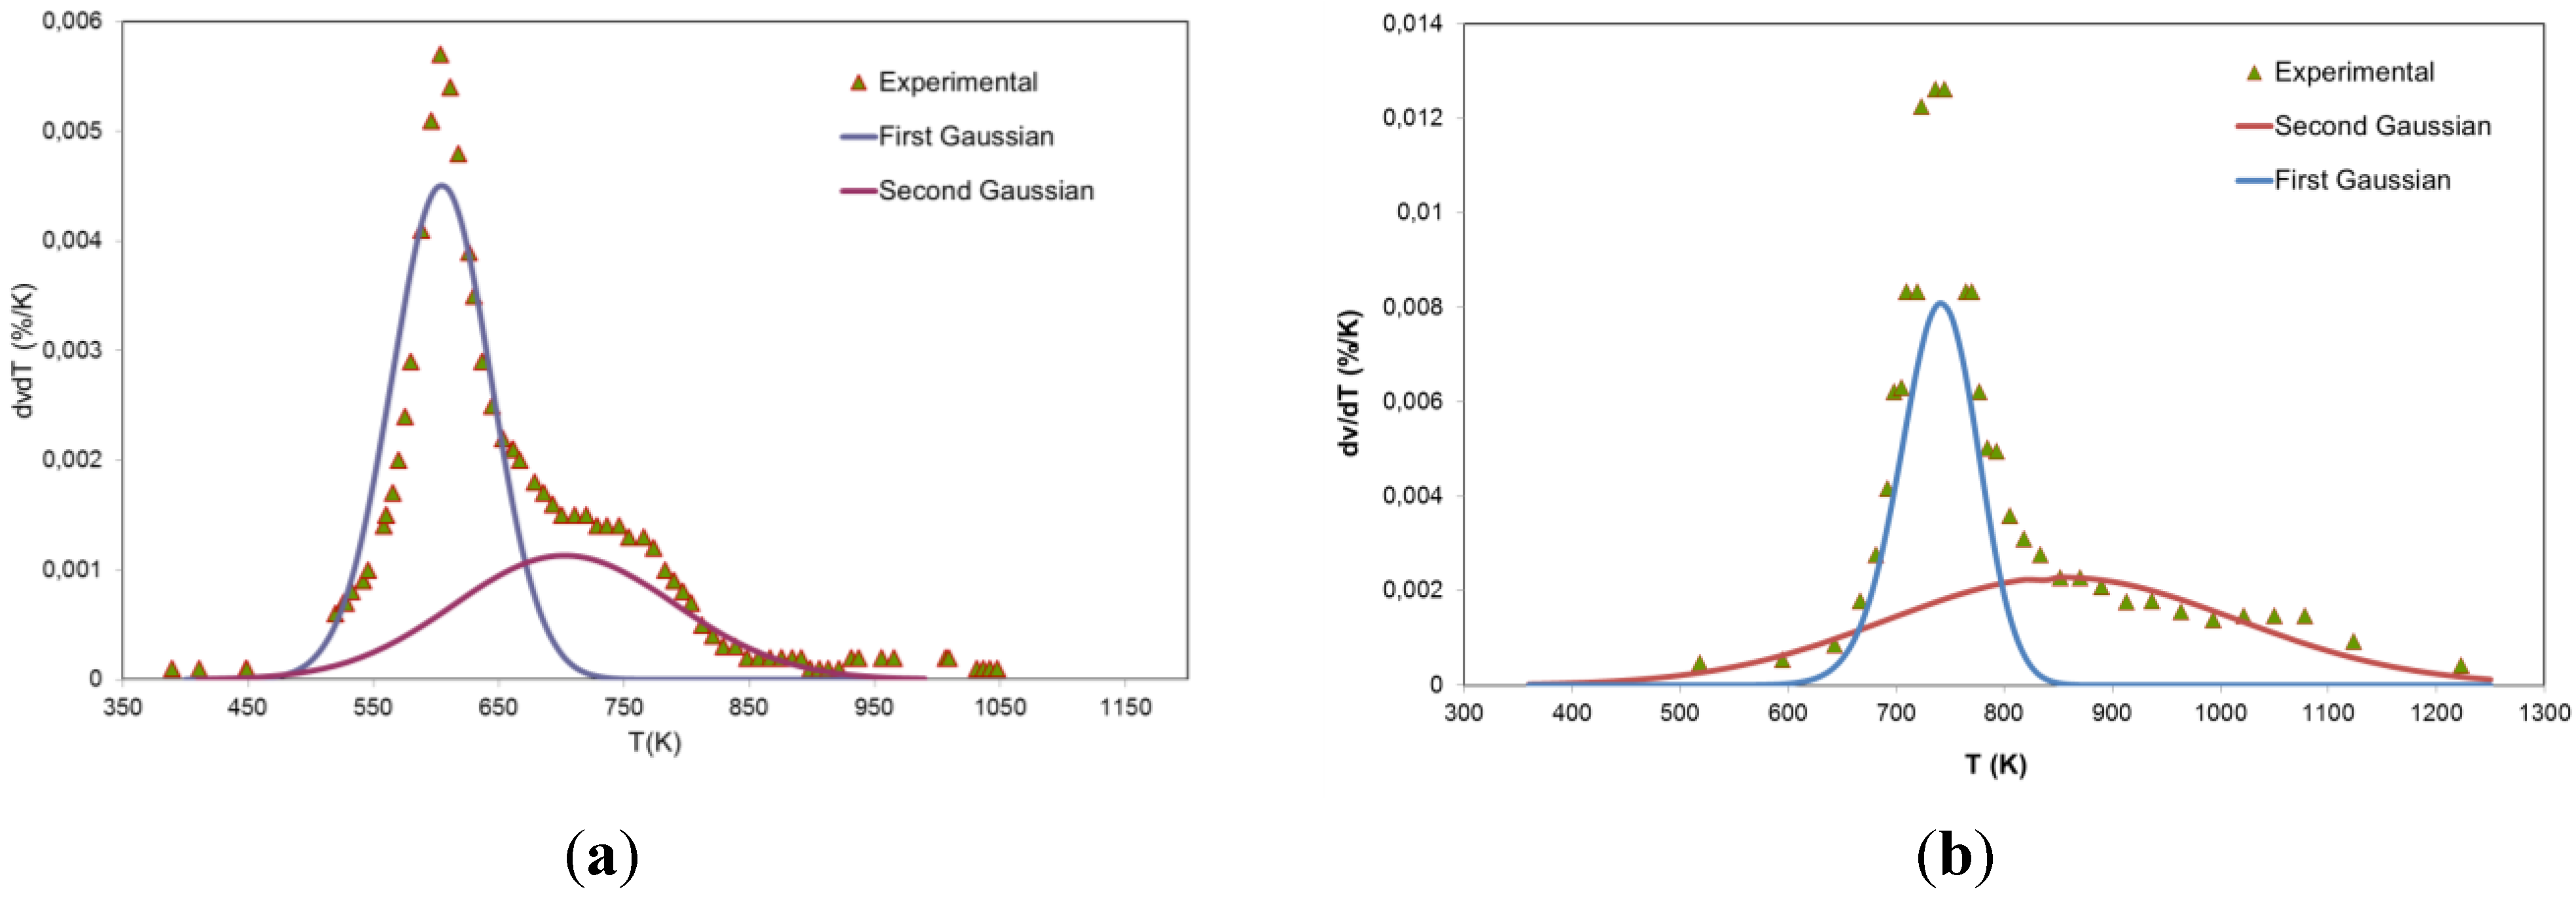
In
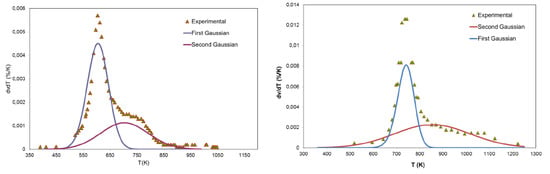
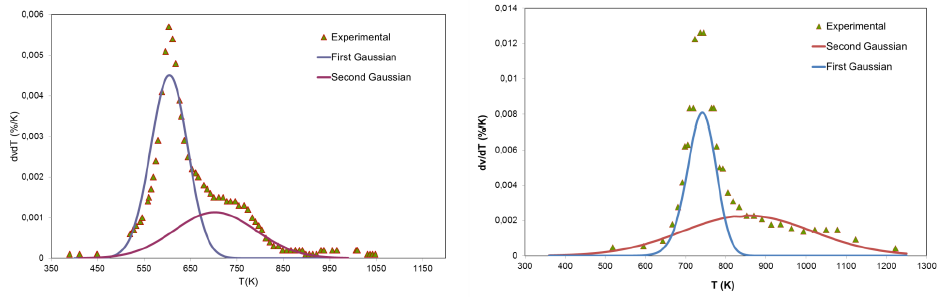
Figure 10, the reaction rates obtained from experimental data are compared with the reaction rate due to the two Gaussians. Each curve represents the contribution of one of the two Gaussians distributions in the whole process. The fast primary pyrolysis reactions and the superimposition of the two steps can be noticed for both the considered materials.
Figure 10.
Comparison between experimental reaction rates and reaction rates obtained with the 2-DAEM kinetic parameters at a heating rate of 100 K·min−1. (a) Biomass and (b) Sulcis coal.
Figure 10.
Comparison between experimental reaction rates and reaction rates obtained with the 2-DAEM kinetic parameters at a heating rate of 100 K·min−1. (a) Biomass and (b) Sulcis coal.
The 2-DAEM in the case of the Sulcis coal gives a greater improvement with respect to the application of the same model to the biomass. The importance of the secondary pyrolysis in this case makes the model particularly suitable for the selected material and in general in all the case where the secondary step of the pyrolysis process is important. In the case of the biomass, the 2-DAEM improves the fit quality but not as significantly as for the coal since the pyrolysis is almost completed in the first predominant step and is reproduced by the 1-DAEM with adequate accuracy. These remarks are confirmed by the calculation of the residual sum of squares for the two models applied at the two materials experimental data as reported in
Table 6. In the case of the biomass, the improvement achieved using the 2-DAEM is only 30 times with respect to the 1-DAEM, while for the Sulcis coal the improved model fits the experimental data with an accuracy 244 times better.
Table 6.
Summary for the Residual Sums of Squares for the two models.
Table 6.
Summary for the Residual Sums of Squares for the two models.
| Model | Sulcis Coal | Chlorella vulgaris |
|---|
| 1-DAEM | 3.16 × 10⁻³ | 0.067 |
| 2-DAEM | 1.41 × 10⁻⁵ | 0.002 |
| χ2(1-DAEM)/χ2(2-DAEM) | 244 | 33 |
5. Conclusions
The double Gaussian distributed activation energy model was developed to overcome the inadequacy of the single Gaussian model to properly describe both the pyrolysis steps, primary and secondary, which instead energetic materials of different nature show when submitted to the pyrolysis conditions. This improved model was used to interpret the experimental results obtained in the TG analysis of samples of Chlorella vulgaris microalgae biomass and of Sulcis sub-bituminous coal. The improved model performance was compared with that of the standard 1-DAEM to quantify the attainable benefit.
The results of the fitting show that the first pyrolysis is the predominant mechanism in biomass pyrolysis process, occurring at lower activation energy in a narrow interval (σE1 = 17.3 [kJ·mol−1]). The two steps are partially overlapped due to the wide temperature interval of the secondary pyrolysis.
In the case of the Sulcis coal, the 2-DAEM reproduces the experimental data with a high accuracy, clearly identifying the two steps that characterize the pyrolysis behavior of such a material and weighting their different occurrence. It has to be noted that for the Sulcis coal the improvement reaches using the 2-DAEM is considerably higher (χ2(1-DAEM)/χ2(2-DAEM) = 244) because the two steps of the pyrolysis have the same weight, making the 1-DAEM not able to model the process properly. This result demonstrates that the model is very usefull to classify materials of very different nature individuating their different pyrolysis behavior.
The simultaneous fitting procedure proposed in the paper allows reducing the correlation between the identified kinetic parameters by about 50%. This correlation, named compensation effect, always appears, more or less discussed, in the application of the models of the class here considered, but up to now no fixed procedures can be found in the literature that are able to resolve the question.
Finally, a major feature of the improved DAEM is the introduction of the w parameter, estimated from the fit, which gives important information on the weight of the two pyrolysis steps identified in the process.


