1. Introduction
Methane of fossil origin is increasingly used as vehicle fuel worldwide, a development driven by environmental benefits, such as reduced local air pollution and greenhouse gas (GHG) emissions, compared with petrol and diesel. Methane produced from biomass via anaerobic digestion, or biogas, is also increasingly used as vehicle fuel, but the amounts are still marginal [
1]. Using biomass-based methane instead of natural gas as vehicle fuel to replace petrol and diesel will lead to even greater GHG reductions, especially when the biogas is produced from wastes and residues [
2,
3]. Sweden is to some extent unique as regards the continuous increase in the use of biogas as a vehicle fuel over the past decade, now representing more than 1% of the total fuel used in the road transport sector [
4]. The current production of biogas is mainly based on organic wastes and by-products. However, the increased demand for biogas in the transport sectors has resulted in a need of developing new biogas systems based on other feedstock, such as biogas crops, since the amount of wastes and by-products available as biogas feedstock is limited. New, large-scale commercial biogas plants producing vehicle fuels from biogas crops are therefore now being built in Sweden. The cultivation of agricultural crops for biogas production (mainly maize) is already in operation on a large-scale in Germany, for example, but the biogas is utilised mainly for electricity and heat generation. The limited utilisation of agricultural crops for biogas as vehicle fuels has also led to a limited number of life cycle assessments covering such biofuel systems (see e.g., [
2]). Thus, there is a need to increase knowledge about the GHG and energy performance of biogas vehicle fuels based on various agricultural crops. The purpose of this study is to fill this knowledge gap.
According to the EU Renewable Energy Directive (RED), the share of renewable fuels in the transportation sector in the EU should be 10% by 2020 [
5]. Currently, discussions are going within the EU to limit the share of biofuels originating from food crop-based feedstock. This limitation is motivated by concerns about the risk of so-called indirect land-use changes (iLUC) due to an expanding production of biofuel crops which may lead to displacement of food crop production and the cultivation of new arable land [
6]. Furthermore, a requirement is that the current biofuels lead to a 35% reduction in life cycle GHG emissions, compared to petrol and diesel, which will increase to a 50% and 60% reduction for biofuel systems implemented in 2017 and 2018, respectively [
5]. Current dominating biofuel systems in Europe, such as ethanol from sugar beet and wheat, and biodiesel from rape seed, typically have default GHG emission savings of, on average, some 50% and 40% respectively [
5], but actual savings vary depending on the type of fuel used in the biofuel plant
etc. Corresponding default GHG emission savings from biogas vehicle fuel systems based on organic waste and manure are about 70%–80% [
5].
The method to calculate the GHG performance of biofuels in the RED is based on the life cycle assessment (LCA) methodology with standardised procedures for system boundaries, functional unit and allocation. This standardisation in RED differs somewhat compared to the recommendations given in the ISO standard of LCA [
7], which leads to different results regarding the GHG performance of biofuels depending on the calculation methodology used [
8,
9]. Some biofuel systems perform better from a GHG perspective when evaluated by the RED calculation methodology, whereas others perform better when evaluated by the ISO calculation methodology.
An increased supply of agriculture-based biofuel feedstock will include various crops and residues, which all give different energy yields per hectare, but also have different environmental and economic performance. This complicates the issue of which crops are preferable for sustainable, renewable fuel production and stresses the need for updated and further developments in life cycle assessments. The present study presents results from the interdisciplinary research collaboration “Crops 4 Biogas”, where the overall aim was to establish and compare land use, energy, GHG and economic efficiency for biogas as vehicle fuel derived from six different crops representing food, feed and energy crops. The type of crop used for biofuel production may be treated differently in future biofuel policies, such as the RED, regarding iLUC effects
etc. Data related to cultivation have been presented by Gissén
et al. [
10], and data related to biogas process parameters have been presented by Lantz
et al. [
11]. In these two studies, also the economic efficiency of the whole production chain was evaluated. The objective of this final study is to assess the overall primary energy and greenhouse gas efficiency from field to fuel for six crops investigated, and to analyse the impact on the results of the calculation method used and other critical parameters.
2. Methodology and Assumptions
The assessment performed in this paper covers a field-to-tank perspective, from the cultivation of feedstock crops to anaerobic digestion and the upgrading of the biogas to vehicle fuel quality. The crops included are: (1) hemp; (2) sugar beet; (3) maize; (4) triticale; (5) ley crops; and (6) wheat (grain). The crops were chosen to represent food, feed and energy crops that could be potentially interesting as biogas energy crops, but that should be well-known to farmers and that required only commercially available sowing and harvest machinery [
10]. Two different fertilisation strategies are assessed, one based on solely mineral fertilisers and one based on a biofertiliser complemented with mineral fertilisers. The cultivation takes place in southern Sweden on good agricultural land and crop yields represent normalised average yields in this region (
Götalands södra slättbygder, Gss) [
10]. This is a region that, according to the Köppen-Geiger classification, has a cold climate without a dry season and with warm summers. The same classification applies to Europe from a line through the middle of Germany down to Austria and eastwards, covering much of the key agricultural regions within EU27 [
12]. More data about the crop production is given in
Section 2.1. The plant size selected for the biogas production, including upgrading to vehicle fuel quality, is equivalent to some 170 TJ year
−1 (based on lower heating value, LHV), for the crops evaluated [
11]. This scale is based on the economic evaluation related to biogas upgrading. More details about the production and upgrading are given in
Section 2.2.
The study follows the principles of LCA described in the ISO standard 14044 [
7]. The environmental impact categories included are GHG performance, expressed as global warming potential (GWP), and energy balance, expressed as the energy input/output ratio (primary energy). The calculation of life cycle emissions of GHGs includes carbon dioxide (CO
2) of fossil origin and based on changes in soil organic carbon (SOC) content, methane (CH
4) and nitrous oxide (N
2O). The emissions originate from both energy conversion (including CH
4 slip from biogas production and N
2O from fertiliser production plants) and biogenic processes in the soil (causing N
2O and CO
2 emissions). The biogenic emission of N
2O was calculated using the model presented by IPCC [
13]. Expressed as GWP, 1 g of CH
4 and 1g of N
2O are taken to be equivalent to 25 g and 298 g CO
2-equivalents, respectively [
13].
The functional unit (FU) is 1 GJ of upgraded and pressurised biogas. The assessment includes two alternative system boundaries. Case one represents ”systems expansion” and is based on the cultivation using solely mineral fertilisers where the indirect effects of the generated digestate, or biofertiliser, are included. In this case, the biofertiliser is estimated to replace mineral fertilisers, leading to reduced energy use and emissions in the production of mineral fertilisers, increased input of organic matter to the soil, but also increased biogenic emissions of nitrous oxides. Case two represents “no system expansion” and is based on cultivation using biofertiliser, and mineral fertiliser complement, where only the direct effects of the production systems are included. Both cases include direct land use changes (dLUC), but potential iLUC are excluded in this study. The reason for this is that (i) all biogas systems analysed are based on crops cultivated on existing farmland and thus will have a similar impact on potential displacements of food crop production; and (ii) the issue of iLUC is embodied with significant uncertainties from a scientific perspective and thus should preferably be handled separately and outside detailed field-to-tank assessments [
6]. In the sensitivity analysis, an additional calculation methodology is tested, which represents the GHG calculation approach standardised in the EU’s RED [
5].
Changes in SOC due to crop residues and digestate added to the soil were accounted for using the Introductory Soil Carbon Balance Model (ICBM) [
14,
15]. The model was calibrated against data derived from the long-term, soil carbon, field experiment in Ekebo, Sweden [
16] by changing the mineralisation rate of the more stable carbon pool. Annual changes in the SOC content according to carbon inputs and mineralisation rates were modelled as an average over a period of 40 years [
17].
The calculations of energy inputs are based on primary energy inputs; that is, all energy flows are calculated as unconverted and untransformed natural resources. The energy input into cultivation includes diesel fuel, fertilisers, seed, pesticides, the manufacture and maintenance of field machinery used for field operations, transport and storage
etc. The energy input into biomass feedstock storage includes the building of concrete bunker silos and the manufacture of plastic cover material. In the biogas processes (including upgrading and pressurisation) the energy input in the form of heat and electricity is included, as is the primary energy in the form of nutrients added to the process. The energy input into storage, transport and spreading of biofertiliser (digestate) is included in the system expansion case. The energy represented by farm buildings, roads and conversion plants is not included since this energy input is assumed to be equivalent for the various crop-based biogas systems included in the assessment. Furthermore, the energy embodied in such infrastructure has previously been shown to be of minor importance compared to the energy input in the production system, also since the energy embodied in infrastructure is allocated to other farm activities and production systems [
3].
The primary energy source for heat generation for the digestion process was here assumed to be solid biofuels, such as forest fuels (wood chips from logging residues) or straw, having a primary energy factor of 1.3, including an energy input in feedstock recovery and transport equivalent to 5% of the energy content of the biomass and a heat conversion efficiency of 80% [
18]. The input of electricity is based on Swedish average electricity with a primary energy factor of 2.1, including heat losses in nuclear power production and transmission losses in the grid [
19]. The primary energy factor for diesel fuels is assumed to be 1.19, also including lubricant oil [
18,
20]. All gas volumes are given as normalised to 0 °C and 101 kPa.
2.1. Crop Production
The crops evaluated were included in a 7-year crop rotation with all crops harvested as whole crop, except winter wheat for which only grain of fodder quality was harvested and the straw was left in the field. For sugar beet both the root and the top were harvested. Triticale was harvested in the early dough stage. The ley crops (25% white and red clover, 50% hybrid ryegrass and the rest a mix of two ryegrasses) were under-sown in triticale, harvested twice a year (mid-June and late August) and kept in the crop rotation for 2 years. Winter wheat was harvested at full maturation. In the cultivation trials, two fertilisation strategies were compared; fertilisation with mineral fertiliser (nitrogen, phosphorus and potassium, or NPK) and with biofertiliser with NPK addition (dig+NPK). The biofertiliser was the digestate (the effluent) from a biogas plant treating mainly municipal and industrial food waste [
10]. The average digestate composition used in the LCA calculations was 3.3% dry matter (DM), 0.5 g·P·kg
−1, 4.6 g·N·kg
−1 (whereof 74% ammonia-N) and 0.8 g·K·kg
−1 [
10]. The effect of fertilisation strategy on crop yield and quality was evaluated [
10]. The two fertilisation strategies were shown to have no significant effect on mineral uptake or methane yield. For all crops except hemp there was no significant difference in crop DM yield when using dig+NPK compared to using NPK [
10]. The normalised crop yields presented in
Table 1 are considered to be representative for both fertilisation strategies.
The crop-specific fertilisation levels and operations included in the calculations of primary energy input into cultivation are presented in detail by Gissén
et al. [
10], and include transport from field to biogas plant (8 km), ensiling in bunker silos at the biogas plant (for wheat, drying and storage in grain silos), cutting or grinding (if precision chopping was not applied at harvest), and loading into a dosing container connected to the biogas plant. Energy input into crop production is calculated for the two fertilisation strategies (NPK and dig+NPK), showing a decrease of, on average, 34% in primary energy input into cultivation when digestate replaced most of the mineral fertiliser (
Table 1, [
10]). The primary energy input into crop cultivation related to the LHV of the DM of the harvested crop ranges from approximately 10%–15% with NPK fertilisation, and 6%–10% with dig+NPK (
Table 1).
Calculation of the amounts of carbon from above- and below-ground crop residues added to the soil followed the Nordic methodology as described by Björnsson
et al. [
17]. Carbon (C) content in the part of the crops used for biogas production was measured as 42% (hemp), 41% (sugar beet), 44% (maize), 44% (triticale), 45% (ley crops) and 43% (wheat grain) of DM [
10] while C content in crop residues was assumed to be 45% [
21]. Initial SOC content was assumed to be 2%, which corresponds to the mean SOC content in agricultural soils of southern Sweden [
22].
Table 1.
Biomass yields, energy inputs for biogas crop production systems with different fertilisation strategies, and carbon addition to soil 1.
Table 1.
Biomass yields, energy inputs for biogas crop production systems with different fertilisation strategies, and carbon addition to soil 1.
| Crop | Biomass yield 2 | Energy input 3 GJ ha−1, year−1 | Energy balance 4 | Carbon addition to soil 5 |
|---|
| t DM· ha−1· year−1 | GJ·ha−1· year−1 | Cultivation & harvest | Storage | Transport | Total | Energy input/output Ratio % | t C·ha−1· year−1 |
|---|
| Hemp | 9.1 | 148 | 11.4 | 1.3 | 1.8 | 14.5 | 9.9 | 3.2 |
| (4.7) | (1.4) | (2.4) | (8.5) | (5.8) |
| Sugar beet | 12.9 | 208 | 18.5 | 1.2 | 4.9 | 24.6 | 11.9 | 2.0 |
| (12.3) | (1.3) | (5.5) | (19.1) | (9.2) |
| Maize | 9.4 | 152 | 12.1 | 1.8 | 1.6 | 15.5 | 10.2 | 5.7 |
| (5.4) | (1.9) | (2.1) | (9.4) | (6.2) |
| Triticale | 7.5 | 120 | 9.6 | 1.2 | 1.8 | 12.6 | 10.4 | 2.5 |
| (6.2) | (1.2) | (2.1) | (9.5) | (7.9) |
| Ley crops | 8.6 | 140 | 12.9 | 1.3 | 2.0 | 16.2 | 11.6 | 9.9 |
| (6.3) | (1.4) | (2.6) | (10.3) | (7.3) |
| Wheat (grain) | 6.7 | 109 | 12.9 | 3.3 | 0.6 | 16.8 | 15.4 | 7.8 |
| (6.2) | (3.4) | (1.2) | (10.8) | (9.8) |
The calculations of the GHG emissions from crop production, which are based on the same input data as for the assessment of energy balances [
10], are shown in
Table 2 expressed as kg CO
2-equivalents per hectare and year. The total emission of GHG varies between approximately 0.6 and 4.0 t CO
2-eq·ha
−1·year
−1 with NPK fertilisation (equivalent to approximately 4–19 kg CO
2-eq·GJ
−1 biomass), and −0.6–2.9 t CO
2-eq·ha
−1·year
−1 with dig+NPK (equivalent to approximately −4 to 14 kg CO
2-eq·GJ
−1 biomass). Regarding annual crops produced with NPK fertilisers, roughly half of the GHG originate from cultivation and harvest, whereas the biogenic N
2O emissions represent the second largest contributor, followed by changes in SOC. However, for some cultivation systems, changes in SOC are of more significant importance (see
Table 2).
When digestate is replacing mineral fertilisers, biogenic N2O emissions will in most cases be the largest contributor to GHG emissions and exceed the emissions from cultivation and harvest. Cultivation of some crops, especially perennial ley crops, leads to a significant sequestration of SOC, which in these cases will be the most important GHG parameter. The emissions of GHG from storage and transport represent minor contributors.
Table 2.
Emissions of GHG’s from different biogas crop production systems, expressed as kg CO2-equivalents per hectare and year 1.
Table 2.
Emissions of GHG’s from different biogas crop production systems, expressed as kg CO2-equivalents per hectare and year 1.
| Crop | Cultivation & harvest 2 | Biogenic N2O 3 | SOC changes 4 | Storage 5 | Transport 5 | Total | Total–per GJ biomass 6 |
|---|
| Hemp | 1430 | 742 | 153 | 111 | 136 | 2570 | 17.4 |
| (440) | (1220) | (−515) | (125) | (176) | (1440) | (9.8) |
| Sugar beet | 1970 | 798 | 784 | 108 | 356 | 4010 | 19.3 |
| (975) | (1310) | (115) | (122) | (397) | (2920) | (14.0) |
| Maize | 1470 | 845 | −875 | 151 | 140 | 1730 | 11.3 |
| (457) | (1310) | (−1540) | (166) | (181) | (566) | (3.7) |
| Triticale | 1090 | 596 | 255 | 102 | 131 | 2180 | 18.1 |
| (559) | (868) | (−110) | (110) | (154) | (1580) | (13.2) |
| Ley crops | 1650 | 1460 | −2780 | 109 | 148 | 579 | 4.1 |
| (639) | (1910) | (−3450) | (123) | (188) | (−593) | (−4.2) |
| Wheat (grain) | 1550 | 982 | −1340 | 243 | 45 | 1480 | 13.6 |
| (543) | (1440) | (−2010) | (257) | (86) | (324) | (3.0) |
2.2. Biogas Production and Upgrading to Vehicle Fuel Quality
When used as a vehicle fuel in Sweden, biogas must fulfil several specifications regarding heating value and impurities, for example the gas must have a methane content of at least 97% [
11]. The process of cleaning the biogas and removing CO
2 is generally referred to as upgrading. In the upgrading of biogas to vehicle fuel, the scale of production has a strong effect on the upgrading cost. Thus, the selected scale of production of 1000 m
3·h
−1 biogas is based on an economic evaluation [
11]. With a content of 55% methane in the biogas, this means a biogas production of 172 TJ·year
−1 (LHV), which is the size of the biogas production plant that has been used in the evaluation for all crops. Available upgrading technologies are e.g., water scrubber, chemical scrubber, membrane and pressure swing adsorption. Each technology has different characteristics regarding e.g., energy demand and methane losses. The selected upgrading process is a chemical scrubber, producing upgraded gas with a methane content of 97% and with a methane leakage of 0.1% [
11]. Electricity and heat demand for upgrading and compression will thus be the same in all cases (
Table 3), and includes compression to 200 bars on site and filling into mobile gas storage tanks, but not distribution [
11].
The biogas production process has been calculated as if each process is operating on only one type of ensiled (or dried in the case of grains) crop, even if neither production nor storage of individual crops in some cases would be possible. This was done to enable the evaluation of energy and GHG performance for each crop separately. The properties of the crop that affect the process are biodegradability, water content and content of nutrients. These properties have been recalculated into feedstock demand, biogas process size, water and nutrient demand and digestate amount and composition as presented by Lantz
et al. [
11]. The differences in crop properties resulted in different demands on feedstock amount and required land area for energy crop production (1070–2200 ha·year
−1). Mean values for experimentally determined methane yields for crops from cultivation trials [
10] were decreased by 10% to reflect full scale yields. The limits set for the process parameters organic loading rate (OLR) and hydraulic retention time (HRT) were 3 kg DM
removed·m
−3·day
−1 and 46 day, resulting in crop-specific process active volumes [
11]. For nutrients, focus was on the content of N and the micronutrients iron (Fe), cobalt (Co), molybdenum (Mo) and nickel (Ni), which are all essential for a well functioning biogas process. If the crop had a low content of these nutrients, they were added to reach the same minimum level in all processes, and this was considered an important precondition for the selected OLR and HRT [
11]. The reactor DM content was calculated based on feedstock DM and biogas yield, and if these were over 9.5%, water was added for dilution. In the case of wheat grain, additional water was added to dilute the reactor concentration of total ammonia nitrogen (NH
3-N + NH
4-N), where the upper limit was set to 4 g/L [
11].
The amount of digestate and content of nutrients and organic material (determined as volatile solids (VS) and C) were calculated based on crop amount, biodegradability and nutrient content, addition of water for dilution (hemp 41,000 m
3·year
−1, wheat 41,000 m
3·year
−1and triticale 2000 m
3·year
−1) and addition of mineral N in the process (hemp 132 t·year
−1, beet 95 t·year
−1, maize 45 t·year
−1 and triticale 3 t·year
−1). Digestate storage capacity in covered storage was for 12 months, and 1% of total N was lost as NH
3 during storage [
11].
Methane losses during storage of digestate are calculated by the method developed by IPCC [
13] based on the content of undigested DM for each crop feedstock [
10], and using the methane conversion factor (MCF) of 3.5% for methane leakage from liquid manure storage [
24]. The maximum methane potential (B
0) is based on the average, measured, residual methane potential (measured after 60 days of incubation at 37 °C) of 64 m
3 CH
4 (t·DM)
−1 for 13 German biogas plants with >70% crop feedstock [
25]. The calculated losses during digestate storage are then, expressed as % of the biogas produced, 0.5% for hemp, 0.1% for sugar beet, 0.2% for maize, 0.1% for Triticale, 0.3% for ley crops and 0.1% for wheat (grain).
Table 3.
Methane yields and energy inputs in the conversion system of energy crops into upgraded and pressurised biogas, including use of digestate as biofertiliser 1.
Table 3.
Methane yields and energy inputs in the conversion system of energy crops into upgraded and pressurised biogas, including use of digestate as biofertiliser 1.
| Crop | Methane yield 2 | Energy input 3 MJ·GJ−1 biogas | Energy balance |
|---|
| Biogas process | Upgrad. | Press. | Digestate | Total | Energy input/output ratio % |
|---|
| GJ·t−1 DM | % of Energy in feedstock | El. | Heat 4 | Nutr. add. | El. | Heat | El. | Load. | Transp. | Spread. |
|---|
| Hemp | 8.2 | 51 | 40.0 | 4.6 | 37.0 | 46.2 | 131 | 54.6 | 1.82 | 6.14 | 7.66 | 329 | 32.9 |
| (103) |
| Sugar beet | 12.4 | 77 | 26.1 | 0 | 26.5 | 46.2 | 131 | 54.6 | 1.12 | 2.25 | 4.71 | 293 | 29.3 |
| (67.0) |
| Maize | 11.0 | 68 | 21.4 | 0 | 12.6 | 46.2 | 131 | 54.6 | 0.88 | 1.87 | 3.71 | 273 | 27.3 |
| (51.4) |
| Triticale | 12.2 | 76 | 14.9 | 0 | 1.0 | 46.2 | 131 | 54.6 | 0.55 | 1.06 | 2.32 | 252 | 25.2 |
| (33.2) |
| Ley crops | 9.2 | 57 | 41.9 | 12.2 | 0 | 46.2 | 131 | 54.6 | 1.92 | 6.16 | 8.07 | 302 | 30.2 |
| (111) |
| Wheat (grain) | 13.2 | 81 | 19.9 | 0 | 0 | 46.2 | 131 | 54.6 | 0.81 | 2.65 | 3.39 | 259 | 25.9 |
| (49.0) |
Methane losses during upgrading are equivalent to 0.2% of the biogas produced, based on average emissions measured in Swedish chemical adsorption upgrading plants 2007–2012 [
26]. The amount of digestate applied were restricted by national regulations on the maximum biofertiliser contribution of P (22 kg·ha
−1) and easily available N (150 kg·ha
−1). 30% of the agricultural land surrounding the biogas plant was estimated to be available for digestate fertilisation, and energy and GHG emissions for loading, transport and spreading were calculated based on this.
The conversion efficiency, expressed as the methane yield in relation to the energy content of the feedstock crop (LHV), was 51% (hemp) to 81% (wheat grain) (
Table 3). These values differed from previous life cycle inventory (LCI) data used in LCA’s of biofuels (see e.g., Börjesson and Tufvesson [
20]). The conversion efficiency of biomass feedstock into methane was in the present paper calculated to be somewhat higher for sugar beet, maize and wheat (grain) than in previous LCA’s, whereas it is estimated to be somewhat lower for ley crops [
20]. The primary energy input for the biogas production process, the upgrading and compression of the biogas, and the digestate storage, transport and spreading, showed that the biogas upgrading represents the dominating energy input (54%–70%). This was partly due to the high heat demand in the biogas upgrading with a chemical scrubber, and 75% of this heat was available for reuse in the heating of the biogas process, where it covered the whole heat demand with the exception in the case of hemp (96%) and ley crops (89%). Expressed as a percentage of the biofuel output the primary energy input varies between 25% (triticale) to 33% (hemp). Compared with previous LCI data, the primary energy input into the conversion system in this study was calculated to be almost similar for sugar beet and maize but somewhat higher for ley crops and wheat (grain) [
20].
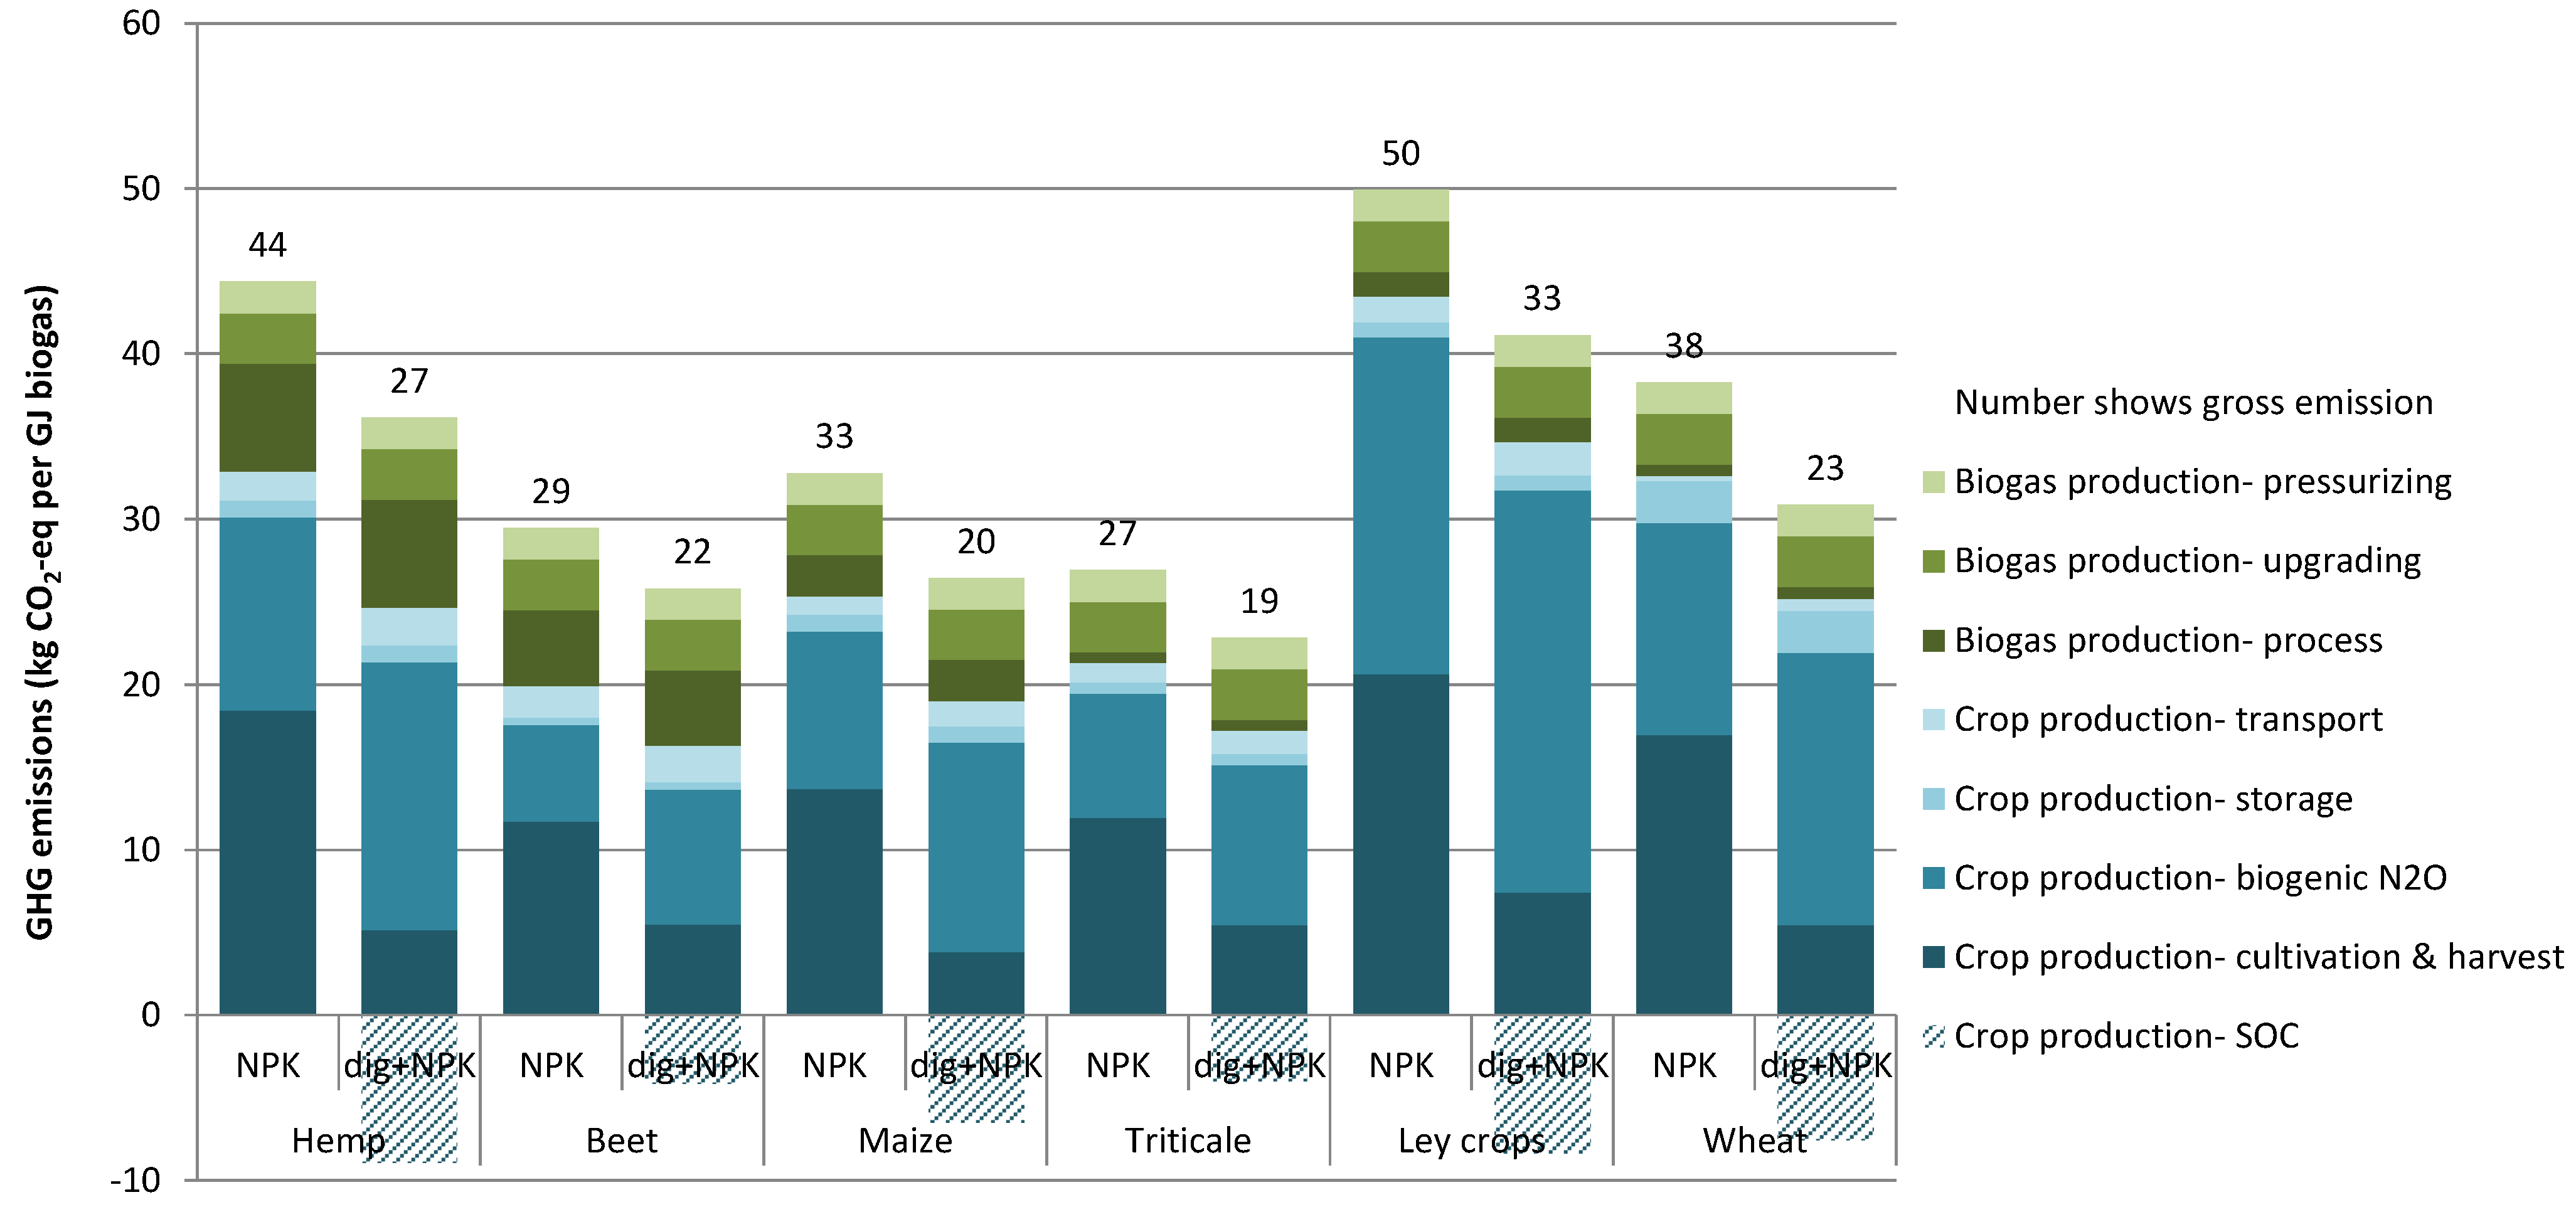
The emissions of GHG from the biogas production system, including upgrading and pressurising of the biogas, are shown in
Table 4. Transport and spreading of the digestate produced are included as an integrated part of the energy demand (and GHG emissions) of the process. Biogenic GHG emission during digestate storage is also included. A conclusion to be drawn from
Table 4 is that methane loss during the storage of digestate is one of the main contributors to the emissions of GHG in the biogas production step (excluding feedstock cultivation), together with the addition of nutrients in the biogas process regarding some energy crop feedstock. The total GHG emissions from the conversion system vary from approximately 4 kg (wheat and triticale) to 12 kg (hemp) CO
2-eq·GJ
−1 upgraded biogas. These calculated GHG emissions are somewhat lower than previous LCI data for biogas conversion systems [
20].
2.3. Credit of Digestate (Systems Expansion)
The recirculation of digestate leads to indirect energy and GHG benefits since it is assumed that digestate will replace mineral fertiliser in cultivation. These benefits were calculated based on the nutrient content in the digestate from the specific crop substrates, including the nutrients added in the biogas process. Added mineral nitrogen represents 46%, 54%, 33% and 4% of the NH
4-N shown in
Table 5 for hemp, sugar beet, maize and triticale, respectively.
Table 4.
Emissions of greenhouse gases from the conversion system of energy crops into upgraded and pressurised biogas, including recirculation of digestate, expressed as kg CO2-eq·GJ−1 biogas 1.
Table 4.
Emissions of greenhouse gases from the conversion system of energy crops into upgraded and pressurised biogas, including recirculation of digestate, expressed as kg CO2-eq·GJ−1 biogas 1.
| Crop | Process | Upgrad. | Press | Digestate | Methane losses | Amm. loss 2 | Total |
|---|
| El. | Heat3 | Nutr. add. | El. | Heat | El. | Load. | Transp. | Spread. | Up-grad. | Diges. storage | Diges. storage | |
|---|
| Hemp | 0.45 | 0.02 | 5.08 | 0.52 | 0.45 | 0.61 | 0.13 | 0.44 | 0.55 | 1.0 | 2.28 | 0.14 | 11.7 |
| | (0.35) | | | | | | | | | | | |
| Sugar beet | 0.29 | 0 | 3.65 | 0.52 | 0.45 | 0.61 | 0.08 | 0.16 | 0.34 | 1.0 | 0.63 | 0.08 | 7.80 |
| | (0.23) | | | | | | | | | | | |
| Maize | 0.24 | 0 | 1.74 | 0.52 | 0.45 | 0.61 | 0.06 | 0.13 | 0.27 | 1.0 | 1.06 | 0.07 | 6.14 |
| | (0.17) | | | | | | | | | | | |
| Triti-cale | 0.17 | 0 | 0.13 | 0.52 | 0.45 | 0.61 | 0.04 | 0.08 | 0.17 | 1.0 | 0.69 | 0.05 | 3.90 |
| | (0.11) | | | | | | | | | | | |
| Ley crops | 0.47 | 0.04 | 0 | 0.52 | 0.45 | 0.61 | 0.14 | 0.44 | 0.58 | 1.0 | 1.77 | 0.16 | 6.17 |
| | (0.38) | | | | | | | | | | | |
| Wheat (grain) | 0.22 | 0 | 0 | 0.52 | 0.45 | 0.61 | 0.06 | 0.19 | 0.24 | 1.0 | 0.44 | 0.07 | 3.80 |
| | (0.17) | | | | | | | | | | | |
Table 5.
Indirect savings of energy input and emissions of GHG’s when digestate replaces mineral fertiliser 1.
Table 5.
Indirect savings of energy input and emissions of GHG’s when digestate replaces mineral fertiliser 1.
| Crop | Nutrient amounts 2 kg· (GJ biogas)−1 | Energy savings 3 MJ· (GJ biogas)−1 | GHG savings 4 kg CO2-eq·(GJ biogas)−1 |
|---|
| | Nutrient rec. | Tot. | Nutrient rec. | N2O 5 | Soil C 6 | Tot. |
|---|
| N-org | NH4-N | P | K | N | P | K | N | P | K |
|---|
| Hemp | 1.35 | 1.45 | 0.41 | 1.56 | 71 | 7.8 | 9.1 | 87 | 9.7 | 1.2 | 0.7 | -9.2 | 30 | 33 |
| Beet | 0.58 | 0.89 | 0.12 | 0.56 | 44 | 2.3 | 3.3 | 49 | 6.0 | 0.4 | 0.2 | -4.5 | 6.9 | 9.0 |
| Maize | 0.69 | 0.70 | 0.16 | 0.43 | 34 | 3.1 | 2.5 | 40 | 4.7 | 0.5 | 0.2 | -4.6 | 16 | 17 |
| Triticale | 0.55 | 0.44 | 0.14 | 0.61 | 21 | 2.5 | 3.6 | 27 | 2.9 | 0.4 | 0.3 | -3.4 | 11 | 11 |
| Ley crops | 1.49 | 1.73 | 0.38 | 2.08 | 84 | 7.0 | 12 | 104 | 12 | 1.1 | 0.9 | -10 | 28 | 31 |
| Wheat (grain) | 0.54 | 0.92 | 0.39 | 0.42 | 45 | 7.4 | 2.4 | 55 | 6.2 | 1.1 | 0.2 | -4.3 | 6.6 | 9.8 |
Regarding the recirculation of N, only NH
4-N was assumed to replace mineral N (and not organically bound N, N-org), after subtraction of N losses during storage and spreading. The N loss as NH
3 during storage was estimated to be equivalent to 1% of the total N content in the digestate with no N
2O production (storage under cover without a covering of a natural crust) whereas the NH
3 loss during spreading was estimated to be equivalent to 10% of the NH
4-N content [
27]. The corresponding losses when mineral N was applied were 0.9% and 0.8% based on Swedish national GHG inventory data [
24]. In both cases, the volatilised NH
3 was assumed to give an indirect N
2O generation corresponding to 1% of the lost NH
4-N [
13]. The mean annual SOC stock change due to digestate application was modelled on the calculated C content in the digestate, based on the initial C content in the crop and on biodegradability.
4. Discussion and Conclusions
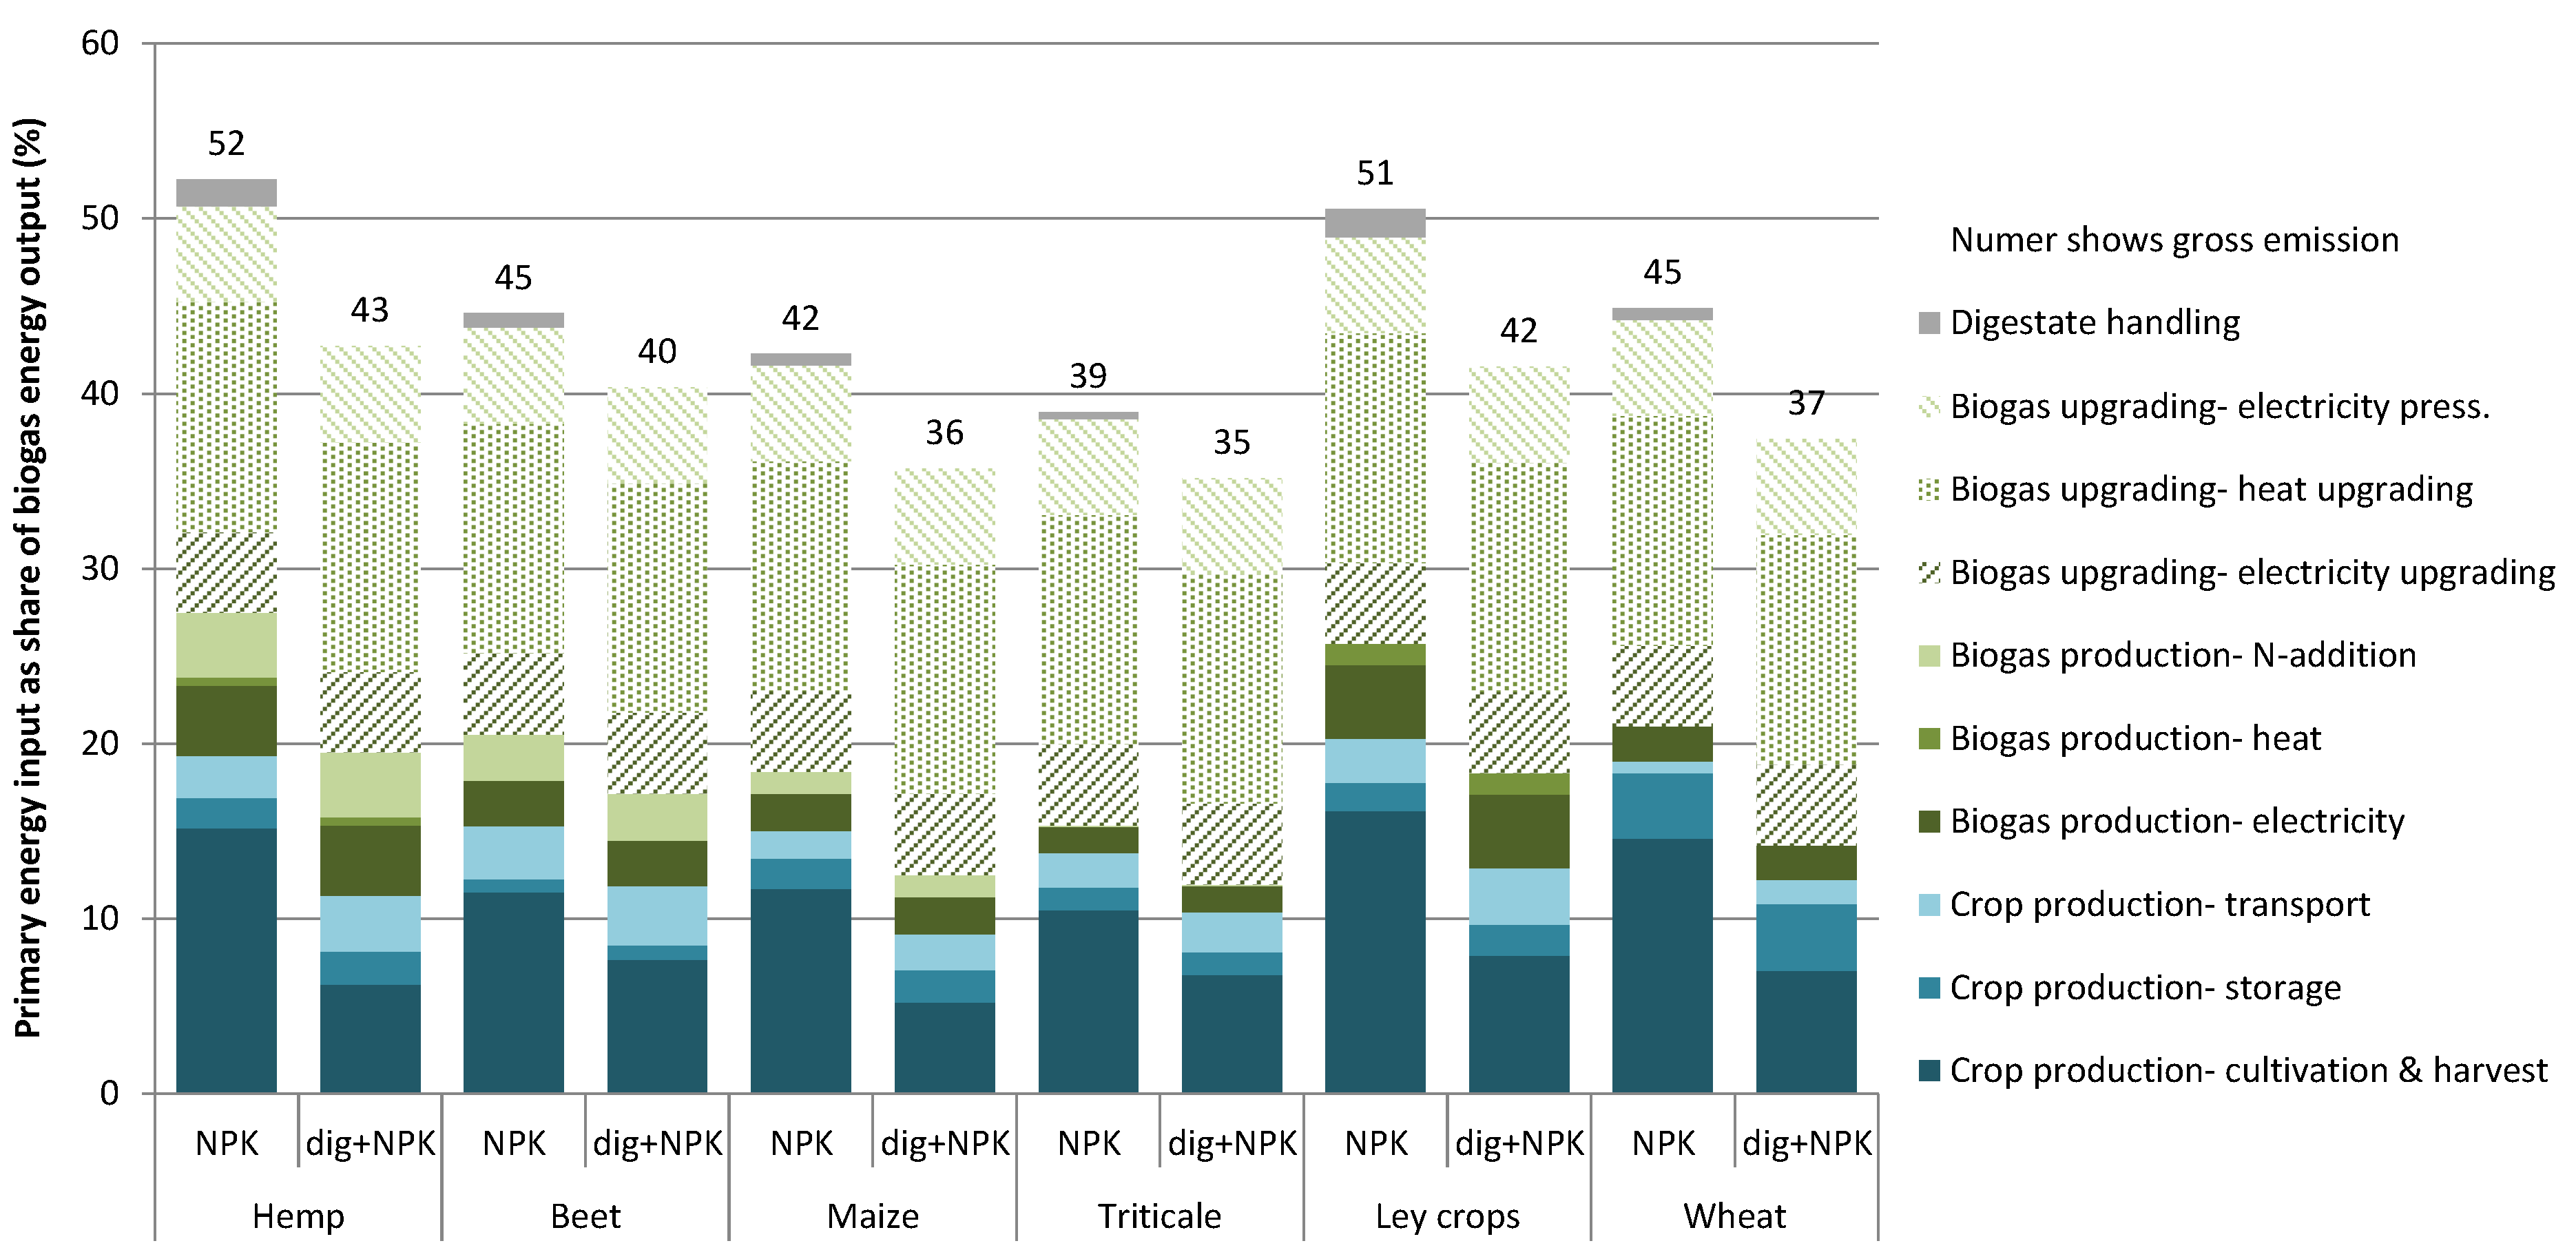
The energy efficiency performance of the crop-based biogas systems included in this assessment varied from 35% up to 44%, expressed as primary energy input per energy unit of vehicle gas produced. This is roughly equivalent, or somewhat higher, than the results of previous studies (e.g., Börjesson and Tufvesson [
20]; JRC [
2]). The present study, however, represents a more comprehensive and detailed assessment of the different types of energy inputs in the complete biogas production chain. Examples of energy inputs often not included in previous assessments are, for example, additional input of mineral nutrients in the biogas process needed for some individual feedstock, storage of harvested, crop-based feedstock during a non-cropping season, handling of digestate
etc. These additional energy inputs are one explanation for the somewhat higher primary energy input for some of the crop-based biogas systems in this study (e.g., ley crops).
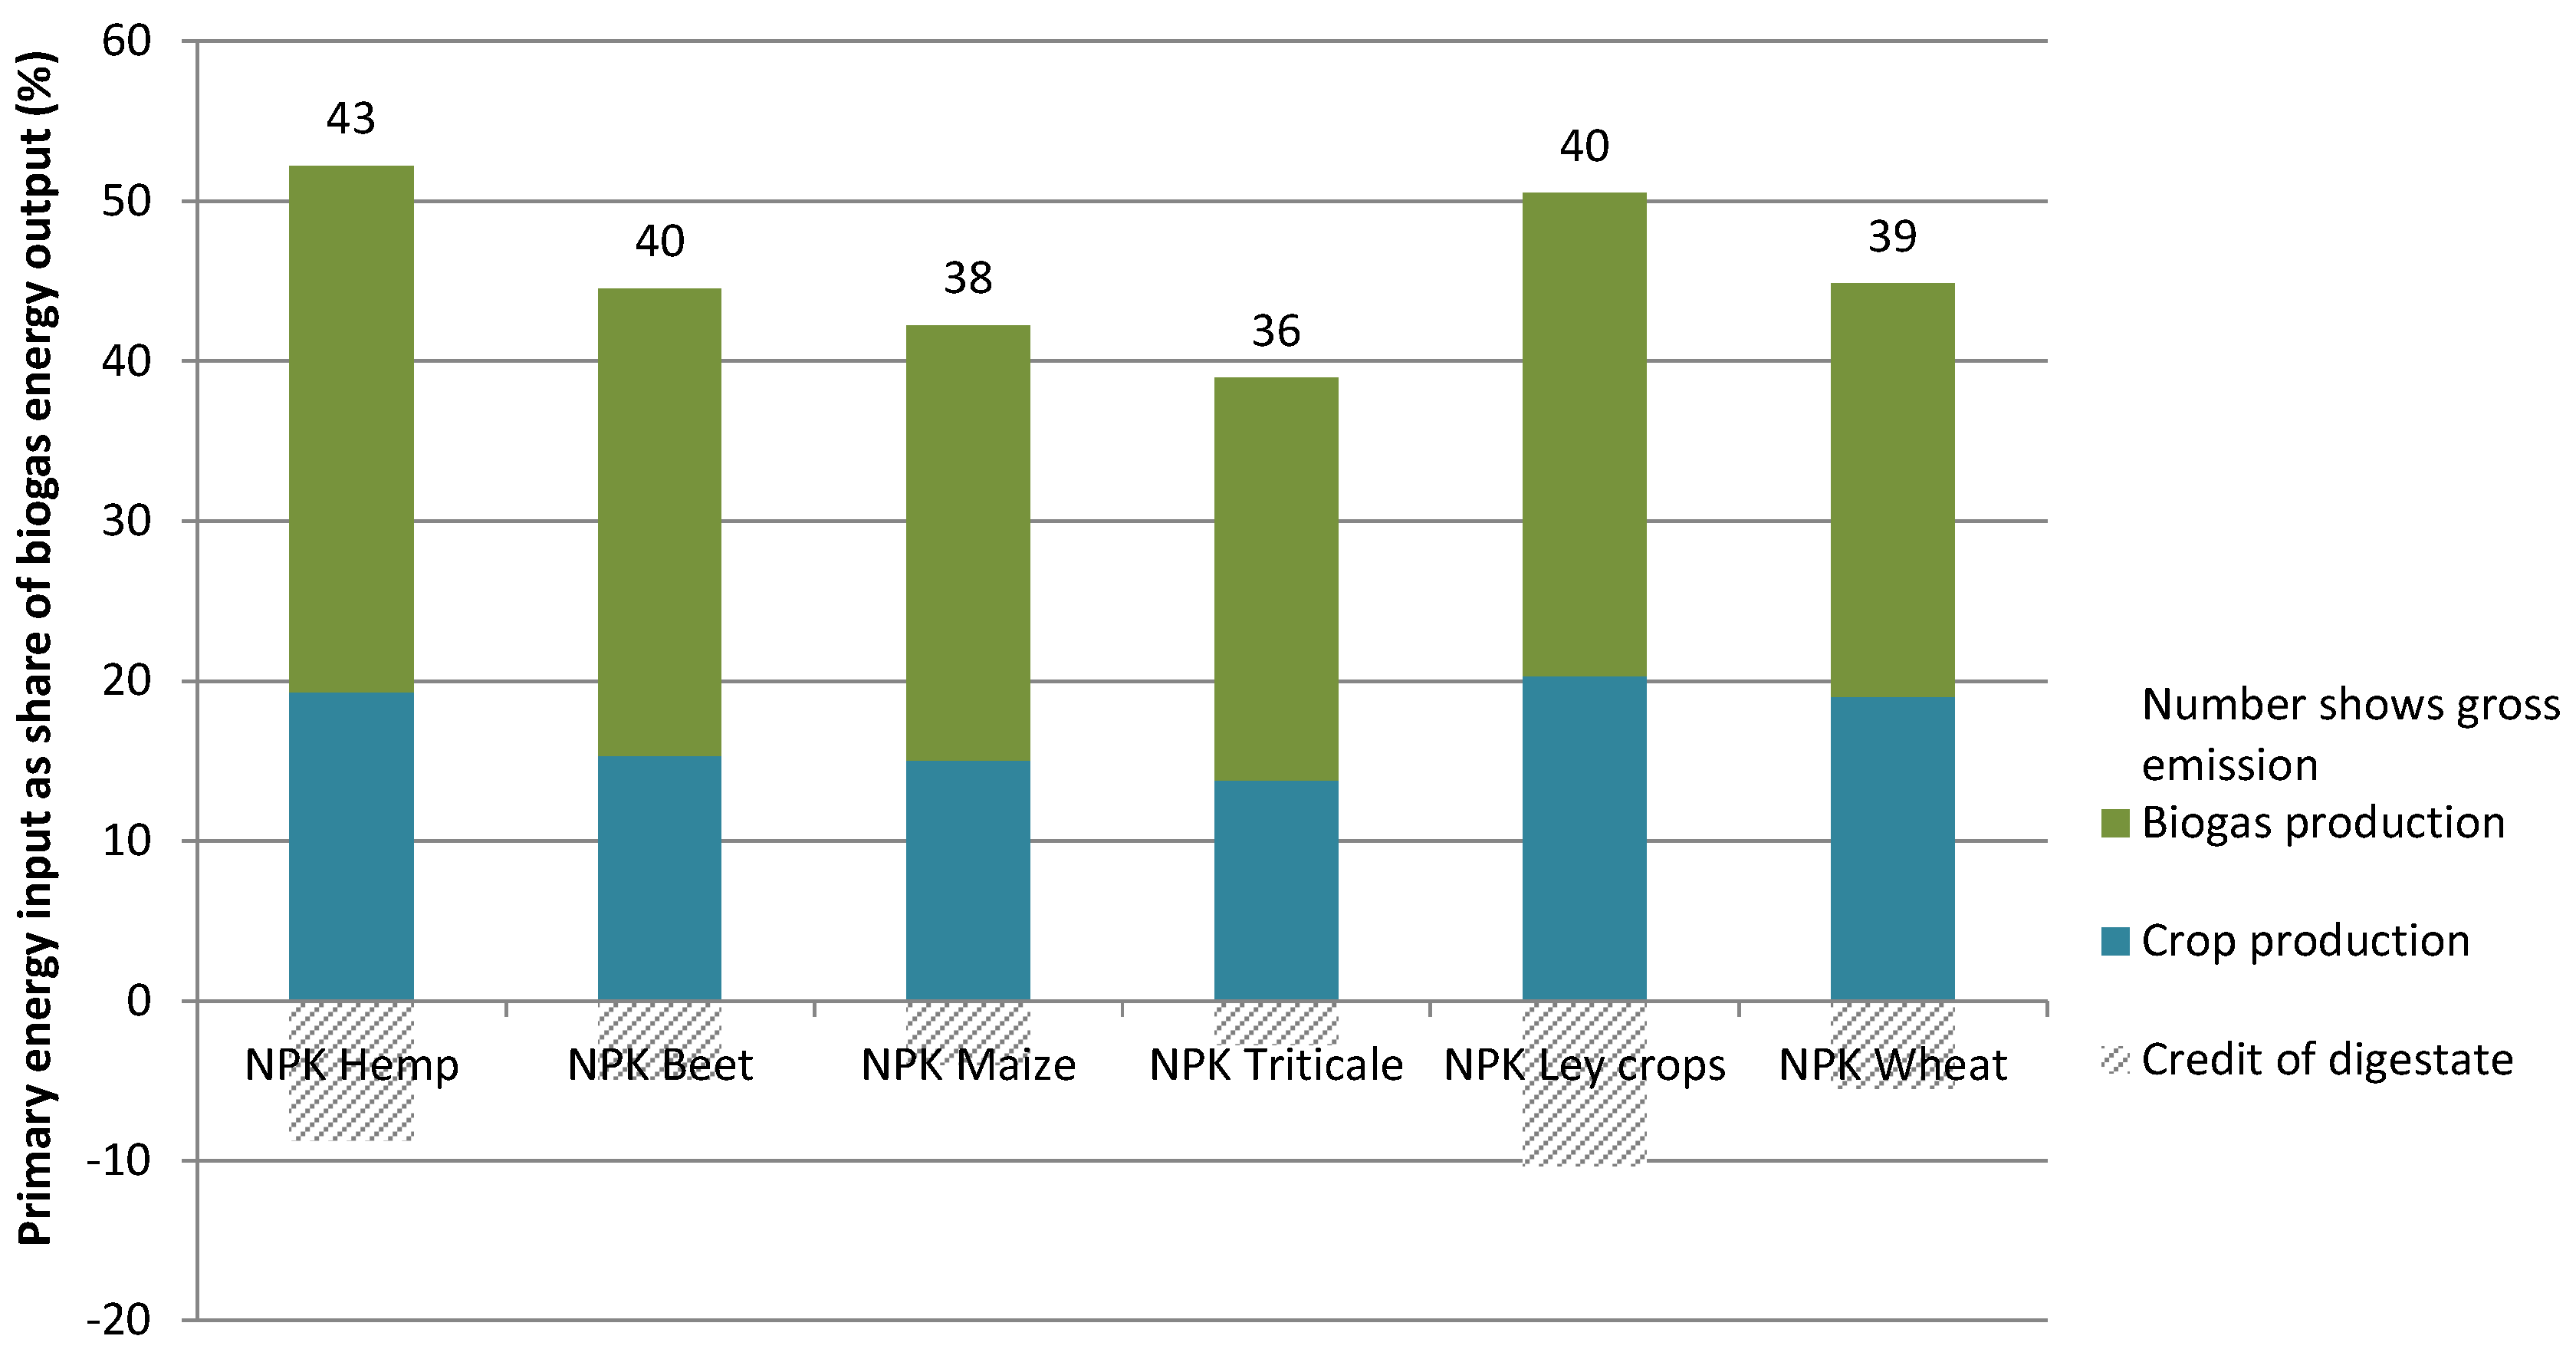
The main primary energy input in the systems studied were found to be in the upgrading and pressurisation of the produced biogas, often representing half, or more, of the total primary energy input. The upgrading technology selected here (chemical scrubber), required a large amount of heat, but this heat was to a large extent reused in the biogas process by means of heat exchangers. Consequently, the primary energy input in the biogas process was low in the biogas systems in this study compared to previous studies. The second largest category of primary energy input was the cultivation and harvest of the feedstock, approximately 25%–30% of the total primary energy input regarding crop production systems using mineral fertilisers in the cultivation. When digestate was used to replace mineral fertilisers, the primary energy input in cultivation and harvest represented approximately 15%–20% of the total primary input. Thus, the total primary energy input in crop-based biogas systems using digestate was, on average, 10%–20% lower than in systems using mineral fertilisers. Comparable results were, however, found when the systems boundaries were expanded for cultivation systems using mineral fertilisers and when the indirect energy credit of the produced digestate was included.
Among the individual crop-based systems, triticale had the highest energy efficiency, followed by maize, wheat, sugar beet, ley crops and hemp, when systems expansion was applied and the energy credit from the digestate was included. There was a particularly significant difference between the gross and net primary energy input in systems based on hemp and ley crops due to the rather high input of mineral nutrients in the biogas process to optimise the biogas yield. However, these mineral nutrients ended up in the digestate produced and were reused for the following crop and thereby replaced a larger amount of mineral fertilisers. This shows the importance of having a broad system perspective, also including indirect effects of crop-specific digestate in the energy assessments of crop-based biogas systems. The approach of nutrient addition to compensate for sub-optimal crop properties is somewhat theoretical, and in practice, the nutrient demand in the biogas process can often be solved by co-digestion with nutrient-rich feedstock, such as manure.
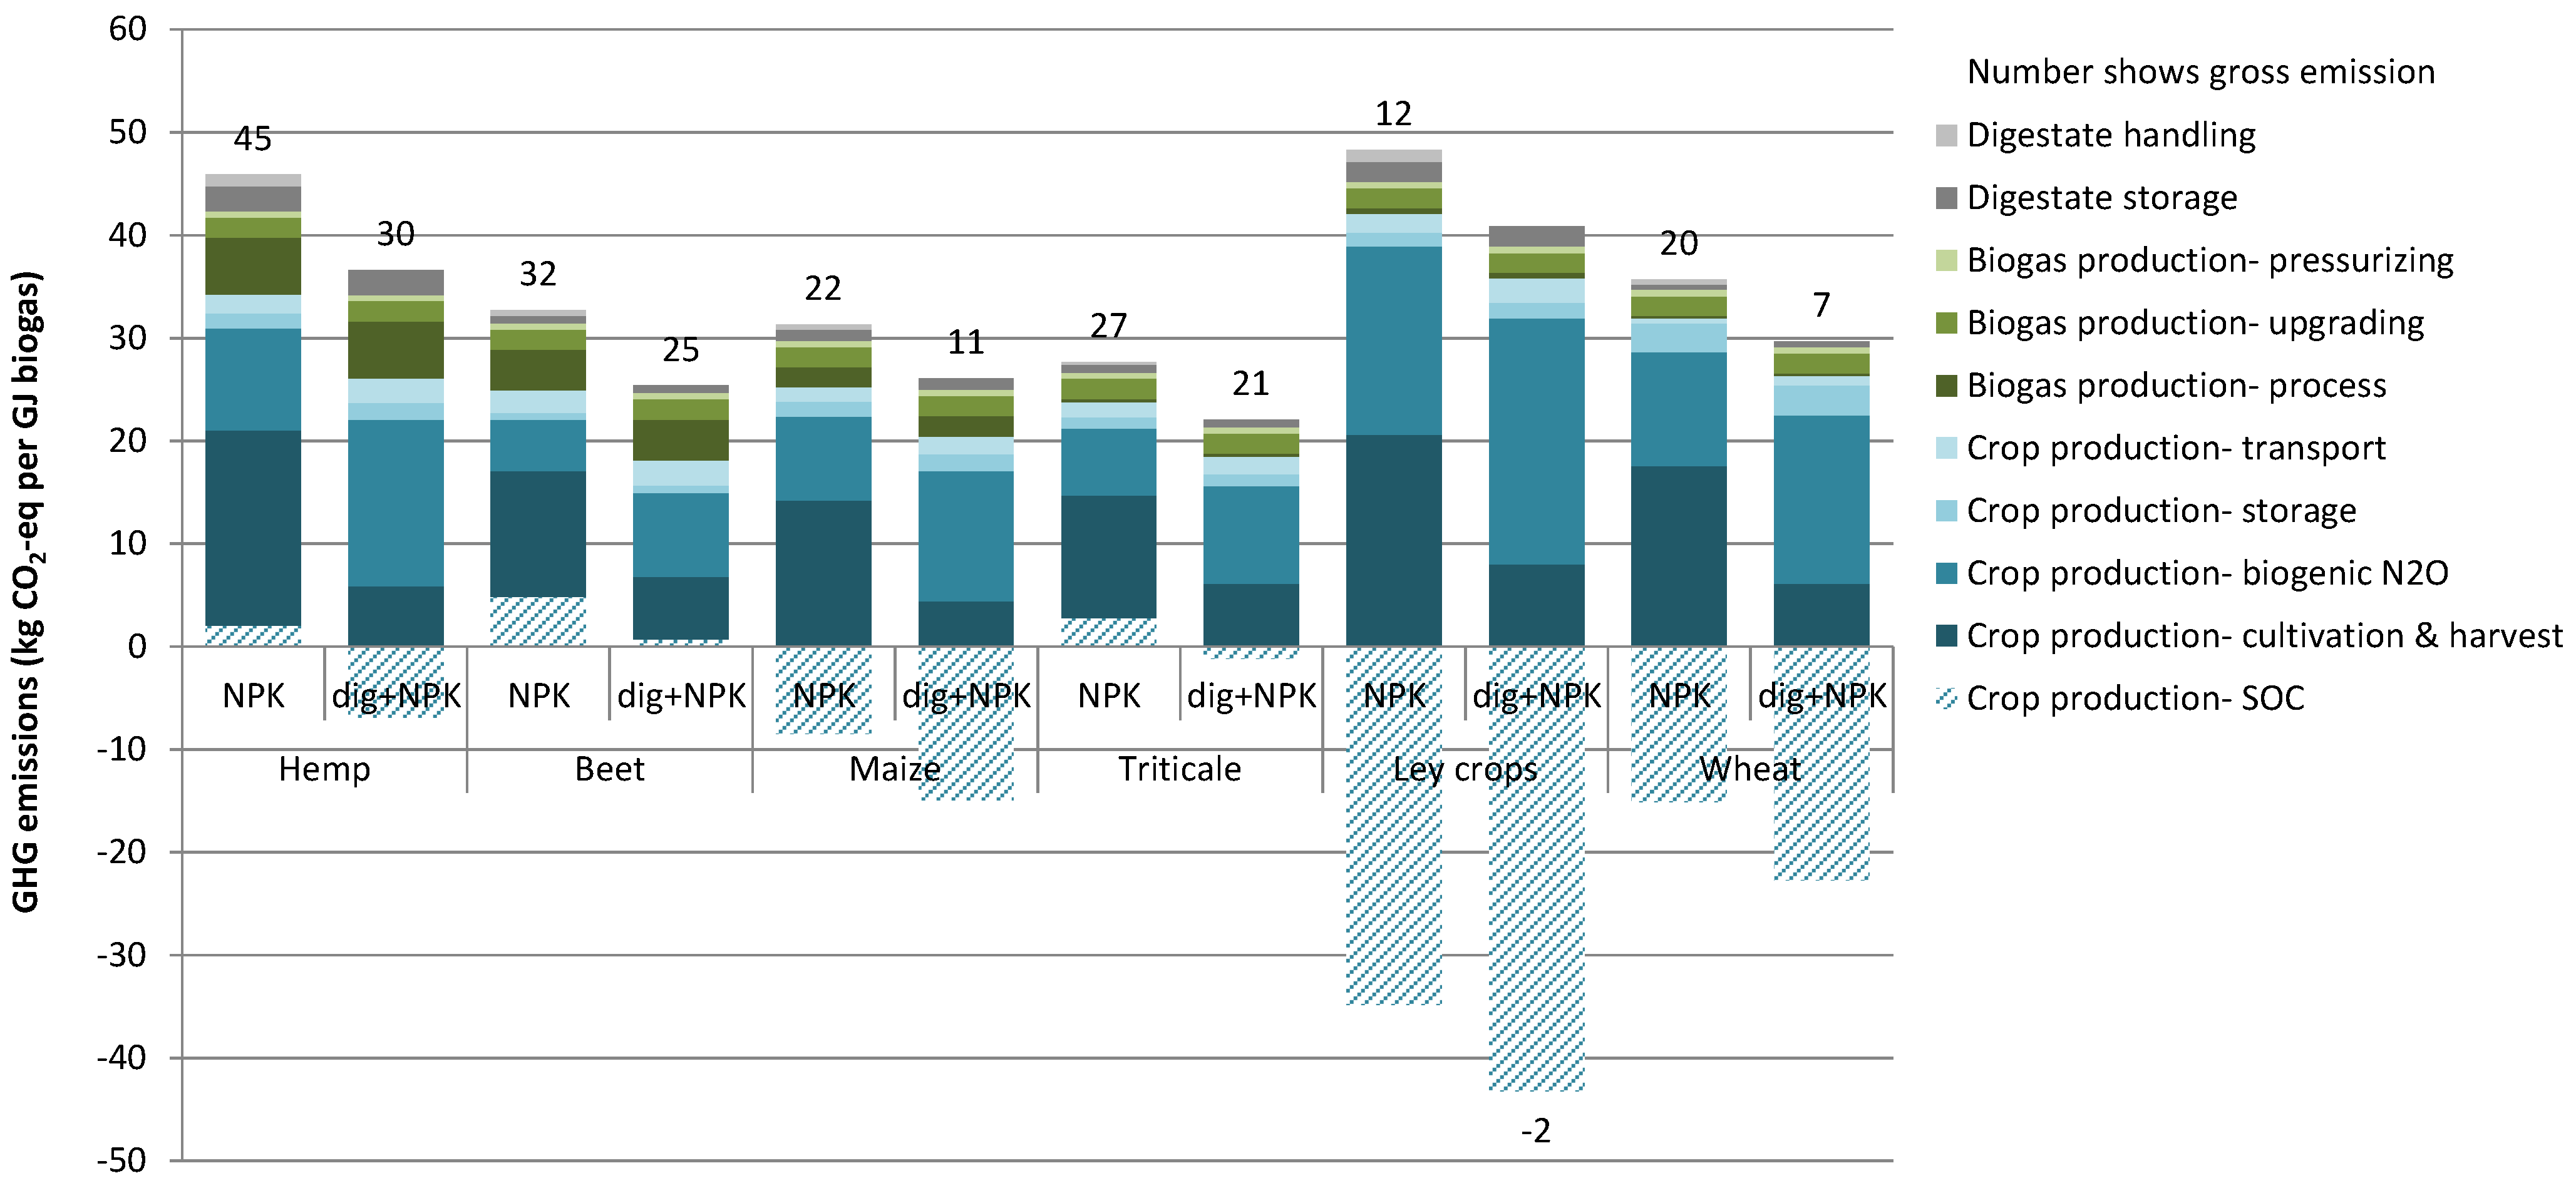
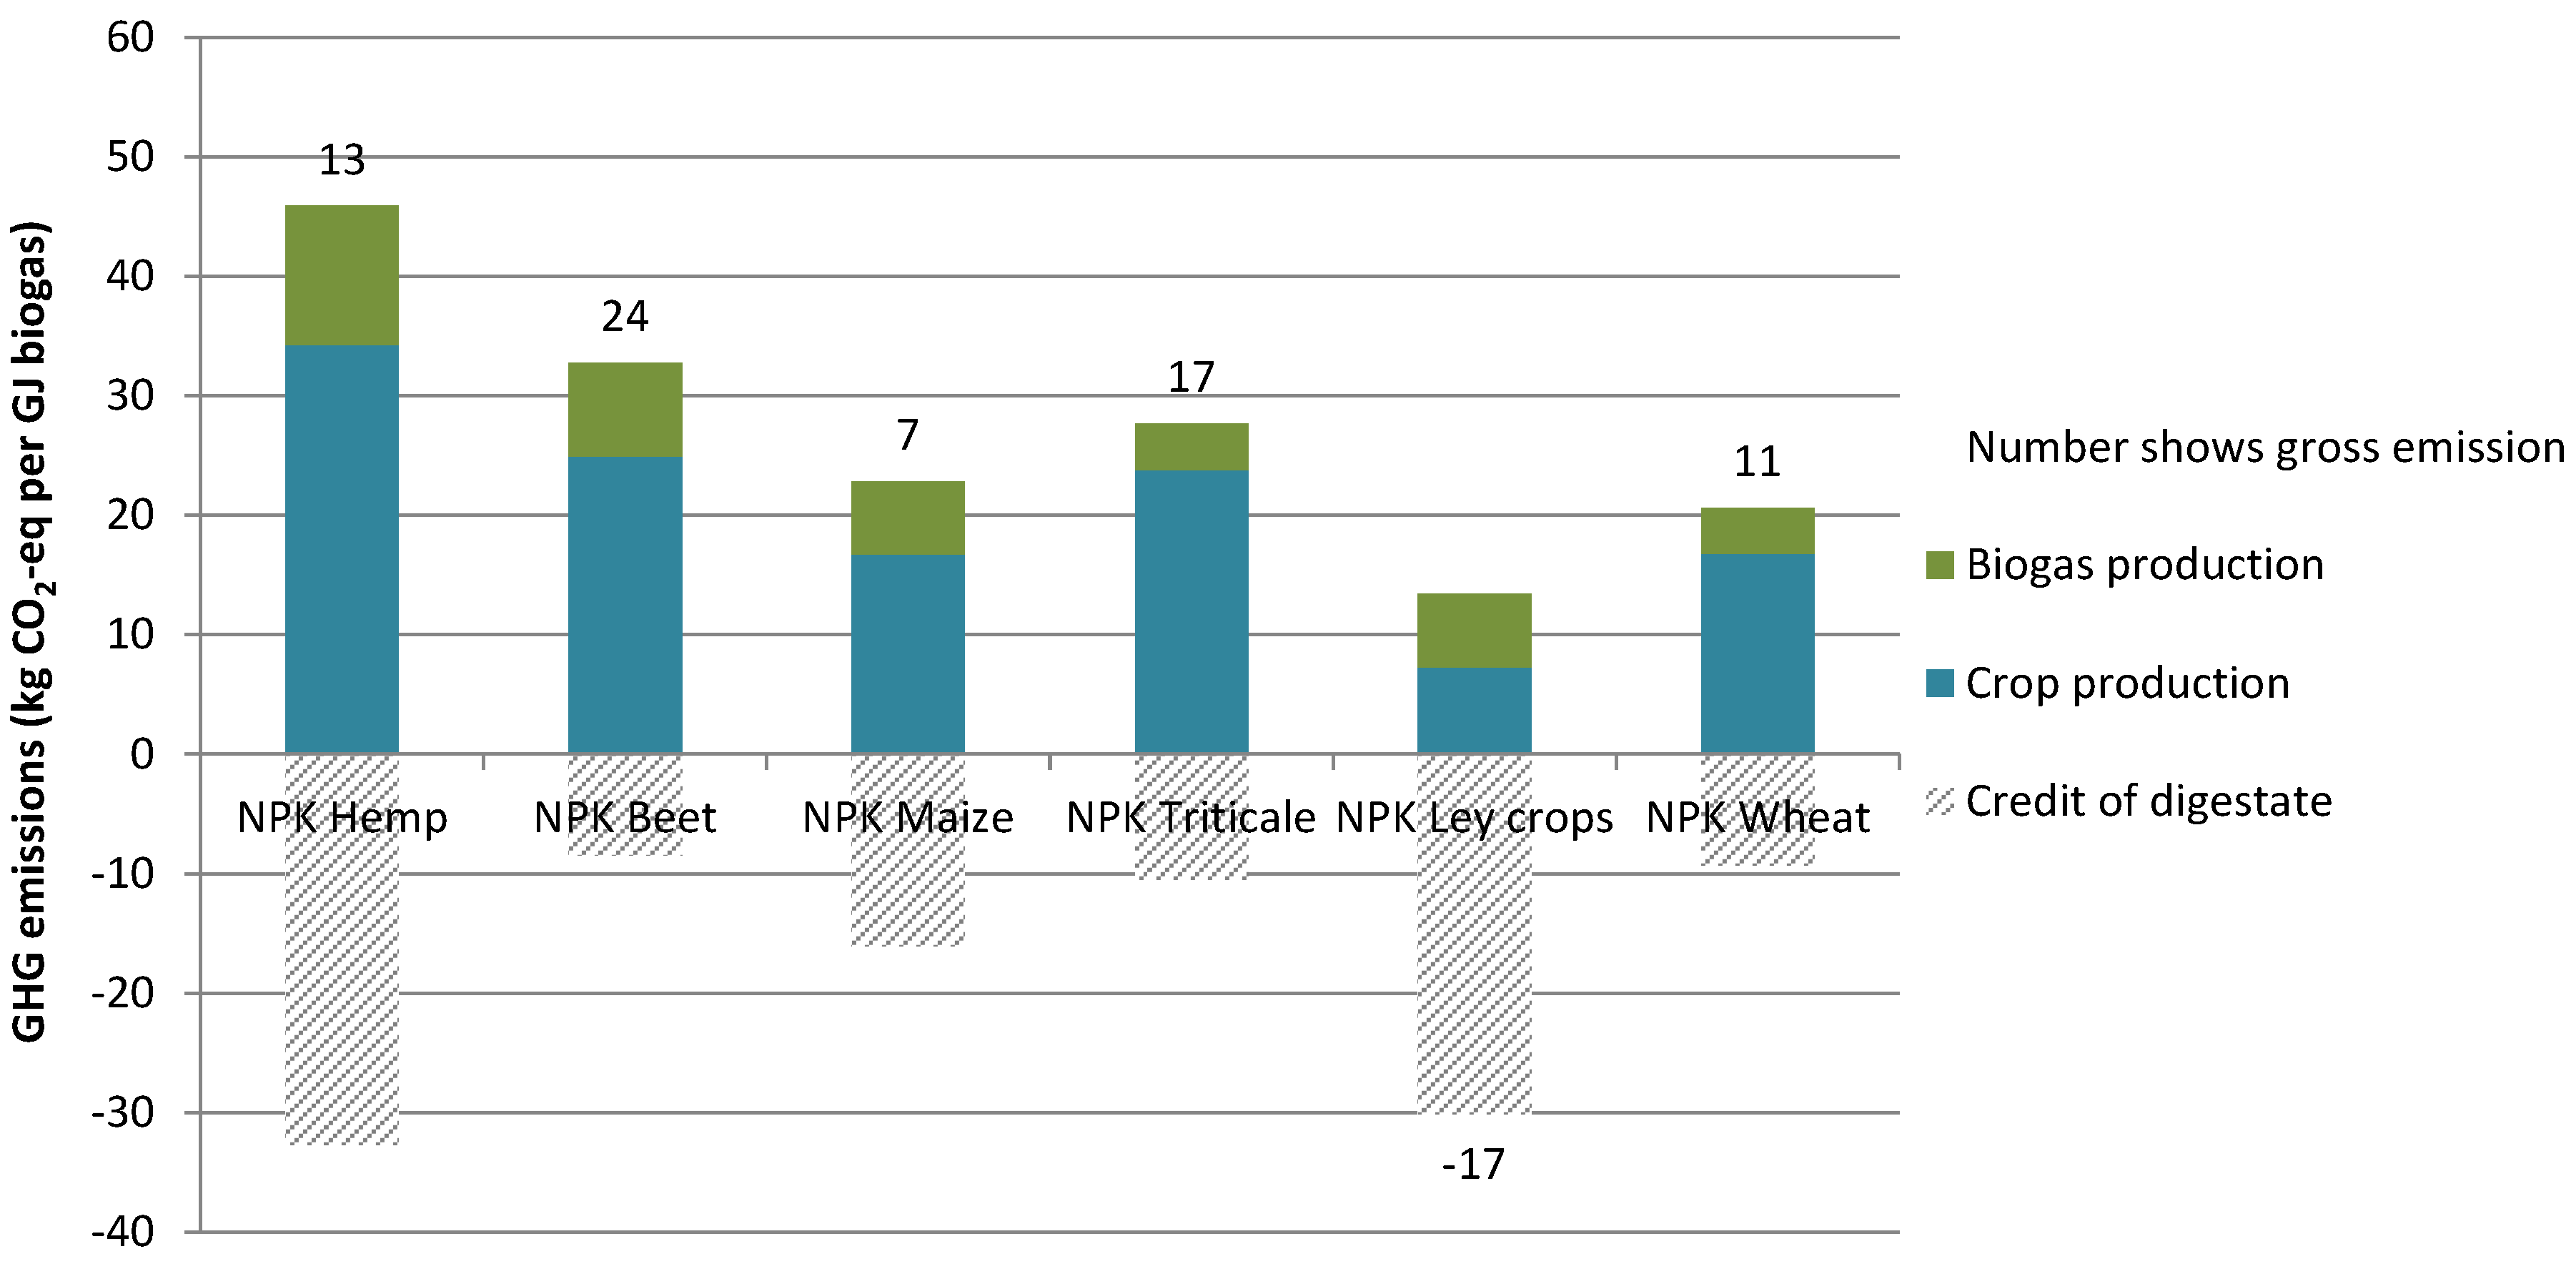
The GHG performance of the crop-based biogas systems varied between −17 and 24 g CO
2-eq·MJ
−1 vehicle fuel quality biogas when system expansion was applied, including the GHG credit of the digestate produced (ISO calculation methodology). Compared with petrol and diesel, these biogas systems led to a GHG reduction of 70% to 120%. Compared with previous studies, e.g., Börjesson and Tufvesson [
20] and JRC [
2], this study gave slightly different results, with most of the biogas systems (e.g., maize, ley crops and wheat) giving somewhat lower GHG emissions, while a few systems (e.g., sugar beet) gave somewhat higher emissions.
Ley crop-based biogas systems led to a “negative” net contribution of GHG emissions due to the significant SOC accumulation in these cultivation systems. Based on the specific regional conditions regarding soil characteristics and crop yields in this assessment, the results showed that the increase in SOC input in ley crop-based systems may be equivalent to approximately 70% of the fuel cycle GHG emissions. In general, the major part of the SOC accumulation normally originates in the cropping system, but the input from the digestate will also be of significant importance (and will vary among the crop systems).
The reference case in the SOC calculations was a maintained SOC level in the soil. This means that the individual crops and/or the whole crop rotations need to supply a certain amount of C to the soil to fulfil this criterion. All biogas systems except beet in this study fulfilled this criterion when digestate was used as fertiliser in the crop production. However, when only mineral fertilisers were used, also biogas systems based on triticale and hemp led to a loss in SOC, whereas systems based on maize and wheat (grain) where the straw was left in the field, and especially ley crops as discussed above, led to an increase in the SOC content. In order to maintain or preferably to increase SOC content as a measure of C sequestration, crops contributing to a net increase of SOC are necessary. However, the overall SOC balance of the whole crop rotation is a crucial factor for long-term development of SOC content. Thus, ley crops which have a substantial positive SOC balance effect can provide a solution when the other crops in the rotation do not contribute or even decrease SOC levels. However, assessments must then be performed on the crop production system/crop rotation level instead of on the individual crop level.
Expanding the systems boundaries to include SOC accumulation is of special importance for biogas feedstock, which has a lower biodegradability, leading to low biogas yields. Lower biogas yields from, for example, hemp- and ley crop-based feedstock, will, from a climate perspective, to a large extent be compensated for by a higher output of organic carbon in the digestate, leading to an increase in SOC accumulation. On the other hand, higher biogas yields from, for example, sugar beet- and wheat grain-based feedstock, result in a rather low output of organic carbon in the digestate and thereby a limited SOC accumulation from the digestate. Thus, the indirect GHG benefit in the form of SOC accumulation from digestate may be 3–4 times larger (per MJ upgraded biogas) in biogas systems based on hemp and ley crops, than in systems based on sugar beet and wheat grain.
The main contribution of GHG emissions originated from the cultivation, corresponding to approximately 60%–80% of the total fuel cycle emissions, where biogenic N2O emissions from the soil represented a significant part. The emissions of biogenic N2O were higher in systems in which digestate was utilised as fertiliser instead of mineral fertiliser. On the other hand, the GHG emissions from the production of mineral fertilisers are almost completely avoided in the systems using digestate and this GHG benefit is normally larger than the increase in biogenic N2O emissions from the digestate fertilisation.
The assessment performed in this paper included several uncertainties that may have affected the results in various ways. The level of biogenic N
2O emissions from the soil during crop cultivation is inherently uncertain, since these emissions are influenced by a large number of local parameters [
20]. Furthermore, there are no specific N
2O emission factors for digestate in the scientific literature, and therefore default values from the national inventory report [
24] or IPCC [
13] were used regarding organic fertilisers in general. To reduce these uncertainties, local biogenic N
2O emission factors specific for digestate fertilisers need to be developed. Another crucial parameter for the GHG performance of biogas systems was the level of methane leakage from the biogas process and upgrading, and from the storage of the digestate. These leakages must be kept to a minimum, specifically less than a few per cent, in order that the GHG performance does not significantly deteriorate. The assumed GHG emission level in the production of the mineral N fertiliser may also have affected the results in various ways.
Finally, the GHG calculation methodology selected is of significant importance for the GHG measured performance of biogas vehicle fuels. The GHG benefits of the crop-based biogas systems analysed will be reduced when the EU RED calculation methodology is utilised instead of the ISO calculation methodology (including a systems expansion approach). The EU RED calculation methodology does not include dLUC when existing cropland is utilised for biofuel production. Thus, biofuel systems based on perennial cellulosic crops, such as ley crops, are clearly disadvantaged by this methodology since the SOC sequestration from the cropping system is excluded. The current calculation methodology in RED thereby favours, for example, biofuel systems based on annual crops with limited input of organic matter to the soil, such as sugar beet-based biogas systems. When mineral fertilisers were used in cultivation, only three of the six crop-based biogas systems studied fulfilled the forthcoming 60% GHG reduction target in RED, namely, the food crops triticale, beet and maize. Biogas from wheat, hemp and ley crops will not meet this target under the conditions studied.
The calculation methodology in the RED, however, allows for the inclusion of potential GHG emission savings from SOC accumulation via improved agricultural management. One example of this is to use organic fertilisers, such as digestate, instead of mineral fertilisers. When this improved agricultural management was included, in the form of utilising digestate instead of mineral fertilisers, all the six biogas systems studied led to at least a 60% GHG reduction compared with the fossil fuel comparator.
The overall conclusion from the above comparison between the GHG calculation methods is that the current calculation methodology in RED strongly favours easily degradable biogas crops, leading to high biogas yields but insignificant SOC sequestration. Crops that fall into this category are usually sugar- or starch-rich food crops that are rather to be avoided in regard to the recent debate of iLUC effects. At the same time, the calculation methodology leads to significant disadvantages for perennial, cellulose-rich biogas crops which have a somewhat lower biogas yield but lead to a significantly higher SOC accumulation. A more holistic, comprehensive and adequate calculation method based on a systems expansion approach (recommended by ISO 14044 [
7]) shows that the overall GHG benefits from ley crop-based biogas may be considerably higher than from sugar beet-based biogas (even though both systems are superior to fossil liquid vehicle fuels). Thus, the current GHG calculation methodology in RED may be a potential hinder to the expansion of highly GHG efficient biogas vehicle fuels based on perennial, cellulose-rich crops. A recommendation, based on the findings in this paper, is therefore that the calculation methodology in the EU RED should be revised, from the current more narrow approach to a more holistic, systems expansion approach, which will promote the most efficient biofuel systems from a GHG performance perspective.
The issue of potential risks of iLUC from an expanding biofuel production from food crops has been intensively discussed within the EU RED in recent years. Suggestions exist that annual food crop-feedstock for biofuel production should be limited in various ways. The land-use efficiency regarding biomass production, and the following GHG reduction from the replacement of fossil-based vehicle fuels, is therefore of importance in reducing the risk of iLUC effects and maximising the climate benefits of the crop-based biogas vehicle fuels. By combining the methane yield per hectare and year for the different crop-based biogas systems, presented in Gissén
et al. [
10], and the GHG reduction per MJ of biogas vehicle fuel when petrol and diesel are replaced, as presented in this paper, the GHG reduction efficiency per hectare of arable land can be calculated. When the ISO calculation methodology is applied, including the GHG credit of digestate by system expansion, the GHG reduction per hectare of arable land will be highest for biogas systems based on beet (9.6 t CO
2-eq·ha
−1·year
−1), followed by maize and ley crops (8.0), wheat (6.4), triticale (6.1) and hemp (5.3). Both the order of the crop-based systems and the level of GHG reduction will be somewhat changed when the GHG calculation methodology is based on the EU RED for biofertilised crops. The results will then be: beet (10 t CO
2-eq·ha
−1·year
−1), maize (6.6), triticale (5.9), wheat (5.4), hemp (4.2), and ley crops (4.1). From a GHG reduction per ha perspective, an iLUC factor expressed per MJ biofuel will affect high-yielding crops more negatively than crops with lower yields. At the same time, high yielding crops may lead to a reduced risk of negative iLUC effects compared to low yielding crops with low land use efficiency.
Another important aspect to be considered in the evaluation of crop-based biogas systems is the cost efficiency. The calculated production costs for upgraded and compressed biogas of vehicle fuel quality for the various systems are, based on the results of Lantz
et al. [
11], 21 €·GJ
−1 for triticale and wheat, 25 €·GJ
−1 for sugar beet and maize, 26 €·GJ
−1 for ley crops, and 31 €·GJ
−1 for hemp. Thus, from an economical point of view, cereal-based biogas systems seem to be the most favourable. From both a GHG reduction per hectare and cost performance, hemp-based biogas systems hence seem less favourable, whereas the picture is not so clear for the other biogas systems.
By combining the production costs per GJ biogas and the GHG reduction potential per GJ, an aggregated evaluation of the GHG reduction and cost performance may be possible. Expressed as cost per GHG reduction, based on the ISO calculation methodology, the ley crop-based biogas system seems to perform best, 0.26 €·(kg CO2-eq)−1 reduced, followed by wheat, 0.29; triticale, 0.31; maize, 0.32; beet, 0.43 and hemp, 0.44. When the EU RED calculation methodology is applied, the result will be as follows: triticale, 0.32 €·(kg CO2-eq)−1 reduced; wheat, 0.35; maize, 0.39; beet, 0.41; ley crops, 0.52; and hemp, 0.55.
A conclusion from these complementary evaluation perspectives, and when the GHG calculation is based on the ISO methodology, is that ley crop-based biogas vehicle fuel systems seem to perform better than the other systems. The ley crop-based systems lead to a high GHG reduction per hectare and to a low cost per amount of GHG reduced. Other systems that perform relatively well are maize, followed by wheat. Biogas systems based on sugar beet lead to the highest GHG reduction per hectare, but also require the highest cost per amount of GHG reduced.
The sustainability assessment performed in this paper, and in the complementary studies presented by Gissén
et al. [
10] and Lantz
et al. [
11], illustrate the importance of applying a broad systems perspective in the evaluation of crop-based biofuel systems, in this case biogas vehicle fuel systems. Future studies should also include additional sustainability criteria, such as biodiversity, eutrophication
etc., to complete the picture even further. Broad systems studies, including the most crucial sustainability criteria, will be an increasingly valuable input in the development and revision of biofuel policies and political incentives, both nationally and on an international level.


