Article

A Study of Fuel Economy Improvement in a Plug-in Hybrid Electric Vehicle using Engine on/off and Battery Charging Power Control Based on Driver Characteristics

1
School of Mechanical Engineering, Sungkyunkwan University, 300 Chunchun-dong, Jangan-gu, Suwon 440-746, Korea
2
Korea Automotive Technology Institute, 330 Pungse-ro, Pungse-myeon, Cheonan-si, Chunggnam 330-910, Korea
*
Author to whom correspondence should be addressed.
Energies 2015, 8(9), 10106-10126; https://doi.org/10.3390/en80910106
Submission received: 17 April 2015 / Revised: 12 June 2015 / Accepted: 22 August 2015 / Published: 16 September 2015
(This article belongs to the Special Issue Advances in Plug-in Hybrid Vehicles and Hybrid Vehicles)

Abstract

:
In this study, driving data for various types of drivers are collected using a VIDE (virtual integrated driving environment), and a driver model is developed. To represent the driver tendencies quantitatively, the DDA (degree of driver aggression) is proposed based on fuzzy logic. DDA has a 0-1 value; the closer the DDA is to one, the more aggressive the driver. Using the DDA, an engine on/off and battery charging power control algorithm are developed to improve the fuel economy of a power-split-type plug-in hybrid electric vehicle. The engine on/off control reduces the frequent engine on/off caused by aggressive driving, whereas the battery charging power control maintains the battery state of charge (SOC) by operating the engine according to the DDA. It is found that the proposed control algorithm improves fuel economy by 17.3% compared to the existing control for an aggressive driver.

Graphical Abstract

1. Introduction

Despite fluctuating oil prices, changes in the global energy paradigm are unavoidable due to limited oil resources and increasing demand for energy in developing countries, such as China and India. Energy-related emissions account for 23% of carbon dioxide produced in the world, and among them, transport-related emissions account for 71%. Out of the 71%, 57% of emissions come from passenger vehicles. As a result, regulation of carbon dioxide emissions has been strengthened worldwide. For example, the EU, which has the strictest regulation, limited carbon dioxide emissions to 130 g/km driven in 2014, which will be reduced to 95 g by 2020 and to 59 g by 2030 [1,2].
To cope with future regulations, EV (electric vehicles), HEV (hybrid electric vehicles), PHEV (plug-in hybrid electric vehicles) and FCEV (fuel cell hybrid electric vehicles) have been developed. Among them, PHEV are of great interest, since PHEV have the strengths of an EV combined with the flexibility of an internal combustion engine (ICE) [3].
The fuel economy of an HEV or PHEV, equipped with ICE and an MG (motor/generator), is influenced significantly by driving mode (downtown/highway), the tendency of the driver (aggressive/cautious) or the surrounding environment (gradient/temperature/altitude). Besides the uncontrollable factors that cannot be changed by drivers, such as driving mode or the surrounding environment, driver behavior has a large effect on fuel economy [4,5]. HEV/PHEV perform a mode change from EV (electric vehicle) mode to HEV (hybrid electric vehicle) mode if the required power is high [6]. If the driver is wild, the driver’s acceleration (or braking) intention is often abrupt. Therefore, a mode change from EV to HEV (or HEV to EV) occurs frequently. This mode change increases electric energy loss due to the frequent engine on/off [7]. Furthermore, frequent sudden acceleration and deceleration result in increased energy loss, which increases fuel consumption and reduces battery SOC (state of charge). To solve these problems, a control strategy for mode change and engine on/off needs to be developed to reduce energy consumption based on driver characteristics. An optimization study of engine operation under extreme conditions was performed for a transmission-mounted electric device-type parallel HEV to maintain battery SOC by controlling the mode change condition between EV and HEV mode according to the driving mode, the tendency of the driver and the surrounding environment [8]. However, since the mode change control algorithm varies with the configuration of the HEV/PHEV, the control strategy should be developed considering the vehicle structure.
In this study, a driver model that can reflect the driver’s aggressiveness was developed using a virtual integrated driving environment, and the degree of driver aggression was introduced to represent driver behavior quantitatively. To improve the fuel economy of a target PHEV, an engine on/off and battery charging power control algorithm were developed based on the degree of driver aggression.

2. Development of the Powertrain System and Performance Simulator

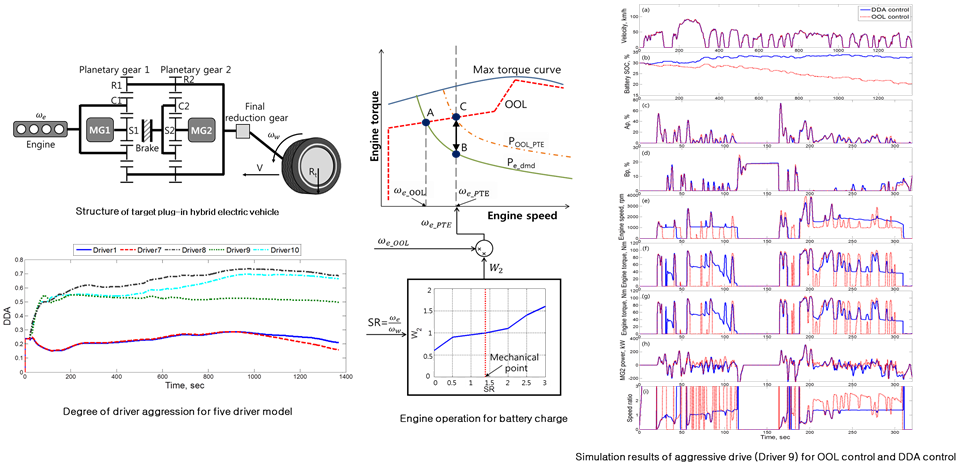
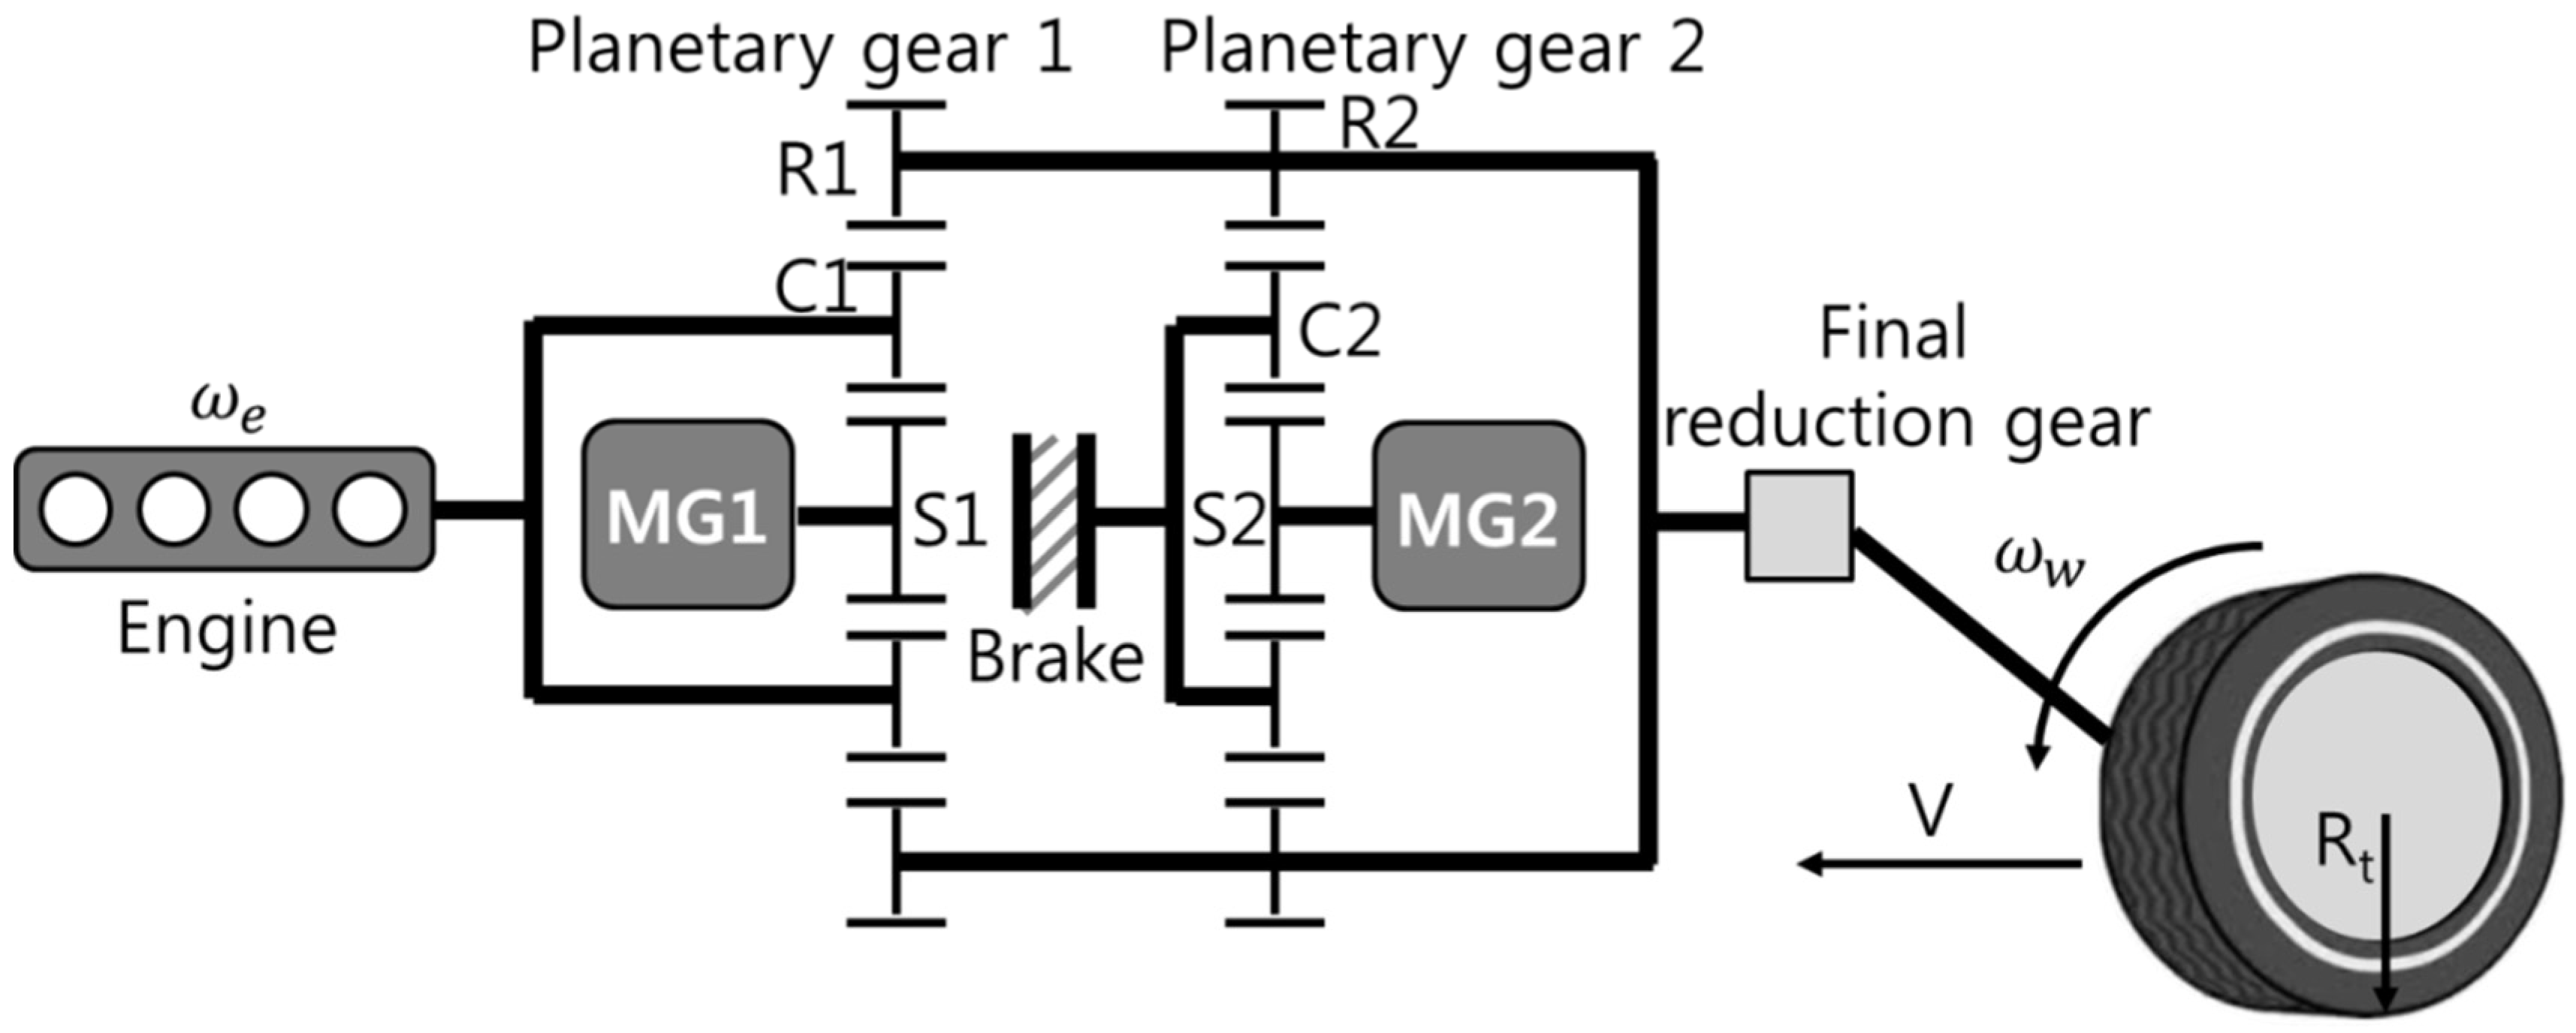
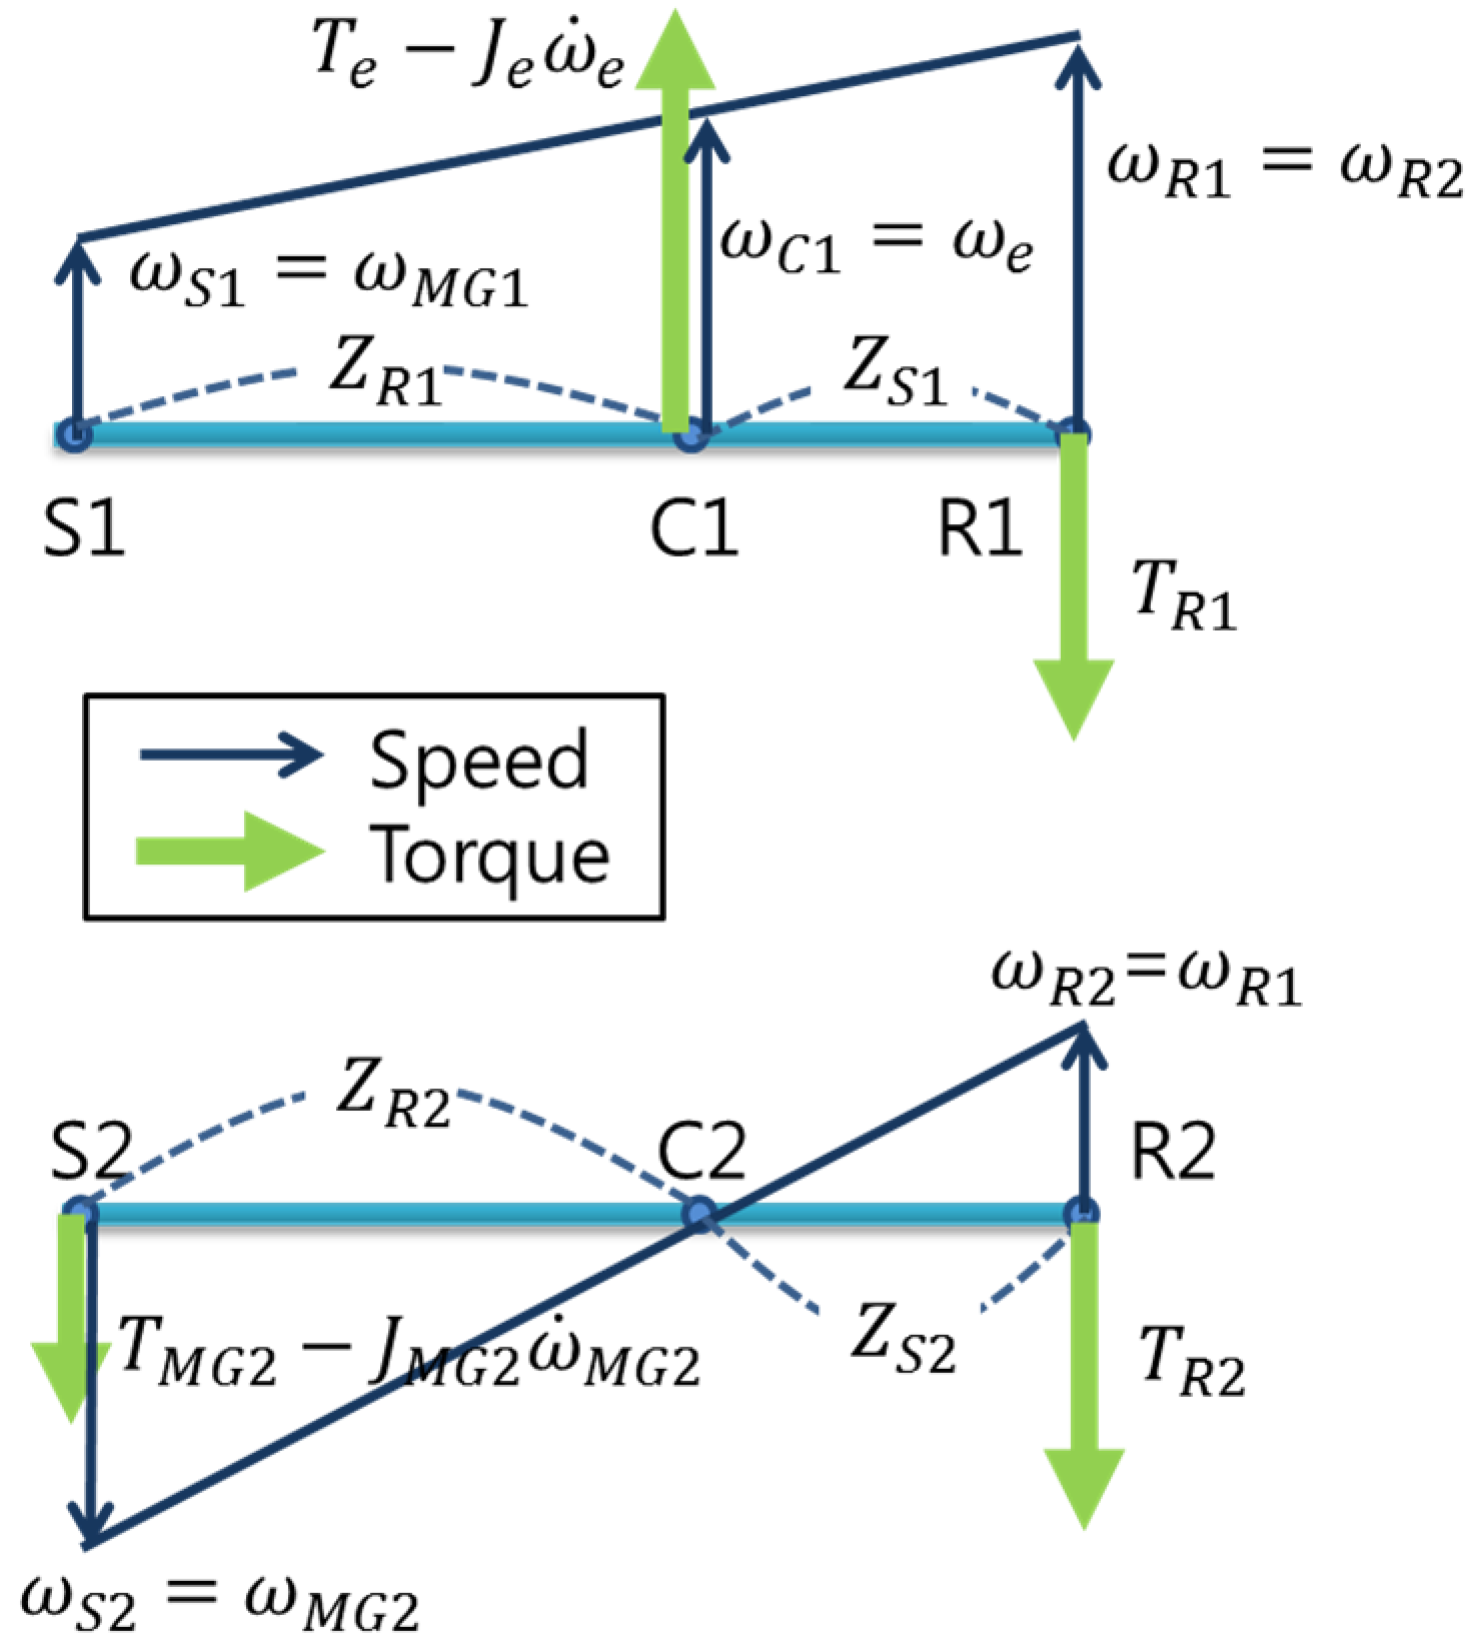
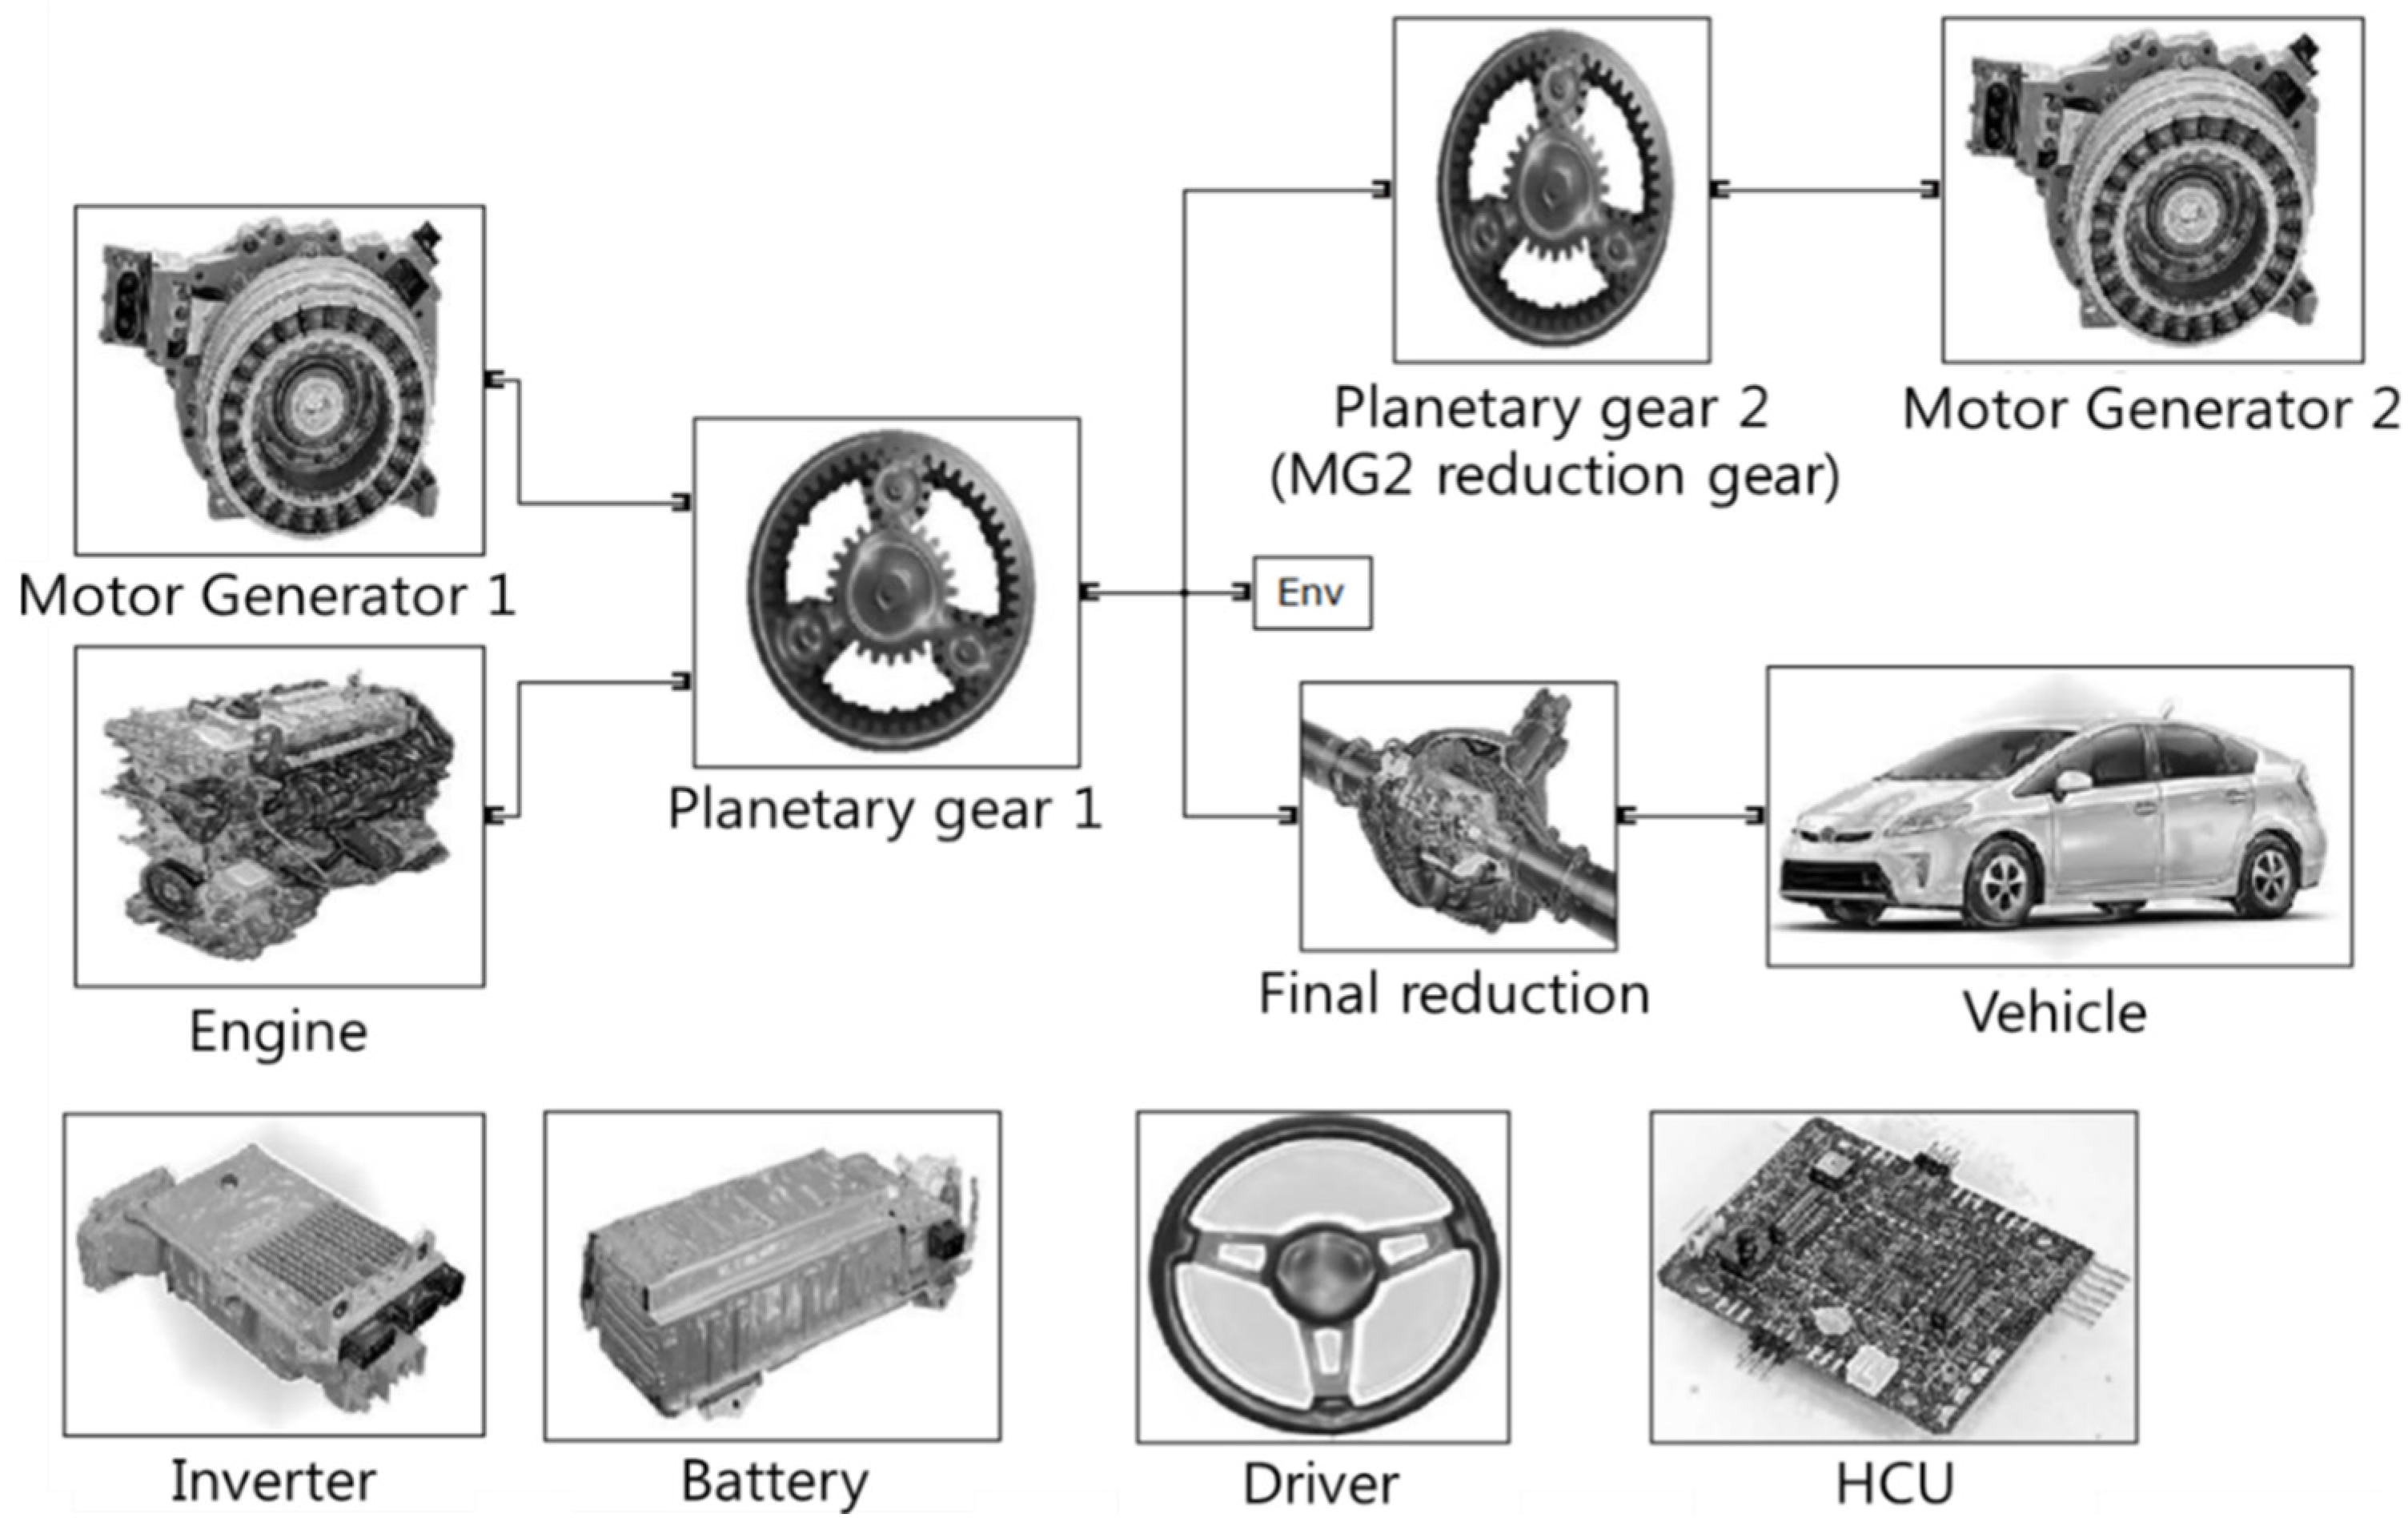
2.1. Powertrain System Modeling of the PHEV

As the target PHEV, a plug-in Prius, which is a power-split type, was selected. A plug-in Prius has two sets of planetary gears, two motor/generators, MG1 and MG2, and an engine. Figure 1 shows the structure of the plug-in Prius, and Table 1 summarizes the main specifications. Carrier C1 is connected to the engine, and Carrier C2 is always connected to the brake.
Powertrain system models were obtained for the target PHEV.
Engine: For the engine torque model, the fuel cut torque map is used if the engine speed is less than an idle speed. If the engine speed is larger than the idle speed, a steady-state characteristic map is used. The engine’s torque is represented with first-order dynamics as:
{ T e = T e _ f r i c t i o n = f ( ω e ) , ω e < ω i d l e T e = 1 τ e s + 1 f ( θ , ω e ) , ω e ω i d l e
where T e is the engine torque, T e _ f r i c t i o n is the friction torque, ω e is the engine speed, ω i d l e is the engine idle speed and θ is the engine throttle opening.
Figure 1. Structure of target plug-in hybrid electric vehicle. C1: Carrier 1; MG: motor/generator.
Energies 08 10106 g001
Table 1. Specifications of the target PHEV (plug-in Prius) [9,10,11].
ComponentsType Specifications
Engine1.8 L gasoline 4-cylinder Atkinson engineMax engine torque142 Nm
Max engine output73 kW
MotorSynchronous AC motorMax output60 kW
Max torque207 Nm
Max speed13,900 rpm
Max current170 Arms
BatteryLithium-ionCapacity4.4 kWh
Max output27 kW
Voltage201.6 V
Curb weight1420 kg
Motor reduction gear ratio (planetary gear ratio ZR2/ZS2)2.636
Final reduction gear ratio3.267
Motor/generator: The target vehicle uses two synchronous AC motors, MG1 and MG2. The motor characteristic map with efficiency was used as the MG1/MG2 model. The input/output power of the motor/generator can be represented as:
{ P i n p u t = T M G × ω M G η M G f o r m o t o r i n g P o u t p u t = T M G × ω M G × η M G f o r g e n e r a t i n g
where P i n p u t is the motoring power, P o u t p u t is the generating power, T is the motor torque, ω is the speed and η is the efficiency.
Battery: The battery of the target PHEV was modelled based on the open circuit voltage according to the SOC [12] and heat loss according to impedance and battery current. The battery SOC can be obtained as follows:
S O C = S O C i n i t i a l + 0 t - i Q d t
where i is the battery current and Q is the battery capacity.
Planetary gear: The target PHEV is a power-split type using two planetary gear sets. As shown in Figure 1, MG2 is connected to the wheel, which is able to provide the EV mode using the MG2. The engine is connected to MG1 through the carrier C1, thereby being controlled by MG1 independent of the vehicle speed. To calculate the speed and torque of MG1, MG2 and the engine, a lever analysis was conducted for the speed and torque, as shown in Figure 2.
The torque of the ring gear in Planetary Gear 1, which is connected directly to the drive shaft, can be obtained from the lever analysis as follows:
T R = T R 1 + T R 2 = Z R 1 Z S 1 + Z R 1 ( T e J e ω ˙ e ) + Z R 2 Z S 2 ( T M G 2 J M G 2 ω˙ M G 2 )
where T is the torque, Z is the number of gear teeth and J is the rotational inertia. Subscript R refers to the ring gear, S the sun gear, C the carrier, MG the motor/generator; 1 and 2 refer to the Planetary Gears 1 and 2, respectively.
Vehicle dynamics: The vehicle dynamics of the target PHEV are represented as:
M d V d t = F t r a c t i o n F r o a d l o a d
where M is the vehicle mass, V is the velocity, F t r a c t i o n is the tractive force and F r o a d l o a d is the road load.
Control algorithm: For the target PHEV, the engine is controlled to operate on the optimal operating line (OOL), which provides the minimum fuel consumption for the required vehicle power. The engine demanded speed ( ω e _ O O L ) is determined from the OOL for the required engine power, P e _ d m d [13]. MG1 is controlled to make the engine operate on the OOL, whereas MG2 is controlled to satisfy the wheel torque according to the driver’s acceleration (or deceleration) intention.
Figure 2. Lever analysis of the planetary gear for speed and torque.
Energies 08 10106 g002

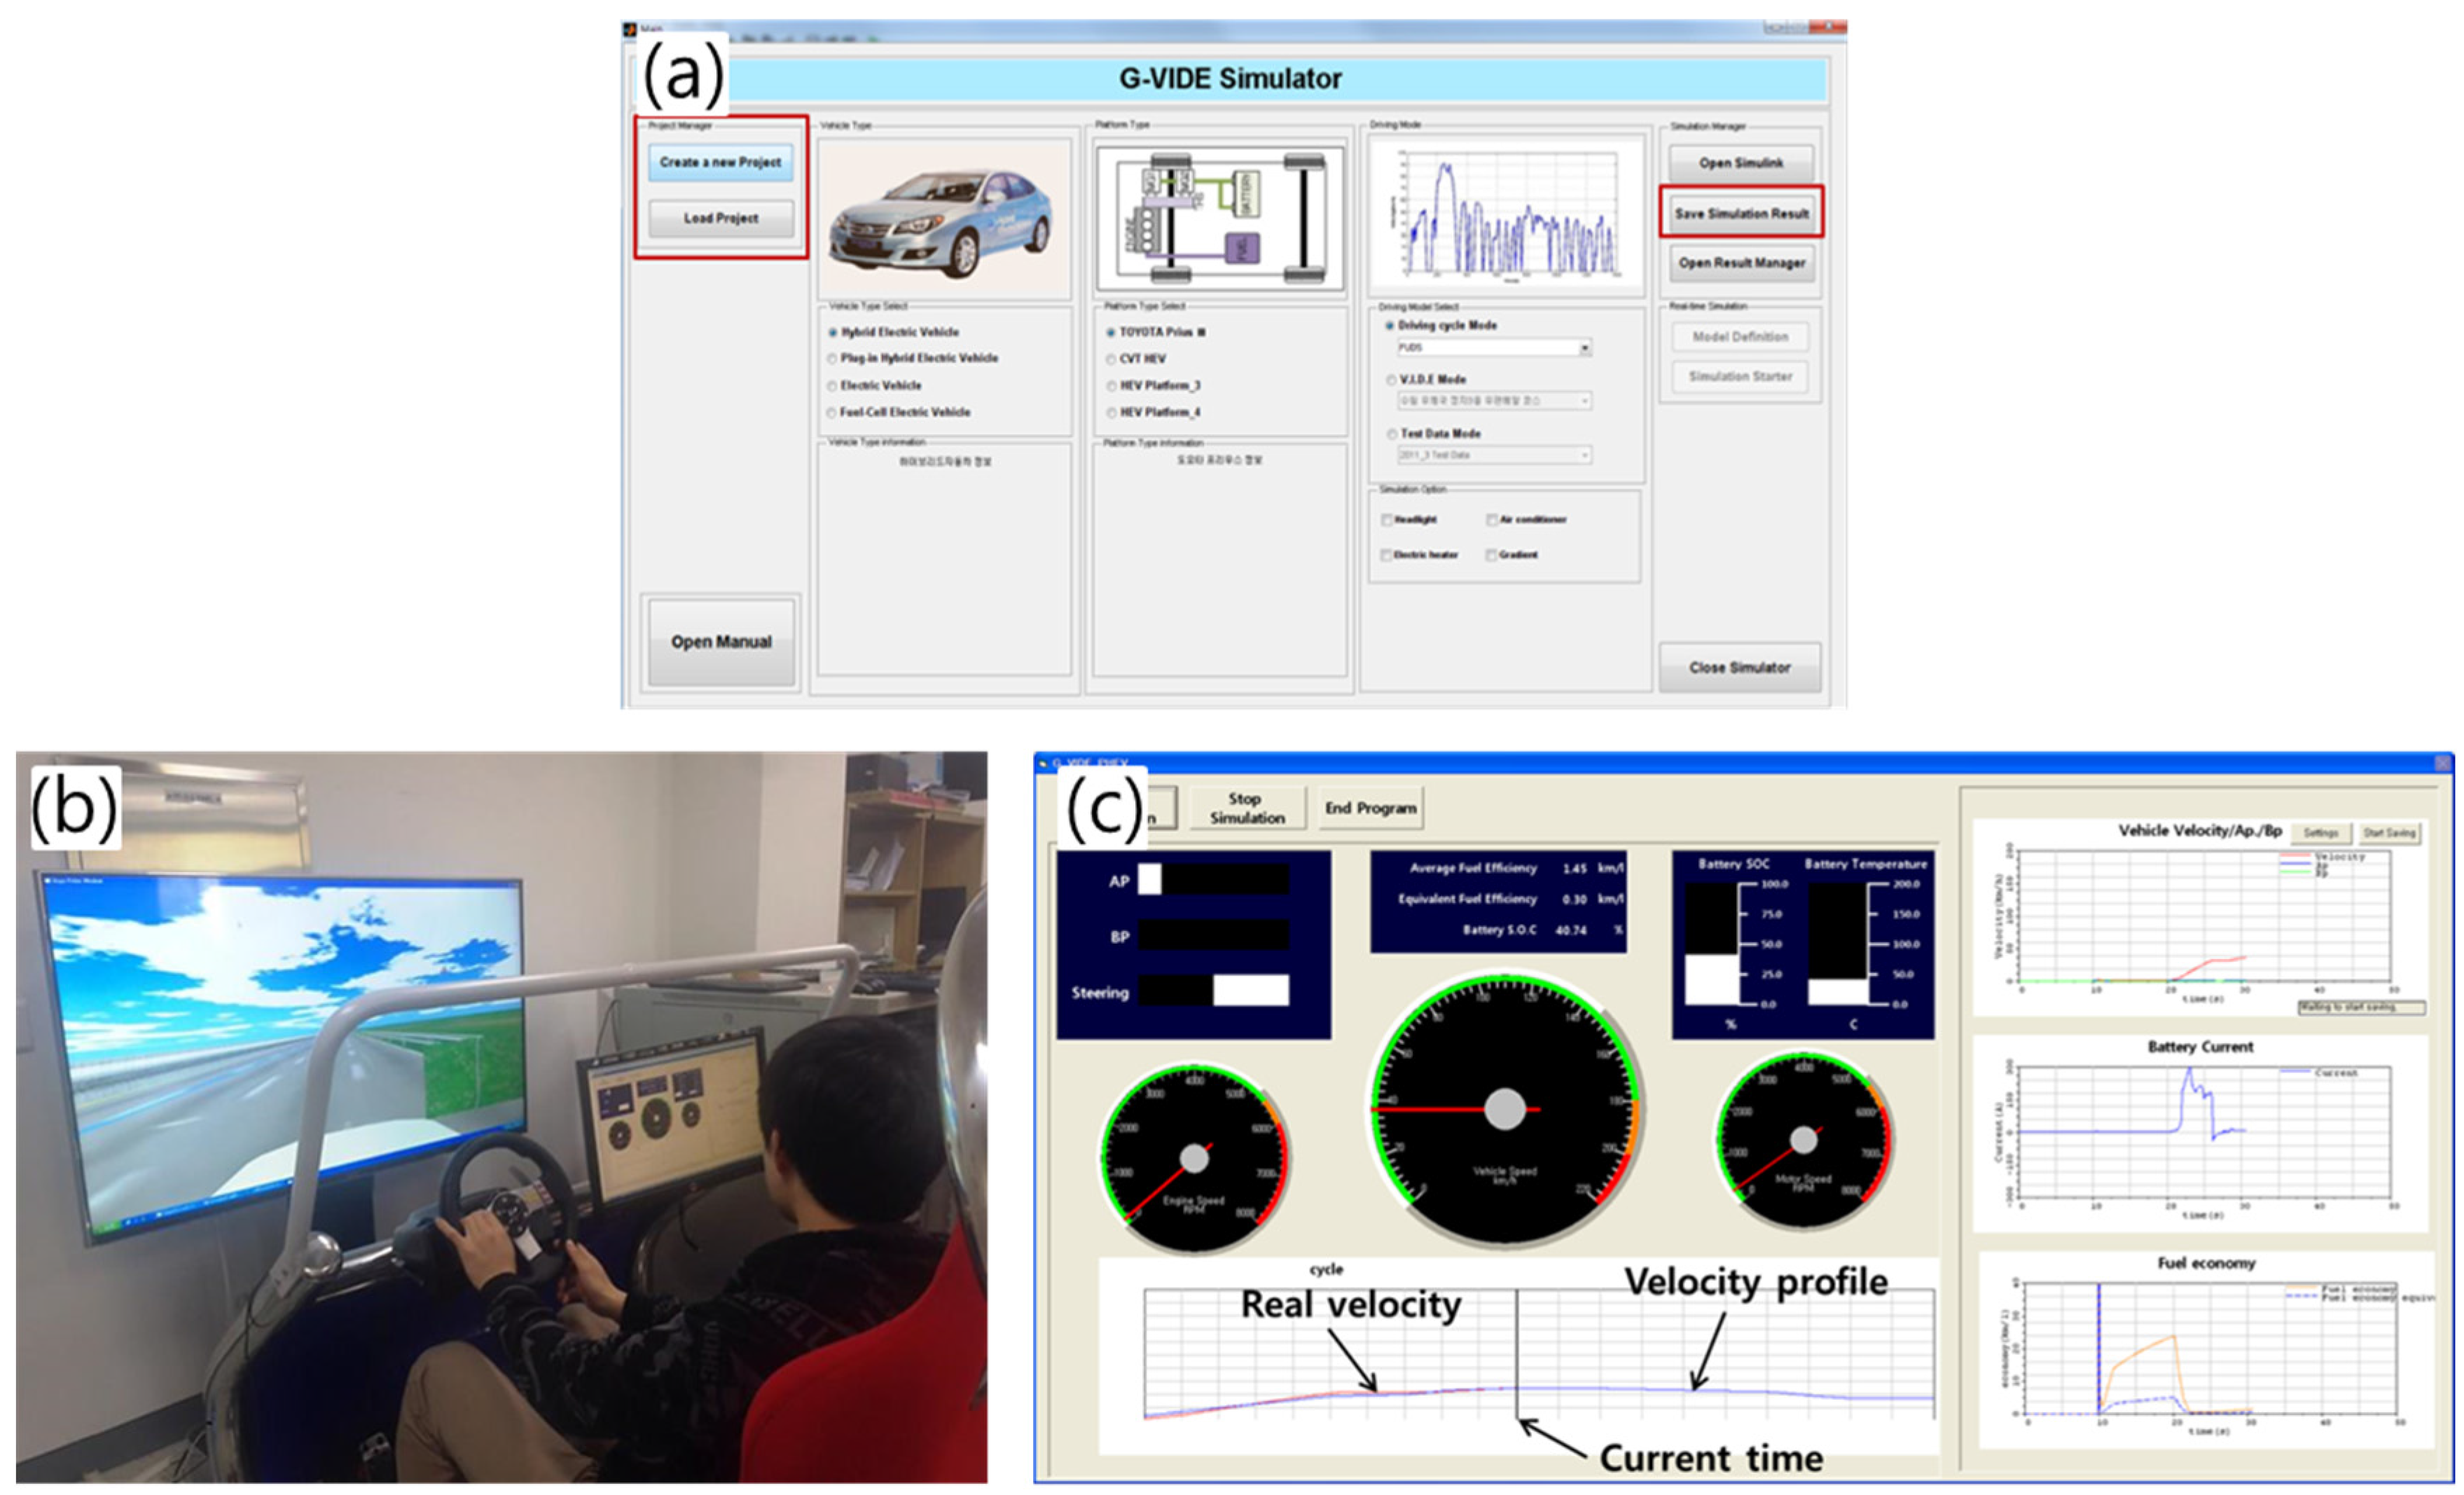
2.2. Development of the Target PHEV Simulator

The target PHEV simulator was developed using the powertrain models. Figure 3 shows the MATLAB/Simulink-based PHEV simulator.
Figure 3. Target PHEV (plug-in Prius) performance simulator.
Energies 08 10106 g003

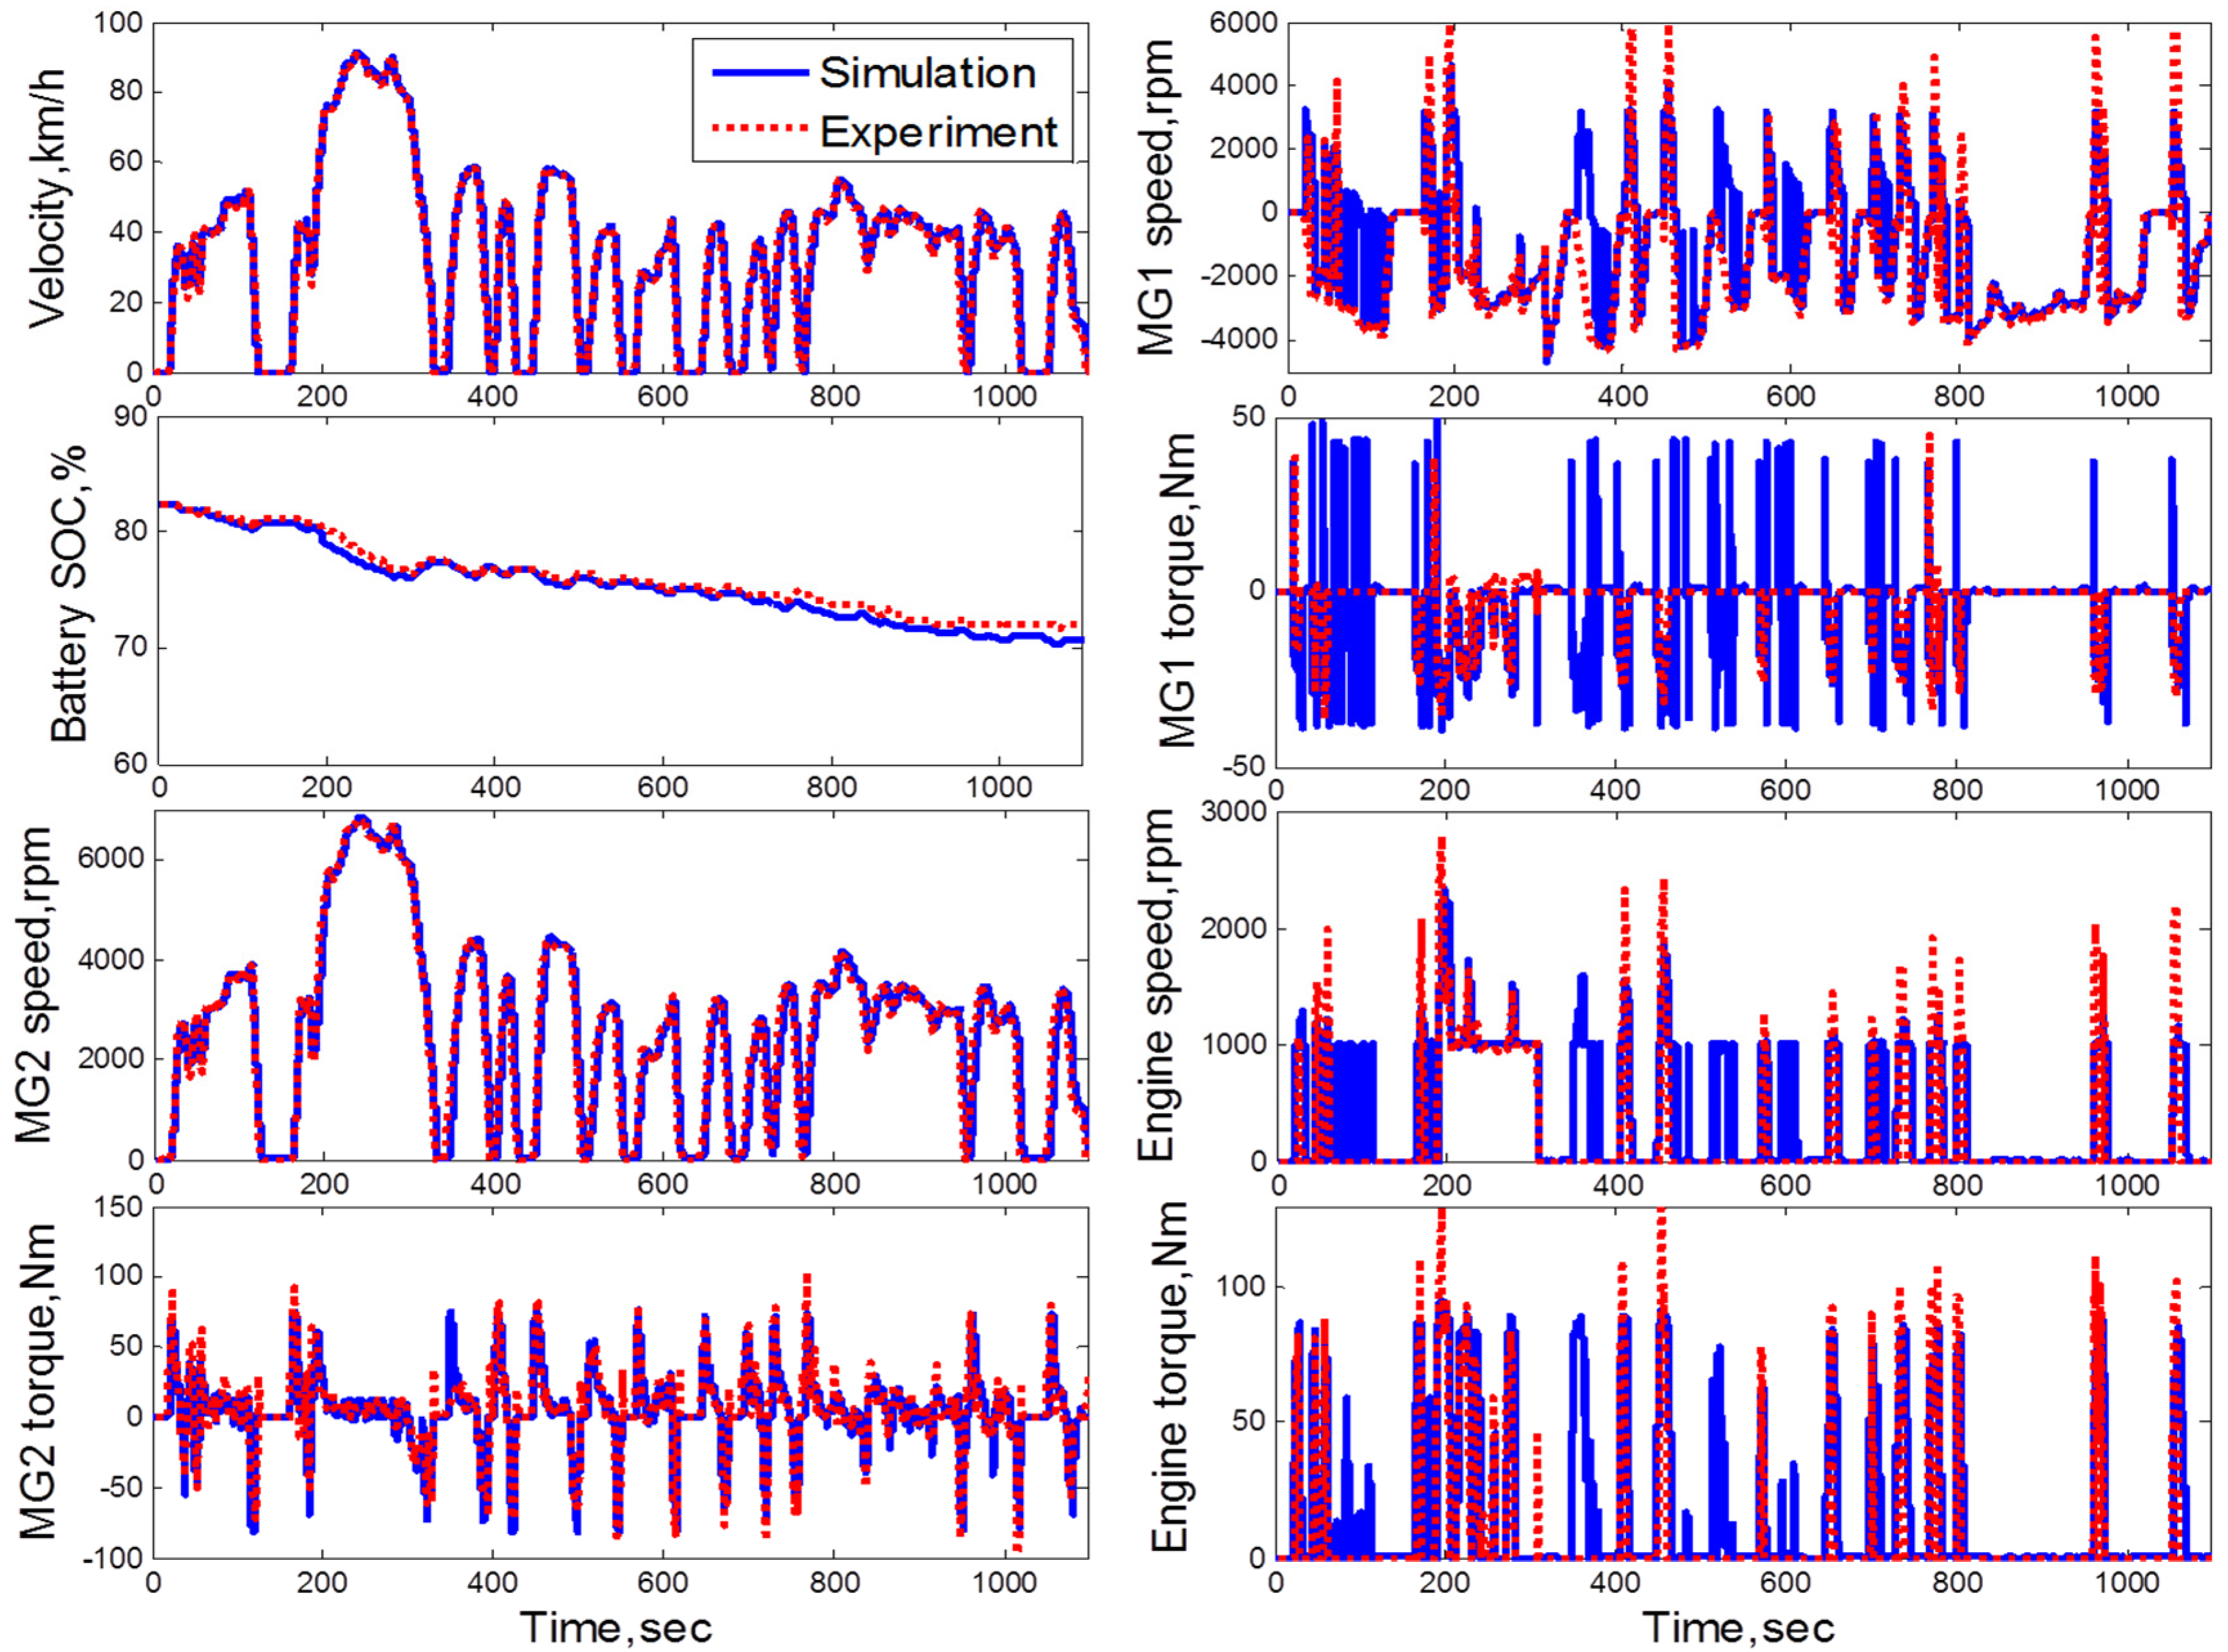
2.3. Verification of the Target PHEV Simulator

The target PHEV simulator was verified by a dynamo test performed at KATECH (Korea Automotive Technology Institute) for an FTP-72 driving cycle.
As shown in Figure 4, the simulation results of the vehicle speed, battery SOC, MG1 speed and torque, MG2 speed and torque and the engine speed and torque are in good accordance with the test data. The speed and torque of MG1 and the engine showed little difference between the simulation and test results in some sections. This is due to the difference in mode change timing between EV and HEV mode. The battery SOC, which affects the fuel economy the most, showed good agreement with the test results.
Figure 4. Validation of the PHEV simulator in FTP-72 driving cycle. SOC: state of charge.
Energies 08 10106 g004

3. Driver Model and Tendency of the Driver

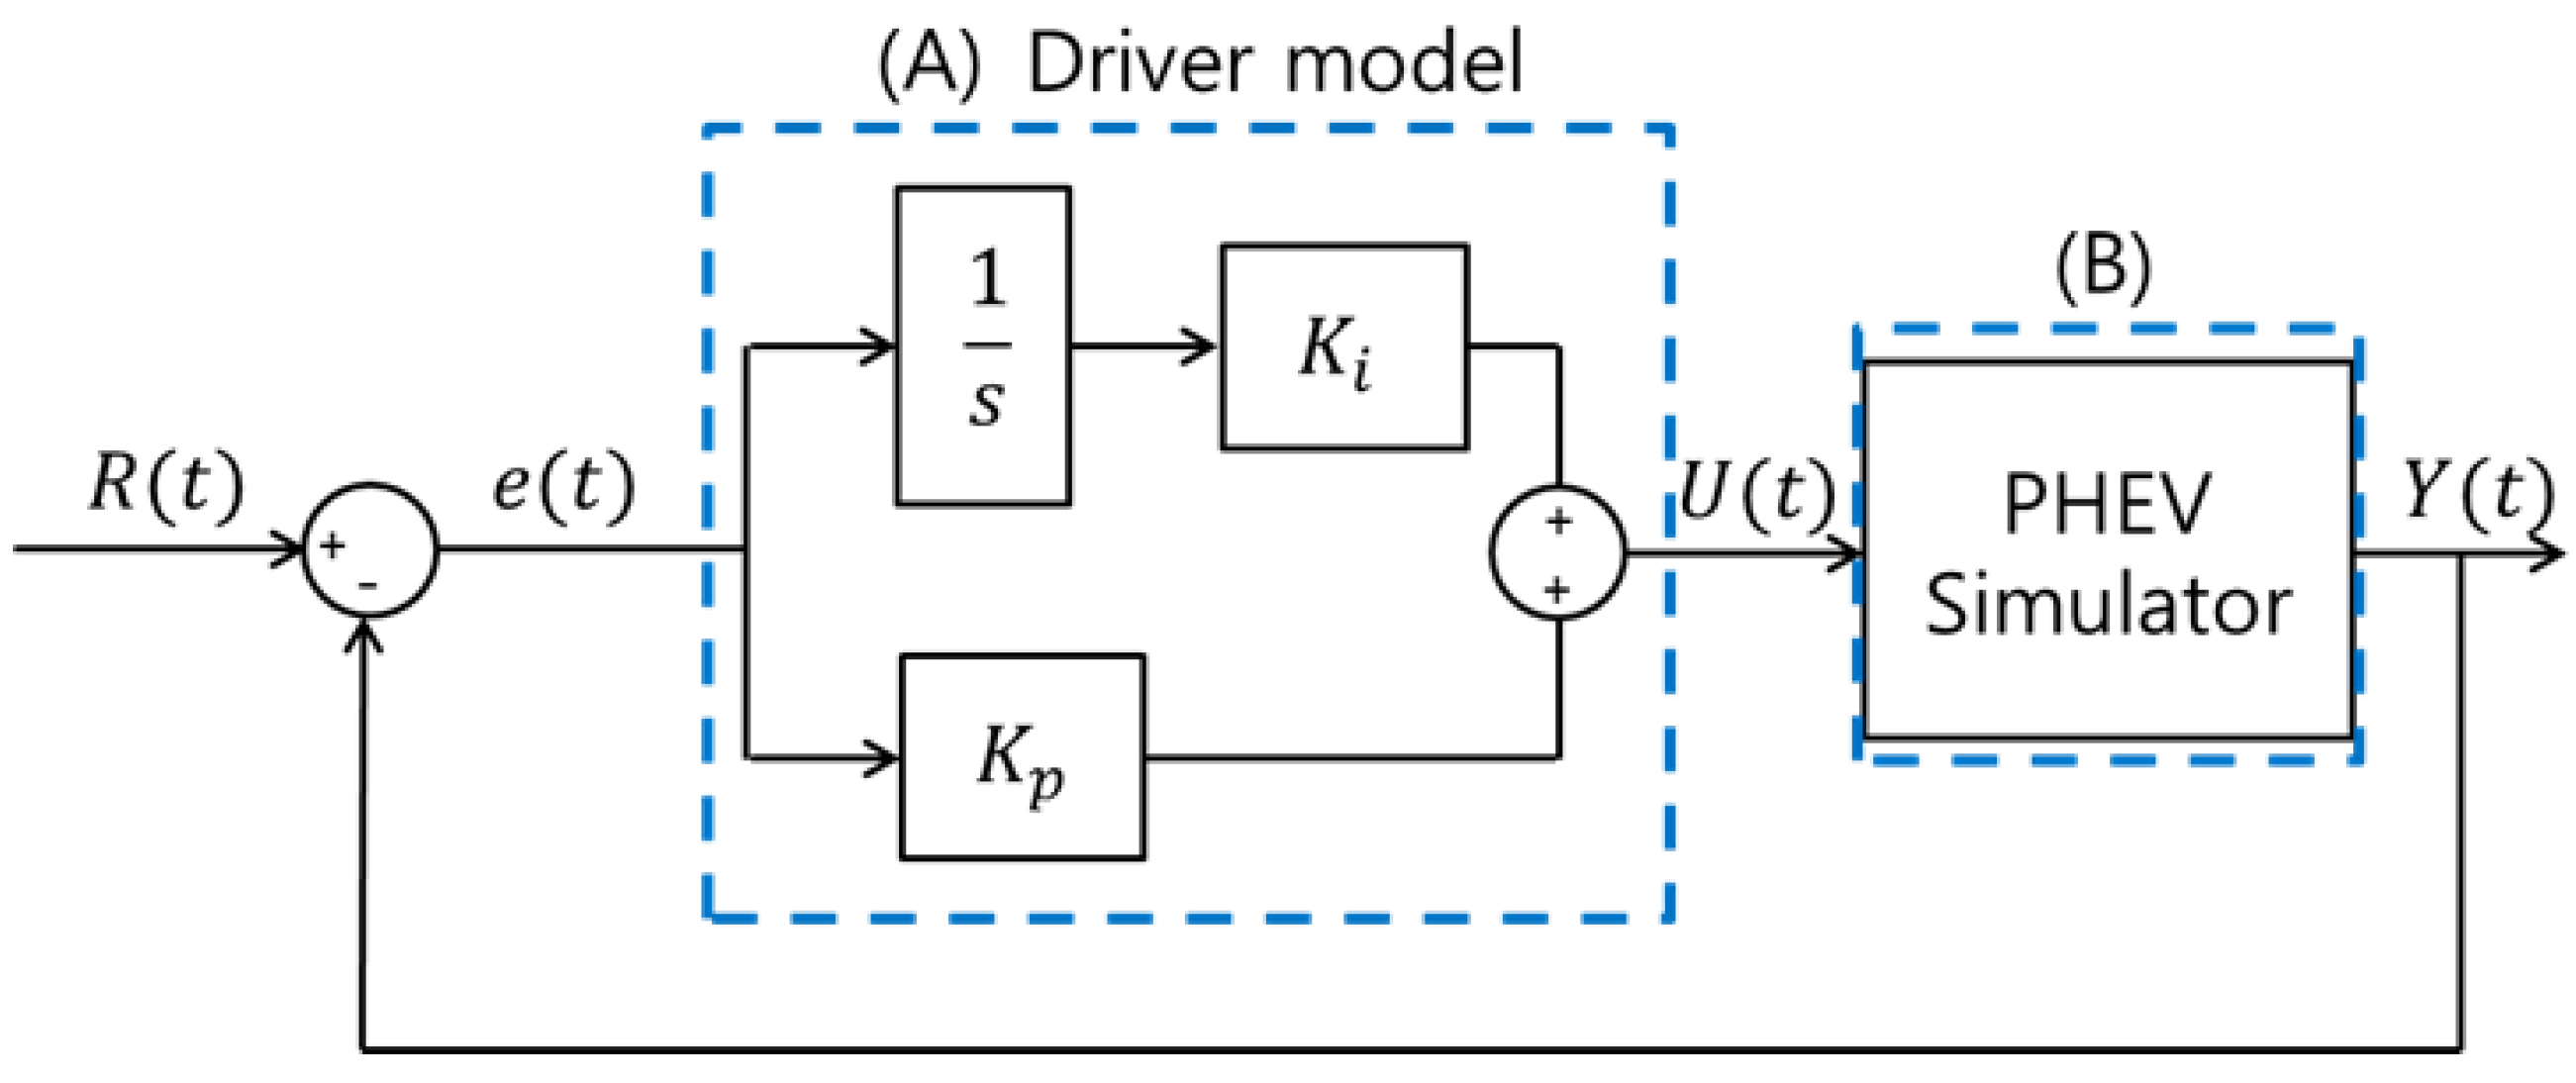
3.1. Development of the Driver Model

A driver model should take actual driver behavior into consideration to be valid. In order to reflect driver behavior, a VIDE (virtual integrated driving environment) is used. The VIDE consists of the MATLAB SimDriveline-based car simulator, a real-time driving instrument and a virtual driving environment. Using the selected vehicle simulator, which is constructed in the library, the driver can evaluate the performance of the vehicle at the component level, as well as at the vehicle level. In the VIDE, the driver can manipulate the steering wheel, accelerator pedal and brake pedal to drive the vehicle in the virtual environment. During VIDE driving, the component performances, such as torque, speed, voltage, current and fuel economy, are calculated in real time and displayed on the monitor [14].
To develop the driver model, the vehicle speed, accelerator pedal position Ap and brake pedal position Bp were collected for an FTP-72 driving cycle using the target PHEV simulator in the VIDE. Figure 5a shows the virtual driving environment equipment used to collect driving data and displays the vehicle performance. In the driving test, 10 drivers with more than one year of driving experience participated. Each driver manipulated Ap and Bp to follow the UDDS velocity profile within an allowable speed difference while watching the velocity profile and real-time vehicle speed displayed on the screen (Figure 5c).
Figure 5. (a) The virtual integrated driving environment (VIDE) library; (b) the VIDE hardware and driver; (c) display screen.
Energies 08 10106 g005
Factors that represent driver characteristics can be divided into reckless, sensitive and immature groups. In particular, reckless and sensitive driving influence fuel economy more than immature driving [15]. Therefore, in this study, reckless and sensitive driving behaviors are selected to simulate real drivers and modeled as proportional integral control [5,14]. Figure 6 shows a block diagram of the driver model.
Figure 6. Block diagram of the overall system.
Energies 08 10106 g006
In the driver model, K p is the proportional control gain, K i is the integral control gain, R ( t ) is the demanded velocity, Y ( t ) is the vehicle velocity, e ( t ) is the error and U ( t ) is the control signal to the vehicle, which is Ap or Bp. The functions U ( t ) and U ( t + 1 ) can be expressed as:
{ U ( t ) = K p e ( t ) + K i t 1 t e ( t ) d t U ( t + 1 ) = K p e ( t + 1 ) + K i t t + 1 e ( t ) d t
K p and K i can be obtained from Equation (6) as follows:
{ K p = U ( t ) t 1 t e ( t ) d t t t + 1 e ( t ) d t U ( t + 1 ) e ( t ) t 1 t e ( t ) d t t t + 1 e ( t ) d t e ( t + 1 ) K i = U ( t ) e ( t ) e ( t + 1 ) U ( t + 1 ) t 1 t e ( t ) d t e ( t ) e ( t + 1 ) t t + 1 e ( t ) d t
To determine the driver characteristics, simulations were performed, and mean values of proportional control gain K p and integral control gain K i were determined from Equations (6) and (7) for Driver 1–Driver 10.
Now, we need to define the characteristics of the driver. To determine the characteristics of the driver, simulations were performed for each driver model to follow the FTP-72 driving cycle using the target PHEV simulator. In Table 2, the mean value of | d d t U ( t ) | , the number of crossings between Ap and Bp and NCCP (normalized cross correlation power) are shown. In following the speed profile using VIDE, an error may exist between the real speed profile and the driving cycle even when well-trained driver maneuver. Therefore, in this study, the test results with NCCP >95% were used as meaningful data [16].
Table 2. Mean value of | d d t U ( t ) | , the number of crossing between accelerator pedal position (Ap) and brake pedal position (Bp) and normalized cross correlation power (NCCP) for the FTP-72 driving cycle.
Driver No.Mean Value of | d d t U ( t ) | Number of Crossing between Ap and BpNCCP
Driver 10.0137950.98916
Driver 20.20596590.99748
Driver 30.02801730.99102
Driver 40.03151850.99661
Driver 50.12115110.9972
Driver 60.05932970.99669
Driver 70.01481010.99249
Driver 80.07263790.99782
Driver 90.04012330.99663
Driver 100.06253250.99682
We defined a driver as “aggressive” who has a larger mean value of the change rate of U ( t ) and a larger number of crossings between Ap and Bp than other drivers. A cautious driver was defined to have a smaller mean value of the change rate of U ( t ) and a smaller number of crossings between Ap and Bp than other drivers. As shown in Table 2, Driver 2 was the most aggressive driver, and Driver 1 was the most cautious. Driver 2 and Driver 5 showed 659 and 511 crosses in FTP-72 driving mode, indicating crossing between Ap and Bp every two seconds. This seemed too excessive and unrealistic. Therefore, Drivers 2 and 5 were not used in the test group. Drivers 8, 9 and 10 were selected as the aggressive driver group and Drivers 1 and 7 as the cautious driver group.

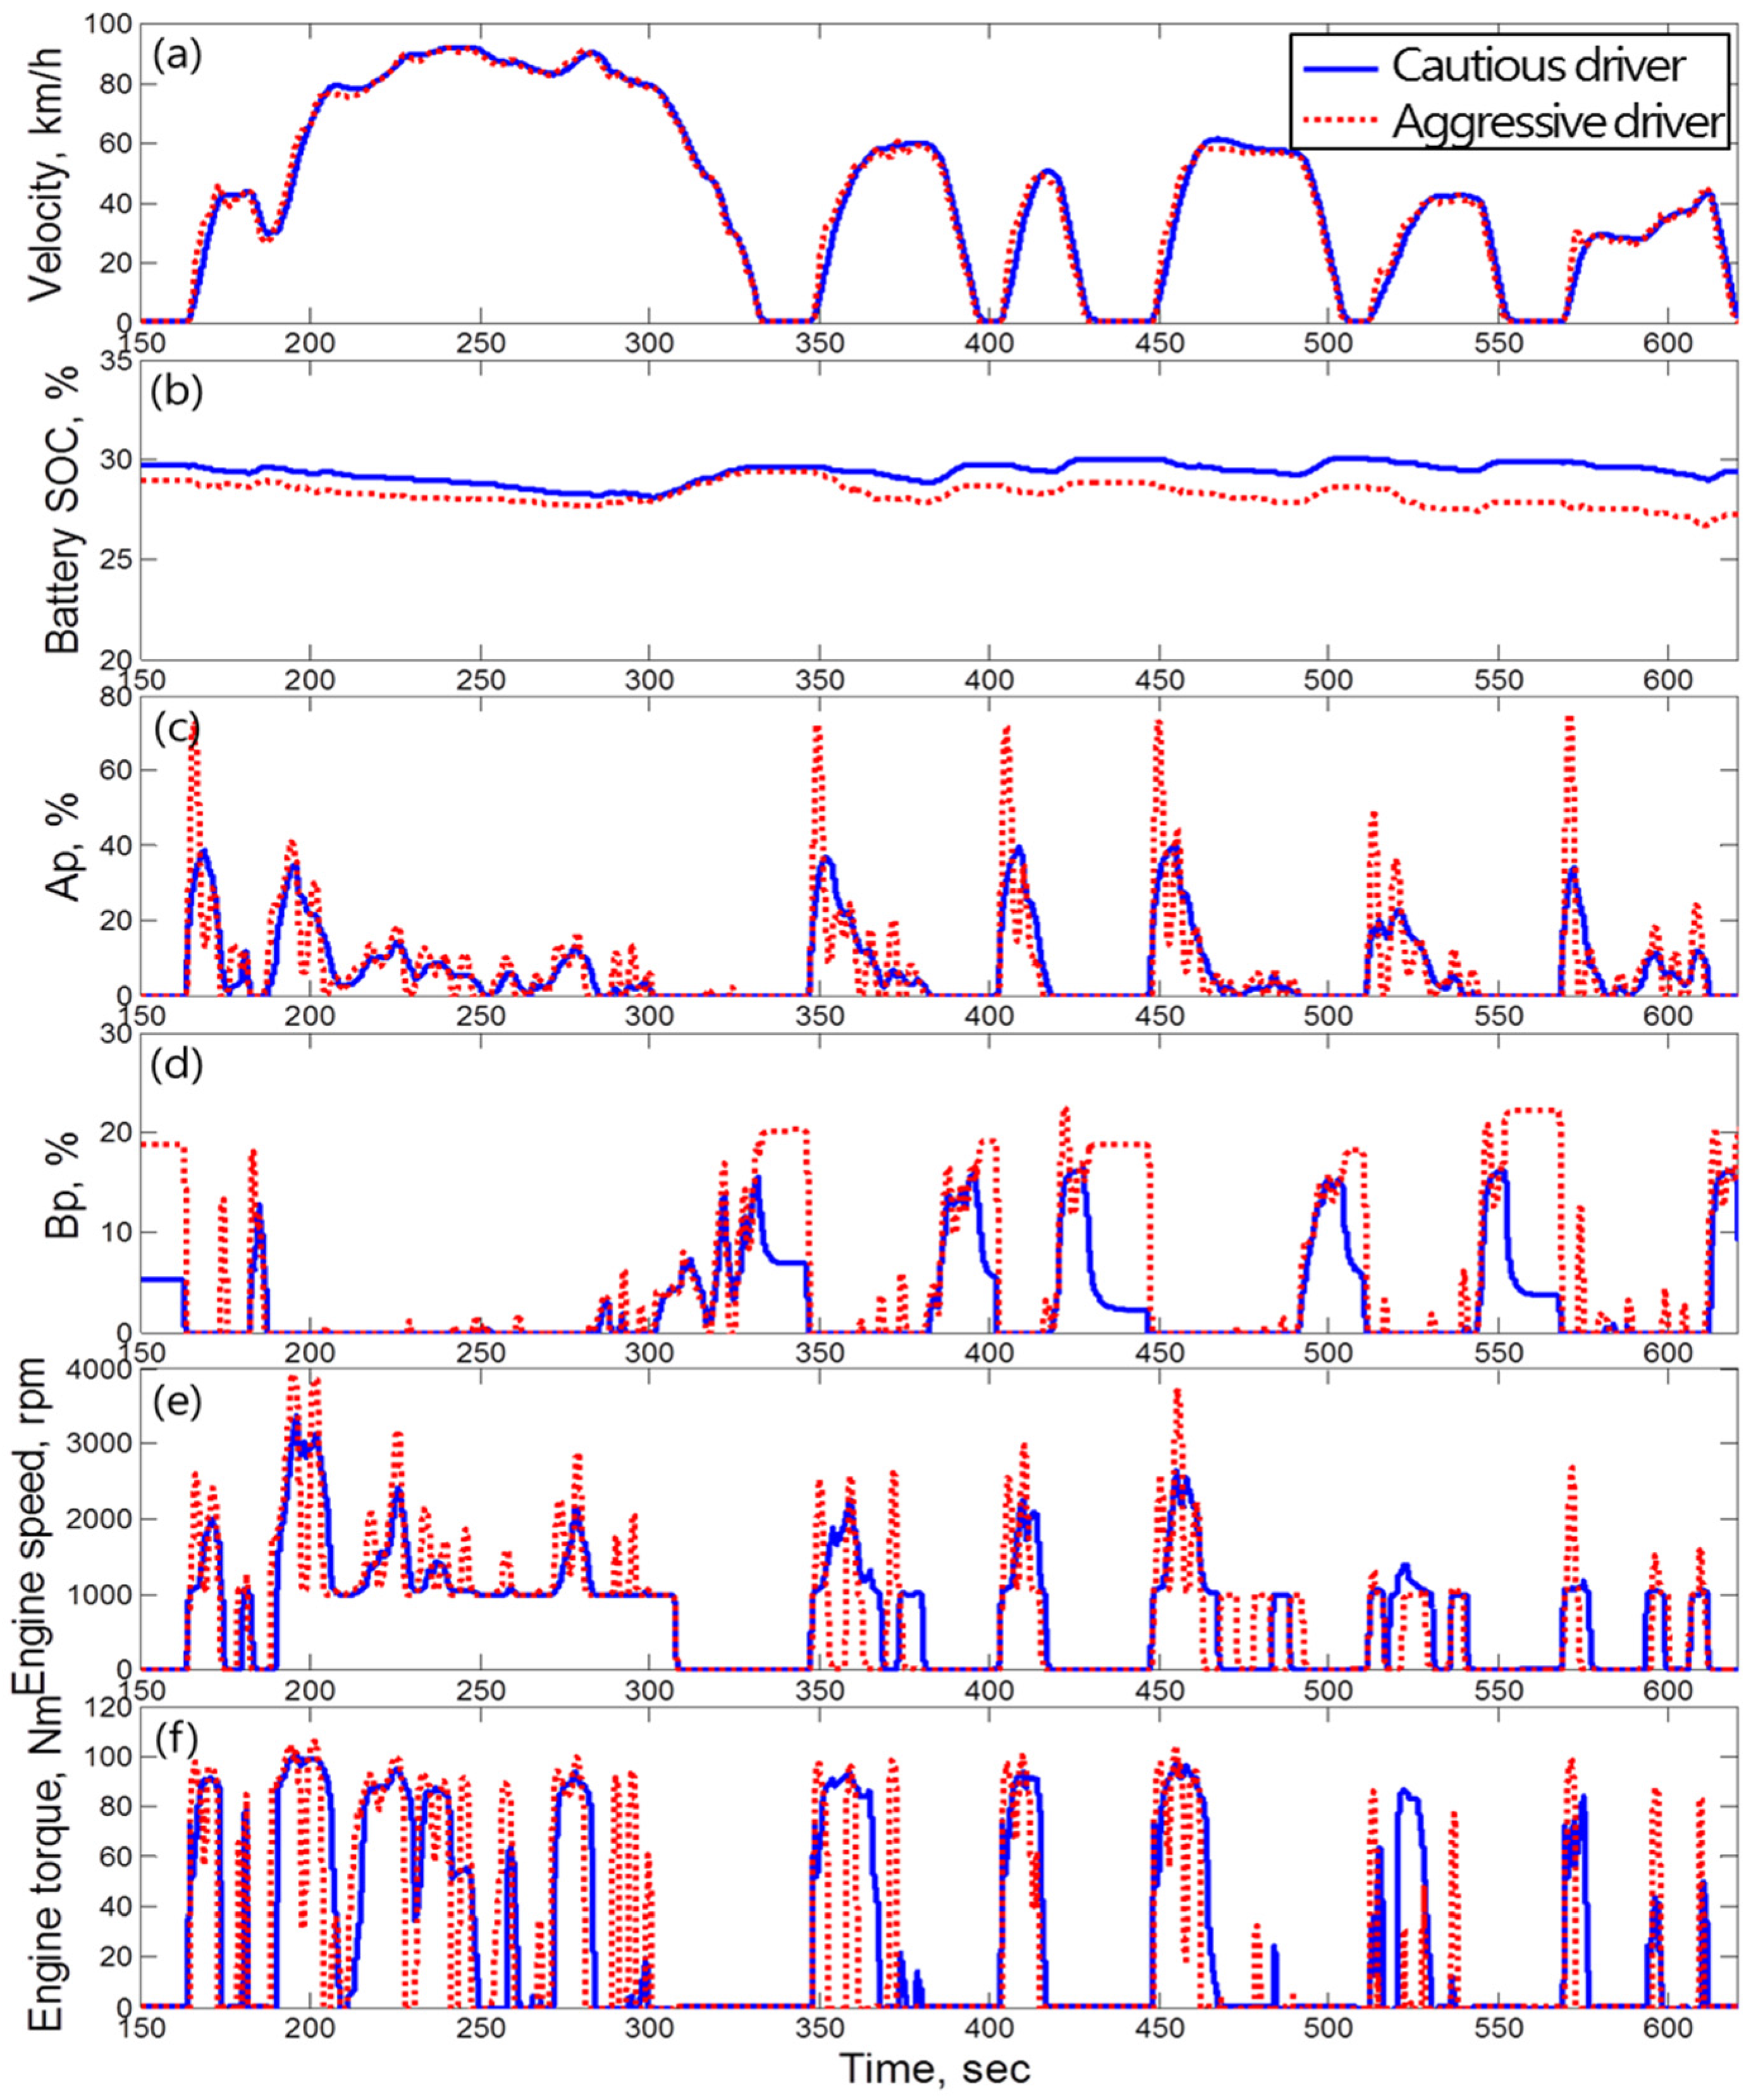
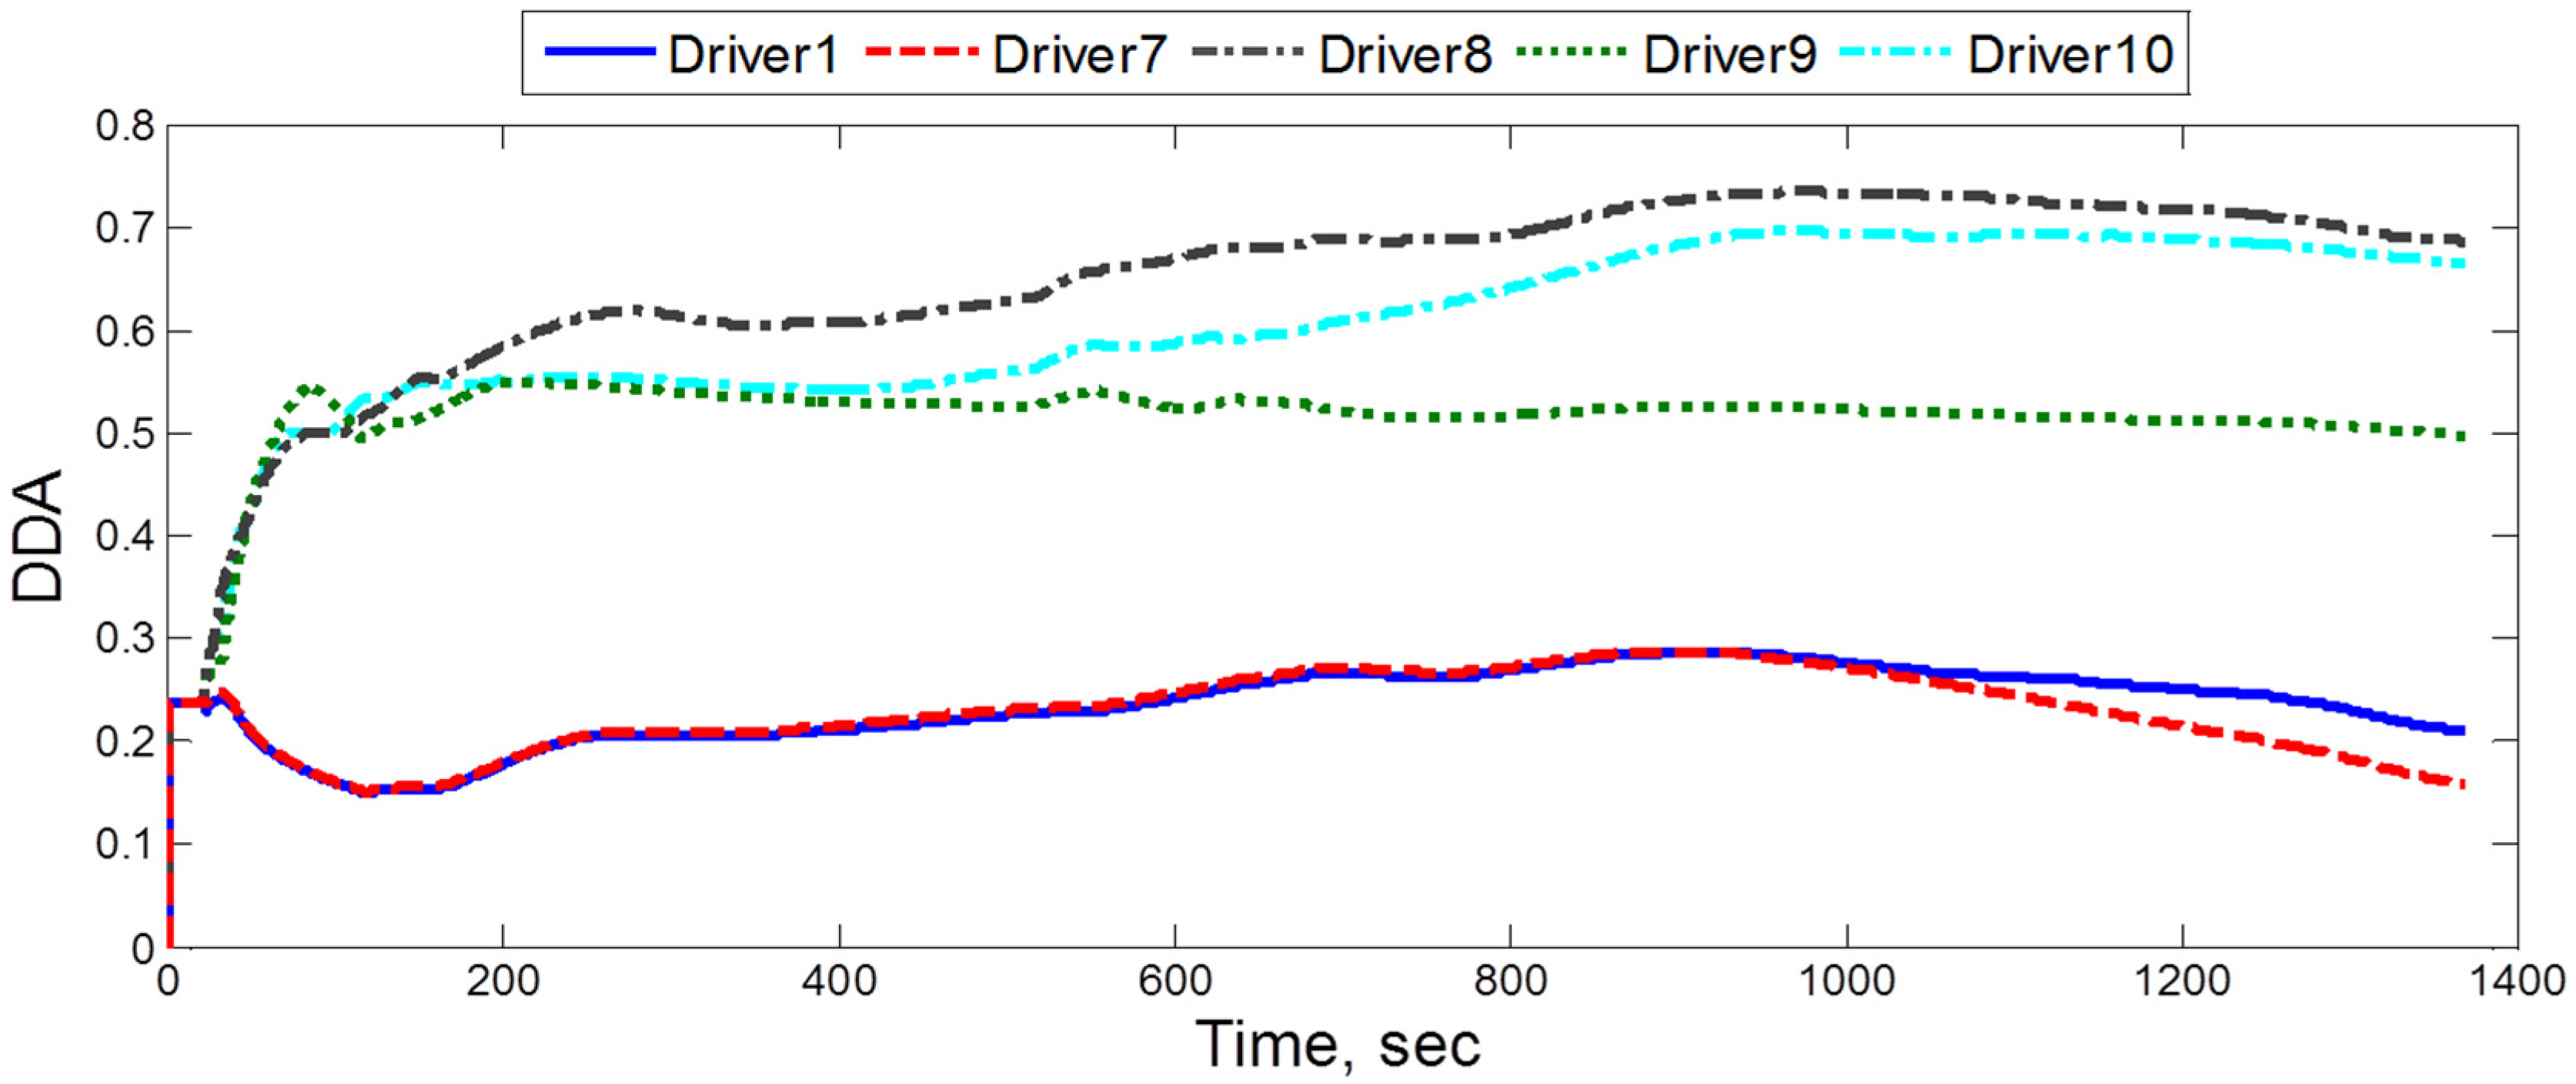
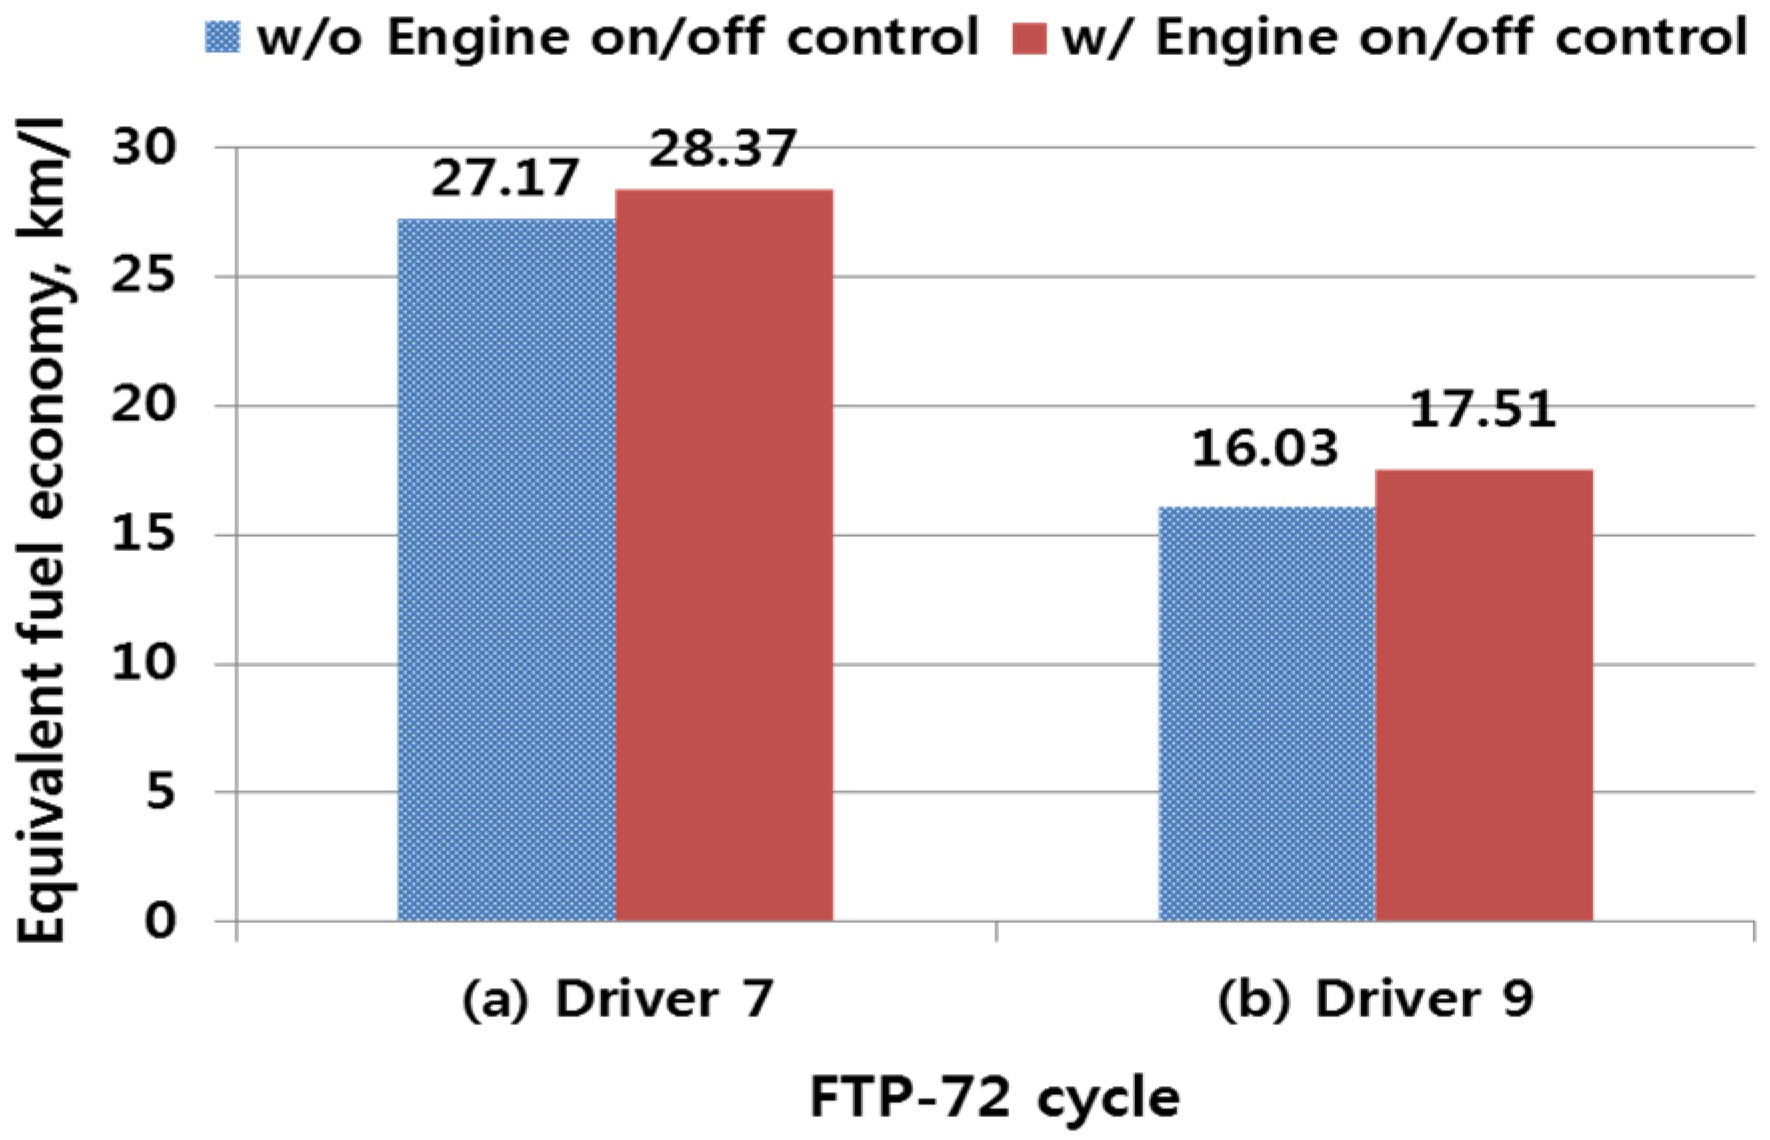
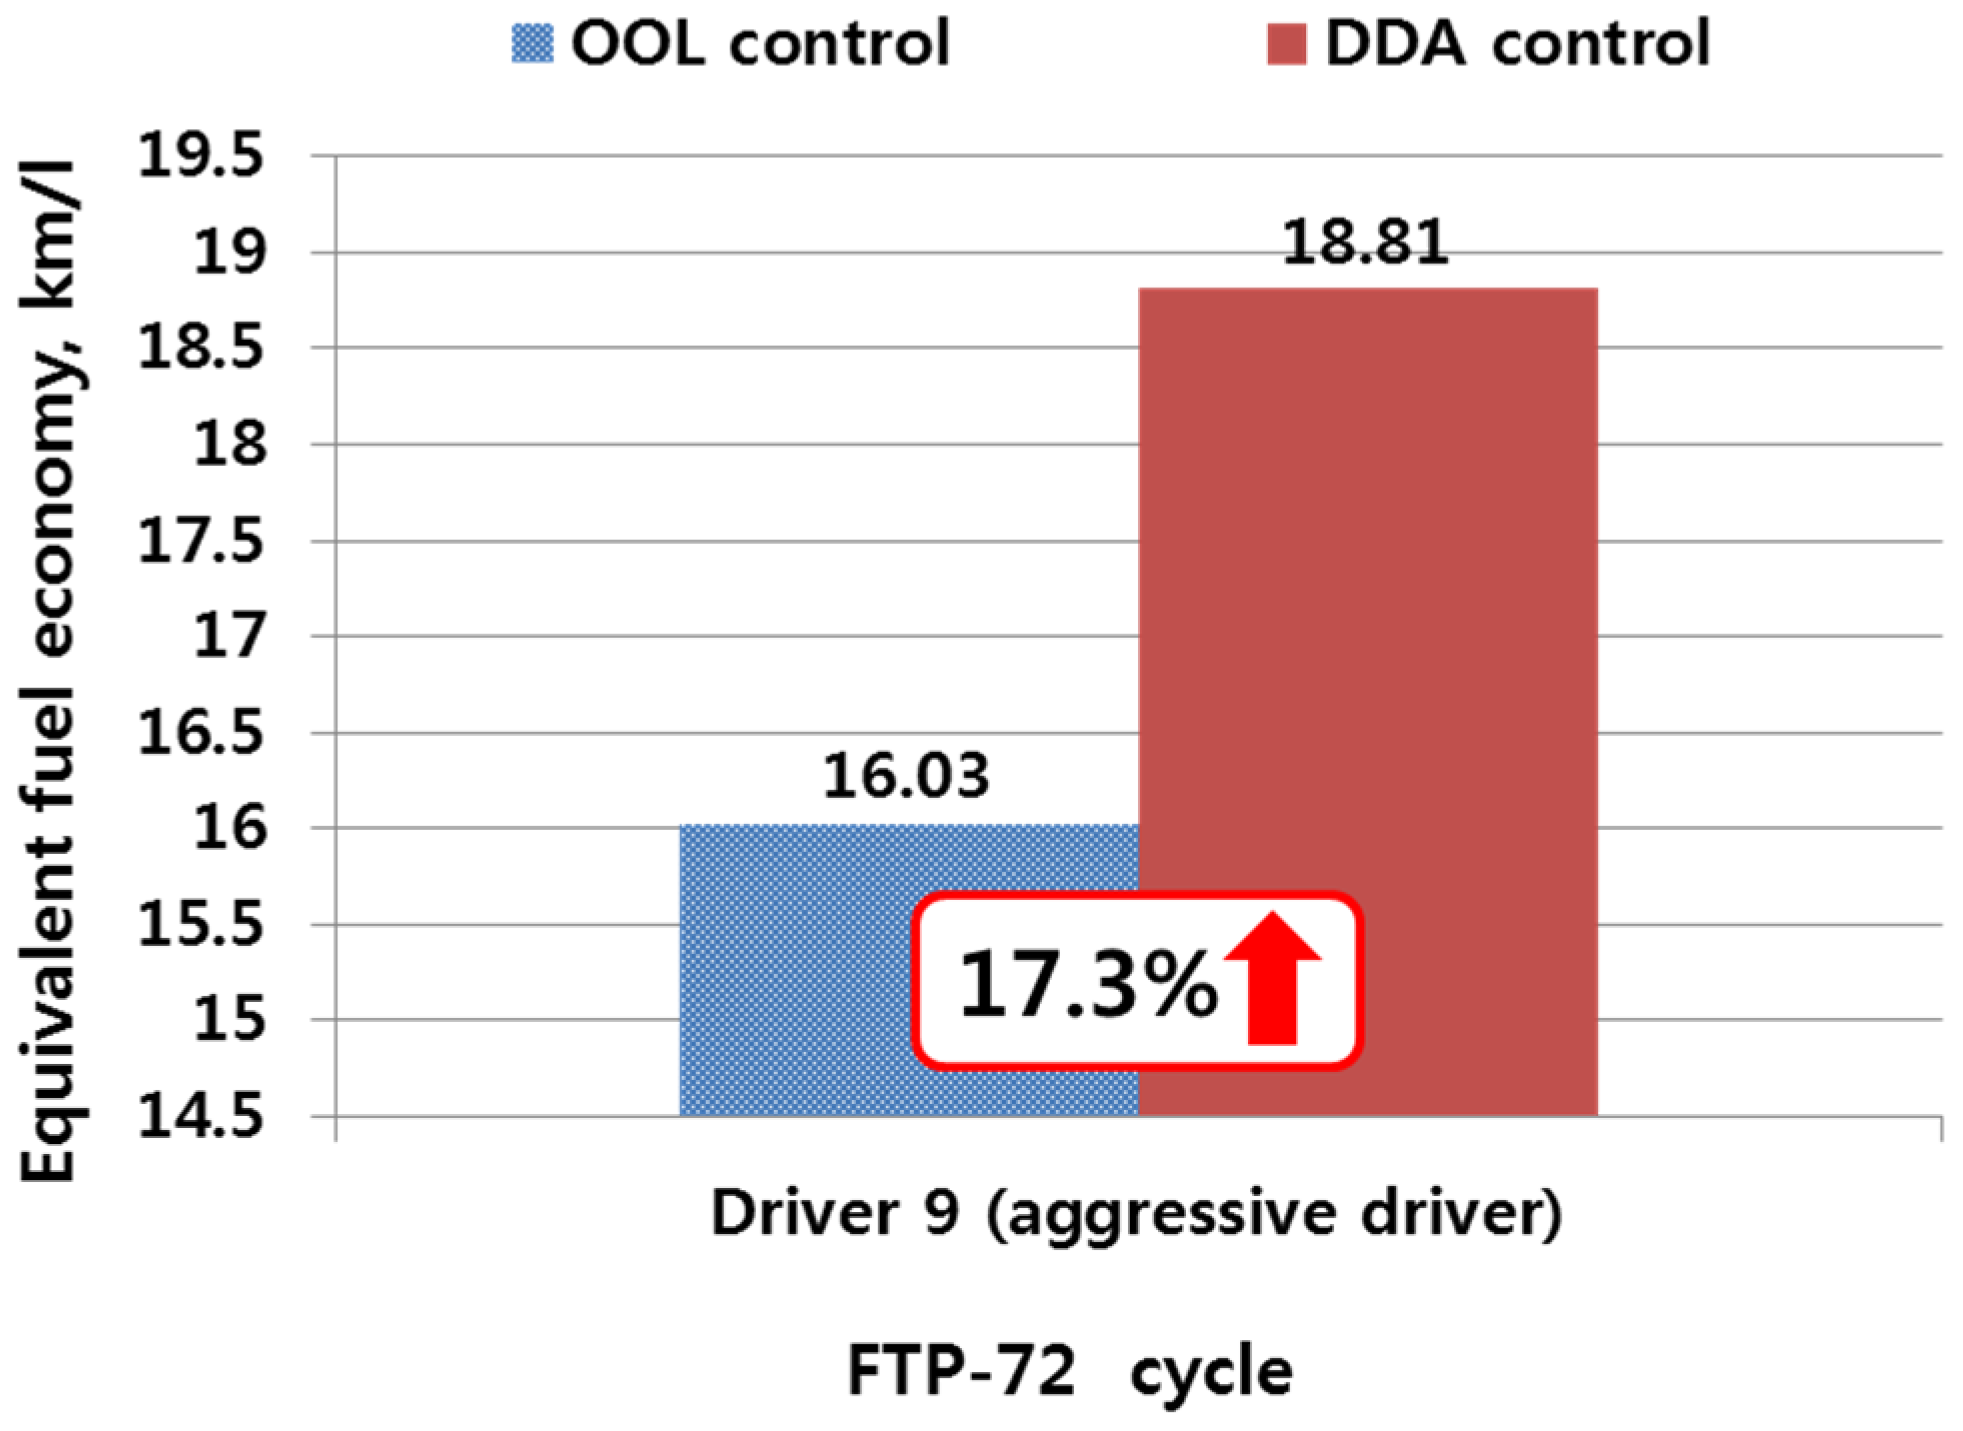
3.2. Fuel Economy Analysis According to Driver Characteristics

The fuel economy was evaluated to quantify the effect of different driving styles. Since the target PHEV uses the battery and internal combustion engine (ICE) as energy sources, the equivalent gasoline energy was obtained to compare the fuel economy [17]. In addition, the fuel economy of the target PHEV depends on the control strategy in HEV mode, where ICE and MG1/MG2 are used together.
In the simulation, the initial battery SOC 0.3 was used for the FTP-72 driving cycle.
Table 3 compares the results of equivalent fuel economy according to the driver characteristics. The fuel economy of aggressive Drivers 8, 9 and 10 was much lower than that of cautious Drivers 1 and 7. Figure 7 compares simulation results for Driver 7 (a cautious driver) and Driver 9 (an aggressive driver) for the FTP-72 driving cycle. Figure 7 shows that the aggressive driver manipulated the acceleration pedal more frequently and deeply than the cautious driver (Figure 7c). This acceleration demand changes the vehicle power requirements, increasing power consumption. Therefore, the battery SOC decreases much faster in the aggressive driver’s case (Figure 7b). Furthermore, the frequent engine on/off is observed for the aggressive driver. Since energy consumption of at least 248 J is required to start the engine from the stop state [18], this frequent engine on/off also deteriorates the fuel economy.
Table 3. Fuel economy comparison between cautious driver and aggressive driver for the FTP-72 driving cycle.
Driver No.Fuel Economy (km/L)
Driver 128.16
Driver 727.17
Driver 813.26
Driver 916.03
Driver 1013.56
It is noted from Figure 7 that for the aggressive driver, the battery SOC is not regulated in CS mode. This can be explained as: when an average (normal) style driver drives in CS mode, the demanded vehicle power is relatively small, and the battery SOC is regulated by the normal engine on/off control. However, for an aggressive driver, to satisfy the relatively high demanded vehicle power, the engine power and battery charging power increase, which causes the battery SOC to decrease below the reference value for a long period of time in spite of the battery regulation. This can be found in actual road driving [8]. In this case, the battery SOC is regulated by compulsory engine operation instead of the normal battery SOC regulation control, and this causes additional energy loss.
As shown in the simulation results in Table 3 and Figure 7, aggressive drivers had significantly lower fuel economy than cautious drivers. Therefore, if the engine on/off, battery SOC management and mode change can be controlled appropriately, improved fuel economy may be achievable.
Figure 7. Simulation results of cautious and aggressive driver for the FTP-72 cycle. (a) velocity; (b) battery SOC; (c) Ap; (d) Bp; (e) engine speed; (f) engine torque.
Energies 08 10106 g007

4. Categorizing Drivers with an Appropriate Algorithm

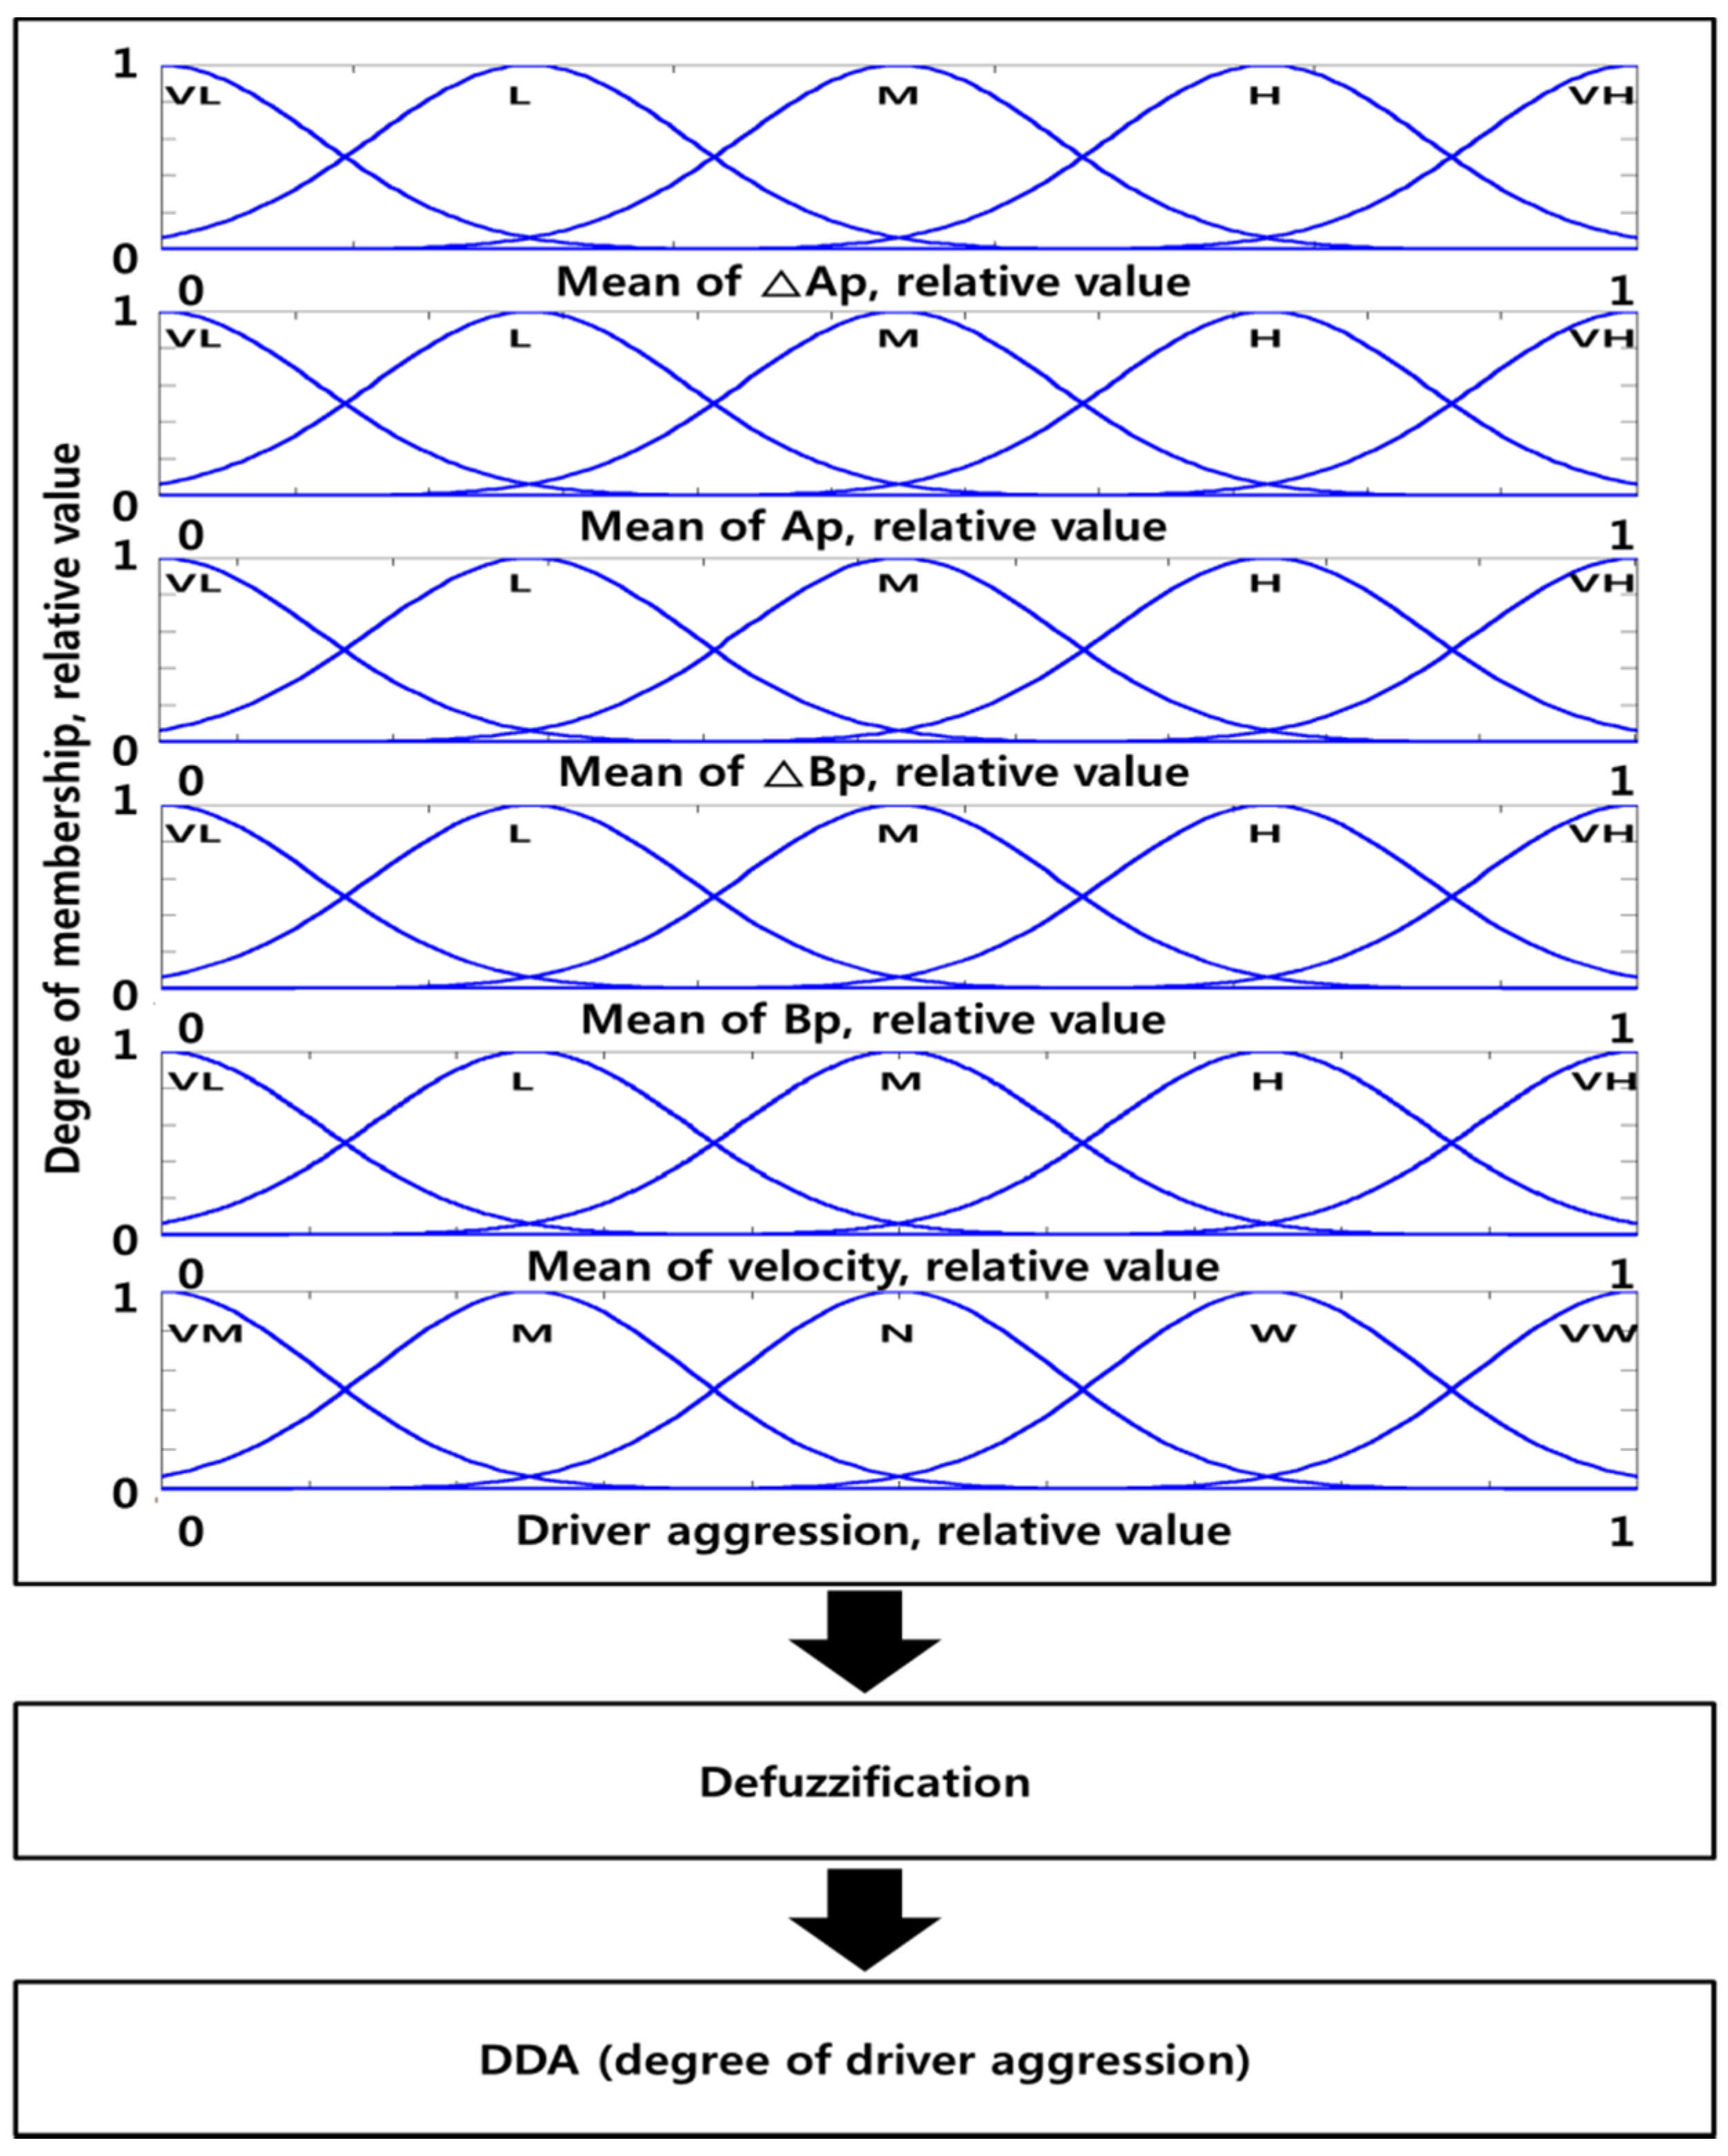
4.1. Driver Tendency Determination

To develop a control algorithm that reflects the driver characteristics, the driver ought to be categorized. It is difficult to categorize drivers objectively, and their tendencies may change depending on traffic circumstance or psychological factors.
In this study, in order to evaluate driver characteristics quantitatively, fuzzy logic was used. Figure 8 represents the block diagram of the fuzzy logic. The mean value of Ap, Bp and the mean value of the change rate of Ap and Bp were selected as the input variables of the fuzzy logic; driver aggression was defuzzified using the centroid method. The output of the fuzzy logic was obtained as the DDA (degree of driver aggression).
Figure 8. Block diagram of the DDA.
Energies 08 10106 g008
Figure 9 represents the DDA per driver using fuzzy logic. The closer the DDA is to one, the more aggressive the driver. It was verified that Drivers 1 and 7, who were defined as “cautious” from Table 2, had DDAs of 0.1–0.3. Drivers 8 and 10, who were defined as “aggressive”, had DDAs of 0.5–0.8. It is noted from Figure 9 that even though the DDA of each driver changed in real time, the DDA showed a distinct tendency after t = 200–300 s from the vehicle start.
Figure 9. Degree of driver aggression for five driver models.
Energies 08 10106 g009

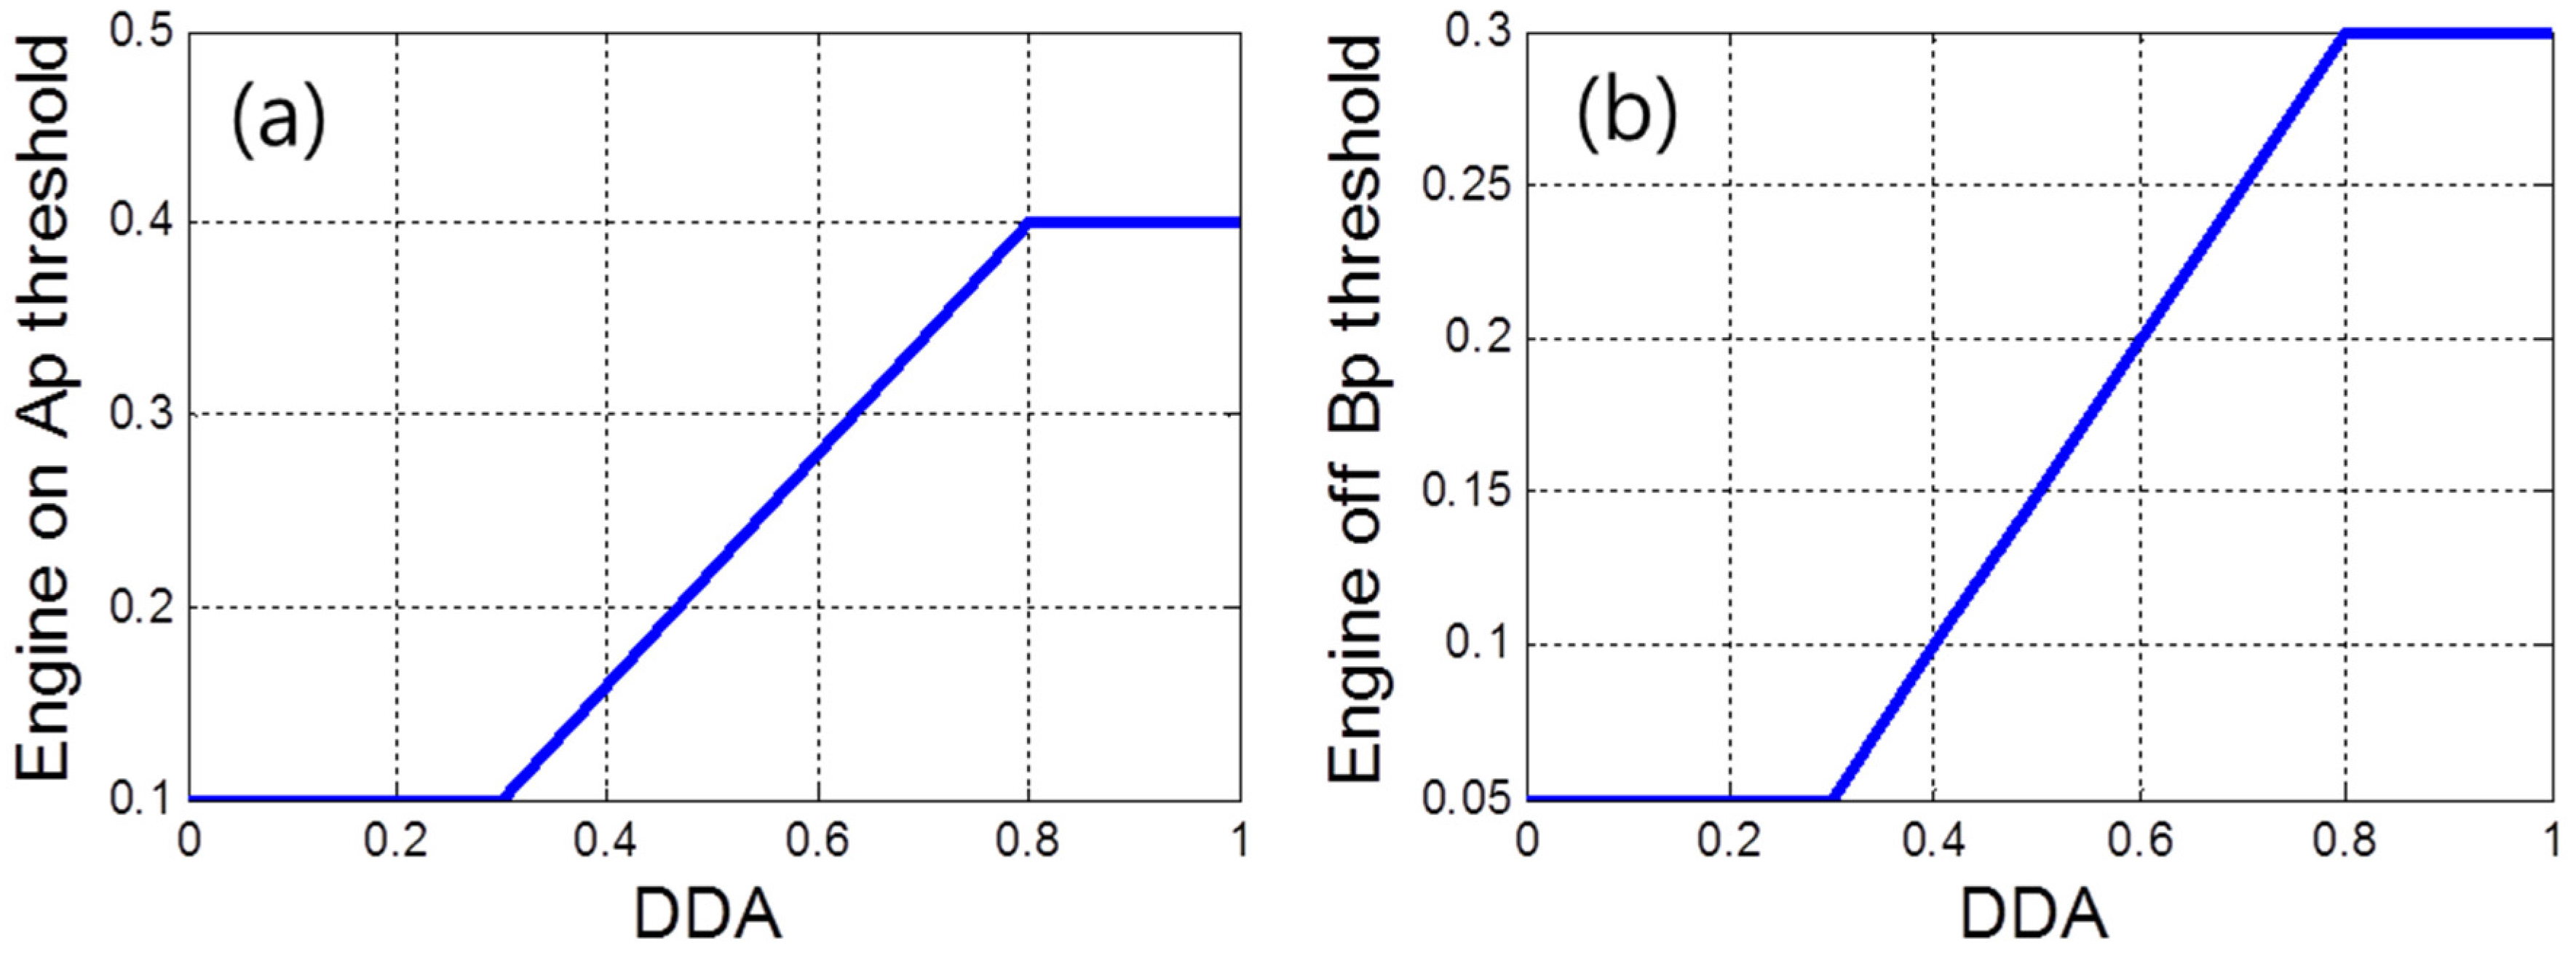
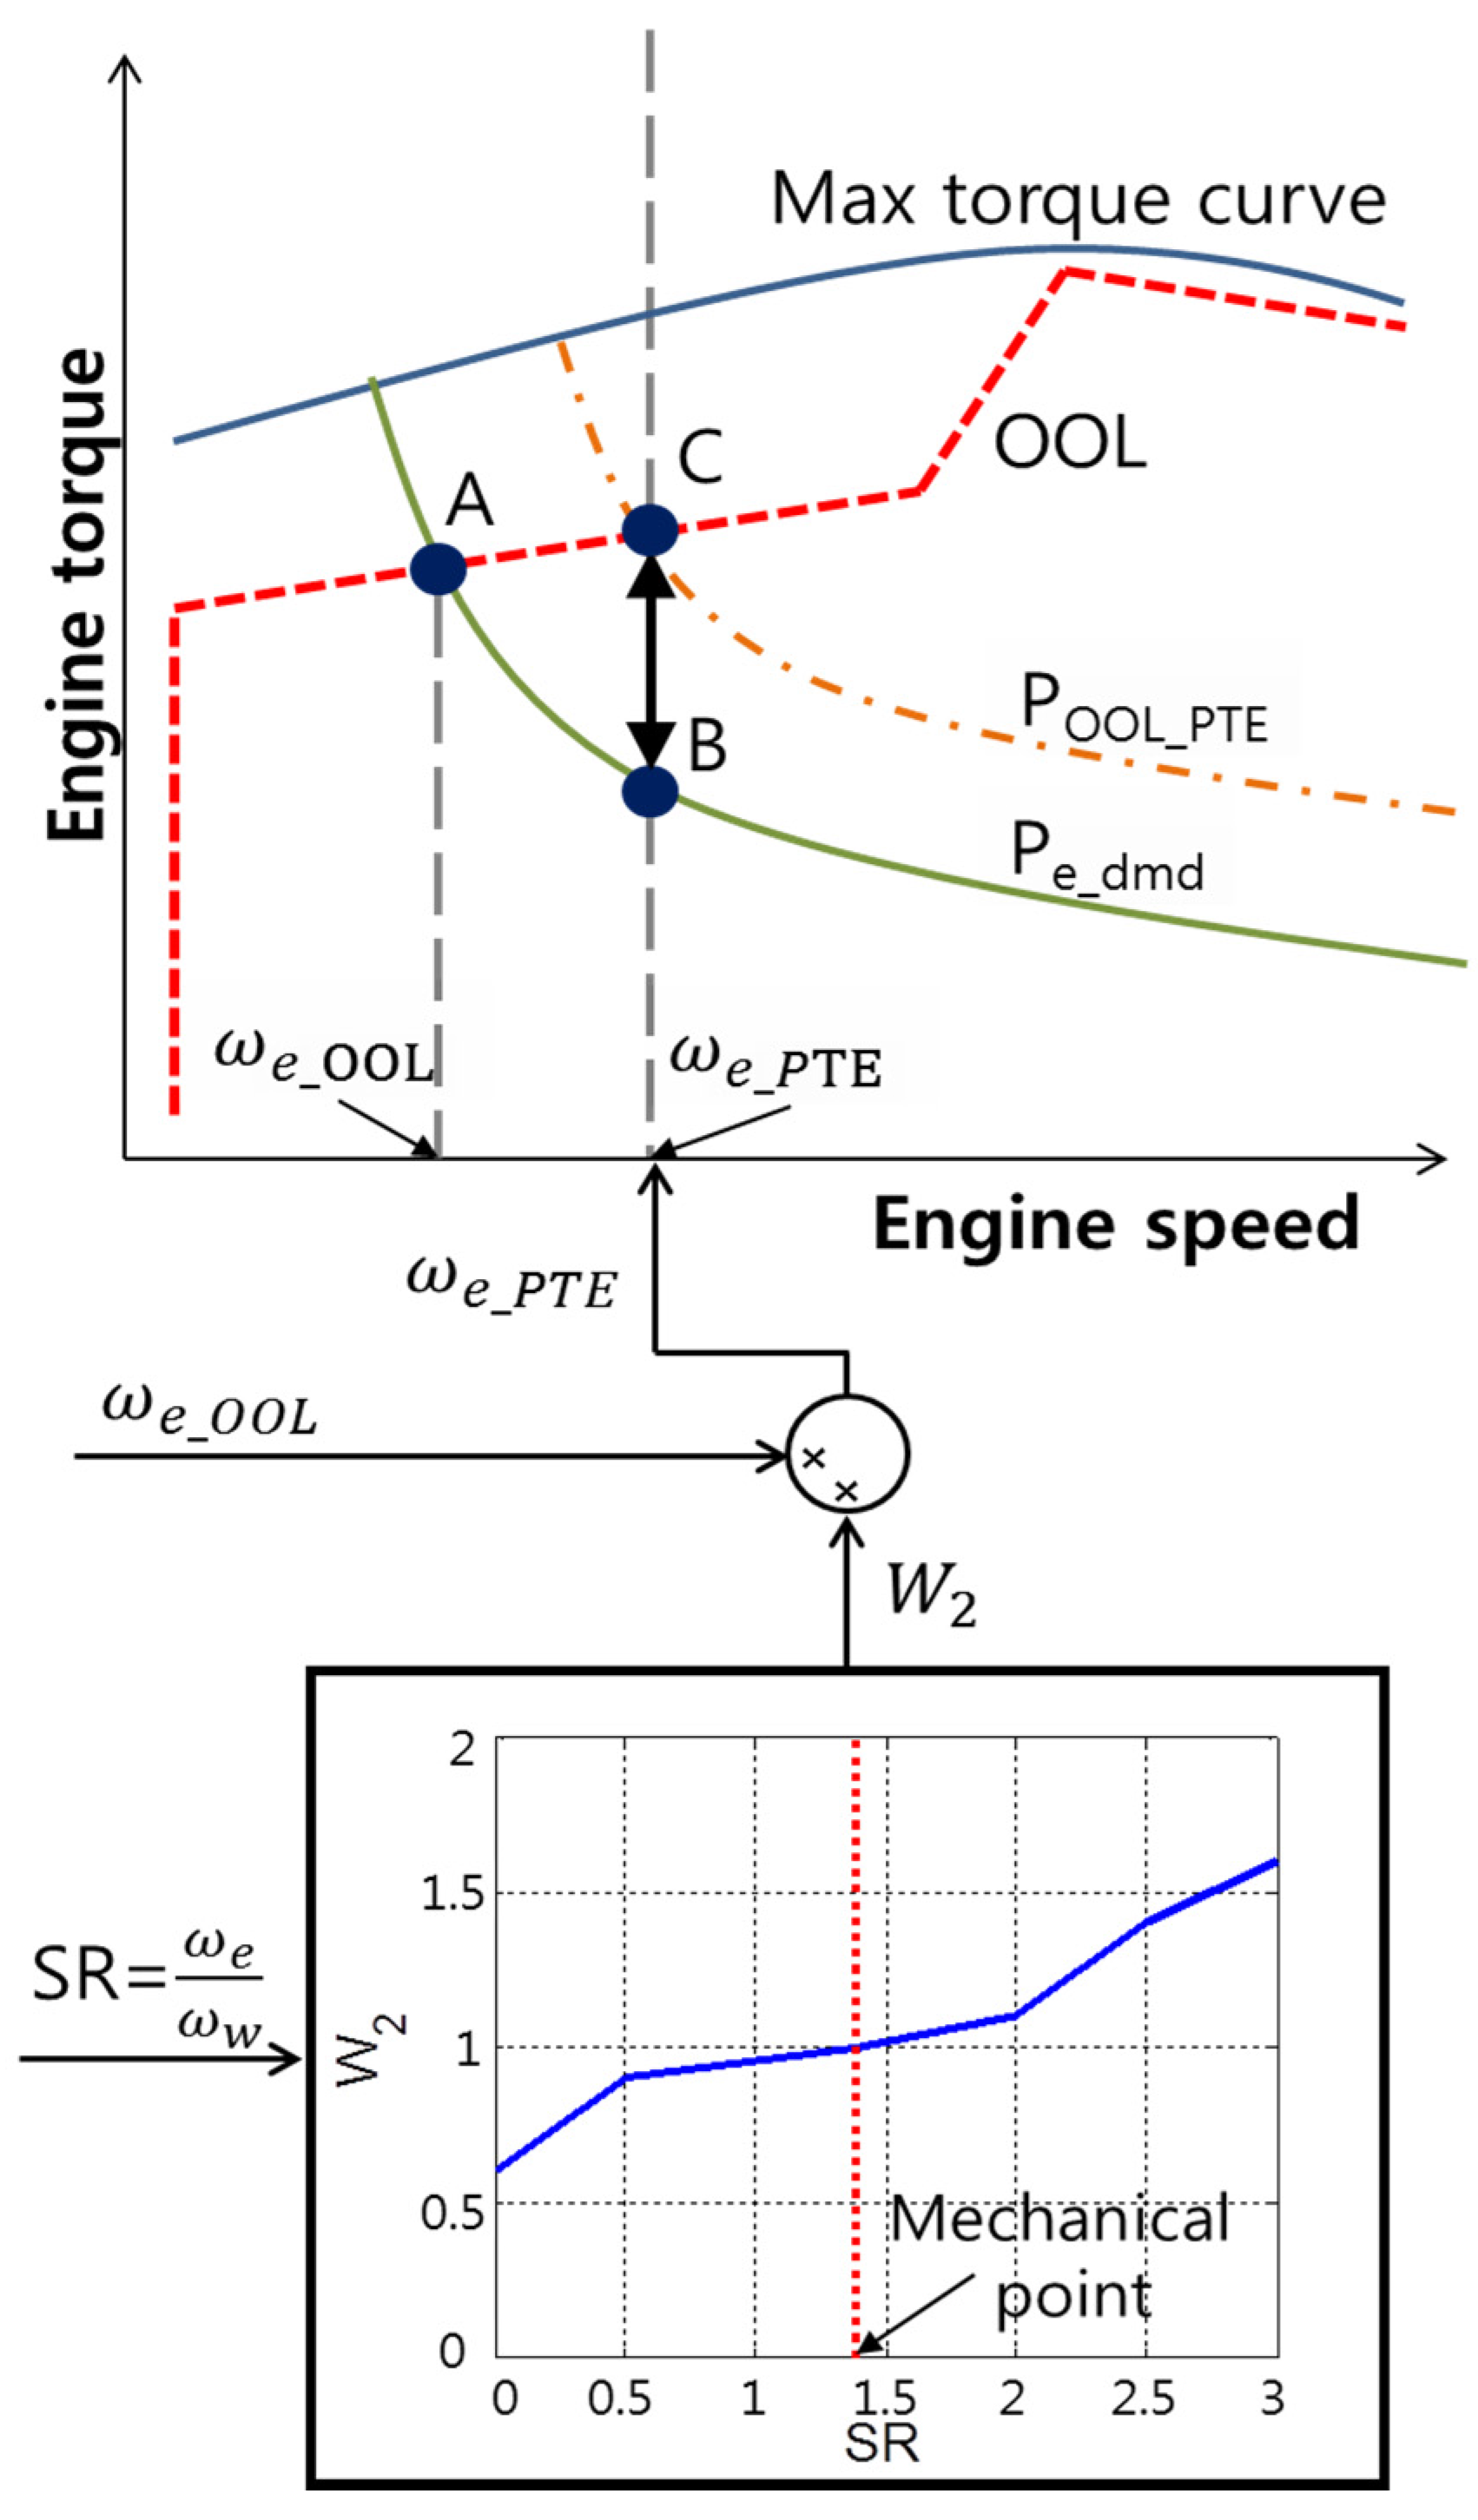
4.2. Engine on/off Control Algorithm Using DDA

As shown in Figure 7e,f, aggressive drivers had a frequent engine on/off and large variation in the engine speed and torque compared to cautious drivers. Accordingly, the energy loss increases whenever the engine starts. To reduce the energy loss due to the frequent engine on/off, an engine on/off control algorithm reflecting driver characteristics was developed.
The aim of this control is to reduce the excessive engine on/off by controlling the engine on/off condition. To do this, threshold values of Ap and Bp are introduced using weight factors, as shown in Figure 10. The Ap and Bp threshold values were set at 0.1 and 0.05 as their minimum values, respectively, for the cautious driver, DDA = 0–0.3. For the driver with DDA = 0.3–0.8, a weight factor was set to make Ap and Bp threshold values increase linearly. In this section, as DDA increases, Ap and Bp threshold values also increase linearly. Therefore, unnecessary engine on/off operations can be reduced by allowing the engine on/off only when Ap and Bp are larger than the more cautious driver. For DDA = 0.8–1, aggressive drivers, maximum values of Ap and Bp thresholds were set at 0.4 and 0.3, respectively, because the engine on/off rarely occurs if threshold values are too large. This allows the engine on/off only when Ap and Bp are sufficiently large for the aggressive driver. However, it does not have much influence on the cautious driver, because small threshold values are set for DDA = 0–0.3. In this study, the maximum value of each threshold was determined based on the test data from the VIDE.
Figure 10. Weight factors of the engine on (a) and off (b) threshold value.
Energies 08 10106 g010
Figure 11 and Figure 12 show simulation results for the aggressive driver (Driver 9) and the cautious driver (Driver 7) with and without the engine on/off control algorithm with respect to the FTP-72 driving cycle. To investigate the engine on/off characteristics more carefully in the time domain, the time response for t = 0–320 s was compared for Ap, Bp, engine speed and torque and MG1 and MG2 power. The vehicle velocity followed the driving cycle for both drivers regardless of the engine on/off control (Figure 11a and Figure 12a). The battery SOC with the engine on/off control decreased more slowly than that without the engine on/off control for the aggressive driver (Figure 11b). The Ap and Bp showed almost the same behavior for both controls (Figure 11c,d). The frequency of the aggressive driver’s on/off control was reduced by the proposed engine on/off control according to DDA. For the cautious driver (Figure 12), similar results are observed regardless of the engine on/off control, since the threshold values of Ap and Bp were determined based on the aggressive driver.
In Figure 13, equivalent fuel economy is compared. It is apparent from Figure 13 that the fuel economy of the aggressive driver (Driver 9) improved by 7.3% using the engine on/off control according to DDA. This improvement was achieved with reduced energy loss from the reduced engine on/off and reduced battery energy consumption (Figure 11).
However, in spite of the fuel economy improvement, it is found that the battery SOC reduction is still large compared to that of the cautious driver (Figure 11f and Figure 12f). To prevent a rapid reduction in the battery SOC for the aggressive driver, the battery needs to be charged by the engine. However, if the engine operation for charging the battery is carried out in the poor fuel consumption region, the vehicle fuel economy may deteriorate. Therefore, in this study, an engine operation strategy for charging the battery is proposed, which controls the amount of battery charging power according to the DDA.
Figure 11. Simulation results of the aggressive driver (Driver 9) for engine on/off control. (a) velocity; (b) battery SOC; (c) velocity; (d) Ap; (e) Bp; (f) engine speed; (g) engine torque; (h) MG1 power; (i) MG2 power.
Energies 08 10106 g011
Figure 12. Simulation results of the cautious driver (Driver 7) for engine on/off control. (a) velocity; (b) battery SOC; (c) velocity; (d) Ap; (e) Bp; (f) engine speed; (g) engine torque; (h) MG1 power; (i) MG2 power.
Energies 08 10106 g012
Figure 13. Comparison of equivalent fuel economy for the engine on/off control. (a) Driver 7; (b) Driver 9.
Energies 08 10106 g013

4.3. Battery Charging Power Control

In a power-split-type PHEV, the vehicle efficiency is significantly influenced by the transmission efficiency in HEV mode where the ICE and the motor work together. In general, a power-split-type transmission has the highest efficiency at the mechanical point where all of the power is transmitted through the mechanical part, such as planetary gears without power split to the electrical part [19]. The transmission efficiency decreases as the speed ratio departs from the mechanical point, because the magnitude of the power split to the electrical part increases [19]. When the ICE is operated on the OOL, the total powertrain efficiency may decrease if the speed ratio is far from the mechanical point. To solve this problem, PTE (powertrain efficiency) control was proposed by considering both the ICE efficiency and transmission efficiency [20,21].
In this study, an engine operation algorithm that controls the battery charging power was proposed based on the PTE control for HEV mode.
In Figure 14, the powertrain system efficiency of the target PHEV is shown. The system efficiency was calculated using an MG1/MG2 efficiency map and planetary gear efficiency. It is noted that the system efficiency of the target PHEV has the highest value at the mechanical point, where the speed ratio SR ( ω e / ω R ) = 1.385. The system efficiency decreases in the low vehicle speed region for SR > 2.0. It is noted that the system efficiency decreases drastically at high vehicle speed regions (SR <0.5). Therefore, when the PHEV runs in HEV mode, the engine operation point needs to be moved to the point where the speed ratio is close to the mechanical point. This can be achieved as follows:
For the demanded engine power, P e _ d m d , the demanded engine speed ω e _ O O L is determined at Point A from the OOL [20]. The optimal operating line (OOL) can be obtained by connecting the engine operating point, which provides the minimum fuel consumption for various engine powers [22]. Then, the demanded engine speed for the PTE control ω e _ P T E is determined by multiplying the weight factor W 2 with respect to the speed ratio, SR. The weight factor plays a role in changing the engine speed to be closer to the mechanical point for a given vehicle velocity. In general, ω e _ P T E is higher than ω e _ O O L , so ω e _ P T E is obtained at the right side of ω e _ O O L .
Figure 14. System efficiency of the target PHEV in HEV mode.
Energies 08 10106 g014
From ω e _ P T E , Point C can be obtained on the OOL, and the engine power, P O O L _ P T E is determined from Point C as shown Figure 15. Using P O O L _ P T E and P e _ d m d , the engine power is determined by the condition, P O O L _ P T E > P e _ d m d as:
P e = P e _ d m d + W 3 × ( P O O L _ P T E P e _ d m d )
where W 3 is the weight factor according to the DDA. The weight factor W 3 is designed as shown in Figure 16.
Figure 15. Engine operation for battery charge.
Energies 08 10106 g015
It is apparent from Figure 16 that for a cautious driver with DDA = 0–0.3, W 3 is equal to zero, which means that P e _ d m d is used as the engine power from Equation (8). For DDA = 0.3–0.8, W 3 increases linearly, and for an aggressive driver with DDA = 0.8–1, W 3 is equal to one.
In Equation (8), the second term on the right side is the battery charging power. When P O O L _ P T E P e _ d m d , the engine power is determined to be P e = P e _ d m d .
Using Equation (8), we can control the amount of battery charging power around the OOL, where the engine operation is carried out with high thermal efficiency. Since the amount of battery charging power increases according to DDA, it is expected that rapid battery SOC reduction can be reduced for an aggressive driver by the proposed engine operation algorithm.
Figure 16. Weight factor for battery charging power.
Energies 08 10106 g016

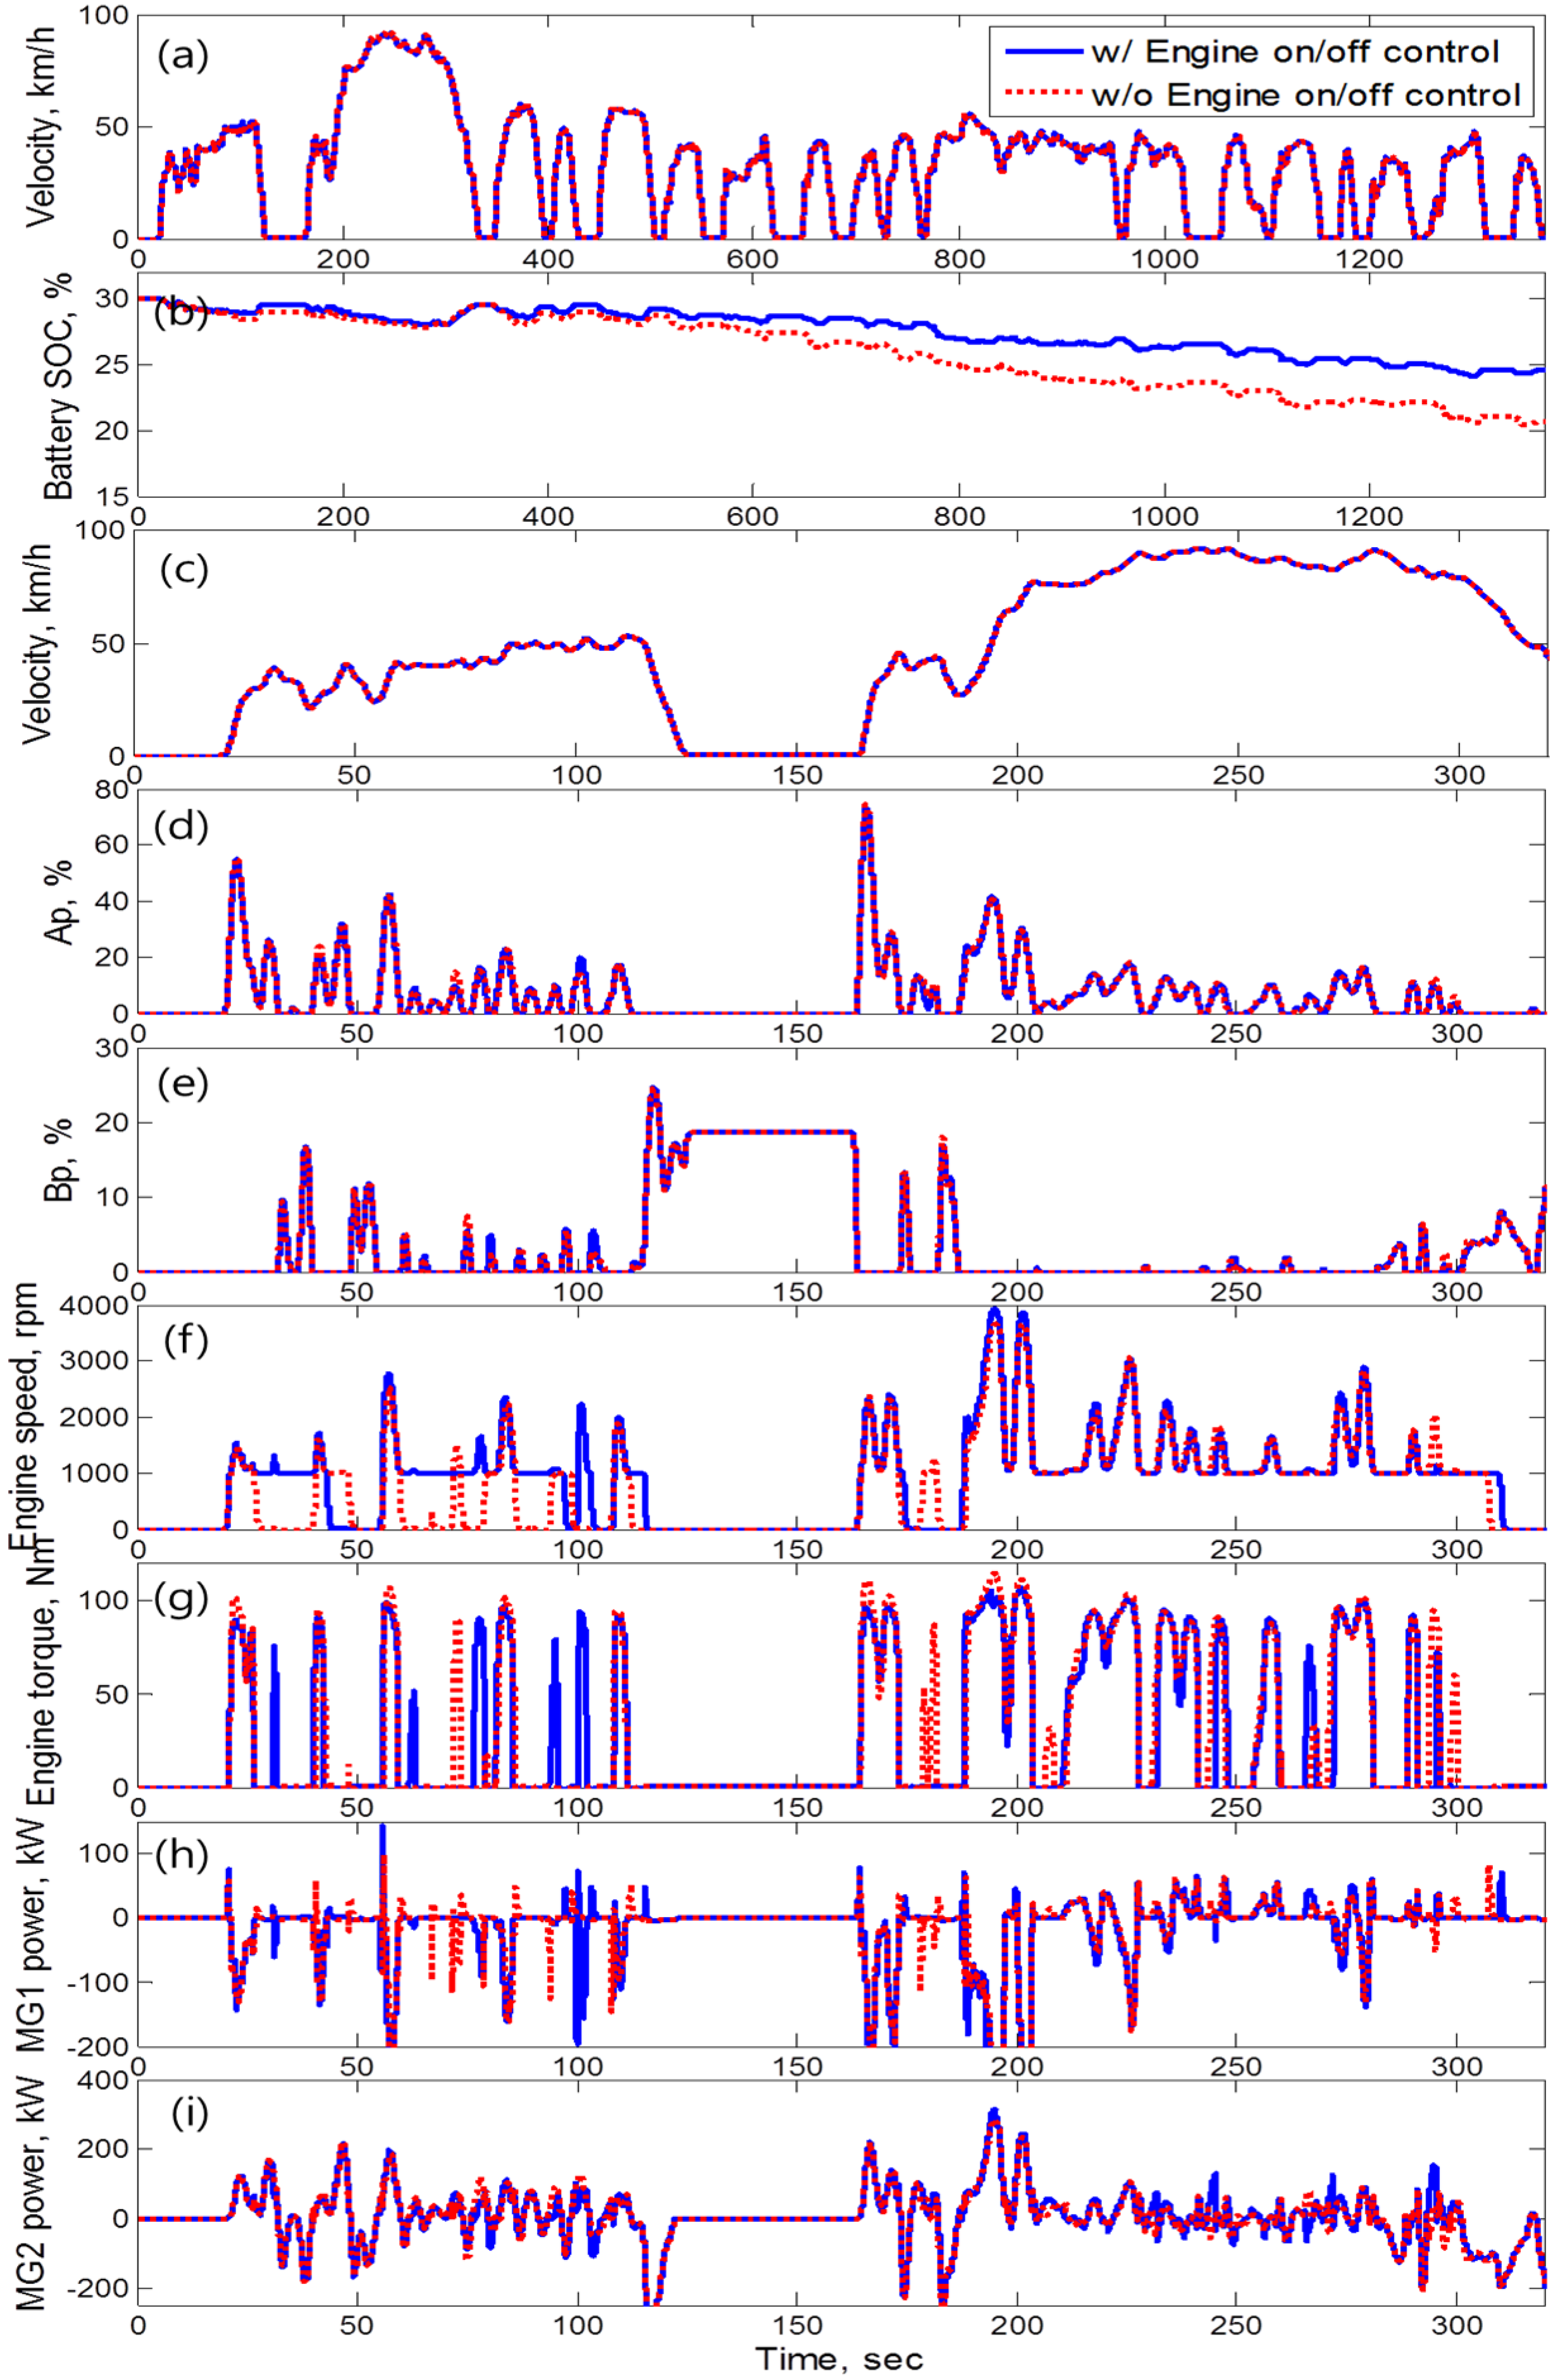
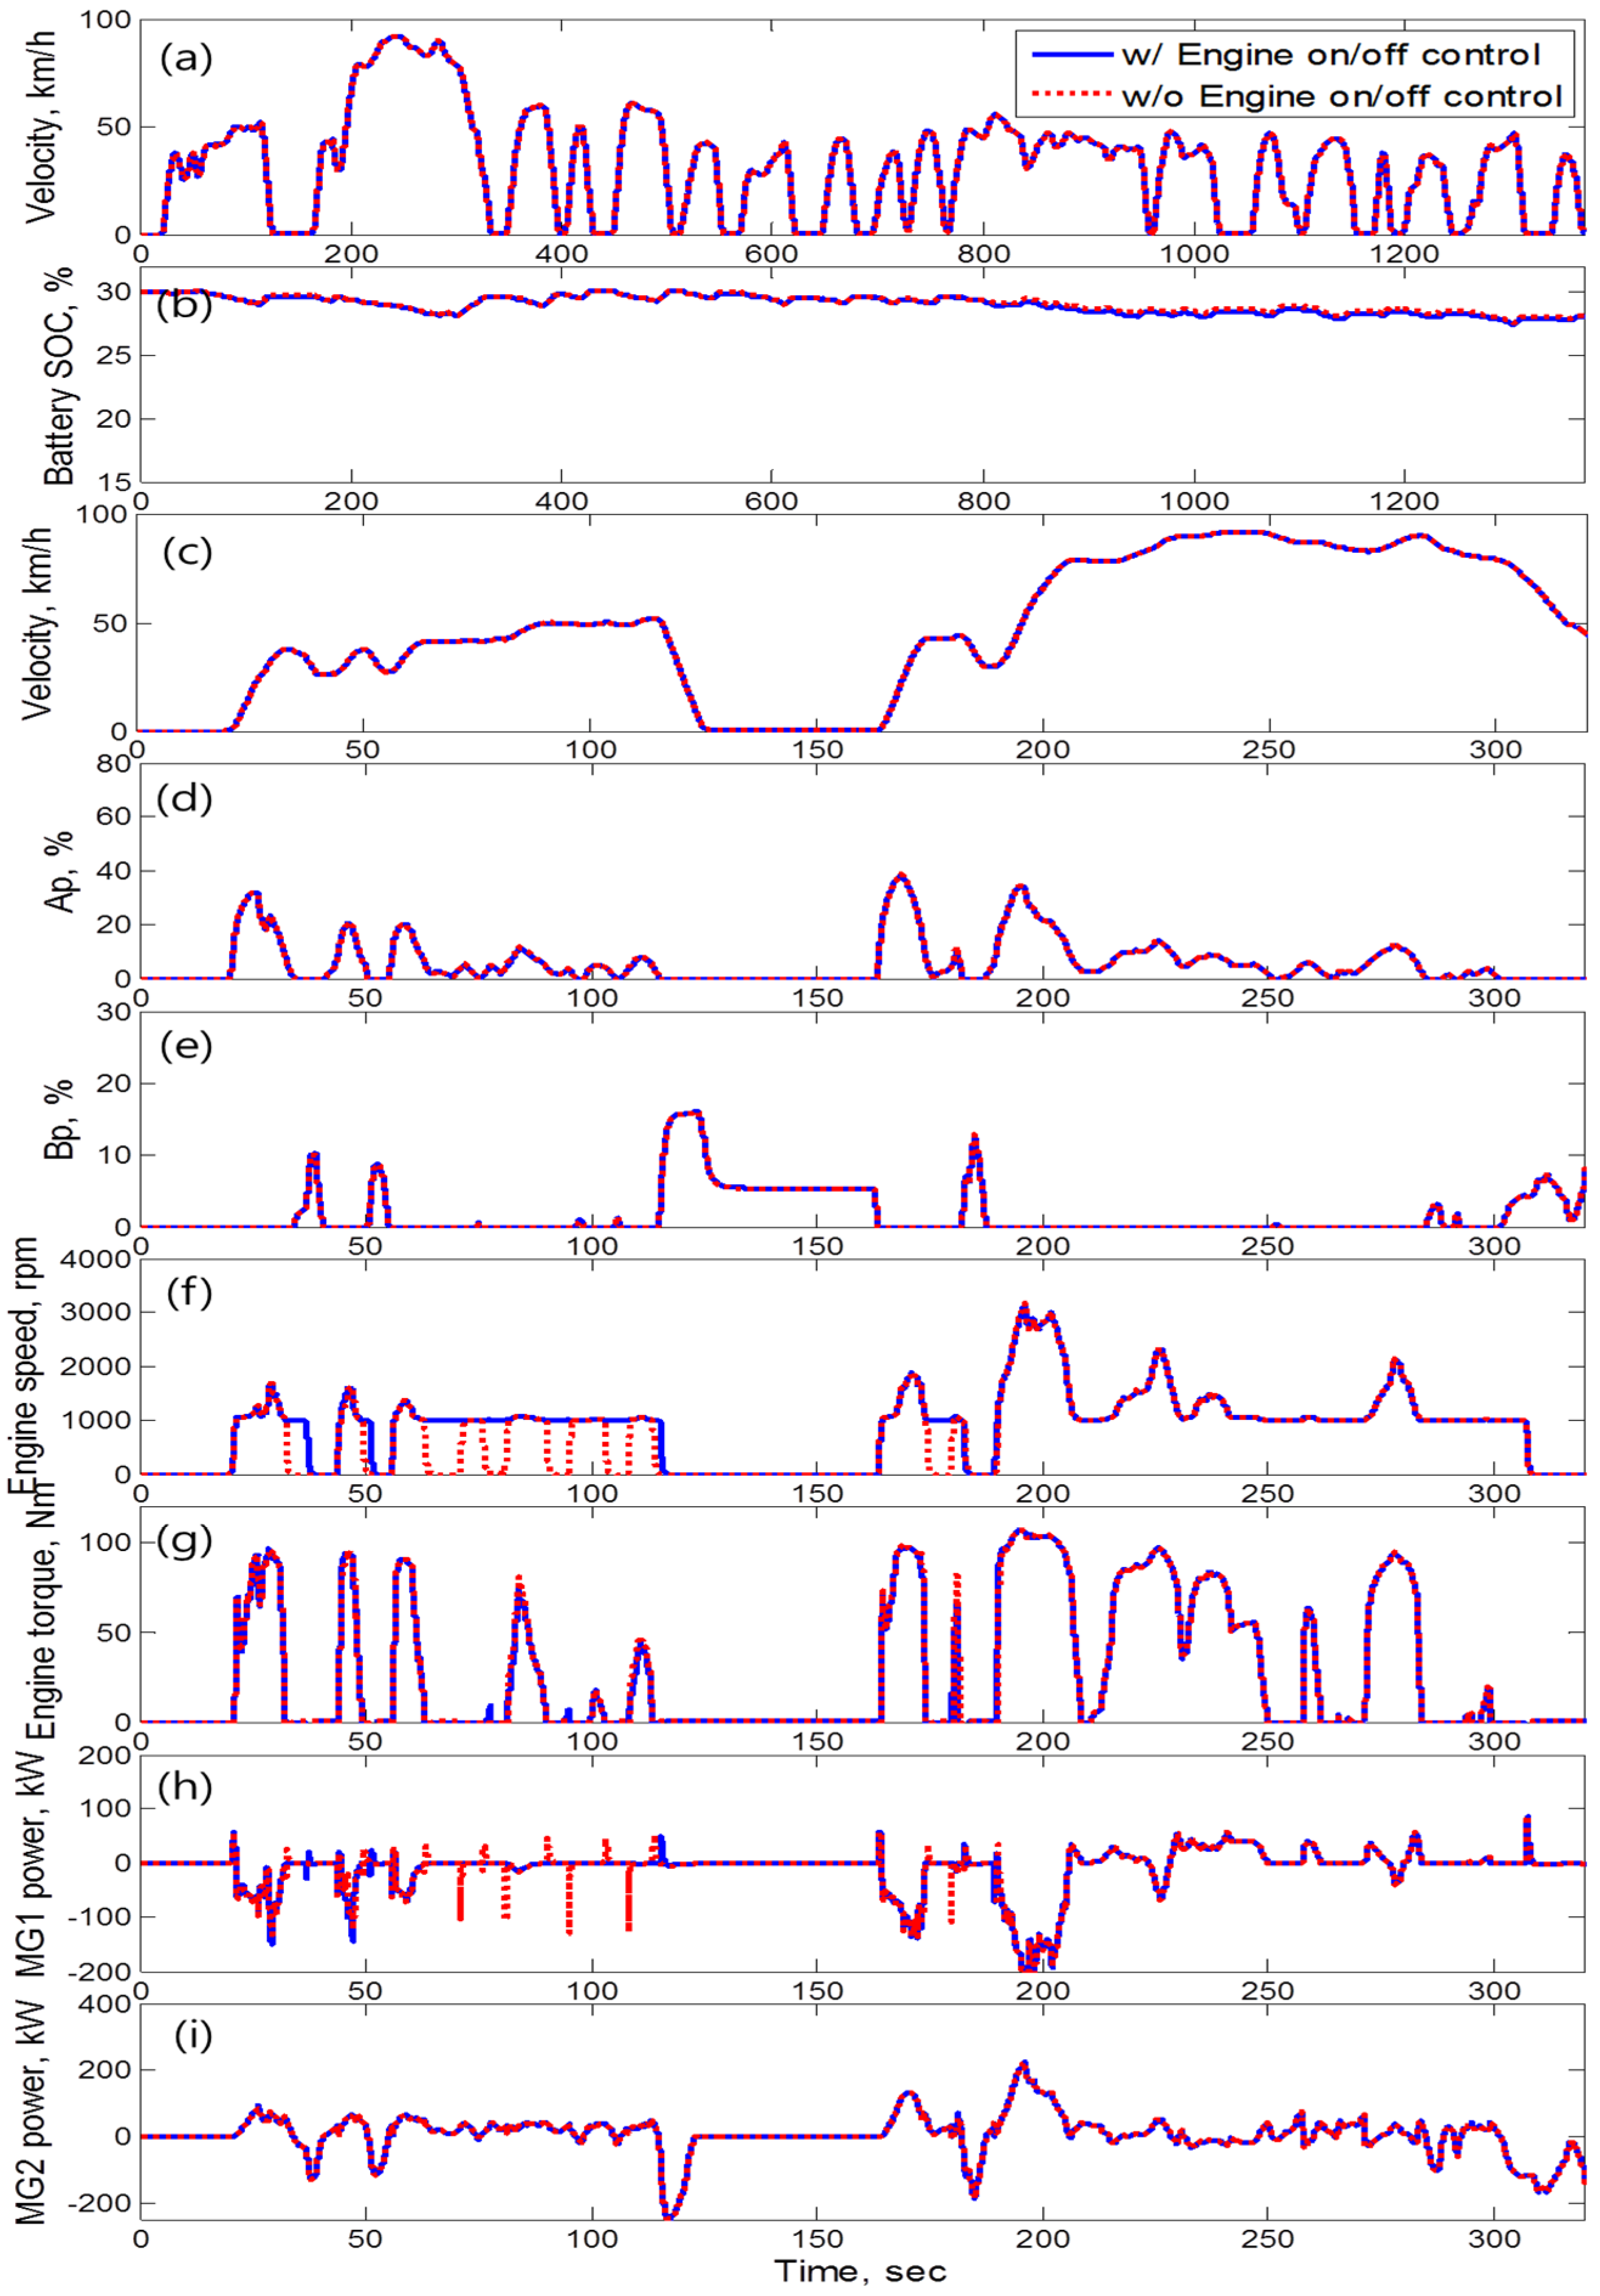
5. Performance Evaluation of the Control Algorithm Considering Driver Tendency for Fuel Economy Improvement

Performance of the engine on/off and the engine operation algorithm to determine the battery charging power based on driver characteristics was compared to the existing OOL control. To evaluate the performance of the control algorithm proposed in this study, a simulation was conducted to drive the FTP-72 driving cycles continuously. The algorithm proposed in this study (DDA control) controls the engine on/off and battery charging power. Thus, a vehicle should run in CS mode where the ICE and motor work together to evaluate the algorithm’s performance. The target PHEV switches from CD mode to CS mode when the battery SOC reaches 23%. Furthermore, even if a battery SOC is more than 23%, the vehicle drives in CS mode when the EV switch is off. Therefore, simulations were performed by setting the EV switch to off and 30% of the initial battery SOC. Figure 17 compares the simulation results for an aggressive driver (Driver 9) for the proposed control (DDA control) and the existing OOL control.
The vehicle velocity (Figure 17a) followed the driving cycle closely for both control types. The battery SOC remained around 30% for the FTP-72 driving cycle. The time responses of Ap, Bp, engine speed and torque and MG1 and MG2 power were compared for t = 0–320 s. Ap and Bp showed almost the same value for both control types (Figure 17b,c). The engine on/off was reduced by the DDA control (Figure 17d,e). It is noted that the engine speed remained higher than that of OOL for t = 200–320 s with the DDA control, thereby maintaining the SR around the mechanical point, SR = 1.385, whereas the SR of the OOL control changed between SR = 1.0 and SR = 2.5.
Figure 18 compares the equivalent fuel economy for the aggressive driver (Driver 9) between the DDA and OOL controls. The equivalent fuel economy was calculated to compensate the SOC difference at the end of the trip using the following Equation [17]:
D ( S O C i n i t i a l S O C f i n a l ) × Q E g + Δ m f u e l ρ f u e l
where D is the driving distance, Q is the battery capacity, E g is the gasoline-equivalent energy of electricity, Δ m f u e l is the engine fuel consumption and ρ f u e l is fuel density. As shown in Figure 18, the DDA control improved the equivalent fuel economy by 17.3% over the OOL control.
Figure 17. Simulation results of the aggressive driver (Driver 9) for the optimal operating line (OOL) control and the DDA control. (a) velocity; (b) battery SOC; (c) Ap; (d) Bp; (e) engine speed; (f) engine torque; (g) MG2 power; (h) speed ratio.
Energies 08 10106 g017
Figure 18. Comparison of the equivalent fuel economy for the OOL control and the DDA control.
Energies 08 10106 g018

6. Conclusions

In this study, the engine on/off and engine operation algorithm for battery charging power were proposed to improve the fuel economy of a power-split-type PHEV (plug-in hybrid electric vehicle).
First, powertrain models of the target PHEV, including the engine, MG1 (motor/generator 1), MG2, power split device, battery and vehicle models, were obtained. Based on the dynamic models, a vehicle performance simulator was developed, and its performance was verified by comparing the dynamo test results. To simulate driver characteristics, vehicle speed, Ap and Bp were collected using a VIDE (virtual integrated driving environment), and a driver model was developed. Mean values of the change rates of Ap and Bp and the number of crossings between Ap and Bp were used to categorize drivers.
To represent the driver tendency quantitatively, the DDA (degree of driver aggression) was proposed based on fuzzy logic, which has a value of 0–1. The closer the DDA is to one, the more aggressive the driver.
For aggressive drivers, demanded vehicle driving power and braking power are relatively large and change frequently, which causes the frequent engine on/off and rapid decreases the battery SOC due to the abrupt acceleration and deceleration. To reduce the frequent engine on/off for aggressive drivers, an engine on/off control algorithm for the target PHEV was proposed using a weight factor according to the DDA. In addition, to prevent a fast reduction in battery SOC, an engine operation algorithm was proposed to determine the battery charging power. This algorithm makes the engine operate in the region by considering both the engine and transmission efficiency according to the DDA. The performance of the engine on/off and battery charging power control algorithm were compared to those of the existing OOL control. It was found that the proposed algorithm reduced frequent engine on/off and can maintain a battery SOC by utilizing the battery charging power control based on the driver characteristics, which improves fuel economy by 17.3% compared to the existing control for an aggressive driver.

Acknowledgments

This work was supported by The Ministry of Trade, Industry and Energy and the Korea Automotive Technology Institute.

Author Contributions

Seulgi Lee and Jingyu Choi performed analysis and VIDE simulation, Kiyun Jeong provided VIDE facilities and vehicle data. Prof. Hyunsoo Kim supervised the analysis and simulation. In addition, Seulgi Lee, Jingyu Choi and Prof. Hyunsoo Kim wrote the paper.

Conflicts of Interest

The authors declare no conflict of interest.

References

  1. PwC. Shale Oil: The Next Energy Revolution. Available online: http://www.pwc.com/en_GX/gx/oil-gas-energy/publications/pdfs/pwc-shale-oil.pdf (accessed on 27 August 2015).
  2. Climate Works Fundation. Policies That Work: How Vehicle Standards and Fuel Fees Can Cut CO2 Emissions and Boost the Economy; Climate Works Foundation: San Francisco, CA, USA, 13 December 2012. [Google Scholar]
  3. Wirasingha, S.G.; Schofield, N.; Emadi, A. Plug-in Hybrid Electric Vehicle Developments in the US: Trends, Barriers, and Economic Feasibility. In Proceedings of the IEEE Vehicle Power and Propulsion Conference, Harbin, China, 3–5 September 2008; pp. 1–8.
  4. Murphey, Y.; Milton, R.; Kiliaris, L. Driver’s Style Classification Using Jerk Analysis. In Proceedings of the IEEE Computational Intelligence in Vehicles and Vehicular Systems, Nashville, TN, USA, 30 March–2 April 2009; pp. 23–28.
  5. Lee, S.; Choi, J.; Park, S.; Pi, J.; Shin, H.; Jeong, K.; Kim, H. Development of a Control Algorithm to Improve Fuel Economy for PHEV considering Driver Tendency. In Proceedings of the 10th International Conference on Ecological Vehicles and Renewable Energies, Monte-Carlo, Monaco, 31 March–2 April 2015.
  6. Kamichi, K.; Yamamoto, M.; Fushiki, S.; Yoda, T.; Kurachi, S.; Kojima, K. Development of Plug-In Hybrid System for Midsize Car; Society of Automotive Engineers: Detroit, MI, USA, 16 April 2012. [Google Scholar]
  7. Zhang, D.; Luo, Y.; Luo, W.; Bao, Y.; Peng, W.; Li, S. Investigation of Novel Ultraviolet Detecting System Used in Aero Magneto Ignition Energy Monitoring. In Proceedings of the 9th International Conference on Electronic Measurement & Instruments (ICEMI), Beijing, China, 16–19 August 2009; pp. 164–167.
  8. Kim, J.; Sim, H.; Oh, J. The Flexible EV/HEV and SOC Band Control Corresponding to Driving Mode, Driver’s Driving Style and Environmental Circumstances; Society of Automotive Engineers: Detroit, MI, USA, 16 April 2012. [Google Scholar]
  9. Takasaki, A.; Mizutani, T.; Kitagawa, K.; Yamahana, T.; Odaka, K.; Kuzuya, T.; Mizuno, Y.; Nishikawa, Y. Development of New Hybrid Transmission for 2009 Prius. In Proceedings of the International Battery, Hybrid Fuel Cell Electric Vehicle Symposium (EVS24), Stavanger, Norway, 1 June 2009.
  10. Matsubara, T.; Yaguchi, H.; Takaoka, T.; Jinno, K. Development of New Hybrid System for Compact Class Vehicles; Society of Automotive Engineers: Detroit, MI, USA, 4 April 2009. [Google Scholar]
  11. Toyota Prius Plug-In Hybrid. Available online: http://en.wikipedia.org/wiki/Toyota_Prius_Plug-in_Hybrid (accessed on 27 August 2015).
  12. Li, S.; Ke, B. Study of Battery Modeling using Mathematical and Circuit Oriented Approaches. In Proceedings of the IEEE Power and Energy Society General Meeting, San Diego, CA, USA, 24–29 July 2011; pp. 1–8.
  13. Ma, C.; Kang, J.; Choi, W.; Song, M.; Ji, J.; Kim, H. Comparative Study on Power Characteristics and Control Strategies for Plug-in Hybrid Electric Vehicle. Int. J. Automot. Technol. 2012, 12, 505–516. [Google Scholar] [CrossRef]
  14. Lee, S.; Choi, J.; Park, S.; Pi, J.; Shin, H.; Jeong, K.; Kim, H. Control Strategy to Improve Fuel Economy for Plug-in Hybrid Electric Vehicle considering Degree of Driver Aggression. In Proceedings of the 28th International Electric Vehicle Symposium and Exhibition, Ilsan, Korea, 3–6 May 2015.
  15. Lee, S.; Park, T.; Son, J.; Won, K.; Lee, H. Development of a Driver Model for the Analysis of Fuel Economy; Korea Society of Automotive Engineers: Ilsan, Korea, 21 November 2012; pp. 2284–2292. [Google Scholar]
  16. Meng, Y.; Jennings, M.; Tsou, P.; Brigham, D.; Bell, D.; Soto, C. Test Correlation Framework for Hybrid Electric Vehicle System Mode; Society of Automotive Engineers: Detroit, MI, USA, 12 April 2011. [Google Scholar]
  17. U.S. Department of Energy. Electric and Hybrid Vehicle Research, Development, and Demonstration Program; Petroleum-Equivalent Fuel Economy Calculation; U.S. Department of Energy: Washington, DC, USA, 12 June 2000.
  18. Fesefeldt, T.; Müller, S. Optimization and Comparison of Quick and Hybrid Start. Society of Automotive Engineers: Detroit, MI, USA, 20 April 2009. [Google Scholar]
  19. Kang, J.; Choi, W.; Kim, H. Development of a control strategy based on the transmission efficiency with mechanical loss for a dual mode power split-type hybrid electric vehicle. Int. J. Automot. Technol. 2012, 13, 825–833. [Google Scholar] [CrossRef]
  20. Liu, J.; Peng, H. Control Optimization for a Power-Split Hybrid Vehicle. In Proceedings of the 2006 American Control Conference, Minneapolis, MN, USA, 14–16 June 2006.
  21. Kim, N.; Carlson, R.; Jehlik, F.; Rousseau, A. Tahoe HEV Model Development in PSAT; Society of Automotive Engineers: Detroit, MI, USA, 2009. [Google Scholar]
  22. Ahn, K.; Papalambros, P.Y. Engine optimal operation lines for power-split hybrid electric vehicles. J. Automob. Eng. 2009, 223, 1149–1162. [Google Scholar] [CrossRef]

