Article

Influence of Combustion Parameters on Fouling Composition after Wood Pellet Burning in a Lab-Scale Low-Power Boiler

Industrial Engineering School, University of Vigo, Campus Lagoas-Marcosende, s/n, 36310 Vigo, Spain
*
Author to whom correspondence should be addressed.
Energies 2015, 8(9), 9794-9816; https://doi.org/10.3390/en8099794
Submission received: 20 December 2014 / Revised: 6 July 2015 / Accepted: 3 September 2015 / Published: 9 September 2015
(This article belongs to the Collection Bioenergy and Biofuel)

Abstract

:
The present study aims to evaluate the effect of different operating conditions on fouling composition after woody biomass combustion in an experimental low-power fixed-bed boiler. The boiler was built specifically for research purposes and allows easy removal of areas susceptible to fouling and the control, modification and registry of combustion parameters. The influences of the total airflow supplied and the deposition probe temperature were studied in fouling; differentiating between the layers of fouling adhered to the tube and those deposited over the tube. Thermogravimetry and Differential Scanning Calorimetry (TG-DSC) and Scanning Electron Microscopy with Energy Dispersive X-Ray Spectroscopy (SEM-EDS) were performed in order to determine a relationship between the fouling composition and the combustion parameters used. Upon increasing the total airflow supplied and the deposition probe temperature, the amount of organic matter, namely unburned carbon, decreased, indicating a better combustion efficiency. Chemical analysis results of fouling deposits showed that inorganic elements presented different behaviors depending on the collection area and the combustion parameters. Non-volatile elements such as Si and Ca were mostly found in the coarse fraction of the bottom ash and minor amounts were deposited over the tube. Small amounts of Cl in biomass generated serious deposition problems, especially during combustions with low airflow rates.

1. Introduction

The growing awareness of environmental issues causes a demand for energy applications based on renewable sources, representing up to 14% of the total world energy demand [1]. Among them, biomass offers a huge potential [2,3], as biomass fuels can be used as substitutes for fossil fuels but do not affect global warming [4,5]. The same amount of CO2 absorbed during the growth stage of biomass through photosynthesis is released in a complete combustion, which results in no net increase in this greenhouse gas in the atmosphere [5,6]. The use of biomass not only possesses environmental benefits [1] but also social and economic, and it can contribute to rural development via energy diversification and create new employment; it also helps restore unproductive and degraded lands, increasing biodiversity, soil fertility and water retention [2,4].
The main structural organic constituents of biomass are cellulose, hemicellulose and lignin, and associated with these organic matrices, there are other major, minor and accessory organic and inorganic compounds [7,8,9]. The chemical composition of biomass is highly variable; proximate, ultimate and ash analyses differ depending on the type of biomass studied [10]. According to Vassilev et al. [10], the main elements of biomass, in decreasing order of abundance, are commonly C, O, H, N, Ca, K, Si, Mg, Al, S, Fe, P, Cl, Na, Mn, and Ti. In comparison with coal, biomass has a lower heating value, and biomass has a higher content of moisture, volatile matter and some elements such as H, Mn, K, P, Cl, Ca, Mg, Na and O, but it is depleted in ash and elements such as Al, C, Fe, N, S, Si and Ti [10,11].
Biomass combustion for the production of energy is a complex process, which consists of consecutive homogeneous and heterogeneous reactions [7]. However, it generates a considerable amount of ash that leads to operational problems in boilers such as fouling, slagging, corrosion, abrasion, erosion, bed agglomeration, sintering, clinkering and others [1,12,13,14,15,16,17,18]. Specifically, the deposits on the surfaces of heat transfer tubes or components in the boiler that are mainly subjected to convection are called fouling; otherwise, deposits formed on the surfaces subjected to radiation are called slagging [1,7,12,19]. Basically, slagging and fouling reduce heat transfer with the heat exchanger surfaces, and they also accelerate corrosion and erosion on these surfaces and other combustor surfaces [1], causing a decrease in exchange efficiency and an increase in maintenance costs of facilities [20,21,22].
The main contributions to fouling come from the inorganic chemical composition of the biomass used in combustion [7]. Primarily, alkali metals such as Na and K combined with other elements such as Si, S, but mainly Cl, are responsible for some of the aforementioned problems, and therefore, they are a major source of concern [1,7,16,23,24]. One of the ways to determine the fouling and slagging potential of a biomass is by calculating different deposition indices. These indices are based on the inorganic composition of the ash. However, most of the indices were first created for coal combustion [25]. Some of them have been used directly for biomass fuels or were slightly modified because literature on direct biomass indices is scarce [26,27]. These indices are just predictions of the potential for fouling and slagging. It is almost impossible to predict these phenomena unequivocally due to other parameters that affect them. Aside from the inorganic composition of the biomass ash, there are other properties that influence these problems. Some combustion problems could be caused by a high content in moisture or a low melting point of the ash [11]. Moreover, in the same combustion unit may be parameters that affect the fouling generated, such as airflows supplied or operating temperatures. The combustion parameter effects, of course, are less alarming than those caused by the biomass composition. However, it is critical to know the optimal operating point of a boiler. There are very few in-depth studies on this topic [28]. In addition, the knowledge of the mechanism of formation of deposits and the influence of the parameters involved in the combustion on fouling and slagging constitutes the key to interpreting these problems and the first step to removing them.
The present article is focused on the fouling deposits produced during the combustion of a wood pellet in an experimental fixed-bed low-power biomass boiler. First, several theoretical deposition indices were calculated in order to predict fuel fouling and slagging potential. However, the main objective was to evaluate the effect of different operating conditions on the fouling deposits composition. In particular, the influence of the airflow and the deposition probe temperature during combustion were studied in the organic and the inorganic matter of the deposits. For that, the thermal and chemical behavior of the samples were analyzed using Thermogravimetry and Differential Scanning Calorimetry (TG-DSC) and Scanning Electron Microscopy with Energy Dispersive X-Ray Spectroscopy (SEM-EDS). The novelty of this work comes from the combination of several factors that were investigated together: first, the study of the influence on fouling composition of two important combustion parameters, specifically the total airflow supplied and the deposition probe temperature; second, the analysis and comparison of two separated layers of fouling, “deposited fouling” and “adhered fouling”; and third, the characterization of the organic matter in the fouling deposits, which is a topic rarely investigated. The study of these three aspects together provides the research its originality.

2. Experimental Section

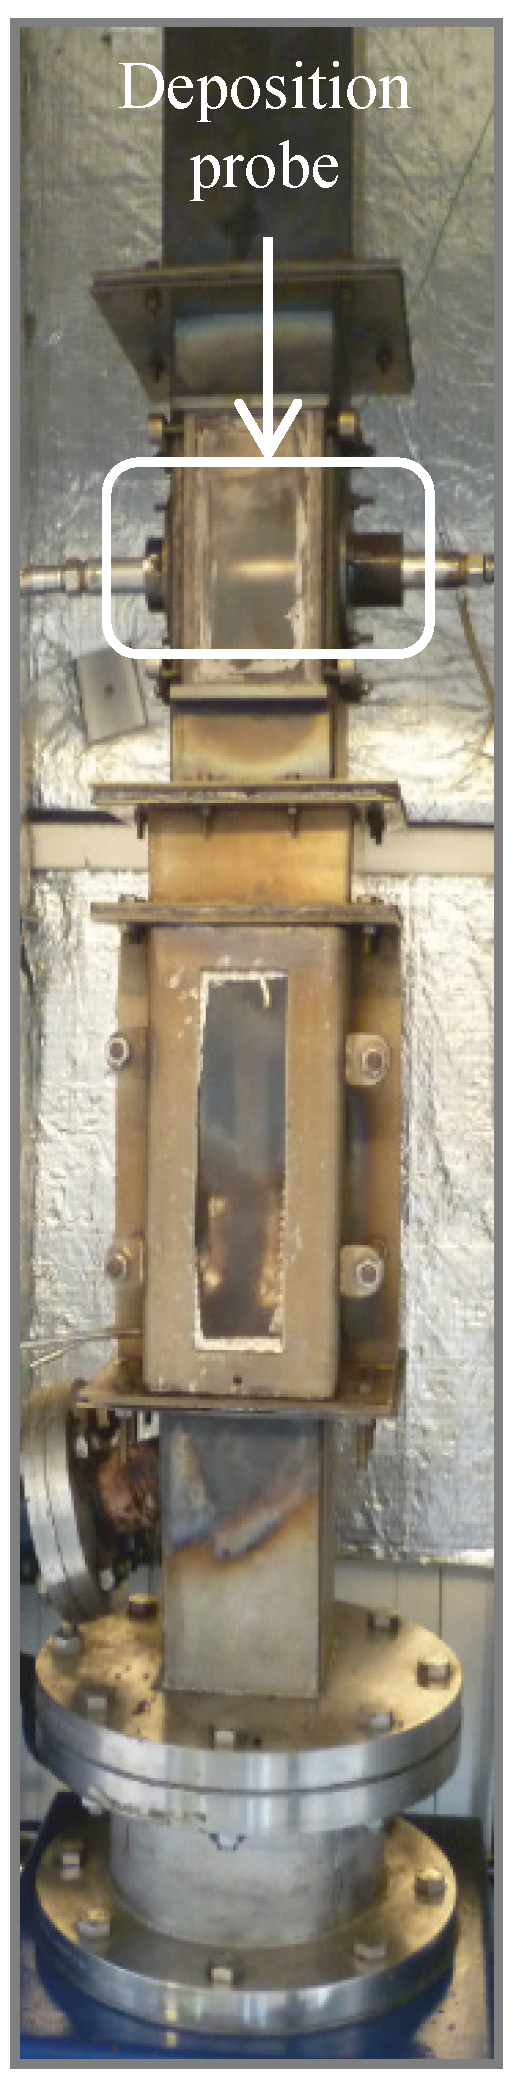
2.1. Combustion Facility

The experimental facility is a fixed-bed low-power boiler of approximately 10–15 kWth, built specifically for research purposes where areas susceptible to fouling are easily removable and combustion parameters can be controlled, modified and registered. The plant was presented in previous works [29,30] (Figure 1). The boiler has a stratified air inlet, where the primary air is introduced inside the bed while the secondary air is introduced over the bed surface. To qualitatively study the deposit formation on heat exchanger surfaces, a stainless steel water-cooled temperature-controlled deposition probe was used (see Figure 1).

2.2. Fuel Burned in the Experimental Plant

The fuel fired was a commercial pellet from natural wood. Its characterization is observed in Table 1.
Figure 1. Picture of the experimental facility: a lab-scale low-power biomass combustion boiler. The deposition probe position is indicated.
Energies 08 09794 g001
Table 1. Fuels characterization: proximate analysis, ultimate analysis and ash analysis of the wood pellet.
Proximate analysis (wt.% of dry fuel)
Moisture6.18
Volatile Matter70.57
Fixed Carbon26.11
Ash3.32
Ultimate analysis (wt.% of dry fuel)
C46.03
H5.95
N1.88
O *42.82 *
Analysis of ash using XRF (wt.% of ash)
Na2O0.36
MgO4.85
Al2O36.97
SiO235.46
P2O52.75
SO36.04
Cl0.95
K2O6.46
CaO28.03
TiO23.14
MnO0.29
Fe2O33.52
NiO0.02
CuO0.04
ZnO0.27
Heating value (MJ/kg in wet basis)
HV16.72
* O is calculated as follows: O = 100 – C – H – N – ash.

2.3. Combustions Performed and Samples Collected

The influences on fouling deposits composition of the total airflow supplied and the deposition probe temperature were studied. First, to investigate the influence of the total airflow supplied during the combustion, six different airflows were tested, keeping constant the distribution in the primary and secondary airflow and the deposition probe temperature; specifically, experiments 1 through 6 were performed (Table 2). Subsequently, in order to investigate the influence of the deposition probe temperature on the composition of the fouling deposits, two different temperatures with three different airflows were tested, keeping constant the distribution of the primary and secondary airflow. Tests 1, 3 and 6 were compared with 7, 8 and 9 (Table 2). The boundaries of the airflows were determined by the need to maintain a steady flame for 3 h and to confine the flame within the burner dimensions, while ensuring the heat exchanger tube was not reached by the flame. The temperatures of the deposition probe were sufficiently separated to distinguish differences in fouling deposits composition, but allowing the equipment to work correctly and steadily. The objective was to study the fouling deposits on low-temperature heat exchange zones, looking for the closest conditions to low-power biomass boilers. The temperature of 20–25 °C was established as the lowest temperature at which water could be maintained on the experimental boiler during 3 h of stable combustion. The temperature of 60–65 °C was established as a regular accumulation water temperature in domestic commercial boilers, following Spanish government guidelines.
Table 2. Description of the combustions performed.
ExperimentTotal time of stable combustionPrimary–secondary airflow distributionTotal airflow suppliedDeposition probe temperature
13 h25%–75%11 m3/h≈20 °C–25 °C
23 h25%–75%14 m3/h≈20 °C–25 °C
33 h25%–75%17 m3/h≈20 °C–25 °C
43 h25%–75%20 m3/h≈20 °C–25 °C
53 h25%–75%23 m3/h≈20 °C–25 °C
63 h25%–75%25 m3/h≈20 °C–25 °C
73 h25%–75%11 m3/h≈60 °C–65 °C
83 h25%–75%17 m3/h≈60 °C–65 °C
93 h25%–75%25 m3/h≈60 °C–65 °C
After each experiment, two different types of samples were collected from the deposition probe; the most superficial layer of deposits that could be collected only by shaking the tube, called “deposited fouling”, and the innermost layer of deposits, adhered to the deposition probe that had to be unstuck from the tube, called “adhered fouling” (Figure 2). The deposition probe was completely removable with easily accessible screw connections. Therefore, after each combustion the pipe was removed from the plant, the fouling deposits were collected, and the tube was exhaustively cleaned with water and chemical products and then mounted again.
Figure 2. Picture of the two different types of fouling samples collected in each of the experiments carried out and appearance of the heat exchanger tube after combustion.
Energies 08 09794 g002

2.4. Theoretical Deposition Indices

Several theoretical indices that predict fouling and slagging behavior of a solid fuel were calculated. In the base-to-acid ratio (B/A) (Equation (1) of Table 3) [13,21,25,26,27,31,32], the compounds of group B (the oxides in the numerator) are basic and possess low melting points, whereas the compounds of group A (the oxides in the denominator) are acidic and possess higher melting points [26,33]. This base-to-acid ratio can be used in a simplified form as (B/A(simp)) (Equation (2) of Table 3) [13,25,33]. However, this deposition rate has been created for fuels with low phosphorus content, such as coal, which is not the case of biomass. P2O5 has a hemispherical temperature of 569 °C [33], such that a high content of phosphorus will enhance low melting phases, therefore, it was placed in the numerator (the B group) [26,33]. The base-to-acid ratio plus phosphorus (B/A(+P)) was calculated (Equation (3) of Table 3) [26,33]. These ratios indicate the potential tendencies for slagging and fouling. Otherwise, there are other ratios specifically for slagging, such as slagging index (RS), (Equation (4) of Table 3) [13,26,33] and, slag ratio (SR), indicative of the slag viscosity (Equation (5) of Table 3) [21,25,26]. For fouling, ratios such as fouling index (FU) (Equation (6) of Table 3) [13,26,33,34] are employed.
Table 3. Theoretical deposition rates. Ratios, equations and approximate ranges.
NameEquationEquation numberApproximate ranges
Base-to-acid ratio B A = F e 2 O 3 + C a O + M g O + N a 2 O + K 2 O S i O 2 + A l 2 O 3 + T i O 2 (1)(*)
Base-to-acid ratio (simplified) B A ( s i m p ) = F e 2 O 3 + C a O + M g O S i O 2 + A l 2 O 3 (2)
Base-to-acid ratio (+P) B A ( + P ) = F e 2 O 3 + C a O + M g O + N a 2 O + K 2 O + P 2 O 5 S i O 2 + A l 2 O 3 + T i O 2 (3)
Slagging index R S = ( B A ) · S d (4)RS < 0.6 low slagging
RS = 0.6–2.0 medium
RS = 2.0–2.6 high
RS > 2.6 extremely high
Slag ratio S R = S i O 2 S i O 2 + F e 2 O 3 + C a O + M g O · 100 (5)SR > 72 low slagging
72 ≥ SR > 65 medium
SR < 65 high
Fouling index F U = ( B A ) · ( N a 2 O + K 2 O ) (6)FU ≤ 0.6 low fouling
0.6 < FU ≤ 40 high
FU > 40 extremely high
(tendency to sintering of deposits)
Note: Each compound makes reference to its weight concentration in the ash shown in Table 1 (wt.% of the ash); Sd makes reference to the weight concentration of S on dry basis in the fuel (wt.% of dry fuel); (*) There is no clear consensus in literature relative to these ratios. Pronobis et al. [33] stated that slagging was low when B/A(simp) < 0.75, it increased when B/A(simp) = 0.75–2.0 and when B/A(simp) ≥ 2 the dependence was not noticeable. However, Teixeira et al. [13] found that slagging was higher for B/A ≈ 0.75, was lower when B/A increased from 0.75 to 2 or decreased below 0.75. There was also found that slagging or fouling propensity was low or medium when B/A < 0.4 or B/A > 0.7 and high or severe when B/A = 0.4–0.7 [35]. Otherwise, Viana et al. [27] mentioned that only slagging could be expected when B/A < 0.75.

2.5. Thermal and Chemical Analysis Performed to the Samples

2.5.1. Thermogravimetry and Differential Scanning Calorimetry (TG-DSC)

Thermal analysis was performed on a Labsys TG-DTA/DSC thermogravimeter from SETARAM Instrumentation (Vigo, Spain) on all of the samples collected. The sample preparation was simple because samples collected from the deposition probe were in the solid state, powdered and of a small grain size. Therefore samples were collected, homogenized and stored separately in bags until their analysis. Approximately 10 mg of each of the samples was heated with a nitrogen flow rate of 50 mL/min from 20 °C to 105 °C at a heating rate of 20 °C/min, and this temperature was maintained for 10 min. Subsequently, the samples were heated from 105 °C to 550 °C with a dry airflow rate of 50 mL/min and at a heating rate of 20 °C/min. This temperature was maintained for 45 min in order to ensure that all of the organic matter was oxidized and the mass stabilized. The temperature of 550 °C assured that inorganic carbonates and sulfates were not decomposed and other inorganic components were not oxidized. Moreover, mass loss and heat flow were measured in an attempt to identify a relationship between the results and the combustion parameters used.

2.5.2. Scanning Electron Microscopy with Energy Dispersive X-Ray Spectroscopy (SEM-EDS)

Samples of deposited and adhered fouling obtained from a burning wood pellet with a total airflow of 11 m3/h and 25 m3/h, a distribution of 25% and 75% in primary and secondary airflow, respectively and low and high deposition probe temperatures (approximately 20–25 °C and 60–65 °C) were studied using SEM-EDS, specifically, experiments 1, 6, 7 and 9 (Table 2). The microscope used was an XL30 (Philips, Vigo, Spain); it had a resolution of 3.5 nm, an acceleration voltage of 0.2 to 30 kV and a magnification from 10 to 200,000 increases. It contained a thermionic tungsten gun, and microanalysis was performed with a PV9760 EDS (EDAX, Vigo, Spain). Samples were prepared over a 12.5 mm diameter circular support. In addition, a carbon sticker was attached to the support, and a few milligrams of the sample was sprinkled on the sticker. The detector used was BSE: it detected backscattered electrons, and it was sensitive to variations in the atomic number of the elements of the surface (i.e., atomic number contrast). The samples were scanned with an acceleration voltage of 20 kV and an electron beam current of approximately 50 µA. The spot size was approximately 6 and the working distance (WD) was as closest as possible to 10 mm. Furthermore, dead time (DT%) was kept under 30% throughout all of the experiments. The measuring time was approximately 30 s or until the peaks stabilized. The methodology for picking areas was randomized but without overlapping of areas. Three microanalyses of each of the samples in different areas were performed with a magnification or enlargement of 500X.

3. Results and Discussion

3.1. Theoretical Deposition Indices Predicted from Inorganic Elements

The pellet used (Table 1) presented a relatively high ash content (3.32%). It had a high amount of Si and Ca and also a considerable quantity of Al, K and S. Some of these elements, mainly K and Si, deserve special attention when the biomass is fired. First, high concentrations of Si together with K and Cl play an important role in causing severe deposition and bed agglomeration problems [7]. The high amount of Ti of the pellet was indicative of a contaminated biomass because natural biomass does not possess such a high amount of Ti. Vassilev et al. [36] found that natural woody biomass had a maximum percentage of TiO2 of 1.20% over the amount of ash, while this fuel contained 3.14% TiO2. Additionally, Vassilev et al. [36] found that contaminated biomass could contain up to a composition of 27.58% TiO2.
Concerning the deposition indices, it must be highlighted that the inorganic material of the fuel cannot predict fouling and slagging tendency. They are also influenced by boiler design [21] and combustion parameters. The approximate ranges that make a fuel highly or slightly liable to slagging or fouling are shown in Table 3. Table 4 contains the results of the indices for the fuel used.
Table 4. Theoretical deposition indices for the fuel used in the experiments.
IndexResultInterpretation
B/A0.95Low-Medium
B/A(simp)0.86
B/A(+P)1.01
RS0.05Low
RS(+P)0.05Low
SR49.35Medium
FU6.47High
FU(+P)6.88High
Regarding base-to-acid indices based on the findings of Teixeira et al. [13], this fuel seemed to have a medium tendency to slagging and fouling. However, according to Viana et al. [27], slagging was not expected in this biomass. Concerning the base-to-acid ratios, B/A(+P) will more closely approach reality when applied to biomass. However, B/A(simp) should not be applied because it eliminated the effect of K, which was one of the key elements in fouling [37]. Otherwise, RS showed a low slagging tendency because of the low content of sulfur. This index provides better results for coal which, normally, contains a much higher amount of S. On the other hand, following the findings of Tortosa et al. [26], this pellet seemed to produce a highly viscous slag, which would be confirmed by the agglomerates generated over the grate during combustion. Operationally, this pellet presented a relatively high tendency toward agglomeration and sintering of the bed material, as shown in Figure 3. The sintered ashes observed in Figure 3 were collected following 3 h of stable combustion. Finally, the fouling index (FU) revealed that it had a strong tendency to fouling. However, operationally, it demonstrated only a medium predisposition to fouling. In view of the theoretical results, and comparing them with experience, theoretical deposition rates do not seem very reliable for biomass, although they provide an approximate prior idea of fuel behavior. There are limitations of using those parameters for biomass fuels because they were first created for coals [26]. Moreover, depending on the research considered, the results were contradictory; they lead to the prediction of inconsistent deposition tendencies [21].
Figure 3. Bed sintering of wood pellet after 3 h of stable combustion.
Energies 08 09794 g003

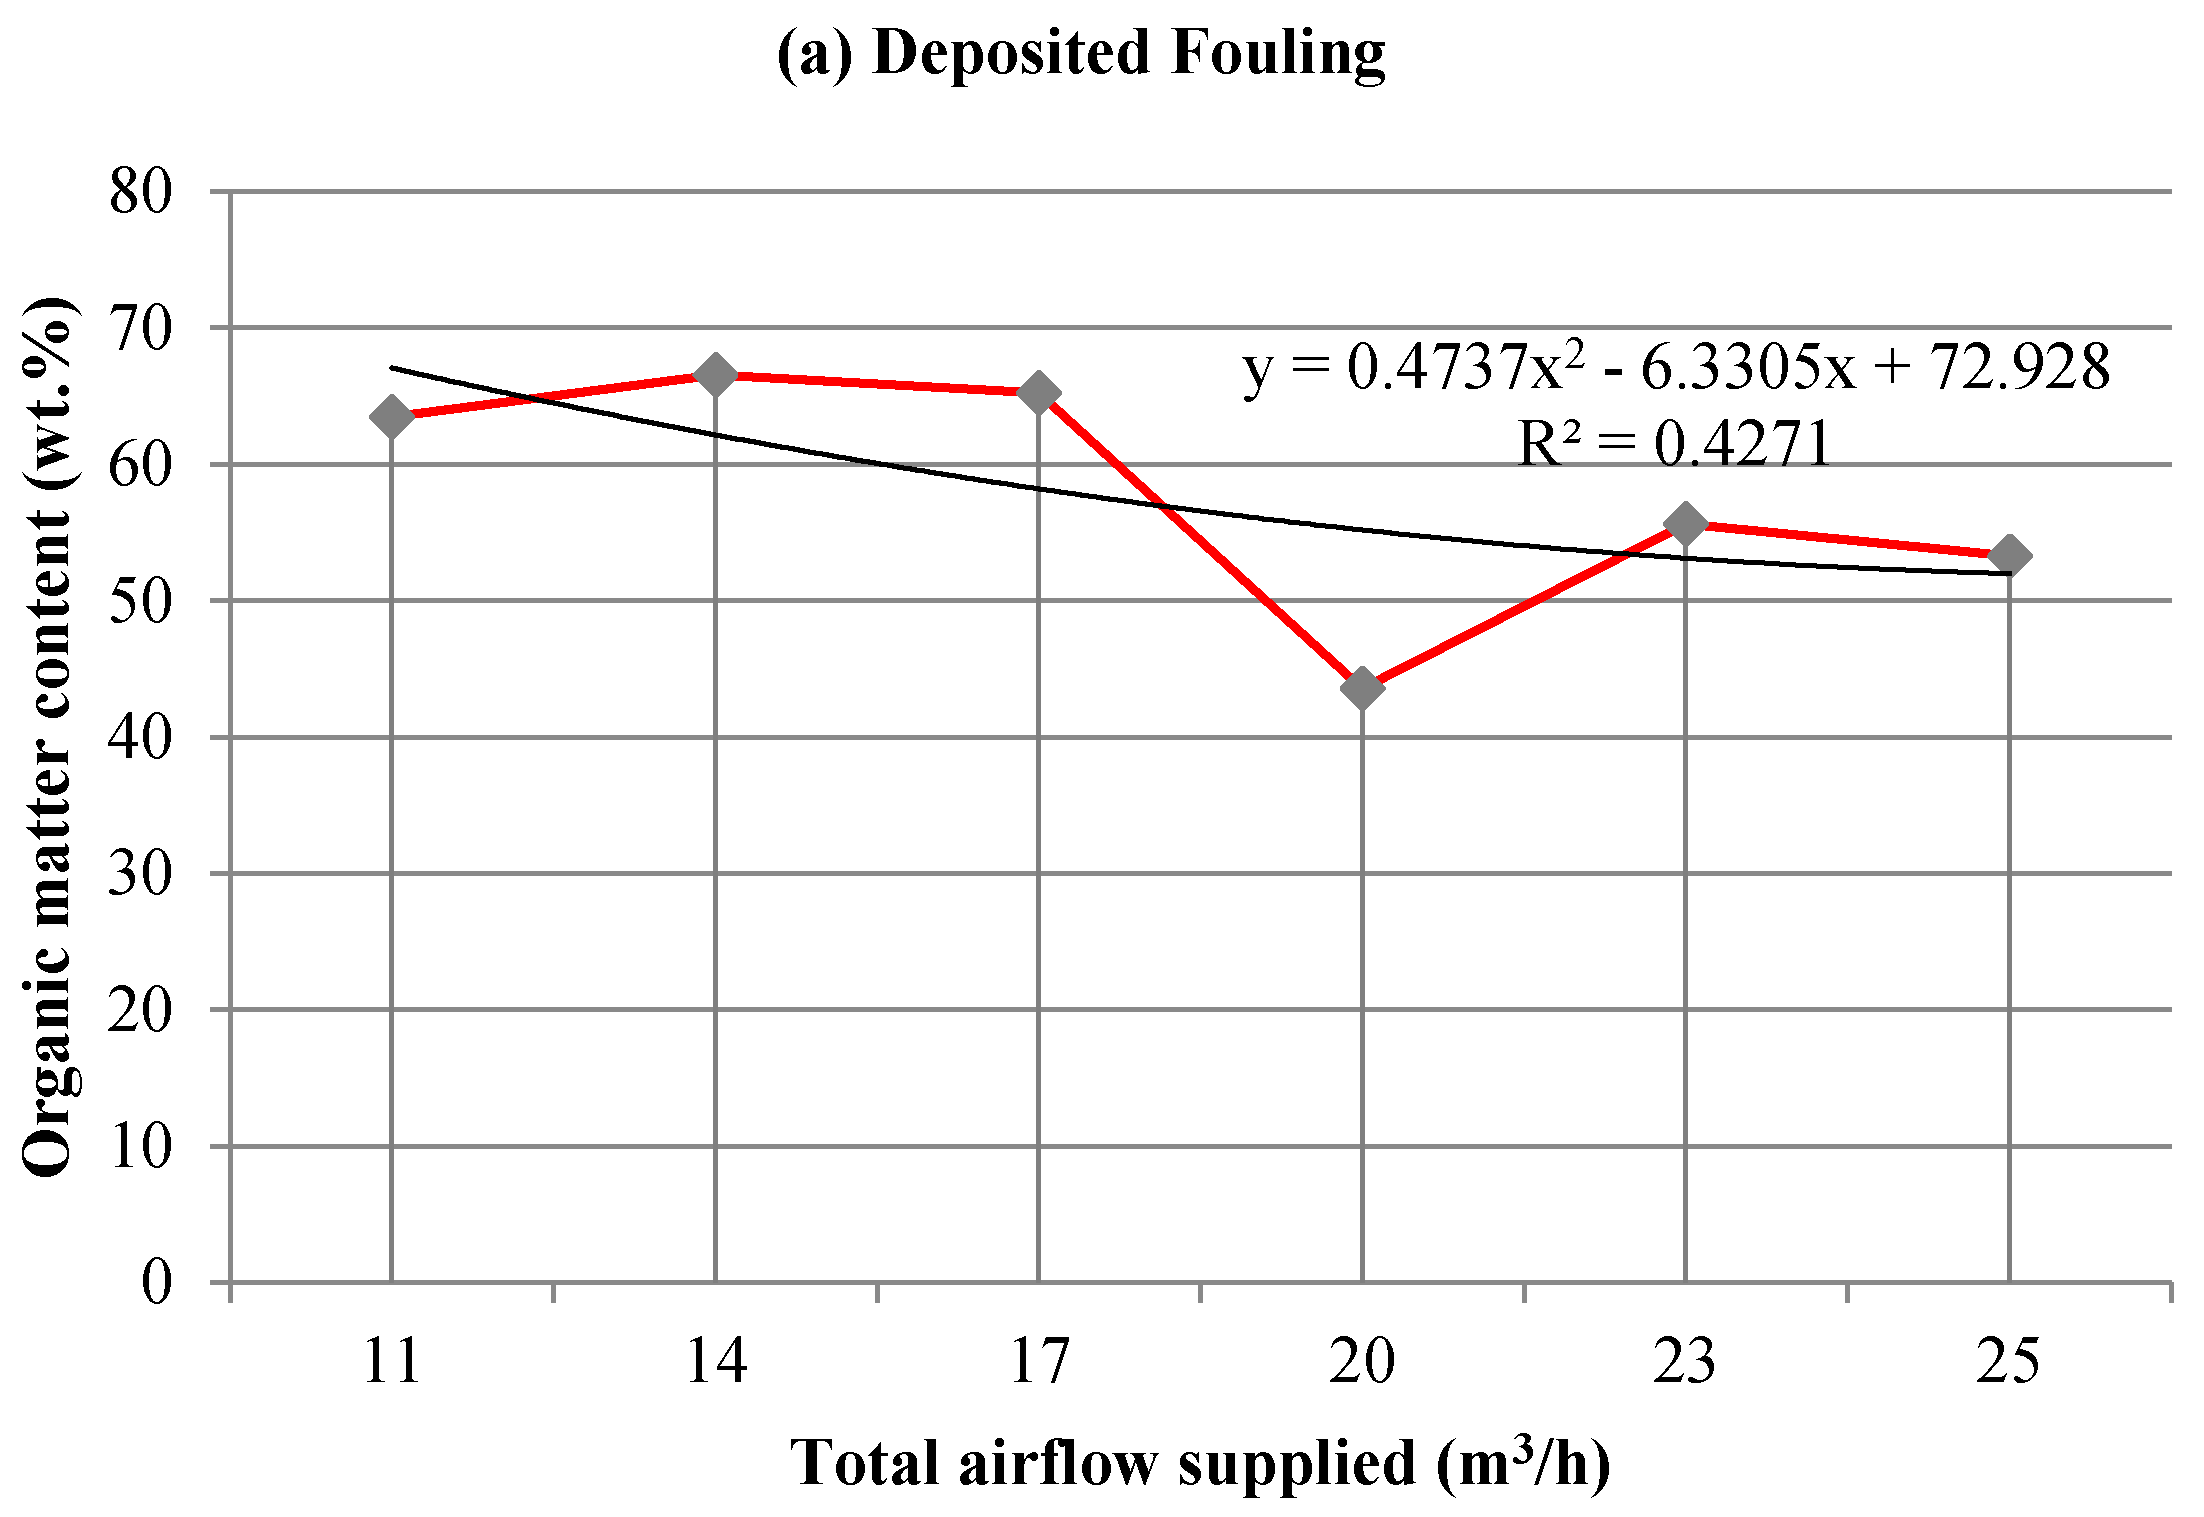
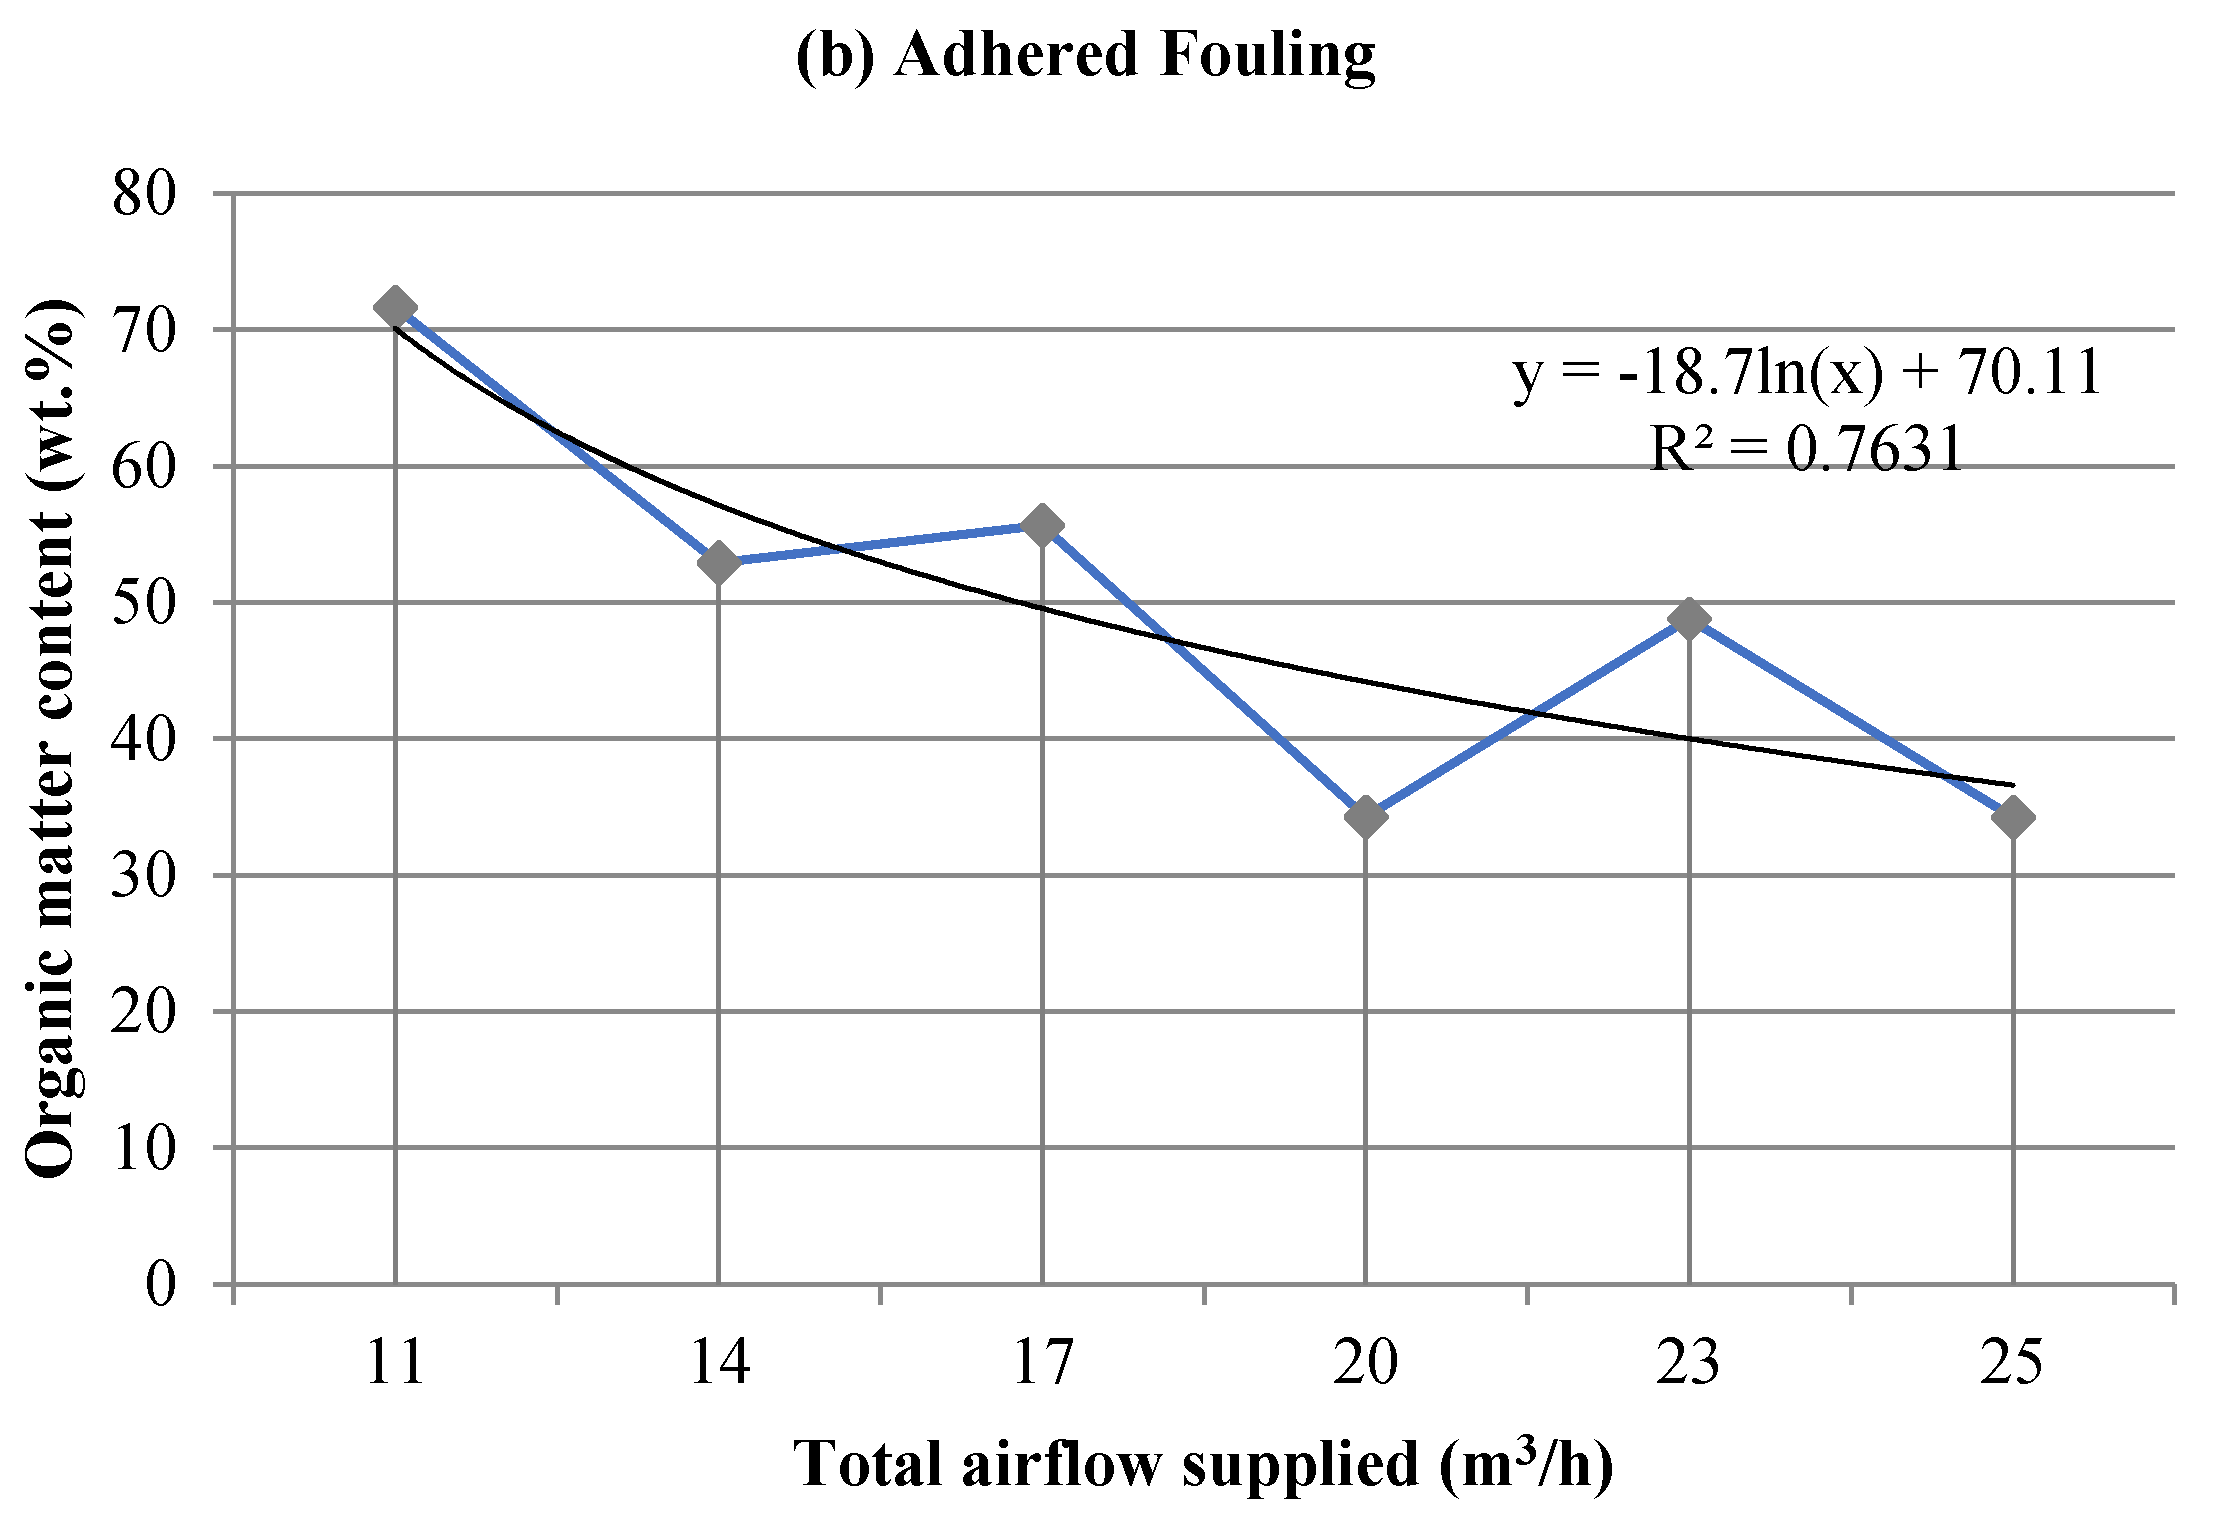
3.2. Influence on Fouling of the Total Airflow Supplied

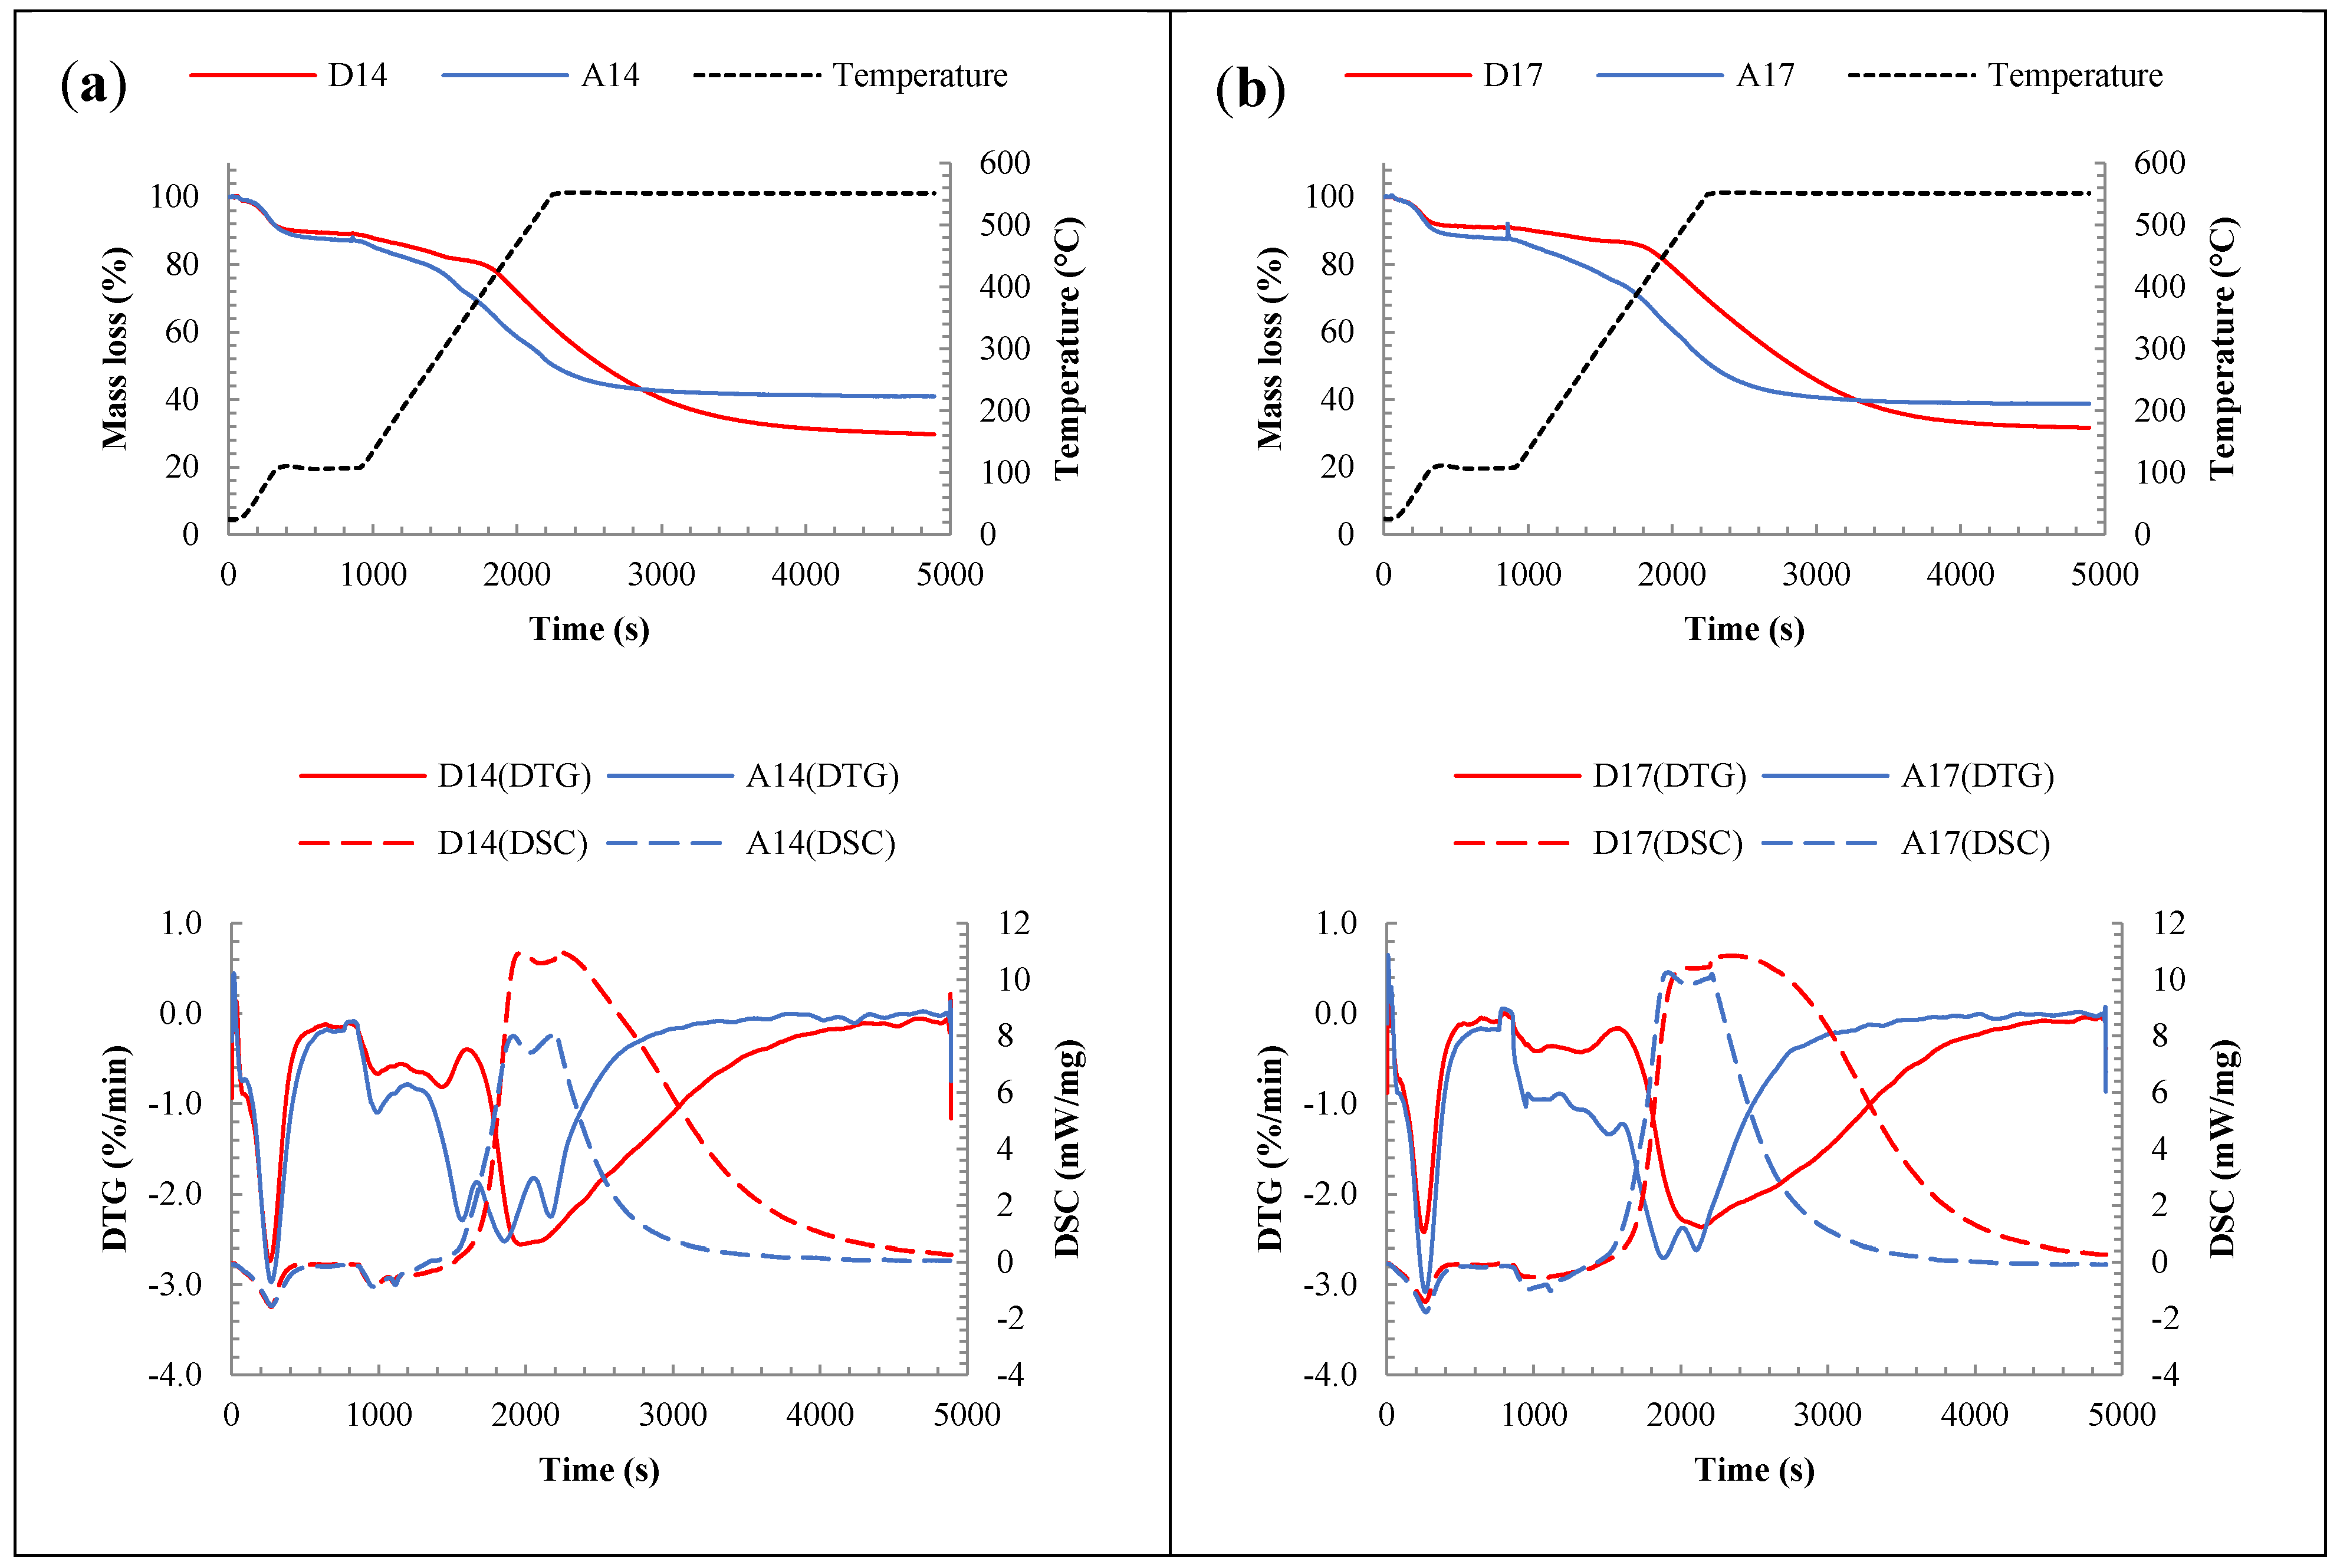
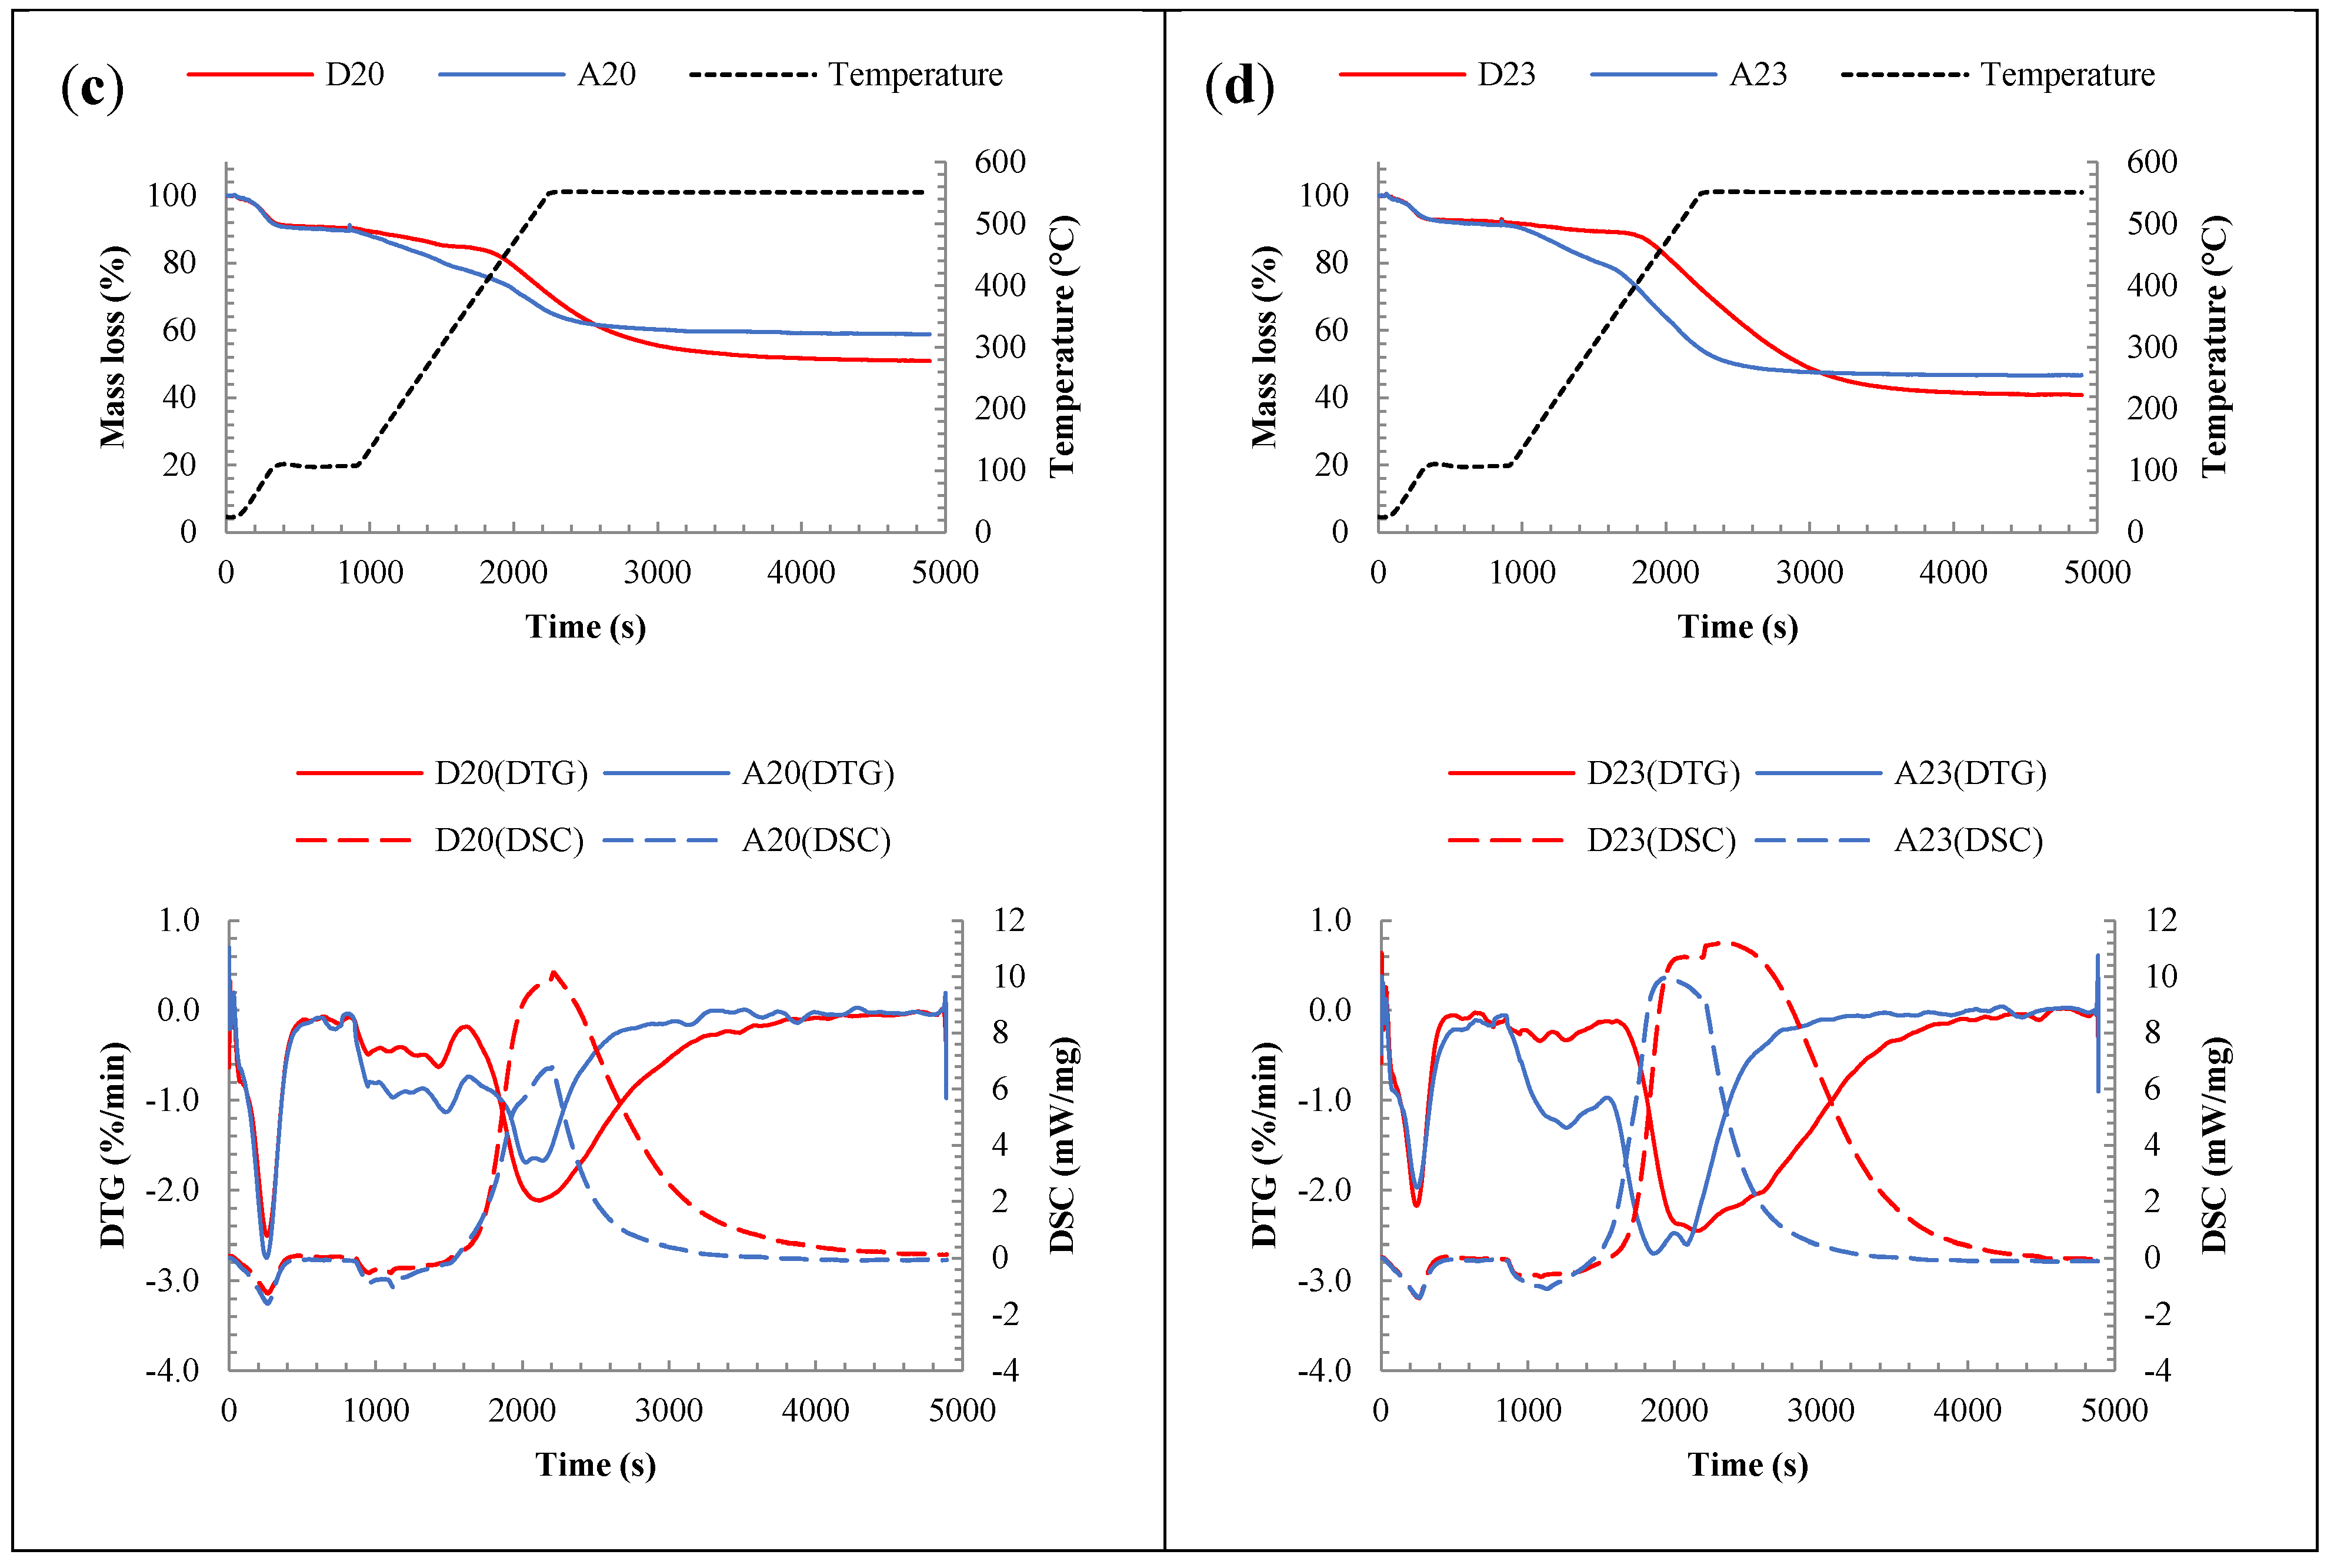
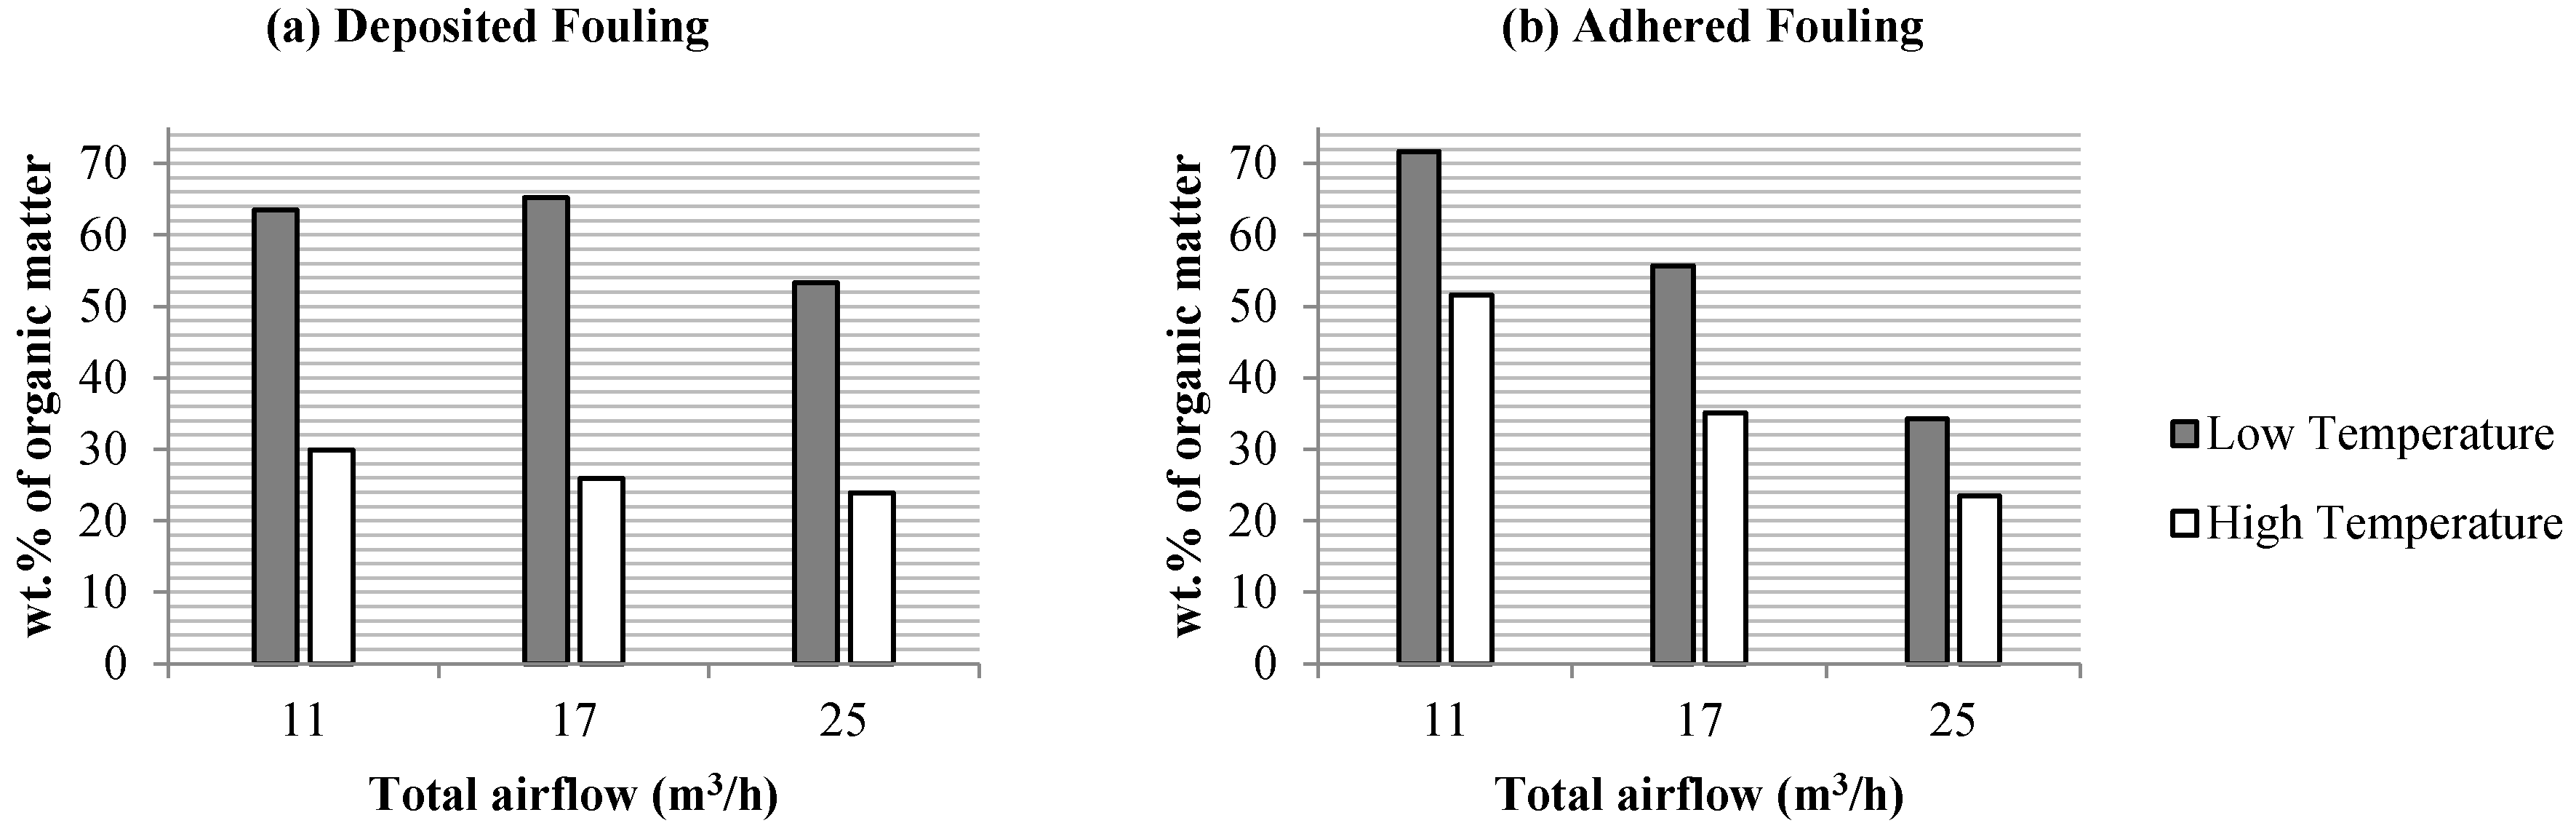
3.2.1. Thermal Analysis: Characterization of the Organic Matter in the Fouling Deposits

The airflow supplied during combustion influences the combustion itself, as any oxygen deficiency leads to an incomplete combustion and excess oxygen can cool the system [1]. Therefore, it seemed possible that there was an influence of the airflow supplied on the amount and composition of fouling deposits. On the one hand, the major mechanisms of ash deposition forming fouling are related to the inorganic matter in the biomass and the combustion conditions [38]. On the other hand, char and other organic material often deposit with the inorganic material on combustor surfaces. The combustion of biomass produced multiple organic components, usually with lower temperatures of volatilization than the inorganic constituents, as volatile organic compounds (VOC), organic aerosol particulates, tars, unburned hydrocarbons or carbonaceous soot. These components could adhere to the deposition probe if its surface was sticky when they were released during the combustion. The samples collected presented an important amount of organic matter. Therefore, a thermal analysis of the organic matter was implemented.
The TG, DTG and DSC curves for all the fouling samples following combustion parameters 1 to 6 (Table 2) were studied in order to determine the mass loss, the mass loss rate and the heat flow exchanged, respectively, as functions of time and temperature (Figure 4).
Figure 4. TG, DTG and DSC curves of deposited (D) and adhered (A) fouling samples obtained with the following combustion parameters: 3 h of stable combustion, a distribution of 25% and 75% of primary and secondary airflow and a deposition probe temperature kept in the range of 20–25 °C. The number indicates the total airflow of (a) 14 m3/h, (b) 17 m3/h, (c) 20 m3/h and (d) 23 m3/h. Combustion performed with 11 m3/h and 25 m3/h of airflow were not represented.
Energies 08 09794 g004aEnergies 08 09794 g004b
Thermograms showed a first mass loss below a temperature of 105 °C representative of the content of moisture associated with an endothermic heat flow also representative of the drying process, a quick process that corresponded to a pronounced peak in the mass loss rate curve (DTG). Then, the volatilization and oxidation of unburned carbon and other organic matter took place in the temperature range of 200 °C to 550 °C depending on the type of sample [39,40,41]. This process was observed in two steps represented by two different slopes on the mass loss curves and different peaks on the mass loss rate curves. In the first step, mass was lost more slowly, and in the second step, from approximately 400 °C, the total oxidation of organic matter was occurred, corresponding with an exothermic peak in the DSC curve and with the highest mass loss rate, releasing a high amount of CO2 mainly. These different zones appeared because samples were heterogeneous and were formed by different components; some of them volatilized and oxidized at low temperatures. Some of these components can even react with each other during the heating of the sample. Comparing samples, it was observed that adhered fouling started to lose mass at earlier temperatures than deposited fouling, with the exception of samples from experiments with 11 m3/h of total airflow. This occurred because adhered fouling was formed by compounds that were more volatile and they started to devolatilize at lower temperatures. That is, the organic components of adhered fouling has lower temperatures of condensation and evaporation than the organic components of deposited fouling. In the mechanism of fouling formation, initially the deposition probe was clean and its temperature was lower. As the fouling was depositing, the layers of fouling acted as a thermal insulator, hindering the heat exchange between the water inside the pipe and the combustion gases released and increasing the temperature of the surface.
Thermal analysis revealed that deposited fouling and adhered fouling contained a similar amount of organic matter. The amount of organic matter is slightly higher for deposited fouling. This could be due to the origin of the first layers of fouling that came from inorganic gaseous phases that condensed over the tube; thus, adhered fouling had more inorganic content than deposited fouling. There are four different deposition mechanisms in fouling formation: inertial transport, thermophoresis, condensation and chemical reaction [38,42]. Initially, inorganic vapors and fine particles condensed over the tube, and then, the inertial impact of bigger particles contributed to the deposit build-up [21]. Changes in the fouling composition as a function of deposit thickness are indicative of variation of the predominant mechanism along the time of combustion, which is why two layers of fouling were differentiated. The first layers of fouling are mainly formed by condensation. As the deposit accumulates, its surface temperature increases and the rate of condensation decreases [38], dominating other deposition mechanisms such as inertial impaction.
Thermal analysis of all samples collected showed their organic matter content. Keeping the rest of the combustion parameters constant and increasing the total airflow supplied, the organic material in all of the samples collected decreased, thereby reducing the amount of unburned carbon in the fouling deposits (Figure 5). When a low airflow was supplied during the combustion, the temperatures of the gases were lower and the organic matter from the fuel was not burned completely, as oxygen deficiency leads to incomplete combustion [1] that can also result in releasing of unburned carbon [37] and high emissions of CO (Figure S1 and Figure S2 of the Supplementary Material). By increasing the airflow rate, the combustion performance was improved and the temperature of gases increased, but when the airflow that was supplied was too high, and the flames escaped the combustion chamber and reached the tube heat exchanger.
Figure 5. Organic matter content in fouling samples, namely “deposited fouling” (a) and “adhered fouling” (b) for different total airflows. Combustion parameters: 3 h of stable combustion and an airflow distribution of 25% and 75% in the primary and secondary airflow. Results of deposited fouling (a) better fitted with a polynomial curve of order 2, while results from adhered fouling (b) better fitted with a logarithmic curve.
Energies 08 09794 g005aEnergies 08 09794 g005b
In addition, the high amount of unburned carbon present in the fouling could also be due to the combustion technology used. Fixed-bed boilers with grate, as used, get to produce ashes with more than a 50% content of unburned carbon [1]. As observed, organic matter deposited with inorganic matter forming fouling deposits; however, the char oxidized with locally available oxygen [38], and thus, the more airflow supplied, the more the oxygen available, and the less unburned carbon that was subsequently detected in the fouling. A high level of unburned carbon in ash not only caused an inefficient fuel use, but also decreased ash stabilization by chemical hardening [1]. In addition, it has to be taken into account that higher airflows induced higher operational temperatures in the burner and the chimney as shown in Figure S1 of the Supplementary Material.

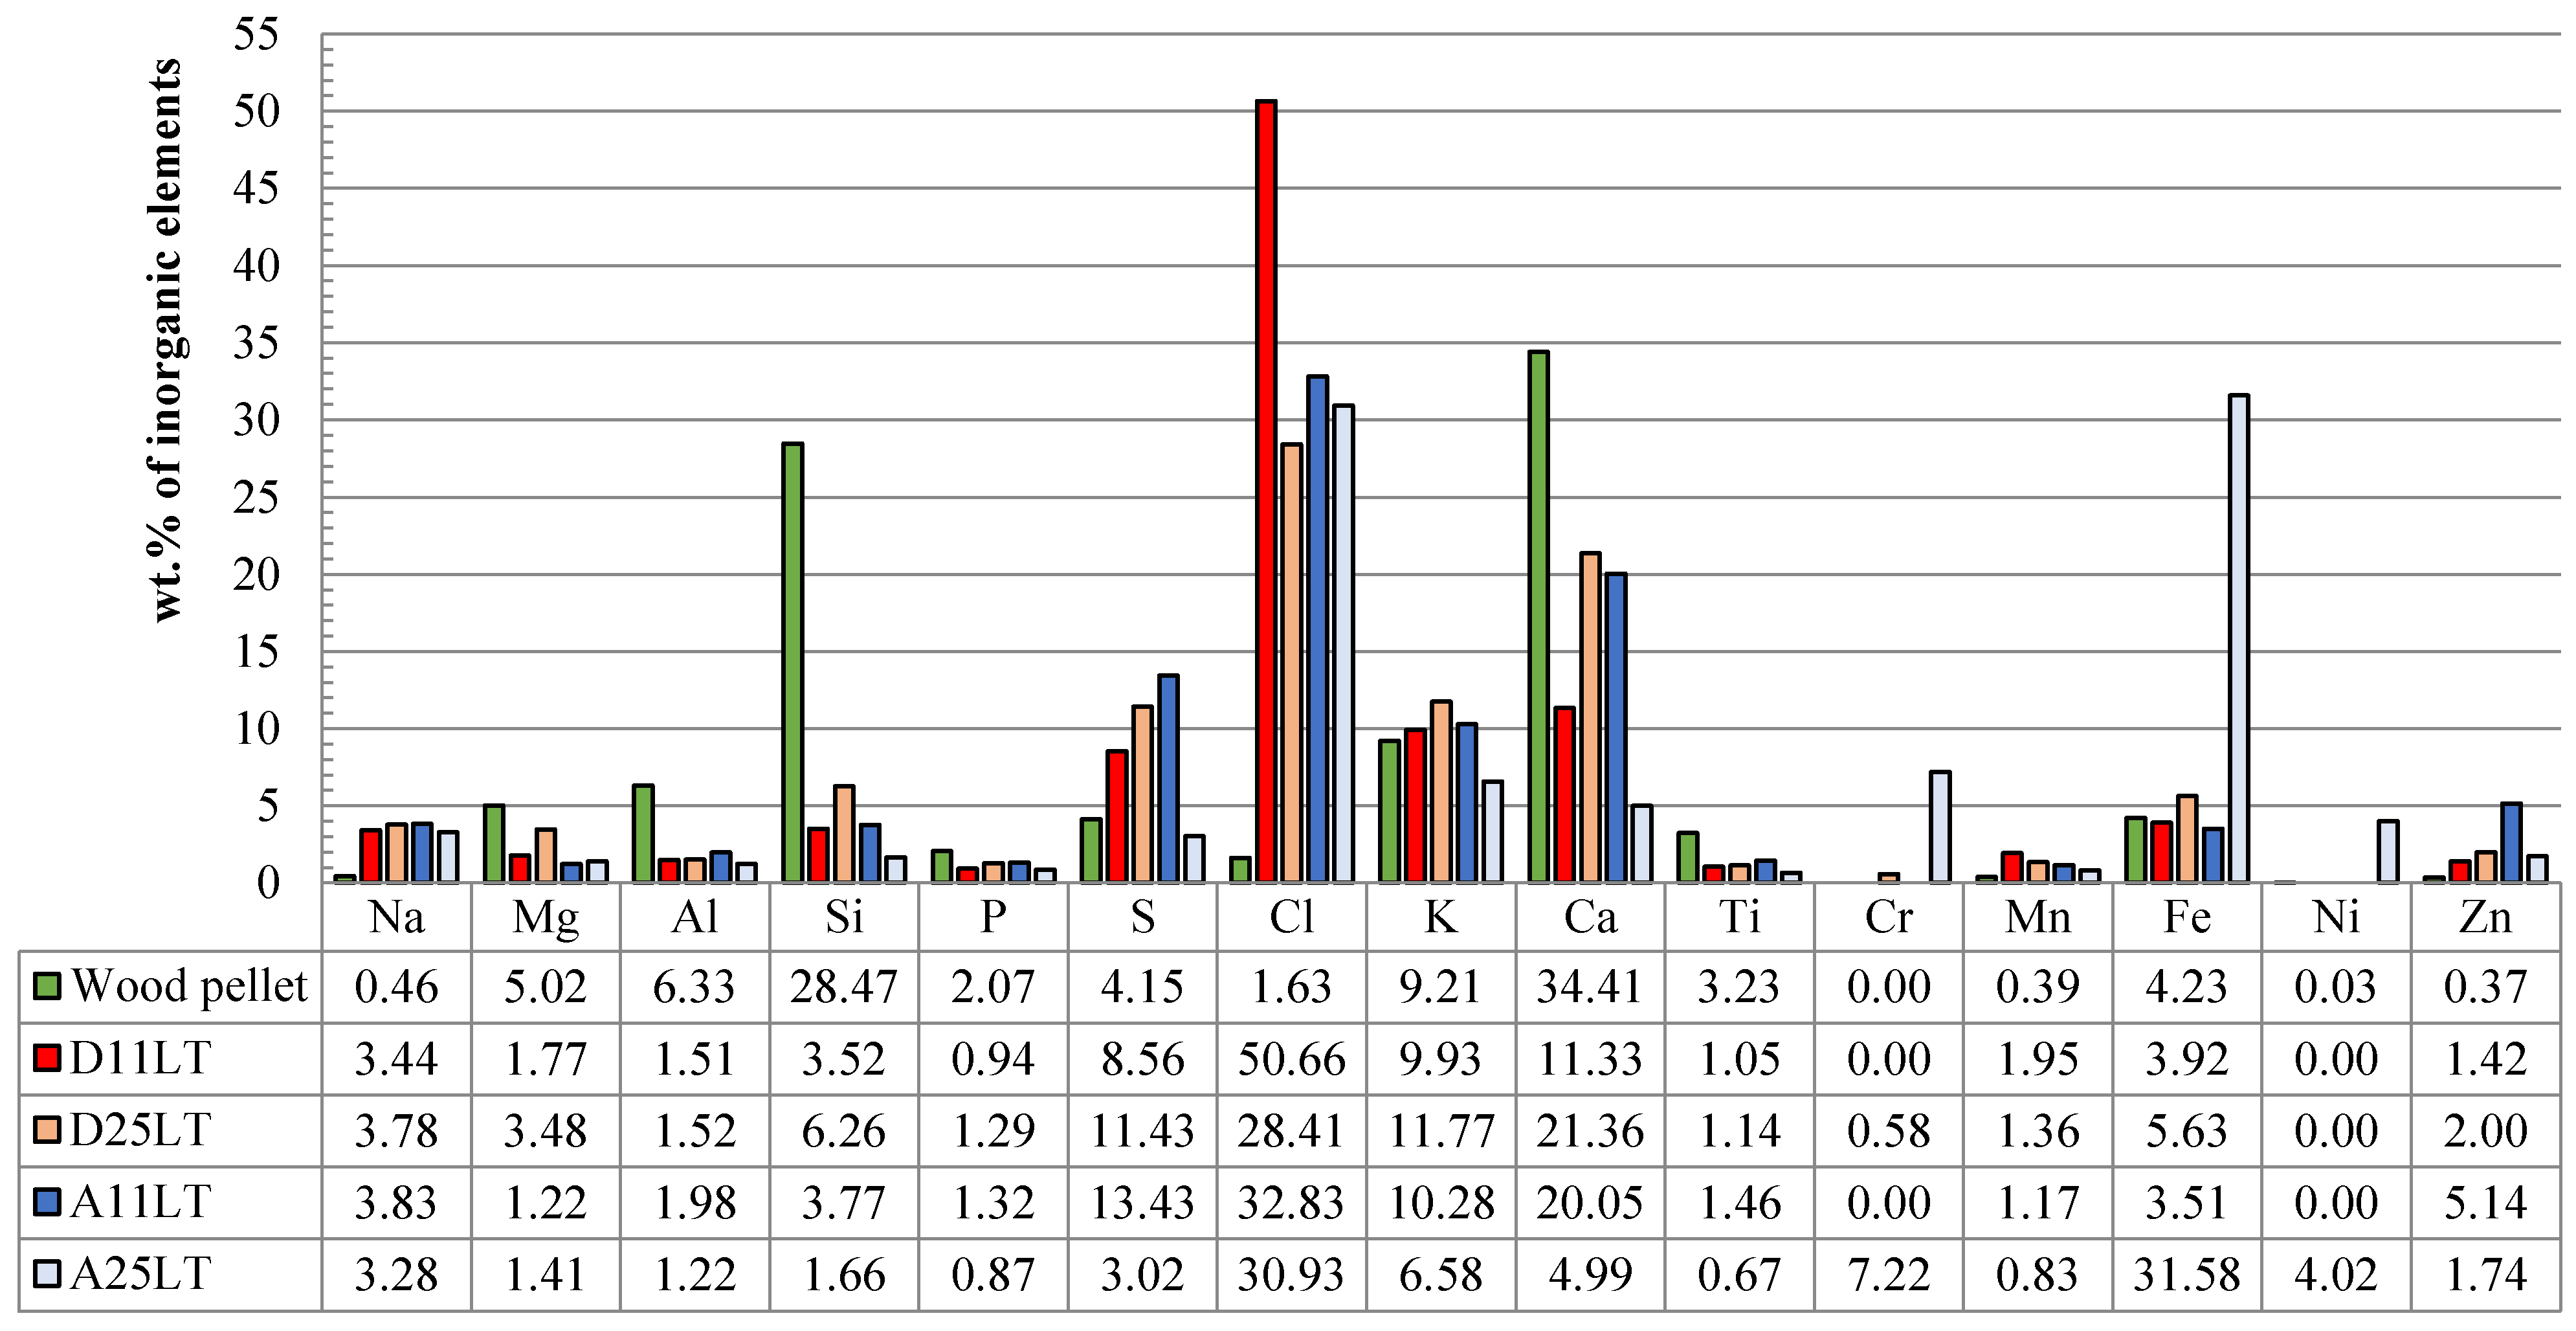
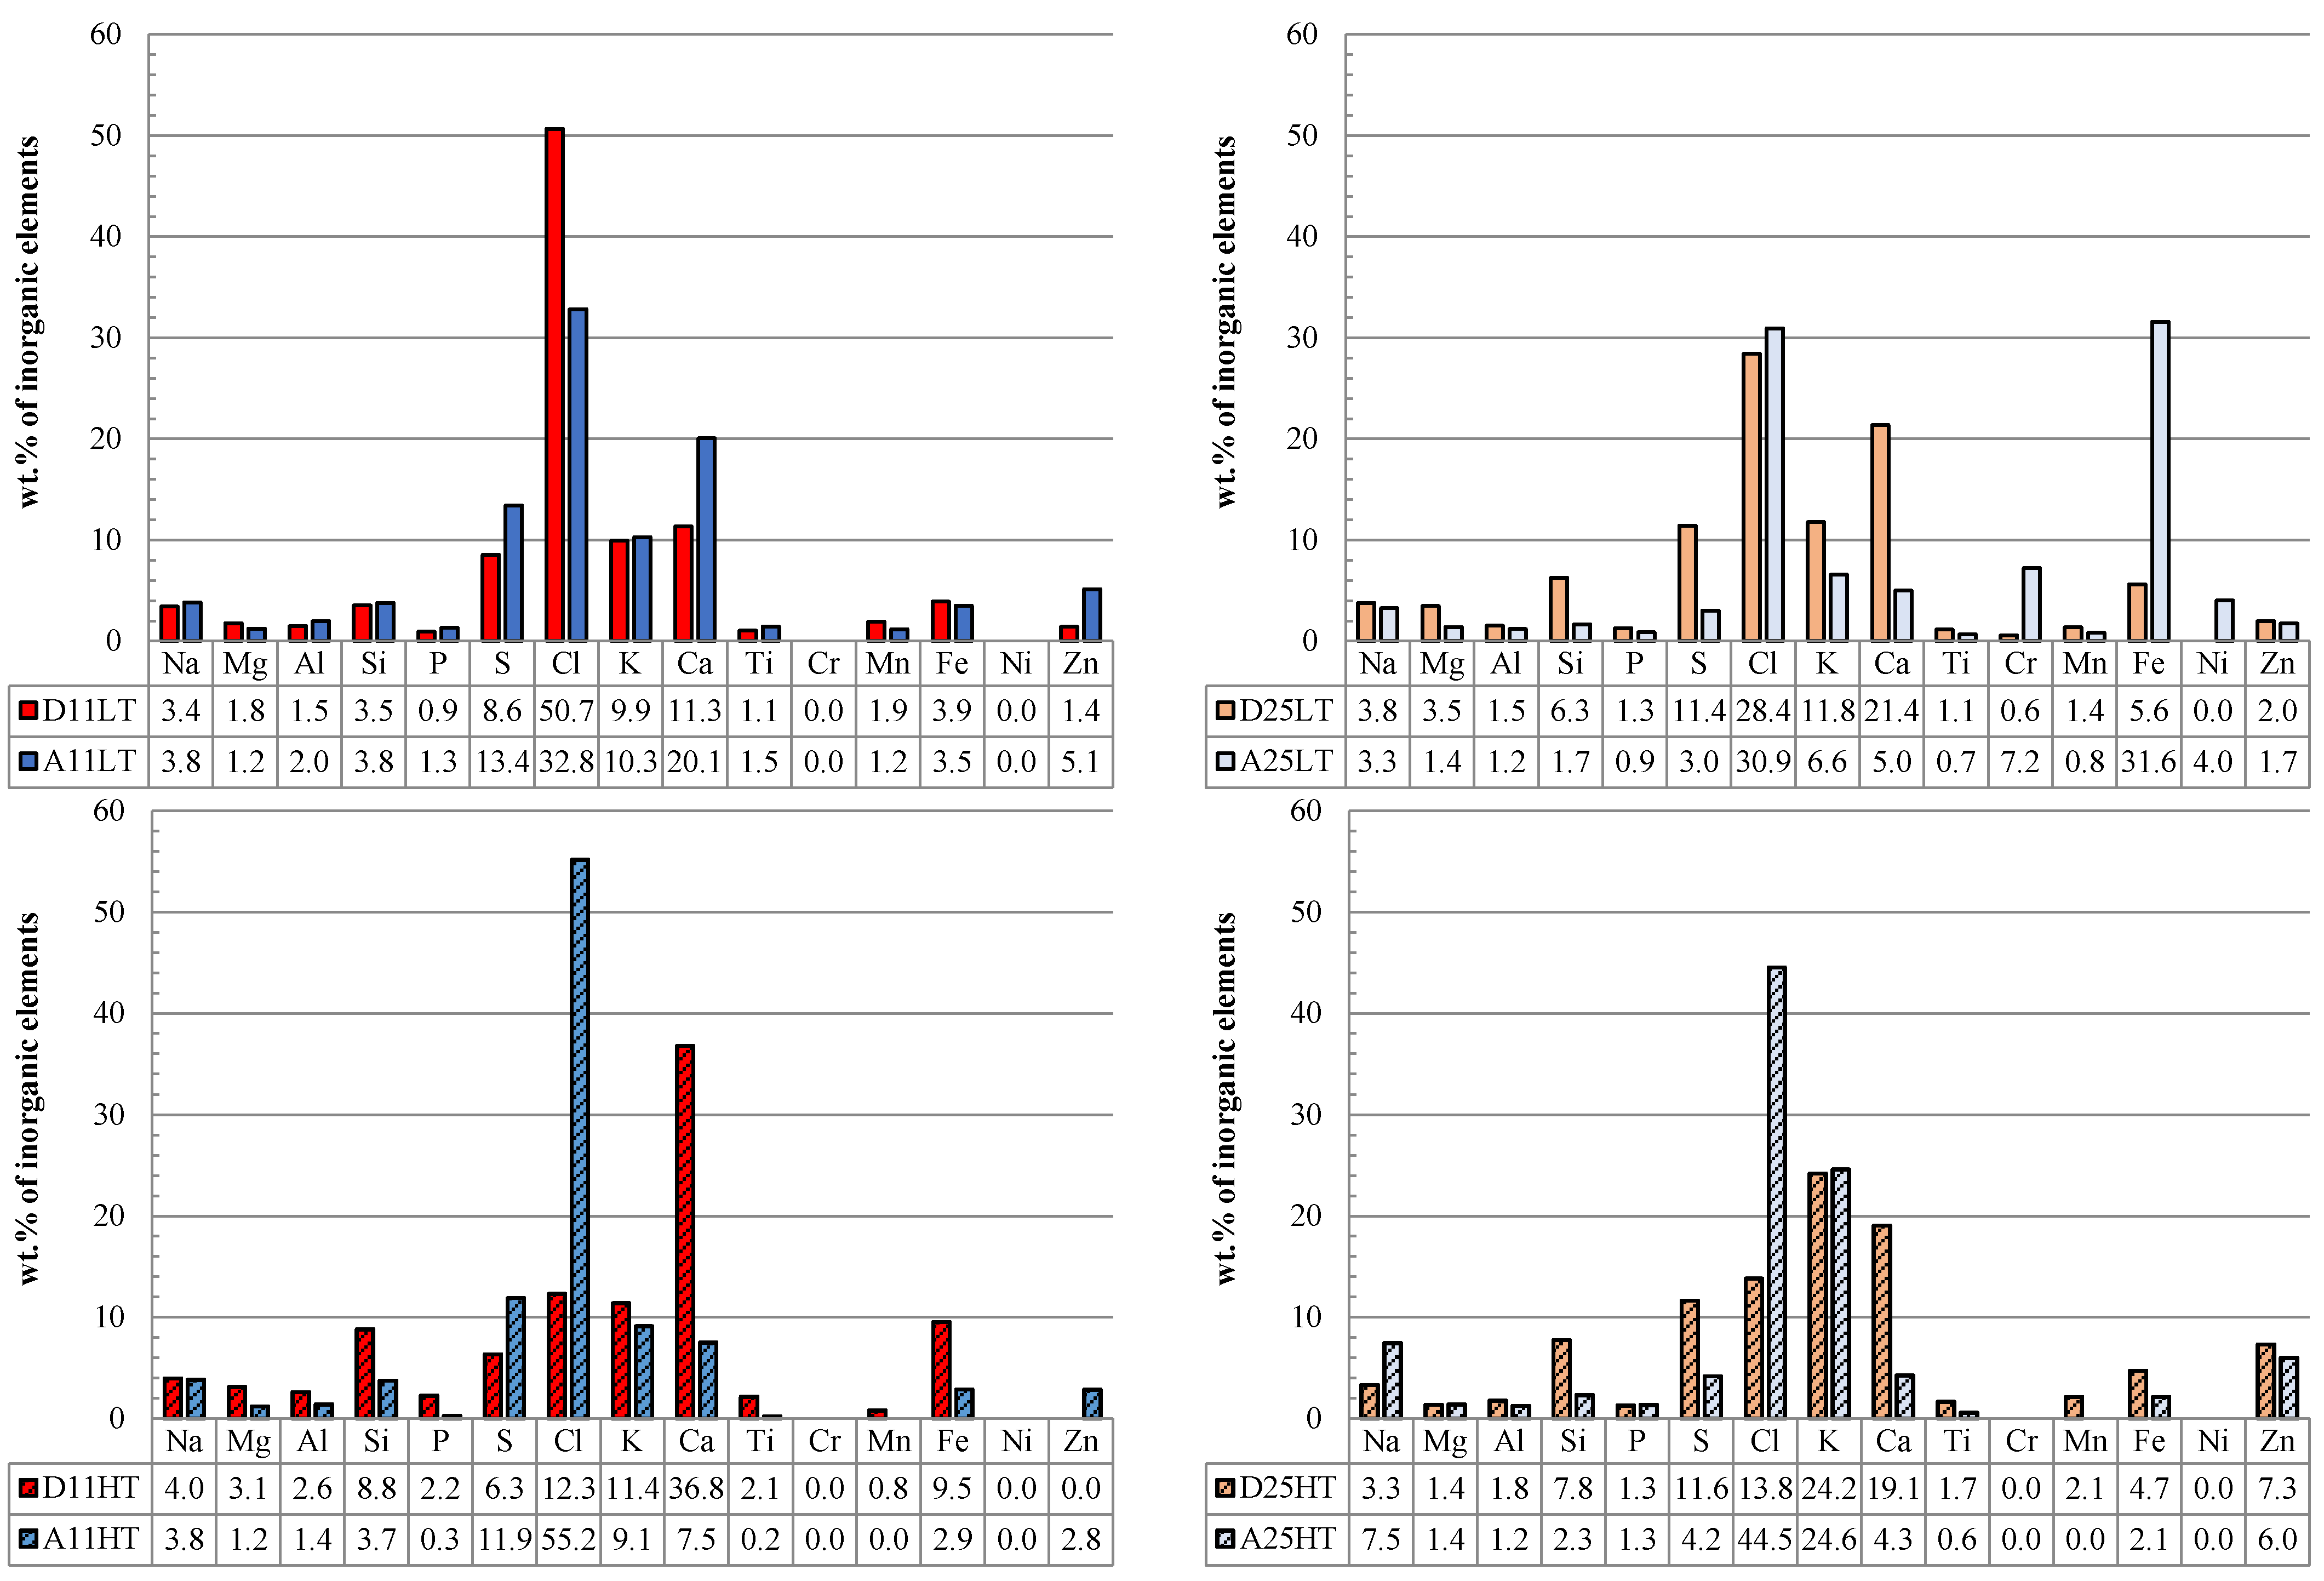
3.2.2. Chemical Analysis: Characterization of the Inorganic Matter in the Fouling Deposits

SEM-EDS analyses were conducted on fouling samples of the lowest and highest airflow used (11 m3/h and 25 m3/h). The remaining parameters were kept constant (tests 1 and 6 from Table 2). An average of three microanalyses of each sample were performed (Table 5). SEM-EDS measurements were always performed in areas totally covered by sample to ensure that the results of the analysis are as representative as possible for the area considered.
Table 5. SEM-EDS results of the average of three analysis from each of the samples. (D) deposited fouling, (A) adhered fouling, (LT) low deposition probe temperature, (11) 11 m3/h and (25) 25 m3/h.
D11LT (wt.%)A11LT (wt.%)D25LT (wt.%)A25LT (wt.%)
C75.5869.3853.4731.59
O9.1711.2416.0815.27
Na0.520.741.151.74
Mg0.270.241.060.75
Al0.230.380.460.65
Si0.540.731.910.88
P0.140.260.390.46
S1.302.603.481.61
Cl7.726.368.6516.43
K1.511.993.583.49
Ca1.733.896.512.65
Ti0.160.280.350.35
Cr0.000.000.183.83
Mn0.300.230.410.44
Fe0.600.681.7116.78
Ni0.000.000.002.13
Zn0.221.000.610.92
In view of the results of SEM-EDS of the fouling samples, it can be observed that C and O were the major elements present in all of the samples. They were in agreement with the organic matter results obtained from the thermal analysis. Specifically, samples of deposited fouling had a slightly greater amount of C than the adhered fouling samples. Comparing samples from different total airflows, the high airflow (25 m3/h) and low airflow (11 m3/h), it was observed that there was a tendency to improve combustion when airflow increased, reducing the unburned carbon; however, as a consequence, the concentration in the fouling of almost all of the rest of the elements increased, especially elements that provoke fouling such as Na, Si, Cl and K. Thus, by increasing the quantities of air, a greater turbulence and a larger excess of air were achieved, which resulted in the biomass burning better. Moreover, the major contributions to fouling are derived from the inorganic part of the biomass, principally the alkali metals, such as Na and K [7]. Mainly, the inorganic material of the biomass affected the mechanism of deposition, but residual char and other organic material sometimes deposited with the inorganic matter [38]. Therefore, assuming the formation mechanisms of fouling were almost independent for organic and for inorganic materials and to eliminate the uncertainty of carbon that did not come from the sample, inorganic elements have been studied independently, and Figure 6 shows inorganic elements removing C and O and normalizing them to 100%. A comparison between the inorganic elements from the wood pellet and the inorganic elements from the fouling was also performed.
Figure 6. Comparison of inorganic elements present in wood pellet and fouling deposits. (D) Deposited fouling, (A) adhered fouling, (11) 11 m3/h of airflow, (25) 25 m3/h of airflow and (LT) low deposition probe temperature (20–25 °C).
Energies 08 09794 g006
Samples of adhered fouling from combustion performed with an airflow of 25 m3/h and low temperature (20–25 °C) had a very high and abnormal amount of Fe, Ni and Cr that obviously did not come from the pellet (Figure 6). These three elements constitute a typical stainless steel composition, therefore, when considering fouling composition, not only must the fuel composition be taken into account, but also the possible contamination of the biomass during combustion, for example detachment of material from the boiler walls or contamination during sample collection [18]. The abnormal amounts of these elements also suggested a beginning of corrosion, as a possible corrosion mechanism is based on gaseous Cl attack, whereby Fe and Cr from the metal react with gaseous Cl, forming volatile metal chlorides [21]. Moreover, by increasing the total airflow and especially the primary airflow, an intensification of the flame was produced. The physical limitations of the equipment itself prevent using a higher airflow because the flame must be confined inside the burner.
Comparing the pellet with fouling samples, it was observed how elements such as Mg, Al, Si, Ca and Ti were non-volatile elements that stayed in the bottom ash as other authors have also concluded [7,37], and only a small amount of these elements was volatilized during the combustion and then deposited on the combustor surfaces. Si presented the most extreme tendency, and along with Ca was the most abundant inorganic element in the wood pellet, but then, it appeared as a minor component of the fouling samples. Si in the fuel appears normally in the form of silica. During combustion, it reacted with Al or Ca to form aluminum silicates or alkaline-earth silicates. Silica had a high melting point, while silicates lower this melting point [22] and are responsible for problems such as slagging and bed agglomeration [7]. Based on our previous work [29], these silicates were most certainly calcium silicates in the form of Ca2SiO4 or Ca3Mg(SiO4)2. The opposite occurred with S and Cl, volatile elements. The content of S in the pellet was much higher than the content of Cl. However, the content of Cl in the fouling samples was higher than the content of S, indicating that although a significant portion was deposited over the tube, a large amount of S was released in the gaseous phase and was not deposited on the boiler heat exchangers. In addition, it is known that the combustion of low S containing biomass could enhance Cl deposition [22]. On the other hand, most of the Cl was deposited forming fouling deposits, and thus, small amounts of Cl in biomass can be harmful in terms of initiating and prompting Cl related fouling deposits and corrosion. Cl played an important role in transport, facilitating the transport of alkali, mainly K, from the fuel to the surfaces of the boiler. When the flue gases were cooled in the convective heat exchanger, these alkali compounds nucleated and then impacted and condensed on the heat exchanger tube [7]. The pure phase of KCl has a melting temperature of 776 °C [43].
Taking into account the airflow rate, the following was observed; in deposited fouling samples, all inorganic elements increased in concentration or remained constant when increasing the airflow, except Cl. In adhered fouling samples, all elements decreased their concentration or remained practically constant except for Fe, Cr and Ni due to the reason stated above. Therefore, fouling deposits contained more Cl at lower airflows. This might be because with a low airflow rate, the flue gases had a longer residence time, and therefore, more deposits condensed and impacted the tube, being Cl, as stated before, the main element in compounds that condensed at lower temperatures. When interpreting the results of the SEM-EDS analysis, it is important to consider the accuracy and precision of the technique and the method used for the analysis.

3.3. Influence on Fouling of the Deposition Probe Temperature

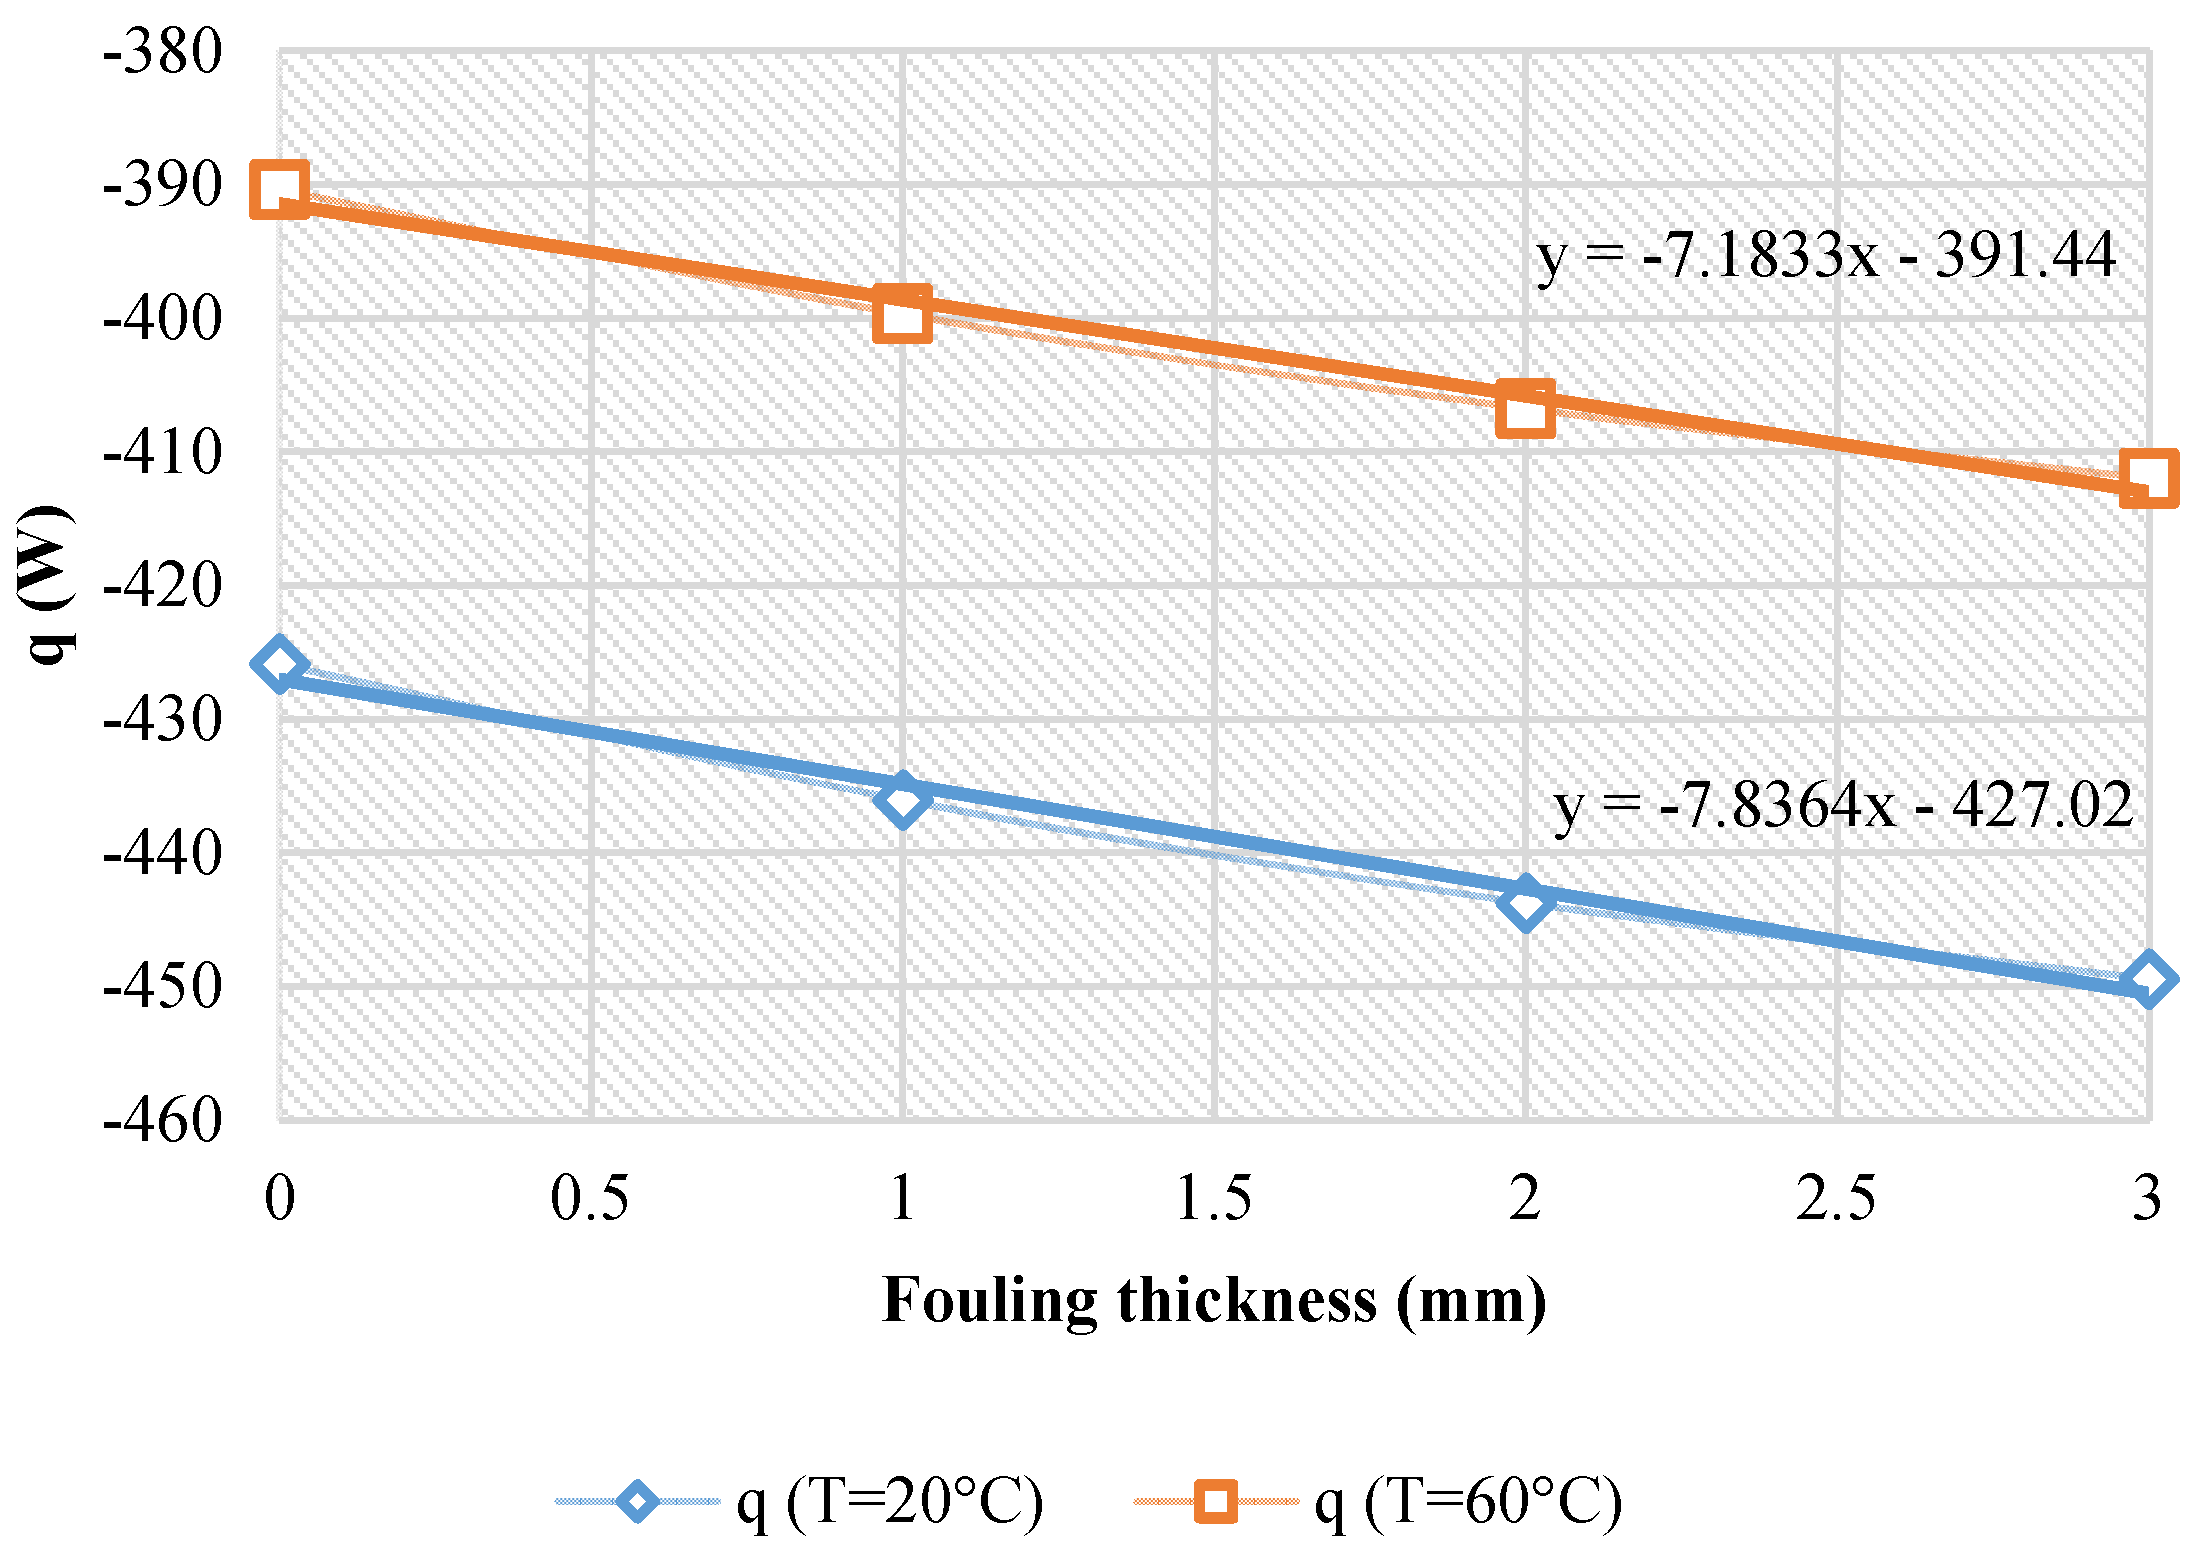
3.3.1. Thermal Analysis: Characterization of the Organic Matter in the Fouling Deposits

In order to study the temperature of the water carried through the tube, the following experiments (1, 3, 6, 7, 8 and 9 of Table 2) were considered and compared. Fouling samples from these tests were collected, and a thermal analysis was carried out on each of them. Regarding the organic matter comprising fouling samples, when the temperature of the deposition probe surface increased (from 20–25 °C to 60–65 °C), the relative amount of organic matter on the tube decreased (Figure 7). This occurred in both layers of fouling but with a greater reduction in deposited fouling samples. Temperature had less influence on the composition of the layer of adhered fouling; it may be because the temperatures were very low in all cases. When the water passed at low temperatures through the circuit, the temperature of the exchanger tube environment was lower, creating a greater thermal gradient through the exterior of the tube. As it was stated above as the deposit accumulated its surface temperature increased and, the rate of condensation decreased [38], and thus, less organic matter adhered to inorganic condensates deposited on the outer layers of the fouling. When increasing the airflow supplied, the operating temperatures of the plant also increased, i.e., a higher temperature in the burner was observed. However, the water temperature changes did not cause a significant variation in the temperature of the boiler (Figure S1 of Supplementary Material). Therefore, it was more difficult to offer an explanation for the behavior of the fouling in this case.
Figure 7. Organic matter content of deposited fouling (a) and adhered fouling (b). Low temperature means that deposition probe temperature was maintained during combustions between 20–25 °C and high temperature means that deposition probe temperature was maintained during combustions between 60–65 °C.
Energies 08 09794 g007
One possible explanation for the more marked difference with temperature in deposited fouling can be the following. When the tube was clean, its outer surface temperature was similar in the experiments with the two different deposition probe temperatures, low temperature (20–25 °C) and high temperature (60–65 °C). As the fouling layer grew, i.e., as the radius of insulation increased, the effect of the temperature difference increased, and thus, the effect became more different in the deposited fouling. Heat transfer in the system was calculated to verify the above explanation using Equation (7) from [44]. In cylindrical systems, such as the heat exchanger tube, temperature gradients are experienced in the radial direction and can be treated as one-dimensional. Figure 8 shows the variation of the heat exchanged as a function of the fouling thickness for both deposition probe temperatures. However, no significant differences in the trends of the curves were observed because the differences were so small that the two curves showed almost parallel behavior; even the low-temperature curve was slightly steeper:
q r = T , 1 T , 3 1 2 · π · r 1 · L · h 1 + ln ( r 2 r 1 ) 2 · π · k A · L + ln ( r 3 r 2 ) 2 · π · k B · L + 1 2 · π · r 3 · L · h 3
where:
  • T∞,1: water temperature (293 K or 333 K)
  • T∞,3: gases temperature (773 K)
  • r1: inner radio of the tube (0.0105 m)
  • r2: outer radio of the tube (0.0125 m)
  • r3: outer radio of the tube plus fouling thickness
  • L: length of the tube (0.12 m)
  • h1: convection coefficient of water (2500 W/m2K)
  • kA: conduction coefficient of steel (14.9 W/mK stainless steel AISI 304 [44])
  • kB: conduction coefficient of fouling (1.95 W/mK [45])
  • h3: convection coefficient of gases (100 W/m2K [46])
Figure 8. Heat transferred in function of the fouling thickness for both water-tube temperatures (20 °C and 60 °C).
Energies 08 09794 g008

3.3.2. Chemical Analysis: Characterization of the Inorganic Matter in the Fouling Deposits

To complete the thermal analysis and the SEM-EDS analysis performed in the previous section, a compositional analysis of fouling was implemented on samples from combustions with the lowest and the highest airflow but with samples from the low temperature and the high temperature regions (Figure 9). That is, samples of deposited fouling and adhered fouling, were performed with two different airflows (11 m3/h and 25 m3/h) and two different deposition probe temperatures (20–25 °C and 60–65 °C), keeping constant the rest of the parameters. C and O were eliminated and the rest of the inorganic elements were normalized to 100%.
In view of the SEM-EDS results presented in Figure 9, some tendencies of the inorganic elements were observed. Na appeared in a concentration more or less constant with the exception of samples with the highest airflow (25 m3/h) and the highest deposition probe temperature (HT). Si appeared in higher concentrations in deposited fouling samples, due to the non-volatile nature of this element, so it was not present in the first layers of fouling. The highest concentration of Si appeared at the high deposition probe temperature for deposited fouling samples. S increased in concentration in the adhered fouling samples of low airflow (11 m3/h), and S decreased its concentration in adhered fouling samples of high airflow (25 m3/h). Jiménez et al. [47] found that K2SO4 nucleates first when the gas cools near the heat exchanger and that KCl condenses on these nuclei at lower temperatures. So, at high airflows and, consequently high operating temperatures, there was a high amount of S in deposited fouling samples. Cl increased in concentration in adhered fouling samples, with the exception of experiments carried out with a low airflow (11 m3/h) and a low deposition probe temperature (LT). The highest concentrations of Cl appeared in adhered fouling samples with low airflow (11 m3/h) and high deposition probe temperature (HT). Cl concentration often dictates the amount of alkali vaporized during combustion [7], which probably combined to form KCl, a very harmful compound for boiler parts. K had a concentration more or less constant, but the highest concentration appeared at high airflows (25 m3/h) and high deposition probe temperature (HT). Ca appeared in higher concentrations upon deposited fouling, with the exception of a low airflow (11 m3/h) and a low deposition probe temperature (LT). Zn appeared in higher concentrations at 25 m3/h and high deposition probe temperature. Some elements, such as Mg, Al, P, Ti and Mn, appeared at practically constant concentration or with no notable trend. In general, K, S and Cl play a main role in fouling. Si has to be taken into account when slagging is studied.
Figure 9. SEM-EDS results of (D) deposited and (A) adhered fouling samples from combustions with a total airflow of (11) 11 m3/h and (25) 25 m3/h with a primary air distribution of 25% and a secondary air distribution of 75% and two different deposition probe temperatures: 20–25 °C (LT) and 60–65 °C (HT). C and O were eliminated and the rest of the inorganic elements were normalized to 100%.
Energies 08 09794 g009

4. Conclusions

One of the main conclusions of this article was the identification of some of the parameters associated with combustion that affect fouling. Their influence was not as critical as the composition of the burned biomass, but it was revealed that certain combustion parameters could be modified to find the optimal operating point in terms of fouling. Two optimum conditions for combustion were determined: first that the total airflow must be as high as possible to allow a complete combustion and not lose yield, but, at the same time, the flame must be confined within the burner in order for the flame to not reach the tube.
Two clear trends were observed in the thermal behavior of organic matter from fouling. When the total airflow supplied or the deposition probe temperature were increased, a reduction in the amount of organic matter was found in both samples of fouling, namely the deposited and the adhered fouling.
Characterization of inorganic matter revealed that on comparing wood pellets with fouling samples, Mg, Al, Si, Ca and Ti are non-volatile elements that stayed in the bottom ash, and only a small amount of each was volatilized in the combustion and then deposited on the boiler heat exchange surfaces. Cl and S are volatile elements that were released in the gas phase and then condensed to form fouling deposits. However, the content of Cl in fouling samples was higher than the content of S, indicating that although an important part is deposited over the tube, a large part of S is released in the gaseous phase and was not deposited over boiler parts. Most of the Cl was deposited to form fouling deposits, and thus, small amounts of Cl in biomass can be harmful in terms of initiating and prompting Cl related fouling deposits and corrosion. The highest concentration of Cl appeared in adhered fouling samples with a low airflow (11 m3/h) and a high deposition probe temperature (HT).

Supplementary Materials

Supplementary materials can be accessed at: https://www.mdpi.com/1996-1073/8/9/9794/s1.

Acknowledgments

The authors acknowledge financial support from the project ENE2012-36405 of the Ministry of Economy and Competitiveness (Spain). The work of the third author, a PhD student, has been supported by the grant BES-2013-064073 of the Ministry of Economy and Competitiveness (Spain).

Conflicts of Interest

The authors declare no conflict of interest.

References

  1. Demirbas, A. Potential applications of renewable energy sources, biomass combustion problems in boiler power systems and combustion related environmental issues. Prog. Energy Combust. Sci. 2005, 31, 171–192. [Google Scholar] [CrossRef]
  2. Fargione, J.; Hill, J.; Tilman, D.; Polasky, S.; Hawthorne, P. Land clearing and the biofuel carbon debt. Science 2008, 319, 1235–1238. [Google Scholar] [CrossRef] [PubMed]
  3. Bridgwater, A.V. Renewable fuels and chemicals by thermal processing of biomass. Chem. Eng. J. 2003, 91, 87–102. [Google Scholar] [CrossRef]
  4. Demirbas, M.F.; Balat, M.; Balat, H. Potential contribution of biomass to the sustainable energy development. Energ. Convers. Manag. 2009, 50, 1746–1760. [Google Scholar] [CrossRef]
  5. Tchapda, A.H.; Pisupati, S.V. A review of thermal co-conversion of coal and biomass/waste. Energies 2014, 7, 1098–1148. [Google Scholar] [CrossRef]
  6. Saidur, R.; Abdelaziz, E.A.; Demirbas, A.; Hossain, M.S.; Mekhilef, S. A review on biomass as a fuel for boilers. Renew. Sust. Energ. Rev. 2011, 15, 2262–2289. [Google Scholar] [CrossRef]
  7. Khan, A.A.; de Jong, W.; Jansens, P.J.; Spliethoff, H. Biomass combustion in fluidized bed boilers: Potential problems and remedies. Fuel Process. Technol. 2009, 90, 21–50. [Google Scholar] [CrossRef]
  8. Vassilev, S.V.; Baxter, D.; Andersen, L.K.; Vassileva, C.G.; Morgan, T.J. An overview of the organic and inorganic phase composition of biomass. Fuel 2012, 94, 1–33. [Google Scholar] [CrossRef]
  9. McKendry, P. Energy production from biomass (part 1): Overview of biomass. Bioresource Technol. 2002, 83, 37–46. [Google Scholar] [CrossRef]
  10. Vassilev, S.V.; Baxter, D.; Andersen, L.K.; Vassileva, C.G. An overview of the chemical composition of biomass. Fuel 2010, 89, 913–933. [Google Scholar] [CrossRef]
  11. Demirbas, A. Combustion characteristics of different biomass fuels. Prog. Energy Combust. Sci. 2004, 30, 219–230. [Google Scholar] [CrossRef]
  12. Bryers, R.W. Fireside slagging, fouling, and high-temperature corrosion of heat-transfer surface due to impurities in steam-raising fuels. Prog. Energy Combust. Sci. 1996, 22, 29–120. [Google Scholar] [CrossRef]
  13. Teixeira, P.; Lopes, H.; Gulyurtlu, I.; Lapa, N.; Abelha, P. Evaluation of slagging and fouling tendency during biomass co-firing with coal in a fluidized bed. Biomass Bioenerg. 2012, 39, 192–203. [Google Scholar] [CrossRef]
  14. Pronobis, M. The influence of biomass co-combustion on boiler fouling and efficiency. Fuel 2006, 85, 474–480. [Google Scholar] [CrossRef]
  15. Gilbe, C.; Öhman, M.; Lindström, E.; Boström, D.; Backman, R.; Samuelsson, R.; Burvall, J. Slagging characteristics during residential combustion of biomass pellets. Energ. Fuel. 2008, 22, 3536–3543. [Google Scholar] [CrossRef]
  16. Jenkins, B.M.; Baxter, L.L.; Miles, T.R., Jr.; Miles, T.R. Combustion properties of biomass. Fuel Process. Technol. 1998, 54, 17–46. [Google Scholar] [CrossRef]
  17. Skrifvars, B.J.; Yrjas, P.; Laurén, T.; Kinni, J.; Tran, H.; Hupa, M. The fouling behavior of rice husk ash in fluidized-bed combustion. 2. Pilot-scale and full-scale measurements. Energ. Fuel. 2005, 19, 1512–1519. [Google Scholar] [CrossRef]
  18. James, A.K.; Thring, R.W.; Helle, S.; Ghuman, H.S. Ash management review-applications of biomass bottom ash. Energies 2012, 5, 3856–3873. [Google Scholar] [CrossRef]
  19. Theis, M.; Skrifvars, B.-J.; Hupa, M.; Tran, H. Fouling tendency of ash resulting from burning mixtures of biofuels. Part 1: Deposition rates. Fuel 2006, 85, 1125–1130. [Google Scholar] [CrossRef]
  20. Szemmelveisz, K.; Szucs, I.; Palotás, Á.B.; Winkler, L.; Eddings, E.G. Examination of the combustion conditions of herbaceous biomass. Fuel Process. Technol. 2009, 90, 839–847. [Google Scholar] [CrossRef]
  21. Yin, C.; Rosendahl, L.A.; Kær, S.K. Grate-firing of biomass for heat and power production. Prog. Energy Combust. Sci. 2008, 34, 725–754. [Google Scholar] [CrossRef]
  22. Shao, Y.; Wang, J.; Preto, F.; Zhu, J.; Xu, C. Ash deposition in biomass combustion or co-firing for power/heat generation. Energies 2012, 5, 5171–5189. [Google Scholar] [CrossRef]
  23. Johansen, J.M.; Aho, M.; Paakkinen, K.; Taipale, R.; Egsgaard, H.; Jakobsen, J.G.; Frandsen, F.J.; Glarborg, P. Release of k, cl, and s during combustion and co-combustion with wood of high-chlorine biomass in bench and pilot scale fuel beds. Proc. Combust. Inst. 2013, 34, 2363–2372. [Google Scholar] [CrossRef]
  24. Li, R.; Kai, X.; Yang, T.; Sun, Y.; He, Y.; Shen, S. Release and transformation of alkali metals during co-combustion of coal and sulfur-rich wheat straw. Energ. Convers. Manag. 2014, 83, 197–202. [Google Scholar] [CrossRef]
  25. Pronobis, M.; Kalisz, S.; Polok, M. The impact of coal characteristics on the fouling of stoker-fired boiler convection surfaces. Fuel 2013, 112, 473–482. [Google Scholar] [CrossRef]
  26. Tortosa Masiá, A.A.; Buhre, B.J.P.; Gupta, R.P.; Wall, T.F. Characterising ash of biomass and waste. Fuel Process. Technol. 2007, 88, 1071–1081. [Google Scholar]
  27. Viana, H.; Vega-Nieva, D.J.; Ortiz Torres, L.; Lousada, J.; Aranha, J. Fuel characterization and biomass combustion properties of selected native woody shrub species from central portugal and nw spain. Fuel 2012, 102, 737–745. [Google Scholar] [CrossRef]
  28. Theis, M.; Skrifvars, B.-J.; Zevenhoven, M.; Hupa, M.; Tran, H. Fouling tendency of ash resulting from burning mixtures of biofuels. Part 3. Influence of probe surface temperature. Fuel 2006, 85, 2002–2011. [Google Scholar] [CrossRef]
  29. Febrero, L.; Granada, E.; Pérez, C.; Patiño, D.; Arce, E. Characterisation and comparison of biomass ashes with different thermal histories using tg-dsc. J. Therm. Anal. Calorim. 2014, 118, 669–680. [Google Scholar] [CrossRef]
  30. Granada, E.; Patiño, D.; Míguez, J.L.; Morán, J. Analysis of deposition of fouled matter in a water-tube heat exchanger of a biomass combustor. In Proceedings of the 34th International Symposium on Combustion, Warsaw, Poland, 29 July–3 August 2012.
  31. Vamvuka, D.; Zografos, D. Predicting the behaviour of ash from agricultural wastes during combustion. Fuel 2004, 83, 2051–2057. [Google Scholar] [CrossRef]
  32. Darvell, L.I.; Jones, J.M.; Gudka, B.; Baxter, X.C.; Saddawi, A.; Williams, A.; Malmgren, A. Combustion properties of some power station biomass fuels. Fuel 2010, 89, 2881–2890. [Google Scholar] [CrossRef]
  33. Pronobis, M. Evaluation of the influence of biomass co-combustion on boiler furnace slagging by means of fusibility correlations. Biomass Bioenerg. 2005, 28, 375–383. [Google Scholar] [CrossRef]
  34. Bartolomé, C.; Gil, A. Ash deposition and fouling tendency of two energy crops (cynara and poplar) and a forest residue (pine chips) co-fired with coal in a pulverized fuel pilot plant. Energ. Fuel. 2013, 27, 5878–5889. [Google Scholar] [CrossRef]
  35. Coaltech. Common slagging and fouling indices. Available online: http://www.coaltech.com.au/LinkedDocuments/Slagging%20&%20Fouling.pdf (accessed on 6 May 2014).
  36. Vassilev, S.V.; Baxter, D.; Andersen, L.K.; Vassileva, C.G. An overview of the composition and application of biomass ash. Part 1. Phase-mineral and chemical composition and classification. Fuel 2013, 105, 40–76. [Google Scholar] [CrossRef]
  37. Obernberger, I.; Brunner, T.; Bärnthaler, G. Chemical properties of solid biofuels-significance and impact. Biomass Bioenerg. 2006, 30, 973–982. [Google Scholar] [CrossRef]
  38. Baxter, L.L. Ash deposition during biomass and coal combustion: A mechanistic approach. Biomass Bioenerg. 1993, 4, 85–102. [Google Scholar] [CrossRef]
  39. Umamaheswaran, K.; Batra, V.S. Physico-chemical characterisation of indian biomass ashes. Fuel 2008, 87, 628–638. [Google Scholar] [CrossRef]
  40. Pietro, M.; Paola, C. Thermal analysis for the evaluation of the organic matter evolution during municipal solid waste aerobic composting process. Thermochim. Acta 2004, 413, 209–214. [Google Scholar] [CrossRef]
  41. Batra, V.S.; Urbonaite, S.; Svensson, G. Characterization of unburned carbon in bagasse fly ash. Fuel 2008, 87, 2972–2976. [Google Scholar] [CrossRef]
  42. Vassilev, S.V.; Baxter, D.; Andersen, L.K.; Vassileva, C.G. An overview of the composition and application of biomass ash.: Part 2. Potential utilisation, technological and ecological advantages and challenges. Fuel 2013, 105, 19–39. [Google Scholar] [CrossRef]
  43. Broström, M.; Enestam, S.; Backman, R.; Mäkelä, K. Condensation in the kcl–nacl system. Fuel Process. Technol. 2013, 105, 142–148. [Google Scholar] [CrossRef]
  44. Incropera, F.P.; DeWitt, D.P. Fundamentos De Transferencia De Calor, 4th ed.; Prentice Hall: Zapopan, Mexico, 1999; p. 886. [Google Scholar]
  45. Quan, Z.; Chen, Y.; Ma, C. Experimental study of fouling on heat transfer surface during forced convective heat transfer. Chinese J. Chem. Eng. 2008, 16, 535–540. [Google Scholar] [CrossRef]
  46. Kreith, F.; Manglik, R.M.; Bohn, M.S. Principios De Transferencia De Calor, 7th ed.; Cengage Learning Editores S.A.: Santa Fe, Mexico, 2012; Chapter 8; p. 496. [Google Scholar]
  47. Jiménez, S.; Ballester, J. Influence of operating conditions and the role of sulfur in the formation of aerosols from biomass combustion. Combust. Flame 2005, 140, 346–358. [Google Scholar] [CrossRef]

