Article

What Do Capacity Deployment Rates Tell Us about the Efficiency of Electricity Generation from Renewable Energy Sources Support Measures in Greece?

by
Sotiris Papadelis
,
Vasssilis Stavrakas
and
Alexandros Flamos
*
Department of Industrial Management and Technology, University of Piraeus, Karaoli & Dimitriou 80, Piraeus 18534, Greece
*
Author to whom correspondence should be addressed.
Energies 2016, 9(1), 38; https://doi.org/10.3390/en9010038
Submission received: 17 November 2015 / Revised: 21 December 2015 / Accepted: 4 January 2016 / Published: 13 January 2016
(This article belongs to the Special Issue Applied Energy System Modeling 2015)

Abstract

:
The efficiency of fiscal support for electricity generation from renewable energy sources (RES-E) is a multifaceted notion that cannot be adequately described by a single metric. Efficiency is related to the ability of a policy measure to support deployment without creating negative feedback effects. These negative effects may stem from saturation of the grid’s ability to absorb an increased amount of RES-E power, the inability of regulatory bodies to cope with the larger workload due to the increased number of projects requesting permits or from rent-seeking behavior. Furthermore, the primary rationale for feed-in tariffs (FITs) and other fiscal support schemes is that increased deployment of RES-E technologies will lead to reductions in costs and increases in efficiency. As a result, the efficiency of an RES-E support policy should be also judged by its ability to capitalize on cost reductions. Overall, we present an approach to facilitate ongoing assessments of the efficiency of support measures for RES-E deployment. We demonstrate the proposed approach using the FIT support policy in Greece as a case study. In particular, the RES-E support policy in Greece has been recently revised through tariff cuts and a moratorium on new production licenses. We aim to demonstrate that if publicly available data are appropriately monitored, a policy revision can take place in a timelier and less disruptive manner.

1. Introduction

The European Union (EU) has set ambitious targets for increasing the share of electricity generation from renewable energy sources (RES-E) since the late 1990s. To meet these targets, the implementation of fiscal support measures has been envisaged. Fiscal support for RES-E can be justified by environmental and socioeconomic reasons; RES-E decreases dependence on fossil fuels, which translates into reductions in greenhouse gas emissions, as well as in emissions of local pollutants. In addition, RES-E deployment provides several socioeconomic benefits, including diversification of energy supply, increased regional and rural development opportunities, establishment of a domestic industry and employment opportunities [1,2,3].
The experience accumulated so far suggests that fiscal support mechanisms, and in particular, feed-in schemes, which are the most common support scheme in Europe, have been an effective policy instrument. Ninety-three percent (93%) of all wind onshore capacity and nearly one hundred percent (100%) of all photovoltaic (PVs) capacity installed by the end of 2010 in Europe were initiated by feed-in tariff systems [4]. Effectiveness can be understood and measured as “the extent to which intended objectives are met, for instance the actual increase in the output of renewable electricity generated or shares of renewable energy in total energy supplies within a specified time period” [5,6].
The usual approach to measuring the effectiveness of RES-E support policies is to measure the extent to which pre-defined national goals have been achieved in an allotted period. This is straightforward, since all EU Member States are obligated by Article 4 of the Renewable Energy Directive (2009/28/EC) to publish a National Renewable Energy Action Plan (NREAP) that will present a detailed roadmap including all necessary policies each member state should endorse to achieve all its legally-binding 2020 goals for the share of renewable energy in its total energy consumption. If we regard the NREAP goals as representative of the electricity generation potential in each Member State, we can define the effectiveness of a Member State policy as the ratio of the change of the potential during a given period of time to the additional realizable potential until 2020 [7].
The efficiency of a policy instrument is significantly more difficult to assess. According to the general definition, efficiency is the ratio of outcomes to inputs, for example renewable energy targets realized for public economic resources spent. One approach for efficiency assessment can be found in Sgroi et al. [8], where the profitability of an investment in RES-E is estimated, and subsequently, the minimum incentive tariff at which the entrepreneur has an economic advantage to realize the RES-E system is determined. A significant gap between the actual and the theoretical minimum incentive tariff reflects a potentially inefficient policy.
The point of departure for this paper is however that the efficiency of the RES-E fiscal support measures, as well as the efficiency of any policy measure in general, is a multifaceted notion that cannot be adequately described by a single metric, such as a cost-to-benefit ratio. In contrast, assessing efficiency requires addressing (at least) the following additional questions:
(1)
To what extent have the support measures overcompensated for induced inertia in the system? An RES-E support policy should not only achieve a deployment rate that best utilizes the technical potential of a country, but it should also support deployment without creating additional friction and negative feedback effects. These negative effects may stem from saturation of the grid’s ability to absorb an increased amount of the RES-E feed-in or the inability of the regulatory bodies responsible for permitting to cope with increased workload due to the increased number of projects requesting permits.
(2)
How capable were the support measures in capitalizing on technology cost reductions? The rationale behind feed-in tariffs (FITs) and other fiscal support schemes is that increased deployment of RES-E technologies will lead to investment cost reductions and efficiency gains as a result of knowledge accumulation, competition and economies of scale. At the same time, there is always a concern among policy makers that falling technology prices may not carry over to falling turnkey prices. Zhang [9] suggested that such a disconnect could indicate a correlation between remuneration and investment costs: high remuneration allowing deployment in high-cost locations (e.g., with poor wind conditions). Moreover, an International Energy Agency (IEA) study [10] suggests that high remuneration may have encouraged rent-seeking behavior: solar panel sellers pricing their products according to the incentive in a given country, trying to take a share of any excess remuneration.
The first question is motivated by observing the findings in [11] that indicate a lack of strong correlation between the effectiveness of RES-E support measures and the potential profit ranges available for investors through these measures. This implies that when higher profitability does not lead to higher deployment rates, fiscal support may be trying to compensate for “non-economic” barriers, such as lengthy administrative processes or barriers to grid access. At the same time, these barriers limit the market’s appeal to only very efficient investors in the first place (i.e., investors with access to the best sites, adequate funds and know-how).
The second question relates naturally to the notion of policy adaptability. Policies must be adaptive to uncertain and continuously changing conditions [12]. A policy is adaptive if: (1) there is monitoring capability or, equivalently, efficient ways to acquire data for the market’s current status; (2) there is performance measurement capability, which implies indicators that can act as metrics to assess policy performance; (3) there is the ability to identify policy inadequacy in a timely manner so that changes can be made, and (4) the ability to change is not perceived by the involved actors as a risk. Experience indicates that retroactive policy changes are highly damaging to investor confidence, whereas regular reviews and adjustments are effective solutions [13].
In this paper, we present an approach for assessing the efficiency of support measures for RES-E deployment. The approach is presented for the case of FIT support in Greece. Greece is an interesting case study, since at a time of economic austerity, fiscal support is difficult to justify and maintain. As a consequence, Greece faced a feed-in tariff deficit and resolved to cuts in subsidies, retroactive revenue taxes, tariff reductions and halts to new renewable energy projects.

2. Approach and Main Assumptions

Due to the cost reductions caused by the increased deployment of an RES-E technology, it is expected that an FIT scheme that maintains a constant tariff rate over time will essentially be providing a growing real subsidy to the investors. In practice, regulators attempt to maintain the same level of profitability by dynamically adjusting the tariffs offered to newly-commissioned projects. For example, Germany’s Renewable Energy Source Act is established based on an approximate 7% rate of return for well-operated installations [14]. The target profit margins in France are based on a profitability index (PI), defined as the ratio between a project’s overall discounted payoffs and its total discounted cost [15]. This leads to a tariff structure that decreases over time, so as to reflect anticipated cost reductions.
A constant PI is not, however, the only policy choice. An ascending PI reflects a policy that starts by limiting the appeal of the technology to very efficient investors first and gradually invites less efficient developers to join in by making their investment financially viable [16]. On the other hand, a descending PI reflects a policy that offers more aggressive tariffs early on to encourage rapid market growth and then decreases profitability as time progresses to narrow the policy scope to only the most efficient segments of the investor pool.
Since each PI policy implies a certain set of assumptions regarding its expected results, important insight can be gained by comparing the PI to the actual demand for RES-E investments. The demand for investments during any given period can be regarded as a function of their perceived value. In turn, the perceived value can be regarded as a function of the PI, as well as of a series of unobservable factors, such as perceived risk, soft costs and information spread. As a consequence, a comparison of the evolution of the demand for RES-E capacity investments with the evolution of their PI would help highlight the magnitude and the time evolution of the unobservable factors. This is important because the unobservable factors are directly responsible for the efficiency of the provided financial incentives. An alternative way to view these factors is that they represent the cost of the policy-induced uncertainty or the cost of the delays caused by permitting and grid connection procedures.

2.1. Quantifying the Investment Profitability Index

Masini and Menichetti [17] employed a survey to examine the factors that influence the decisions regarding renewable energy investments. Their study demonstrates the importance of clear policy signals in driving investment; investors attach high premia to the certainty of the investment returns. Commiting to predictable long-term policies is expected to be more effective and as a result more appealing to investors, than excessive short-term fiscal incentives. Furthermore, investors find tariff size and contract duration of FITs almost equally important. Based on these insights, one should expect that the demand for investments is correlated with an index that incorporates both the tariff size and the contract duration’s impact on the expected profitability of an RES-E project.
The cash flows of an RES-E investment at a future time (year) t can be written as:
C t = energy _ income t O   &   M t tax t
where:
  • energy _ income t represents the revenues from selling energy at time t ;
  • O   &   M t represents the operation and maintenance costs at time t ;
  • tax t represents the corporate tax at time t .
The revenues from selling energy at time t can be written as:
energy _ income t =   ( 1 levy t ) · energy _ yield t · p t
where:
  • levy t represents the special levy on RES-E operation in Greece at time t ;
  • energy _ yield t represents the energy yield of the project at time t in MWh;
  • p t   represents the remuneration of RES-E generation at time t in €/MWh.
The energy yield of a wind RES-E project can be written as:
energy _ yield t = C F t · z · P R w · 8760
where:
  • C F t represents the average capacity factor at time t ;
  • z represents the number of the wind turbines;
  • P R w represents the rated power of each wind turbine.
The energy yield of a PV RES-E project can be written as:
energy _ yield t = C F t · degradation _ index t · P R s · 8760
where:
  • degradation _ index t represents the degradation index at time t ;
  • P R s represents the rated power of the PV plant.
The degradation index at time t can be written as:
degradation _ index t =   degradation _ index t 1 · ( 1 a n n u a l   e f f i c i e n c y   d e c r e a s e )
Since the annual efficiency decrease is zero in the beginning of the asset’s life time ( t = 0 ), we take the degradation index to be equal to one:
degradation _ index 0 = 1
The operation and maintenance costs at time t can be written as a fraction m   of the initial capital invested, also taking into account an annual increase of the cost g   (i.e., the annual inflation rate):
O   &   M t = m · I C o · ( 1 + g ) t
where: I C o represents the initial installation (turnkey) cost.
The corporate tax at time t is:
tax t =   ( energy _ income t O   &   M t depreciation t ) · tax _ rate t
depreciation t =   I C o depreciationtime
where: tax _ rate t represents the national tax rate on corporate profit.
Based on the above, we can adopt the after-tax-leveraged modified internal rate of return [18] (MIRR) as the PI for the RES-E projects. Both the finance rate and the reinvestment rate for the calculation of MIRR will be assumed to be equal to the investor’s weighted average cost of capital (WACC). The WACC represents the weighted mix of debt and equity costs for the investor and is calculated according to the following equation:
W A C C =   W E · r E +   ( 1 W E ) · r D · ( 1 tax _ rate t )
where:
  • W E represents the percentage of financing that is equity, i.e., W E = Equity Equity + Debt ;
  • r E represents the equity cost or, alternatively, the desired annual return on investment;
  • r D represents the cost of debt before tax. The cost of debt is reduced by the tax rate, because it is included in allowable costs against tax and, therefore, acts as a tax shield.
The index is calculated based on the cash flows C t minus the debt service. Furthermore, the initial investment cash flow in Year 0is assumed to be only the equity portion of the investment cost. In general, the capital structure of an RES-E project includes the following capital sources: (1) equity; (2) bank loan; and (3) investment subsidy.
The percentage contributions of each capital source vary according to the current financial market conditions, the type of RES-E technology and the characteristics of the investor. For the Greek market, they are usually formed as follows:
Equity: 25%–70%;
Bank loan: 40%–75% (up to 100% in the case of PV that fall within the scope of the special development program for PV on roofs up to 10kW);
Investment subsidy: 0%–40%.

2.2. The Demand for Investments

For the construction and operation of an RES-E project in Greece, the following licenses are required:
Electricity Production License;
Grid Connection Offer from the System Operator;
Decision of Approval of Environmental Terms;
Installation License;
Operation License: any project that is exempt from the requirement for an Electricity Production License is also exempt from the requirement for an Operation License.
The licensing procedure for RES-E projects is summarized in Figure 1.
Figure 1. The licensing procedure for electricity generation from renewable energy sources (RES-E) projects in Greece (Source: [19]).RAE, Regulatory Authority of Energy.
Energies 09 00038 g001
Demand for production licenses can be used as a proxy for the demand for investments. Alternatively, the demand for investments can be measured using the RES-E capacity actually installed. Both approaches, however, have their limitations: production licenses may not always lead to actual RES-E projects, and on the other hand, there is a sometimes considerable time lag between an investment decision and the capacity addition that corresponds to this decision; this time lag may span over different levels of the PI. For the purpose of the present analysis, production licenses where used for representing the demand for capacity investments. However, hindsight was utilized: the dataset of production licenses that was used for the analysis includes only the ones that are still in effect.

2.3. The Evolution of the Electricity Generation from Renewable Energy Sources Support Incentives in the Greek Market

The evolution of FIT prices for mainland onshore wind and PV RES-E projects in Greece is summarized in Table 1, Table 2 and Table 3. The index of each table (i.e., the first column) represents the year when the FIT size (€/MWh) was fixed. The tables for PV do not contain data until 2005, since before this year, capacity installations were practically zero, due to low tariff and short guaranteed periods, complex and long-lasting licensing procedures and regulatory and technical obstacles regarding the access to the grid.
Table 1. Feed-in tariffs (FITs) for onshore wind from 2001 to 2013.
YearFeed-in Tariffs (FITs) for Onshore Wind from 2001 to 2013 (€/MWh)
2001200220032004200520062007200820092010201120122013
200170707070707070707070707070
2002-707070707070707070707070
2003--68.6868.6868.6868.6868.6868.6868.6868.6868.6868.6868.68
2004---68.6868.6868.6868.6868.6868.6868.6868.6868.6868.68
2005----72.8772.8772.8772.8772.8772.8772.8772.8772.87
2006-----7373737373737373
2007------74.8774.8774.8774.8774.8774.8774.87
2008-------76.676.676.676.676.676.6
2009--------80.1480.1480.1480.1480.14
2010---------105.42105.42105.42105.42
2011----------106.66106.66106.66
2012-----------107.95107.95
2013------------107.95
Table 2. FITs for small photovoltaics (PVs) (up to 10 kWp) from 2006 to 2013.
YearFITs for Small PVs (up to 10 kWp) from 2006 to 2013 (€/MWh)
20062007200820092010201120122013
2006450461.52472.19487.87492.59511.15524.77531.07
2007-461.52472.19487.87492.59511.15524.77531.07
2008--472.19487.87492.59511.15524.77531.07
2009---487.87446.88411.95367.58327.61
2010----446.88411.95367.58327.61
2011-----411.95367.58327.61
2012------226.87210.84
2013-------210.84
Table 3. FITs for large PVs (>100 kWp) from 2006 to 2013.
YearFITs for Large PVs (>100 kWp) from 2006 to 2013 (€/MWh)
20062007200820092010201120122013
2006400400400400400400400400
2007-410.24410.24410.24410.24410.24410.24410.24
2008--419.72419.72419.72419.72419.72419.72
2009---433.65433.65433.65433.65433.65
2010----397.22397.22397.22397.22
2011-----366.18366.18366.18
2012------238.01238.01
2013-------168.66
Furthermore, subsidies on capital investment costs were foreseen according to the National Development Law 2601/1998. Investments in RES-E installations have a special status under Law 2601/1998. More specifically:
40% public subsidy (grant) on the total eligible RES-E investment cost plus 40% subsidy on the interest of loans obtained for the purpose of financing the RES-E investment; alternatively, 40% subsidy on the loan interest plus 100% tax deduction on the RES-E investment cost;
The grant is paid in two equal installments; the first after the implementation of 50% of the investment and the second with the certification of the completion and commissioning of the investment;
RES technology and geographical region do not affect the level of subsidy (40%);
Required own capital: 40% (min) of the total investment cost;
Minimum investment cost required: 176 k€;
Maximum subsidy granted: 14.7 M€;
Maximum investment cost subsidized: 36.7 M€.
In February 2011, the new Development Law for supporting private investment for economic growth, Entrepreneurship and regional cohesion (Law 3908/2011) was introduced in order to improve the tax benefits for investors selecting this option of investment support. According to the law, investors can select one of three forms of investment support:
Cash grants/leasing subsidies: The amount of subsidy varies according to the size of the enterprise and the prefecture where the investment plan will be implemented. In any case, the subsidy cannot exceed 50% of the qualifying cost of the investment;
Wage subsidies for new employment created by the investment of up to 60% of the overall investment cost;
Non-taxable income of up to 100% of the investment at a 25% tax rate. This translated to a tax benefit of up to 25% of the investment.
The subsidy is paid in three installments, according to the state of implementation of the project. Investors may receive an advance payment of up to 25% of the granted subsidy, if they are able to produce a guarantee of a bank based in Greece. Another 25% is paid after the implementation of 50% of the investment and the remaining 50% with the certification of the completion and commissioning of the investment.

2.4. The Evolution of Onshore Wind and Photovoltaic Electricity Generation from Renewable Energy Sources Costs

The capital costs of a wind RES-E project can be broken down into the following major categories:
The turbine cost;
Civil works including construction costs for site preparation and tower foundations;
Grid connection costs, including transformers and sub-stations, as well as the connection to the local distribution or transmission network;
Planning and project costs;
Other capital costs, which may include the construction of roads, buildings, control systems, etc.
According to the International Renewable Energy Agency (IRENA) report [20], the average capital cost for onshore wind power systems in Greece was as below.
The capital cost for onshore wind power systems in Greece for the years 2011, 2012 and 2013 is assumed to be 1200 €/kW. The operation and maintenance costs can be written as a fraction of the initial capital invested according to Table 4 and Table 5.
Table 4. Average capital cost for onshore wind power systems in Greece from 2003 to 2010. Note here that for the year 2009, the original number in the report was “1628”; however, it is regarded as a skewed result.
Cost (€/kW)
2001200220032004200520062007200820092010
1000100084969476611361159112011641207
Table 5. Operation and maintenance costs for onshore wind power systems in Greece.
Operation and Maintenance Costs
i.Cost coefficient for electro-mechanical equipment maintenance2%
ii.Cost coefficient for civil works maintenance0.5%
iii.Cost coefficient for electro-mechanical equipment insurance0.6%
iv.Cost coefficient for civil works insurance0.6%
According to the national survey reports of the IEA Co-operative Program on PV Power Systems [21], the PV module prices, as well as the system prices for small roof-mounted systems in Italy (Italy was chosen because of data unavailability for Greece) from 2001 to 2012 were as follows in Table 6 and Table 7.
Table 6. PV module prices for Italy from 2001 to 2012.
Module Price (€/Wp)
200120022003200420052006200720082009201020112012
4.253.83.53.33.63.43.83.32.21.51.00.7
Table 7. System Prices for Small Roof-Mounted PV Systems in Italy.
System Prices for Small Roof-Mounted PV Systems (€/Wp)
200120022003200420052006200720082009201020112012
7.47.57.36.87.06.46.56.04.54.03.22.4
During 2013, the cost range for a small roof-mounted PV system in Greece was between 1300 €/kW and 1700 €/kW.

3. Results and Discussion

3.1. Sensitivity of Investment Demand to Feed-in Tariffs Prices for Onshore Wind Electricity Generation from Renewable Energy Sources Projects

The analysis begins by quantifying the corresponding PI, using the set of parameters and equations defined in Section 2.1. The benchmark project for this section concerns an interconnected (mainland) wind farm with an installed capacity of 3.6 MW (e.g., consisting of two wind turbines with a nominal capacity of 1.8 MW, each). The contributions of each capital source to the initial investment expenditure are assumed as follows:
Until 2006: A 40% public subsidy (grant) of the total eligible RES-E investment cost, equity capital equal to 40% of the total investment cost and 40% subsidy of the interest of the loan (20%) obtained for the purpose of financing the investment;
From 2006 to 2010: A 40% public subsidy and equity capital equal to 25% of the total investment cost;
From 2010 onwards: The equity capital covers 25% of the total investment cost. The rest is covered by a loan (75%), and the FIT are increased by 20%
It is also assumed that the investors secure a loan with a 10 year duration and a 7% interest rate. The cost of equity is 10%. According to data from the Greek operator of electricity market [22], the average annual capacity factor for interconnected wind RES-E farms is 25%. Furthermore, the operating and maintenance cost is assumed to be equal to 3.7% of the total investment cost per annum. The depreciation expense is assumed to be equal to 5% of the total investment cost per annum. We assume that the corporate tax rate remains at 25% during the project’s operation and that inflation rises at the rate of 2% annually. The project duration is 20 years, and the salvage value is assumed to be zero.
The values of the PI for the years from 2001 to 2012 are presented in Table 8 (note: the value 12.7 in 2001 means that the MIRR was 12.7%).
Table 8. The profitability index (PI) for an interconnected onshore wind farm from 2001 to 2012.
Profitability Index (PI) for an Interconnected on Shore Wind Farm from 2001 to 2012
Year200120022003200420052006200720082009201020112012
PI12.712.713.715.014.813.513.614.014.114.915.015.1
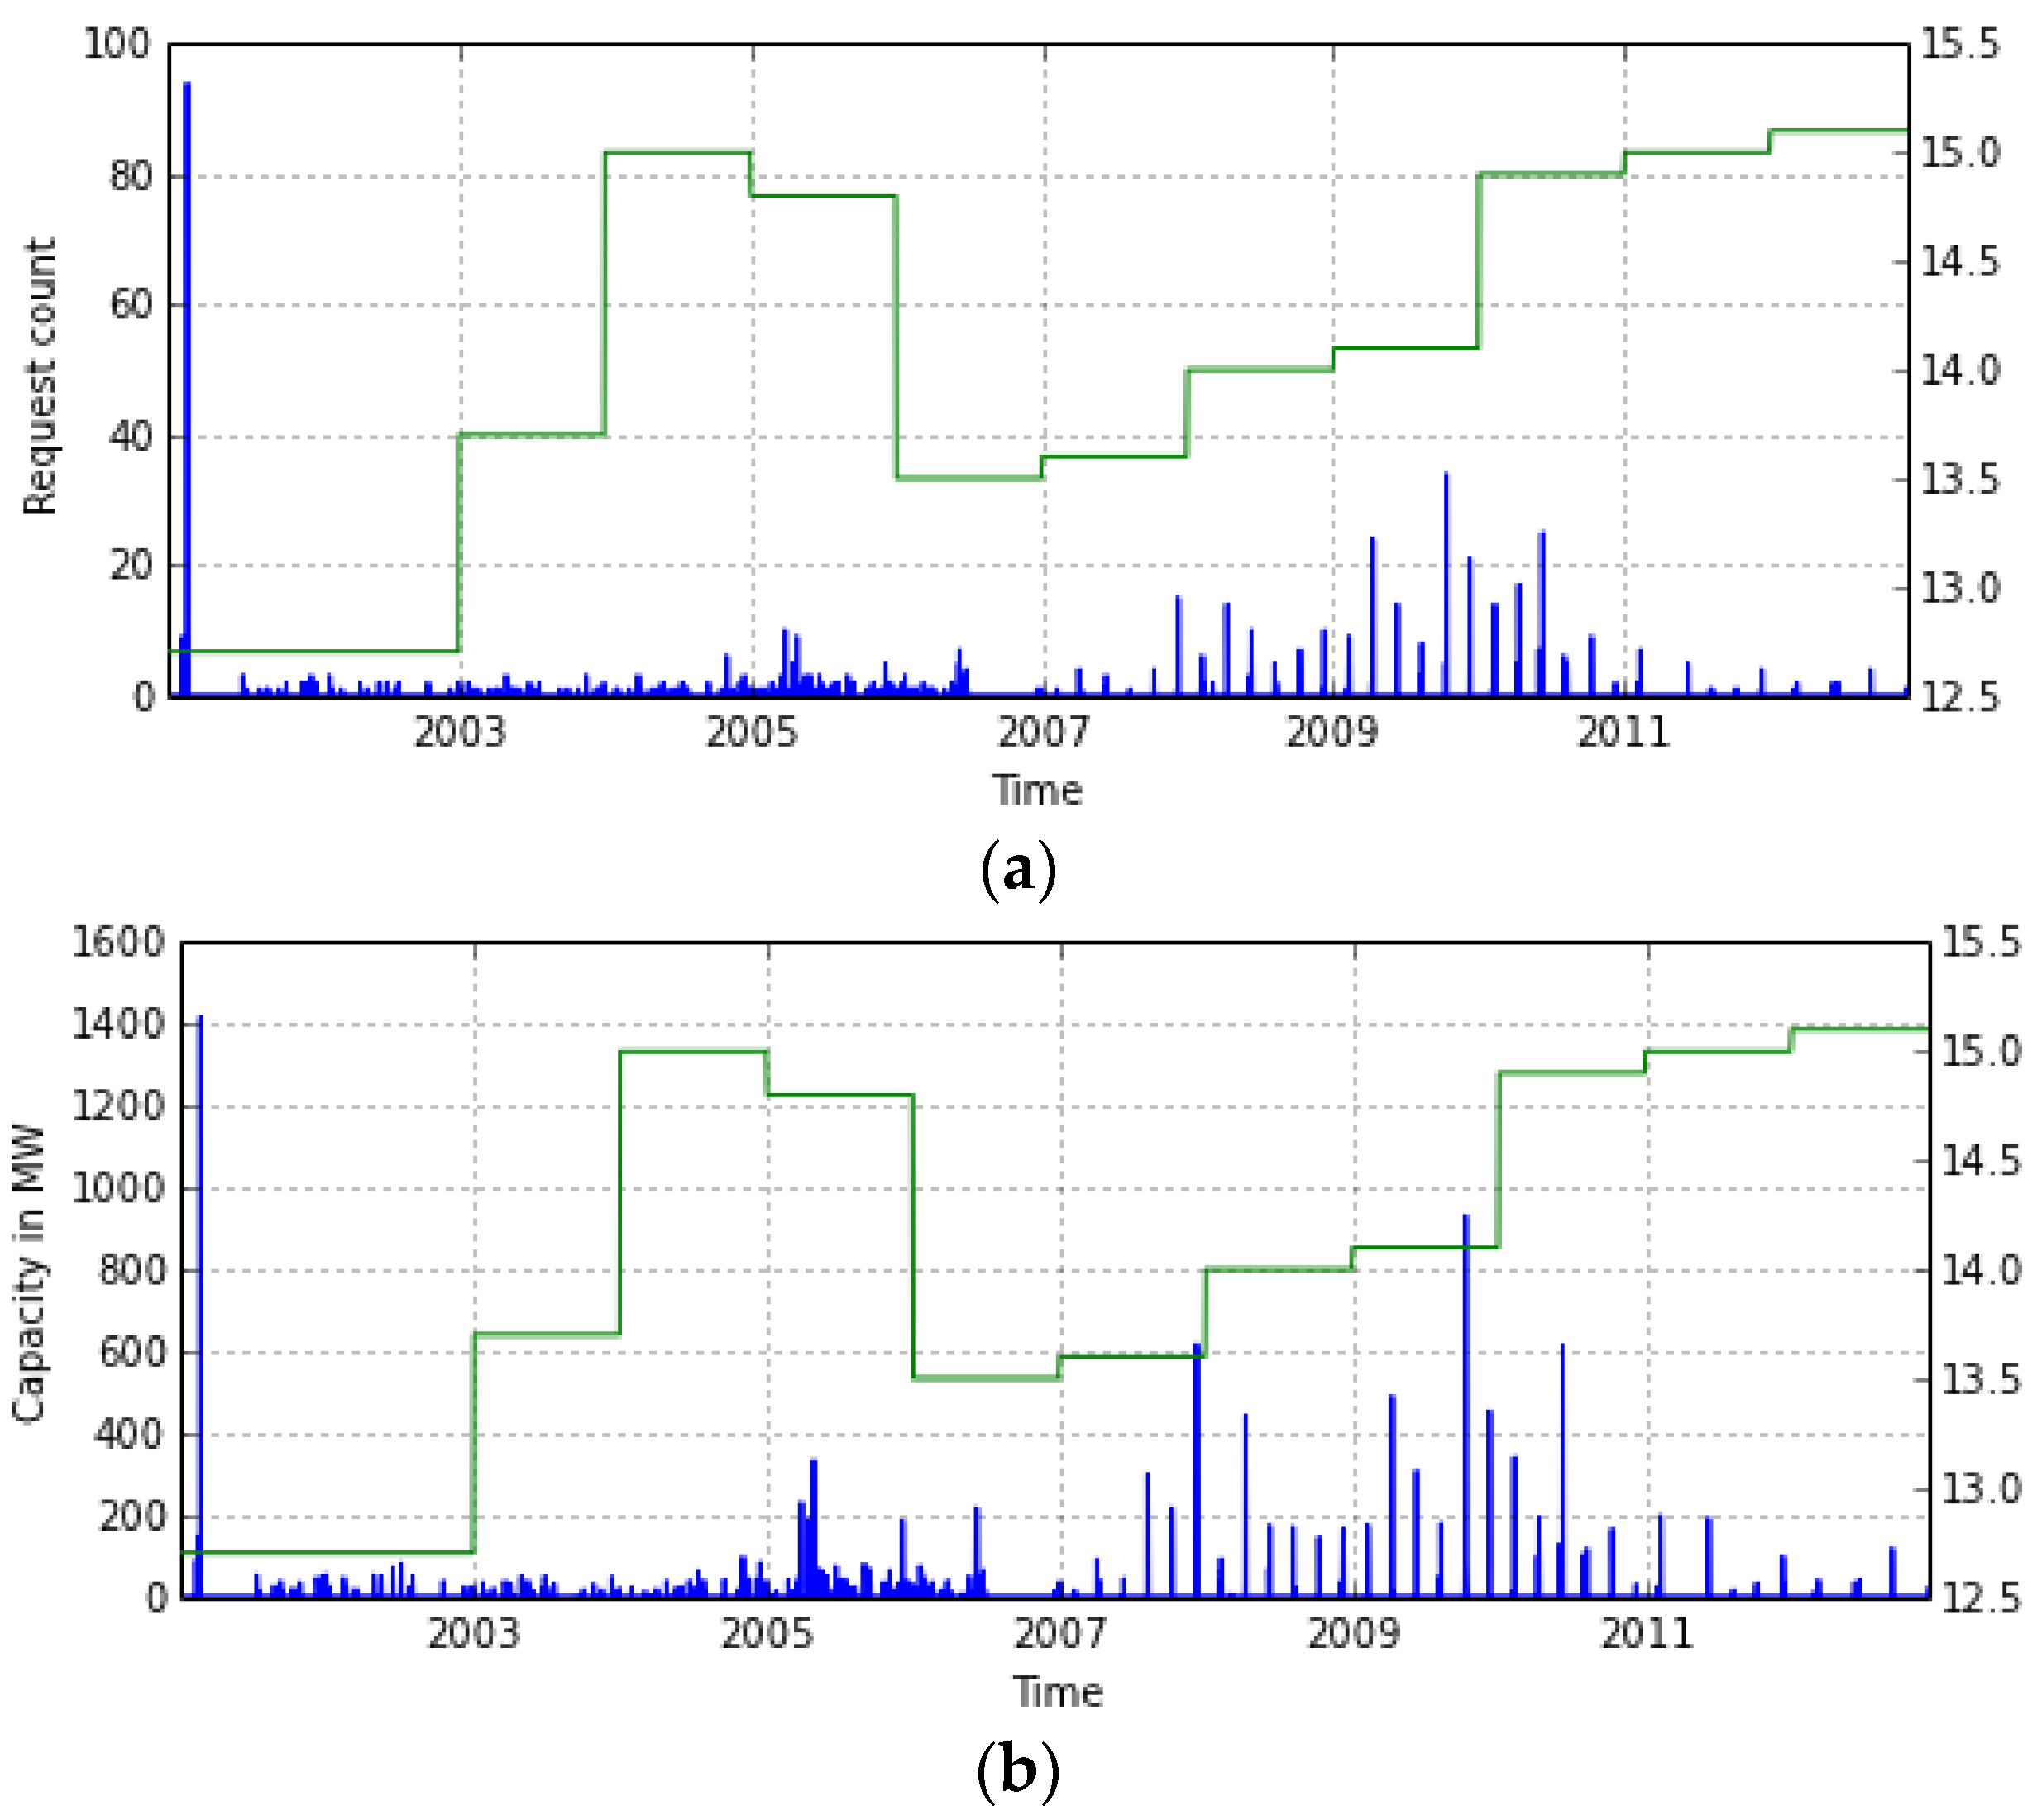
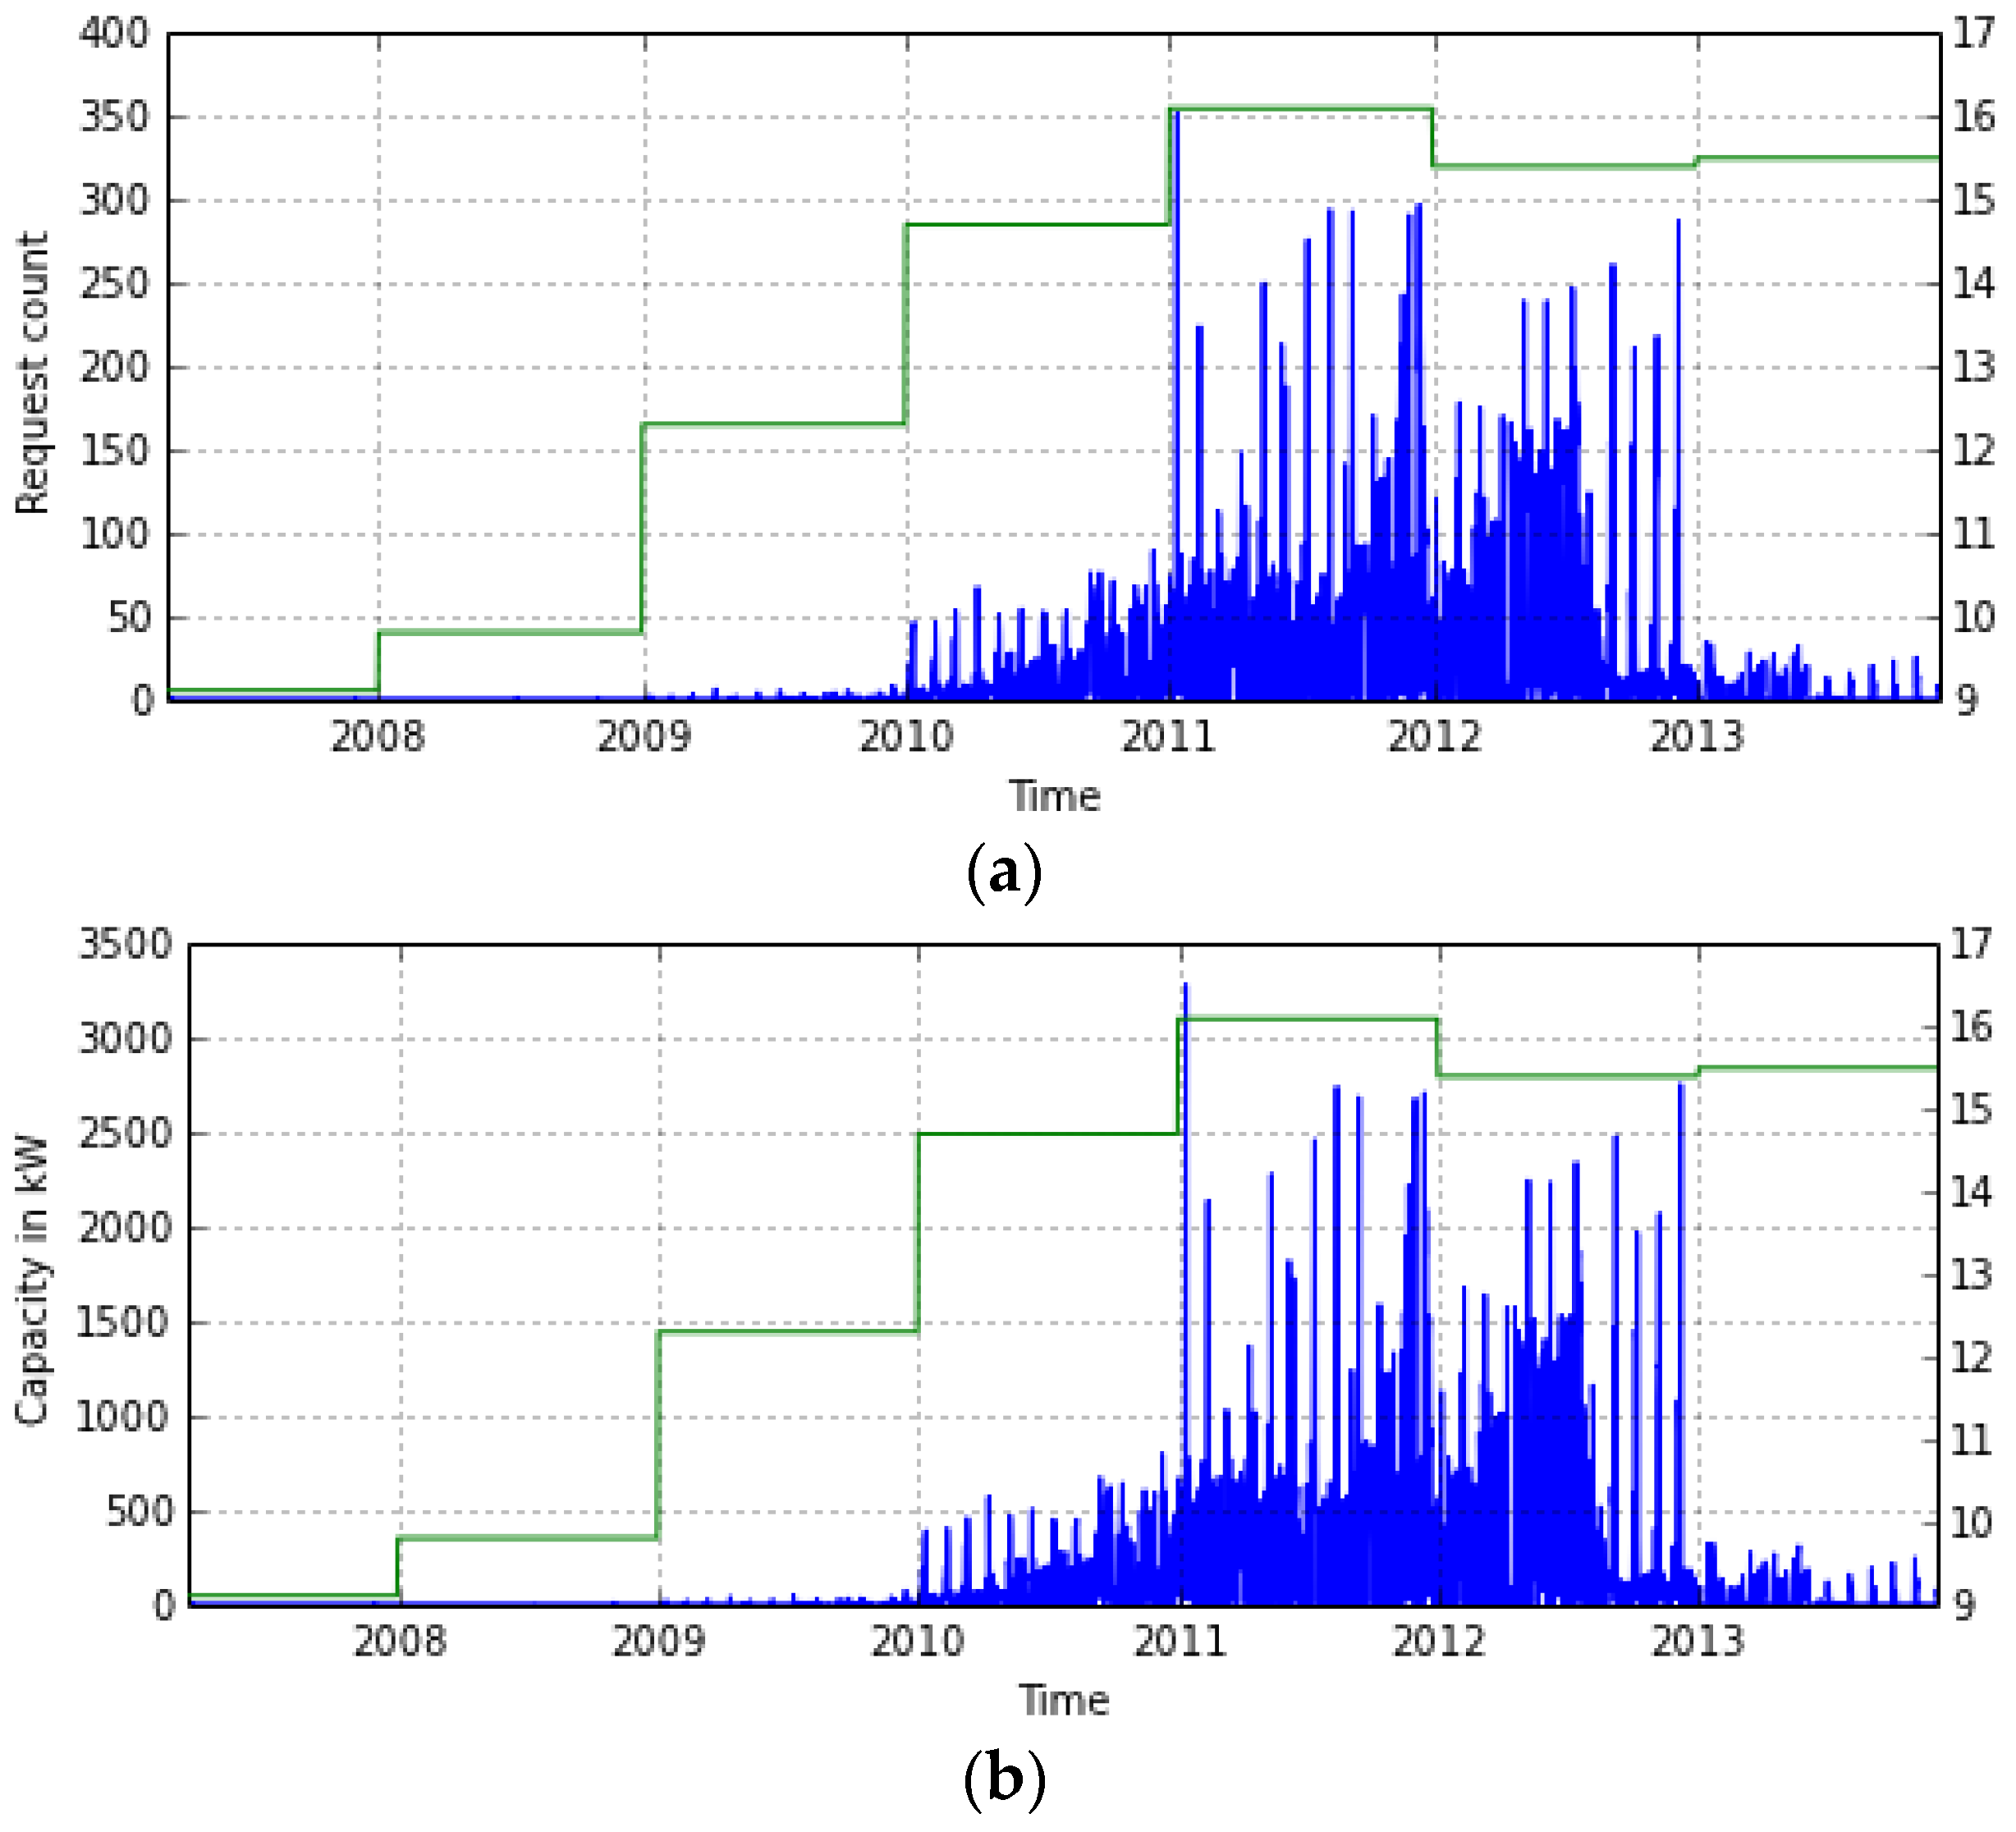
The evolution of demand, measured both in terms of the number of projects requesting a production license and in terms of the corresponding cumulative capacity, and the PI (as a piecewise linear curve) for interconnected wind RES-E investments from 2001 to 2012 are depicted in the next figure.
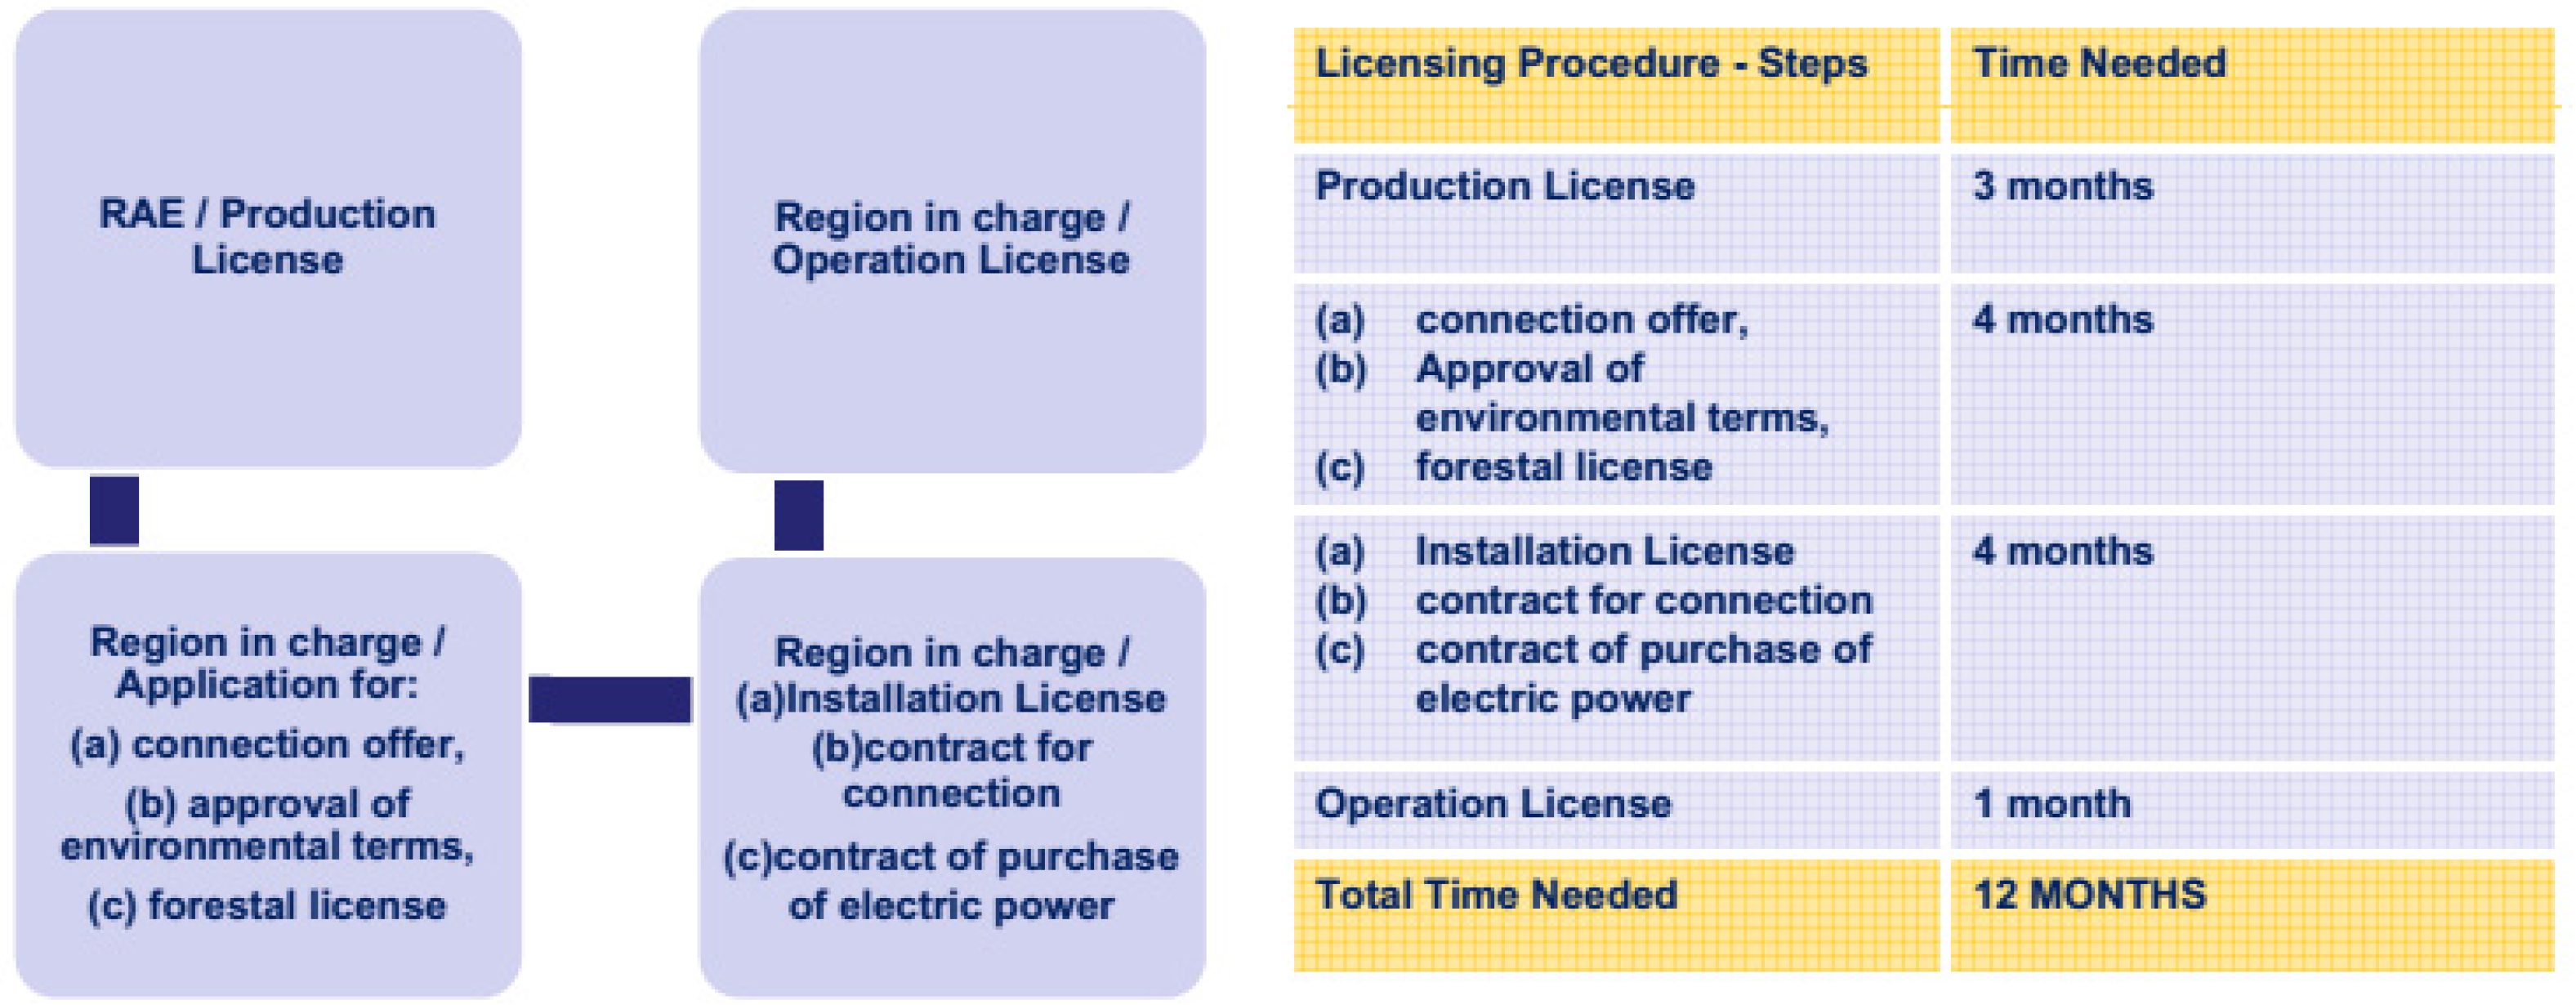
It is evident that the PI becomes relevant only after the enactment of Law 3468/2006 (June 2006), which set new administrative procedures for the promotion of RES-E and simplified the licensing procedures, and Law 3522/2006 (December 2006), which allowed investors to receive an upfront payment of up to 50% of the granted subsidy.
At the same time, the years 2011 and 2012 are an interesting case, since although the PI was higher than ever, the demand for new investments was very low. Furthermore, production licenses for wind RES-E projects of a total capacity of 260 MW were unilaterally cancelled by the investors who owned them; the French utility, electricite de France (EDF) alone owned and cancelled production licenses for 100MW of wind RES-E. The main reason for this loss of interest has been the low rate of the actual capacity additions. Although many of the projects that have acquired a production license would not materialize for various reasons (licensing, financial, etc.), the allocated grid connectivity offers had covered in many areas the limit for the safe operation of the grid.
The data suggest that increased financial incentives were utilized to counterbalance institutional deficiencies in permitting and interconnecting wind RES-E projects. An RES-E support policy measure is efficient if it induces a strong demand for investments in RES-E deployment with the minimum level of public expenditures. However, the rate of actual capacity additions has a reinforcement effect on the willingness to invest. No matter how attractive the PI is, if the success rate of the RES-E projects that acquire a production license is significantly low and/or the lead time to obtain all necessary permits is significantly high, either the willingness to invest diminishes or the size of the pool of the potential investors reduces to only the most capable to handle the authorization procedures.
A higher than necessary PI negatively affects the efficiency of the support measures in proportion to the number of projects that manage to receive the fiscal support. Consequently, an alternative way to explore the data is to examine the actual weighted monthly average price of wind RES-E generation. In order to quantify the FIT cost per RES-E unit installed, we must know both the time evolution of the RES-E capacity additions, as well as the time when each RES-E installation in operation attained its connection offer.
Due to data unavailability regarding the dates when RES-E projects in operation actually attained their connection offers, i.e., the dates when the FIT size was fixed, the analysis in this paper was based on the realistic assumption that after the enactment of Law 3851/2010, the average time elapsed between the attainment of the connection offer and the attainment of the operation license for a wind RES-E project was 9 months, whereas before Law 3851/2010, it was 18 months, since large-scale RES-E plants required permissions from 32 public-sector entities on a central, regional, prefectural and local level, leading to a licensing procedure that could exceed in practice 24 months.
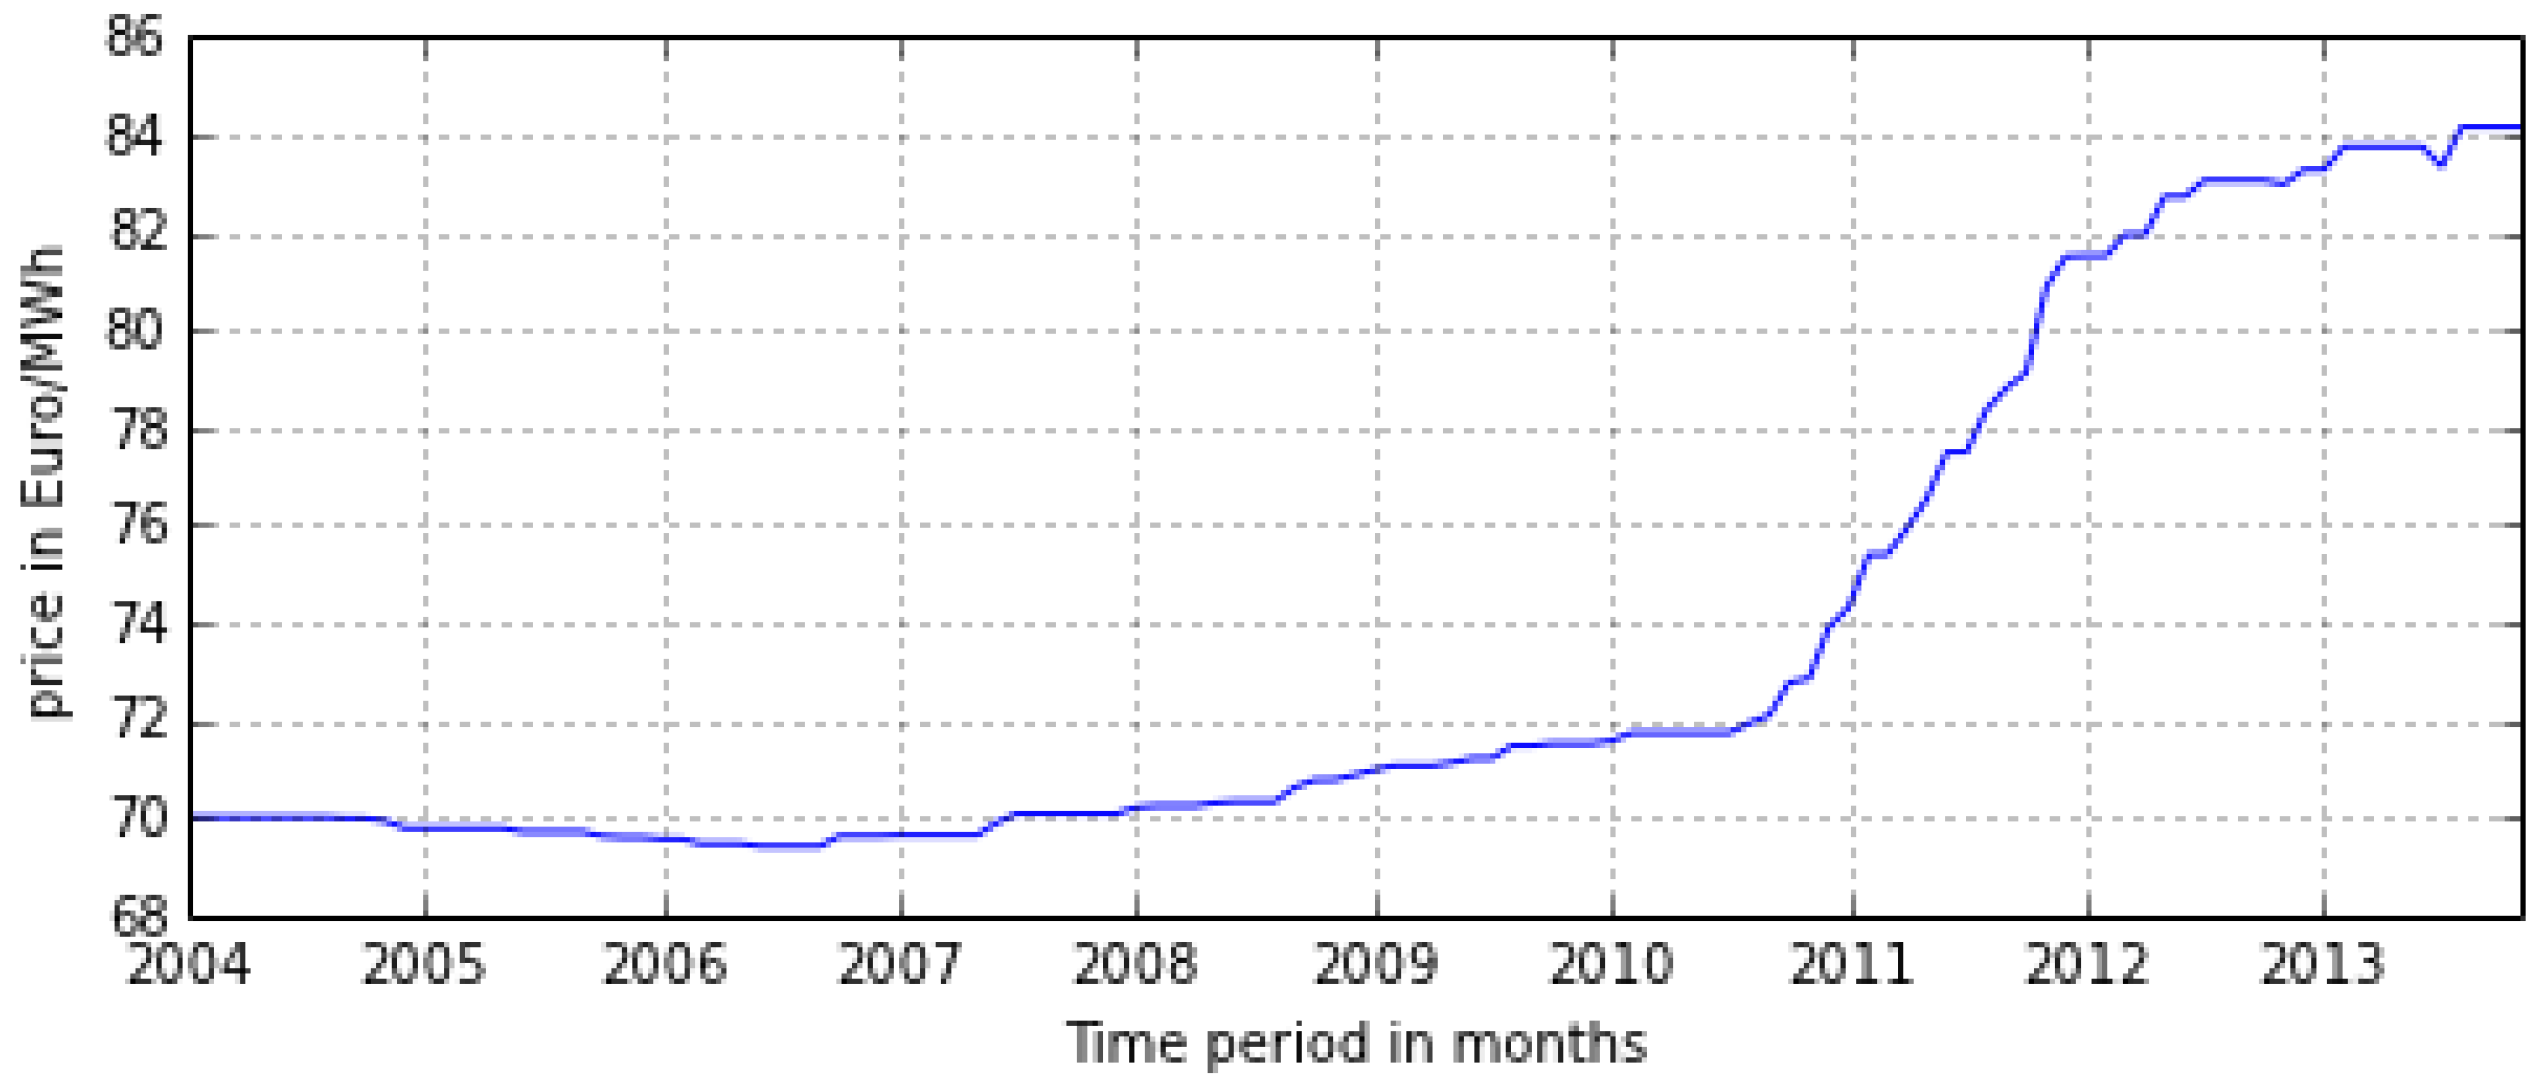
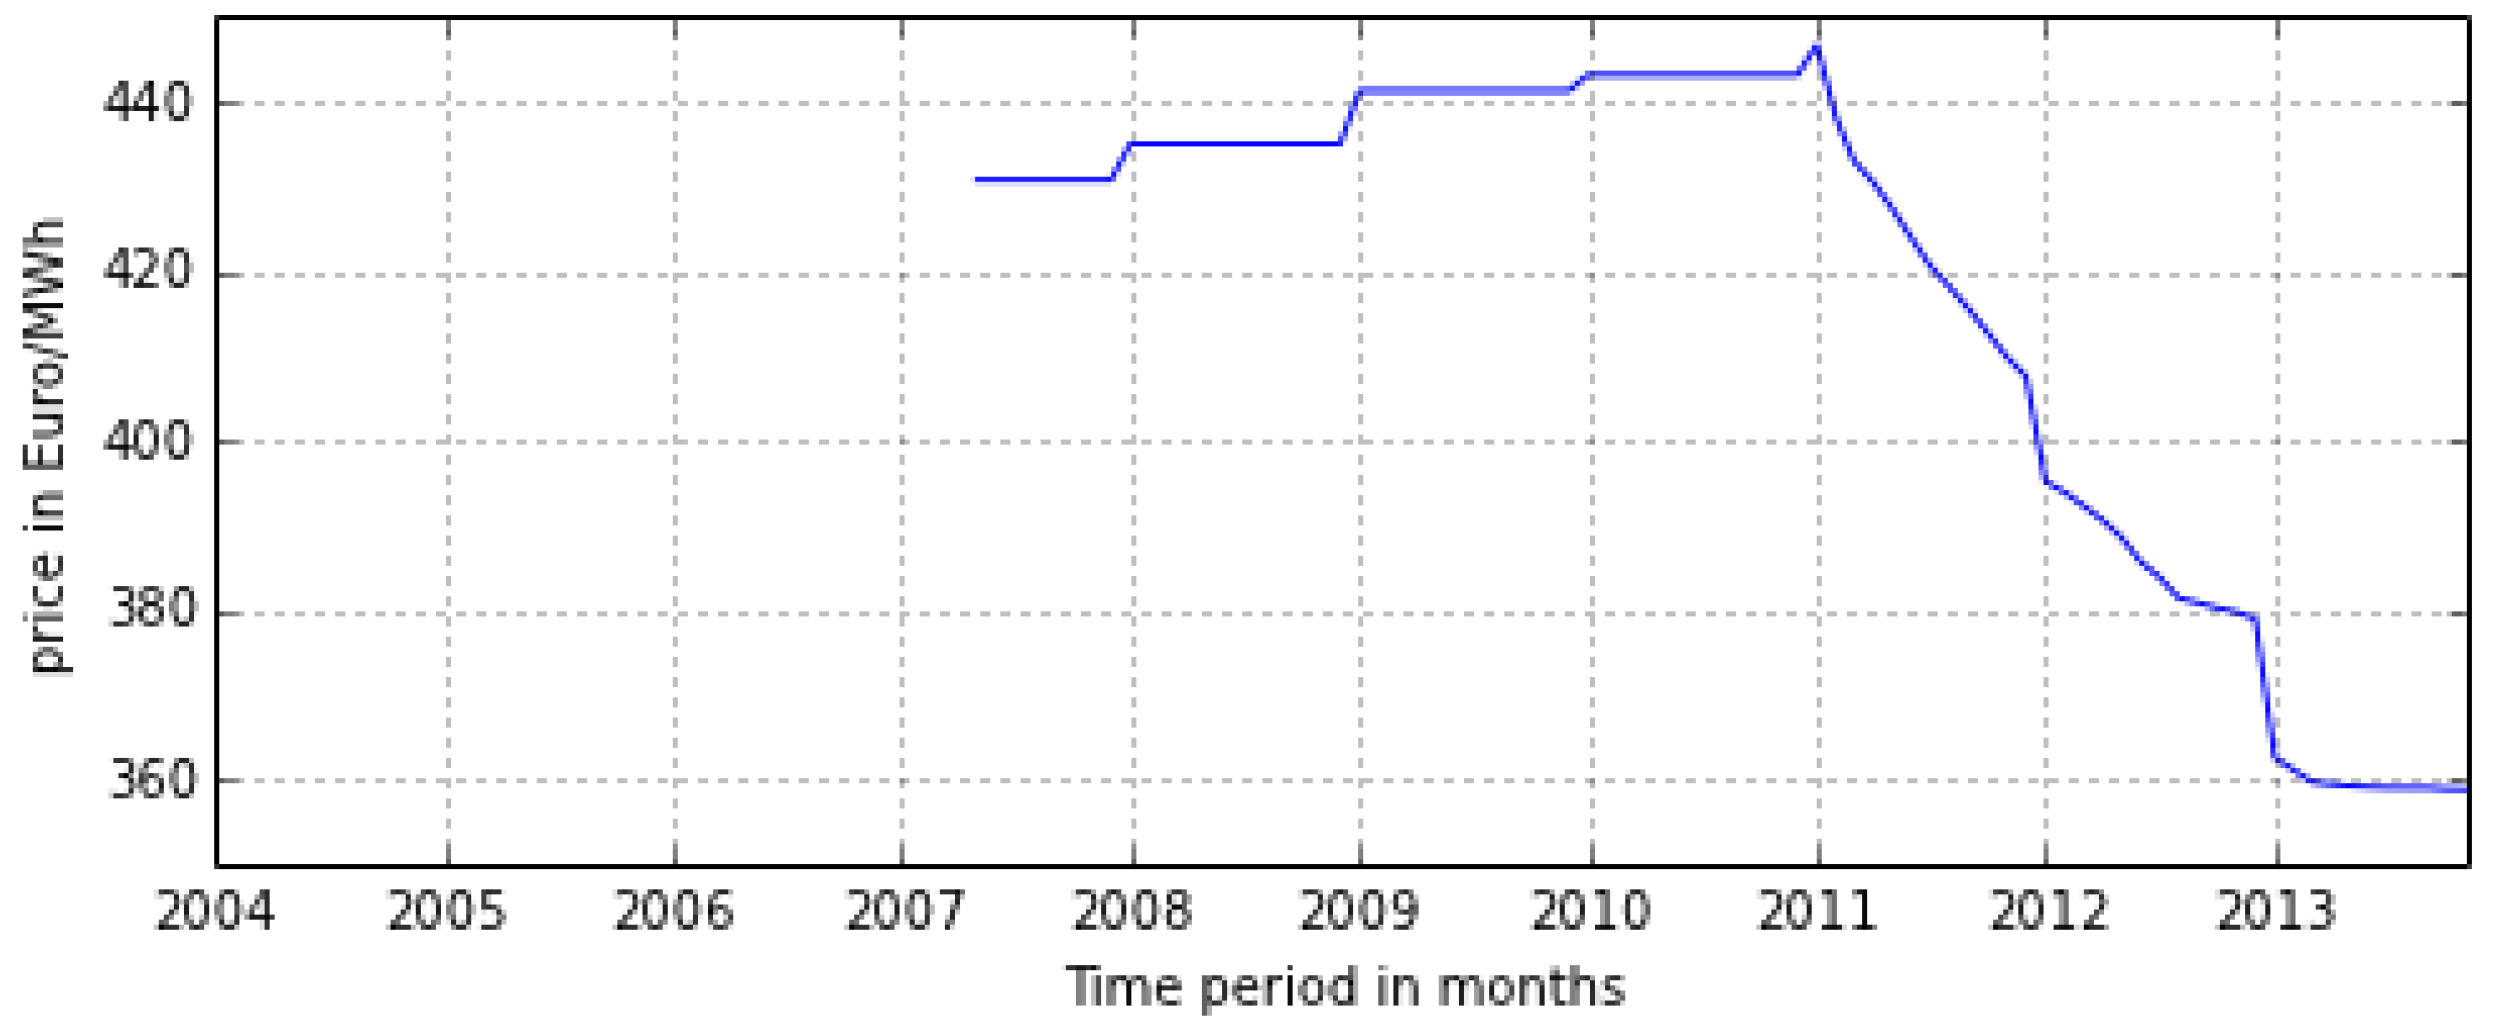
The estimated evolution of the generation-weighted (in €/MWh) monthly average wind power price for the same period is presented in Figure 2.
Figure 2. Evolution of demand and PI for interconnected wind RES-E investments. (a) Number of operation license requests for interconnected onshore wind RES-E during January 2001 to December 2012; and (b) capacity that corresponds to the operation license requests for interconnected onshore wind RES-E during January 2001 to December 2012.
Energies 09 00038 g002
An increasing cost for RES-E remuneration makes sense only if financial incentives start at a significantly low level and become progressively stronger so that less efficient sites are explored. However, the difference between the planned, according to the Greek NREAP, and the actual installed capacity suggests that this does not characterize the case of Greece. In particular, from 2010to 2013, the installed capacity increased from 1320 MW to 1784 MW, whereas the NREAP goal envisioned an increase from 1327 MW to 3112 MW.

3.2. Sensitivity of Investment Demand to Feed-in Tariff Prices for Photovoltaic Electricity Generation from Renewable Energy Sources Projects

The analysis begins by quantifying the corresponding PI, using the set of parameters and equations defined in Section 2.1. In this subsection, two benchmark projects will be employed: one for an interconnected (mainland) utility-scale project and one for a residential system installation. The first benchmark project concerns a 1MW installation. The initial investment expenditure corresponds to:
Until 2006: A40% public subsidy (grant) of the total eligible RES-E investment cost, equity capital equal to 40% of the total investment cost and 40% subsidy of the interest of the loan (20%) obtained for the purpose of financing the investment;
From 2006 to 2010: A40% public subsidy and an equity capital equal to 25% of the total investment cost;
From 2010 onwards: The equity capital covers 25% of the total investment cost. The rest is covered by a loan (75%), since PV plants were excluded from the national investment incentive law.
Fantidis et al. [23] have calculated the long-term monthly mean values of solar radiation and the monthly average daily clearness index over 46 areas in Greece. For the profitability calculations, the average annual capacity factor is taken to be 22%, and the annual efficiency decrease is 0.5%. Furthermore, the operating and maintenance cost is assumed to be equal to 1% of the total investment cost per annum, and the depreciation expense is assumed to be equal to 5% of the total investment cost per annum. We assume that the corporate tax rate remains at 25% for the duration of the PV’s operation. The cost of equity is 10%, and the price level (inflation) rises at the rate of 2% per annum. It is also assumed that the initial installation cost (€/Wp) is 1.5times the PV module price for the corresponding year. Finally, it is assumed that the investors secure a loan with a 10year duration and a 7% interest rate. The values of the PI for the years from 2005 to 2012 are presented in Table 9.
Table 9. The PI for a 1MW PV plant from 2005 to 2012.
PI for a 1 MW PV Plant from 2005 to 2012
Year20052006200720082009201020112012
PI3.915.314.815.818.619.621.721.2
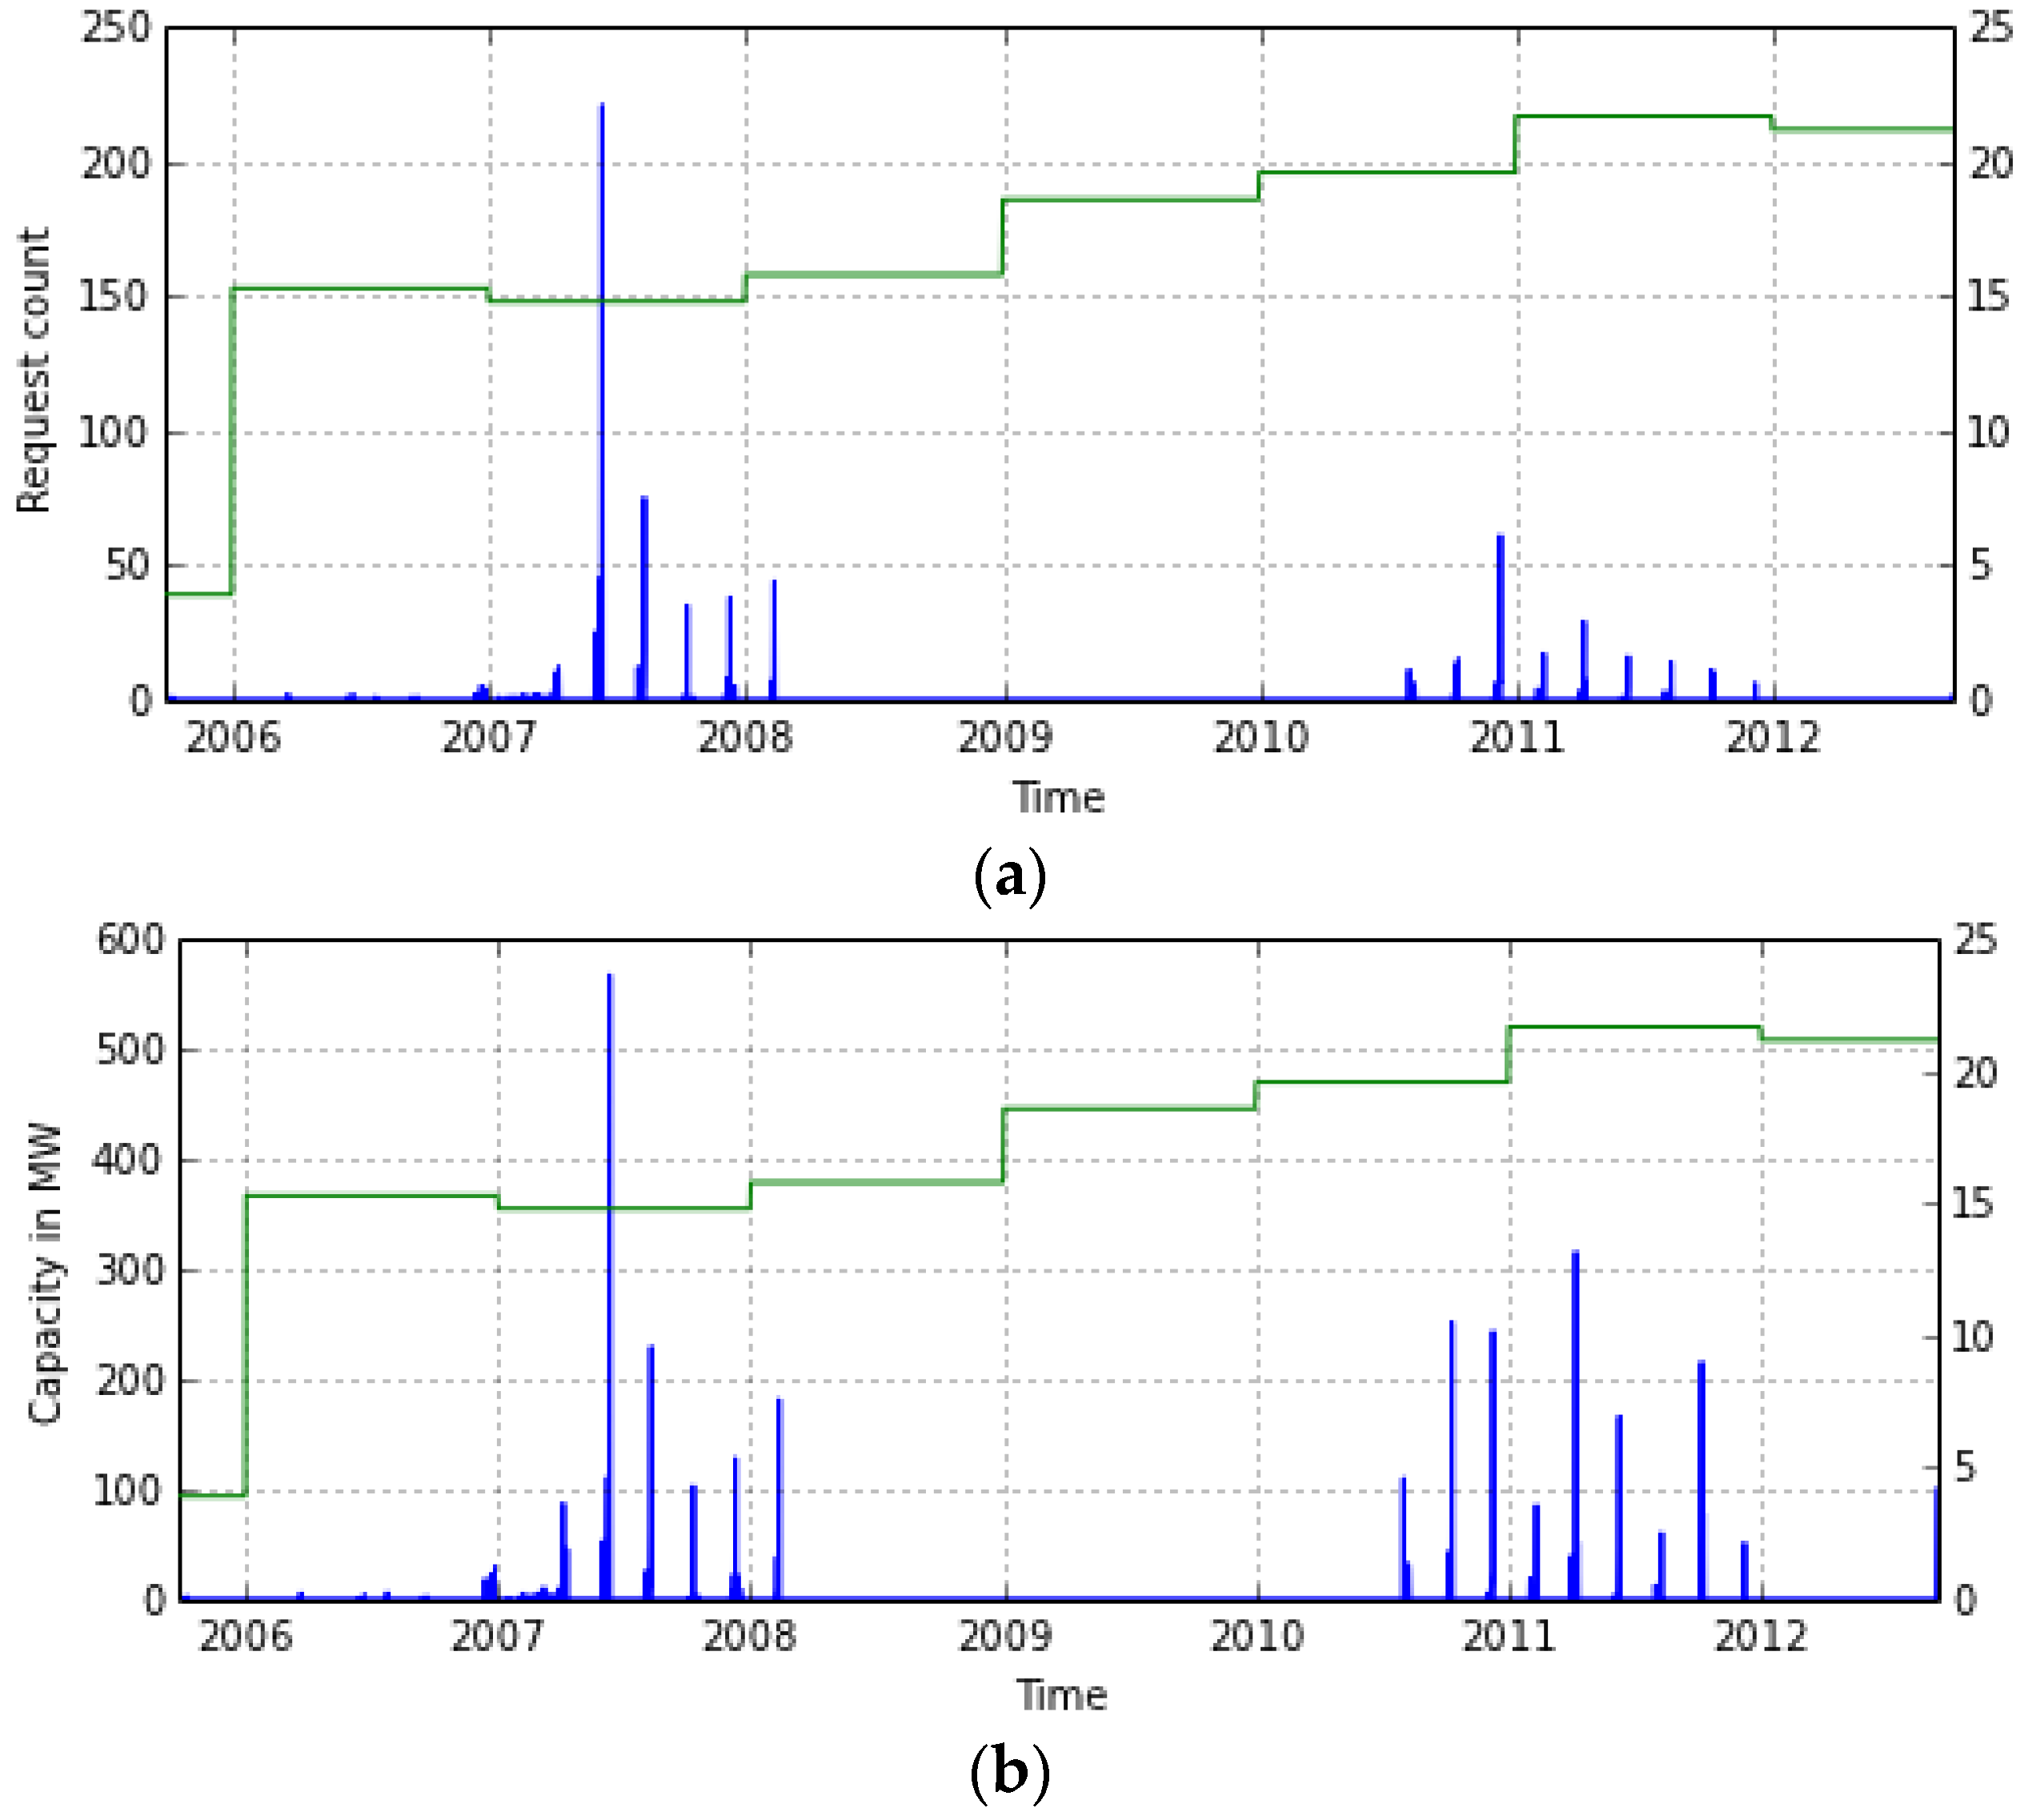
The evolution of demand, measured both in terms of capacity and in terms of the number of projects requesting a production license, and the PI for PV investments of capacity equal to or greater than 1MW from 2006 to 2012 investments is depicted in Figure 3 and Figure 4.
Figure 3. Generation-weighted average wind power price for the period from January 2004 to November 2013.
Energies 09 00038 g003
The FIT scheme that was established in Greece in 2006 provided strong price incentives for PV RES-E investments. However, in order to make the grid restrictions explicit, but also to control the overall cost for the consumers, the national RES implementation program set an upper limit on the PV capacity per administrative region. The surge of applications for operation licenses exceeded by far the limits set by the program, leading to a halt of any further submission of PV applications to the regulatory authority of energy (RAE) in 2008.
In light of these developments, the scheme voted on in January 2009 provided for the capacity limits to be scrapped. At the same time, Law 3734/2009 did not allow buying or selling production licenses or approvals prior to the grid connection of a PV station. This led to the deterioration of hundreds business plans of PV investors, who, eventually, lost their interest. In fact, the trading of licenses was one of the most determinant factors of the PV market development until then [24]. The demand for investments increases considerably only during 2010 and 2011 due to the Law 3851/2010, which provided for a highly improved permitting procedure. It also provided a signal of increased market share for new RES-E investments by stating that the contribution of the electrical energy produced by RES-E to the gross electrical energy consumption should reach a share of at least 40% by 2020. However, time-consuming grid connection procedures a result of the limited capacity of the grid, have been a major barrier for PV deployment in Greece.
Figure 4. Evolution of demand and the PI for PV investments of capacity equal to or greater than 1 MW. (a) Number of operation license requests for 1 MW and greater PV RES-E during September 2005 to September 2012; and (b) capacity that corresponds to the operation license requests for 1 MW and greater PV RES-E during September 2005 to September 2012.
Energies 09 00038 g004
The assumption behind the estimation of the annual FITs paid for PV RES-E production is that capacity additions that took place before 2011 had locked their remuneration in 2007 FITs, whereas for capacity additions that took place from 2011 onwards, the average time elapsed between the attainment of the connection offer and the attainment of the operation license was 24 months. According to LAGIE data [25], approximately 40% of the PV installations with a capacity greater than 10 kWp are also less than 100 kWp. It is assumed that this percentage remained steady throughout the horizon of the analysis. The estimated evolution of the generation-weighted (in €/MWh) monthly average PV power price is presented in Figure 5.
Figure 5. Generation-weighted average PV power price for the period from January 2004 to November 2013.
Energies 09 00038 g005
Figure 5 represents a case of overshooting, where very attractive support was provided for the diffusion of PV, leading to the actual installed capacity being far higher than that planned; from 2010 to 2013, the installed capacity increased from 184 MW to 2055 MW, whereas the NREAP goal envisioned an increase from 153 MW to 836 MW. A side effect of the target overshooting was locking the electricity system with older PV technological options that were (cost-wise) inferior; a significant number of PV installations attained their connection offer until 2010, but they were actually built during 2012 and 2013.
The benchmark project for the calculation of the residential systems’ PI is based on a system with capacity equal to 9 kWp. The initial investment expenditure corresponds to the equity capital, covering 50% of the total investment cost. The rest is covered by a loan with a 10 year duration and a 7% interest rate. The cost of equity is assumed to be 15%. The operating and maintenance cost is assumed to be equal to 2% of the total investment cost per annum. According to data from LAGIE, the average annual capacity factor for rooftop PV installations is 15%. The annual efficiency decrease has been assumed to be 0.5%. Until 2010, 20% of the total PV cost (capped at 700€) is deducted from the investors’ annual taxable income. From 2010 onwards, the FIT for small rooftop PV systems of up to 10 kWp is guaranteed for 25 years, and the revenues from selling electricity are tax free. The values of the PI for the years from 2007 to 2013 are presented in Table 10.
Table 10. The PI for rooftop PV systems of up to 10 kWp from 2006 to 2013.
PI for Rooftop PV Systems of up to 10 kWp from 2006 to 2013
Year2007200820092010201120122013
PI9.19.812.314.716.115.415.5
Since residential installations do not require the attainment of production licenses, the requests for grid connection were used as a proxy for demand. The demand for investments, measured both in terms of capacity and in terms of the number of projects requesting grid connection, is depicted in Figure 6.
Figure 6. Evolution of demand and PI for rooftop PV investments from 2007 to 2013. (a) Number of grid connection requests for rooftop PV systems during March 2007 to December 2013; and (b) capacity that corresponds to grid connection requests for rooftop PV systems during March 2007 to December 2013.
Energies 09 00038 g006
Regarding residential systems’ installations, PV investors, even if they were private owners, were fiscally considered as enterprises and had therefore to submit value added tax declarations periodically, while at the same time, the revenues from solar electricity were taxed as regular income, i.e., in the order of 25%–40%. This led practically to zero residential system installations until 2010.
An interesting observation is that although the expected profitability of the rooftop PV installations remained constant during 2012 and 2013, the rate of deployment in 2013 was significantly lower. Following the line of thought that searches in unobservable factors for explanations for such discontinuities, one should consider that 2013 was a year when a discussion began about the need to tax the revenues from rooftop PV installations (this discussion was fueled by a series of press articles that highlighted that the PV deployment rate was very high in particularly high-income areas of Greece), and rooftop PV owners were asked to pay a retrospective levy on their revenues; it is likely that these events increased the perceived risk of investing in rooftop PV.

4. Conclusions

The main lesson derived from the analysis is that the PI for a given RES-E technology and the demand for investments in this technology should be monitored for the ongoing evaluation of the corresponding support measures. Fiscal support measures dictate the PI profile of an RES-E technology (i.e., the evolution of its PI). At the same time, the profitability profile implies a set of expectations regarding the policy measure’s impact: an ascending PI is efficient if actual demand corresponds first to the most efficient plants (locations with the best wind or solar potential, closer to the grid, etc.), while a descending index is efficient if cumulative capacity additions, used as proxy for information spread, actually have a significant impact on demand for new RES-E investments, accounting for the PI levels. A divergence between the expected and the actual characteristics of the demand for investments may indicate sources of inefficiency (i.e., spending more money than is necessary to achieve the desired result).
A useful metaphor is in regard to fiscal support as a force that overcomes issues that create resistance for the diffusion of a given technology option: some aspects of this resistance should be addressed by affecting the technology’s profitability levels, whereas others should not. A naive approach to FIT design is that low profitability is the reason for low levels of technology investments, and equivalently, increasing profitability will increase deployment. Such an approach is potentially false and, in the case of Greece, very inefficient, since it ignores the impact of soft costs created by ineffective governance. A counterargument for the case of wind investments in Greece could be that policy makers accepted that the governance limitations will lead to only very efficient investors being able to enter the market, and as a result, they designed for an ascending PI. However, such an approach is efficient only if governance issues are resolved, rather than escalated, through time.
A descending PI reflects a policy that offers more aggressive tariffs early on to encourage rapid market growth. However, a caveat exists: high initial tariffs may lead to locking the electricity system with older technological options that are cost-wise inferior. This means that specific targets for the cumulative installed capacity must be set a priori and utilized as an upper limit that triggers the evaluation of the FIT levels.
As further research, we would suggest to apply the presented approach to a number of European case studies comparing results regarding the RES-E deployment rates around Europe, following the same rationale with similar studies published on this front as Sarasa-Maestro et al. [26].

Acknowledgments

This research was funded by the E.C. 7th Framework Programe for Research and Development (EC FP7) Project titled “Assessment of Policy Interrelationships and Impacts on Sustainability in Europe” (APRAISE) with Grant Agreement No. 283121. The authors would like to acknowledge the support from the E.C. The content of the paper is the sole responsibility of its authors and does not necessary reflect the views of the E.C.

Author Contributions

Sotiris Papadelis and Alexandros Flamos conceived and developed the methodological framework. Sotiris Papadelis and Vasssilis Stavrakas developed the necessary code for the implementation of the application, Sotiris Papadelis, Vasssilis Stavrakas and Alexandros Flamos analyzed the results of the application. Sotiris Papadelis, Vasssilis Stavrakas and Alexandros Flamos wrote the paper.

Conflicts of Interest

The authors declare no conflict of interest.

References

  1. Grafakos, S.; Flamos, A. Assessing low carbon energy technologies against sustainability and resilience criteria: Results of a European experts survey. Int. J. Sustain. Energy 2015. [Google Scholar] [CrossRef]
  2. Oikonomou, V.; Flamos, A.; Grafakos, S. Combination of energy policy instruments: Creation of added value or overlapping? Energy Sources Part B Econ. Plan. Policy 2014, 9, 46–56. [Google Scholar] [CrossRef]
  3. Oikonomou, V.; Flamos, A.; Gargiulo, M.; Giannakidis, G.; Kanudia, A.; Spijker, E.; Grafakos, S. Linking least-cost energy system costs models with MCA: An assessment of the EU Renewable Energy targets and supporting policies. Energy Policy 2011, 39, 2786–2799. [Google Scholar] [CrossRef]
  4. Ragwitz, M.; Winkler, J.; Klessmann, C.; Gephart, M.; Resch, G. Recent Developments of Feed-in Systems in the EU—A Research Paper for the International Feed-in Cooperation; A report commissioned by the Ministry for the Environment, Nature Conservation and Nuclear Safety(BMU): Bonn, Germany, 2012.
  5. Mitchell, C.; Sawin, J.L.; Pokharel, G.R.; Kammen, D.; Wang, Z.; Fifi, S.; Jaccard, M.; Langniss, O.; Lucas, H.; Nadai, A.; et al. Policy, Financing and Implementation. In IPCC Special Report on Renewable Energy Sources and Climate Change Mitigation; Cambridge University Press: Cambridge, UK; New York, NY, USA, 2011. [Google Scholar]
  6. Spyridaki, N.; Flamos, A. A paper trail of evaluation approaches to energy and climate policy interactions. Renew. Sustain. Energy Rev. 2014, 40, 1090–1107. [Google Scholar] [CrossRef]
  7. Ragwitz, M.; Resch, G.; Faber, T.; Huber, C. Monitoring and Evaluation of Policy Instruments to Support Renewable Electricity in EU Member States; Final Report; A Research Project Funded by the German Federal Environment Agency (UBA) and the Ministry for the Environment, Nature Conservation and Nuclear Safety (BMU): Bonn, Germany, 2005.
  8. Sgroi, F.; Tudisca, S.; Di Trapani, A.M.; Testa, R.; Squatrito, R. Efficacy and Efficiency of Italian Energy Policy: The Case of PV Systems in Greenhouse Farms. Energies 2014, 7, 3985–4001. [Google Scholar] [CrossRef]
  9. Zhang, F. How Fit Are Feed-In Tariff Policies? Evidence from the European Wind Market; Policy Research Working Paper No. WPS 6376; World Bank: Washington, DC, USA, 2013. [Google Scholar]
  10. Deploying Renewables 2011: Best and Future Policy Practice; Organization for Economic Co-operation and Development (OECD)/International Energy Agency (IEA): Paris, France, 2011.
  11. Steinhilber, S.; Ragwitz, M.; Rathmann, M.; Klessmann, C.; Noothout, P. RE-Shaping: Shaping an Effective and Efficient European Renewable Energy Market. In D17 Report: Indicators Assessing the Performance of Renewable Energy Support Policies in 27 Member States; EIE/08/517/SI2.529243; Fraunhofer ISI: Karlsruhe, Germany, 2011. [Google Scholar]
  12. Spyridaki, N.A.; Banaka, S.; Flamos, A. Evaluating public policy instruments in the Greek building sector. Energy Policy 2016, 88, 528–543. [Google Scholar] [CrossRef]
  13. Evaluating Policies in Support of the Deployment of Renewable Power; International Renewable Energy Agency (IRENA) Policy Brief: Masdar City, UAE, 2012.
  14. Fell, H.J. Feed-in tariffs for renewable energies: An effective stimulus package without new public borrowing. In Significance of Renewable Energies in the Current Economic Crisis; Alliance 90/the Greens, Parliamentary Group: Berlin, Germany, 2009. [Google Scholar]
  15. Alizamir, S.; De Vericourt, F.; Sun, P. Efficient Feed-In-Tariff Policies for Renewable Energy Technologies; Working Document; Duke University: Durham, NC, USA, 2012. [Google Scholar]
  16. Mendonca, M.; Jacobs, D.; Sovacool, B.K. Powering the Green Economy, the Feed-In Tariff Handbook; Earthscan: London, UK, 2009. [Google Scholar]
  17. Masini, A.; Menichetti, E. The impact of behavioural factors in the renewable energy investment decision making process: Conceptual framework and empirical findings. Energy Policy 2012, 40, 28–38. [Google Scholar] [CrossRef]
  18. Fisher, J.; Martin, R.S. Investment Analysis for Appraisers; Kaplan Publishing: Wokingham, UK, 1994. [Google Scholar]
  19. Invest in Greece Agency. Available online: http://www.enterprisegreece.gov.gr/ (accessed on 6 January 2015).
  20. Renewable Energy Technologies: Cost Analysis Series—Wind; International Renewable Energy Agency (IRENA): Masdar City, Abu Dhabi, UAE, 2012.
  21. International Energy Agency Photovoltaic Power Systems Programme. Available online: http://www.iea-pvps.org/index.php?id=93 (accessed on 17 November 2015).
  22. Operator of Electricity Market. Available online: http://www.lagie.gr/nc/en/home/ (accessed on 17 November 2015).
  23. Fantidis, J.G.; Bandekas, D.V.; Potolias, C.; Vordos, N. Cost of PV electricity—Case study of Greece. Sol. Energy 2013, 91, 120–130. [Google Scholar] [CrossRef]
  24. Karteris, M.; Papadopoulos, A.M. Legislative framework for photovoltaics in Greece: A review of the sector’s development. Energy Policy 2013, 55, 296–304. [Google Scholar] [CrossRef]
  25. Operator of Electricity Market—RES & CHP Monthly Statistics. Available online: http://www.lagie.gr/en/feed-in-tariffs/res-chp/res-chp-monthly-statistics/ (accessed on 17 November 2015).
  26. Sarasa-Maestro, C.J.; Dufo-López, R.; José, L.; Bernal, A. Photovoltaic remuneration policies in the European Union. Energy Policy 2013, 55, 317–328. [Google Scholar] [CrossRef]

