1. Introduction
Over the past few years there has been a significant effort worldwide to increase the utilization of renewable energy sources for electricity and heat production. The European Union Renewables Directive, for example, set a target of 20% of the energy consumption of the European Union to be from renewable sources by 2020 [
1] and current decarburization scenarios point at 30% by 2030 and at least 55% by 2050 [
2]. In this context, the firing of biomass and the co-firing of biomass with coal in power plants originally designed for coal play a significant role. This approach to the generation of renewable energy has been demonstrated in more than 200 power plants over the recent years taking advantage of the infrastructure already in place within the electricity supply industry, and the associated low capital investment requirements [
3].
Besides the expected reduction in both NO
x and SO
x levels, there are still some difficulties in using raw biomass for co-firing with coal [
4]. Amongst the biggest challenges are the diverse chemical and physical properties of biomass that need to be addressed. The ash content as well as volatiles and oxygen content can be higher in biomass than in coal resulting in lower gross calorific value of the fuel [
5]. Additionally, problems may occur if feeding and milling is not adapted. The particle size distribution of ground biomass is different from coal and particles may be considerably larger leading to lower burn-out efficiencies [
6]. Overall, co-firing with regular biomass may lead to instability of the combustion process making biomass with coal-like properties the most desirable co-firing fuel.
One intensively researched approach for upgrading regular biomass for co-firing with coal is the thermo-chemical pre-treatment best known as torrefaction. At temperatures in the range of 250–300 °C, and in the absence of air, the biomass undergoes a mild form of pyrolysis and is converted into a solid fuel with chemical and mechanical properties similar to coal [
7]. This process has been studied on a large variety of feedstock applying different torrefaction settings (e.g., temperature, and time) mainly on lab-scale [
8] and most recently also in pilot scale plants [
9]. Several technological innovations were made over the past years to bring the process to commercial scale [
10] and techno-economic assessments assuming European and Northern American conditions were conducted [
11,
12]. In both cases, the now more homogenous, brittle and hydrophobic material is compacted to pellets and can be transported, stored for prolonged periods and delivered as a boiler fuel.
Some experts came to the conclusion that the percentage of biomass for co-firing in power plants can be as high as 40% when the torrefied biomass is used [
13] while others showed that, according to CFD simulations, coal boilers can handle operation with up to 100% of torrefied biomass without an obvious decrease of energy efficiency and fluctuation of the boiler load [
14]. The direct application of torrefied biomass pellets in small-scale pellet boilers may not be advisable at this point unless boiler technology is adapted [
15].
For the utilization of torrefied biomass in pulverized coal fired plants it is necessary to assess its fuel properties (chemical and mechanical) beforehand. For most of the parameters standardized analysis methods are available. However, the difference in characteristics between torrefied biomass and coal requires some adaptation of existing methods or even new methods to fully describe their fuels properties, which would then allow comparison with those of coals. A power plant operator will need to, e.g., adjust the mills for achieving the right particle size distribution for optimal plant operation. It is assumed that particle size distribution of the milled material may effect combustion efficiency, the amount of unburned carbon in the ash and the stability of combustion [
16]. The Hardgrove Index (HGI), developed in the 1930 by Hardgrove [
17], was designed to compare grindability of brittle materials such as black coal. It is commonly used as a simple empirical laboratory procedure for the characterization of their milling behaviour in large coal mills to produce a pulverized fuel with the appropriate fineness. The HGI method described in ISO 5074 [
18], however, is not suitable for the characterization of more fibrous material like torrefied biomass and does not consider the actual milling of pellets.
Several studies have determined the grindability of torrefied biomass by applying one of the following methods: the modified Hardgrove Index [
16], the Grindability Criterion (GC) [
19], the Hybrid Work Index (HWI) [
20] and the Impact Grindability Index (PMI) [
21]. The HGI was developed for the testing of black coals, which are commonly milled in ball and roller mills. The PMI was developed for low rank coals, which are commonly processed in beater or fan mills. The modified HGI, the HWI and the GC were specifically designed to characterize the grindability of torrefied biomass. A number of boiler makers and mill suppliers also have scaled down coal mills that are employed for test purposes.
All of the current laboratory grindability tests require the preparation of a pre-crushed feed material of a specific particle size. In all cases, the test results provide an assessment of the relative grinding behaviour of the test materials. It may, however, be difficult to extrapolate the data from a laboratory test to provide quantitative information on the behaviour of torrefied biomass pellets in an industrial scale mill.
The aim of the work presented here, which was part of the SECTOR-project (funded under the EU FP7 programme) [
9], is to test a grindability method (GM) for torrefied biomass pellets, which is simple, fast and reliable and based on the grinding of pellets rather than pre-crushed material. The method will result in a single parameter: the specific grinding energy (SGE), i.e., the energy consumed when a defined pellet mass (2.5 kg), at a defined mass flow is ground to a particle top size of 1 mm. This parameter, or the basic principles behind it, may eventually become useful to pellet producers and plant operators if grindability is introduced to a standardized product specification of thermally treated biomass, which is currently being drafted in the relevant ISO TC238 working group (as ISO/PRF TS 17225-8 [
22]).
The results of the GM, when done with different mill types (hammer, cutting and impact mill), will be compared and their relation to other pellet stability measures such as the modified HGI, mechanical durability and a hardness test will be discussed. Finally, advantages and disadvantages of the different mill types as proper equipment for a standardized method are discussed.
3. Results and Discussion
3.1. General Fuel Charactersitic of the Torrefied Biomass Pellets
The seven different biomass materials all underwent slightly different torrefaction conditions with a TF
temp range between 260 °C and 308 °C while the residence time of the biomass in the reactor varied between 9 and 30 min (see
Table 2). In order to compare the relative change of the material caused by torrefaction, the change in volatile content was chosen as TF
dgr, which, in this case, ranged between 6 and 9% DM. Regarding the HHV, which is increased during torrefaction, values found by other torrefaction studies were in some cases similar to what was obtained in this study and in other cases not. Gucho et al. [
26] for example found torrefied beech wood both at 260 °C and at 280 °C for 30 min and the mean HHV between the two is the same as the value obtained here for 30 min at 270 °C. Phanphanich and Mani [
27] on the other hand torrefied pine chips at 300 °C for 30 min and obtained a HHV of 25.4 MJ/kg, much higher than the 21.9 MJ/kg observed here. However, both studies torrefied on lab scale in batch reactors and it is known from studies on biomass pyrolysis that particles size and sample size, let alone the reactor type, will have an impact on the product [
28]. Reports on increasing HHV with increasing intensity of torrefaction when using pilot scale plants are available and support the findings here [
29,
30].
Specific requirements for chemical and physical-mechanical characteristic of the pellets made from thermally treated are currently finalized in a technical specification (TS) on international level as ISO/PRF TS 17225-8 [
22]. Once finalized, ISO/PRF TS 17225-8 will have an outline much like the ISO 17225-2 [
31] for pellets made from wood or ISO 17225-6 [
32] for pellets made from non-woody biomass. However, as the market of thermally treated biomass is still developing a TS will serve as a placeholder until a full standard can be agreed upon. The main categorization in this TS is between woody biomass of energy content (HHV) below or above 21 MJ/kg DM. Again, there is a differentiation in woody and non-woody biomass and three respective quality classes, however, for non-woody biomass, the 21 MJ/kg DM threshold does not exist. In order to produce a fuel that is above or below 21 MJ/kg DM, the torrefaction plant operators will have to decide how they run their reactor accordingly. In case of this study, which took place before the conception of this TS, almost all woody fuels are above 21 MJ/kg DM (except for the beech pellets) which is why the requirements for bulk density, durability, moisture and ash will be discussed based on the thresholds that apply to that category. None of the here investigated woody biomass pellets could meet the criteria for the highest quality class. Even the second highest class, which requires bulk density to be >650 kg/m
3, durability to be >96%, moisture to be <8% water content, and ash to be <3%, could only be met by spruce pellets (see
Table 2). However, bulk density, durability, and moisture of the pellets are all parameters that are a result of pelletizing process while the HHV is a result of the torrefaction process. Creating standardized high quality fuel pellet will only be a problem when ash content of the input material is already high as it will only be increased during torrefaction. The straw pellets produced here were able to meet many of the requirements for the highest quality class of pellets made from thermally treated non-woody biomass such as bulk density (>600 kg/m
3), durability (>97.5%, see optimization of durability in [
9]) and ash content (<5%). However, the S content was posing a problem as it was above the threshold of 0.05% for the highest quality class. In addition, the moisture was slightly above the threshold of 10%, which is no major challenge and can be adjusted either during pelletizing or through subsequent drying. The S content, however, is much like the ash content a parameter that needs to be controlled in the raw material as the torrefaction will not help reduce it. In general, a non-woody biomass pellet to fall into the thermally treated biomass standard not only needs to be thermally treated but should also have a minimum HHV of 18 MJ/kg DM for the highest quality class.
3.2. Hardness and Modefied Hardgrove Index of the Torrefied Biomass Pellets
Beyond the standard characteristics, which are prescribed in the respective ISO standards, the quality of the pellets may also be described by other relevant properties e.g., resistance to fracture or grindability. In this study, hardness was chosen as a parameter that may bridge the gap between the information obtained from the mechanical durability test (ISO 17831-1) to the actual grindability using a laboratory mill. In addition, the hardness test may also help understand the unintended grinding which happens when pellets are being fed, e.g., using a screw feeder. This, however, was not focus of this study.
The average hardness of the different pellets types was very different with 96 N for forest residue pellets and 496 N for spruce pellets (
Table 3). This variation is partly reflected by the differences in torrefaction conditions with forest residue being exposed to the highest and spruce being exposed to the lowest TF
temp. This may be explained by the removal of hydrogen bonding sites, depolymerisation and the destruction of the fibrous structure (less interlocking bonds) with increased degree of torrefaction. The high standard deviation, which is observed when recording the pellet hardness across 20 pellets, as proposed here, may reflect the inhomogeneity of the torrefied material leading to different structural bonds in the pellets. In order to produce torrefied pellets with high durability and a respective hardness, application of steam and water prior to densification may be crucial to help plasticize the material and reduce the softening temperature of the remaining lignin [
9].
In literature only one study could be found reporting the hardness of torrefied biomass pellets measured via the Kahl Hardness Tester [
30], while Li et al. [
33] compared the Meyer hardness of torrefied wood pellets which in addition to the force also includes the indentation depth and the surface area the force is applied to. Li et al. [
33] found that the higher the severity of the torrefaction the lower the hardness of the pellets was. This is in line with the findings of this study.
Regarding a comparison with standardized Hardgrove coals by applying the modified HGI method, forest residue and straw had the highest value (HGI = 55) which reflects a low energy input, better grindability and potentially a higher throughput while spruce and beech had the lowest HGI values (HGI = 25 and 21 respectively) being not so favourable for grinding. Similar to the method used here with 50 cm
3 samples, Shang et al. [
34] investigated the HGI of torrefied wheat straw at different TF
temp with a residence time much higher (2 h) than any of the TF
time used here. The HGI of the pellets made from straw torrefied at 270 °C for 30 min analysed here (HGI = 55) is therefore slightly below the value observed by Shang et al. [
34] for straw torrefied at 250 °C for 2 h (HGI ≈ 60). Bridgeman et al. [
16] measured the modified HGI of torrefied willow and found values between 24 and 51 mainly depending on the difference in TF
time (10 vs. 60 min) while the TF
temp was in both cases at 290 °C. The pellets from torrefied willow analysed here had a HGI of 34 which is between the two HGIs measured by Bridgeman et al. [
16] probably due to a higher TF
temp (308 °C) at similar TF
time (9 min). Interestingly, the results obtained by Bridgeman et al. [
16] and Shang et al. [
34] compare well to the results obtained here even though the torrefaction in these two studies was done in lab-scale reactors as compared to the pilot-scale torrefaction which might affect homogeneity of the product.
No evident correlation could be observed between mHGI and the hardness. This is to be expected as the hardness test gives an information on the resistance of the pellet to fracture while the mHGI is measured on the pre-ground pellet (<1.18 mm) and therefore reflects the characteristics of those particles. The hardness test is more similar to the durability test which is supported by a correlation between the two parameters of R2 = 0.72. Durability and HGI values are also not correlated.
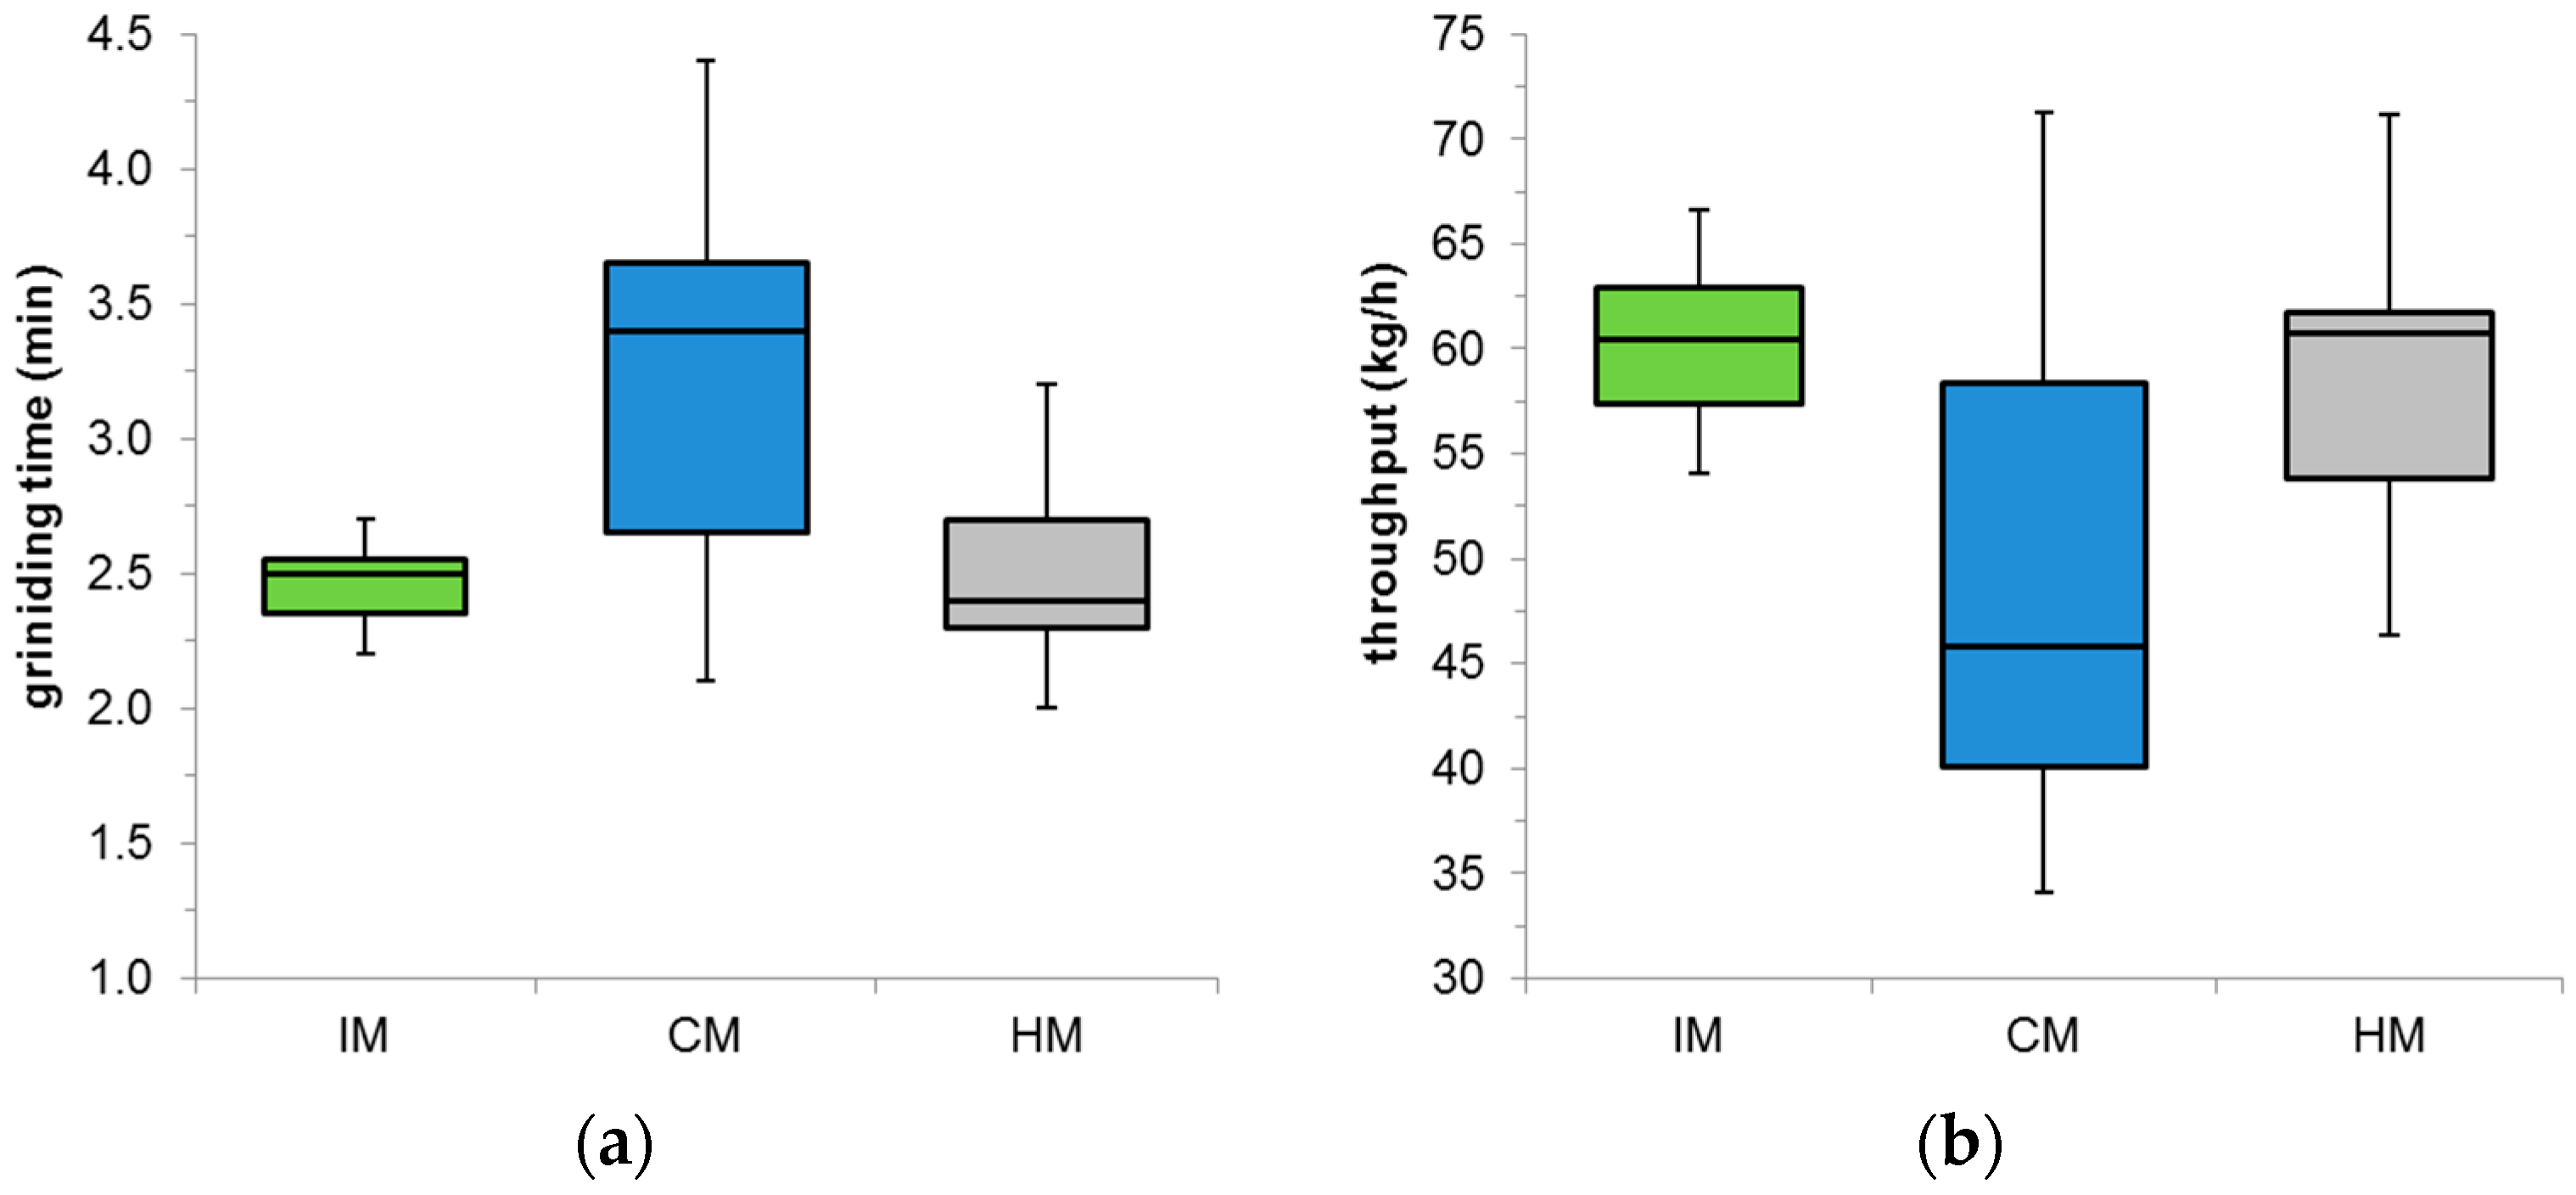
3.3. Performance of the Mills and Specific Grinding Energy
The range in time required to grind 2.5 kg of pellets using a 1 mm sieve varied between the different mills (
Figure 1a). The smallest variation was observed for pellets ground with the IM (2.3–2.7 min) while for the CM the range was between 2.1 and 4.4 min. The type of pellet requiring the longest (t
max) or shortest time (t
min) to be ground was never the same between the mills (IM: t
max = poplar, t
min = beech; CM: t
max = straw, t
min = willow; HM: t
max = forest residue, t
min = pine) highlighting that different grinding forces are at work. For IM and HM, the grinding time was independent of mHGI, hardness or durability of the pellets (all R
2 < 0.01). However, the grinding time in the CM was showing signs of dependency on hardness (R
2 = 0.50) and a strong correlation (R
2 = 0.79) with durability. The fact that IM takes the least time for crushing the pellets below 1 mm is largely due to its capacity. As by construction the impact mill is designed for the highest throughput and operating at higher rotor speed than the other two mills. Given the procedure chosen in this study (2.5 kg input material) the IM was not operating at full capacity.
Regarding the throughput of the mills (
Figure 1b), which by definition is dependent on the grinding time, smallest variation was observed for IM and HM while CM had a wide range (34.1–71.3 kg/h). Since low grinding time leads to a high throughput, the pattern of pellet specific throughput per mill is the reverse pattern of pellet specific grinding time mentioned above.
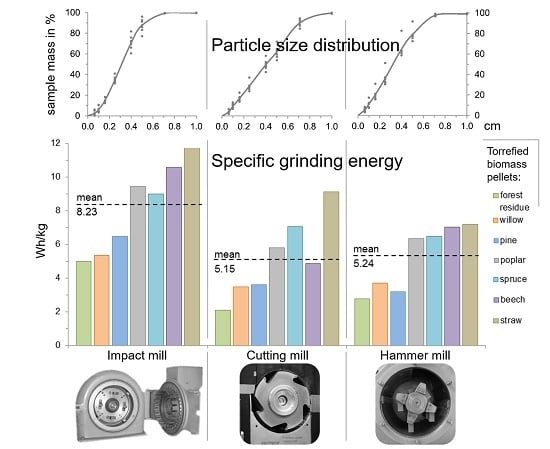
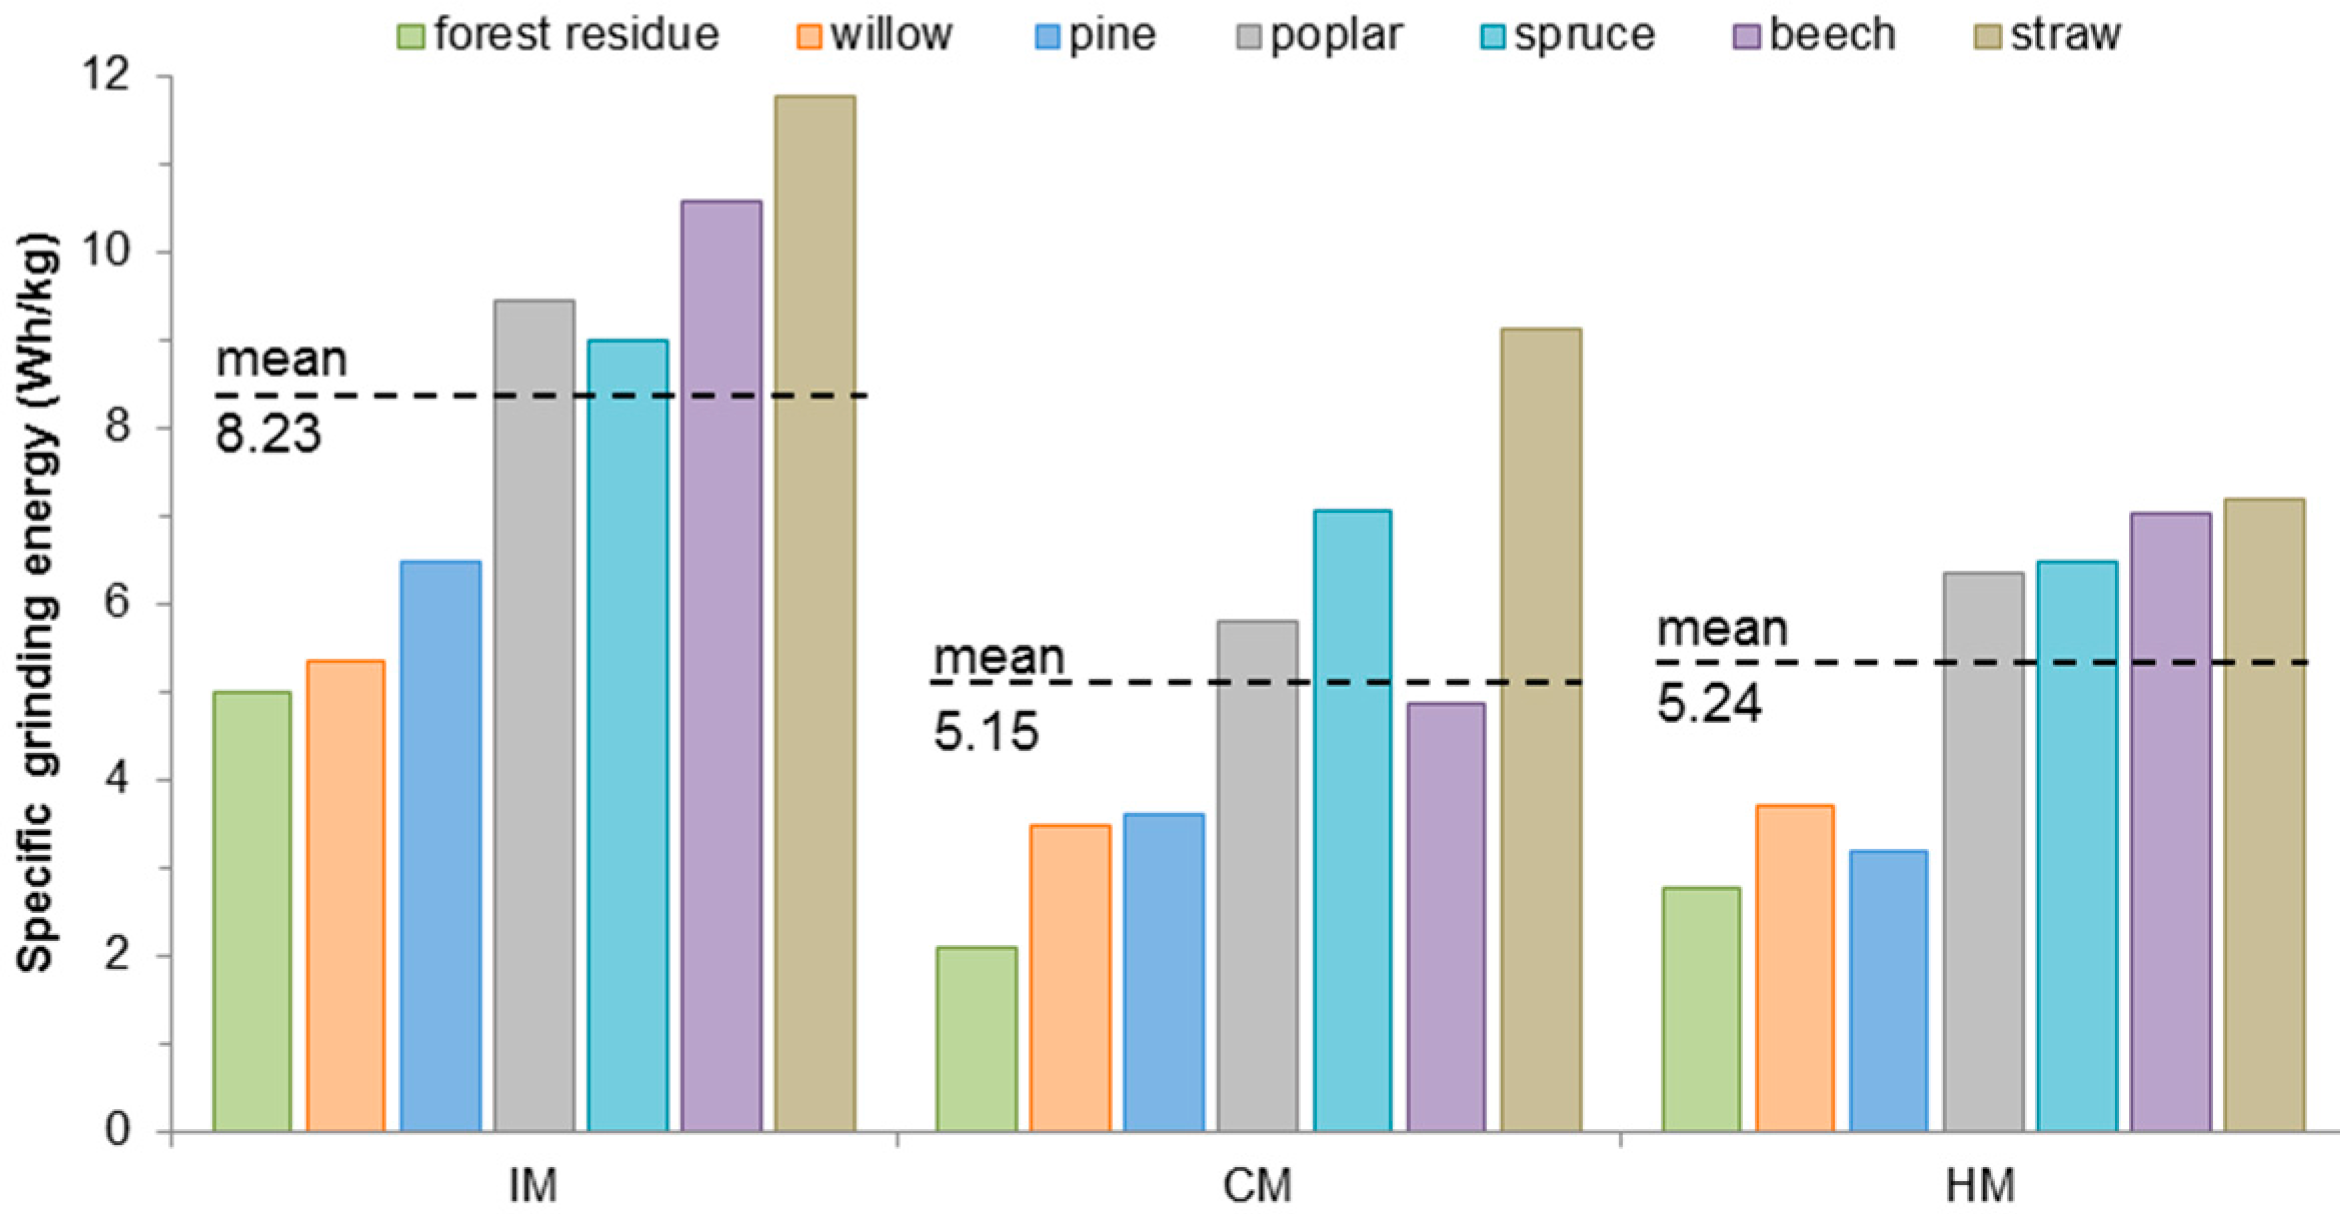
How the different torrefied biomass pellets resulted in different SGEs can be seen in
Figure 2. The mean SGE observed for CM and HM were about the same at 5.15–5.24 Wh/kg while the mean SGE of the IM was substantially higher with 8.23 Wh/kg. Again, this reflects the similar technical specifications of both CM and HM in terms of throughput and rotor speed, which is much different from the IM. More interesting, however, is the way the different mills performed with the respective pellets. The commonality between all three mills was that forest residue pellets required the least and straw the most energy for grinding. In addition, all three mills were able to grind forest residue, willow and pine well below the average SGE consumption while in addition to straw poplar and spruce and beech (except for the CM) required above average SGE. This pattern is in line with several physical-mechanical characteristics of the pellets. Forest residue, willow and pine have much lower hardness (96–125 N) and durability (87.7%–90.3%) and higher TF
TEMP (300–308 °C) than the other pellet types (hardness: 206–496 N; durability: 94.5%–97.9%; TF
TEMP: 260–280 °C).
Current literature does not allow a good classification of the results obtained here as in other studies other parameters were the centre of focus when reporting grinding energy. However, a closer look at other studies recording grinding energy may still give further insights into the results obtained here. Phanphanich and Mani [
27], for example, showed a dramatic decrease in grinding energy between untreated wood chips (237 Wh/kg; at water content of 7%) and torrefied wood chips (as low as 23 Wh/kg) using a laboratory cutting mill (1.5 kW, mesh size 1.5 mm) and found a strong linear correlation with torrefaction temperature. Temmerman et al. found similar values for grinding energy of wood chips (162 Wh/kg, at water content of 5%–10%) as Phanphanich and Mani [
27] using a laboratory hammer mill (1.1 kW, mesh size 2 mm), while regular wood pellets consumed energies much closer to the ones measured here for torrefied wood pellets (on average 11.4 Wh/kg; water content of 5%–10%). This may be explained by the fact that grinding pellets often is a disintegration of the pellets back into the particles they were made of. Hence, the difference in grinding energy between pellets from untreated material and torrefied material will be much smaller than between, e.g., wood chips and pellets. However, whether the grindability of untreated and torrefied material or non-torrefied and torrefied pellets are compared, increasing the degree of torrefaction should result in lower SGE. Shang et al. [
35] reported an exponential decrease of the grinding energy for pine pellets exposed to increasingly higher torrefaction temperatures when using a coffee grinder as laboratory mill (0.55 kW; similar grinding forces as the IM). However, a comparison between the grindability of torrefied pellets and pellets from torrefied material may only partly apply (see discussion on bonding mechanisms during densification in
Section 3.2).
The fact that pellets from torrefied material require a much lower grinding energy is one of the economic advantages of torrefaction as it will save energy during the final grinding for injecting the biomass powder into the boiler. However, the possible difference that may occur between different laboratory mill types, as shown here, may only partly be relevant for power plant operators since existing technology may not be replaced for new technology due to high investment costs. However, the results shown here could help identify the most appropriate mill type for a standardized methodology to assess grindability of regular and thermally-treated biomass pellets. The SGEs observed in the IM, for example, are much more distinct for the different pellet types than the values observed with the HM where poplar, spruce, beech and straw only differ minimally.
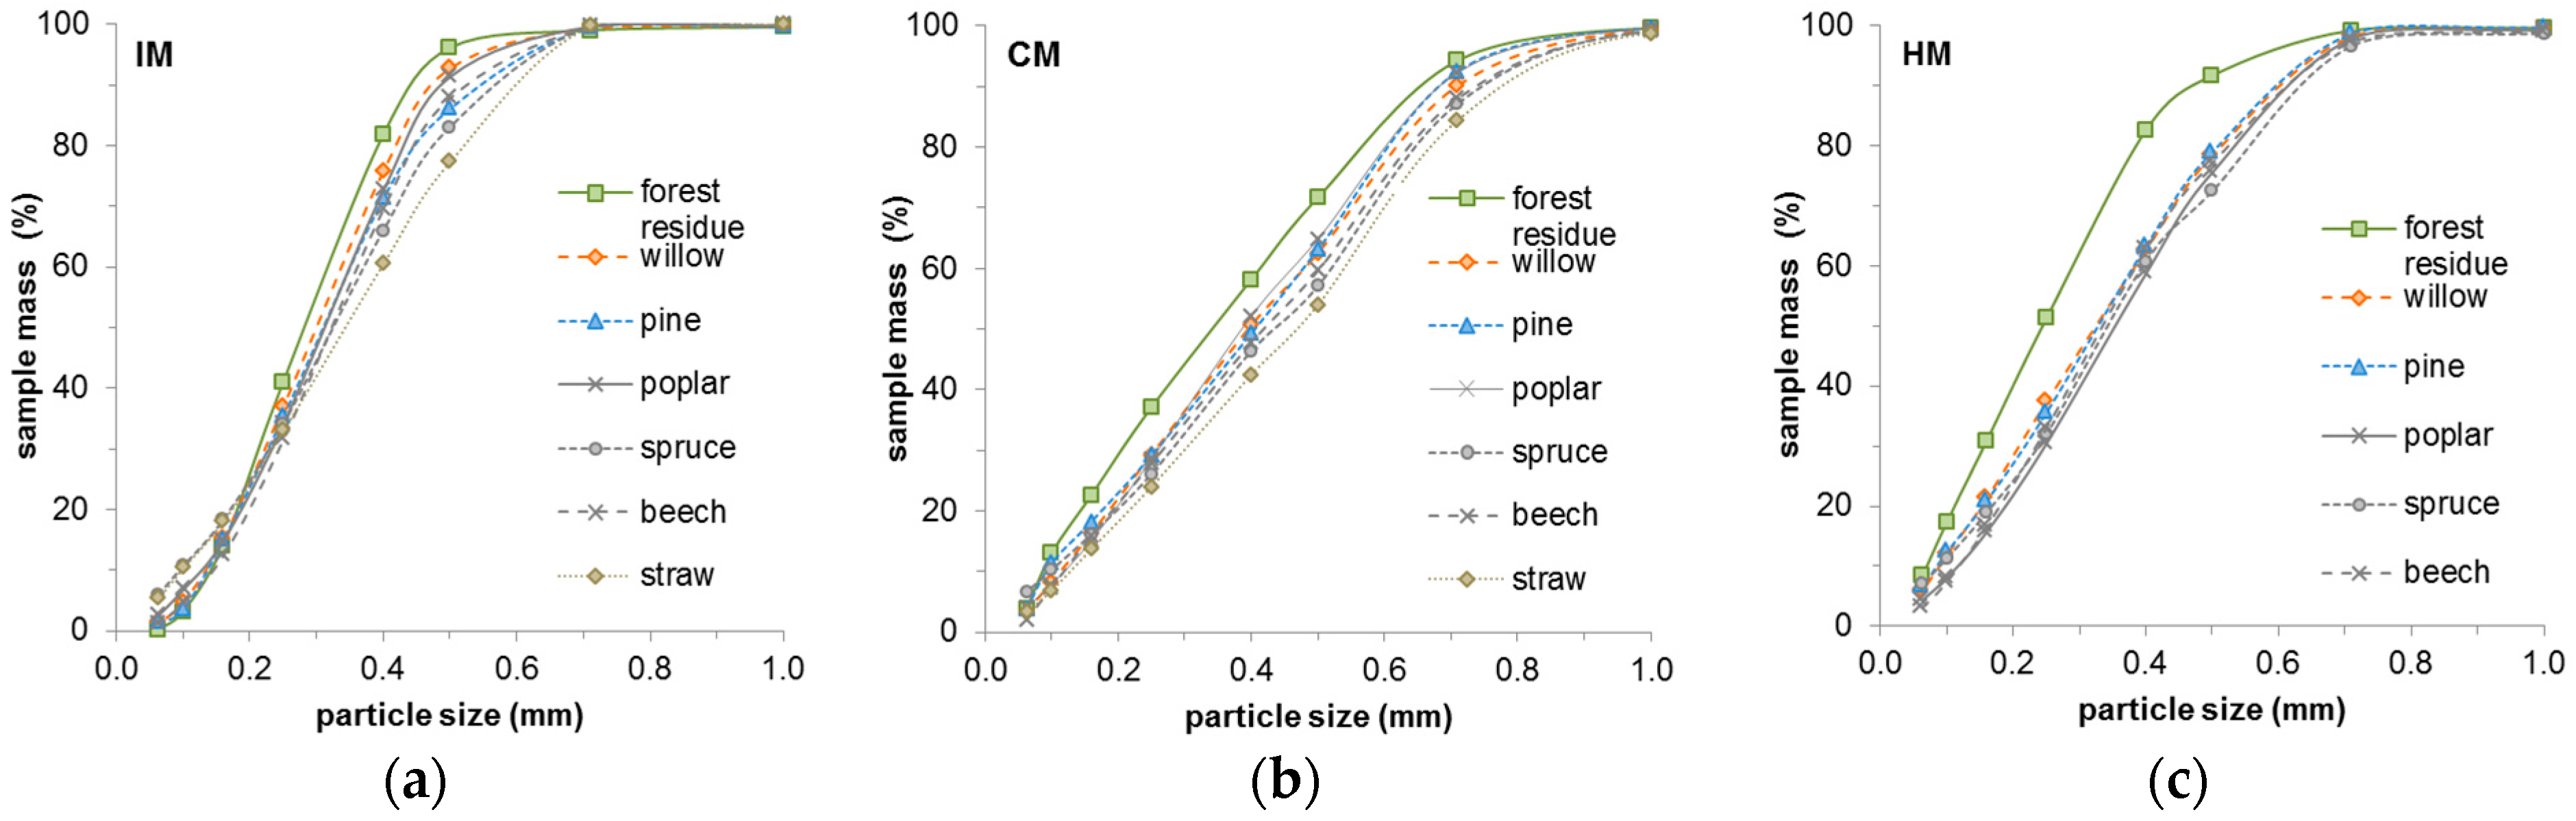
3.4. Particle Size Distributions after Grinding
In addition to the SGE, the cumulative PSD curves (
Figure 3) were compared to assess the impact of the mills on the material and to check whether a particular mill type might prove more suitable for use in a standardized methodology in relation to, e.g., co-combustion requirements.
As can be seen in
Figure 3, each mill yields a uniquely shaped distribution curve, which is similar for all materials ground with that mill. In the current literature, a comparison of PSD curves between different lab-size mills and their performance with torrefied pellets is missing. Some studies, however, may be helpful to further understand the results shown here. Phanphanich and Mani [
27], for example, produced cumulative PSDs of two materials (pine chips and logging residue) with different degrees of torrefaction which were ground in a lab-size cutting mill. The resultant PSD curve showed a linear increase—much like the one in this study for the untreated materials (
Figure 3b)—where it can be seen that as the severity of the torrefaction increased the incline of the curve was more pronounced at <0.25 mm before it started declining (at >0.25 mm). However, it is difficult comparing the grindability of wood chips with the grindability of pellets. Thrän et al. [
9] showed that pellets from torrefied spruce were mostly disintegrated back to the particle sizes before densification. The disintegration of non-densified material is of course very different and may depend even more on the mill type. However, when looking at the three different mill types and their respective PSD curves it becomes clear that the pellets were not just disintegrated but fractioned differently. Especially the PSD curves of the IM (
Figure 3a) had a unique characteristic with a slow incline up until 0.2 mm followed by a strong incline between 0.2 and 0.5 mm and phasing out thereafter. For both CM and HM the incline is steady up until 0.7 mm before the curves phase out (with the exception of forest residue in the HM). Bridgman et al. [
16] showed cumulative PSD curves for two energy crops (willow and miscanthus) which where torrefied and ground in a roller-ball mill designed for the HGI test and they had very different characteristics than the curves of the three mills used here. Interestingly, in their study, all degrees of torrefaction of miscanthus resulted in curves similar to the ones from the HGI coals while the raw material yielded an entirely different curve. However, in the case of willow, only the PSD curve of the most severely torrefied sample showed the same pattern as all the standard coal curves. Despite the differences in mills, the PSD curves obtained by their study do not compare well with the result obtained here as they show the grindability of pre-ground material (as required by the HGI procedure) while here whole pellets were used. Only during the investigation of the mHGI of the seven pellet (when using a ball mill after pre-grinding the pellets) their findings (PSD curve of torrefied willow) could be confirmed (see
Figure S4).
Regarding the grinding performance and suitability of the PSD for co-combustion application Thrän et al. [
9] investigated the co-milling of torrefied pellets with coal in a bowl mill (400 kg/h at medium load, vertical rollers) at different mixture rates. When the share of torrefied pellets in the mixture was high (58.5%) 90% of the ground material had a particle size below 0.6 mm while at a lower share of torrefied pellets (32%) the main particle size fraction dropped below 0.2 mm. In comparison to the mills used here, only the IM can achieve similar results with most of the seven feedstocks resulting in 90% of the ground mass to be below 0.6 mm.
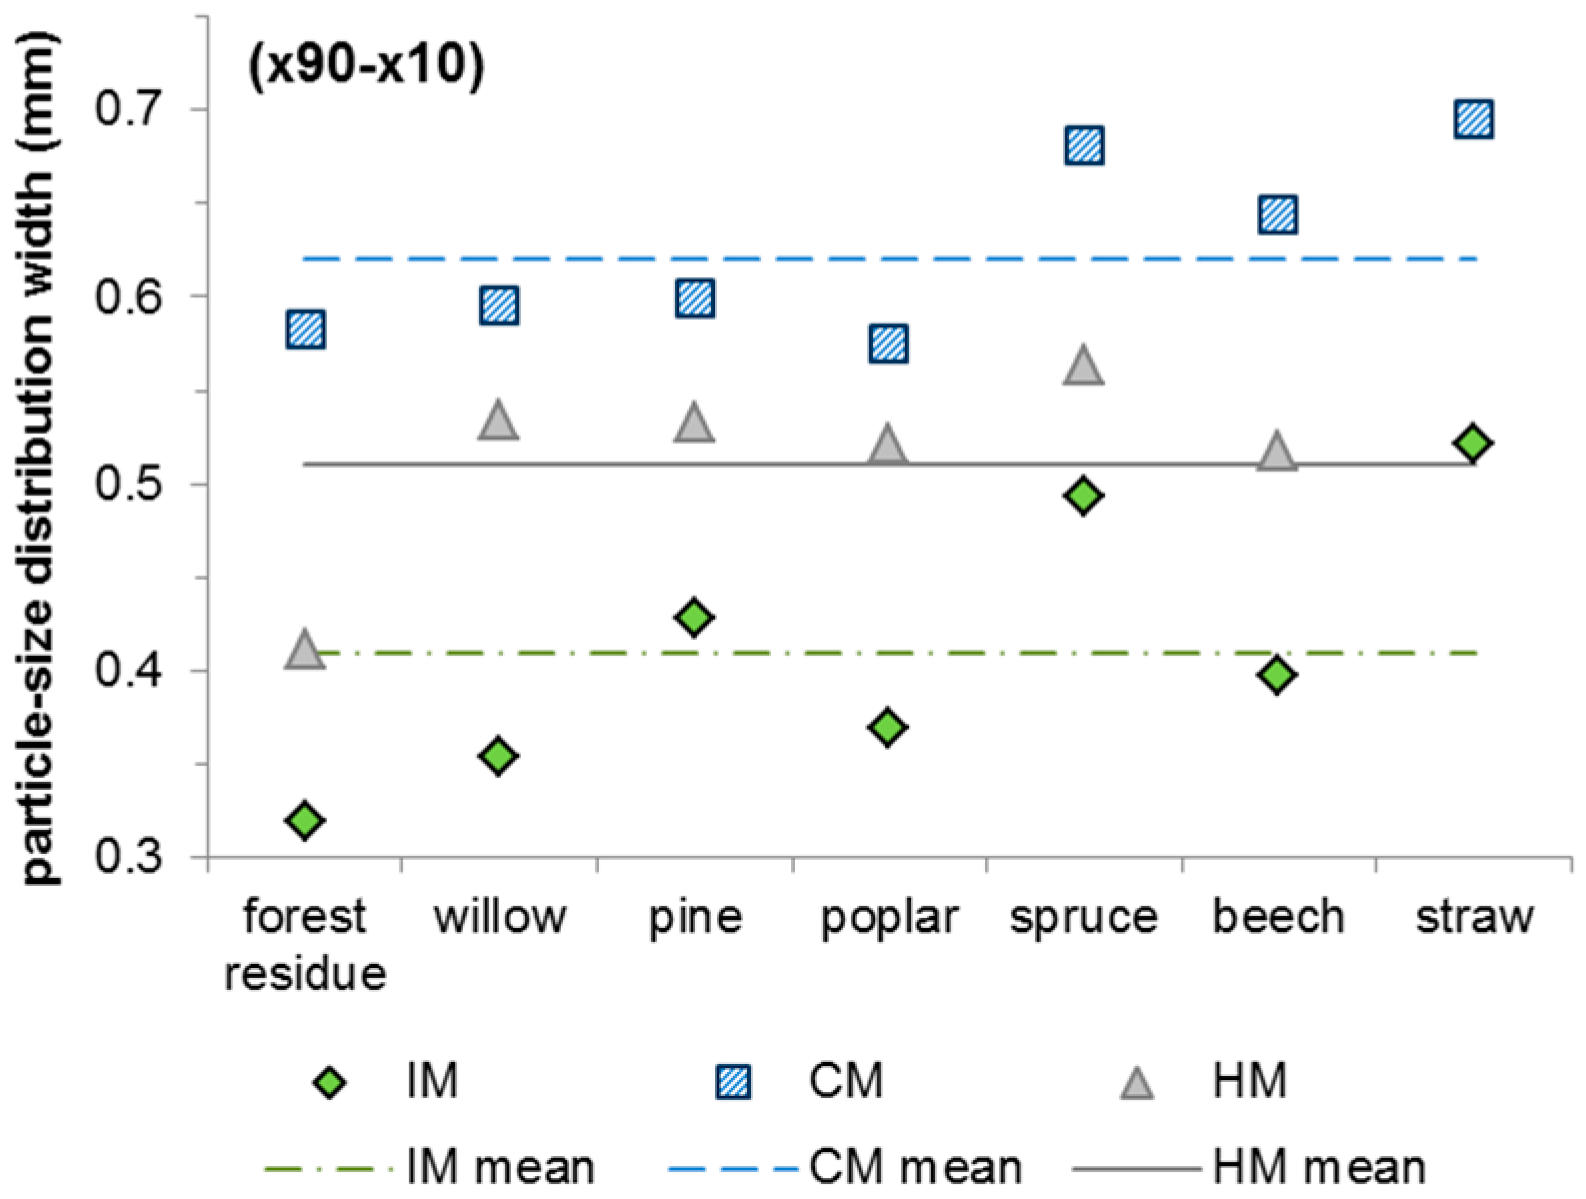
To assess the suitability of the mills to test grindability in a standardized way for an application in co-combustion process the distribution widths of the PSD curves were compared. The average distribution width (
Figure 4) across all input materials was narrowest for the IM (0.41 mm), followed by the HM (0.51 mm) and the CM (0.62 mm). However, the IM had the largest variation in feedstock-based distribution width ranging from 0.33 mm all the way to 0.52 mm. Both HM (0.41–0.56 mm) and CM (0.57–0.69 mm) had more even distribution widths across the different feedstock. Looking back at the distribution curves again (
Figure 3), it becomes obvious that the variation in the curves from the IM happened in the particle range of >0.3 mm, while the variation observed in the other two mills was more or less consistent along the particle size scale. The distribution curves of HM, on the other hand, had one strong outlier (forest residue) compared to the other mills. However, in all mills the distribution width was below average when grinding forest residue material, which is also in line with the low SGE required to grind this type of pellet in all mills. Along the same line, straw resulted in the largest distribution width in all mills (curve for straw in HM is missing from the data) as suggested by the SGE. However, a modest linear correlation of the SGEs and the respective distribution width could be observed for the CM (R
2 = 0.65) and the IM (R
2 = 0.47) while the HM had only weak correlations (R
2 = 0.27). Thus, for CM and IM it can be concluded that pellets from torrefied material, which generally require lower SGEs, also will be ground with narrower distribution widths. The fact that the IM not only has the narrowest distribution width but also the lowest values for x90 (0.53 mm, average across all seven pellet types; see
Table S1) makes it a more ideal lab-mill for producing particles favourable in co-combustion settings.
3.5. Specific Grinding Energy versus Other Methods
To assess whether the SGE is a parameter that can stand alone or is better complemented with another parameter the SGE values were correlated to the three relevant grindability parameters analysed here. The SGE was found to be in a positive linear relation with the durability of the pellets and the pellet hardness (
Table 4). However, only the correlation with the durability is of strong enough significance (R
2 = 0.86 for both IM and HM) that one could argue that SGE is partly reproducing that information. All correlations of SGE with the modified HGI were weaker (R
2 ≤ 0.77) than the correlation between durability and SGE. The correlations between mHGI and SGE were all negative, as a lower value mHGI will imply higher energy requirement for grinding. The correlations of SGE with hardness were all of insignificant strength.
Looking at the close correlation between SGE and durability it might be advisable to combine SGE values with a PSD parameter such as the distribution width to help detangle it from durability and give a unique insight into the co-combustion characteristics of the torrefied biomass pellets.
3.6. Adjustments of the Grindablity Method for Reliable Performance
For a standardized method, it is essential for the equipment used to perform reliably and a procedure that ensures high repeatability and reproducibility of the results obtained. For the proposed GM and the values it will yield, it is necessary to not only define the type of mill but also to adjust some parameters, e.g., the feeding rate. This will require a round robin test of the methodology across different laboratories all using the same equipment.
In terms of choosing the right mill technology for a standardized method, the transferability of the results to plant operator scenarios is the main focus. As plant operators will try to use their existing equipment (in most cases ball, roller or impact mills) and adapt it to the new biomass, a CM seems to be an unlikely choice. Another disadvantageous feature of a CM, also in terms of repeatability and reproducibility of laboratory results, are the knives, which tend to become dull and thereby bias the results (e.g., the sharpness of the knives used here could not be quantified). A HM on the other hand may pose the challenge of proper adjustment of the hammers so that results will be repeatable and reproducible, which, however, is less of a challenge than what the CM poses. IM seem to be the easiest to handle and adjust and yielded the most promising PSD curves and distinct SGE values amongst the three mills. Results from a mill like Thrän et al. [
9] used in there study may be even more valuable to plant operators yet it is not applicable for a lab standard given its capacity (double that of the IM) and respective investment cost. As the IM used here is still relatively large for lab application, it might be advisable to also do an investigation on the performance of a small-scale disc-grinding system as was used by Shang et al [
35].

 ,
, 


