Article

Effects of Biochar Amendment on Chloropicrin Adsorption and Degradation in Soil

1
Southwest Research and Design Institute of Chemical Industry Co., Ltd., Chengdu 610225, China
2
Plant Protection Institute of Chinese Academy of Agricultural Sciences, State Key Laboratory for Biology of Plant Disease and Insect Pest, Beijing 100193, China
3
U.S. Department of Agriculture—Agricultural Research Service (USDA-ARS), Water Management Research Unit, Parlier 93648, CA, USA
*
Authors to whom correspondence should be addressed.
Energies 2016, 9(11), 869; https://doi.org/10.3390/en9110869
Submission received: 10 August 2016 / Revised: 6 October 2016 / Accepted: 18 October 2016 / Published: 26 October 2016
(This article belongs to the Special Issue Biomass Chars: Elaboration, Characterization and Applications)

Abstract

:
The characteristics of biochar vary with pyrolysis temperature. Chloropicrin (CP) is an effective fumigant for controlling soil-borne pests. This study investigated the characteristics of biochars prepared at 300, 500, and 700 °C by michelia alba (Magnolia denudata) wood and evaluated their capacity to adsorb CP. The study also determined the potential influence of biochar, which was added to sterilized and unsterilized soils at rates of 0%, 1%, 5%, and 100%, on CP degradation. The specific surface area, pore volume, and micropores increased considerably with an increase in the pyrolytic temperature. The adsorption rate of biochar for CP increased with increasing pyrolytic temperature. The maximum adsorption amounts of CP were similar for the three biochars. Next, the study examined the degradation ability of the biochar for CP. The degradation rate constant (k) of CP increased when biochar was added to the soil, and k increased with increased amendment rate and pyrolysis temperature. The results indicate that biochar can accelerate CP degradation in soil. The findings will be instructive in using biochar as a new fertilizer in fumigating soil with CP.

1. Introduction

Biochar is produced during pyrolysis of organic material under oxygen-limited and relatively low temperature conditions [1]. The application of biochar to agricultural soil can improve soil fertility and the nitrogen-use ratio; selectively immobilize nutrient elements [2]; adsorb heavy metals and organic contaminants; transform Cu2+ and Zn2+ for plant uptake [3,4]; and change the soil physicochemical properties, including pH, organic carbon, and cation exchange capacity [5,6]. Biochar has received increasing recognition as a soil amendment for sequestering carbon to mitigate climate change [7,8]. In addition, biochar can affect the fate of pesticides in soil. Yang et al. and Zhang et al. suggested that wheat straw-derived biochar affects the degradation of organic chemicals in soil, presumably through adsorption, and indicated that biochar can decrease the microbial degradation of Diuron [9,10]. Jones et al. found that biochar suppresses simazine biodegradation and reduces simazine leaching [11]. However, Jablonowski et al. observed that increased degradation of atrazine residues likely occurred through the transfer of atrazine-adapted soil microflora from different soils and regions to non-adapted soil [12]. Therefore, the influence of biochar on pesticides produces variable results.
Chloropicrin (CP) is applied as a fumigant to many crops to control soil-borne disease and nematodes [13,14]. The influence of biochar on CP degradation in soil remains poorly understood. Biochar, which is a type of charcoal, possesses a high specific surface area (SSA) that may decrease CP degradation because of its strong capacity to adsorb this fumigant. However, chloropicrin is a polyhalide that can be degraded by free radical-induced reactions [15], and biochar typically contains high quantities of free radicals [16] that could potentially accelerate CP degradation. Thus, the application of biochar as a new fertilizer into the soil could accelerate the degradation of CP, and, accordingly, affect the efficacy of CP to soil borne pests. Biochar produced under different temperatures has different properties. For example, biochar produced under high pyrolysis temperatures typically has a relatively high surface area and aromaticity and can, therefore, resist decomposition. This type of biochar is known as a green adsorbent [2,17,18]. In contrast, low-temperature pyrolysis favors a greater recovery of C and several other nutrients (e.g., N, K, and S) that are increasingly lost at higher temperatures [19].
The objectives of this study were to determine the structure and surface chemical properties of biochar prepared under different pyrolysis temperatures (300, 500, and 700 °C, marked as B300, B500, and B700, respectively) and to evaluate the effects of amending soil with these biochars on CP degradation and adsorption. Additionally, the study evaluated the interplay between CP degradation and adsorption. The results will be instructive in how to use biochar as a new fertilizer in fumigating field with CP.

2. Results and Discussion

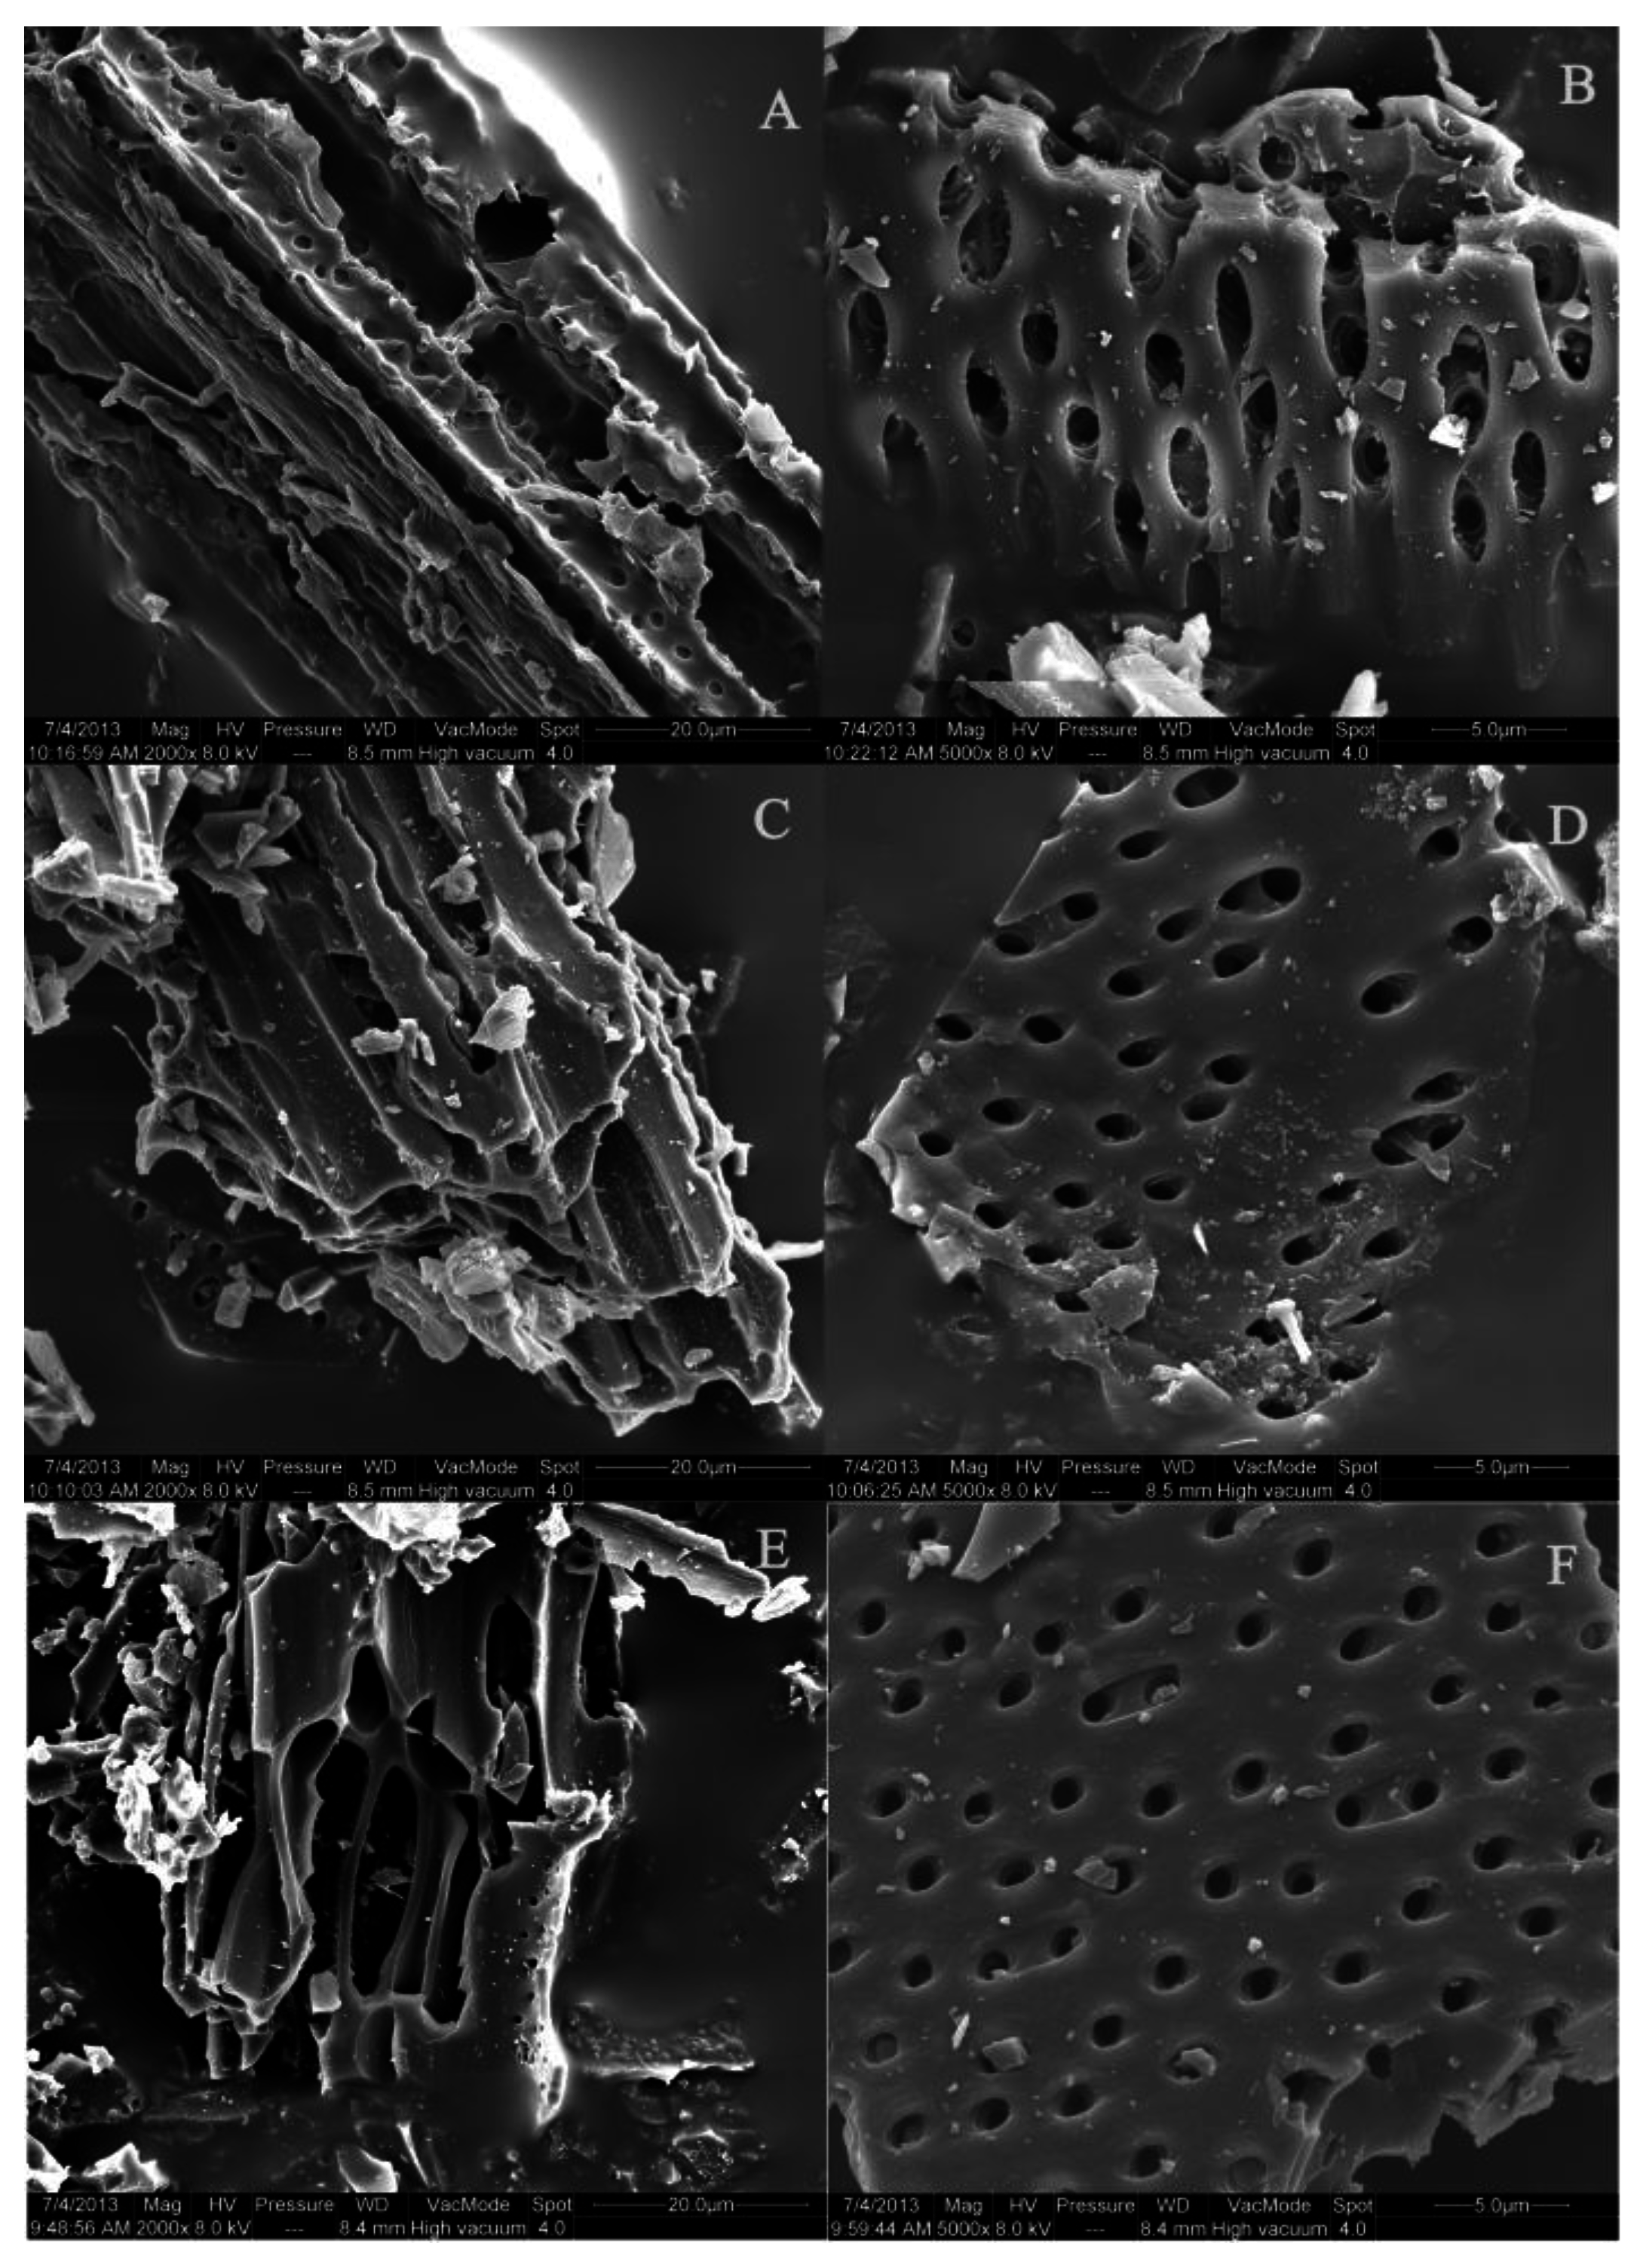
2.1. The Composition and Structure of Biochar

The Boehm titration results (Table 1) indicates that, in general, the carboxyl concentration decreased and the phenol hydroxyl concentration increased as the pyrolytic temperature increased. The phenol hydroxyl and carboxyl concentrations changed dramatically from 300 °C to 500 °C. The lactone concentration did not change significantly with changes in temperature, but these molecules were present in the highest concentration of all the oxygen-containing functional groups. In addition, the changes in carboxyl and lactone concentrations were not significant between B500 and B700. The elemental composition is shown in Table 1. An increase in the pyrolytic temperature resulted in a decrease in the hydrogen and oxygen content, and an increase in the carbon content. The calculated H/C values were lower under high temperatures, indicating that the biochar was highly carbonized and showed a highly aromatic structure. The higher H/C values for B300 and B500 indicates that most of the carbon-containing compounds had not decomposed under low pyrolytic temperatures, including lignin and cellulose components [20,21]. Additionally, the (O + N)/C and O/C ratios decreased sharply with increasing pyrolytic temperature, indicating that the biochar had high polarity and was hydrophilic under high temperatures [22,23].
The SSA, pore size, and ash content of the different biochars are shown in Table 1. The SSA and pore volume increased and the pore size decreased as the pyrolytic temperature increased. In addition, the scanning electron microscopy (SEM) images showed that the pore volume (Figure 1A,C,E) and the number of micro-pores on the biochar surfaces (Figure 1B,D,F) increased. The pore canal gradually collapsed as the pyrolytic temperature increased which caused the pore volume to increase. At high pyrolytic temperatures, an immense heat flow was released from the inner feedstock and burst through the micro-pores. The changes in the properties of the biochars produced under different temperatures were due to the decomposition of hemicellulose, cellulose, and lignin. The corresponding temperatures for maximum decomposition of hemicellulose and cellulose were 300 °C and 355 °C, respectively, while the temperature for lignin decomposition ranged between 150 to 900 °C [20,21]. Therefore, as the temperature increased from 300 °C to 700 °C, the surface characteristics of biochar changed dramatically, which caused obvious differences in surface properties. Intense heat was released from the inner parts of the feedstock and burst through the micropores at high pyrolytic temperatures, resulting in an increase in the number of micropores [1].
The ash content of the biochars increased gradually with an increase in temperature (Table 1), which indicates that at higher temperatures there was a greater decomposition of organic matter and a reduction in the biochar yield rate. However, compared with other feedstocks (e.g., chicken manure, rice straw), wood has a lower ash content [24] and, therefore, has good potential as a feedstock. Additionally, the pH of the biochars increased with an increase in the pyrolysis temperature, which indicates that the biochars were alkaline, as indicated by Lehmann [25].

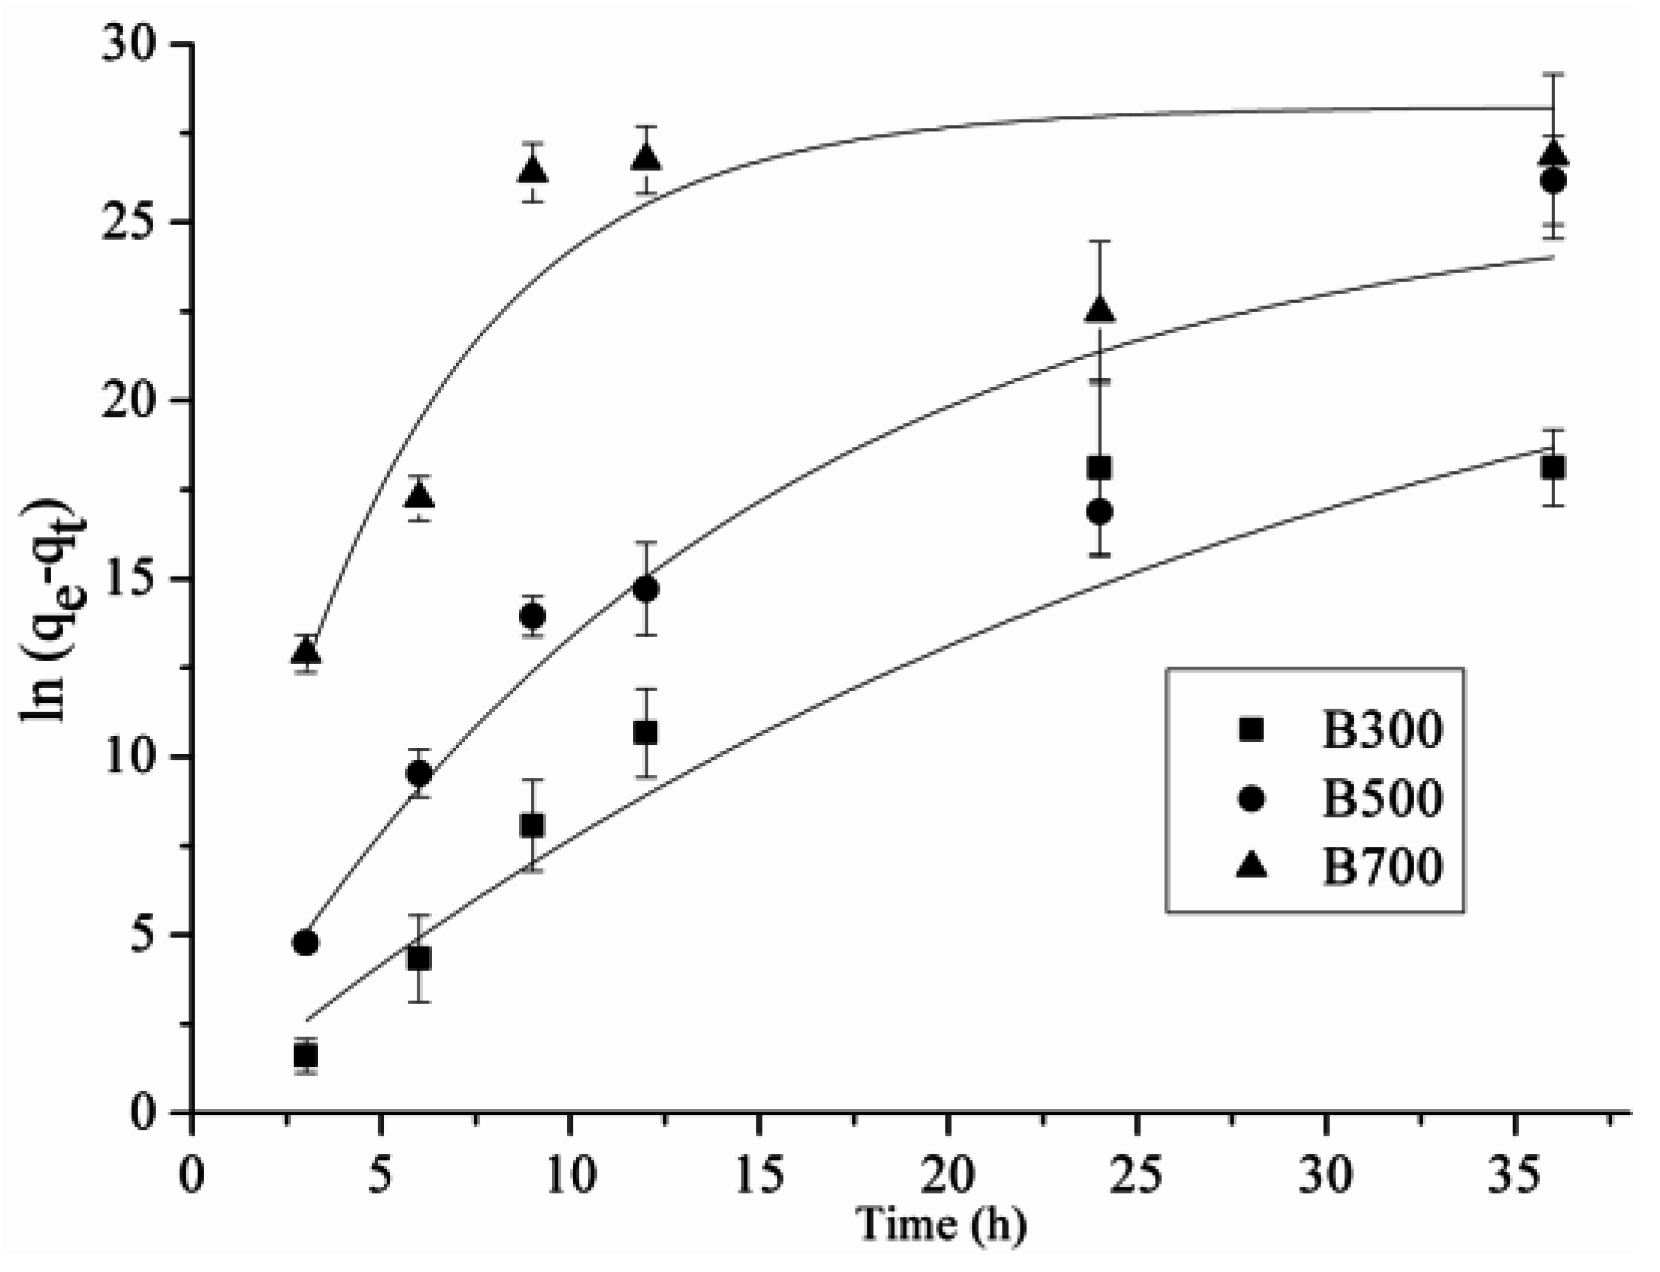
2.2. Adsorption Kinetics

The Lagergren pseudo-first-order model fit the adsorption kinetics of biochar to CP well (Table 2). The adsorption equilibrium time was approximately 36 h (Figure 2) and 24 h in biochar and active carbon, respectively, at 30 °C. The adsorption rate constants were 0.01, 0.07, and 0.24 min−1 for B300, B500, and B700, respectively, which shows that the adsorption rate gradually increased as the pyrolytic temperature increased. This result may be due to changes in the biochar characteristics, such as the number of micropores and adsorption sites on the surface of the biochar. An increase in the pyrolytic temperature from 300 °C to 700 °C did not result in significant differences in the quantity of CP on the three biochars at equilibrium. The adsorption capacity of the biochars was considerably lower than that of active carbon. The large SSA of biochar appears to be in accordance with its high adsorption capacity for CP; however, this result conflicts with the adsorption results of B700, whose SSA is 364.63 m2·g−1. Therefore, other factors, such as the number of adsorption sites on the adsorbent, may account for the adsorption performance of biochar. The following section discusses how the properties of CP adsorption to biochar were studied by determining the adsorption isotherm.

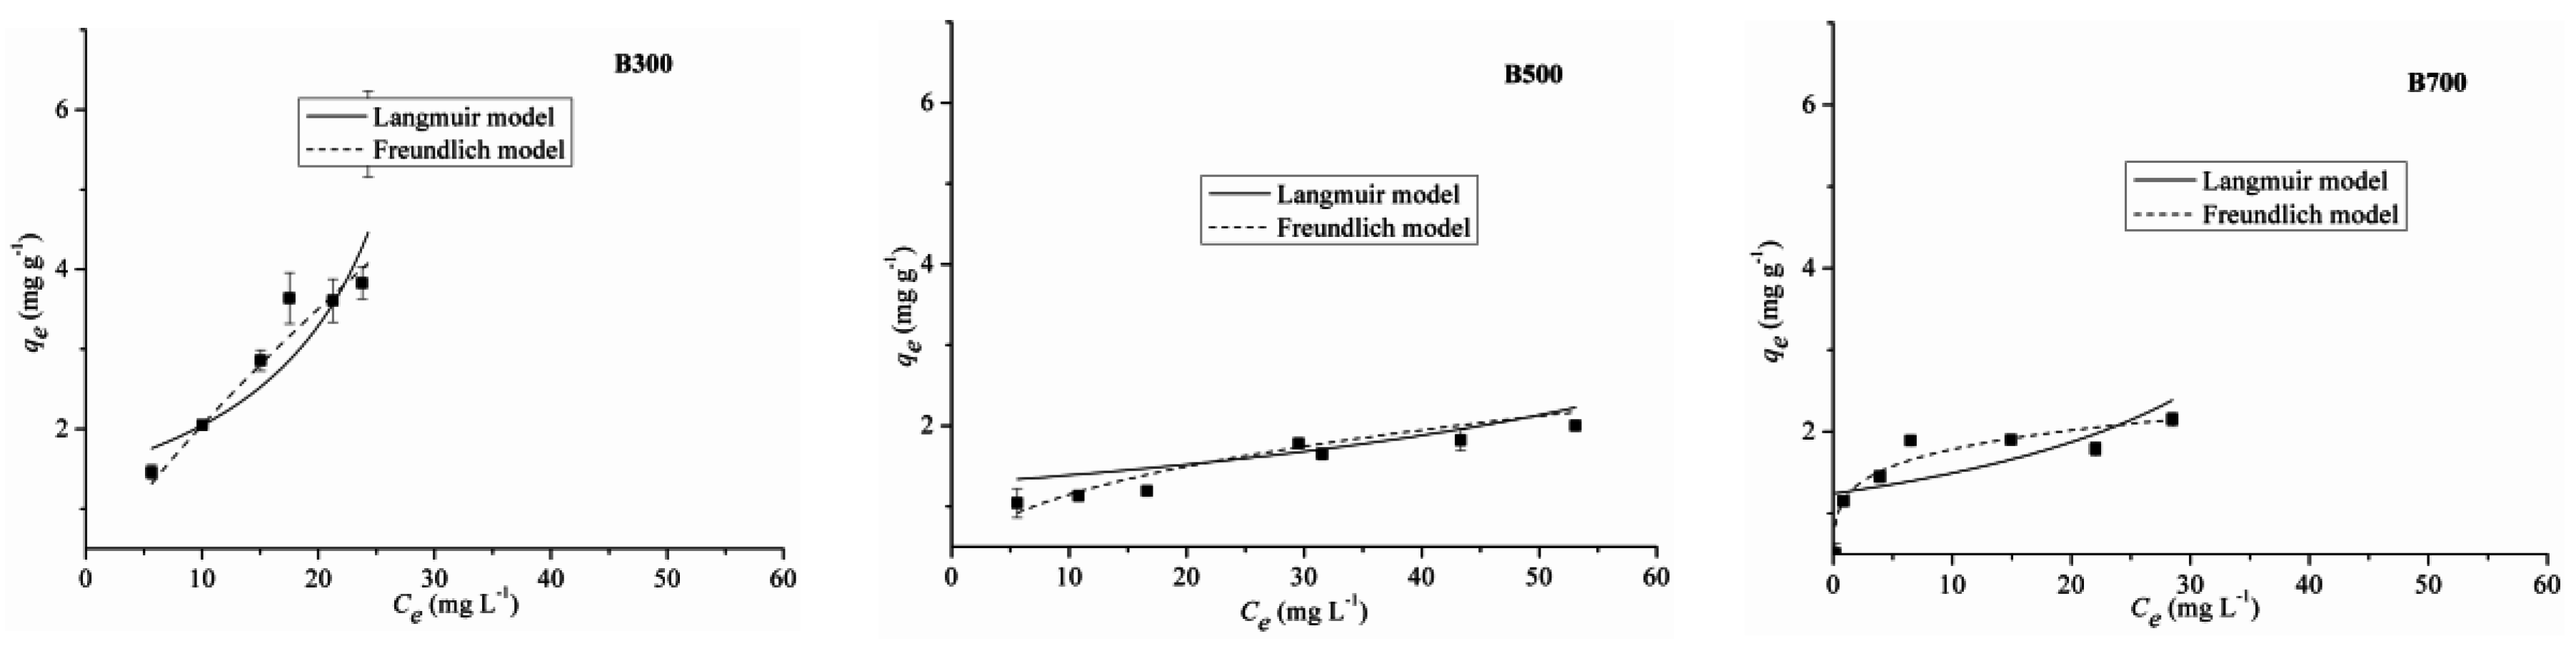
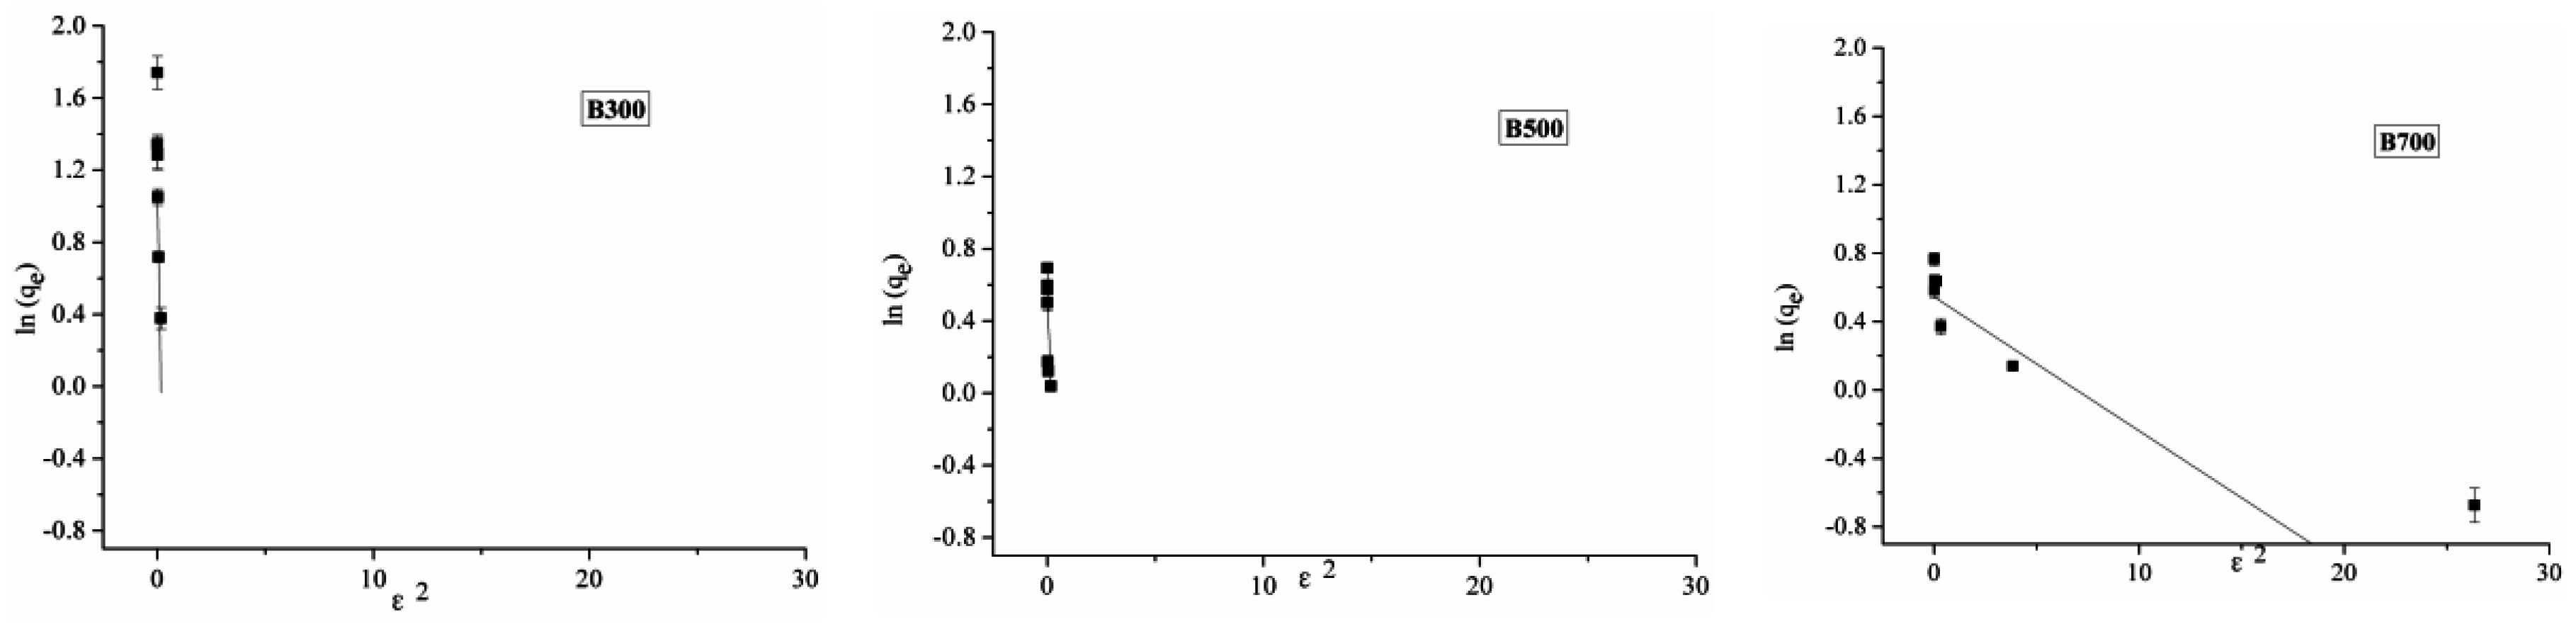
2.3. Adsorption Isotherm

The isotherm equation was fitted using three models, and the Freundlich equation provided the best degree of fit (Table 3, Figure 3 and Figure 4). Therefore, the discussion below focuses mainly on the parameters of this equation. According to the principles of the Freundlich model, the process of CP adsorption to biochar is associated with heterogeneous adsorption and biochar surfaces that contain sites with different adsorption energies. The parameter n increased with an increase in the pyrolytic temperature. The larger the value of n, the more nonlinear the adsorption isotherm became, and the more its behavior deviated from linearity. The kf value increased with an increase in pyrolytic temperature, which indicated the following adsorption capacity trend: B700 > B500 > B300. This result was not in agreement with the adsorption kinetics data. However, the sum of the amount of CP in the gas and biochars was considerably lower than the applied amounts (Table 4), which indicated that the CP was degraded by the biochar. The degradation ratio increased as the pyrolytic temperature increased, and 8%–25%, 14%–36%, and 44%–80% of applied CP was degraded in B300, B500, and B700, respectively. The adsorption capacity of CP to B700 was strong, and the degradation ability was high; therefore, the maximum adsorption amounts of CP in B300, B500, and B700 were similar.

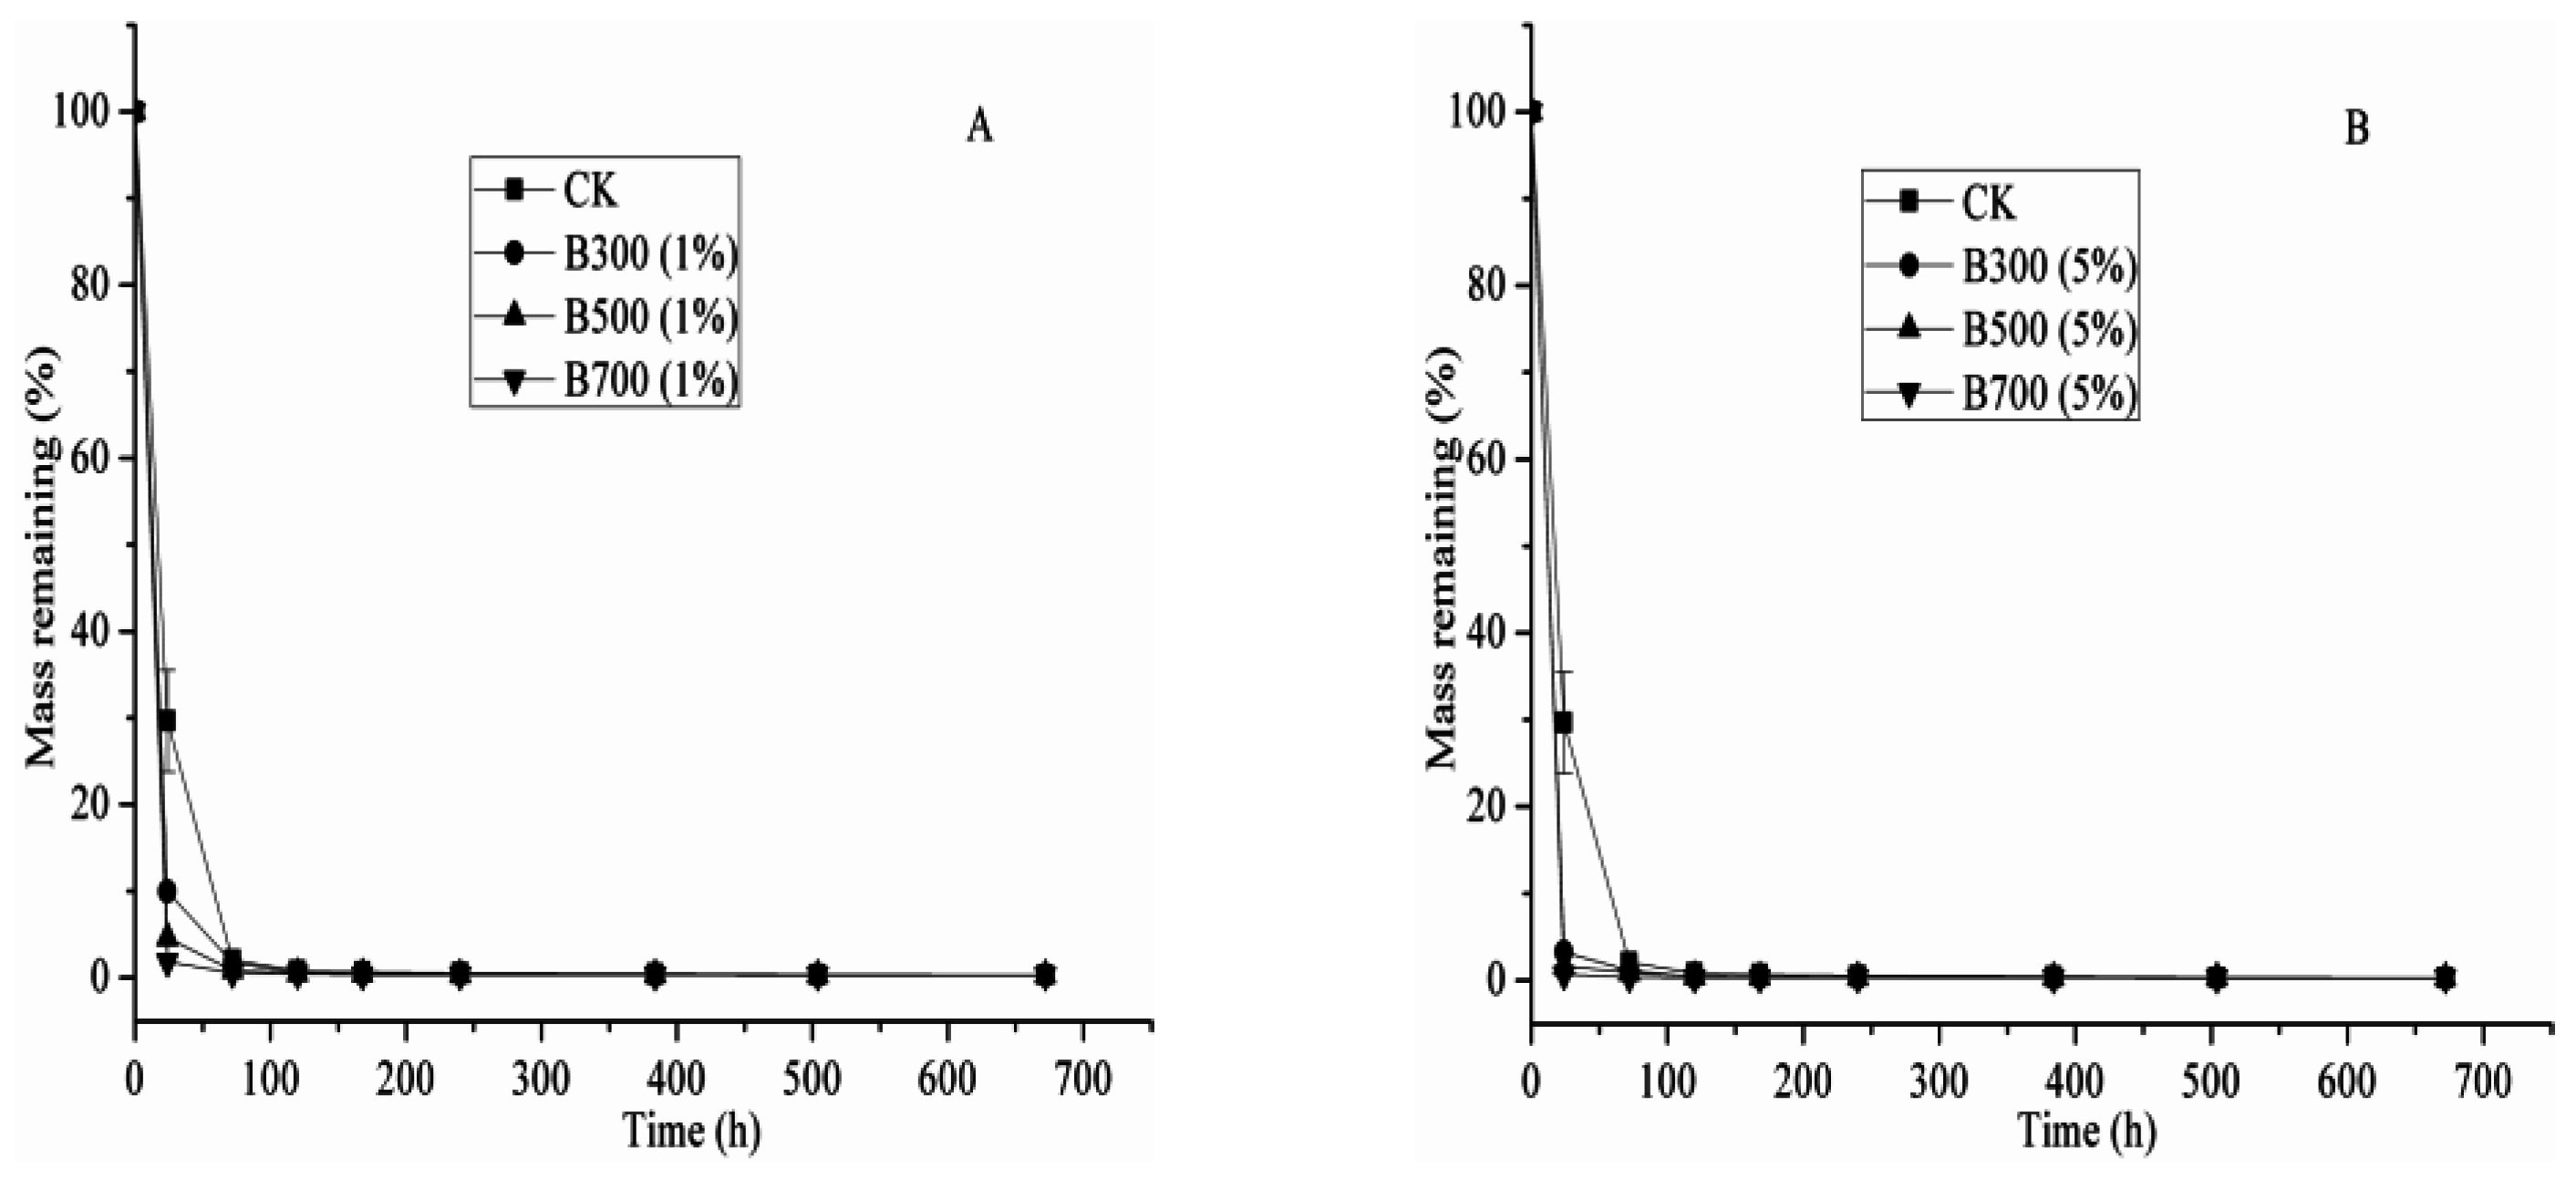
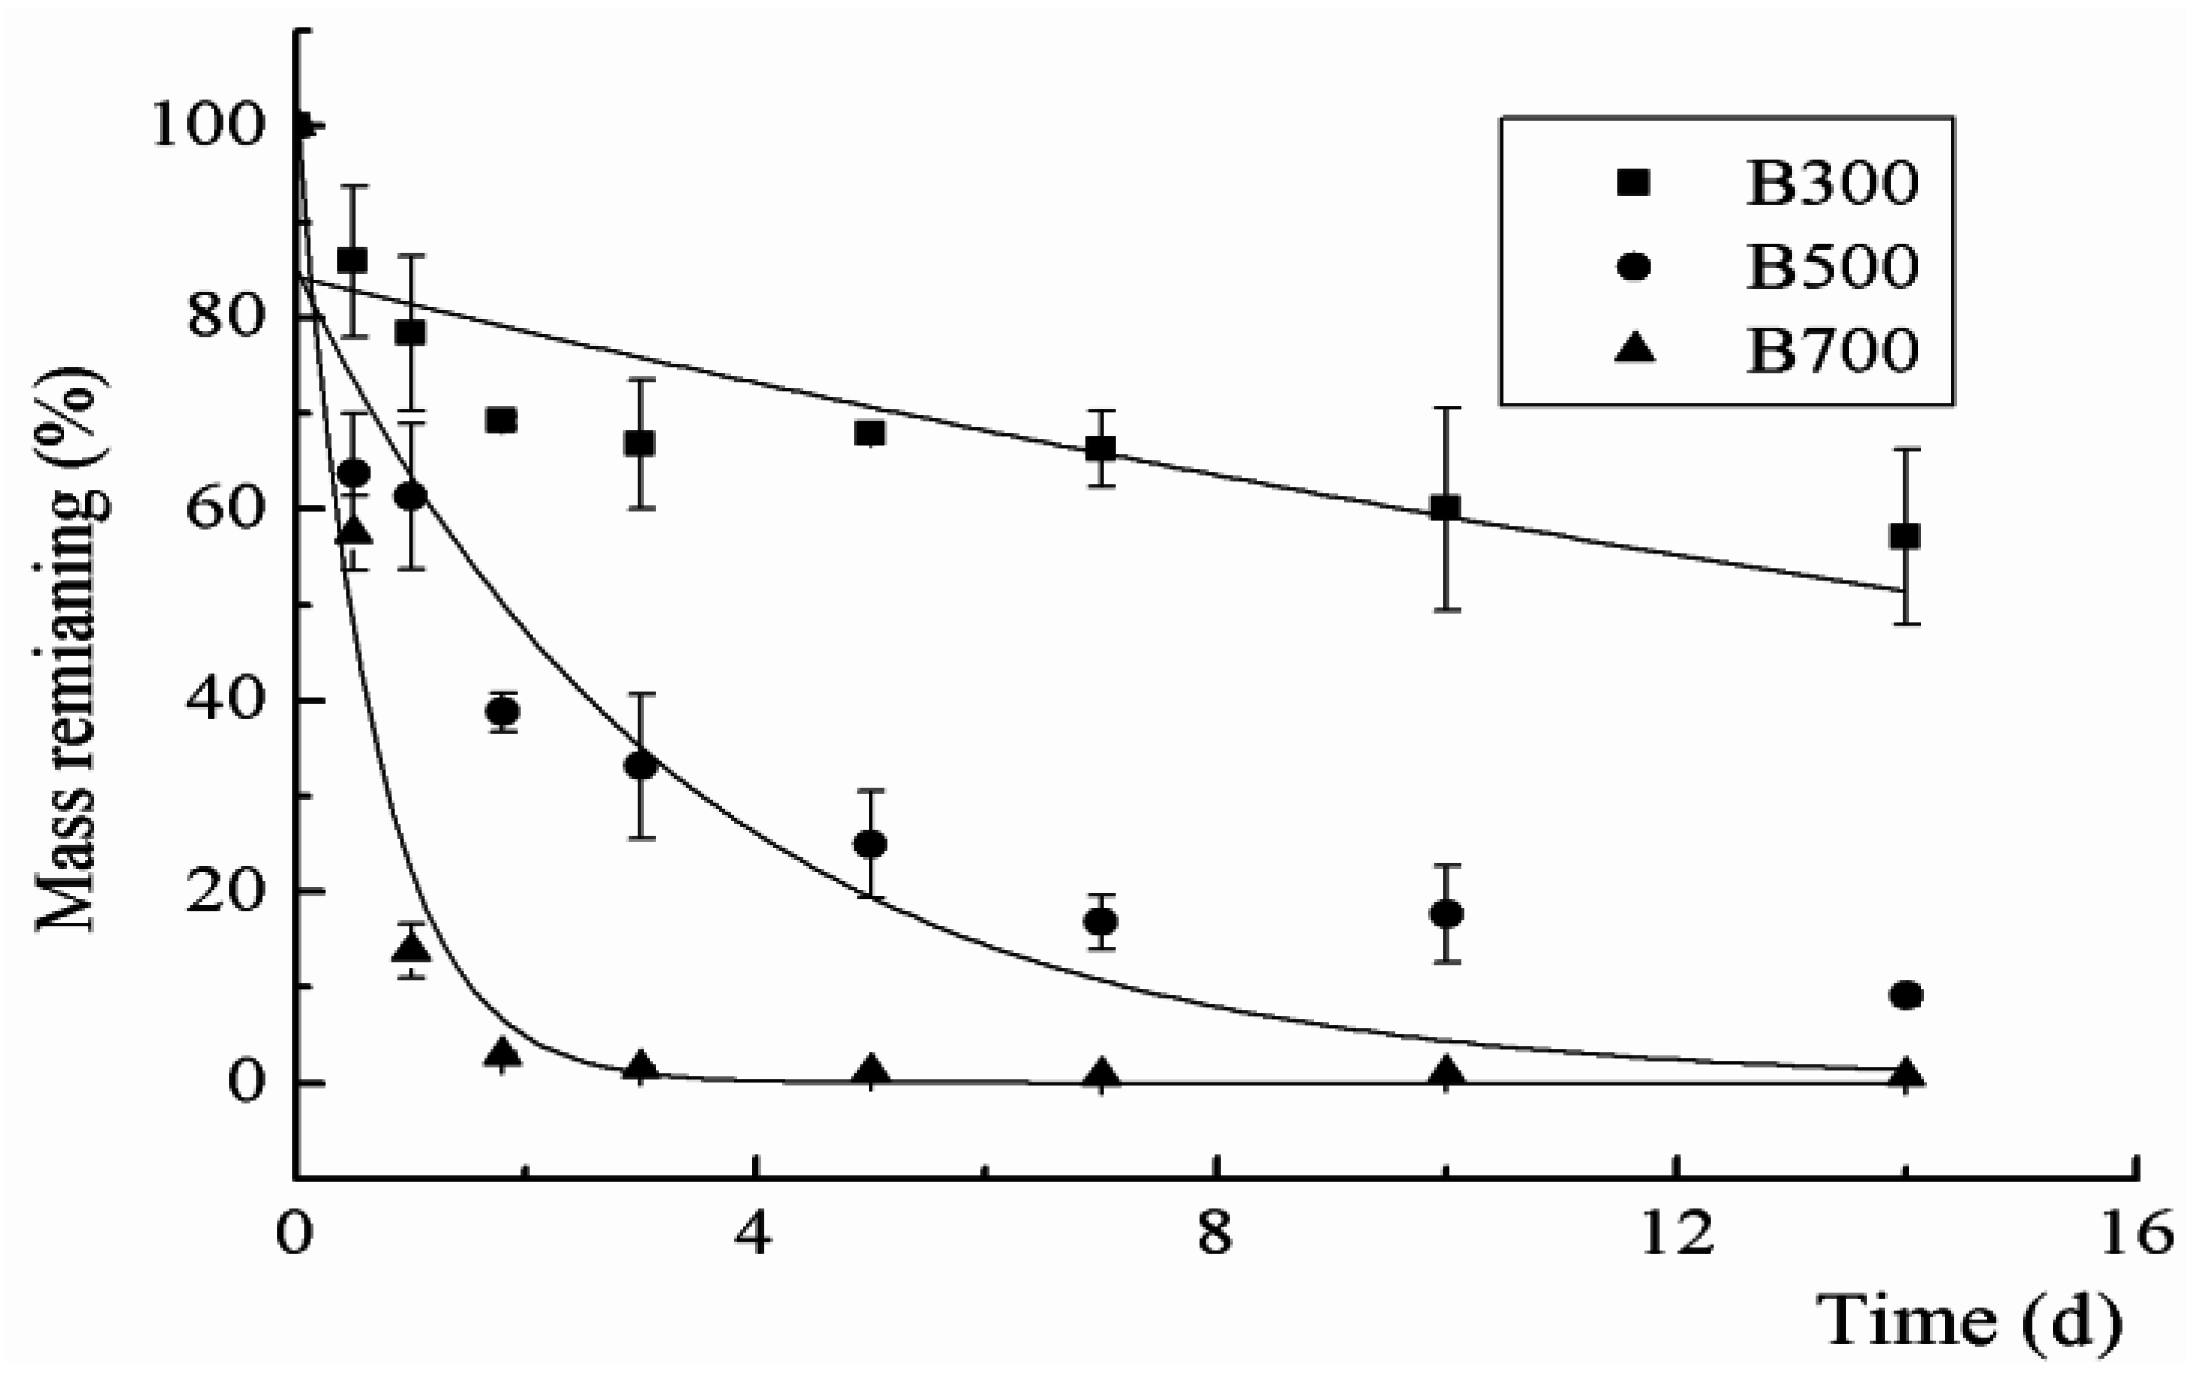
2.4. The Effects of Different Biochar Types and Rates on CP Degradation Kinetics

The degradation of CP (Figure 5) followed first-order kinetics in unamended soils and those that were amended with biochar, and the correlation coefficients were greater than 0.99 (Table 5). The degradation rate constant (k) and half-life (t1/2) was 1.22 d−1 and 0.57 d, respectively, in unamended soil, which was comparable to the findings of Gan et al., who reported t1/2 values of 1.5, 4.3, and 0.2 d in Arlington sandy loam, Carsitas loamy sand, and Waukegen silt loam, respectively [26]. The degradation rate constants in soils amended with 1% B300, B500, and B700 were 2.30, 2.44, and 4.05 d−1, respectively, and the associated half-lives were 0.30, 0.28, and 0.17 d. The soil amended with biochar showed a drastic increase in the degradation rate constant in comparison to the soil without biochar, in other words, 89% to 232%. These results indicate that biochar added to soil can accelerate the degradation of CP, and this acceleration increases with the biochar production temperature.
The degradation rate constants for soils amended with 5% B300, B500, and B700 were 3.42, 4.17, and 5.10 d−1 and the half-lives were 0.20, 0.17, and 0.14 d, respectively. The degradation rate constants for the above treatments were 1.49, 1.71, and 1.26 times higher than those for soils amended with 1% B300, B500, and B700, respectively. These results indicate that the degradation rate increased as the biochar amendment rate increased.
In unamended sterilized soil, the degradation rate constant was 0.19 d−1 and the half-life was 3.65 d. The degradation rate constant was 84% lower than that of unsterilized soil. In sterilized soils amended with 1% B300, B500, and B700, the degradation rate constants were 1.23, 0.91, and 0.93 d−1 and the half-lives were 0.56, 0.76, and 0.75 d, respectively. The degradation rate constants for sterilized soils were 86%–448% lower than those for the unsterilized soil treatments. These results indicate that biodegradation played an important role in CP degradation, and the sterilization effect on CP degradation in soil amended with biochar was greater than that in unamended soil. Gan et al. reported that biodegradation accounts for 68%–92% of CP degradation in soil [26]. The edaphon that degrade CP are composed of pseudomonades that rely on dehalogenation to generate nitromethane. The processes are as follows: Cl3CNO2 → Cl2CHNO2 → ClCH2NO2 → CH3NO2 [27], and the end products are CO2, NO3, and Cl−1. Biochar produced under a high pyrolytic temperature has numerous surface micropores and larger interior channels, which are suitable for microorganism colonization and biodegradation [28,29]. The sterilization effect on CP degradation was therefore significant in soil amended with B700. Additionally, biochars react with microbes, soil organic matter, and minerals within days of addition to soil [1]. There is a formation of organomineral phases that contain nanoparticles especially of redox active Fe and compounds with high contents of quinones/phenols that can catalyse redox reactions [30,31,32,33]. Microbes that can be involved in these redox reactions and the mineral oxide nanoparticles can break down CP through biotic and abiotic oxidation.
In addition, the degradation rate constants for sterilized soil with biochar amendment were significantly higher than those for sterilized soil without biochar and were similar to those for unamended and unsterilized soil. After sterilization at high temperatures, most of the soil microorganisms are nearly killed, and the effects of biodegradation may be ignored. The above results suggest that chemical degradation of CP occurred when soils were amended with biochar. The chemical degradation capacity of biochar was similar to the microorganism biodegradation capacity.
The fitting results of CP degradation in 0.2 g of pure biochar are shown in Figure 6. The degradation rate constants for B300, B500, and B700 were 0.04, 0.30, and 1.53 d−1 and the half-lives were 17.33, 2.31, and 0.45 d, respectively. The results indicate that biochar can degrade CP and the degradation rate constants increased as the biochar production temperature increased. This finding confirms the occurrence of a chemical reaction between CP and the biochar.

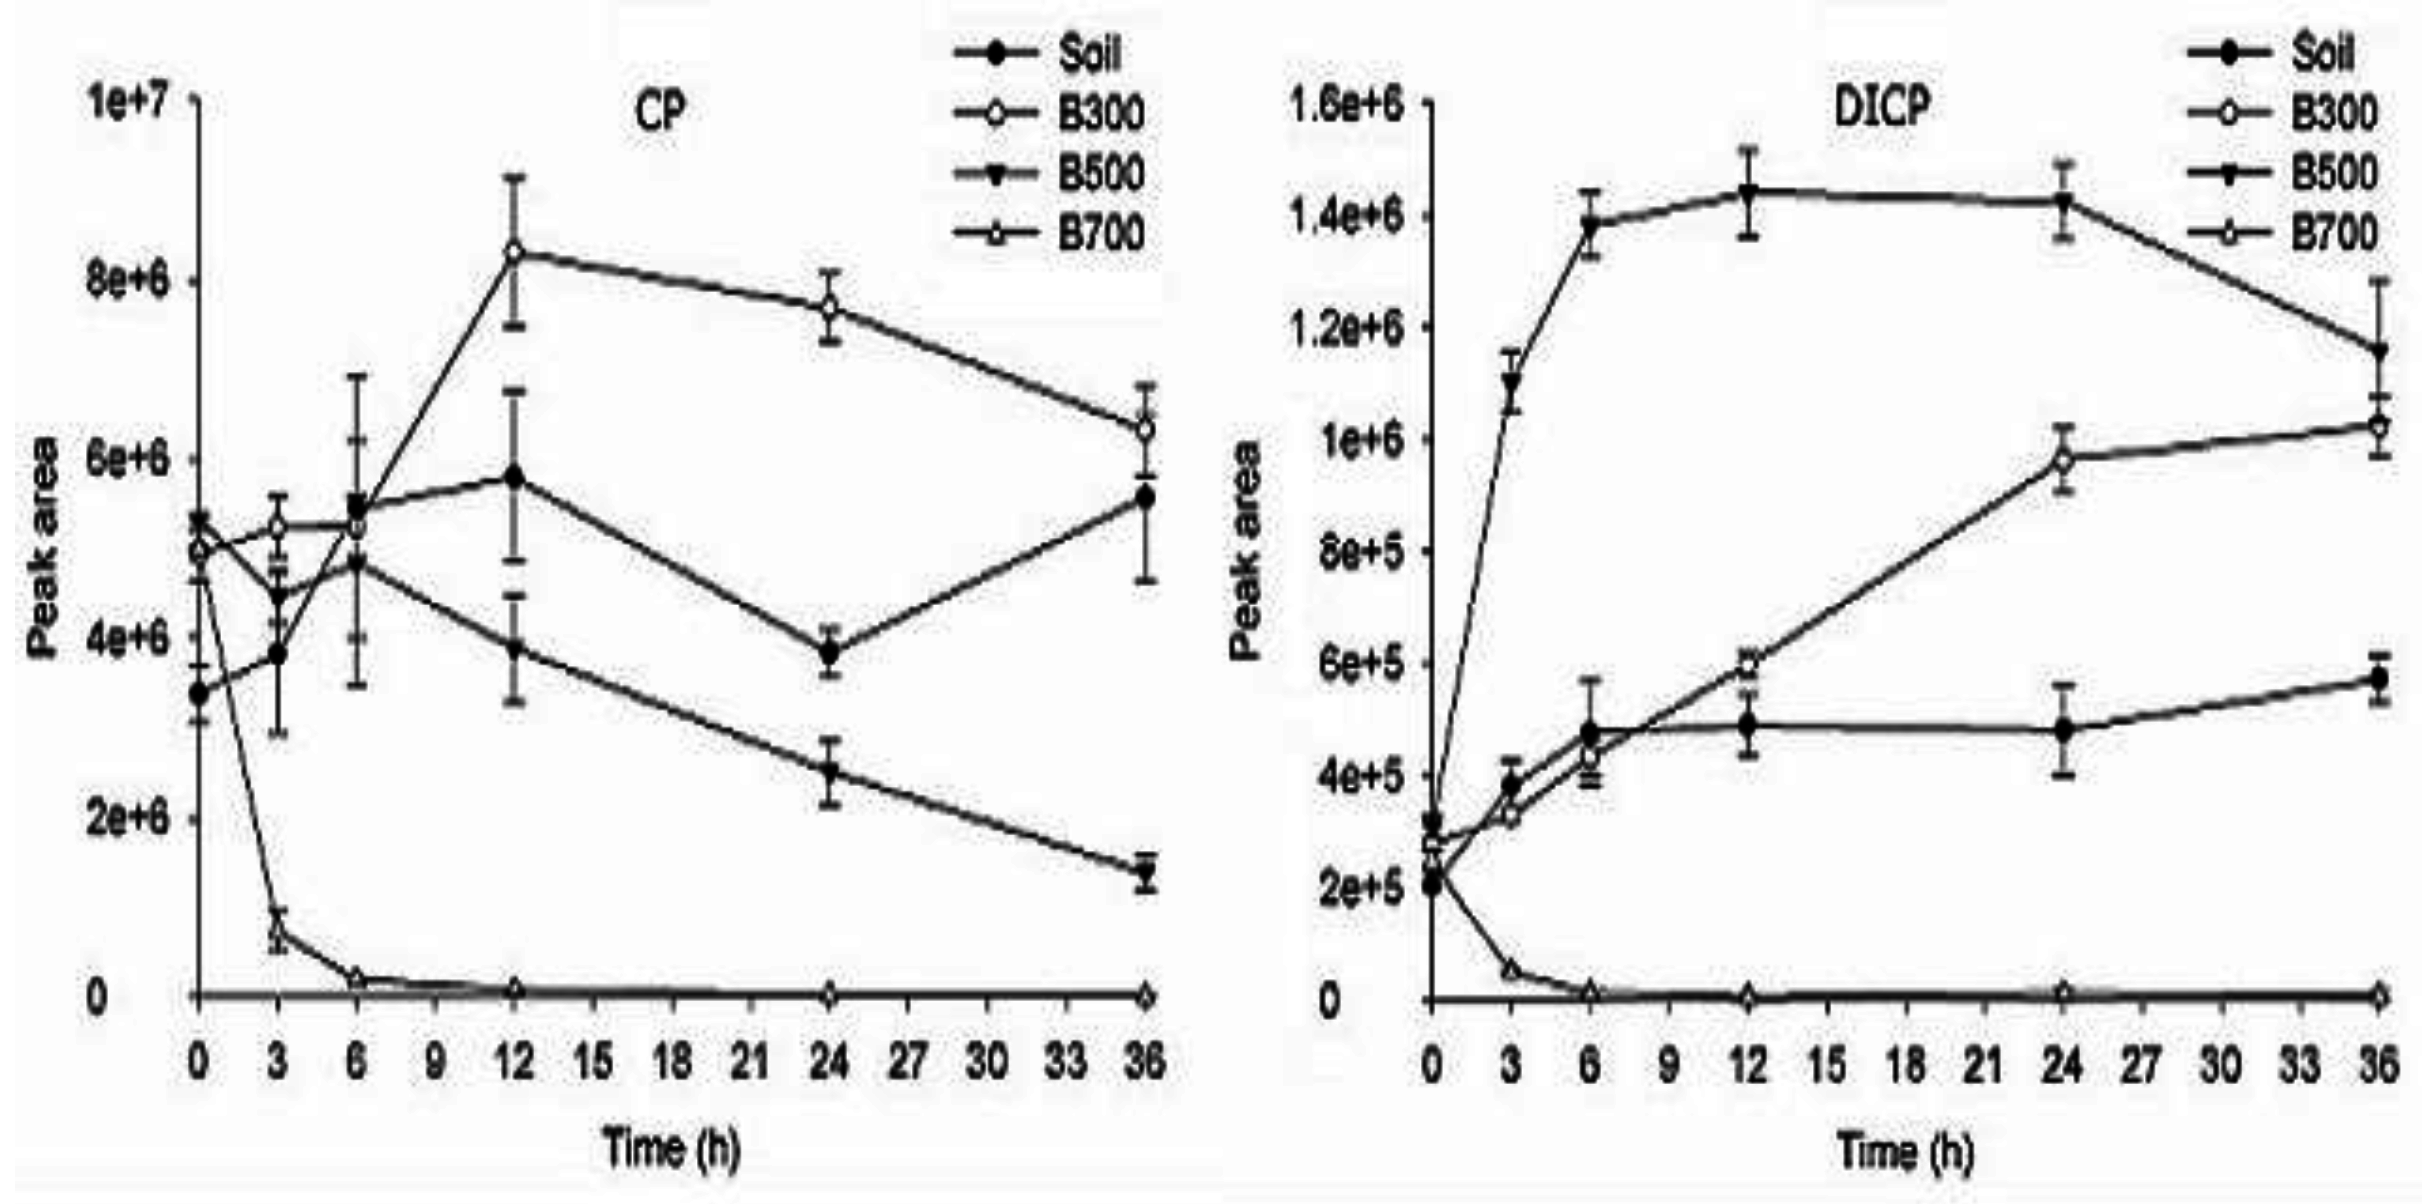
2.5. The Degradation Products of CP in Soil and Biochar

Chloropicrin and its main dechlorinated product (dichloronitromethane, DICP) were detected in soil and biochar (Figure 7). The peak areas of CP and DICP were used to express the changing concentrations. Both CP and DICP degraded much more rapidly in B700 than in the other materials. The CP degraded more rapidly in B500 than in B300 and pure soil. The difference between the CP concentration in B500 and in the soil was not significant. The DICP concentration in B500 increased up to 10 h after incubation and then decreased from 25 h after incubation; these values were considerably higher than those measured in pure soil. The DICP concentration in B300 increased over time and was higher than that measured in soil 12 h after incubation. The results showed that biochar has the ability to accelerate the dechlorination process of CP.
The dechlorination process is generally induced by radical reactions. Considerable research has been conducted on the hydroxyl-radical-induced degradation reactions of fumigants [15,34,35]. Mezyk and Cole researched the reaction process and mechanism between CP and free radicals. These authors reported that free radicals react with CP in the following chain reactions: CP + H··CCl2NO2 + H+ + Cl; CP + H··CCl3 + H+ + NO2−; CP + OH· → intermediate products →·CCl3 + ONOOH.
In the process of pyrolysis, the biochar surface forms many free radicals [16] that are generated by oxygen atoms and inorganic impurities of the feedstock [36]. The free radical content varies with pyrolytic temperature. At pyrolytic temperatures between 300 °C and 600 °C, the free radical content gradually increases and tends to maximize at 500 °C–600 °C [16,37,38]. The CP degradation rate in soil amended with B700 was, therefore, the fastest.

3. Materials and Methods

3.1. Biochar Characteristics

Clean and dry michelia alba (Magnolia denudata) wood was collected as a feedstock for biochar production. As one of many potential feedstocks, the properties of michelia alba wood are more stable, which results in consistency under different pyrolytic temperatures. The wood was sawn into small pieces (<2 cm) and charred in a muffle furnace at different temperatures (300, 500, and 700 °C) under oxygen-limited conditions for 4 h. The charred residuals were marked as B300, B500, and B700 and ground into powder using a high-speed smashing machine. The biochar powder was then passed through a 2-mm sieve.
The surface oxygen-containing functional groups were titrated using Boehm titration [39]. The surface structure was surveyed using an environment scanning electron microscope (QUANTA 200 FEG, FEI Co., Hillsboro, OR, USA). The specific surface area (SSA) and pore volume were measured using a V-Sorb 2800P surface area analyzer (Gold APP Instrument Co., Beijing, China). The contents (%) of carbon, oxygen, and hydrogen of the biochar samples were measured by elemental analyzer (Vario EL III, Elementar Analysensysteme GmbH, Hanau, Germany). The samples were placed in a muffle furnace at 900 °C for 5 h to determine the ash content.

3.2. Adsorption Kinetics

Activated carbon and 0.15 g of B300, B500, and B700 were weighed into 20-mL headspace vials. Three replicates of each type of carbon, in other words, a total of twelve vials, were placed in a container that was constructed in two stainless steel cylindrical boxes. A clear vial containing 5 mL of pure CP liquid was placed in the cylindrical boxes to form a saturated gas concentration. The cylindrical boxes were then transferred to an incubator at 30 °C. After incubating the samples for 3, 6, 12, 24, or 36 h, the cylindrical boxes were removed and placed in an airing chamber for 30 min. The CP adsorbed by the biochar was extracted using the extraction method described in the degradation experiment section.
The Lagergren pseudo-first-order kinetics equation was used to fit the data as follows:
ln (qt − qe) = ln qe − kt,
where qt is the amount of CP adsorbed at time t; qe is the calculated adsorption amount at equilibrium (mg/g), and k is the adsorption rate constant (min−1).

3.3. Adsorption Isotherm Experiment

Adsorption isotherms were determined using the headspace-gas chromatography technique [40]. Activated carbon and 0.15 g of B300, B500, and B700 were weighted into 20-mL headspace vials. Various quantities of CP were injected into small 2-ml vials to generate different gas concentrations; these vials were placed inside the 20-mL headspace vials after the addition of the biochar. The 20-mL vials were capped with an aluminum cover and a Teflon-faced rubber septum. Each treatment was repeated three times. When the CP liquid was completely volatilized, the initial gas concentrations of CP in the headspace vials were 20, 30, 40, 50, 60, 70, and 80 mg/L. The preliminary experiment showed that adsorption equilibrium was reached after 48 h in a dark incubator at 30 °C. After the samples were incubated for 48 h, the gas concentration of the vials was analyzed using gas chromatography (GC) with an electron capture detector (ECD) ECD detector and automated headspace sampler. The GC procedure was the same as the degradation experiment described, and the auto-sampler headspace conditions were as follows: 100 °C oven temperature; 105 and 110 °C loop/valve and transfer line temperatures, respectively; 1.0 mL sample loop; 5 min vial equilibration; 0.5 min loop filling; 0.05 min loop equilibration; 0.1 min pressurization; 0.5 min injection; and low shake mode for 1 min. Then, the vials were withdrawn from the headspace sampler, the aluminum covers were removed, and the vials were placed in an airing chamber for 30 min to extract the CP adsorbed by the biochar. The extraction method was similar to the degradation experiment.
The Langmuir, Freundlich, and Dubinin-Radushkevitch (D-R) models were used to describe the adsorption isotherms. The Langmuir isotherm model is described using the following equation:
q e = q m a x K L C e 1 + K L C e
where qe is the amount adsorbed per unit mass; qmax represents the maximum adsorbed concentration; the parameter kL represents the affinity constant or Langmuir constant, and Ce is the concentration in the gas phase. The equation is a measure of how strongly an adsorbate molecule is attracted to a surface.
The equation for the Freundlich isotherm is:
qe =kfCe(1/n),
This model assumes a heterogeneous adsorption surface with sites of different adsorption energies. kf represents the adsorption equilibrium constant, which indicates the adsorption capacity and represents the strength of the adsorptive bond. n is the heterogeneity factor, which represents the bond distribution. Generally, n > 1 represents favorable adsorption.
The D-R equation is expressed as:
qe = qmax exp(−kε2),
ε = RTln   ( 1 + 1 C e )
where k is a constant related to the adsorption energy (mol2/kJ2); qmax is the maximum adsorption capacity (mg/g); and ε is the Polanyi potential (J/mol). The mean free energy of adsorption (E) was calculated from the k values:
E = (2k)−(1/2),

3.4. Soil and Incubation Experiments

The sandy loam soil (2.7% clay, 30.5% silt, and 69.5% sand) was collected from the top 20 cm of soil in a cucumber greenhouse in Fangshan District, Beijing and passed through a 2-mm sieve, and the soil was stored at −80 °C until it was added to the vial. The prepared soil had a 12.5% moisture content (w/w) and the following physicochemical properties: 7.30 pH, 3.03% organic matter, and 0.20 ds/m electrical conductivity (EC).
Laboratory incubation experiments were conducted to determine the effects of different biochar types (B300, B500, and B700), rates, and soil sterilization on the degradation of CP. The preparation of soil or biochar prior to fumigant injection was as follows for each experiment:
(1) The sandy loam soil was amended with B300, B500, and B700 at rates of 1% and 5% (w/w, dry weight basis).
(2) The sandy loam soil with or without the 1% (w/w, dry weight basis) B300, B500, or B700 amendment was autoclaved at 121 °C for 1 h.
(3) Biochar (0.2 g of B300, B500, and B700) was weighed into a 20-mL glass vial. The vials with the biochar were disinfected under ultraviolet light for 30 min.
Soil (8 g) with or without biochar was placed into a 20-mL glass vial. The fumigant solution was prepared by dissolving 150 g/L of CP (99.5% purity, Dalian Dyestuffs & Chemicals Co., Ltd., Dalian, China) in ethyl acetate (AR, Sinopharm Chemical Reagent Co., Ltd., Beijing, China). Fumigant solution (5 mL) was injected into each of the above vials containing 8 g of soil or vials containing 0.2 g biochar and immediately capped with an aluminum cover and a Teflon-faced rubber septum; this led to limited oxygen conditions. The fumigant concentration in the soil was 93.75 μg/g. After treatment, the vials were inverted and placed in 30 °C incubators. Each treatment was repeated three times.
After incubation for 1, 3, 5, 7, 10, 14, 21, and 28 d, the vials were withdrawn and then immediately stored at −80 °C until the extraction of the CP residue. The residue extraction method was as follows: Anhydrous sodium sulfate (8 g; AR, Sinopharm Chemical Reagent Co., Ltd.) and 8 mL of ethyl acetate were added to each frozen vial, after which the vials were recapped immediately. The vials were vortexed for 30 s and then placed on a table concentrator for 30 min of shaking and subsequent settling for 2 h. After settling, 1–1.5 mL of supernatant was transferred into a 2-mL amber glass vial. Preliminary experiments showed that this extraction method has an extraction efficiency of 86%–95%. A gas chromatograph with a micro-ECD (GC-μECD) and HP-5 capillary column (30 m length × 320 μm × 0.25 μm film thickness) (Agilent Technologies, Santa Clara, CA, USA) was used to analyze CP. The detector and inlet temperatures were higher than 250 °C. The oven temperature was held at 60 °C for 6 min [41].
Typically, a first-order kinetics model is used in studies of pesticide degradation [42]. Therefore, we selected a first-order kinetics model to fit the degradation of CP in biochar-amended soil:
C = C0 e−kt,
where C and C0 are the concentrations in the soil at times t (d) and time t0, respectively; k is the first-order rate constant (d−1), and t is the incubation time (d).
When using first-order kinetics models, the half-life of degradation is calculated using the equation:
t 1 / 2 = 0.693 k
The first-order kinetics model was fit using Origin Pro 8.0 software.

3.5. The Degradation Products of CP in Biochar and Soil

The biochars and soil (1 g of each) were placed in 20-mL headspace vials. Fumigant solution (5 μL, i.e., 150 g/L of CP in ethyl acetate) was injected into each vial, which was immediately capped with an aluminum cover and a Teflon-faced rubber septum. Each treatment was repeated three times. The vials were then transferred to 30 °C incubators. After incubation for 3, 6, 12, 24, and 36 h, the samples were withdrawn from the incubators and immediately stored at −80 °C until the extraction of the CP residue and its degradation products. The extraction method was similar to that used in the degradation experiment except that 5 mL of ethyl acetate was used instead of 8 mL. A GC-MS (Agilent 7890A, Agilent Technologies, Santa Clara, CA, USA) equipped with a split/splitless injection port and a 5975C mass selective detector was used to determine CP and its degradation products. A DB-5MS (30 m × 0.25 mm ID × 0.25 μm film thickness) column (Agilent Technologies, Santa Clara, CA, USA) was used to separate the chemicals, and the flow rate of the carrier gas with helium (99.999%) was 0.8 mL/min. The temperature of the injection port was held constant at 250 °C, and the splitless mode started 1 min after injection. The primary oven was held constant at 40 °C for 4 min and then increased to 150 °C by 15 °C/min, followed by a rate of 30 °C/min until a temperature of 250 °C was reached. The quadrupole, ion source, and transfer line temperatures were 150 °C, 230 °C, and 280 °C, respectively. Electron impact ionization (EI, Agilent Technologies, Santa Clara, CA, USA) with an energy of 70 eV and electron multiplier voltage of 1494 V was used. The full scan mode, with a scan range of 50–250 m/z and a solvent delay of 3.6 min, was used to obtain the MS spectrum. The MSD Productivity ChemStation software (Version E.02.00.493, Agilent Technologies, Santa Clara, CA, USA) was used to control the instrument and collect data.

4. Conclusions

In summary, biochar produced under different pyrolytic temperatures exhibited variable characteristics. Under high pyrolytic temperatures, biochar possesses larger SSA and pore volume and more micropores. These characteristics resulted in different adsorption rates of CP to biochar. The adsorption isotherm fitted the Freundlich model very well, and the kf value indicated the following adsorption capacity trend: B700 > B500 > B300. However, the actual measurements indicated that there was no significant difference between the three biochars because biochar produced under higher temperature has a high adsorption capacity and possesses a strong CP degradation ability. When biochar was added to soil, it greatly shortened the degradation half-life of chloropicrin. Degradation of CP further accelerated as the rate of addition and pyrolytic temperature of the biochar increased. The ability of biochar to adsorb CP could, therefore, not reduce the degradation rate of CP in biochar-amended soil. The mechanisms by which biochar accelerated the degradation of CP were shown through the detection of degradation products and could likely be attributed to free radical chemical reactions and microbial processes. The findings in the present study show that biochar amendments to soil are beneficial but can decrease the effect of CP on soil-born pests as a fumigant by accelerating degradation. The atmospheric emission of CP is an air pollutant that can cause severe irritation of the eyes, mucous membranes, skin, and lungs, and plays a role in forming tropospheric ozone [43]. Therefore, reducing CP emissions is crucial for protection against the harmful nature of CP. The present study showed that soil amendment with biochar is a promising method to reduce CP emissions. Further testing on the CP efficacy and emission reduction by biochar needs to be conducted in field experiments.

Author Contributions

Pengfei Liu and Qiuxia Wang designed the study and wrote the protocol. Wensheng Fang and Liangang Mao carried out to determinate the biochar characteristics. Pengfei Liu, Wensheng Fang, Dongdong Yan, and Liangang Mao performed most experiments. Pengfei Liu, Canbin Ouyang, Yuan Li, and Meixia Guo managed the literature searches and analyses. Pengfei Liu, Qiuxia Wang, and Dong Wang analyzed the data. Pengfei Liu, Qiuxia Wang, and Aocheng Cao were responsible for the overall design and wrote the article.

Conflicts of Interest

The authors declare no competing financial interests.

References

  1. Downie, A.; Crosky, A.; Munroe, P. Physical properties of biochar. In Biochar for Environmental Management: Science & Technology; Lehmann, J., Joseph, S., Eds.; Earthscan: London, UK, 2009; Chapter 2; pp. 13–32. [Google Scholar]
  2. Novak, J.M.; Busscher, W.J.; Laird, D.L.; Ahmedna, M.; Watts, D.W.; Niandou, M.A.S. Impact of biochar amendment on fertility of a southeastern Coastal Plain soil. Soil Sci. 2009, 174, 105–112. [Google Scholar] [CrossRef]
  3. Uchimiya, M.; Lima, I.; Klasson, K.; Wartelle, L. Contaminant immobilization and nutrient release by biochar soil amendment: Roles of natural organic matter. Chemosphere 2010, 80, 935–940. [Google Scholar] [CrossRef] [PubMed]
  4. Karami, N.; Clemente, R.; Moreno-Jiménez, E.; Lepp, N.W.; Beesley, L. Efficiency of green waste compost and biochar soil amendments for reducing lead and copper mobility and uptake to ryegrass. J. Hazard. Mater. 2011, 191, 41–48. [Google Scholar] [CrossRef] [PubMed]
  5. Chan, K.Y.; Van Zwieten, L.; Meszaros, I.; Downie, A.; Joseph, S. Using poultry litter biochars as soil amendments. Soil Res. 2008, 46, 437–444. [Google Scholar] [CrossRef]
  6. Liang, B.; Lehmann, J.; Solomon, D.; Kinyangi, J.; Grossman, J.; O’Neill, B.; Skjemstad, J.O.; Thies, J.; Luizão, F.J.; Petersen, J.; et al. Black carbon increases cation exchange capacity in soils. Soil Sci. Soc. Am. J. 2006, 70, 1719–1730. [Google Scholar] [CrossRef]
  7. Laird, D.A. The charcoal vision: A win–win–win scenario for simultaneously producing bioenergy, permanently sequestering carbon, while improving soil and water quality. Agron. J. 2008, 100, 178–181. [Google Scholar] [CrossRef]
  8. Case, S.D.; McNamara, N.P.; Reay, D.S.; Whitaker, J. The effect of biochar addition on N2O and CO2 emissions from a sandy loam soil—The role of soil aeration. Soil Biol. Biochem. 2012, 51, 125–134. [Google Scholar] [CrossRef]
  9. Yang, Y.; Sheng, G.; Huang, M. Bioavailability of diuron in soil containing wheat-straw-derived char. Sci. Total Environ. 2006, 354, 170–178. [Google Scholar] [CrossRef] [PubMed]
  10. Zhang, P.; Sheng, G.; Wolf, D.C.; Feng, Y. Reduced biodegradation of benzonitrile in soil containing wheat-residue-derived ash. J. Environ. Qual. 2004, 33, 868–872. [Google Scholar] [CrossRef] [PubMed]
  11. Jones, D.L.; Edwards-Jones, G.; Murphy, D.V. Biochar mediated alterations in herbicide breakdown and leaching in soil. Soil Biol. Biochem. 2011, 43, 804–813. [Google Scholar] [CrossRef]
  12. Jablonowski, N.D.; Krutz, J.L.; Martinazzo, R.; Zajkoska, P.; Hamacher, G.; Borchard, N.; Burauel, P. Transfer of atrazine degradation capability to mineralize aged 14C-labeled atrazine residues in soils. J. Agric. Food Chem. 2013, 61, 6161–6166. [Google Scholar] [CrossRef] [PubMed]
  13. Harris, D.C. Control of Verticillium wilt and other soil-borne diseases of strawberry in Britain by chemical soil disinfestation. J. Hortic. Sci. Biotechnol. 1990, 65, 401–408. [Google Scholar] [CrossRef]
  14. Johnson, M.O.; Godfrey, G.H. Chloropicrin for nematode control. Ind. Eng. Chem. 1932, 24, 311–313. [Google Scholar] [CrossRef]
  15. Cole, S.K.; Cooper, W.J.; Fox, R.V.; Gardinali, P.R.; Mezyk, S.P.; Mincher, B.J.; O’Shea, K.E. Free radical chemistry of disinfection byproducts. 2. Rate constants and degradation mechanisms of trichloronitromethane (chloropicrin). Environ. Sci. Technol. 2007, 41, 863–869. [Google Scholar] [CrossRef] [PubMed]
  16. Bourke, J.; Manley-Harris, M.; Fushim, C.; Dowaki, K.; Nunoura, T.; Antal, M.J. Do all carbonized charcoals have the same chemical structure? 2. A model of the chemical structure of carbonized charcoal. Ind. Eng. Chem. Res. 2007, 46, 5954–5967. [Google Scholar] [CrossRef]
  17. Gaskin, J.W.; Steiner, C.; Harris, K.; Das, K.C.; Bibens, B. Effect of low-temperature pyrolysis conditions on biochar for agricultural use. Trans. ASABE 2008, 51, 2061–2069. [Google Scholar] [CrossRef]
  18. Mohan, D.; Rajput, S.; Singh, V.K.; Steele, P.H.; Pittman, C.U., Jr. Modeling and evaluation of chromium remediation from water using low cost bio-char, a green adsorbent. J. Hazard. Mater. 2011, 188, 319–333. [Google Scholar] [CrossRef] [PubMed]
  19. Keiluweit, M.; Nico, P.S.; Johnson, M.G.; Kleber, M. Dynamic molecular structure of plant biomass-derived black carbon (biochar). Environ. Sci. Technol. 2010, 44, 1247–1253. [Google Scholar] [CrossRef] [PubMed]
  20. Raveendran, K.; Ganesh, A.; Khilar, K.C. Pyrolytic characteristics of biomass and biomass components. Fuel 1996, 75, 987–998. [Google Scholar] [CrossRef]
  21. Yang, H.; Yan, R.; Chen, H.; Lee, D.H.; Zheng, C. Characteristics of hemicellulose, cellulose and lignin pyrolytic. Fuel 2007, 86, 1781–1788. [Google Scholar] [CrossRef]
  22. Chun, Y.; Sheng, G.; Chiou, C.; Xing, B. Compositions and sorptive properties of crop residue-derived chars. Environ. Sci. Technol. 2004, 38, 4649–4655. [Google Scholar] [CrossRef] [PubMed]
  23. Samsuri, A.W.; Sadegh-Zadeh, F.; Seh-Bardan, B.J. Characterization of biochars produced from oil palm and rice husks and their adsorption capacities for heavy metals. Int. J. Environ. Sci. Technol. 2014, 11, 967–976. [Google Scholar] [CrossRef]
  24. Chen, B.; Zhou, D.; Zhu, L. Transitional adsorption and partition of nonpolar and polar aromatic contaminants by biochars of pine needles with different pyrolytic temperatures. Environ. Sci. Technol. 2008, 42, 5137–5143. [Google Scholar] [CrossRef] [PubMed]
  25. Lehmann, J. Bio-energy in the black. Front. Ecol. Environ. 2007, 5, 381–387. [Google Scholar] [CrossRef]
  26. Gan, J.; Yates, S.R.; Ernst, F.F.; Jury, W.A. Degradation and volatilization of the fumigant chloropicrin after soil treatment. J. Environ. Qual. 2000, 29, 1391–1397. [Google Scholar] [CrossRef]
  27. Castro, C.E.; Wade, R.S.; Belser, N.O. Biodehalogenation. The metabolism of chloropicrin by Pseudomonas sp. J. Agric. Food Chem. 1983, 31, 1184–1187. [Google Scholar] [CrossRef]
  28. Steinbeiss, S.; Gleixner, G.; Antonietti, M. Effect of biochar amendment on soil carbon balance and soil microbial activity. Soil Biol. Biochem. 2009, 41, 1301–1310. [Google Scholar] [CrossRef]
  29. Lehmann, J.; Rillig, M.C.; Thies, J.; Masiello, C.A.; Hockaday, W.C.; Crowley, D. Biochar effects on soil biota—A review. Soil Biol. Biochem. 2011, 43, 1812–1836. [Google Scholar] [CrossRef]
  30. Joseph, S.D.; Camps-Arbestain, M.; Lin, Y.; Munroe, P.; Chia, C.H.; Hook, J.; van Zwieten, L.; Kimber, S.; Cowie, A.; Singh, B.P.; et al. An investigation into the reactions of biochar in soil. Soil Res. 2010, 48, 501–515. [Google Scholar] [CrossRef]
  31. Joseph, S.; Husson, O.; Graber, E.R.; Donne, S.W. The electrochemical properties of biochars and how they affect soil redox properties and processes. Agronomy 2015, 5, 322–340. [Google Scholar] [CrossRef] [Green Version]
  32. Graber, E.R.; Tsechansky, L.; Lew, B.; Cohen, E. Reducing capacity of water extracts of biochars and their solubilization of soil Mn and Fe. Eur. J. Soil Sci. 2014, 65, 162–172. [Google Scholar] [CrossRef]
  33. Mukome, F.N.D.; Kilcoyne, A.L.D.; Parikh, S.J. Alteration of biochar carbon chemistry during soil incubations: SR-FTIR and NEXAFS investigation. Soil Sci. Soc. Am. J. 2014, 78, 1632–1640. [Google Scholar] [CrossRef]
  34. Swancutt, K.L.; Dail, M.K.; Mezyk, S.P.; Ishida, K.P. Absolute kinetics and reaction efficiencies of hydroxyl-radical-induced degradation of methyl isothiocyanate (MITC) in different quality waters. Chemosphere 2010, 81, 339–344. [Google Scholar] [CrossRef] [PubMed]
  35. Mezyk, S.P.; Helgeson, T.; Cole, S.K.; Cooper, W.J.; Fox, R.V.; Gardinali, P.R.; Mincher, B.J. Free radical chemistry of disinfection-byproducts. 1. Kinetics of hydrated electron and hydroxyl radical reactions with halonitromethanes in water. J. Phys. Chem. A 2006, 110, 2176–2180. [Google Scholar] [CrossRef] [PubMed]
  36. Brennan, J.K.; Bandosz, T.J.; Thomson, K.T.; Gubbins, K.E. Water in porous carbons. Colloid Surf. A 2001, 187, 539–568. [Google Scholar] [CrossRef]
  37. Feng, J.W.; Zheng, S.; Maciel, G.E. EPR investigations of the effects of inorganic additives on the charring and char/air interactions of cellulose. Energy Fuels 2004, 18, 1049–1065. [Google Scholar] [CrossRef]
  38. Emmerich, F.G.; Rettori, C.; Luengo, C.A. ESR in heat treated carbons from the endocarp of babassu coconut. Carbon 1991, 29, 305–311. [Google Scholar] [CrossRef]
  39. Boehm, H.P. Some aspects of the surface chemistry of carbon blacks and other carbons. Carbon 1994, 32, 759–769. [Google Scholar] [CrossRef]
  40. Wu, J.; Strömqvist, M.E.; Claesson, O.; Fängmark, I.E.; Hammarström, L.G. A systematic approach for modelling the affinity coefficient in the Dubinin–Radushkevich equation. Carbon 2002, 40, 2587–2596. [Google Scholar] [CrossRef]
  41. Wang, Q.X.; Wang, D.; Tang, J.T.; Yan, D.D.; Zhang, H.J.; Wang, F.Y.; Guo, M.X.; Cao, A.C. Gas-phase distribution and emission of chloropicrin applied in gelatin capsules to soil columns. J. Environ. Qual. 2010, 39, 917–922. [Google Scholar] [CrossRef] [PubMed]
  42. Ma, Q.L.; Gan, J.; Papiernik, S.K.; Becker, J.O.; Yates, S.R. Degradation of soil fumigants as affected by initial concentration and temperature. J. Environ. Qual. 2001, 30, 1278–1286. [Google Scholar] [CrossRef] [PubMed]
  43. Goldman, L.R.; Mengle, D.; Epstein, D.M.; Fredson, D.; Kelly, K.; Jackson, R.J. Acute symptoms in persons residing near a field treated with the soil fumigants methyl bromide and chloropicrin. West. J. Med. 1987, 147, 95–98. [Google Scholar] [PubMed]
Figure 1. SEM images of biochars under different pyrolytic temperatures. B300 is shown in (A,B); B500 is shown in (C,D); and B700 is shown in (E,F). (A,C,E) are magnified 2000× and (B,D,F) are magnified 5000×.
Energies 09 00869 g001
Figure 2. The fitting curve of adsorption kinetics using the Lagergren pseudo-first-order model.
Energies 09 00869 g002
Figure 3. The fitting curve of the adsorption isotherm using Freundlich and Langmuir equations.
Energies 09 00869 g003
Figure 4. The fitting curve of the adsorption isotherm using Dubinin-Radushkevitch (D-R) models.
Energies 09 00869 g004
Figure 5. Degradation trend of CP in soil amended with different biochar types, (A) was 1% biochar content and (B) was 5%.
Energies 09 00869 g005
Figure 6. Fitting curves of the CP degradation in biochar produced under different temperatures. The first-order kinetics model was used to fit degradation data.
Energies 09 00869 g006
Figure 7. CP and dichloronitromethane (DICP) concentrations in soil and biochar. The peak areas of CP and DICP were used to express the changing concentrations. The significant difference of values in each biochar was determined using a 95% confidence interval around the estimates (p < 0.05). The CP in B500 and soil was not significantly different, but there was a significant difference in B300 and B700. The differences of DICP were considered significant in different biochar and soil.
Energies 09 00869 g007
Table 1. Characteristics of biochar produced at different temperatures.
TypesOxygen-Containing Functional Groups
Carboxyl (mmoL/g)Phenol Hydroxyl (mmoL/g)Lactones (mmoL/g)
B3000.37 ± 0.03 1 a0.01 ± 0.001 a 20.56 ± 0.01 a
B5000.29 ± 0.01 b0.32 ± 0.01 b0.44 ± 0.01 b
B7000.26 ± 0.01 b0.39 ± 0.01 c0.47 ± 0.03 b
Elemental composition
Carbon (mol %)Hydrogen (mol %)Nitrogen (mol %)Oxygen (mol %)(O + N)/C 3O/CH/C
B30067.97 a2.68 a (B500)0.94 a24.28 a0.370.360.04
B50076.17 b2.36 b (B300)0.99 b14.35 b0.200.190.04
B70083.55 c1.62 c0.97 c6.58 c0.090.080.01
SSA, pore size and ash content
SSA (m2/g) 4BJH pore size (nm)Pore volume (cm3/g)Ash content (%)pH (1:2.5)
B3001.8115.590.000344.62 ± 0.01 a7.42 ± 0.05 a
B50068.365.340.025.86 ± 0.14 b9.39 ± 0.08 b
B700364.634.350.137.74 ± 0.01 c10.14 ± 0.11 c
1 Data were expressed as means ± S.E. (n = 3); 2 The difference was analyzed by ANOVA based on Duncan multiple comparison (p < 0.05); 3 H/C: atomic ratio of hydrogen to carbon. O/C: atomic ratio of oxygen to carbon. (O + N)/C: atomic ratio of the sum of nitrogen and oxygen to carbon; 4 The specific surface area (SSA) of biochar was measured using the BET-N2 method. The pore volume and pore diameter were calculated under an absorption capacity with a relative pressure of 0.99 and the Barrett-Joyner-Halendar (BJH) method, respectively.
Table 2. Fitting results of adsorption kinetics of biochar for chloropicrin (CP).
Biochar Typeqe (mg/g)k (min−1)R2
B30023.810.010.98 1
B50025.720.070.87
B70026.030.240.74
AC176.860.270.88
1 The adsorption kinetics was fitted by Lagergren pseudo-first-order kinetics equation.
Table 3. Fitting results of different adsorption isotherm models 1.
Biochar TypeLangmuirFreundlichD-R
qmaxkLR2kfnR2qmaxER2
B3000.510.0040.820.261.10.824.790.290.67
B5002.240.10.860.5330.931.730.490.58
B7001.971.640.921.15.040.941.813.780.82
1 The adsorption isotherms employed the Langmuir, Freundlich, and Dubinin-Radushkevitch (D-R) models to describe the adsorption capacity of biochar. Compared with other equations, the Freundlich equation provided the best degree of fit.
Table 4. The fate of CP after application to the biochars.
Biochar TypesApplied Amount (mg)Amount in Gas Phase (mg)Amount in Biochar (mg)Degradation Amount (mg)Degradation Ratio (%)Average Degradation Ratio (%)
B3000.40.11 ± 0.003 10.22 ± 0.010.07 ± 0.0116.9217.46 a 2
0.60.2 ± 0.010.31 ± 0.0020.09 ± 0.0115.36
0.80.3 ± 0.050.43 ± 0.020.07 ± 0.018.72
10.25 ± 0.180.55 ± 0.050.2 ± 0.0220.46
1.20.43 ± 0.030.54 ± 0.040.23 ± 0.0519.52
1.40.48 ± 0.020.57 ± 0.030.35 ± 0.0125.01
1.60.49 ± 0.040.85 ± 0.080.26 ± 0.0416.26
B5000.40.11 ± 0.010.16 ± 0.030.13 ± 0.0433.2425.65 b
0.60.22 ± 0.0050.17 ± 0.0030.21 ± 0.00535.58
0.80.33 ± 0.050.18 ± 0.0060.29 ± 0.0536.13
10.59 ± 0.060.27 ± 0.0020.14 ± 0.0614.23
1.20.63 ± 0.150.25 ± 0.010.32 ± 0.1426.84
1.40.87 ± 0.060.27 ± 0.020.26 ± 0.0718.66
1.61.06 ± 0.090.3 ± 0.0050.24 ± 0.0814.86
B7000.40.003 ± 0.00040.08 ± 0.020.32 ± 0.0280.1359.35 c
0.60.02 ± 0.0040.17 ± 0.0020.41 ± 0.00668.53
0.80.08 ± 0.0050.22 ± 0.010.5 ± 0.0163.10
10.13 ± 0.010.28 ± 0.010.59 ± 0.0258.68
1.20.30 ± 0.100.28 ± 0.0060.62 ± 0.1051.38
1.40.44 ± 0.060.27 ± 0.010.69 ± 0.0749.36
1.60.57 ± 0.080.32 ± 0.010.71 ± 0.0844.29
1 Data were expressed as mean ± S.E. (n = 3); 2 The data was analyzed using univariate analyses based on the Duncan multiple comparison and differences were considered significant in different biochars at p < 0.05.
Table 5. Fitting results of CP degradation in different biochar-amended soils using a first-order model.
Treatmentk (d−1)t1/2 (d)R2
Soil (CK)1.22 ± 0.02 10.57>0.99
Soil + 1% B3002.30 ± 0.07 0.30>0.99
Soil + 1% B5002.44 ± 0.05 0.28>0.99
Soil + 1% B7004.05 ± 0.210.17>0.99
Soil + 5% B3003.42 ± 0.150.20>0.99
Soil + 5% B5004.17 ± 0.320.17>0.99
Soil + 5% B7005.10 ± 0.490.14>0.99
Sterilized soil0.19 ± 0.013.650.98
Sterilized soil + 1% B3001.23 ± 0.020.56>0.99
Sterilized soil + 1% B5000.91 ± 0.030.76>0.99
Sterilized soil + 1% B7000.93 ± 0.030.75>0.99
1 Data were expressed as mean ± S.E. (n = 3). The significant difference of values of k for each group was determined using a 95% confidence interval around the estimates (p < 0.05).

