Article

Investigation the Influence of Different Salts on the Degradation of Organic Dyes Using Non-Thermal Plasma

by
Ahmed El-Tayeb
1,2,*,
Ahmed H. El-Shazly
2 and
Marwa F. Elkady
2,3
1
Electric Engineering Department, Faculty of Energy Engineering, Aswan University, Aswan 81528, Egypt
2
Chemical and Petrochemicals Engineering Department, Egypt-Japan University of Science and Technology, New Borg El-Arab City, Alexandria 21934, Egypt
3
Fabrication Technology Department, Advanced Technology and New Materials Research Institute (ATNMRI), City of Scientific Research and Technology Applications (SRTA City), Alexandria 21934, Egypt
*
Author to whom correspondence should be addressed.
Energies 2016, 9(11), 874; https://doi.org/10.3390/en9110874
Submission received: 28 July 2016 / Revised: 16 October 2016 / Accepted: 20 October 2016 / Published: 26 October 2016

Abstract

:
In dye decolorization tests a non-thermal plasma (NTP) corona discharge generated by a high voltage pin-to-ground plate displayed 82% color removal within 11 min. Total color removal was accomplished after 28 min. Different salts such as KCl, NaCl, CaCl2 and AlCl3 were utilized to check the influence of conductivity changes on the dye decolorization process. Higher dye solution conductivity improved the color removal efficiency. The discharge energy and degradation efficiency were computed for diverse concentrations for NaCl, KCl, CaCl2 and AlCl3, whereby it was noticed that the salts generally have a small impact on the level of dye decolorization using corona discharge. In addition, the essential reactive species involved in the oxidation of organic dye compounds such as ozone (O3) generated in treated water and hydrogen peroxide (H2O2) were investigated and the energetic species that produced the non-thermal plasma at the optimum operation time were determined. Energy yields for decolorization and Electrical Energy per Order (EE/O) were calculated for different concentrations of NaCl, KCl, CaCl2 and AlCl3. This work may help in designing plasma systems appropriate for treatment of industrial wastewaters polluted by dyes.

1. Introduction

Contamination in wastewaters created during manufacturing process is a very serious issue around the planet, and particularly in Egypt. In regular water treatment systems, wastewater might be filtered utilizing organic membranes or mixed treatment strategies can be used. In the old-style treatment methods waters, may be treated by either chemical or biological methods. These techniques often have some issues like the duration and cost of treatment, the requirement for big facilities, and the existence of some pollutants that are not easily degraded. Therefore, the implementation of advanced unconventional water-treatment tools that can resolve these difficulties is vital. The best solution is an ozone treatment system [1]. There are a variety of ways to generate non-thermal plasmas which include dielectric barrier discharge (DBD), RF, and corona discharge. Corona discharge is considered a problem in power transmission applications, due to the losses caused and the generation of radio interference in high voltage transmission lines and equipment, but on the other hand corona discharges in gases have found many practical applications, for example in plasma reactors, electrophotography, electrostatic separation, cold plasma chemistry, air pollution control, electrostatic printing, etc. In many of these applications multipoint discharge electrodes of different shapes and configurations are utilized. Dielectric barrier discharge (DBD) is the most common method used for non-thermal plasma generation. These discharges from the surface have a random origination and are composed of micro- discharges in the gap. The prevention of sparks is a major advantage for DBD; however, there is also a risk of the dielectric material depositing onto the substrate being process or interacting with the sample and thus contaminating it. The addition of the dielectric material complicates the reactor design. The main benefit of capturing the charged species is a reduction in the chemical reactions on the surface. Another drawback the equipment is more expensive and adds additional layers of potential failure points to the system. Ozone can be created with an extensive variety of anode and release designs; the most prominent is DBD. Corona discharges can generate O radicals (and thus ozone) with very great energy content. A corona discharge is a high voltage, DC or AC plasma source that creates micro-arcs using ambient air. The needed equipment is easily constructed and does not require vacuum or pump-down time. Most industrial corona discharge sustems consist of a thin wire or some other sharp point that is connected to a high voltage source (10 kV or higher). The voltage provided to the wire is higher than the breakdown electric field of the surrounding gas and thus produces an active coronal region of a certain radius, the electric field drops below the breakdown voltage of the gas and the corona ceases to exist with the exception of ions that may carry the current to surrounding walls or electrodes. Ultraviolet (UV) radiation is also present outside the active region of the corona discharge. Most corona DC discharges are generated from positive voltage due to beading instabilities associated with negative potentials, however alternating voltage (AC) leads to sequential waves of positive and negative ions. The disadvantages of corona discharges include the necessity for high voltages, radiofrequency interference, and acoustic noise. Additionally, corona discharges can easily form streamers, destructive regions of high current, particularly in humid air, causing electrical sparking that can damage substrate materials. The ionization process takes place only locally (due to the non-homogenous electric field) due to the great difference in mass between electrons and positively charged ions resulting in only the electrons having the ability to undergo a significant degree of ionizing inelastic collisions at ambient temperatures and pressures. Although there is a very extensive background on electrical discharges, the corona plasma technique for pollution emission control is still a very young interdisciplinary subject. In relation to chemical reactions and discharge physics, the knowledge is very limited and there are not sufficient physical and chemical data to model the process. It is also very hard to predict the final byproducts. Generally speaking, the main function of corona plasmas in pollution control is to convert one kind of compound into another one, which may be more easily handled. Although corona electrical discharges are well known and have been intensely studied for their technological applications (electrophotography, electroprecipitation, etc.) papers about the effect of coronas on organic matter are recent and scarce. Yang [2] and Mok [3] reported that the phenol removal rate increased with longer release time and that raising the peak voltage was helpful for phenol degradation. They clarified that voltage development could expand the electric field intensity distribution, creating larger amounts of diverse radicals and active species. The liberation of these species in water produces hydroxyl radicals (OH) and hydrogen atoms (H) from water molecules. Under humid conditions an air corona discharge creates ozone (O3), singlet oxygen (O), hydrogen peroxide (H2O2) and hydroperoxyl radical (HO2) with more capability of oxidizing phenol into lower atomic weight species like carboxylic acids or carbon dioxide. Additionally, Njatawidjaja [4] proposed that H2O2 and O3 were delivered with air or oxygen bubbles in the reactors, showing the vital role of active radicals in contaminant disintegration reactions. Numerous studies have reported that ozone is created during the plasma treatment process, and the UV radiation could also enhance the disintegration of organic pollutants by O3 and OH. Dojcinovic [5] considered the oxidation of different contaminant materials with DBD plasma and reached the conclusion that degradation routes practical strategies for the feasible elimination of these contaminants can be developed, and around 10 color categories from 13 type of dyes could be destroyed by 95%. The objective of this investigation was to study the utilization of NTP discharges to produce active radicals as a basis for a special industrial wastewater treatment processes. Experimental estimations were done to focus on the impact of the concentration of diverse salts on the efficiency of the dye decolorization process in the presence of NTP discharges. In addition, the essential reactive species which are responsible for the oxidation of organic dye compounds such as O3 generated in treated water and H2O2 were investigated.

2. Materials and Methods

2.1. Dye Solutions

The physical properties and chemical structure of the Acid Blue 25 dye used in our experiments are given in Table 1 [6].

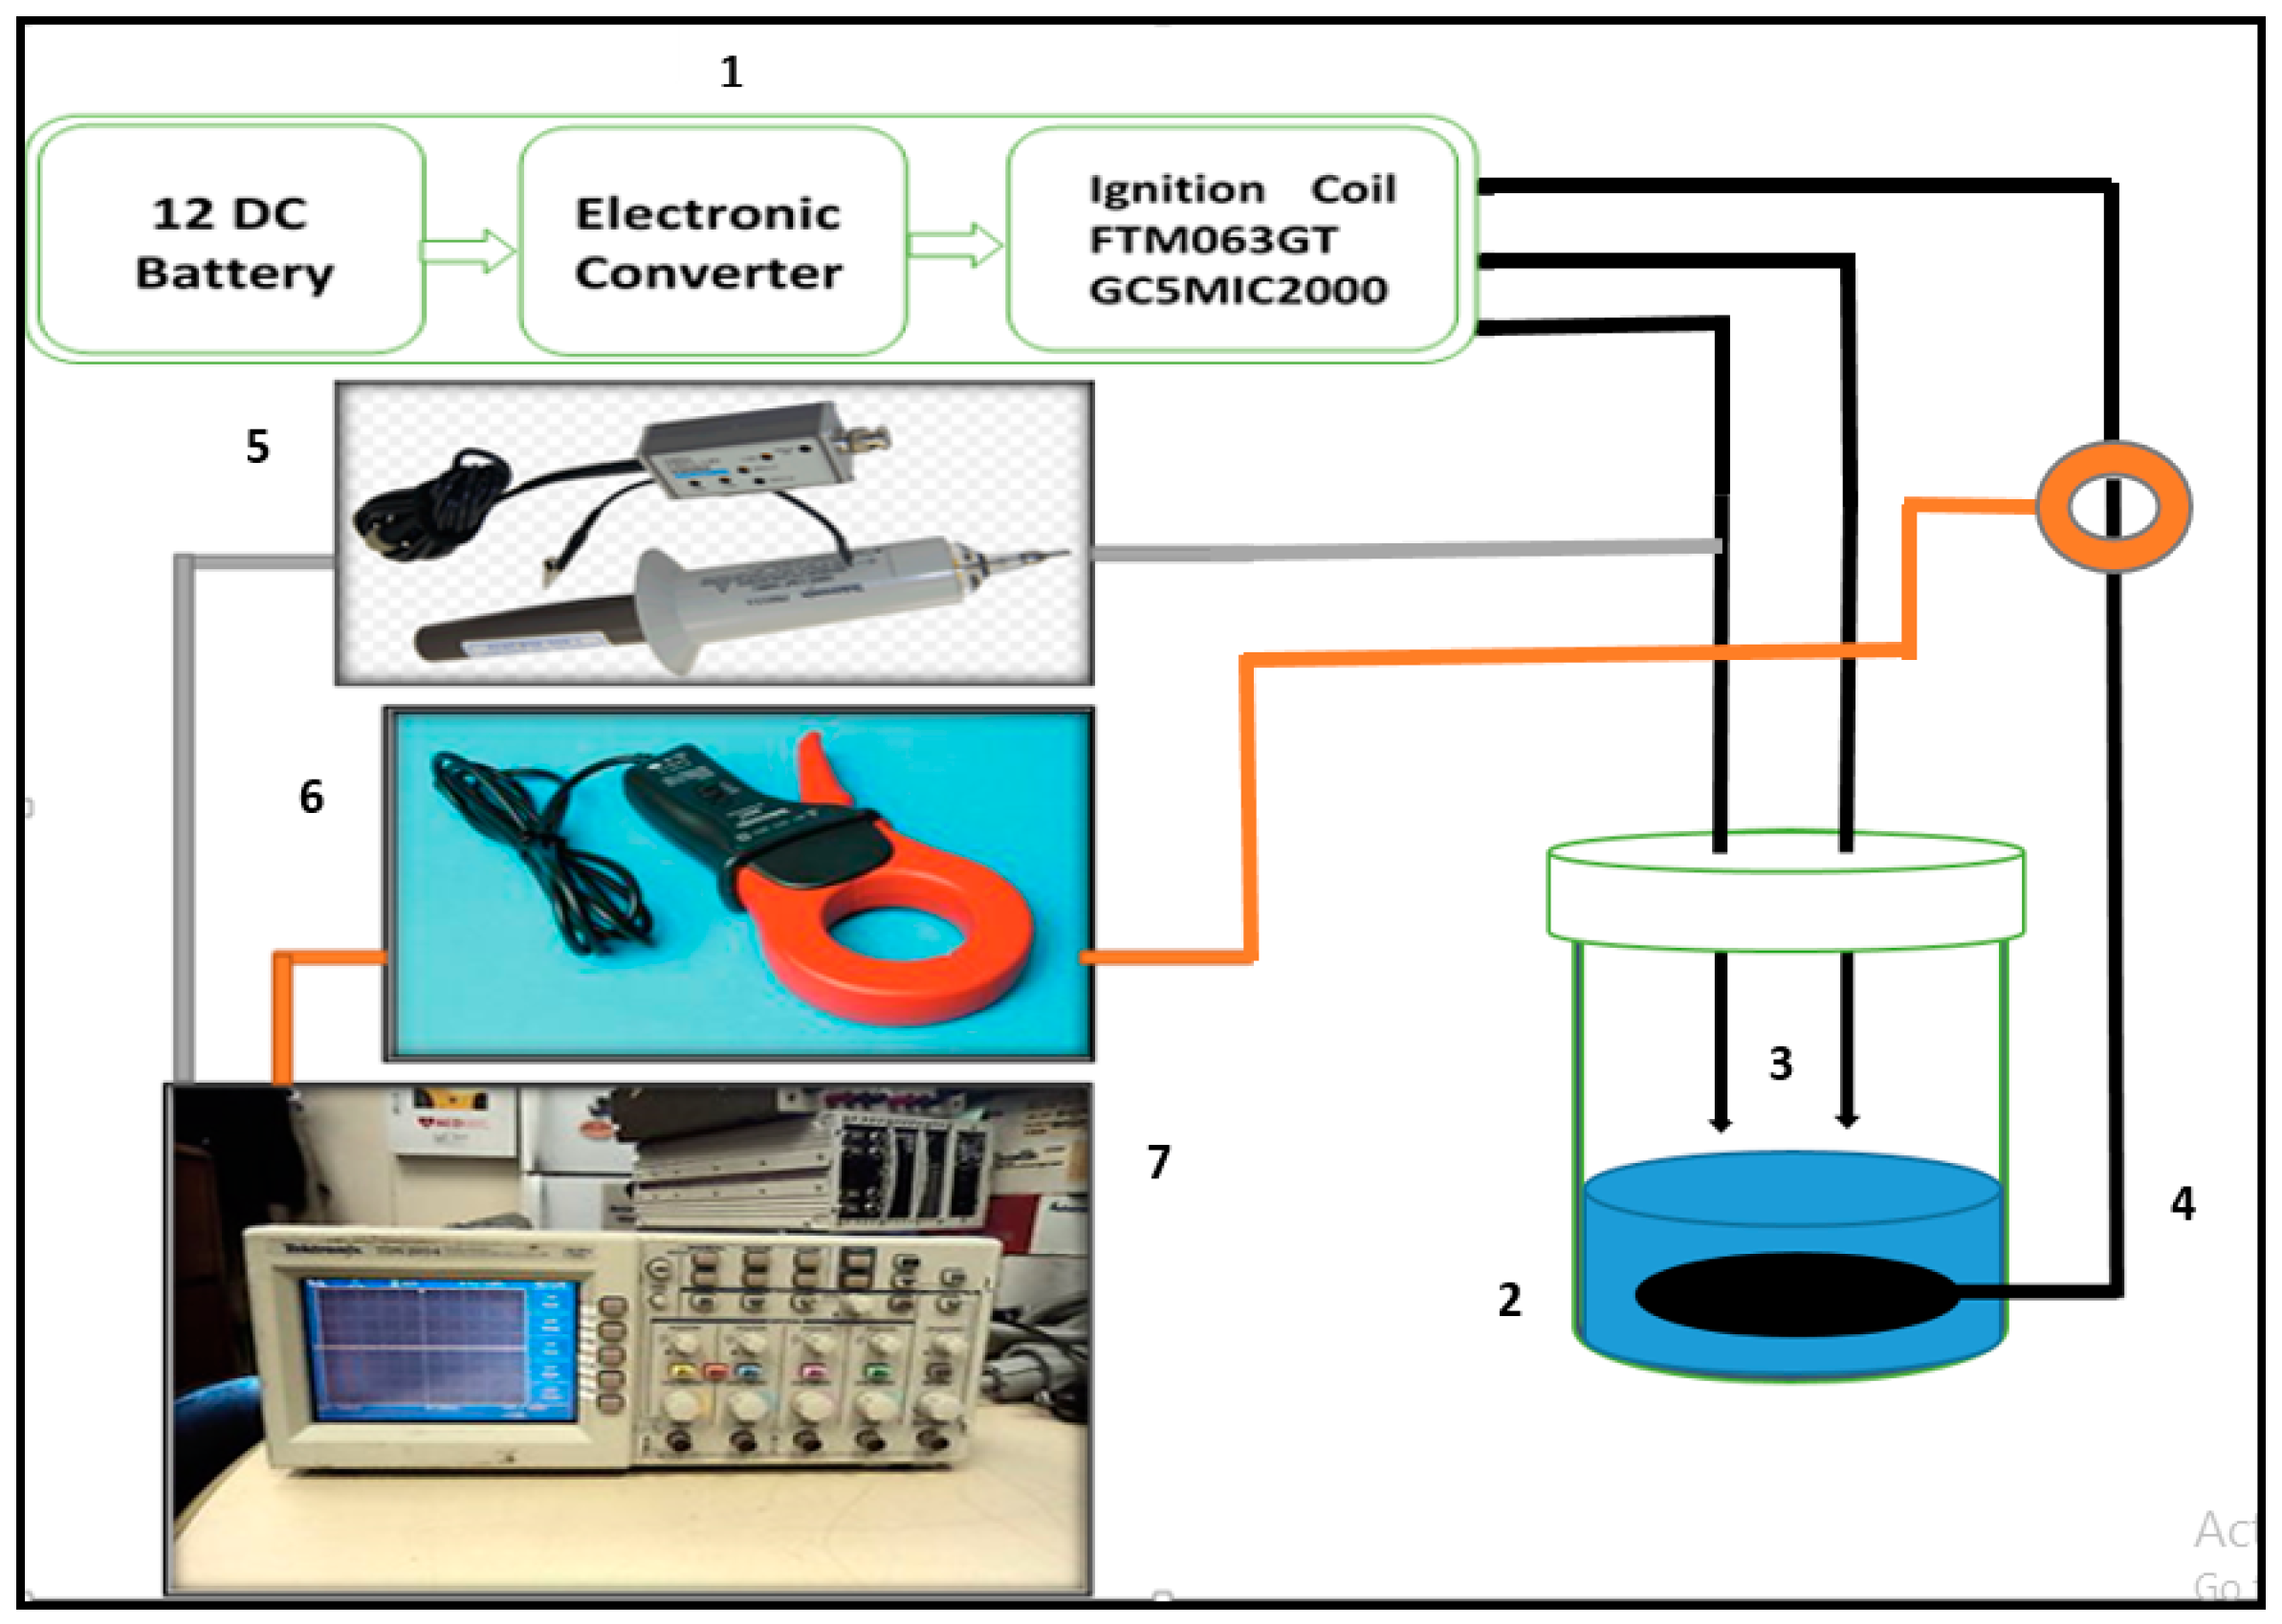
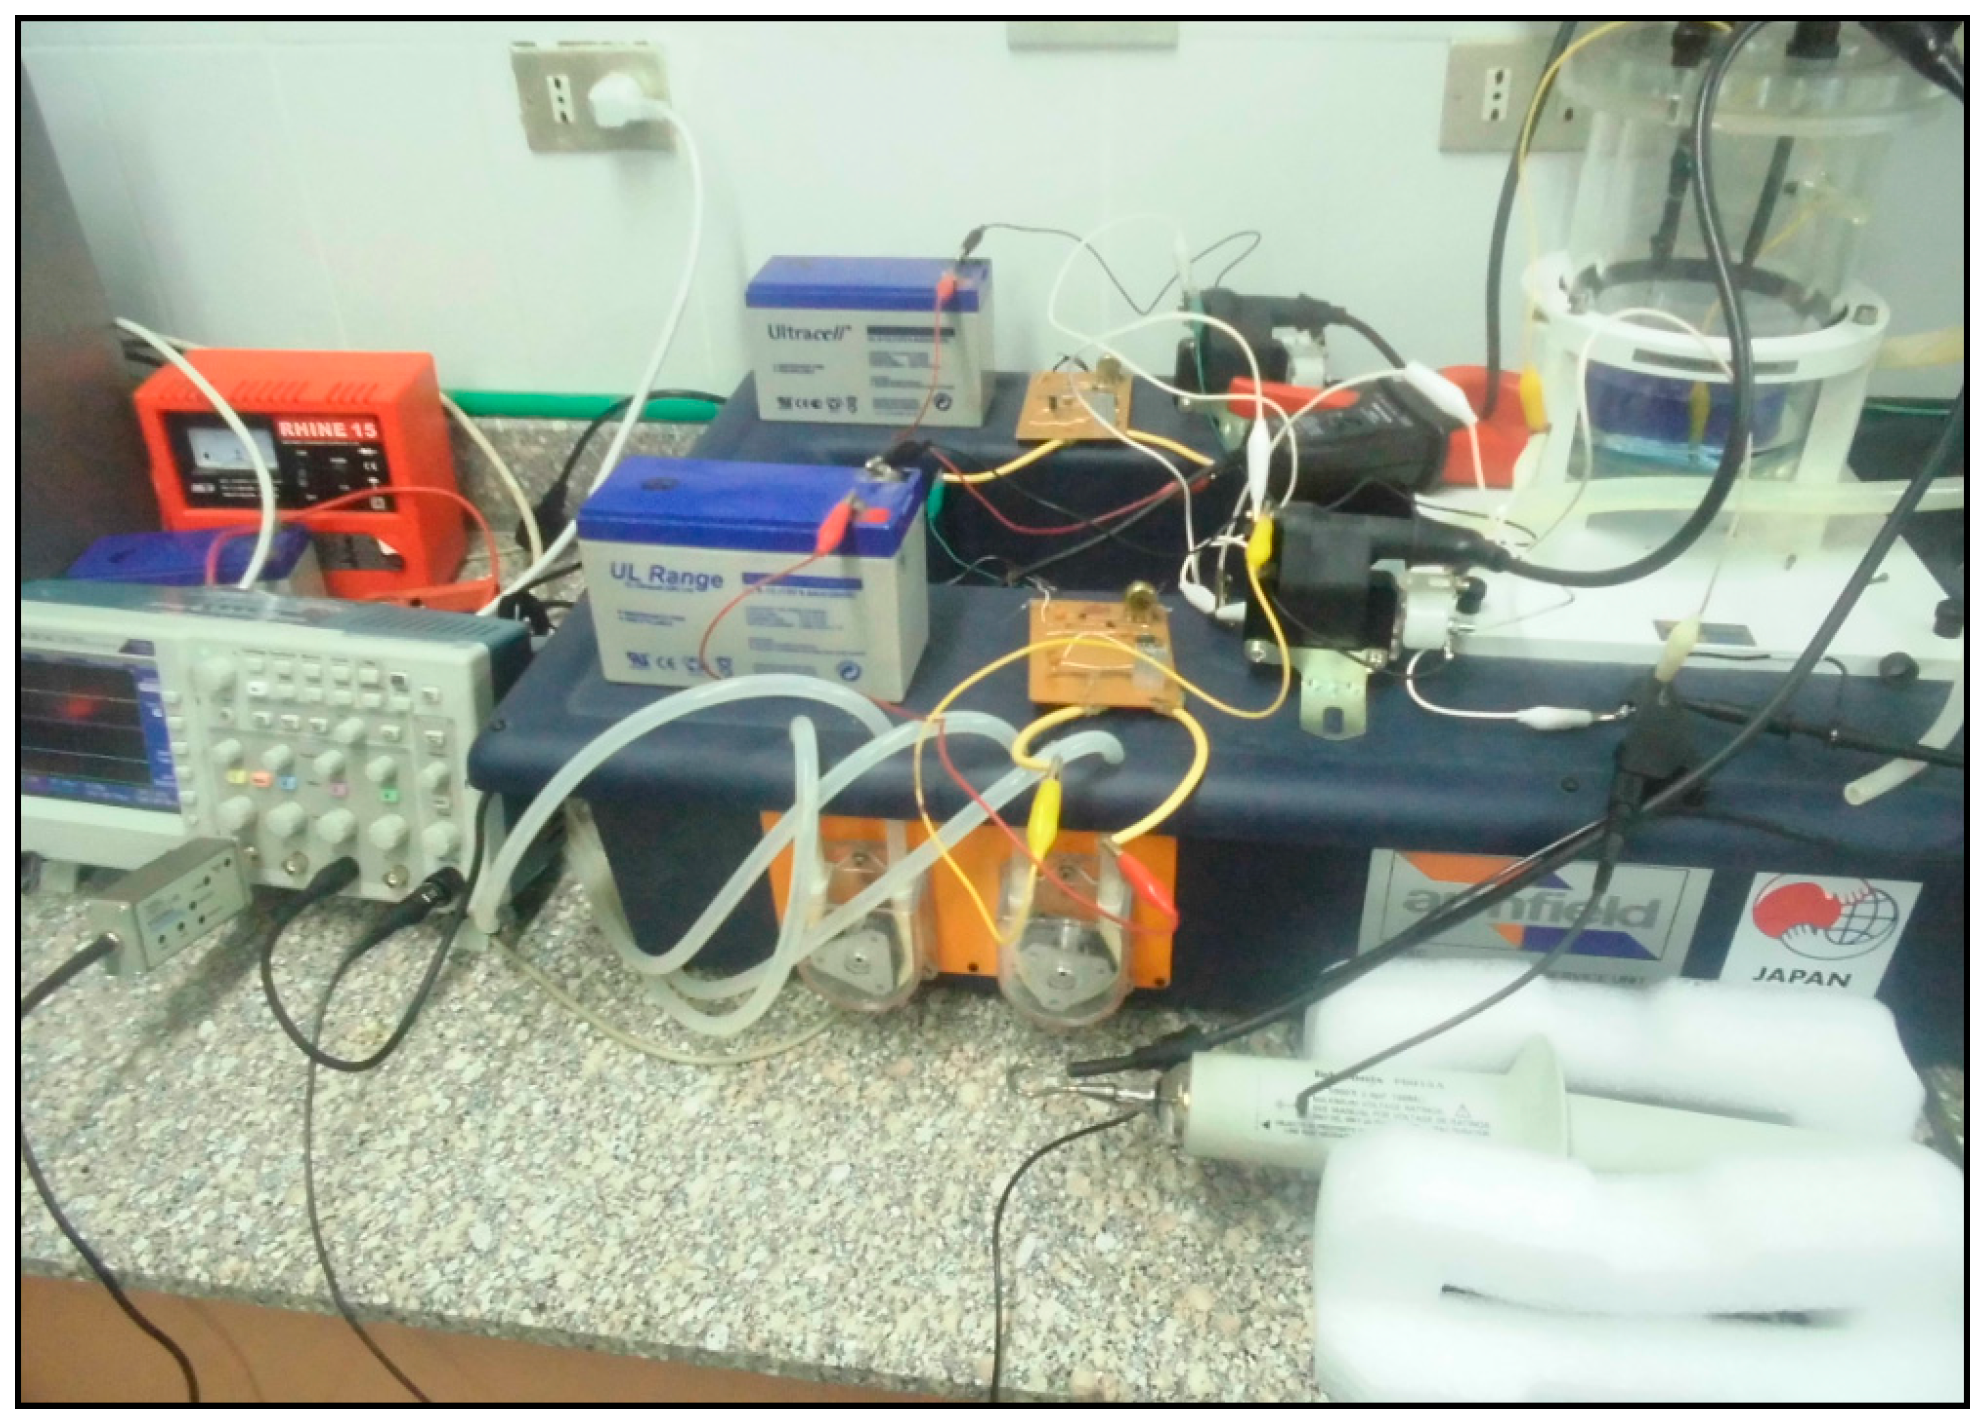
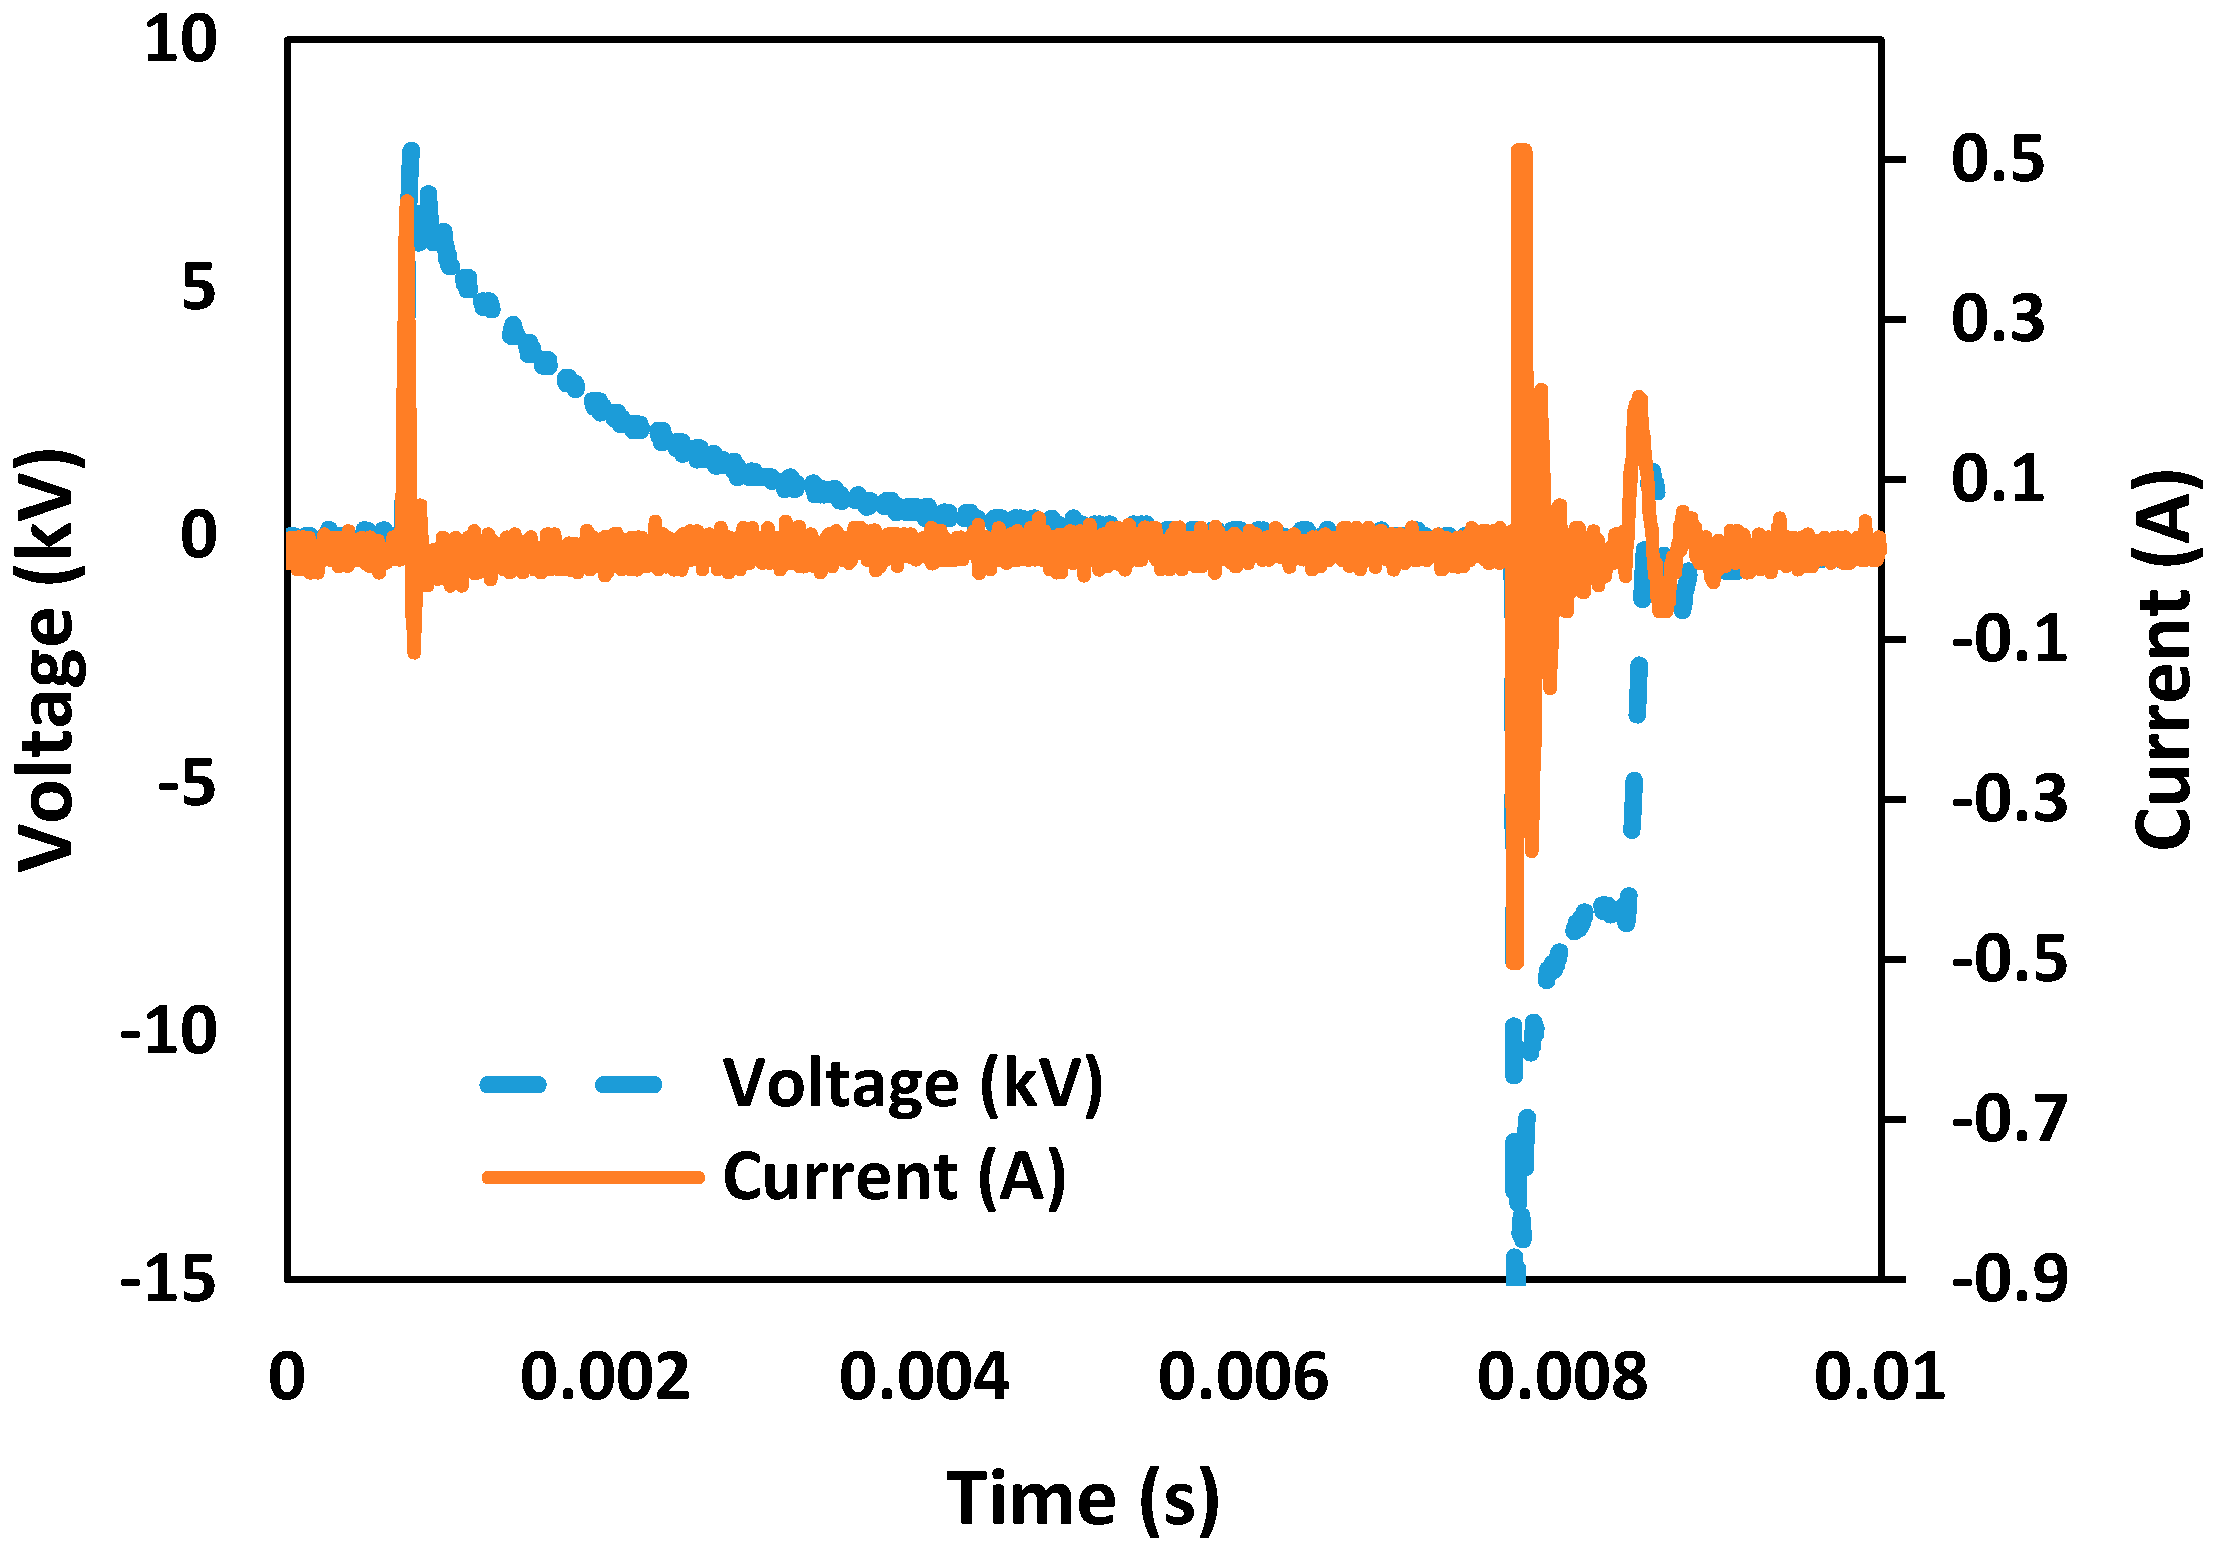
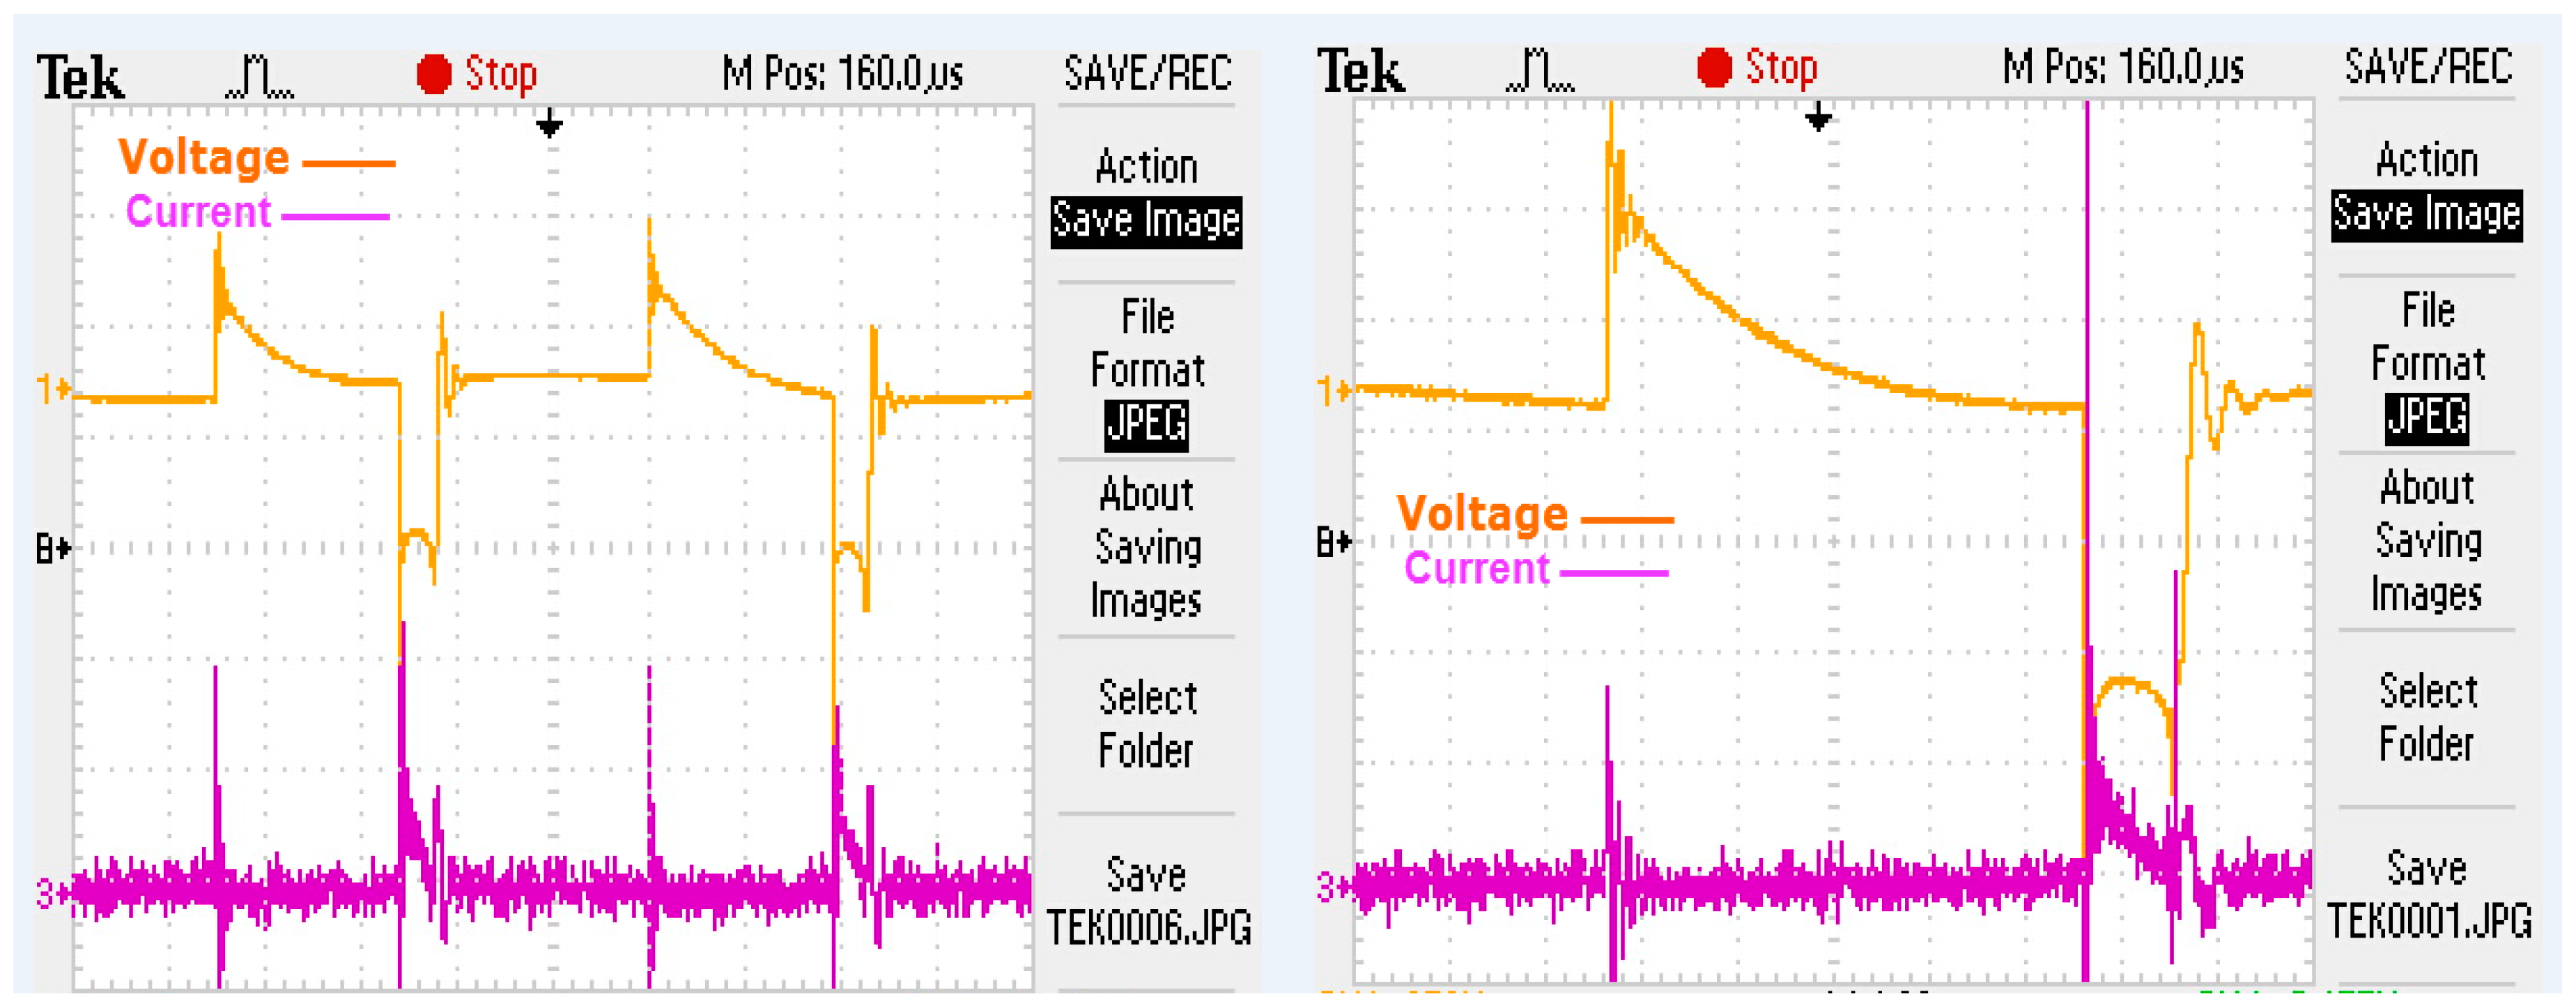
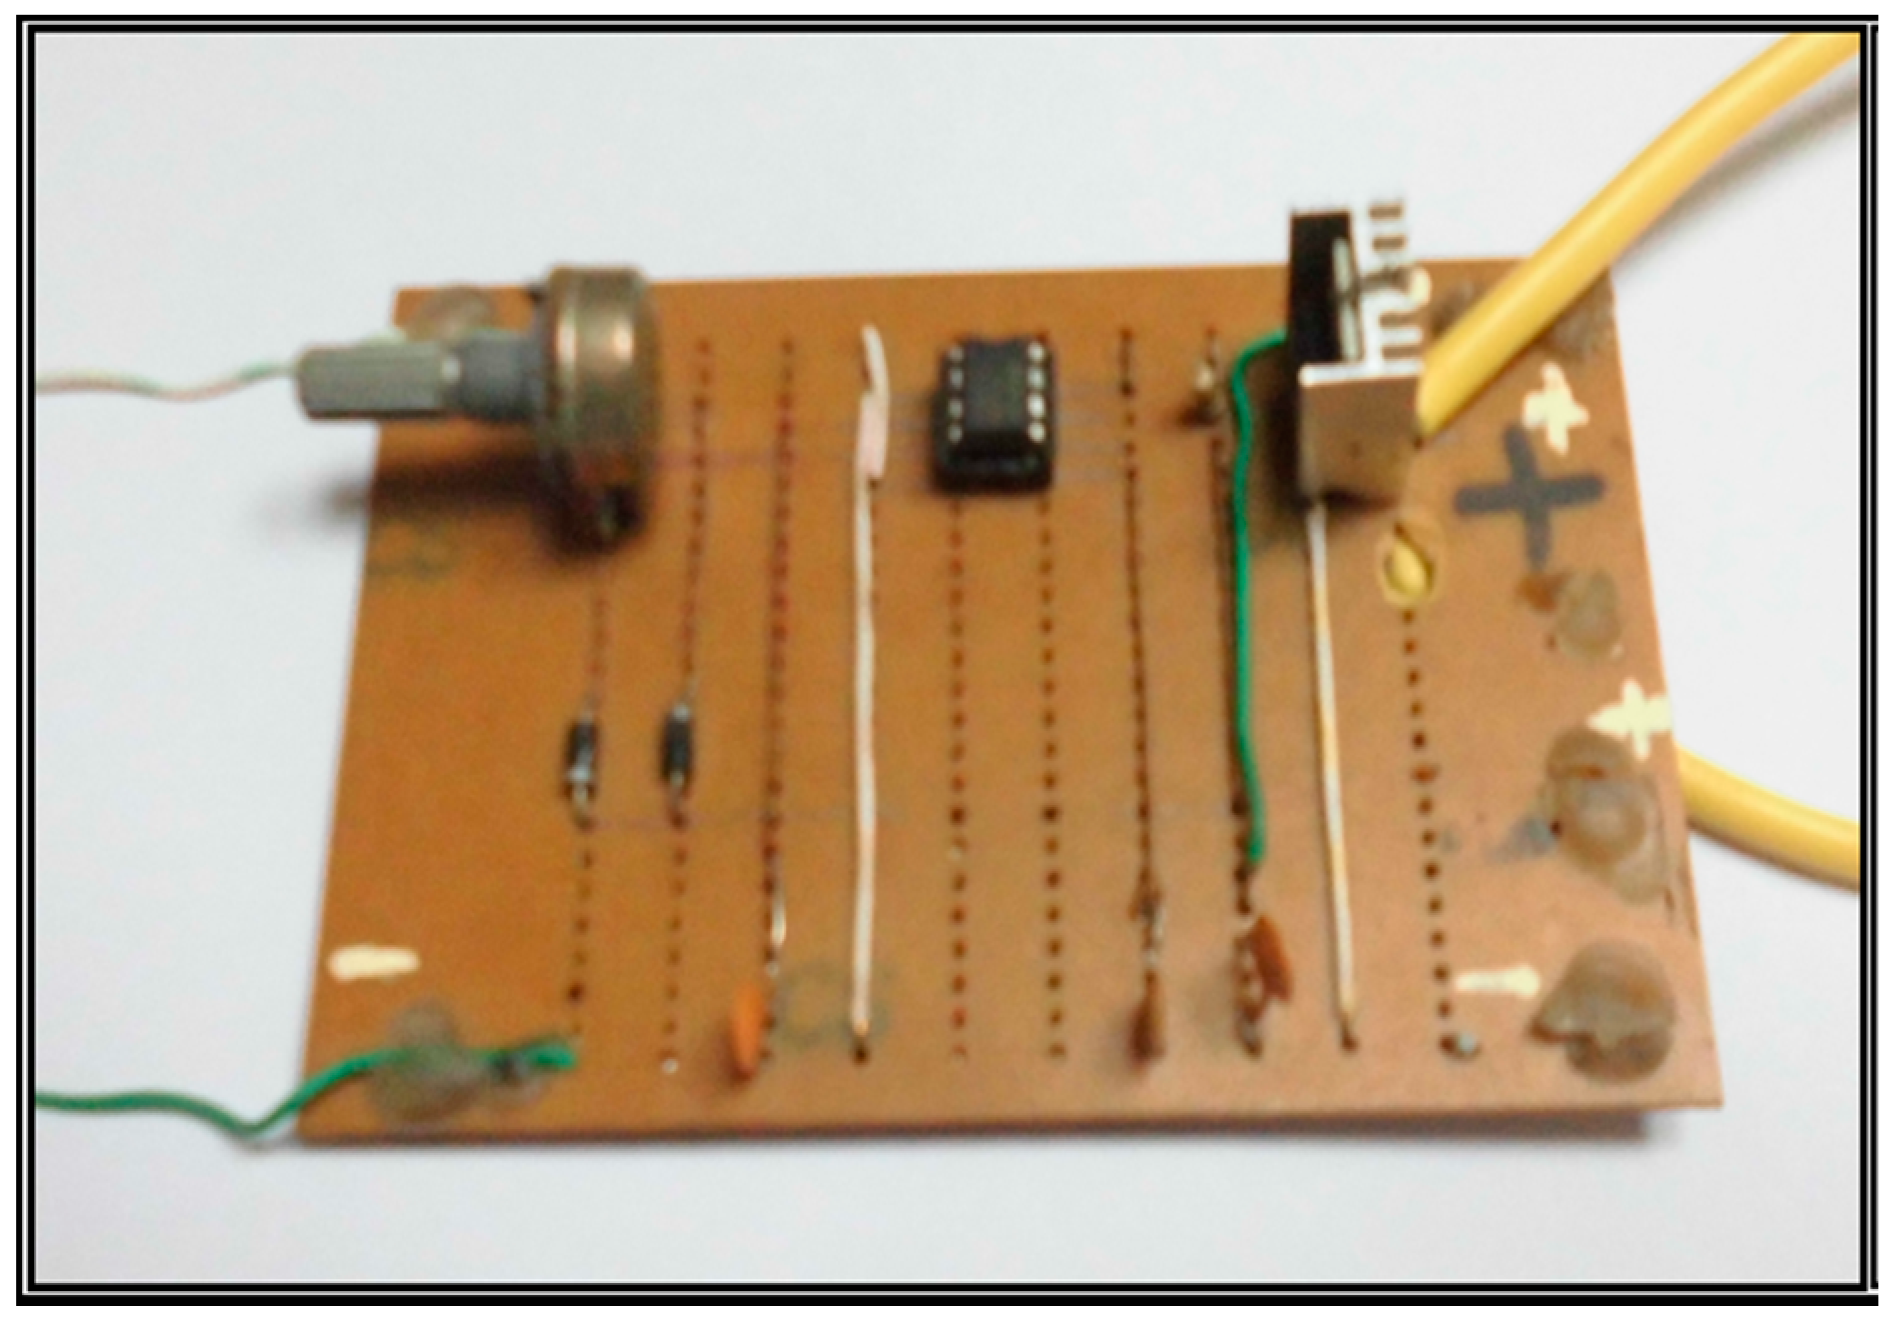
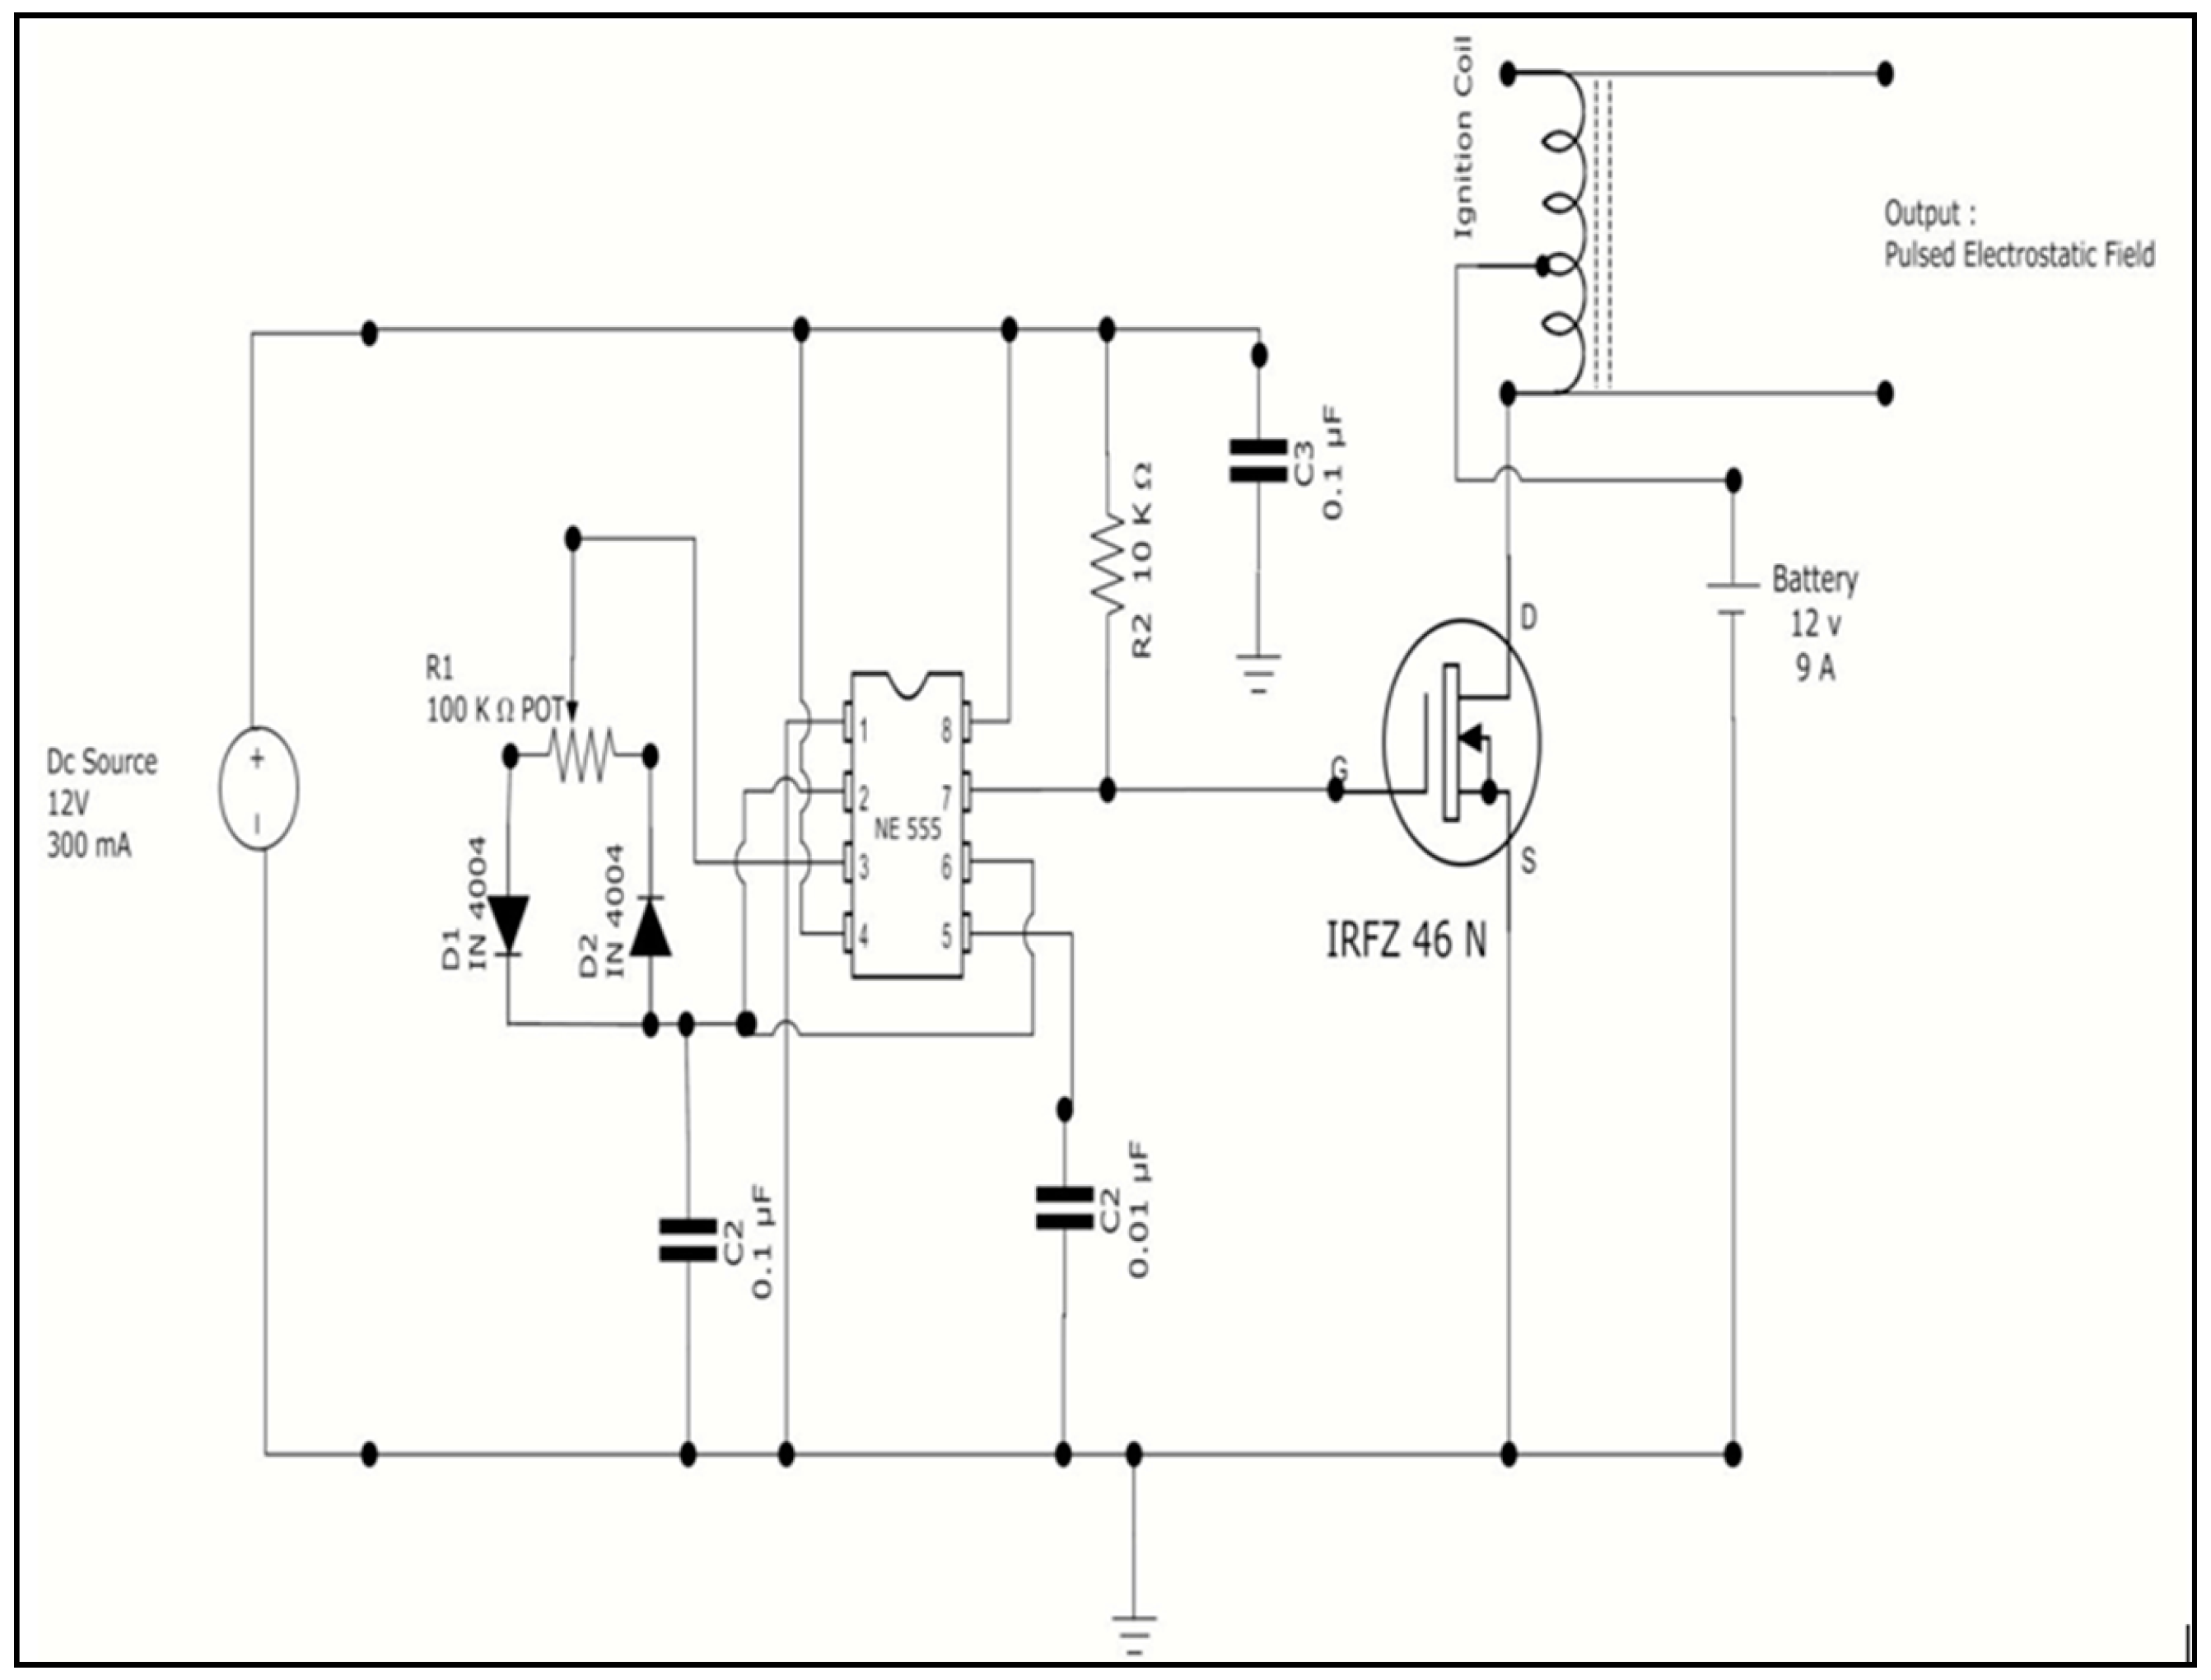
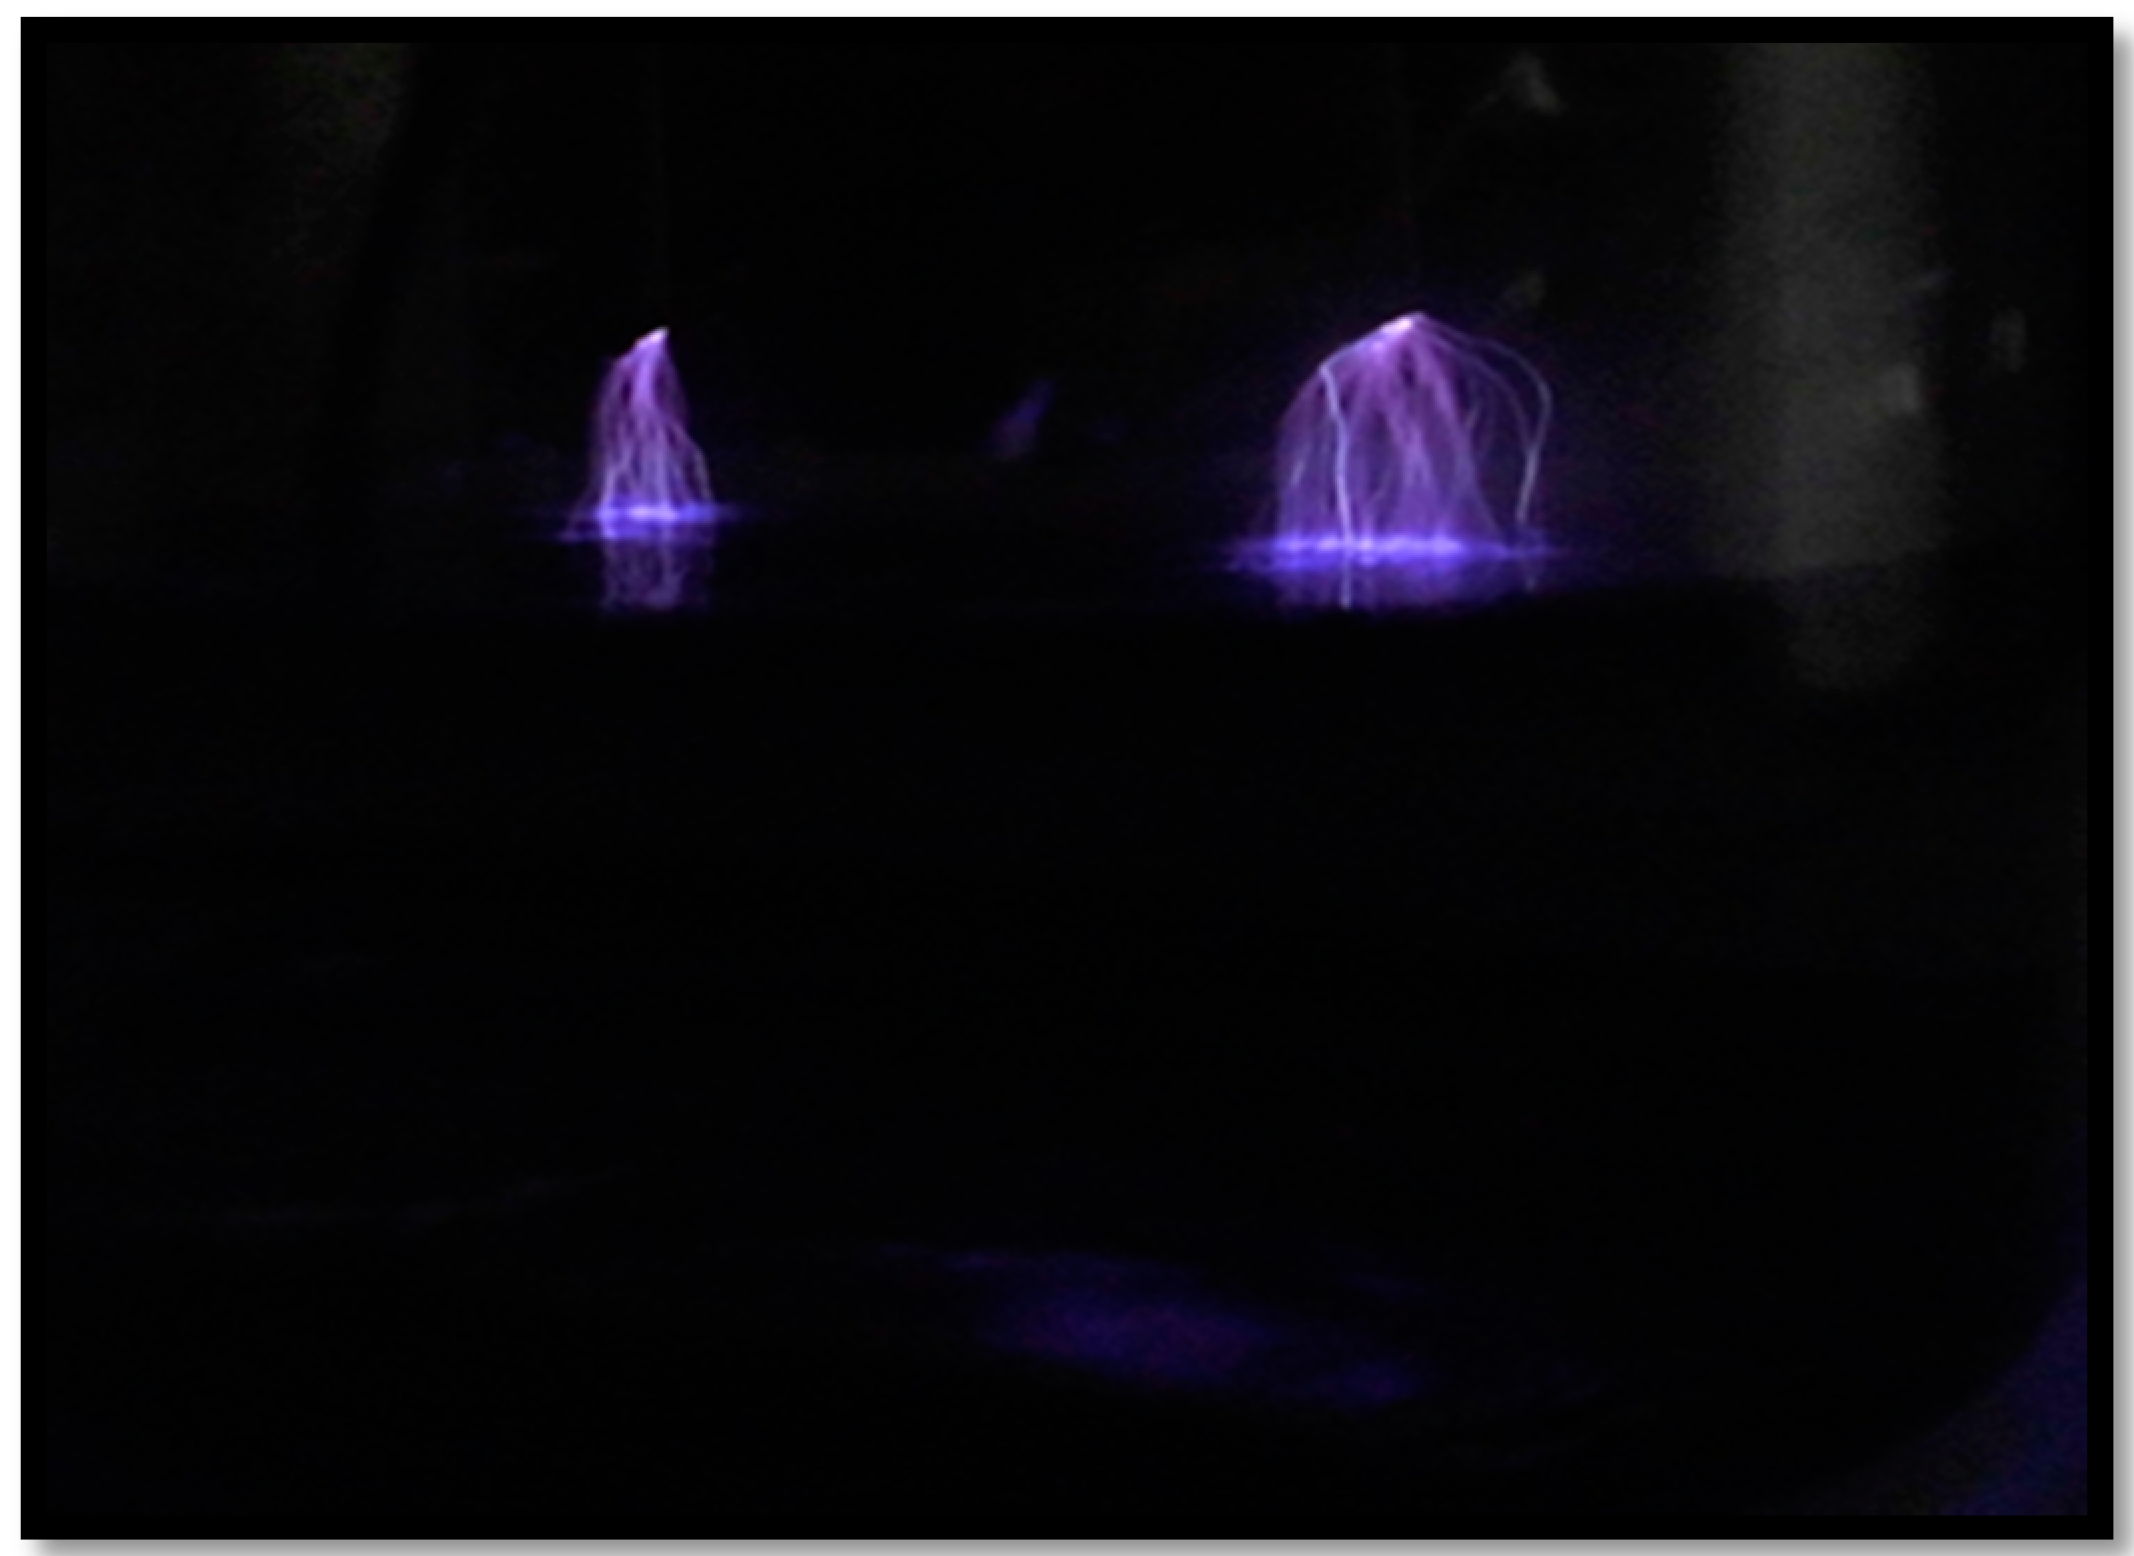
2.2. Non-Thermal Plasma Reactor

High voltage and a ground electrode were applied above the surface of the dye solution to produce a corona discharge between two high voltage electrodes and the ground plate for degradation of Acid Blue 25 dye. A computerized chemical continuous tank reactor was used as corona reactor in our system to easily control the solution temperature using the reactor shell. The dimensions of the reactor were 100 mm diameter and 180 mm height, with an external shell diameter of 120 mm, as presented in Figure 1 and Figure 2.
The width of the pin is 1 mm, its length is 30 mm and the distance between the two pins is 5 mm. Furthermore, the ground dimension was 0.2 × 60 × 50 mm [7,8]. A high voltage of 15 kV generated by an ignition coil was connected with the dual pin terminal. A P6015A high voltage sensor (Tektronix, Beaverton, OR, USA) was utilized to measure the high voltage waveforms. A Tektronix A6021 current sensor is utilized for the current waveforms. A Tektronix TDS2014 oscilloscope is utilized to display the waveforms. Figure 3 shows the waveforms generated from the ignition coil with period time 10 ms, frequency 100 Hz, negative width 1.376 ms, positive width 8.615 ms and rise time equal to 70.46 µs.
The steel electrodes of the two pins and the rectangular ground plate are isolated by a 0.5 cm air gap distance as the optimum separation gap that was determined previously using software programs [9,10,11,12]. A U-3900 UV spectrophotometer (Hitachi, Chiyoda, Tokyo, Japan) was used to measure the dye solution absorption at 600 nm wavelength before and after the experiments. The pulsed high voltage unit that was utilized as a part of the designed plasma treatment system was comprised from a PWM circuit based on a 555 timer and a model FTM063GT-GC5MIC2000 ignition coil. The utilized PWM circuit and its electronic diagram are illustrated in Figure 3. The operation of the PWM circuit begins with the circuit being powered up, which starts the oscillator cycle and transfers its yield to the capacitor C1 to be charged through the right half of R1 and diode D2. At the point when C1 voltage reaches 2/3 of +V, the edge is initiated, which thus causes the yield, and releases the capacitor C1. As the capacitor C1 begins to release through the left half of R1 and D1 the voltage on C1 falls beneath 1/3 of +V, and the cycle restarts. Capacitor C1 charges through one side of R1 and releases through the other side. The aggregate of the charge and release resistance is dependably the same; along these lines the wavelength of the yield sign is consistent and just the obligation cycle fluctuates with R1. The general recurrence of the PWM signal in this circuit is dictated by the estimations of R1 and C1.
The work of the IRFZ46N MOSFET relies upon the 555 clock signal, when the MOSFET work is utilized for the isolated DC source and operates the ignition loop. Ignition loops are utilized in automobiles to create the sparks which start the burning of the fuel-air blend in the chambers.
An ignition coil is similar to a transformer comprised of an iron center with an essential and auxiliary twisting. The proportion of auxiliary and essential turns is 100:1. Two windings are associated to one side and the auxiliary is naturally grounded. The most extreme voltage difference achievable in this manner is about 60 kV, which is sufficient to jump a 10 cm air hole. Various arrangements of double high-voltage electrodes have been set up and examined experimentally for their influence on the decolorization process of Acid Blue dye. A high voltage of 15 kV peak output was applied to the pin electrode with a frequency of 100 Hz, period time of 10 ms, rise time equal 70.46 µs, positive width 8.615 ms and negative width 1.376 ms. The waveform of the IRFZ46N MOSFET switch signal feed, the output voltage and corona current are shown in Figure 4. Figure 5 illlustrates the non-thermal plasma region in the corona reactor.
The percentage of the dye removal was calculated from the difference in the dye absorption before and after the experiments [13,14,15]:
Decolorization Efficiency (D%) = ((Initial absorption (Ai) − Absorption after treatment time t (At))/Initial absorption (Ai)) × 100

3. Results and Discussion

The non-thermal plasma (NTP) corona discharge in air is limited to a very small zone in the vicinity of the small radius wire. Various physical processes occur in the corona zone; their modeling is far too complex to be considered when addressing most situations of practical interest. To understand the mechanisms of corona discharge and generation of ozone, the active radicals present and the field and voltage in the gap space between two electrodes should be known. In order to optimize a corona device, the onset voltage and electric field should be determined by the voltage and field distribution [16]. A 3D model was used to determine the optimum gap and thickness of ground plate for 15 kV. During the non-thermal plasma process, a huge amount of radicals were created. The degradation of water molecules produced (OH•) and (H) in the treated solution. The experimental work was focused on the impact of diverse salt concentrations on the efficiency of the decolorization process in the presence of the NTP. In addition, the effects of the essential reactive species produced such as O3 and H2O2 on the oxidation of organic dyes were investigated.

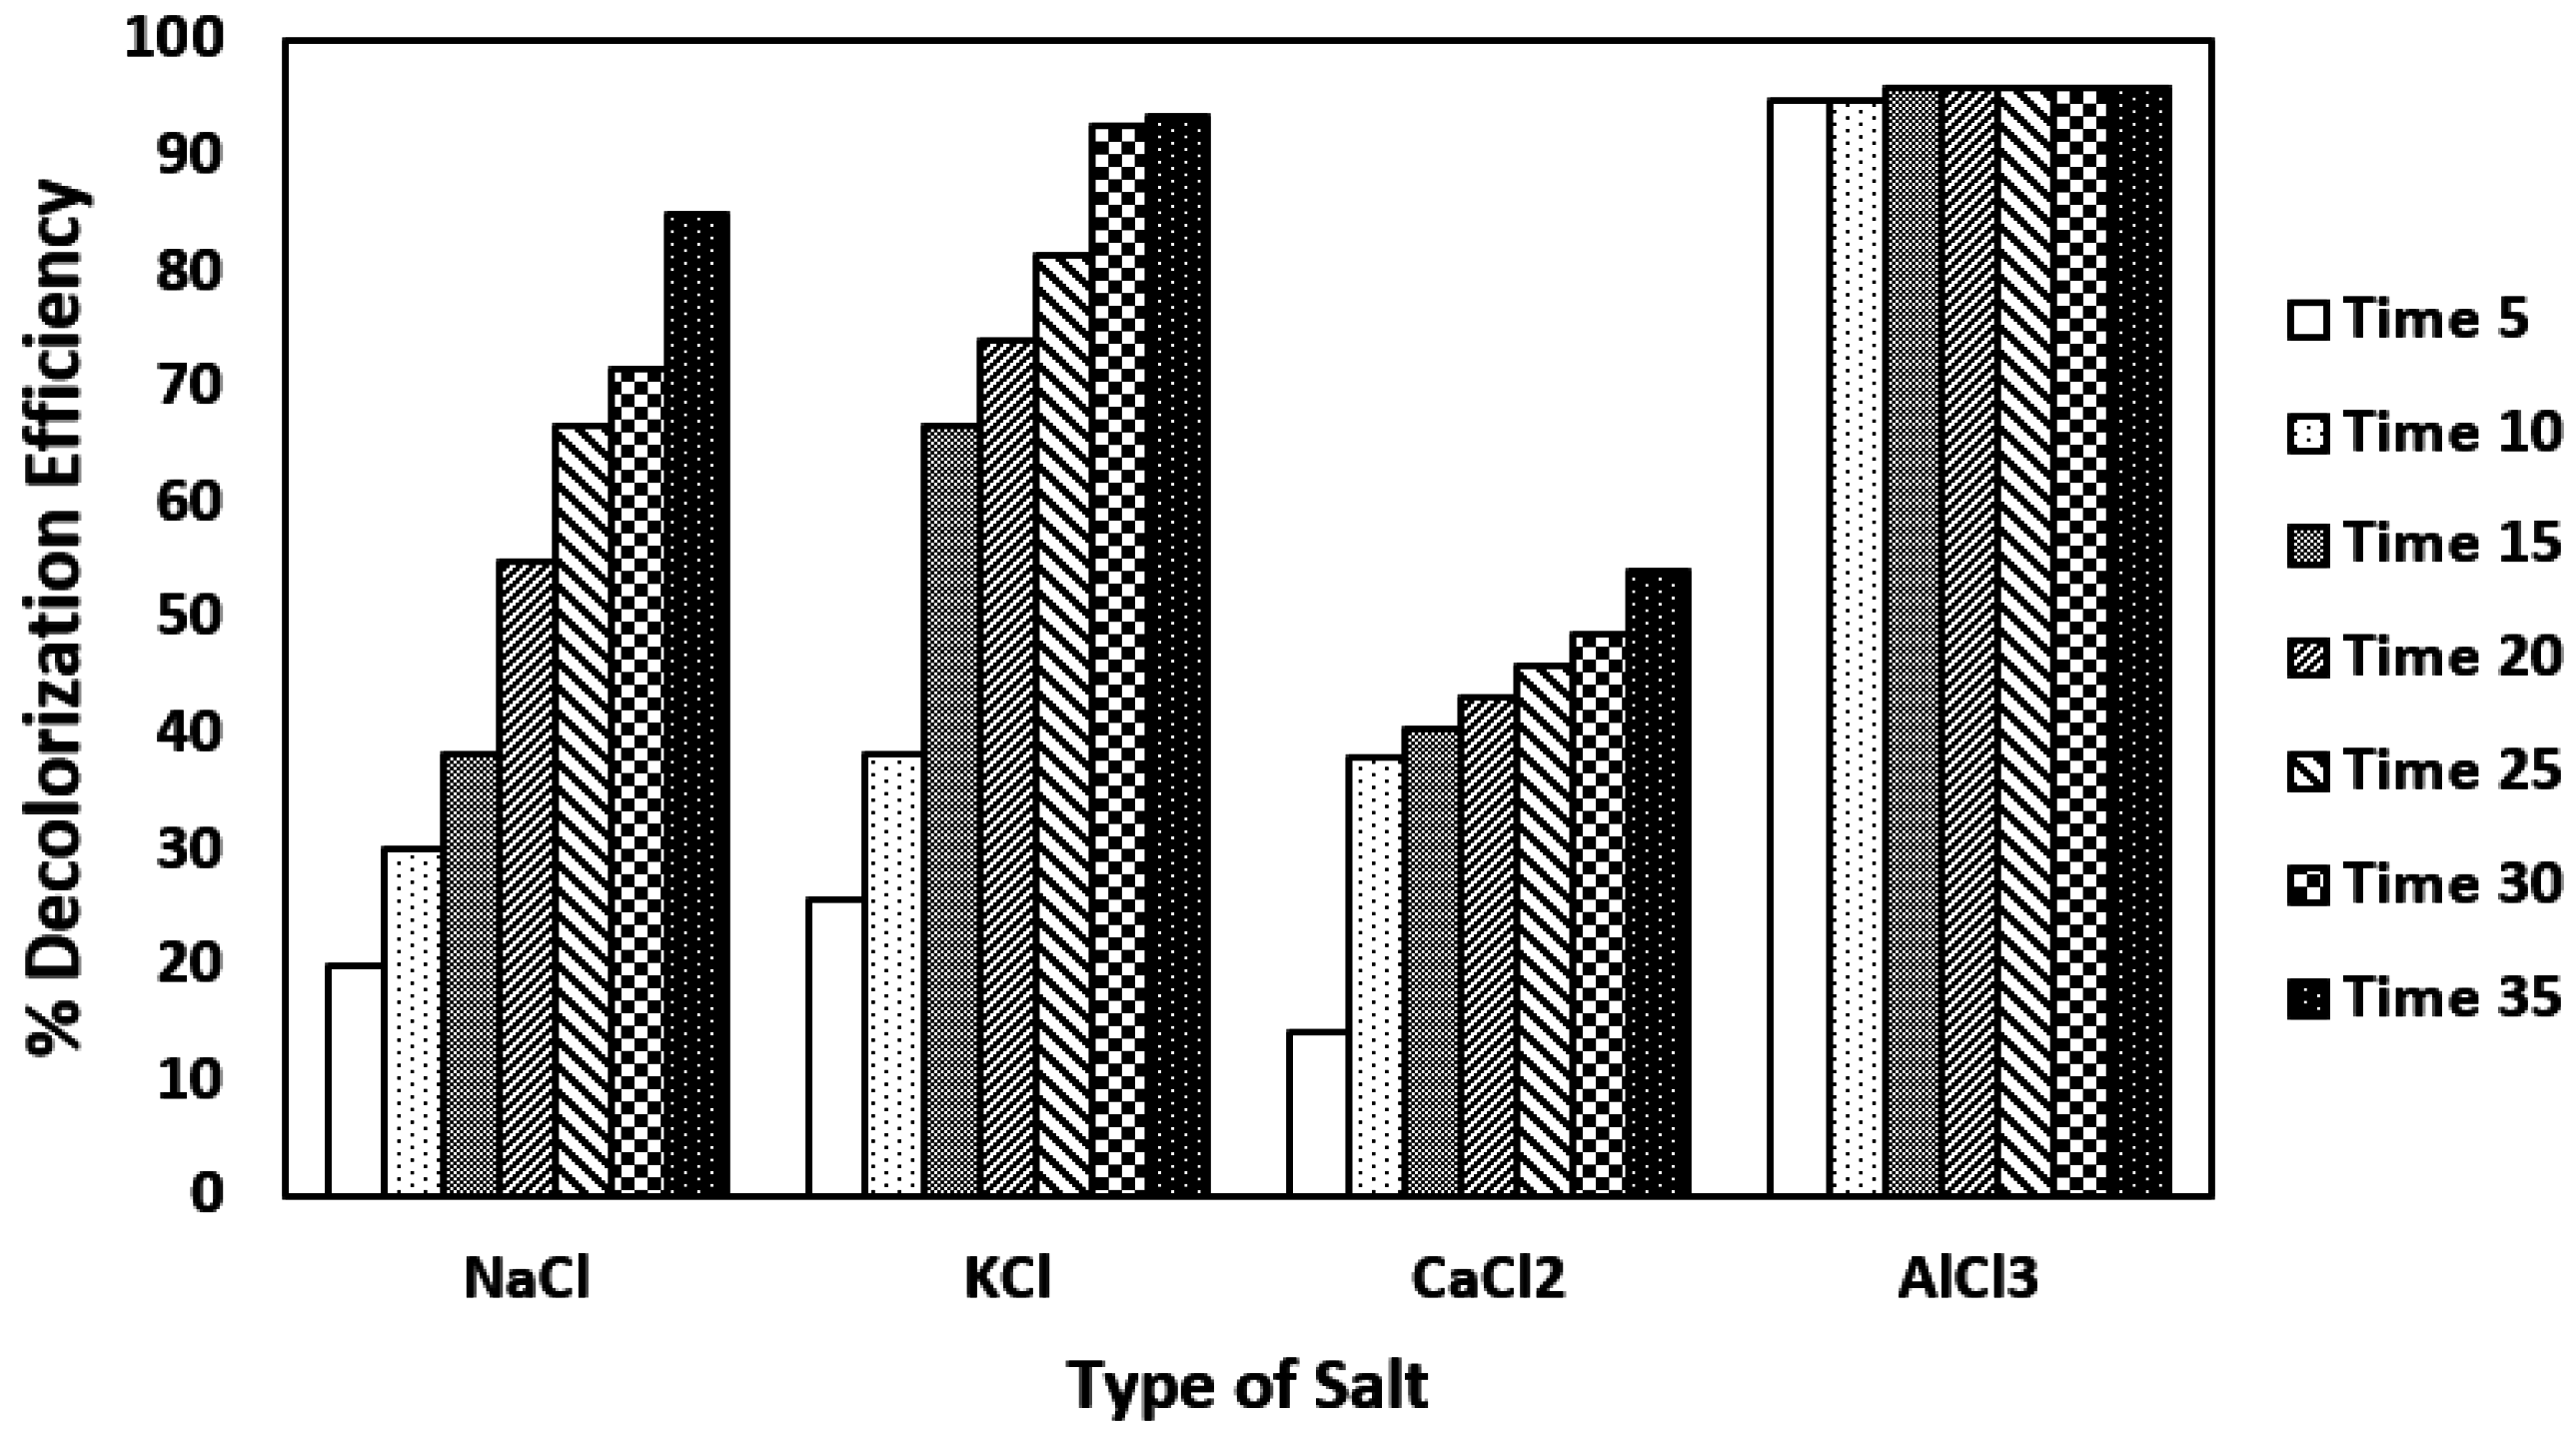
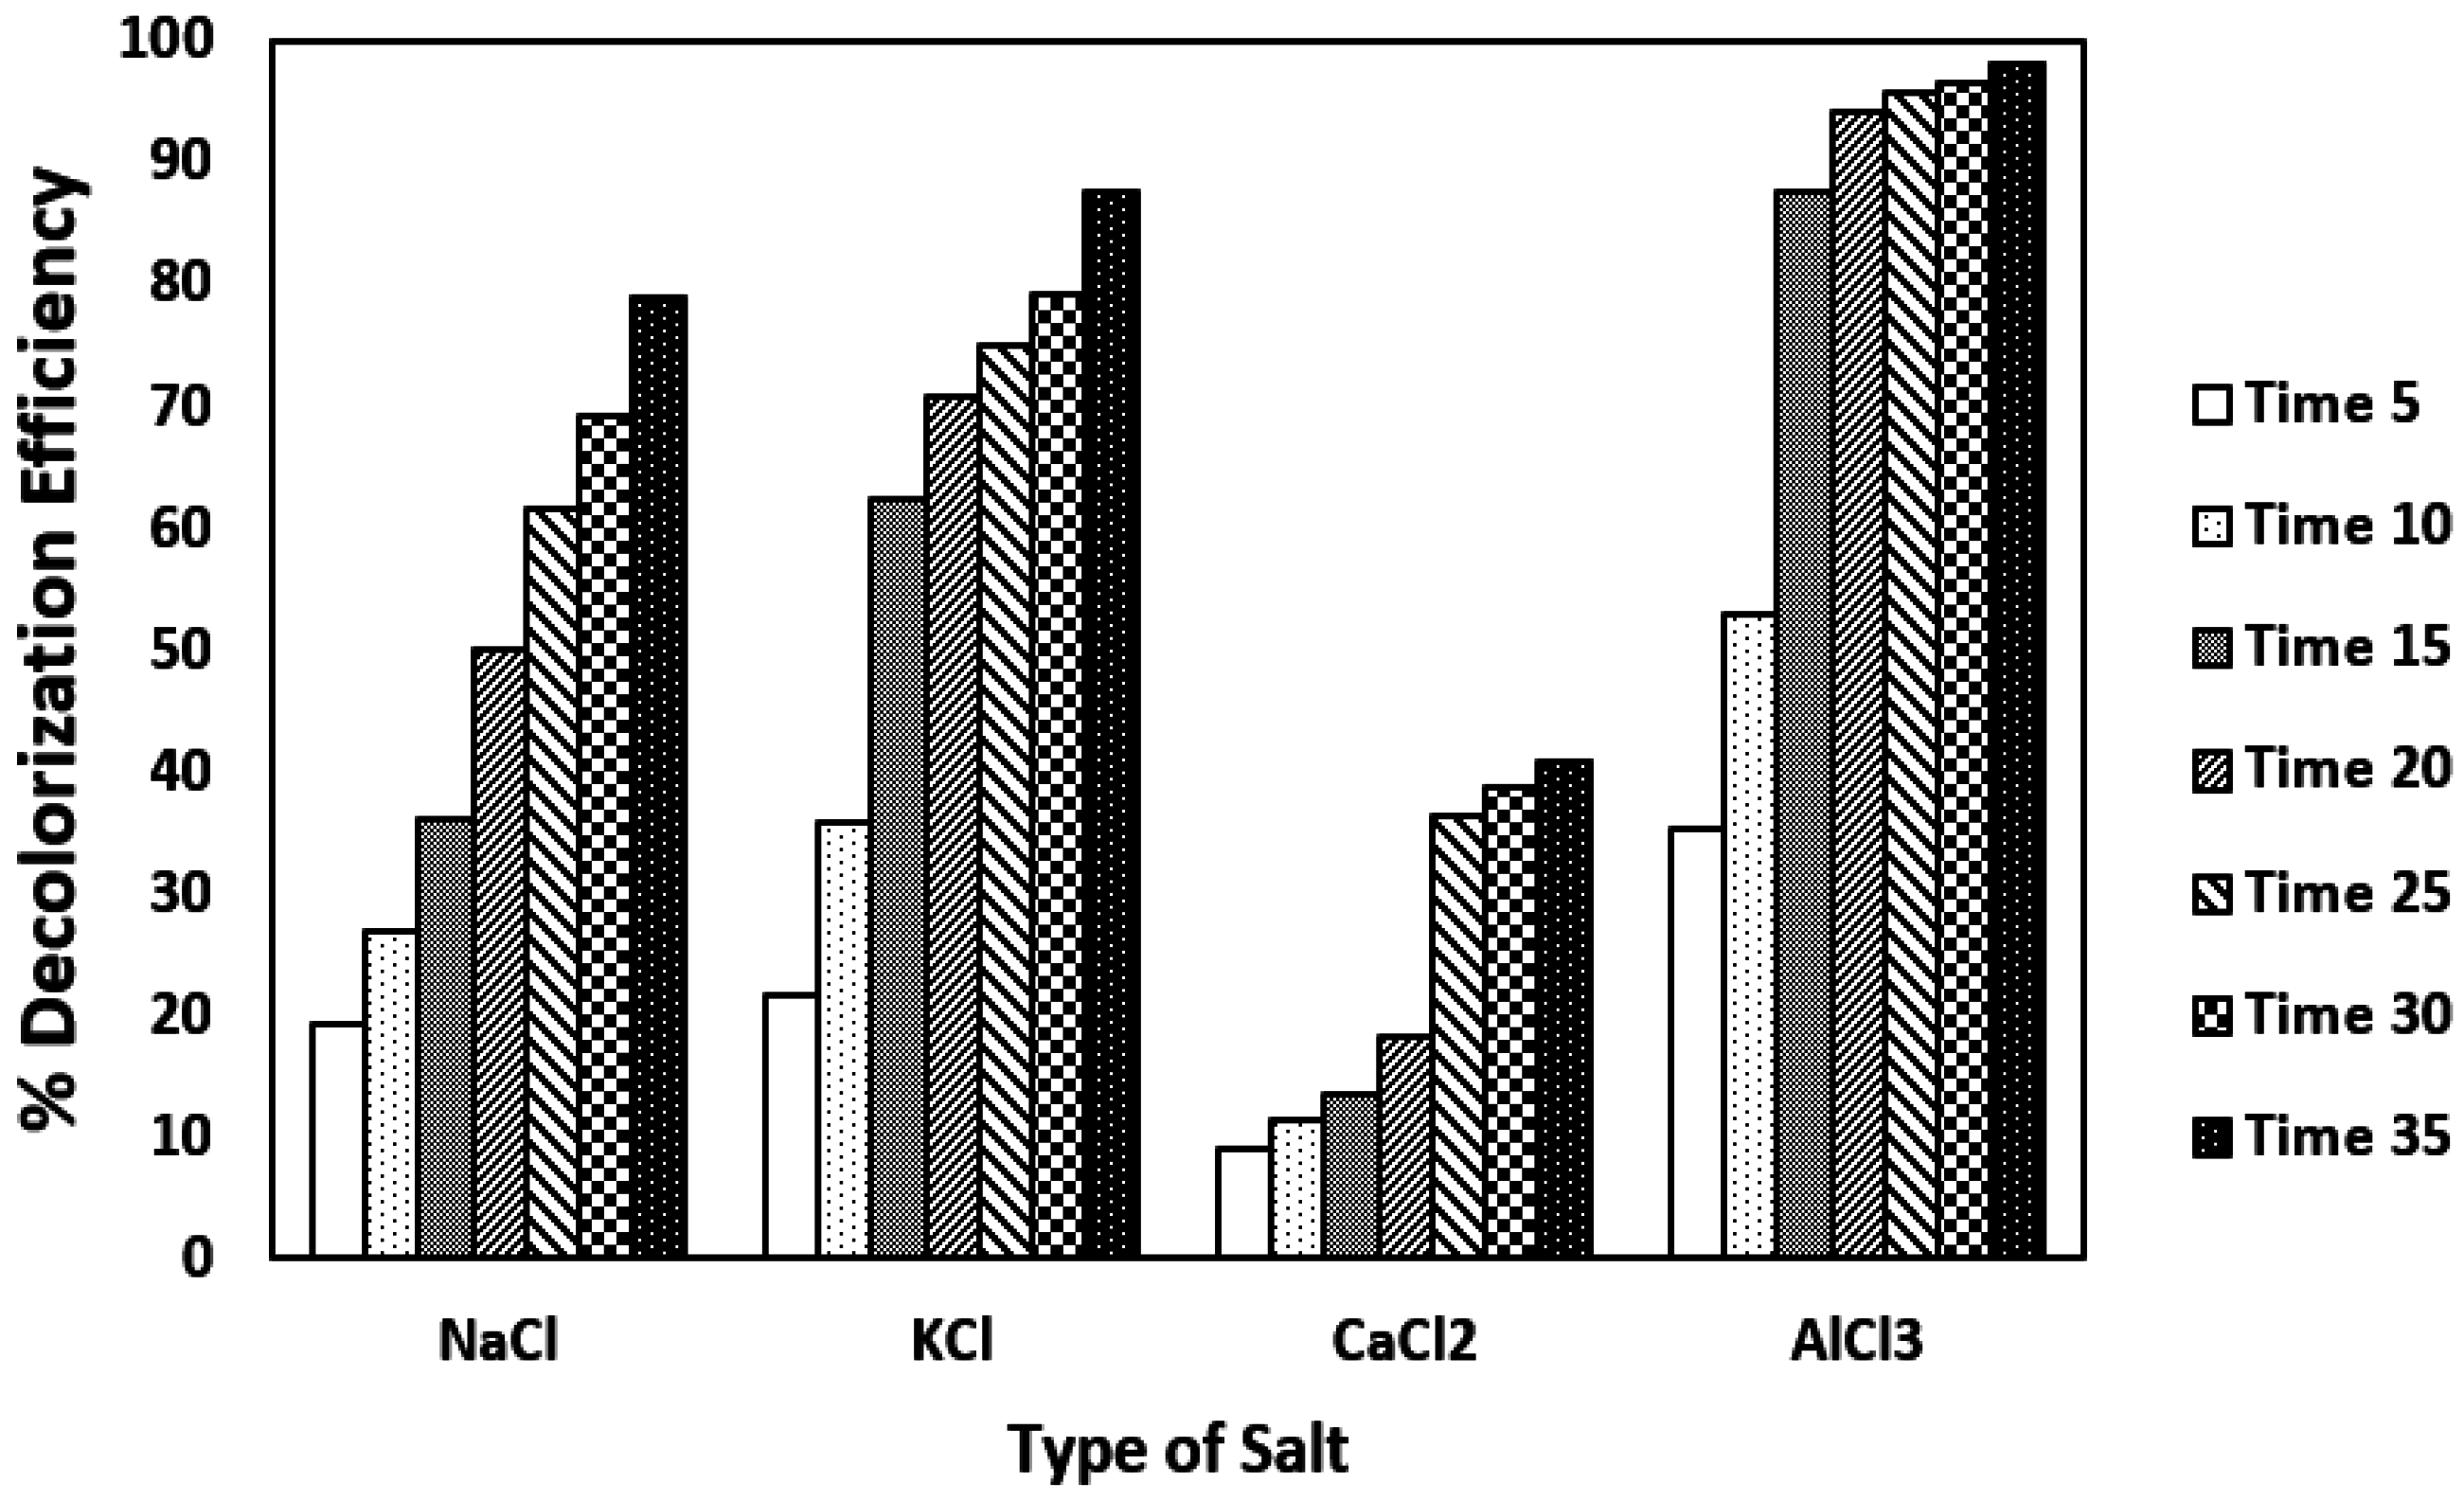
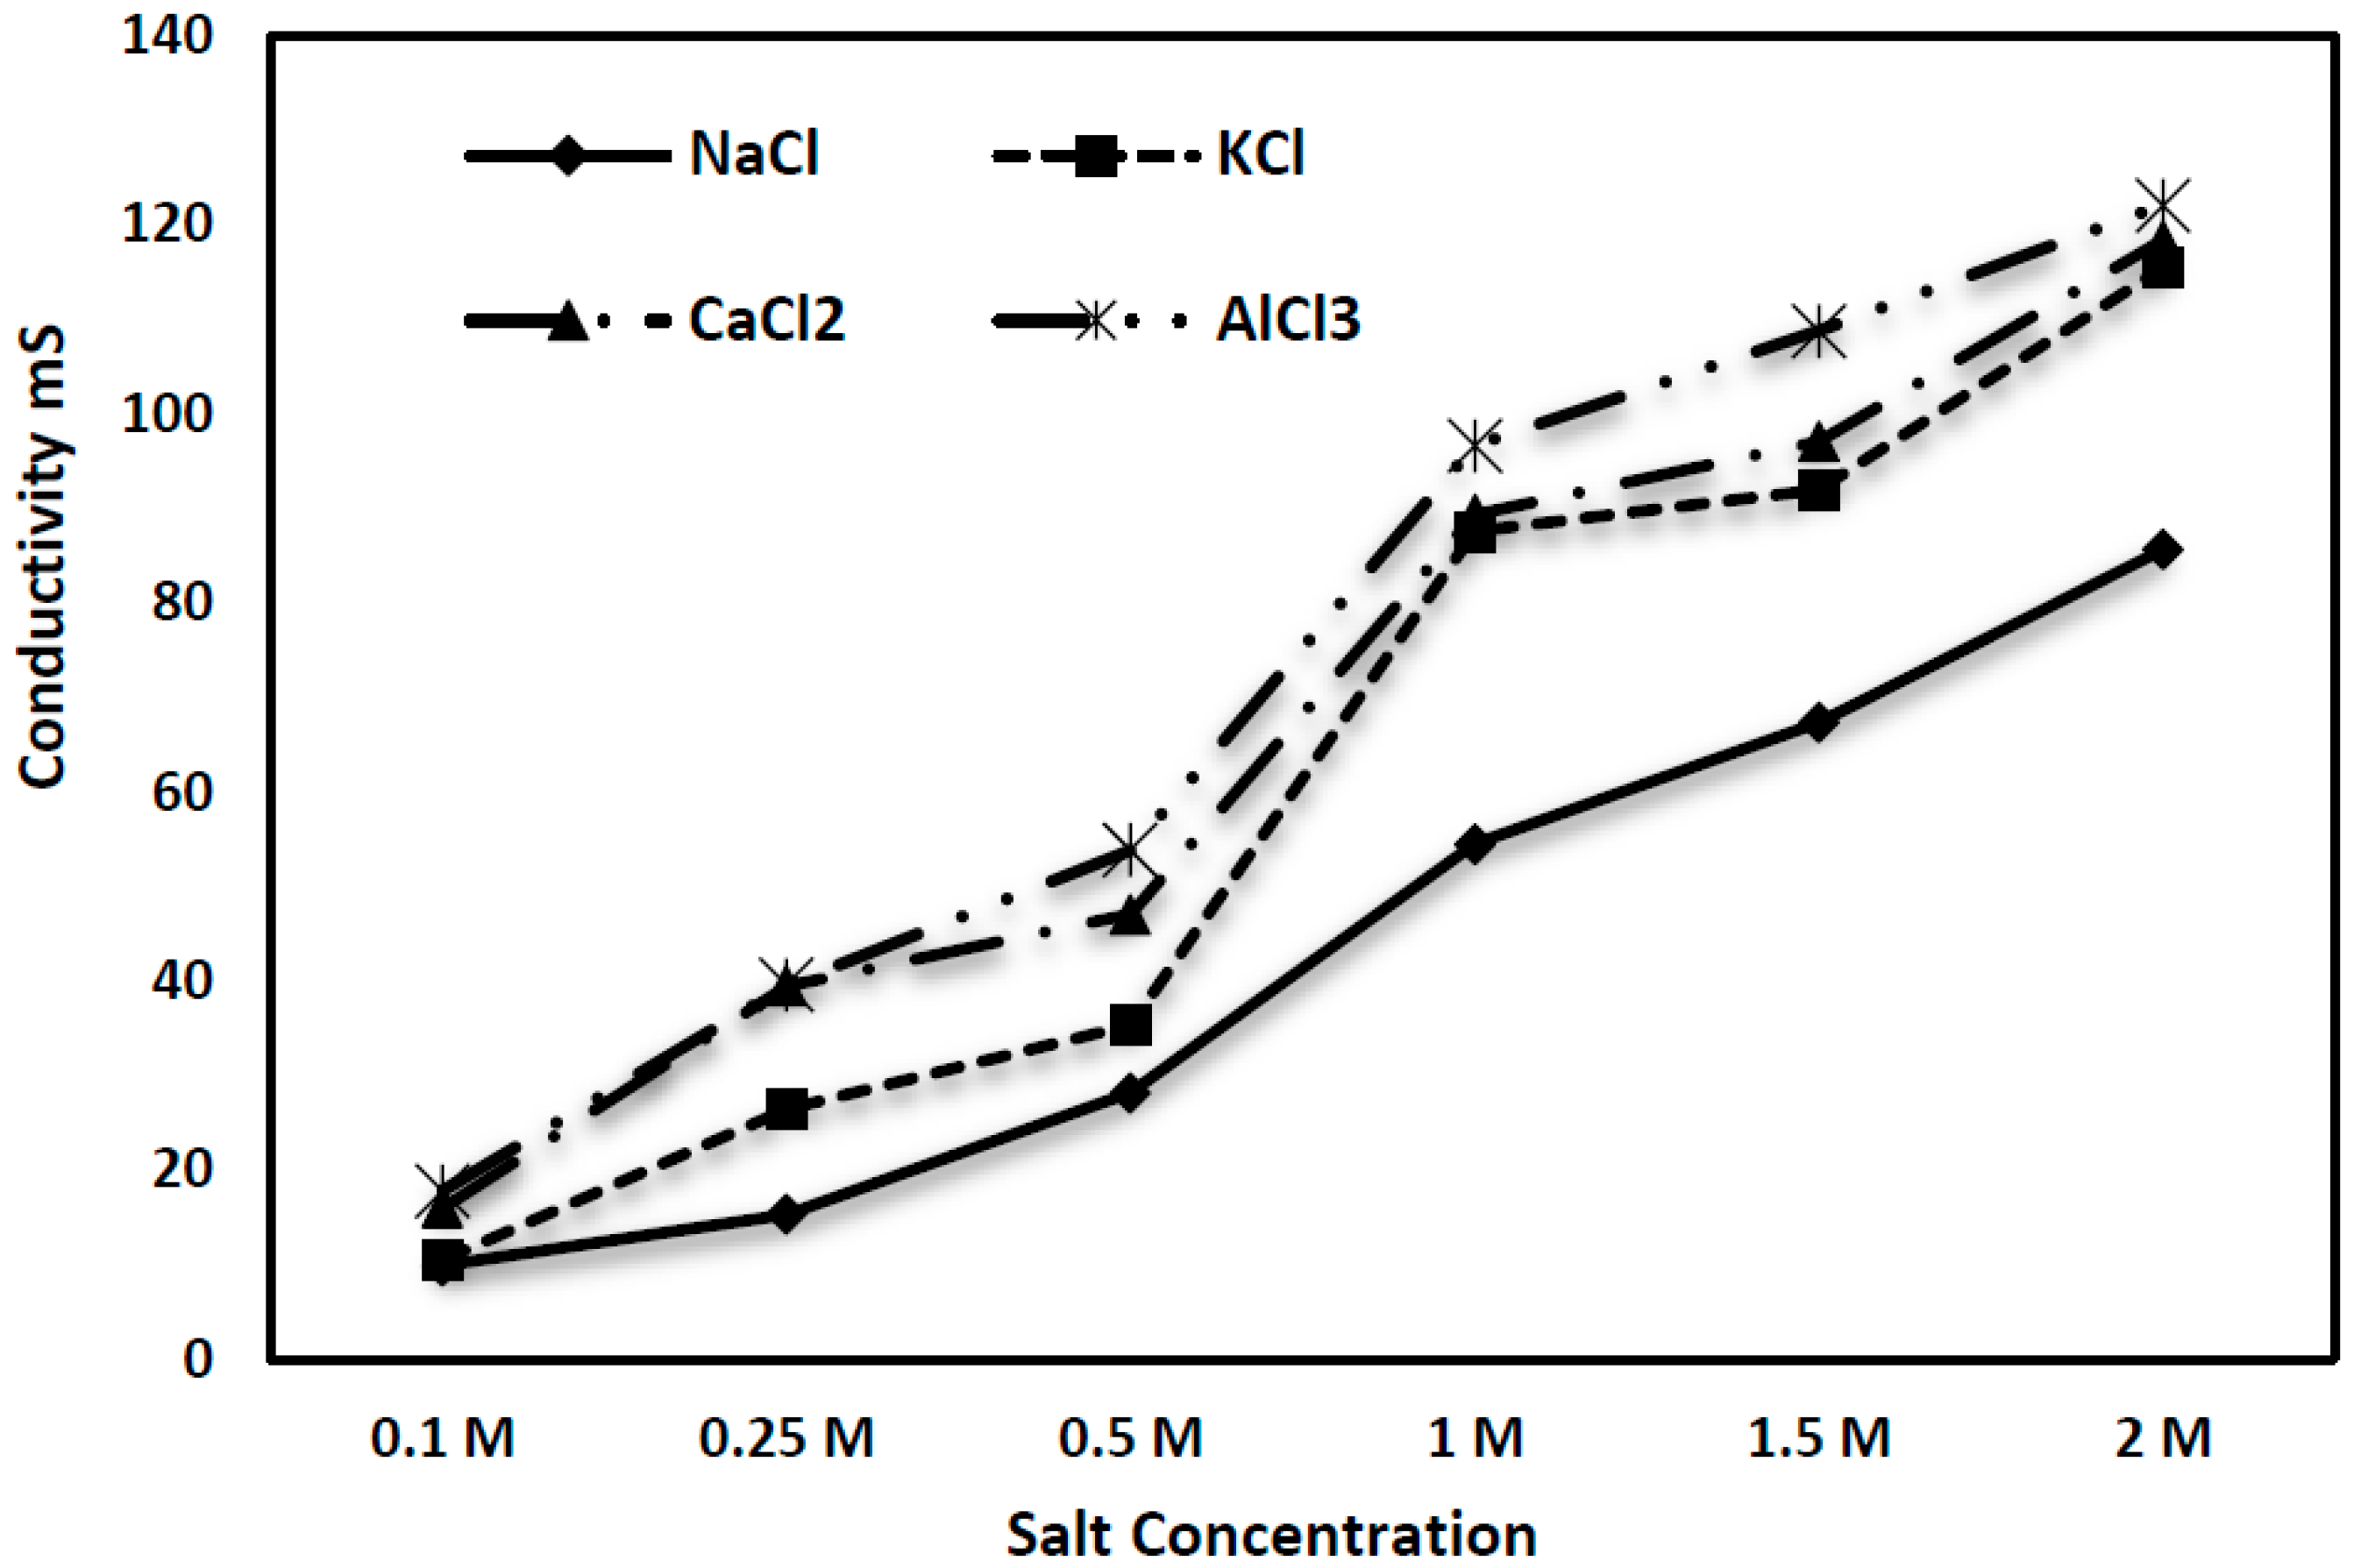
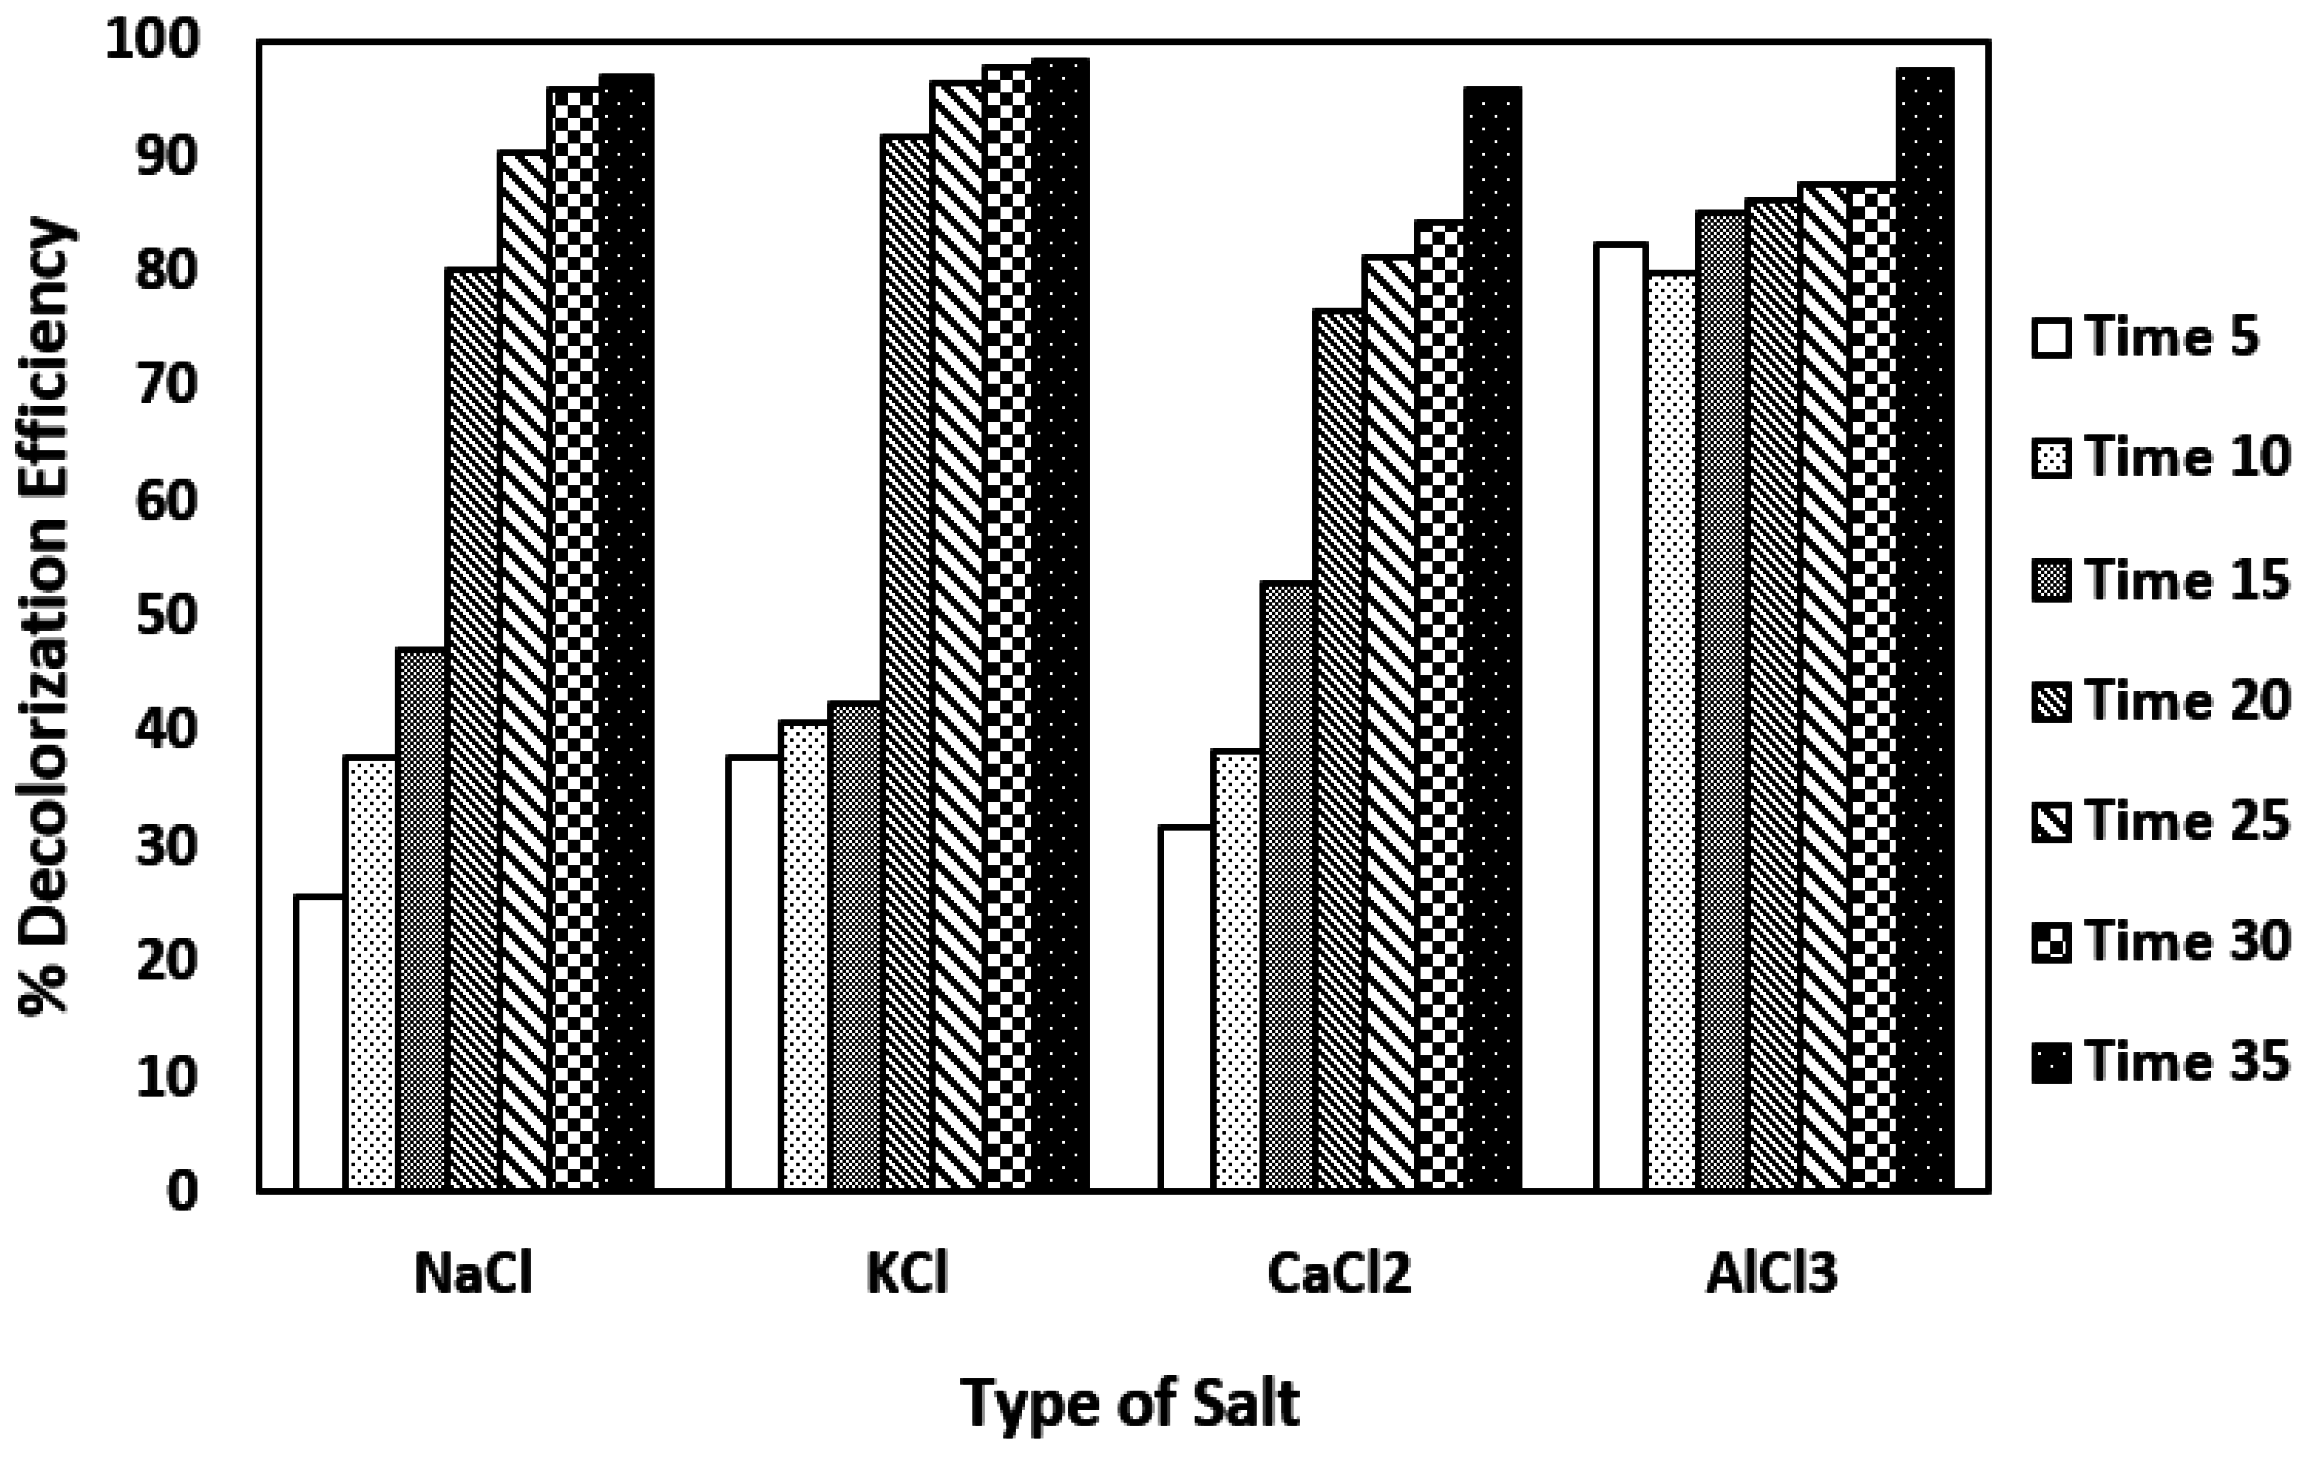
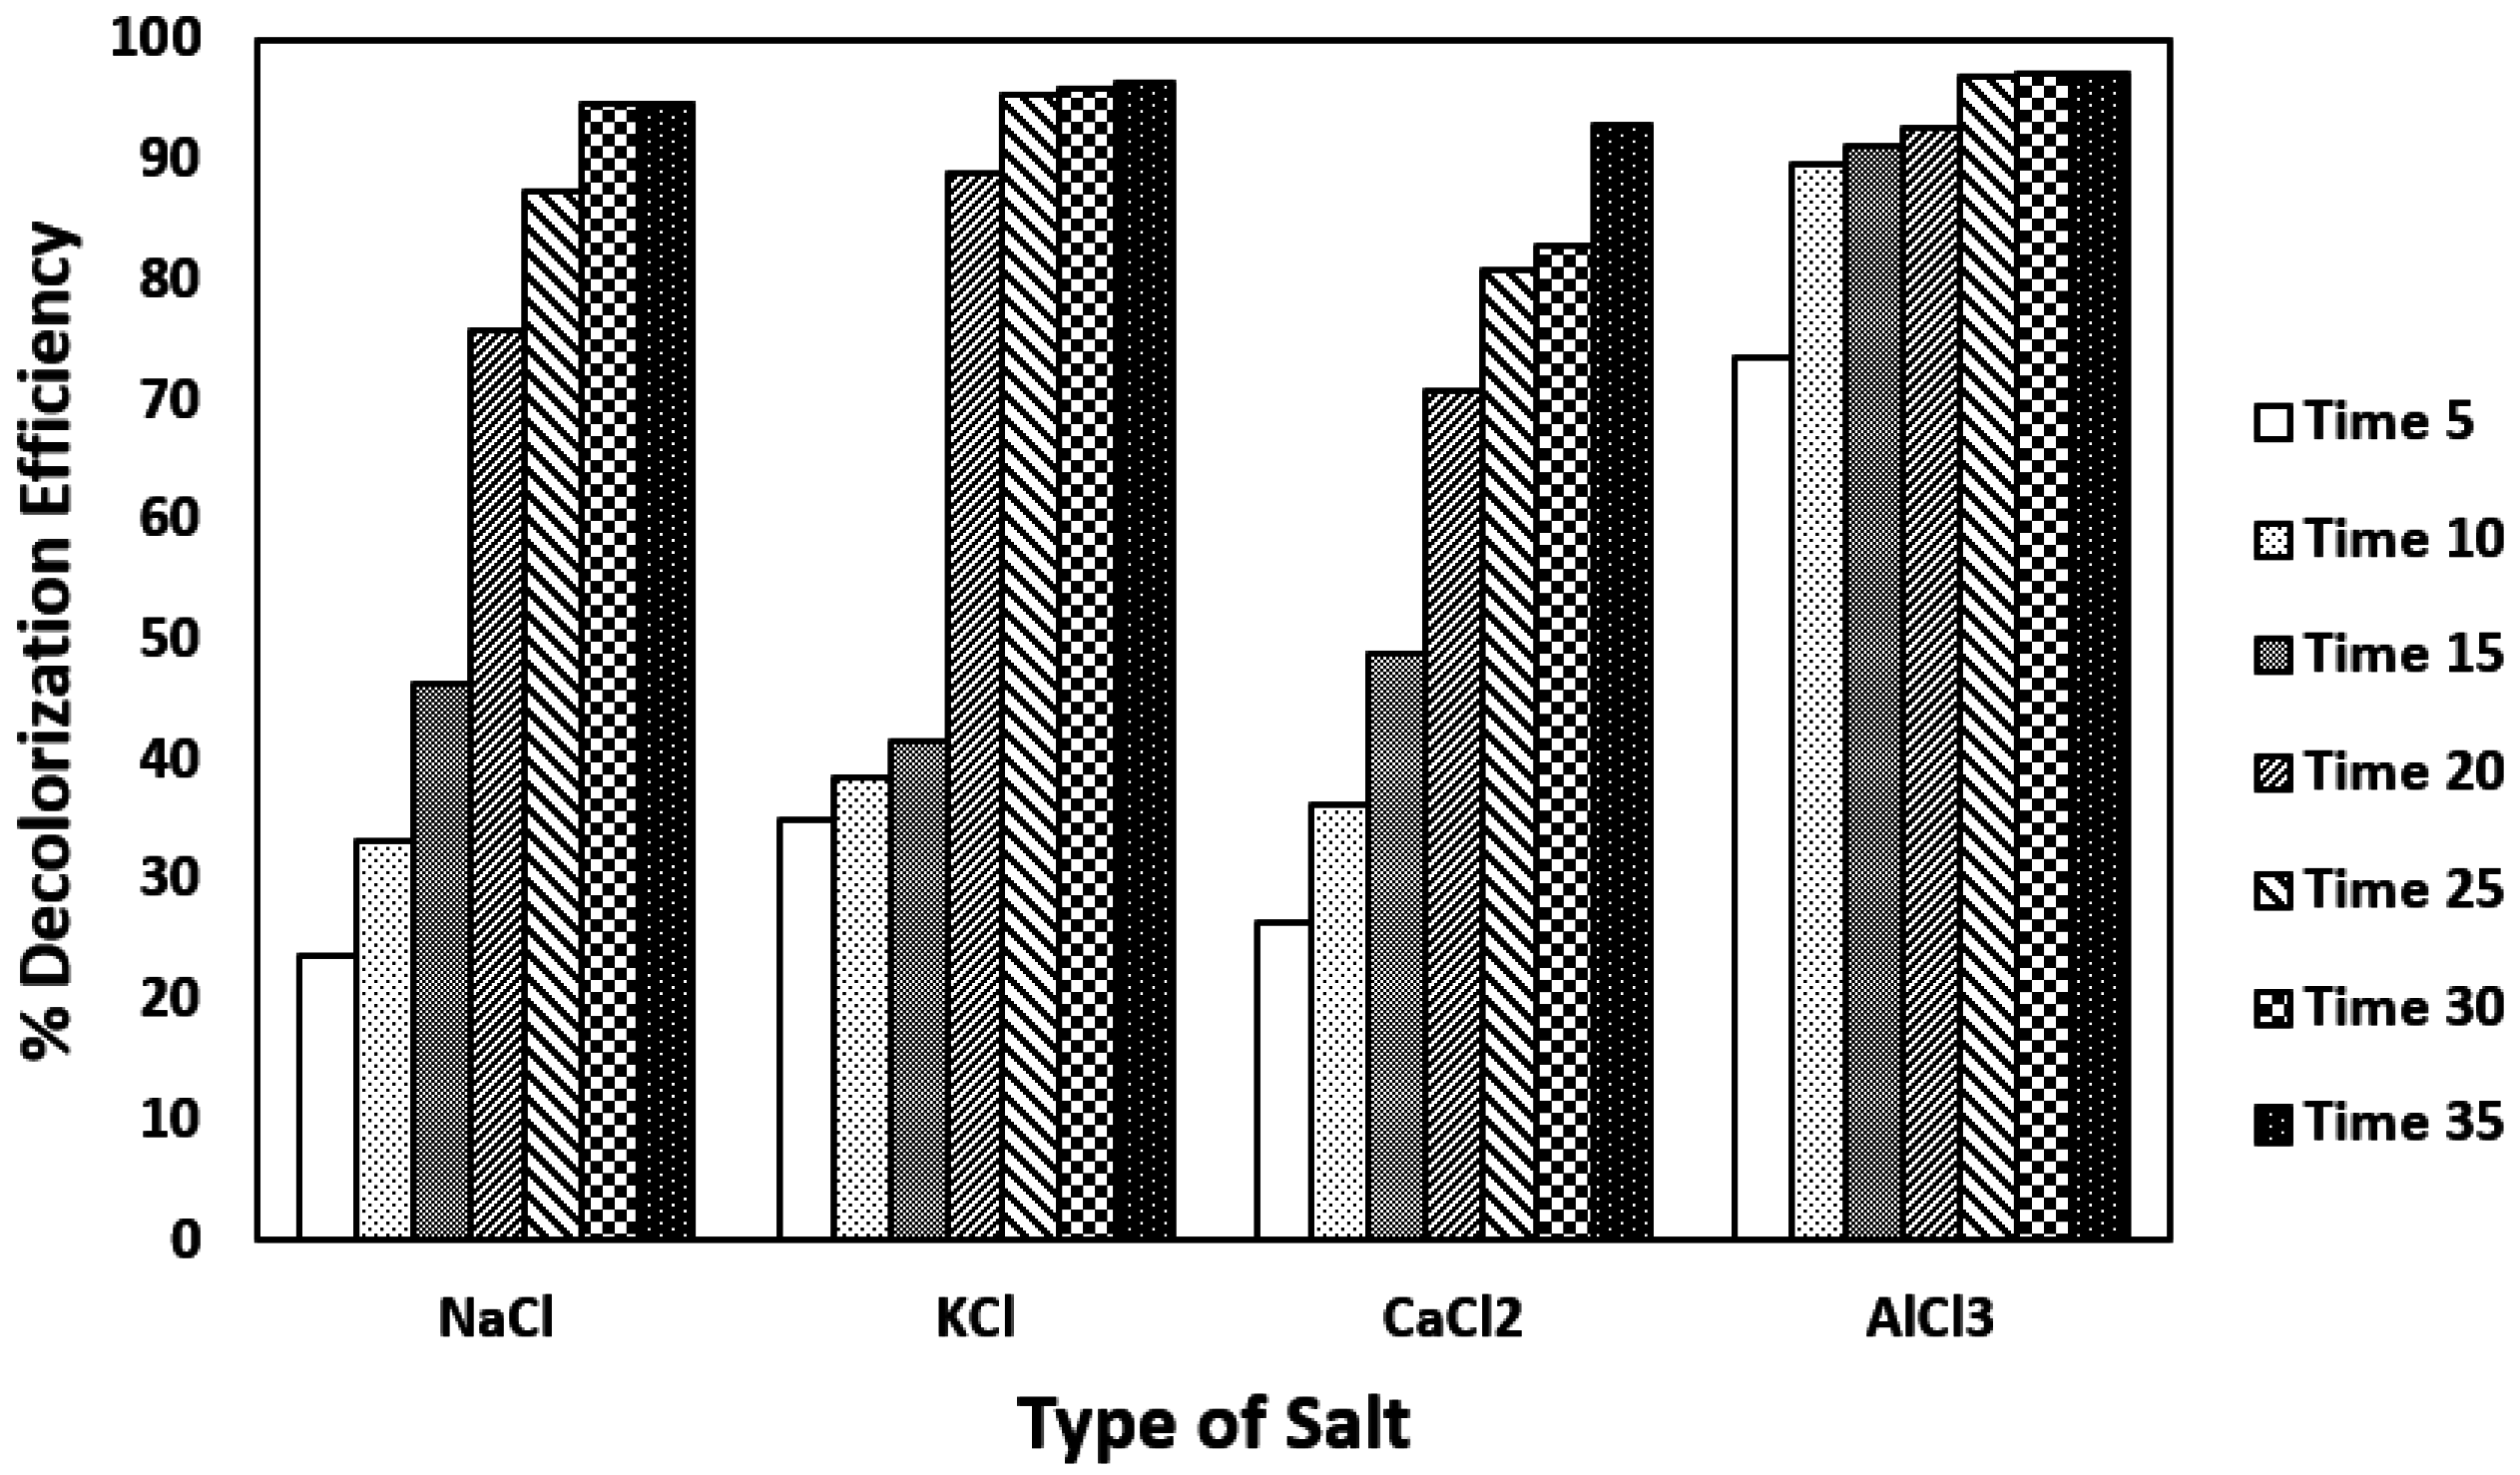
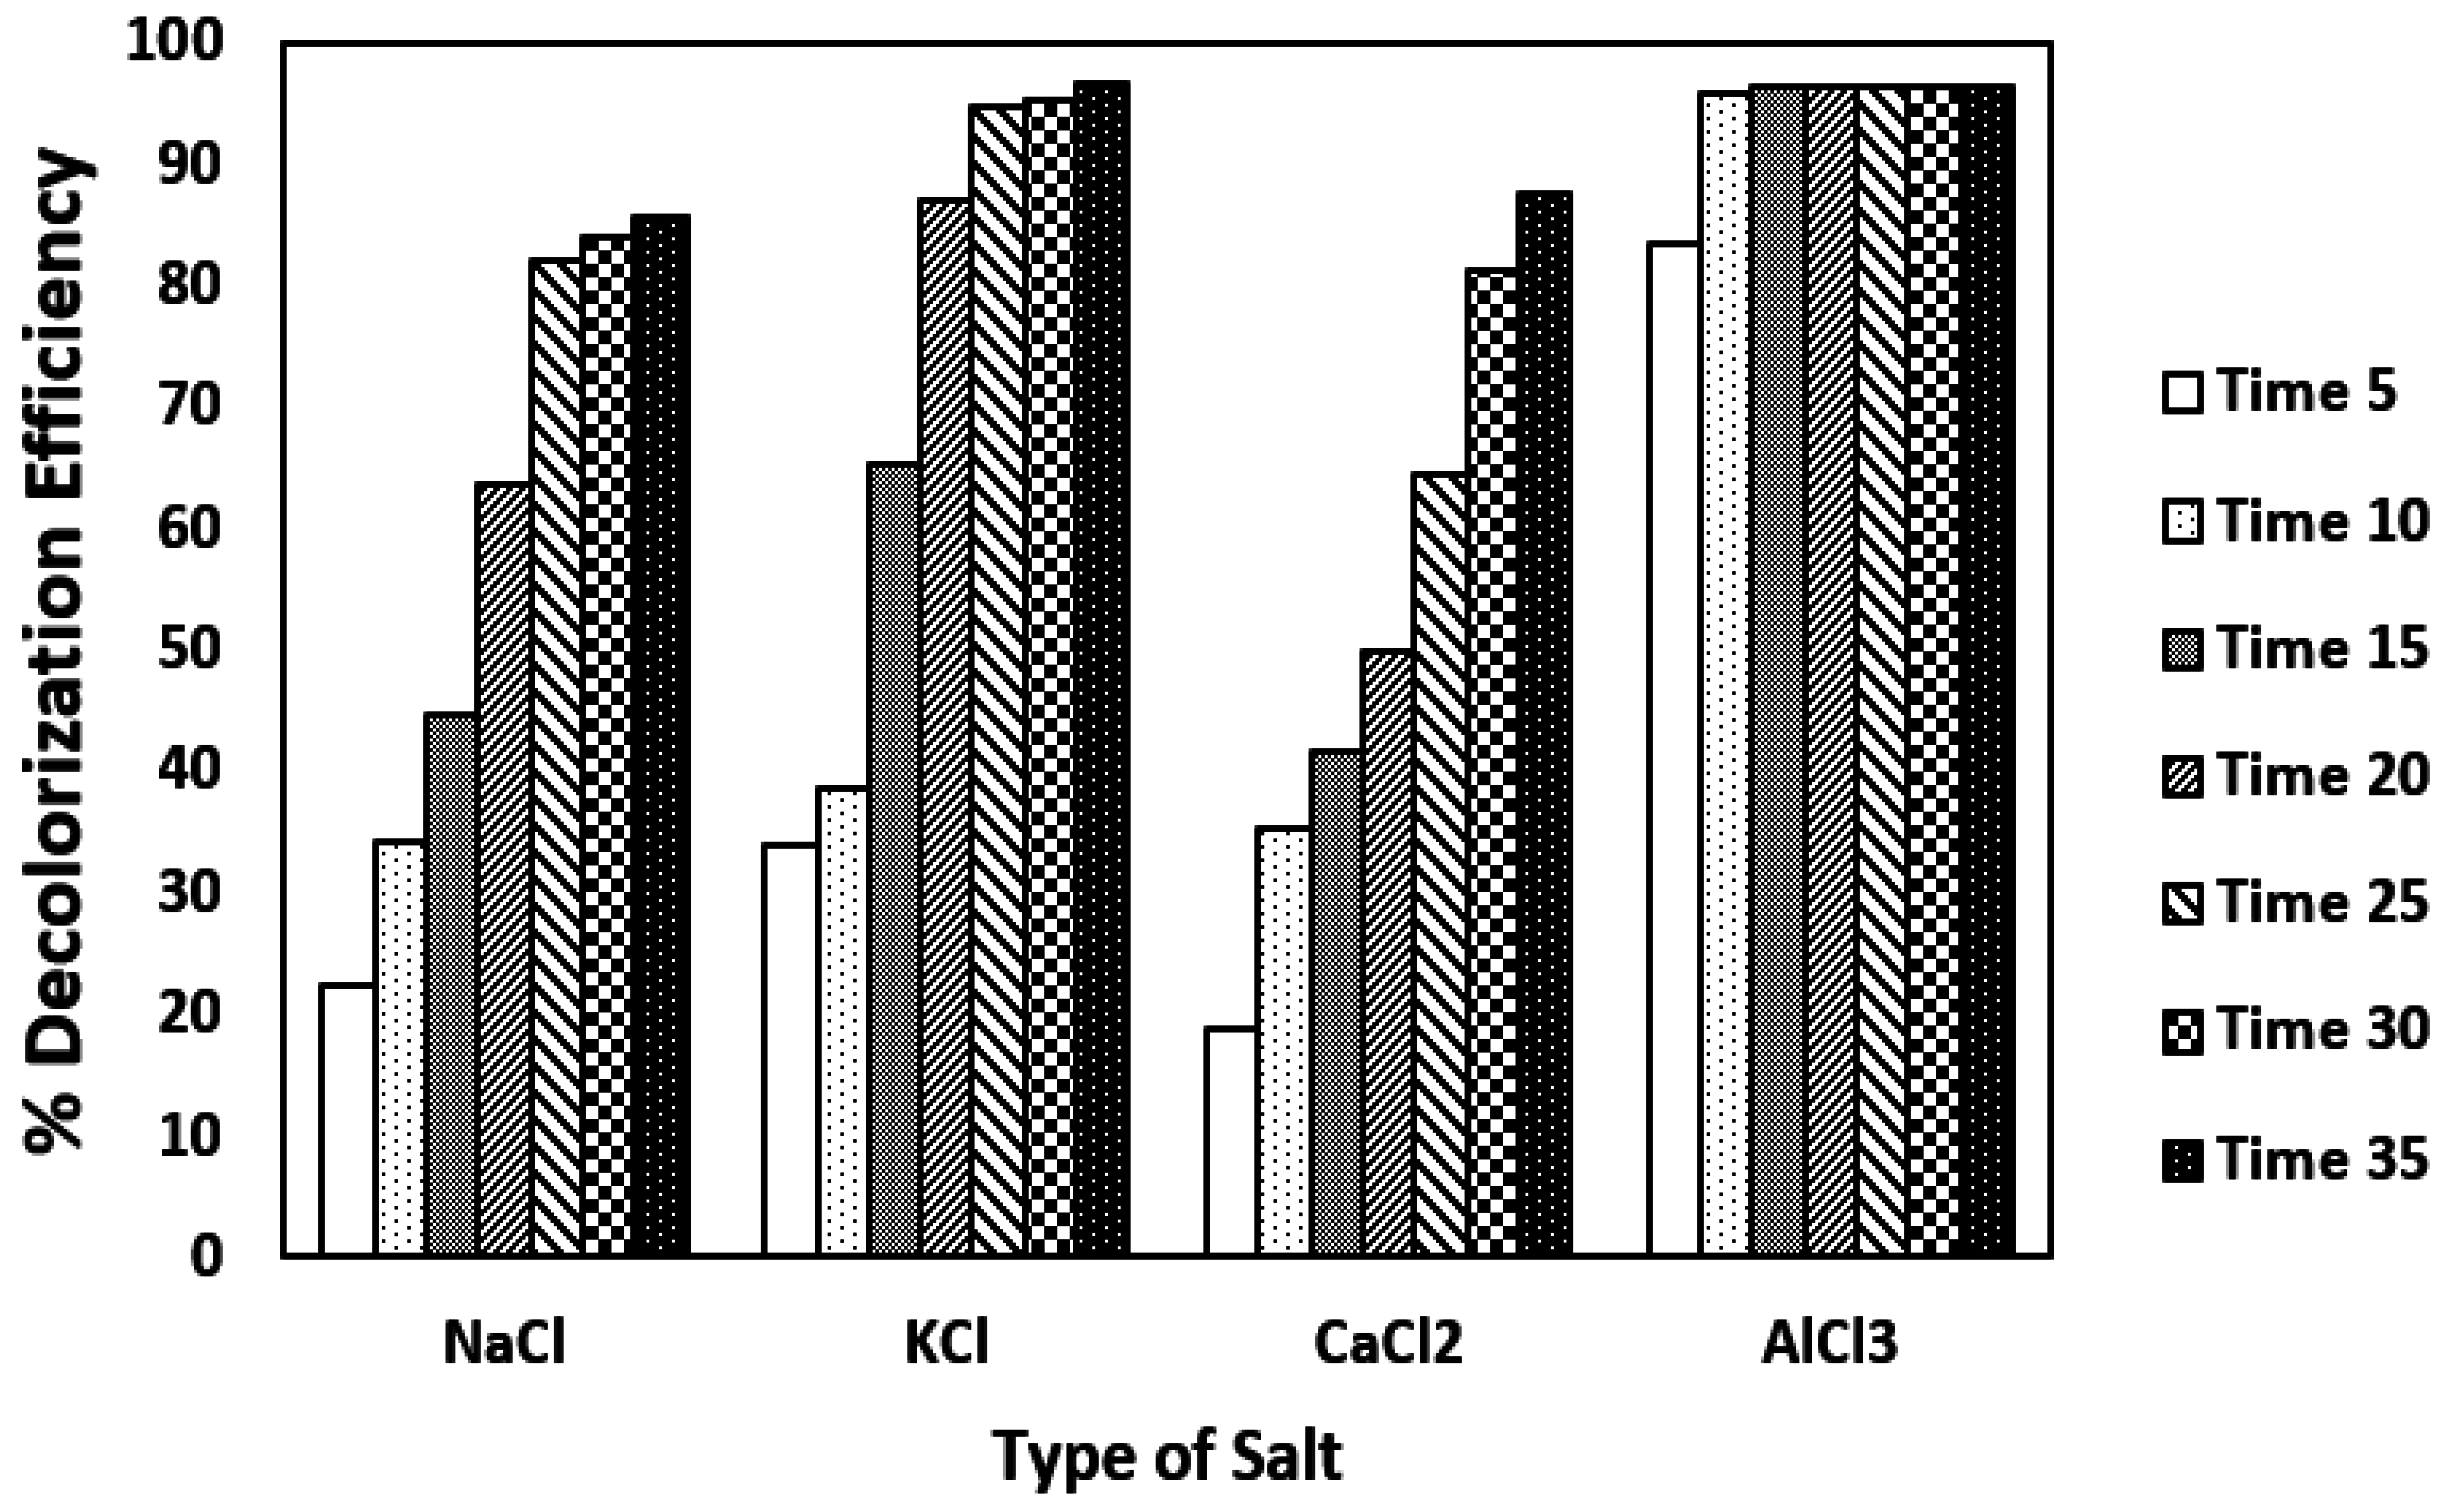
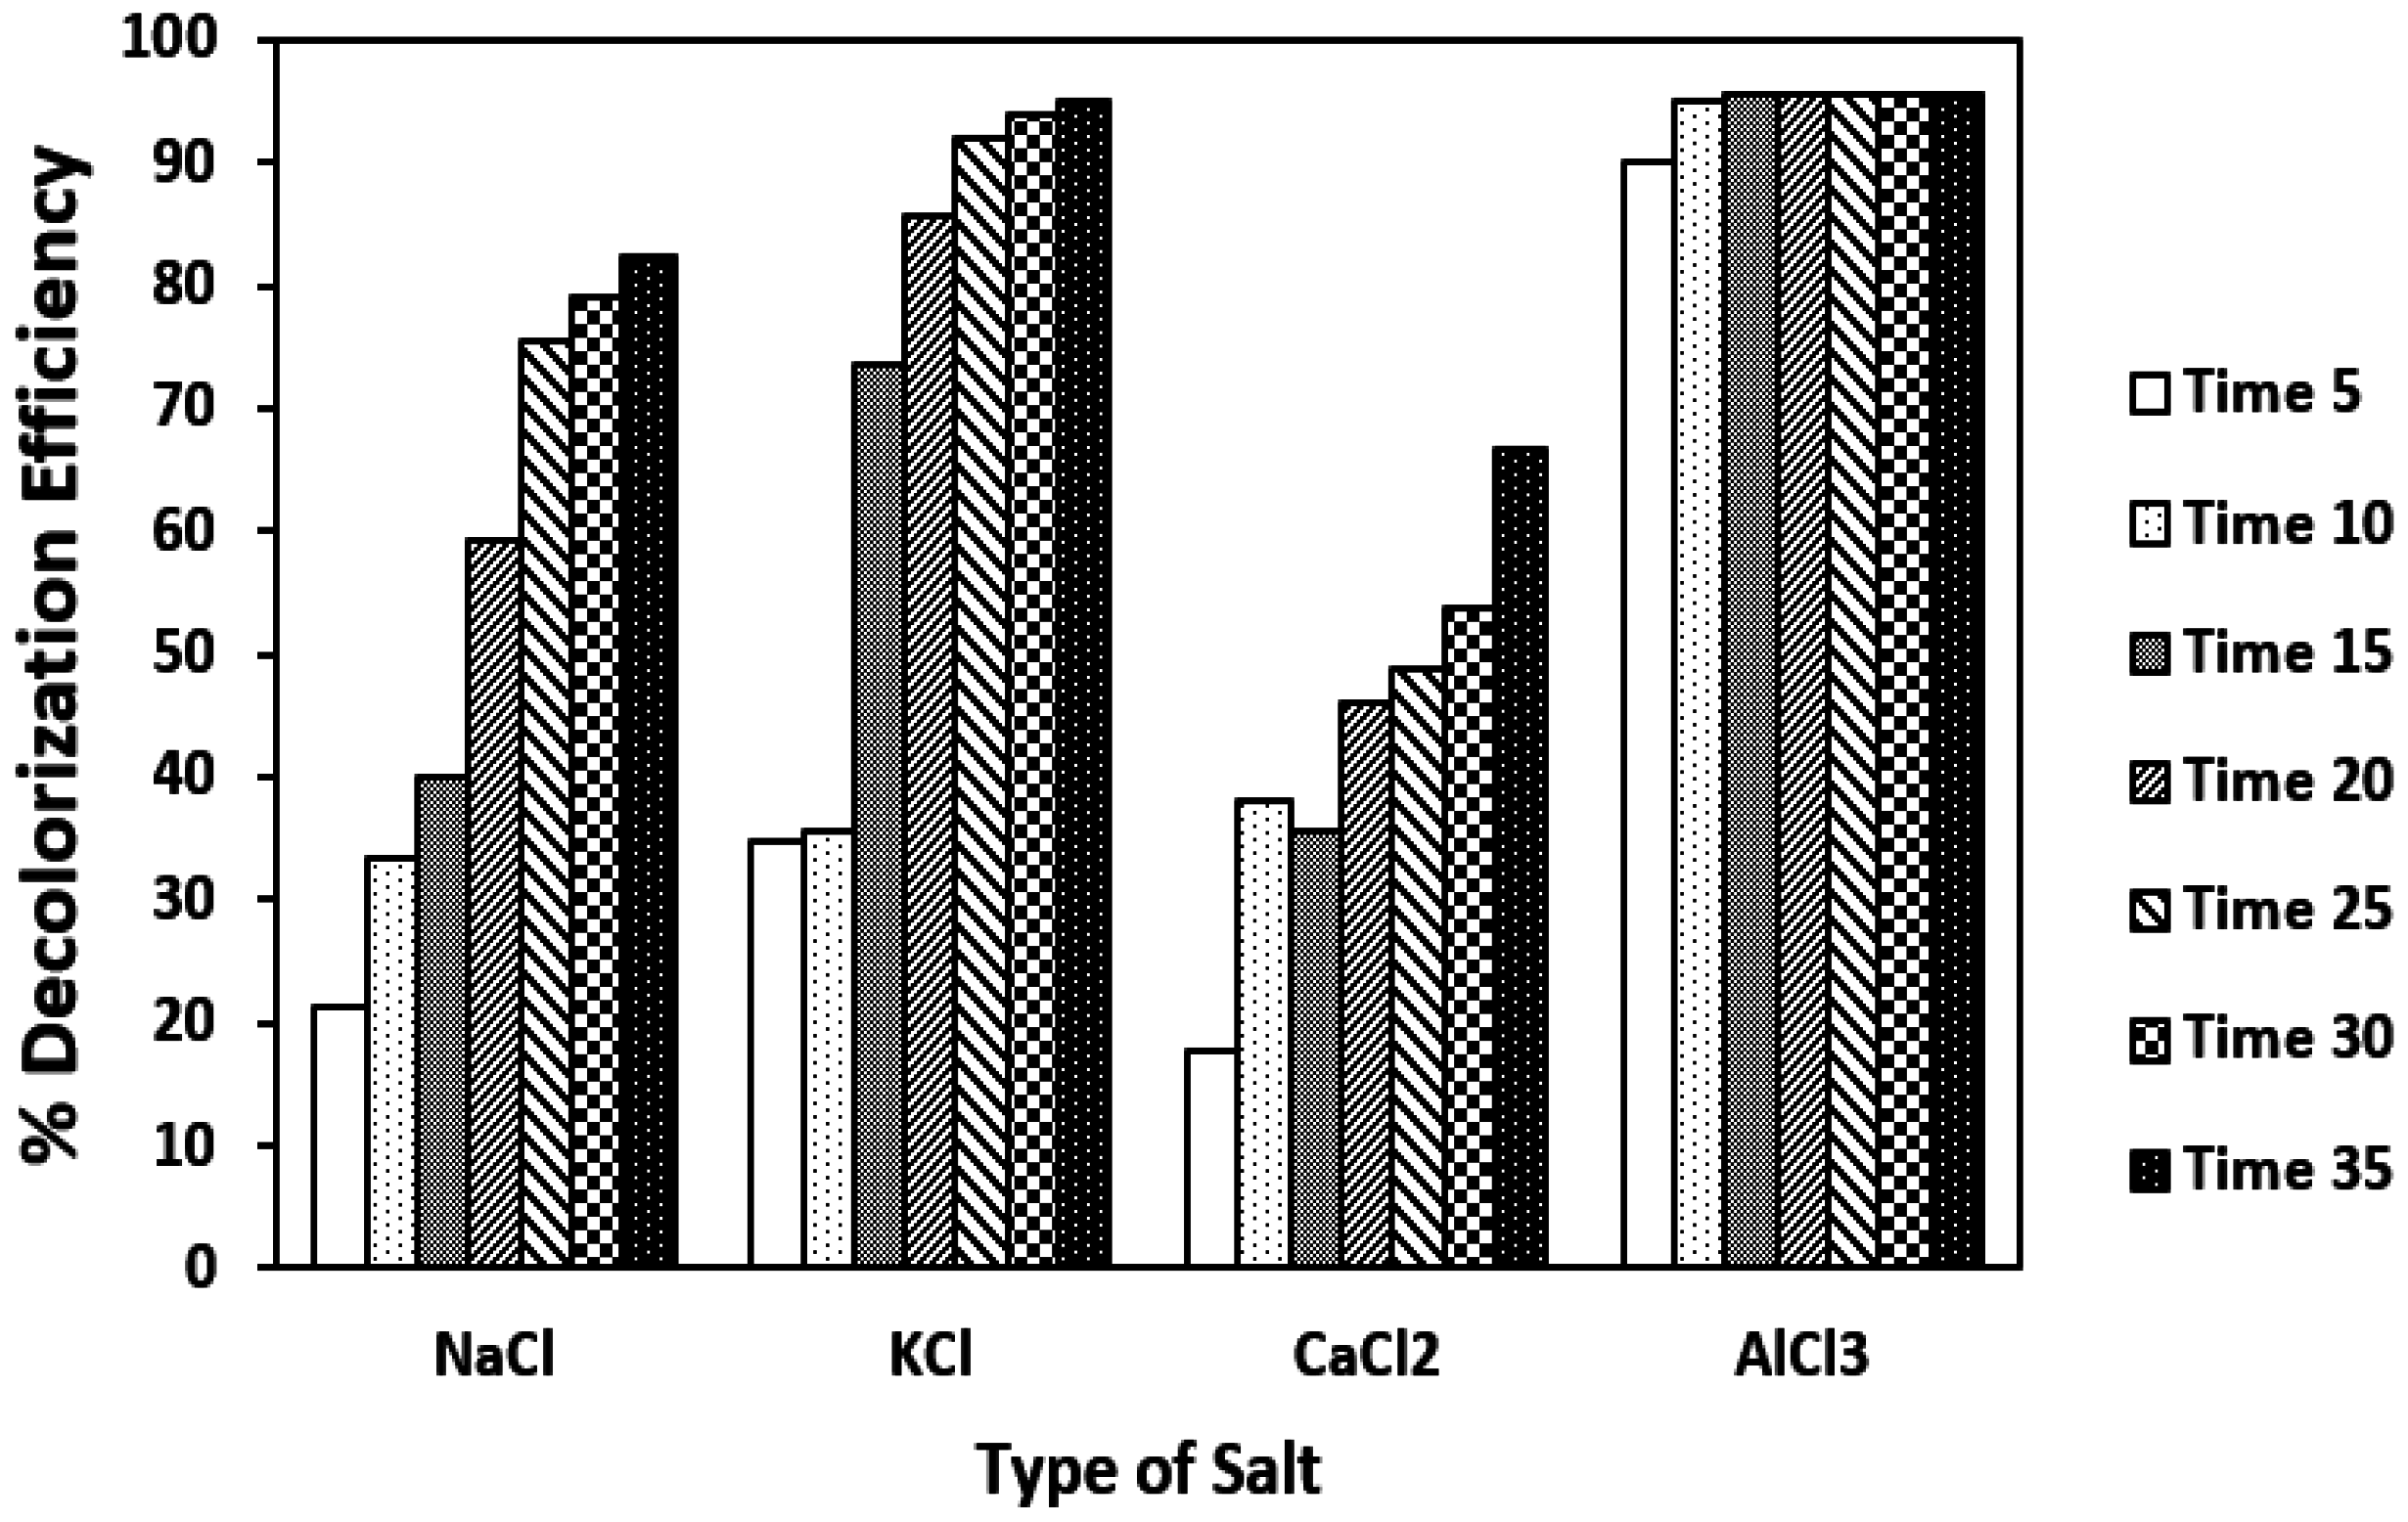
3.1. Impact of the Presence of Diverse Salts in the Dye Solutions

The influence of the presence of various salts associated with the dye solutions such as KCl, NaCl, CaCl2 and AlCl3 on the dye decolorization was examined and monitored through the variation of the solution conductivity. In contaminated water, the current flow in the water solution is due to the movement of ions inside the water instead of the movement of electrons like in a metal. Accordingly the influence of presence of different ions at the wastewater is very important. Clean water has a relative steady dielectric constant value of 78.4 (25 °C) and an electric conductivity of 44.29 µS (25 °C) [17]. The salts were added to the dye solution at various molar concentrations (2, 1.5, 1, 0.5, 0.25 and 0.1 M). The color removal efficiency has been estimated for the various studied salts after a treatment time of 35 min. Figure 6, Figure 7, Figure 8, Figure 9, Figure 10 and Figure 11 illustrate the change of decolorization effectiveness with increasing molar concentration of KCl, NaCl, CaCl2 and AlCl3 individually. It is seen from the figures that the presence of KCl, NaCl and AlCl3 with the organic dye pollutant has a positive impact on the Acid Blue 25 dye decolorization process. However, the presence of CaCl2 decreased the decolorization effectiveness. It was evident from the figures that AlCl3 has a strong influence on the Acid Blue decolorization process, as the presence of Cl ions also produces an oxidation potential that enhances the dye degradation process.
In addition, CaCl2 shows a strange behavior as the concentration of CaCl2 increases, whereby the decolorization efficiency was reduced due to the consumption of the active radicals and H2O2 generated by the action of Ca2+ ions. Moreover, we think that a small amount of Cl2 gas is generated when AlCl3 is utilized at small concentrations which has a negative impact on the dye degradation process, although the influence of the Cl2 gas generated using AlCl3 for dye degradation is extremely small compared with the action of O3 and H2O2. This observation was confirmed when CaCl2 that also produces Cl2 gas from its degradation is utilized. NaCl and KCl have normal behavior as the salt concentrations are changed. To better illustrate this point the diverse solution conductivities in the presence of the four salts are shown in Figure 12 and the discharge energy for every molar concentration is displayed in Figure 13.
As seen in Figure 12 the solution conductivity increased with increasing molar concentration of salts. This behavior is in harmony with the expected results because the presence of salt increases the number of mobile ions that increase the solution conductivity. The results from Figure 12 demonstrate that the energy release increased with the increase in the salt molar concentration; however, the energy release in the presence of CaCl2 and AlCl3 was decreased compared with the cases of KCl and NaCl.
The most significant factor affecting the decolorization process is the discharge power. Any wastewater treatment process should be characterized by its efficiency, cost and time effectiveness. The power needed for the decolorization process was estimated through multiplying the Root Mean Square (RMS) output current and RMS output voltage which are fed to the corona discharge reactor. The input power is equal to 108 W with a power efficiency of 78.7% with regard to the power consumption in the ignition coil that was indicated at Figure 13 at the times of 0.001 to 0.007 s. The duration of the decolorization process was selected as 25 min (1500 s) and the volume of industrial wastewater used was 100 mL.
It’s seen from Figure 14 that the discharge was pulsed-wave amplitude-modulated at a rate of 100 Hz. This allowed enough time to reach a steady state electron density during the on time, but, did not allow the electron density to reach zero during the off time because the electron density decay rate in air is slow. The power to the reactor and the magnitude of the voltage and current are plotted in Figure 14 and Figure 4, respectively. We have measured the voltage and current of a pulsed air discharge during glow turn-on and turn-off as shown in Figure 4. The power does not increase monotonically during the turn- on and does not decrease monotonically to zero at discharge turn-off, caused primarily by the external circuitry, and the power becomes negative at discharge turn-off also due primarily to the external circuitry as shown in Figure 14. During this time the electron density and current rise and the effective electron collision frequency decreases. Since the collision frequency acts as an indirect measure of the electron decreases from discharge turn-on. A larger average electron energy might account for some of the noted differences between pulsed and continuous glows [18,19]. Sunka [20] demonstrated that conductivity has no relation to the limit voltage. Also, he indicated that the higher voltage values of solutions with higher conductivity are capable of beginning the electrical discharge. Takahashi [21] established that the discharge-initiating voltage reduces as the path of conductivity action is extended. The improvement in the value of solution conductivity prompts a higher current stream and more compelling ohmic warming allowing vaporization frames. Since electrical discharge initiation disappears before by the water vaporization as considered, the improvement in solution conductivity will more likely lead to electrical discharge advancement and decrease the limit voltage. Looking at the effect of solution conductivity, it was agreed that the rise in solution conductivity prompts the higher power and plasma densities and more extraordinary UV radiation in the center of the electrical discharge.

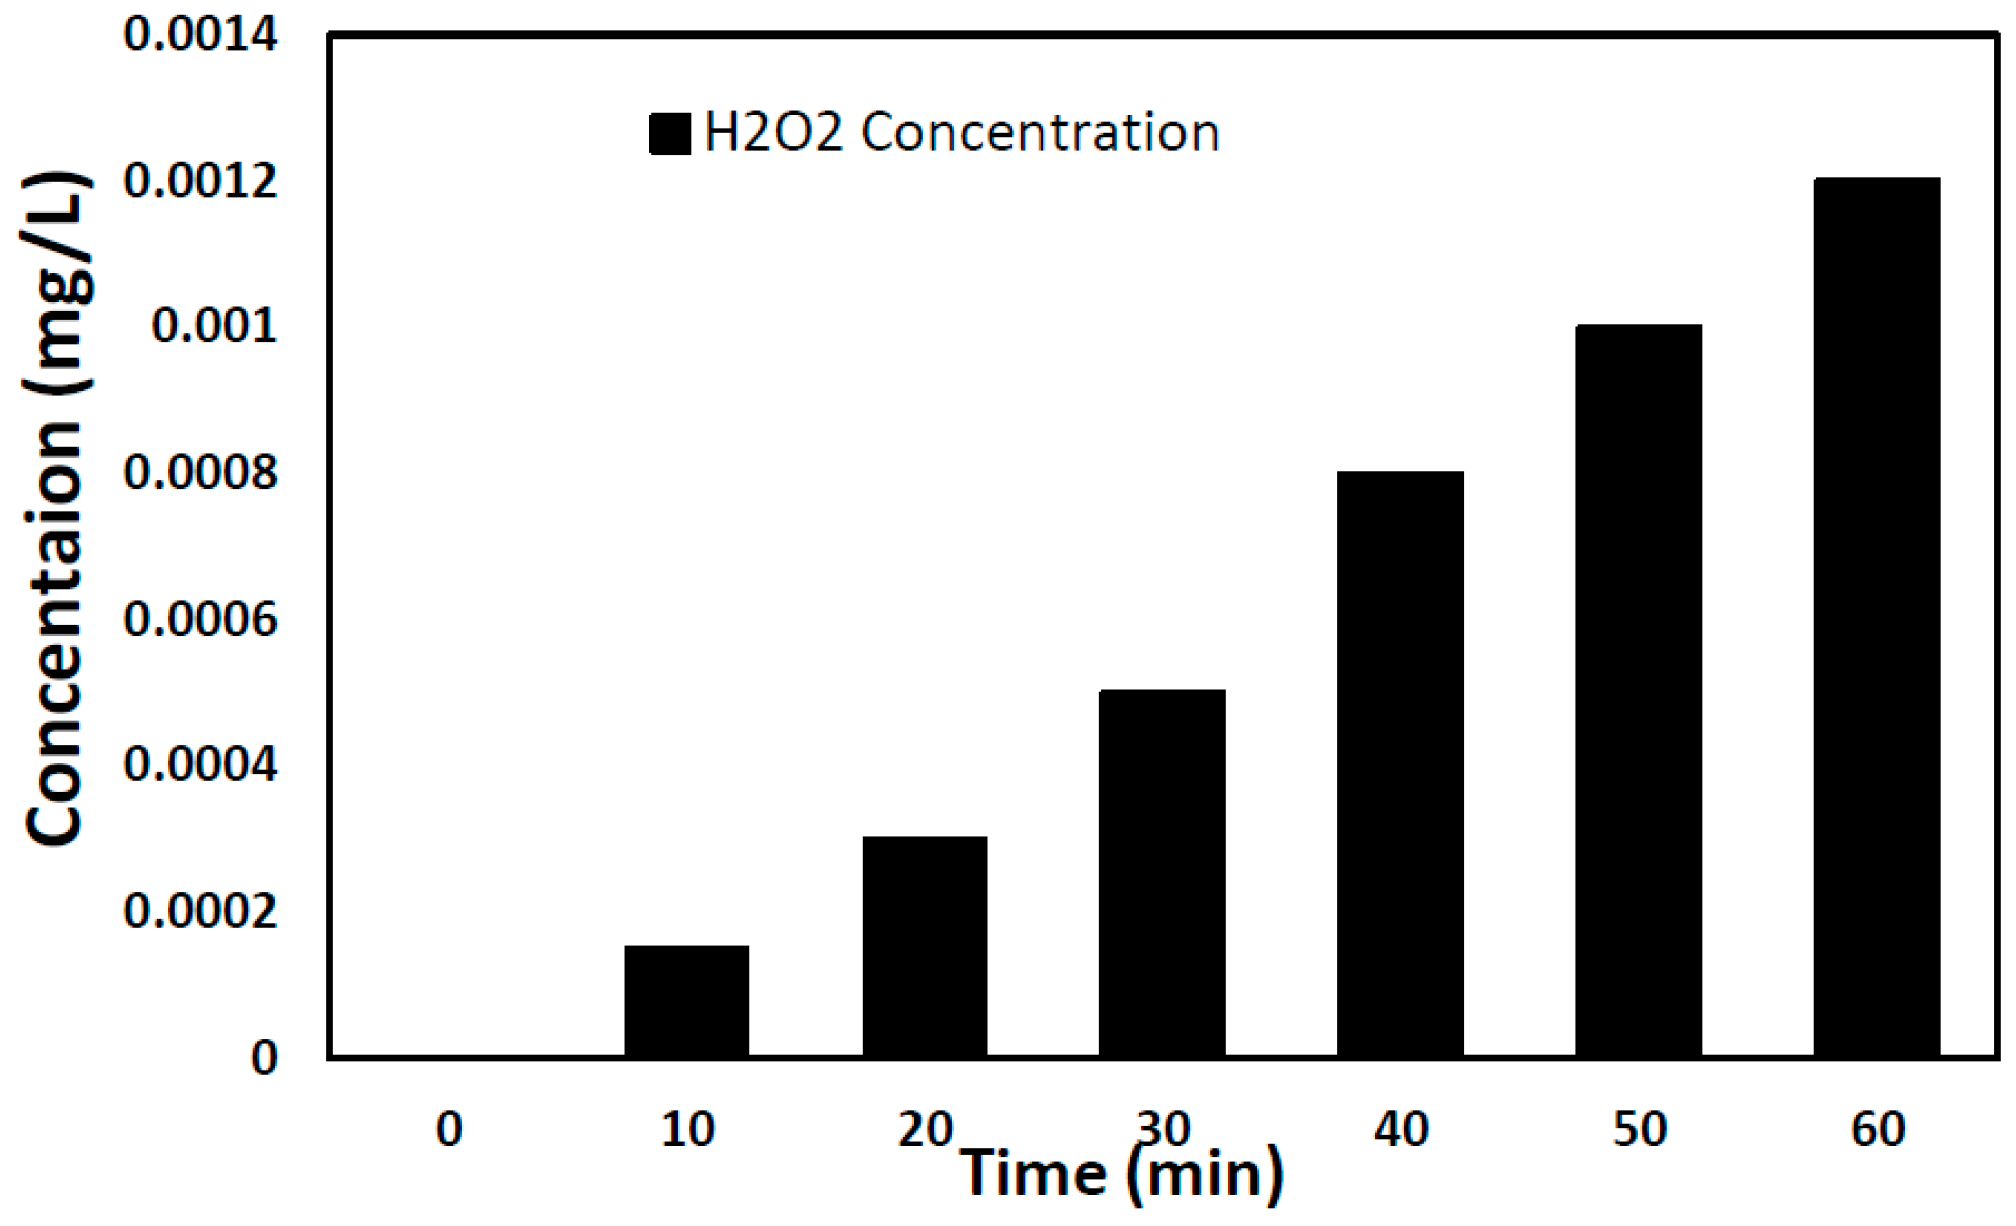
3.2. H2O2 Concentration Measurement

Hydrogen peroxide is a clear, colorless liquid, slightly more viscous than water. It is totally mixable in water and alcohols. Considering its redox potential, one would suppose hydrogen peroxide would act as a strong oxidizing agent. Many analytical methods use hydrogen peroxide as catalyst. The most common laboratory method used for the determination of hydrogen peroxide concentrations is the permanganate method, which is based upon the oxidizing characteristics of peroxide. In this method, potassium (VII) is reduced to potassium (II) according to reaction of Equation (2) [22,23]:
2 KMnO4 + 5 H2O2 + 3 H2SO4↔K2SO4 + 2 MnSO4 + 8 H2O + 5 O2
The overall stoichiometry of the reaction dictates that 10 mL of H2O2 withdrawn from the synthetic dye solution after the corona discharge treatment process will react with 5 mL of 4 N H2SO4. The titration process is done under acidic situations. The solution of peroxide was titrated with 0.01 N KMnO4 until a permanent color absence is observed and then the volume of permanganate is recorded. This experiment was repeated every 10 min and the concentration of H2O2 was calculated by Equation (3):
(C × V) KMnO4 = (C* × V*) H2O2
where C = the concentration of KMnO4; V = the volume of KMnO4; C* = the concentration of H2O2; V* = the volume of H2O2.
H2O2 is one of significant oxidants produced in NTP. Throughout the current study, H2O2 was formed in the plasma. Figure 15 shows the variation of H2O2 concentration over the studied treatment process period. It was indicated that the amount of H2O2 at the solution increased with the reaction time. This behavior may be due to the decreasing number of dye molecules that needed to be degraded, which enhances the concentration of H2O2 in the solution.

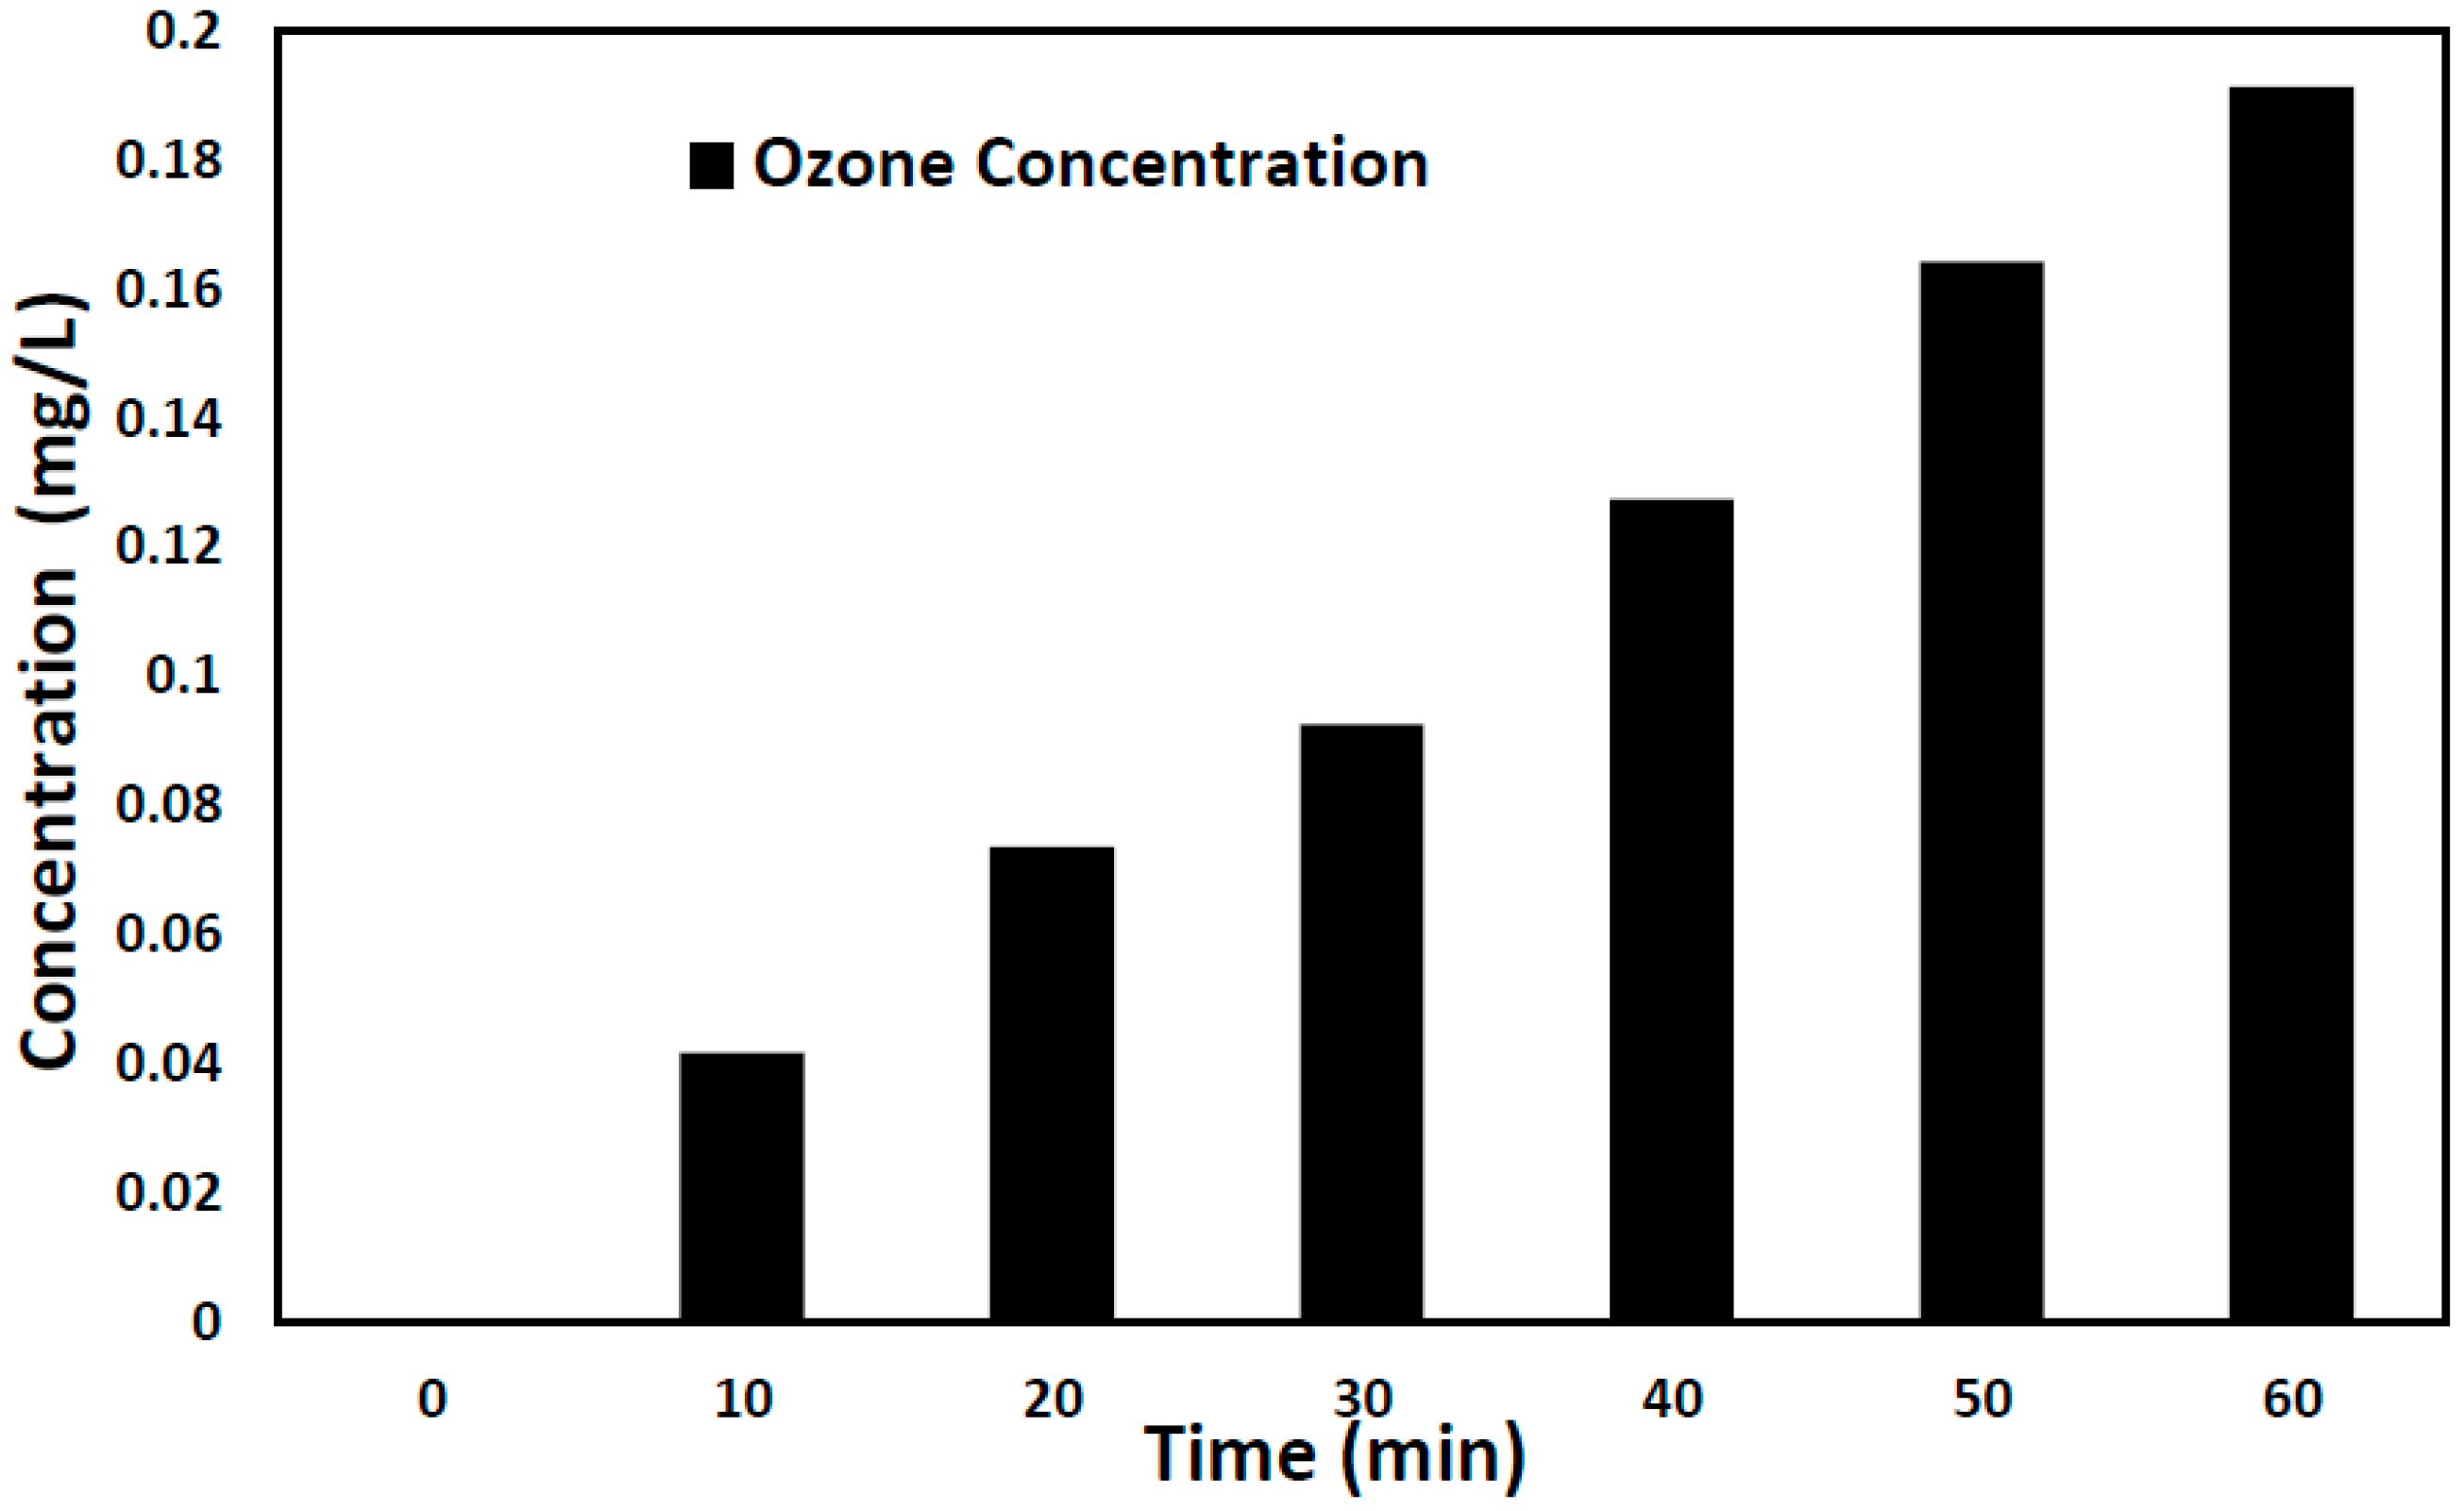
3.3. Ozone Concentration in Treated Water

Ozone is an inorganic molecule with the formula O3. It is a light blue gas with a particularly noticeable smell. The quantity of O3 in the polluted water was measured using the iodometric technique. For this the ozone produced was absorbed in an alkaline 2% potassium iodide (KI) solution (70 mL), which was then acidified by adding 5 mL of 2 N H2SO4 solution, to form iodine from the KI3 complex. The obtained iodide shows a blue coloration when 1 mL of starch solution (0.5%), is added and its amount was defined by titrating with 0.001 N Na2S2O3 solution. The chemical reactions involved, which occur in acid medium, were investigated based on the following Equations (4) and (5) [24,25]:
H2O + O3 + 2 KI→I2 + 2 KOH + O2
2 Na2S2O3 + I2→Na2S4O6 + 2 NaI
For concentrations between 2 and 160 mg O3/L, the error of the method was determined to be within 1%. The quantity of absorbed ozone was estimated with the following formula (6) [24,25]:
C = 171.6 × 10⁻³ × (V2/V1)
where V1 = is the volume of KI solution (2%) and V2 = the volume of Na2S2O3 solution employed in the titration process.
The iodometric method was used for determination the ozone generated in the dye solution during the plasma treatment process, where the sample was measured before and after the plasma treatment process. The ozone in the discharge air is shown in Figure 16. It was evidenced from this figure that the ozone concentration increased with increasing treatment process time and this may be regarded due to the reduction in the amount of dye molecules present in the solution.

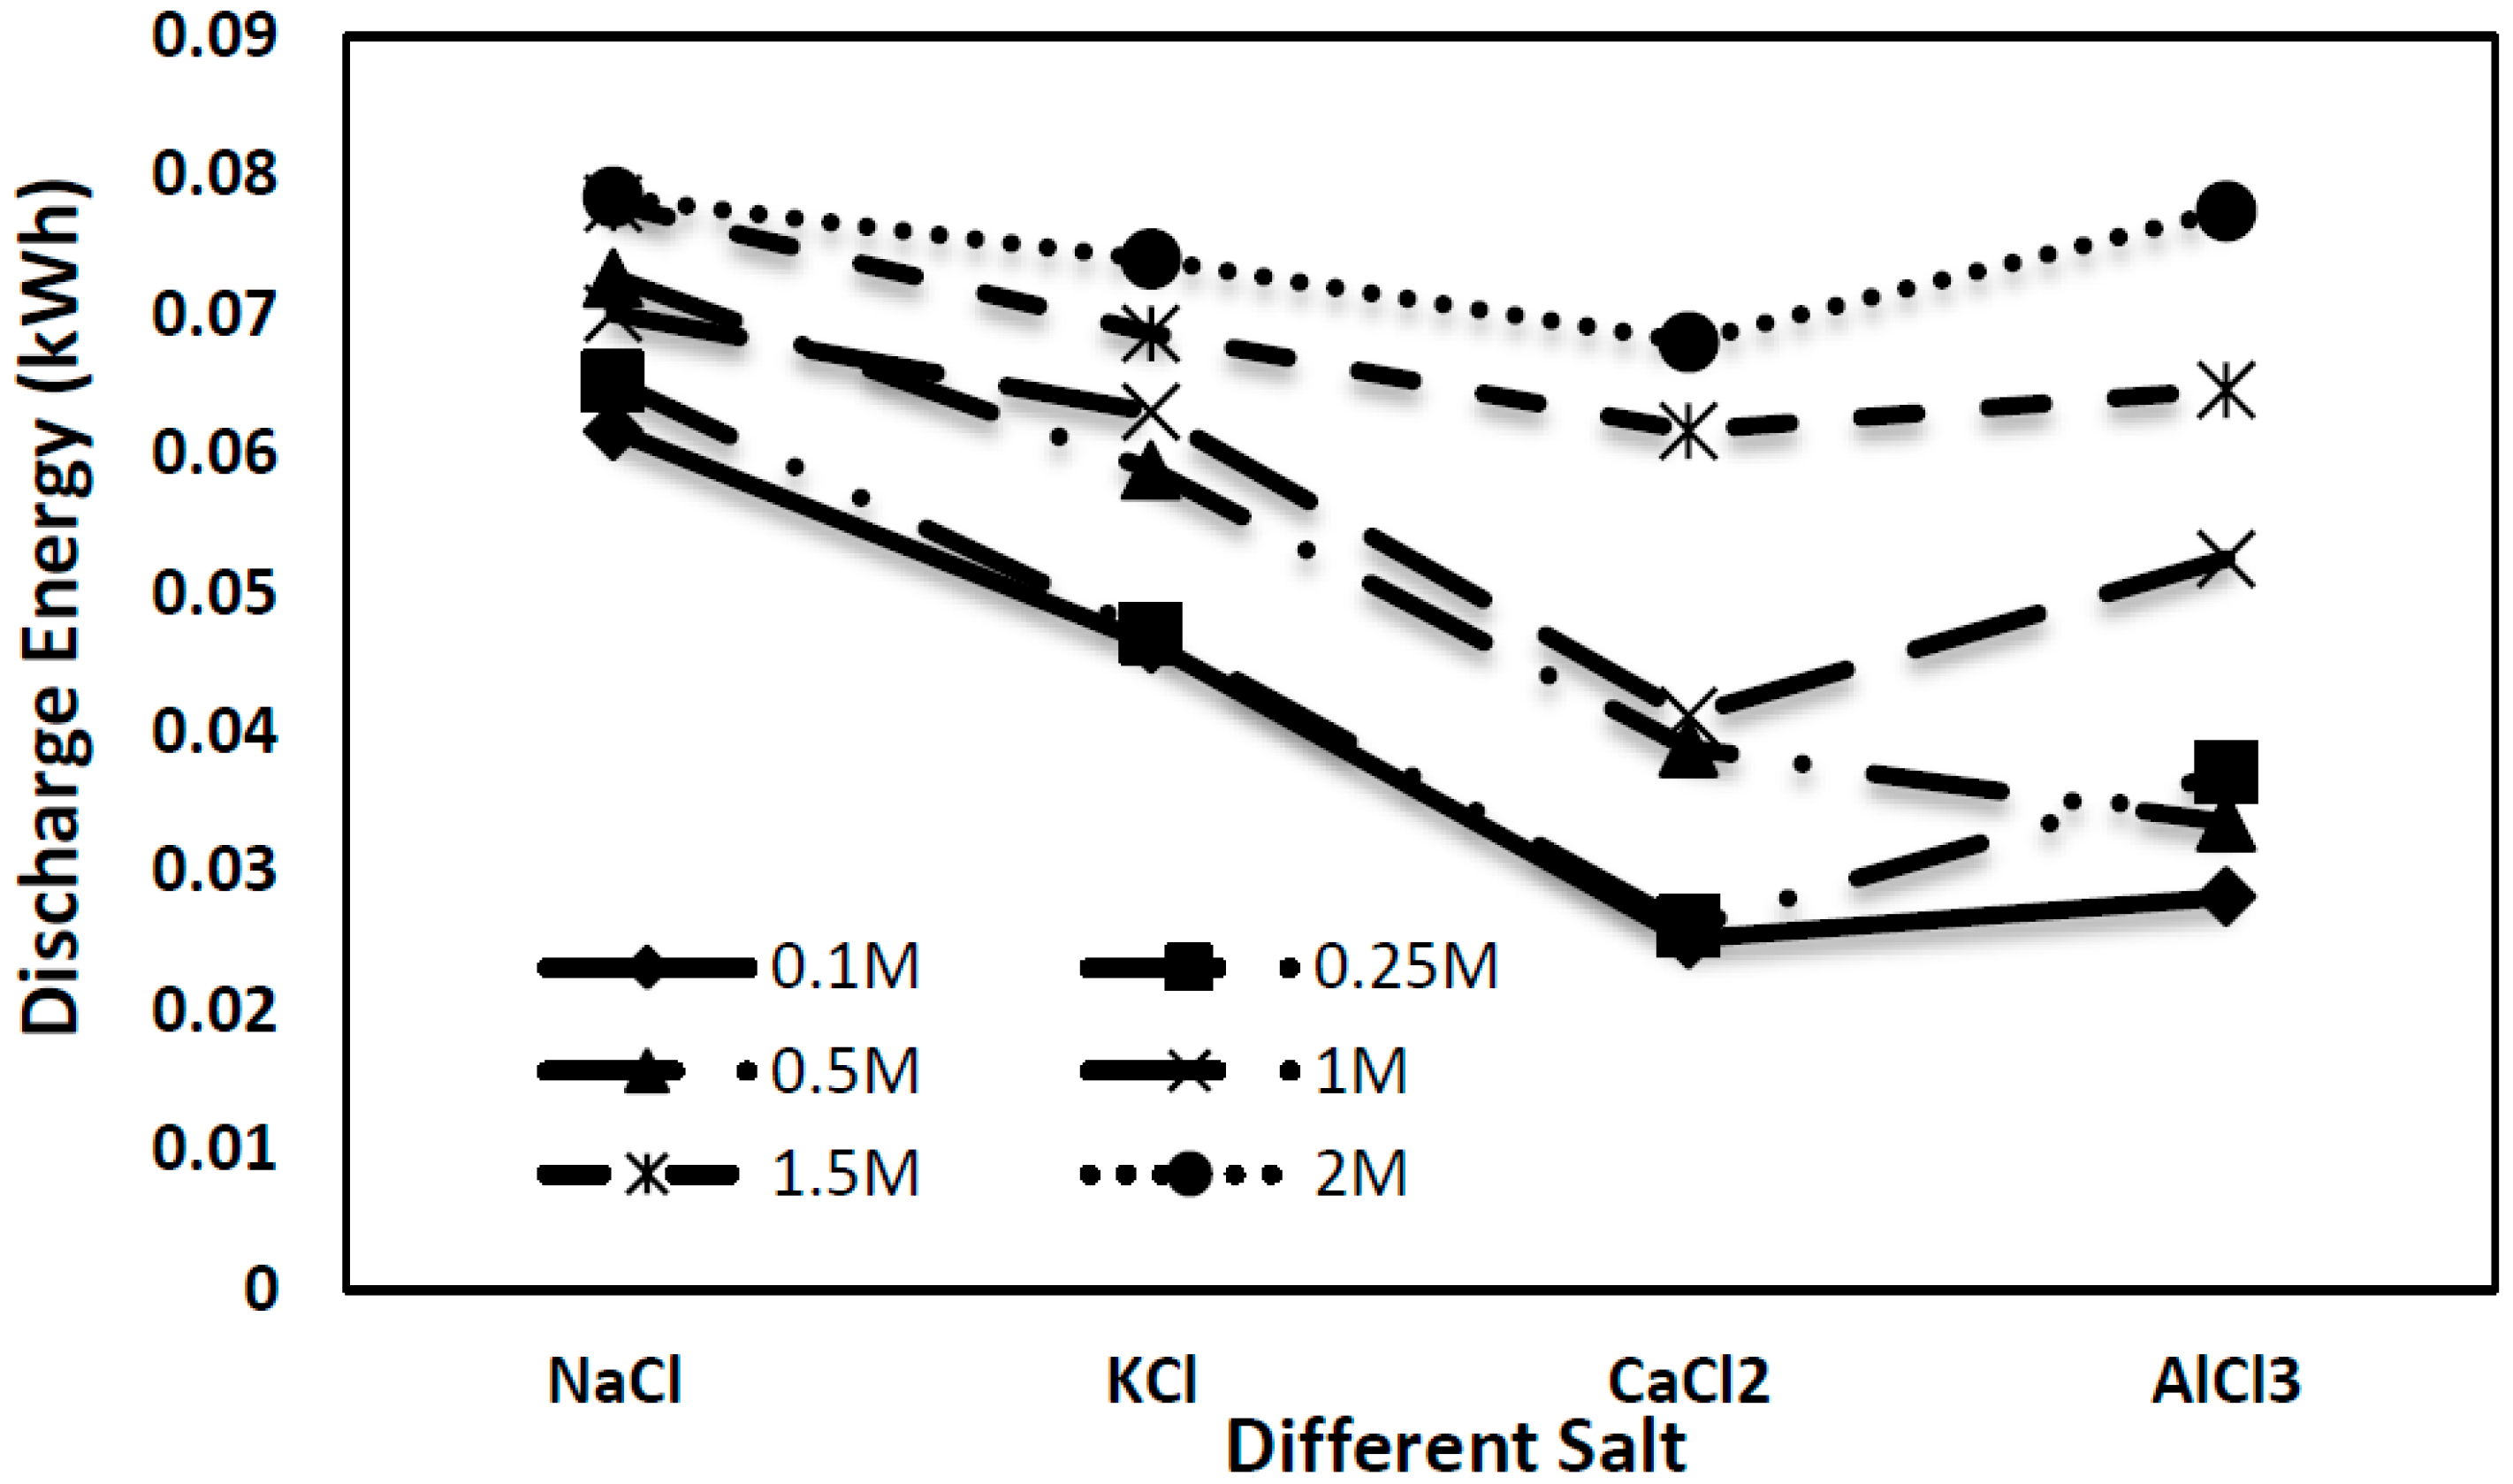
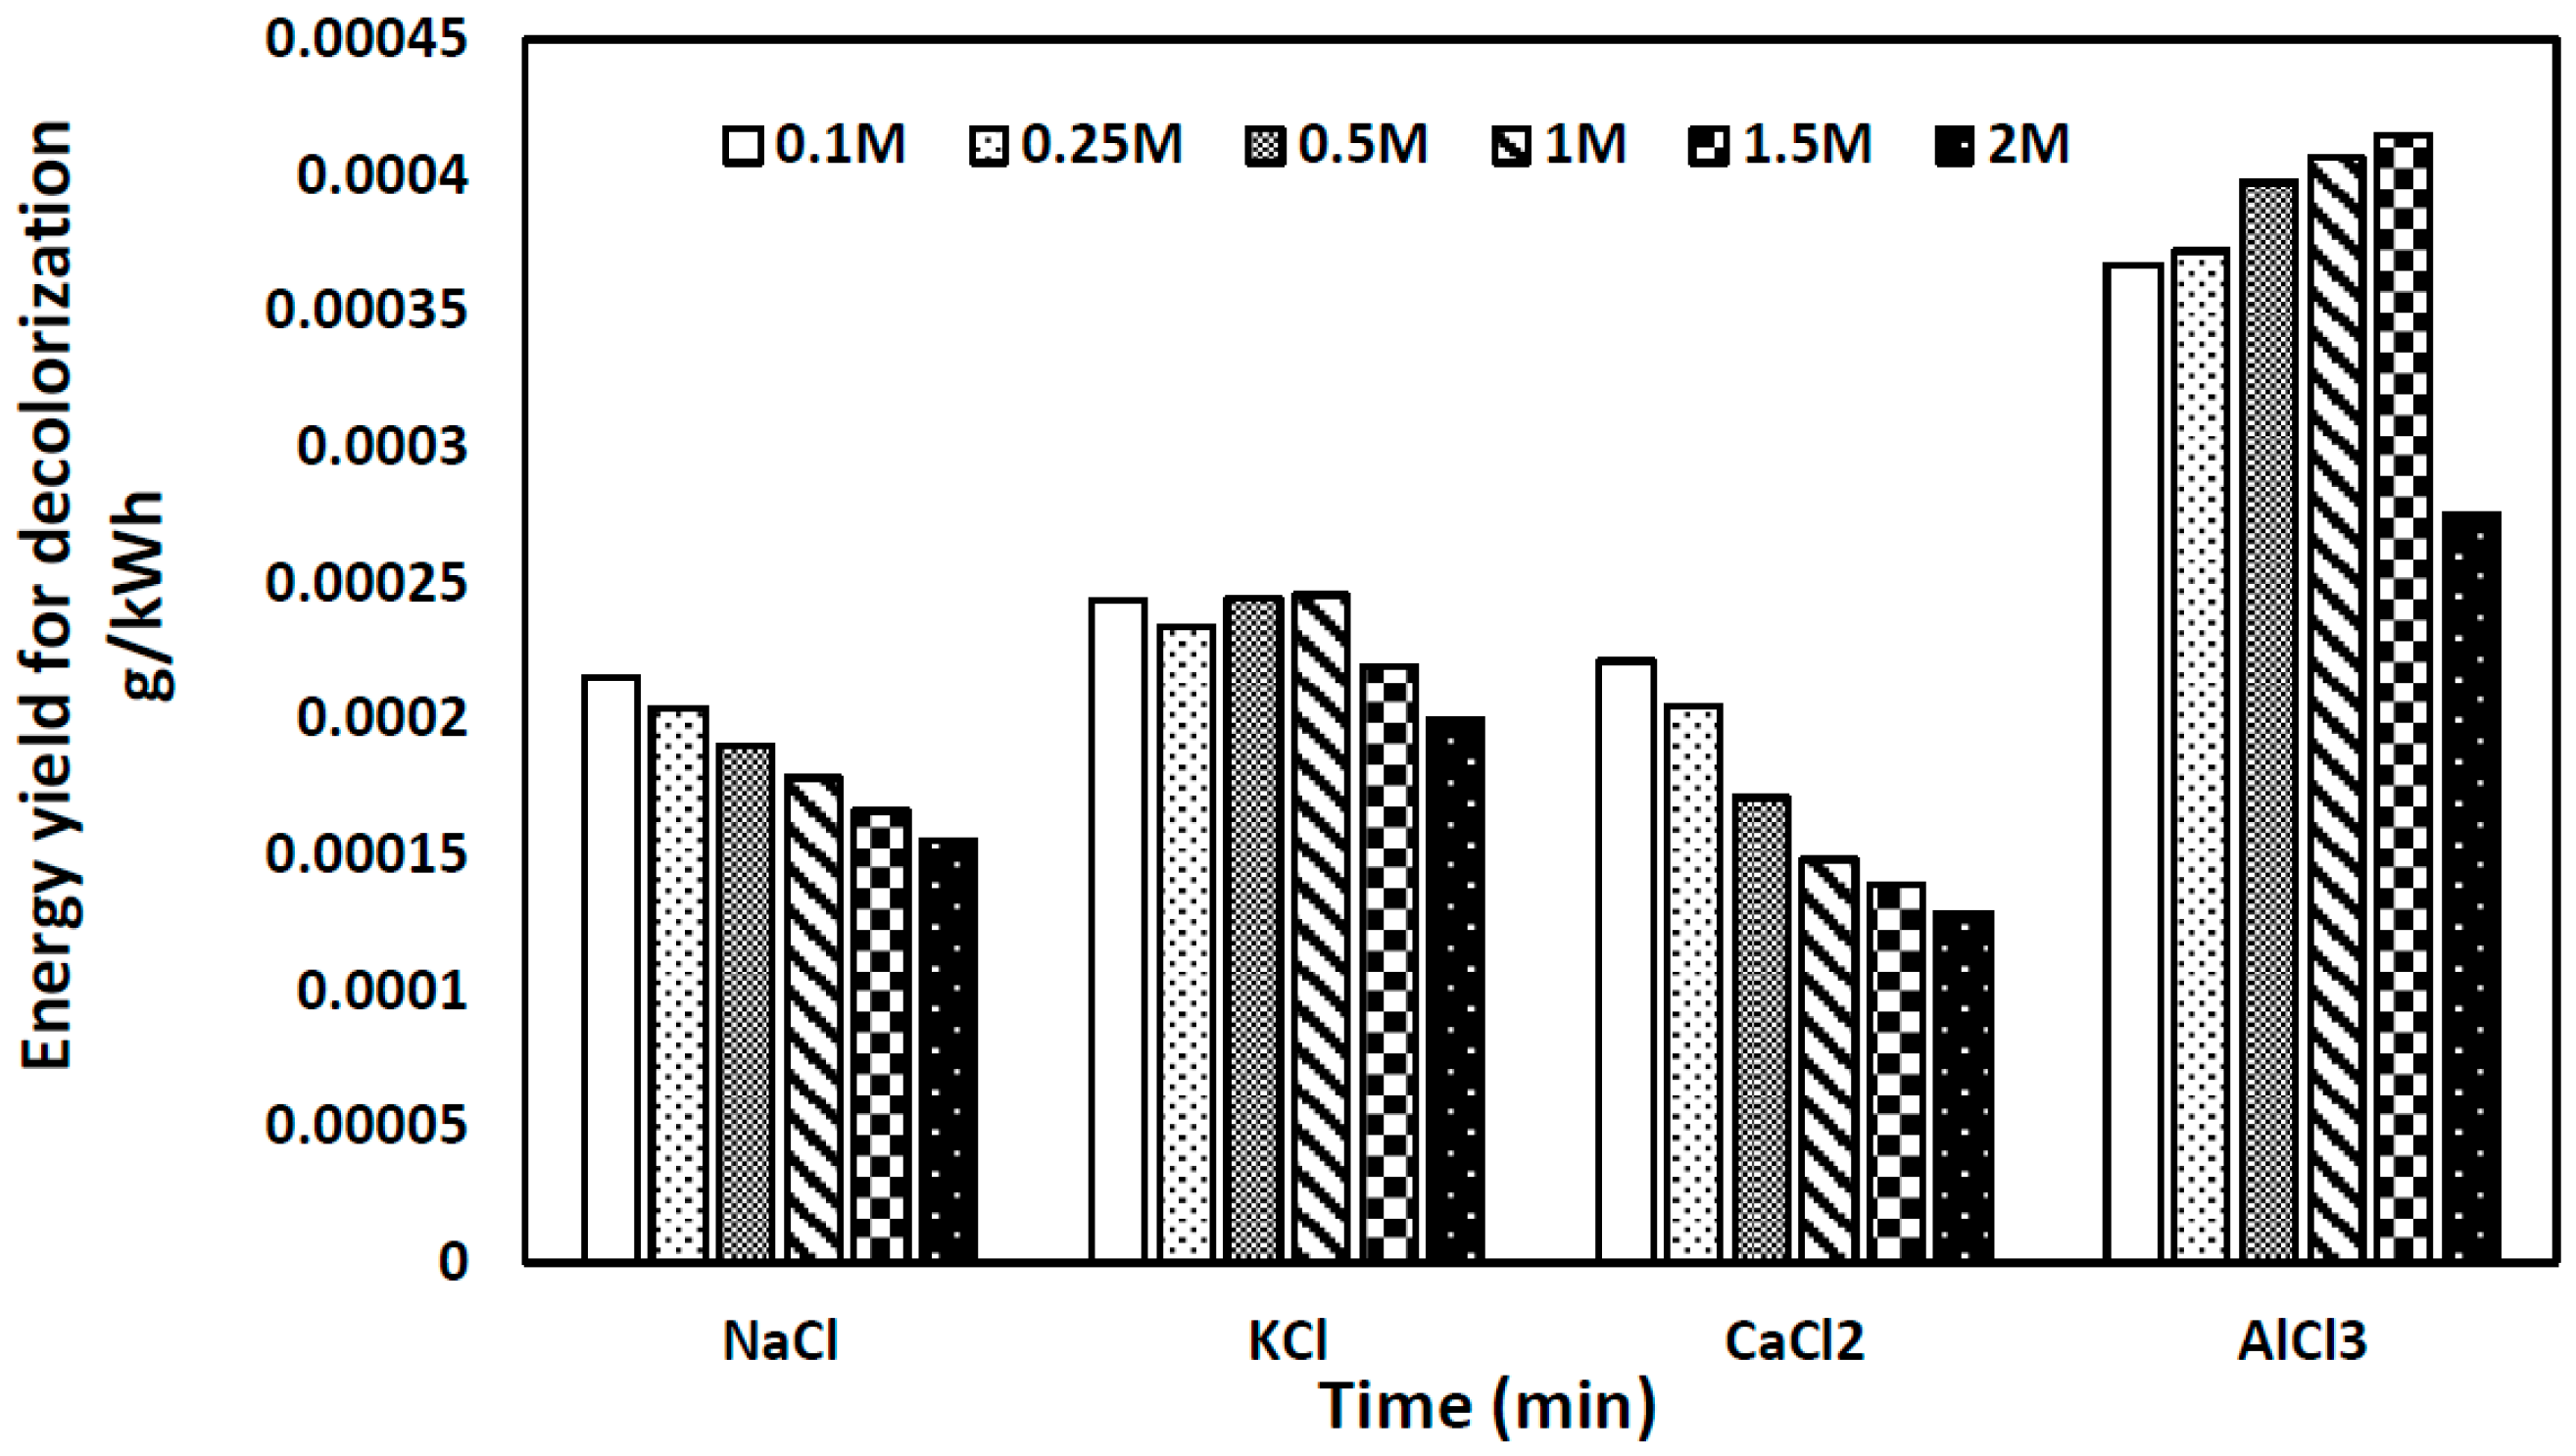
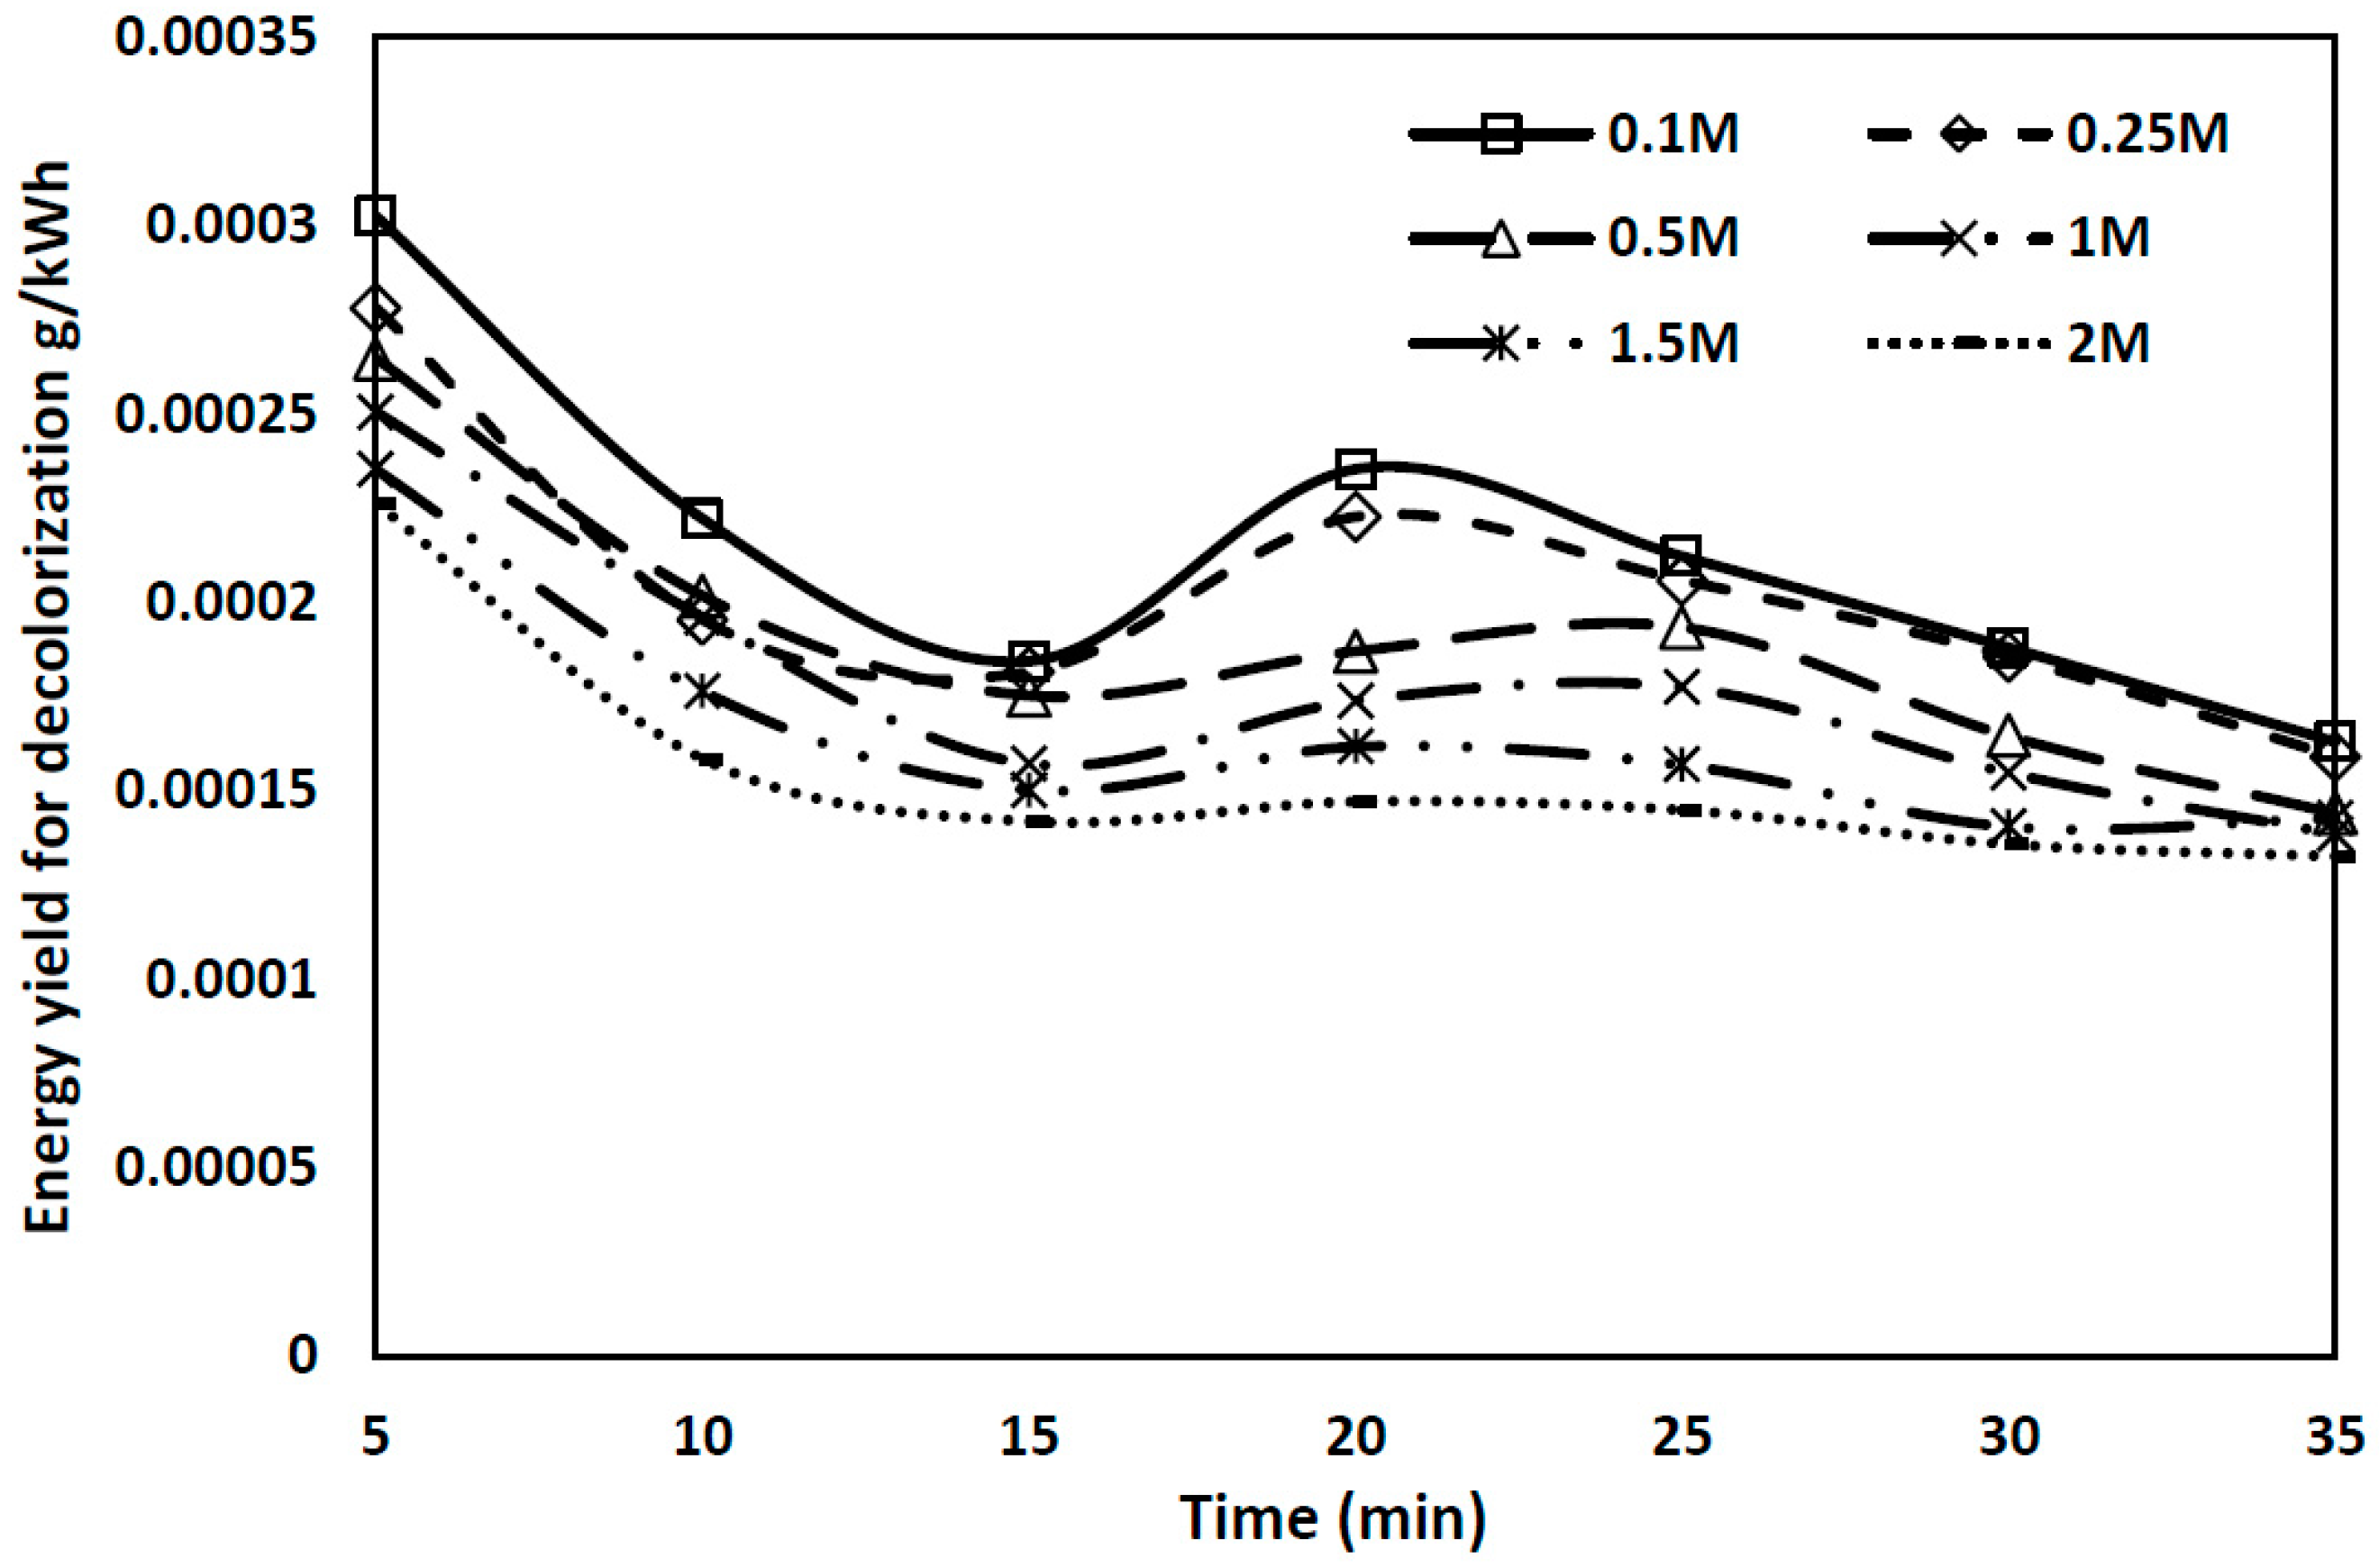
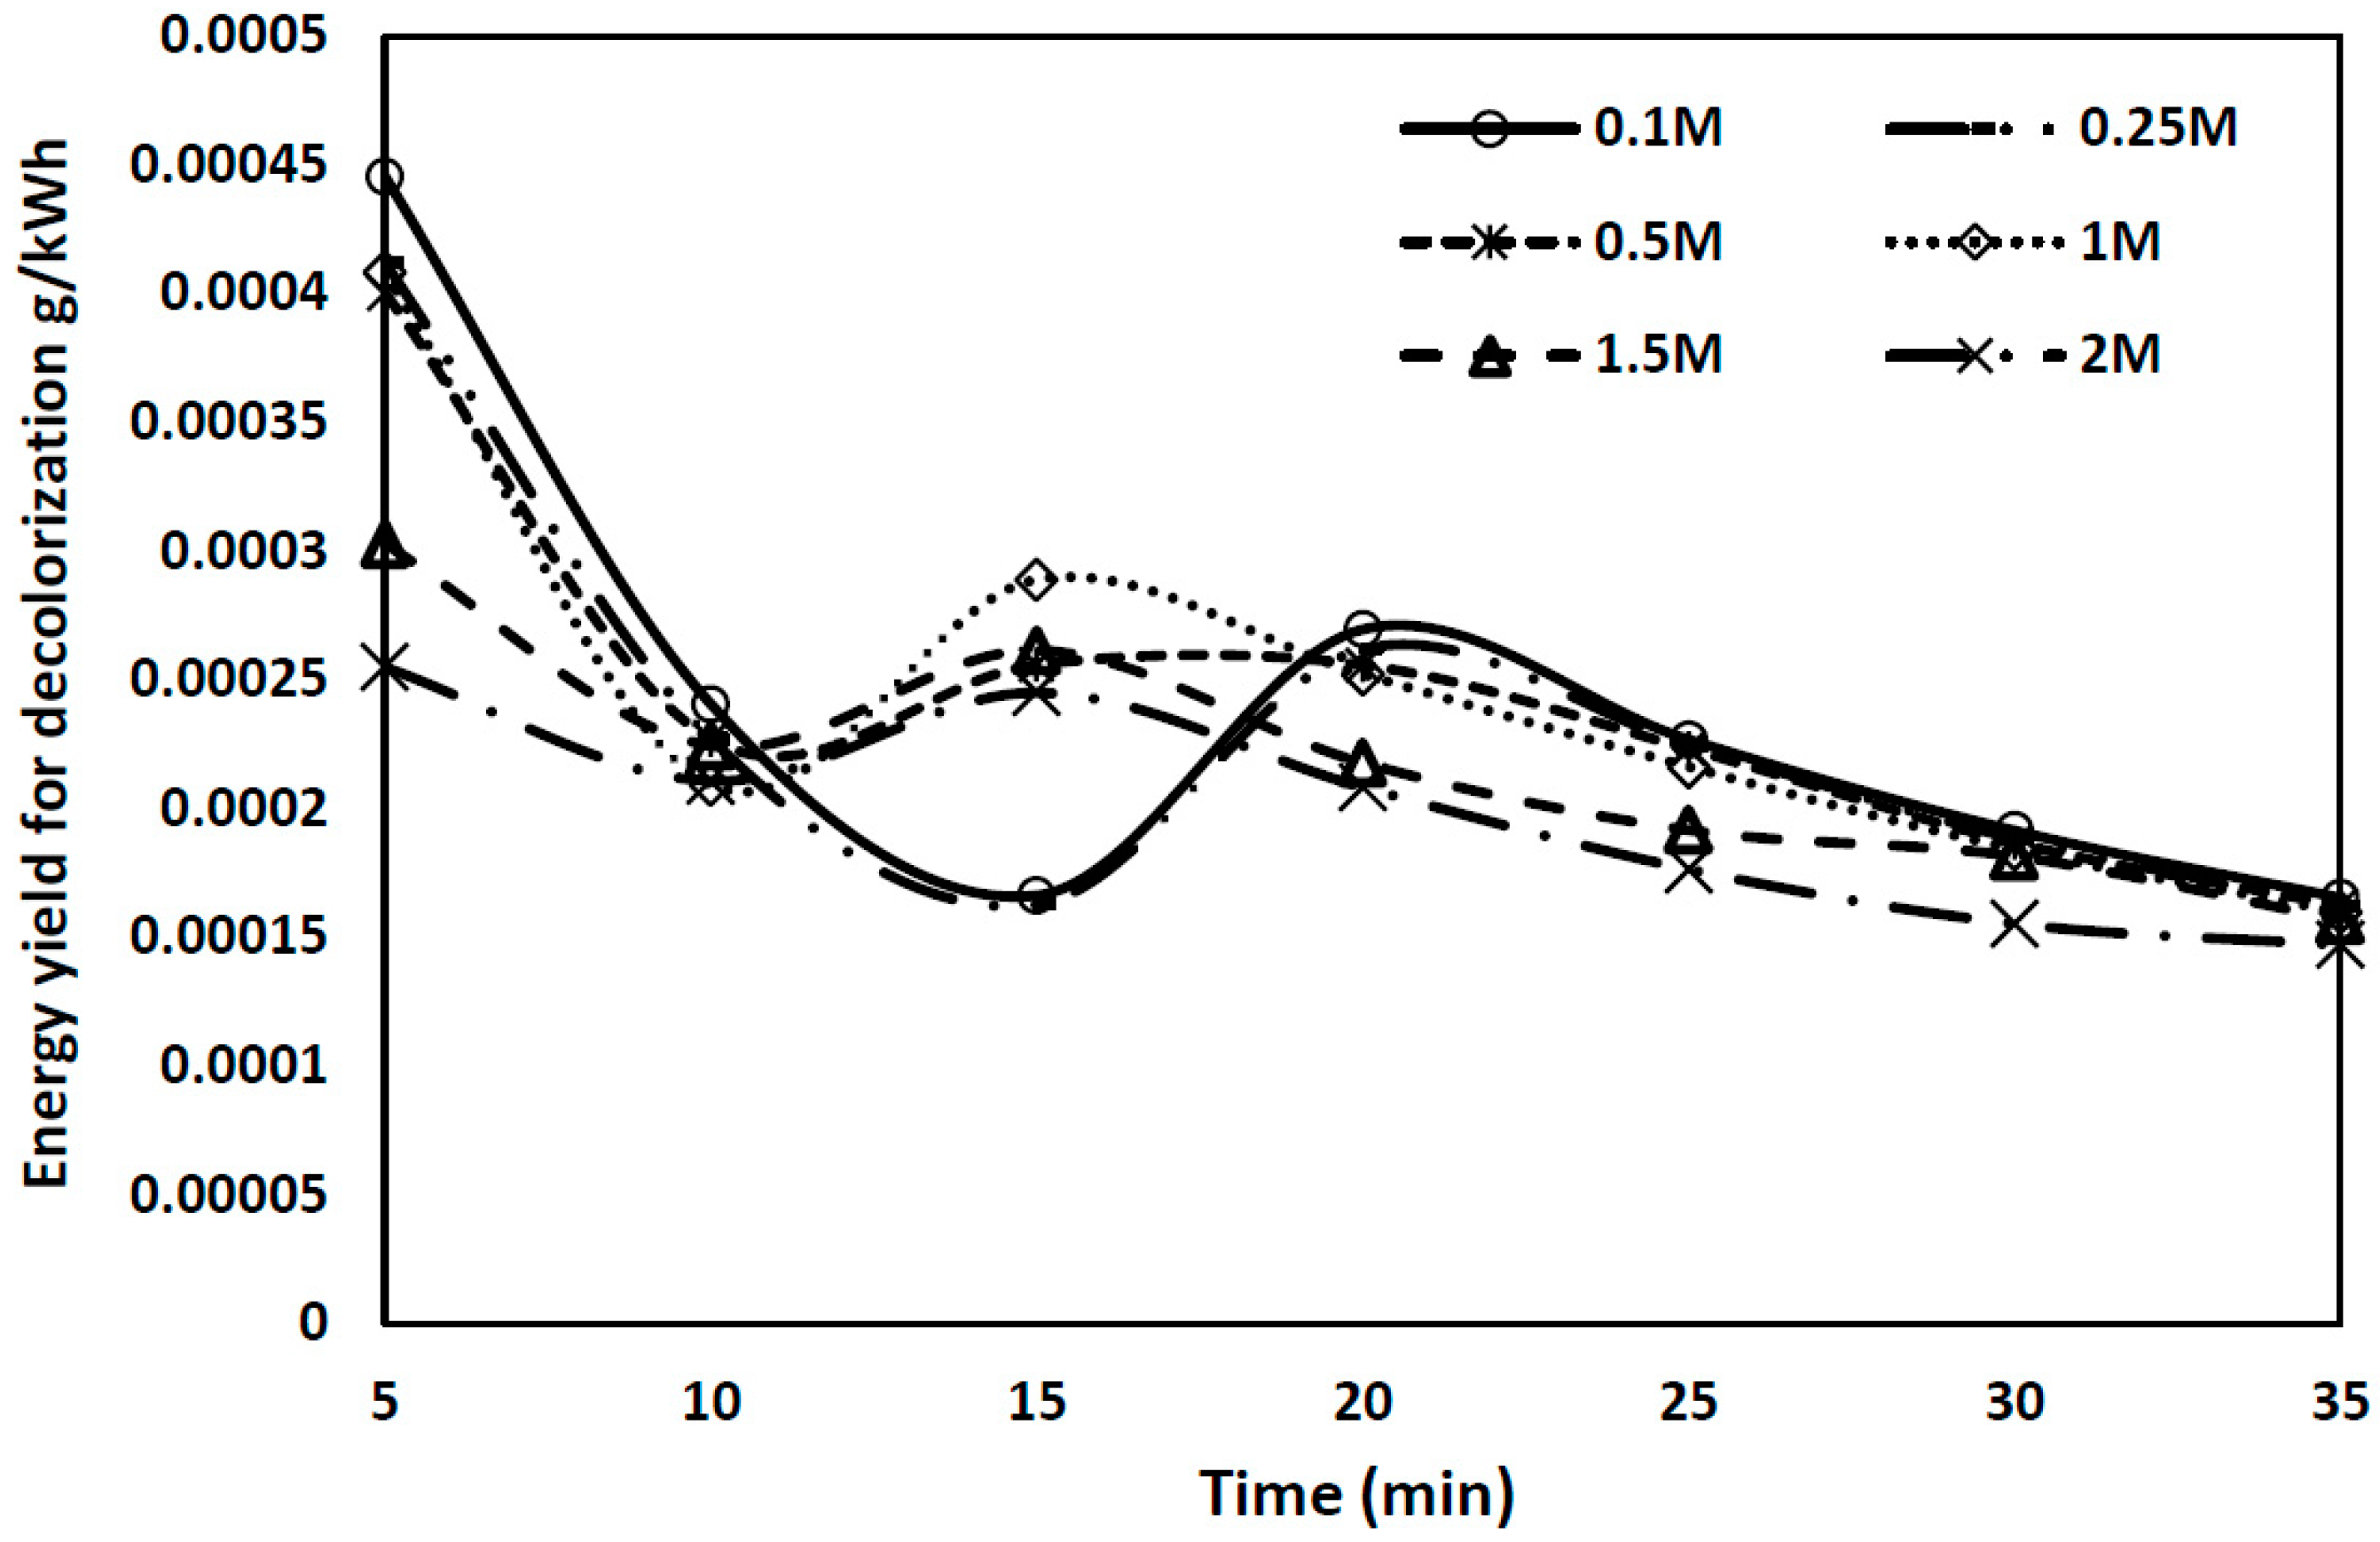
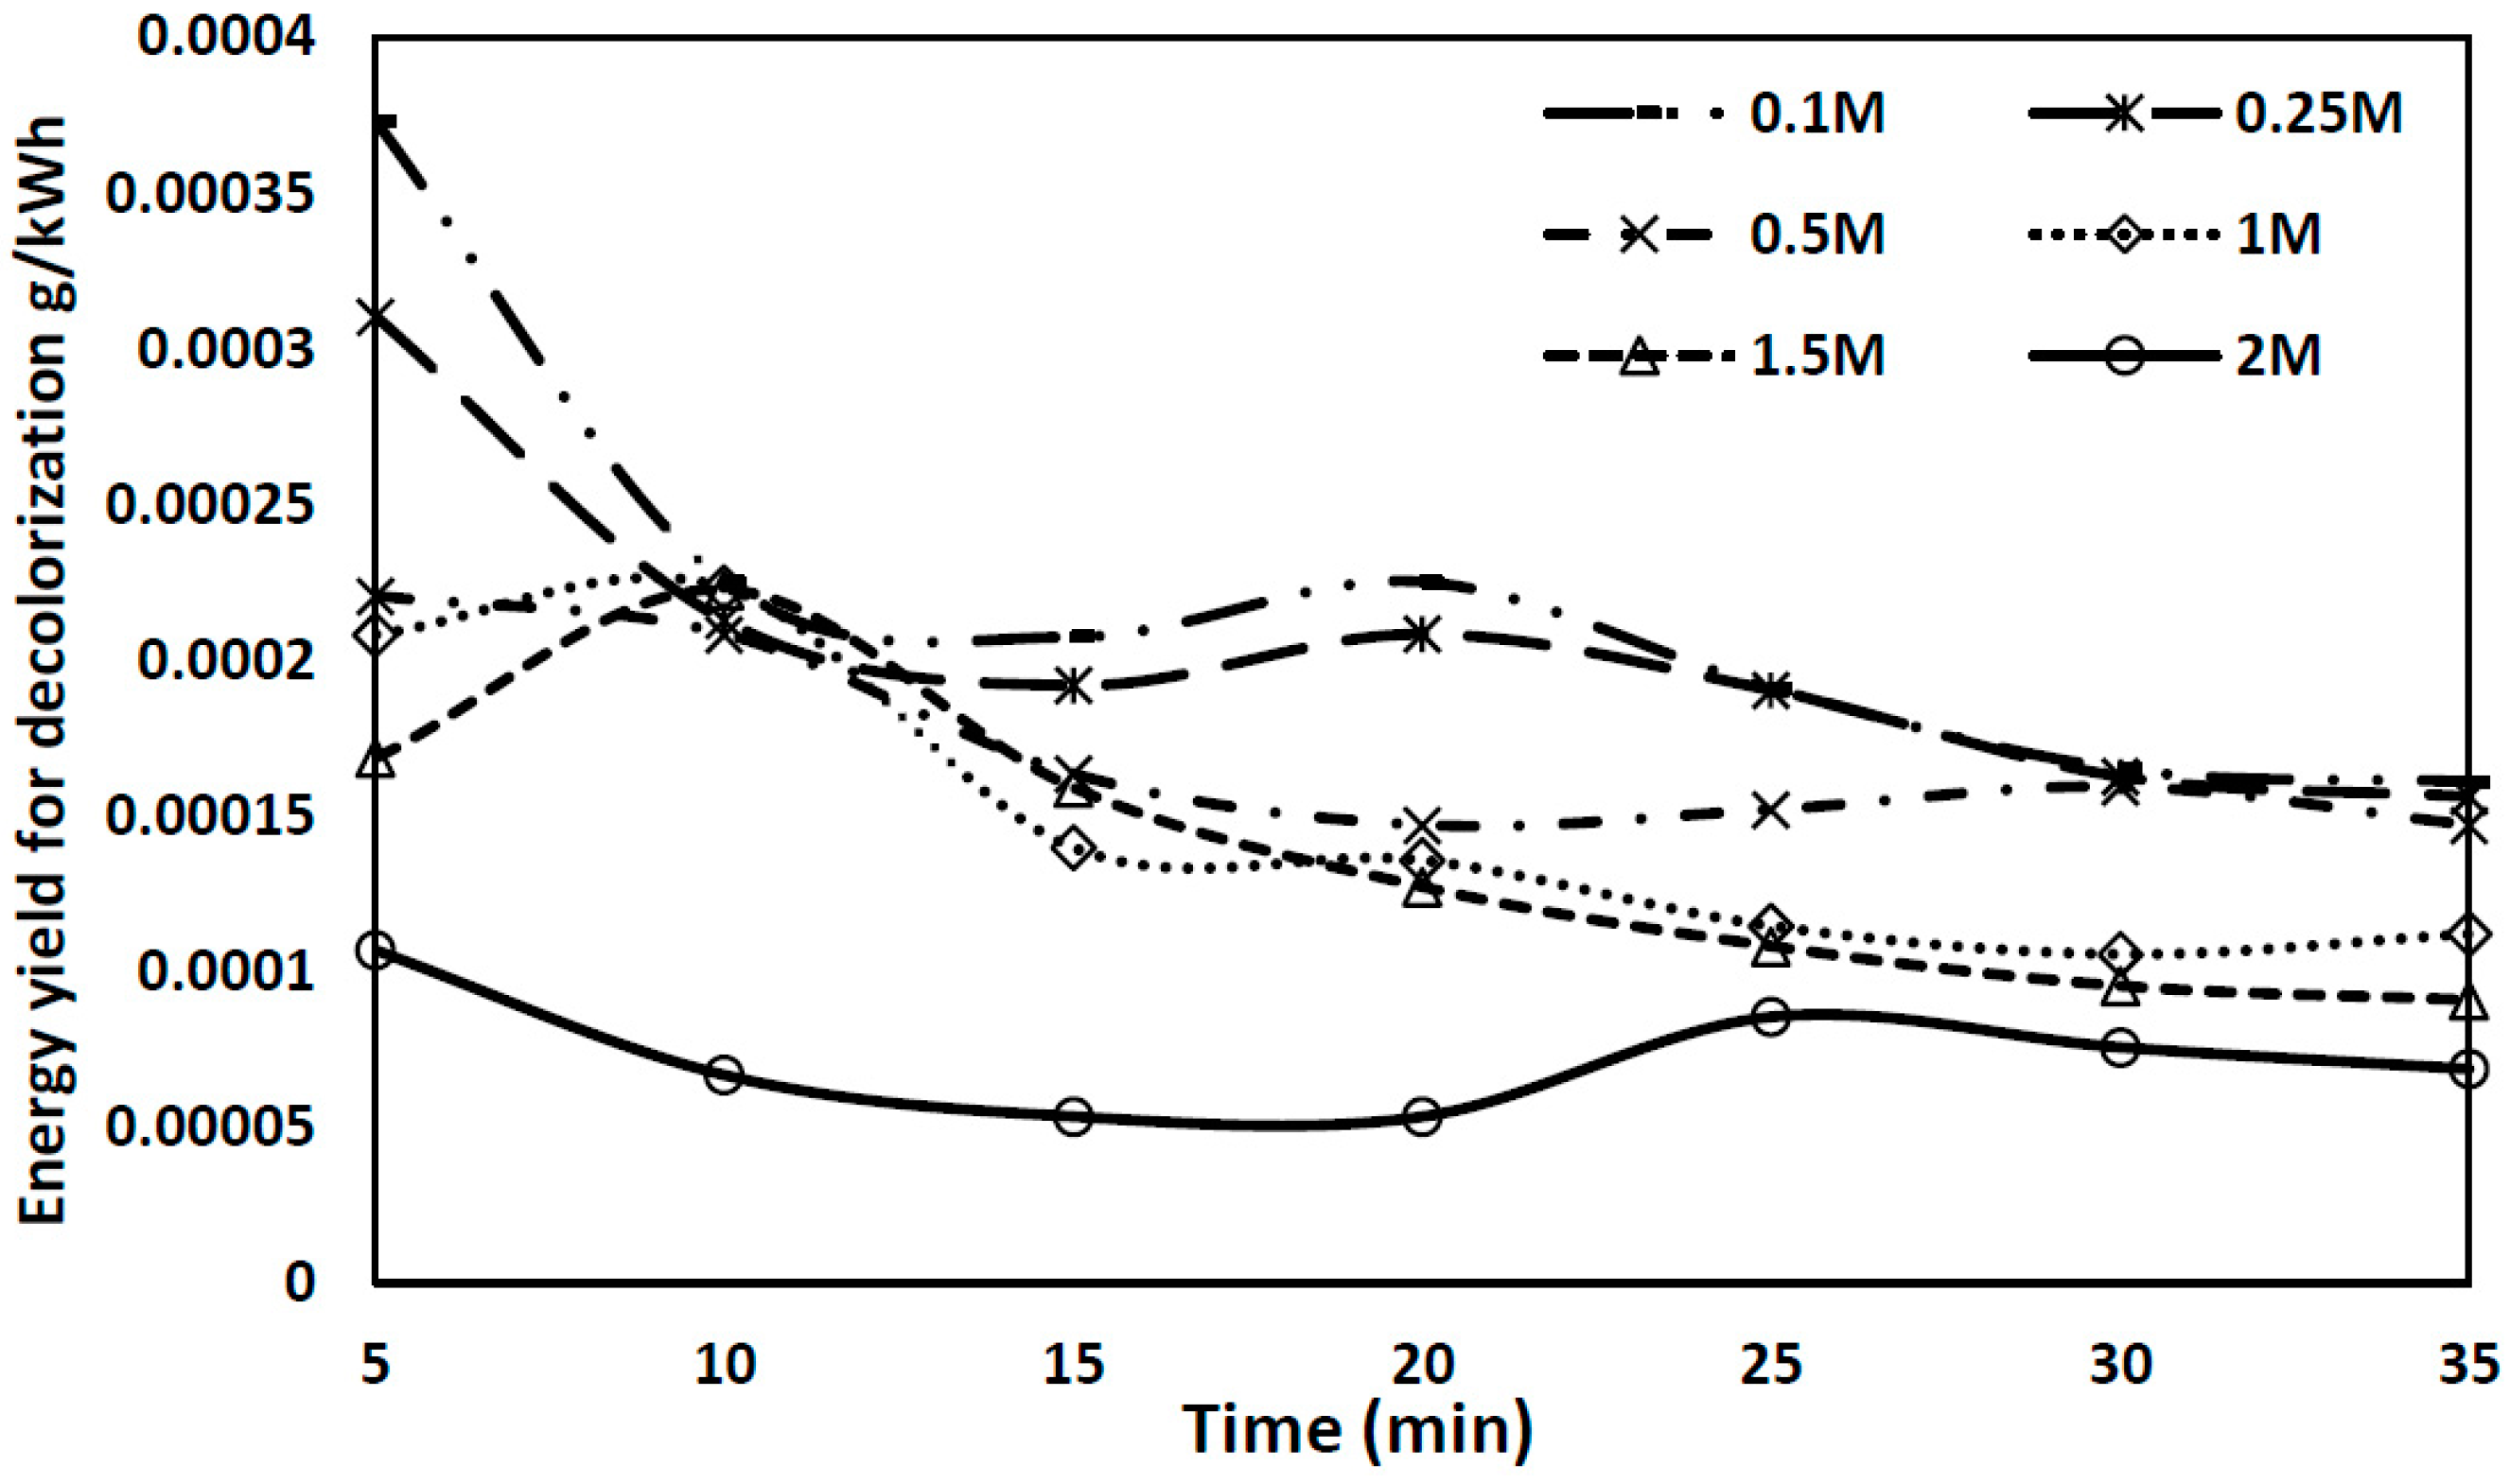
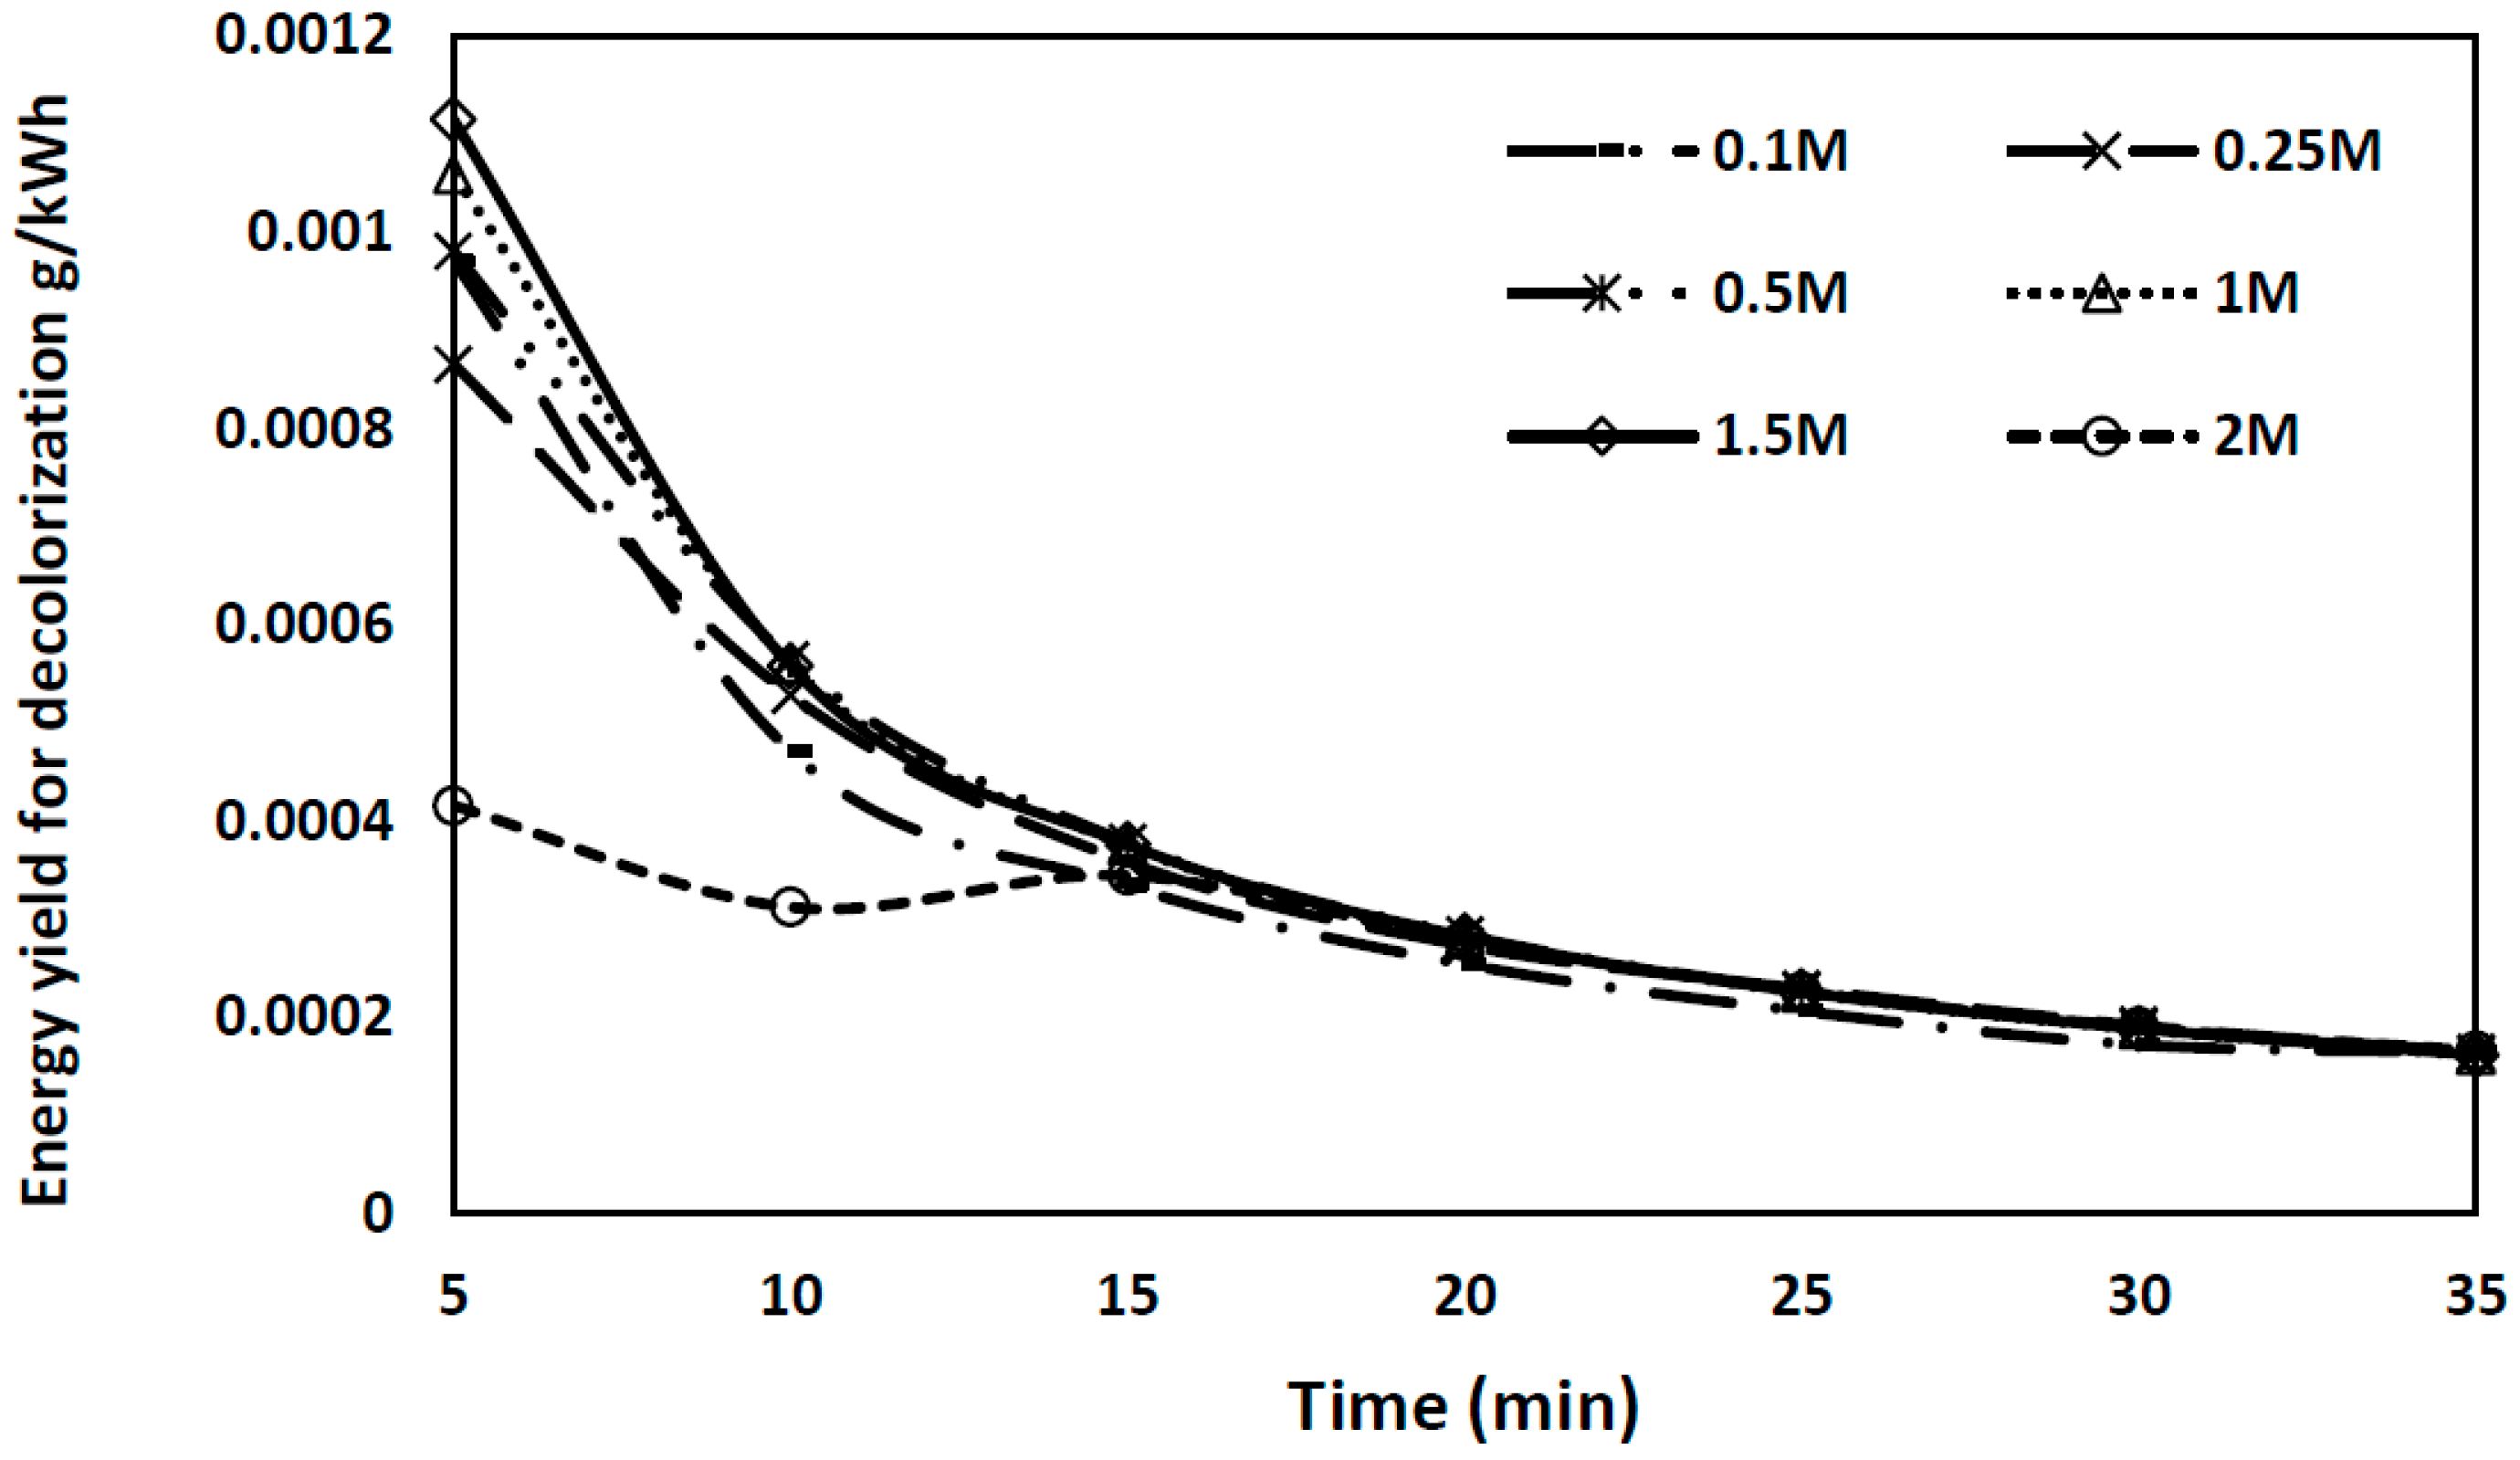
3.4. Energy Yield for Decolorization of Acid Blue 25 Dye

The most important factor for assessing the treatment process is the energy yield which is called G-value (defined as the amounts of radicals produced per 100 eV from the electrical discharge energy input of the process). Another definition for energy yield value is as the quantity of moles of pollutant removed from the solution by one joule of energy supplied to the process, giving G-values dependent upon time or on the streamer length. The energy yield of the polluted dye solution under the pulsed discharge system was ascertained by utilizing the equation of Hayashi [23] and Lukes [24]:
G = (C0 × V0 × D%)/(100 × P × t)
where G: energy yield (g/kWh); C0: concentration of the pollutant at t = 0; V0: volume of treated solution; P: power of the reactor (w); t: time required (s). The energy yield was calculated using Equation (7) with an initial volume of water V0 = 100 mL and initial concentration C0 = 10 ppm, where the power of the reactor was calculated from both the electric current and average voltage. The power consumed was calculated from the output voltage and currents. Figure 17, Figure 18, Figure 19 and Figure 20 illustrate the relations between the energy yield (g/kWh) and the time for different concentrations of NaCl, KCl, CaCl2 and AlCl3 in the presence of 10 mg/L Acid Blue 25 dye solution. It is noticed that the energy yield increased as the salt concentration is reduced. Obviously, the energy yield for 50% dye removal at 5 min time is greater in the situation of gas-phase plasma contacting liquid surfaces and the greatest situation can influence numerous hundred grams per kilowatt-hour (g/kWh).
The relation between the variations in salt concentration against the average energy yield for different types of salts is shown in Figure 21.
It is noticed from the figure that the energy yield increased at low salt concentration for NaCl and CaCl2 whereas the KCl and AlCl3 show a different behavior. The maximum energy yield value was obtained from the figure at 5 min time of the treatment process.

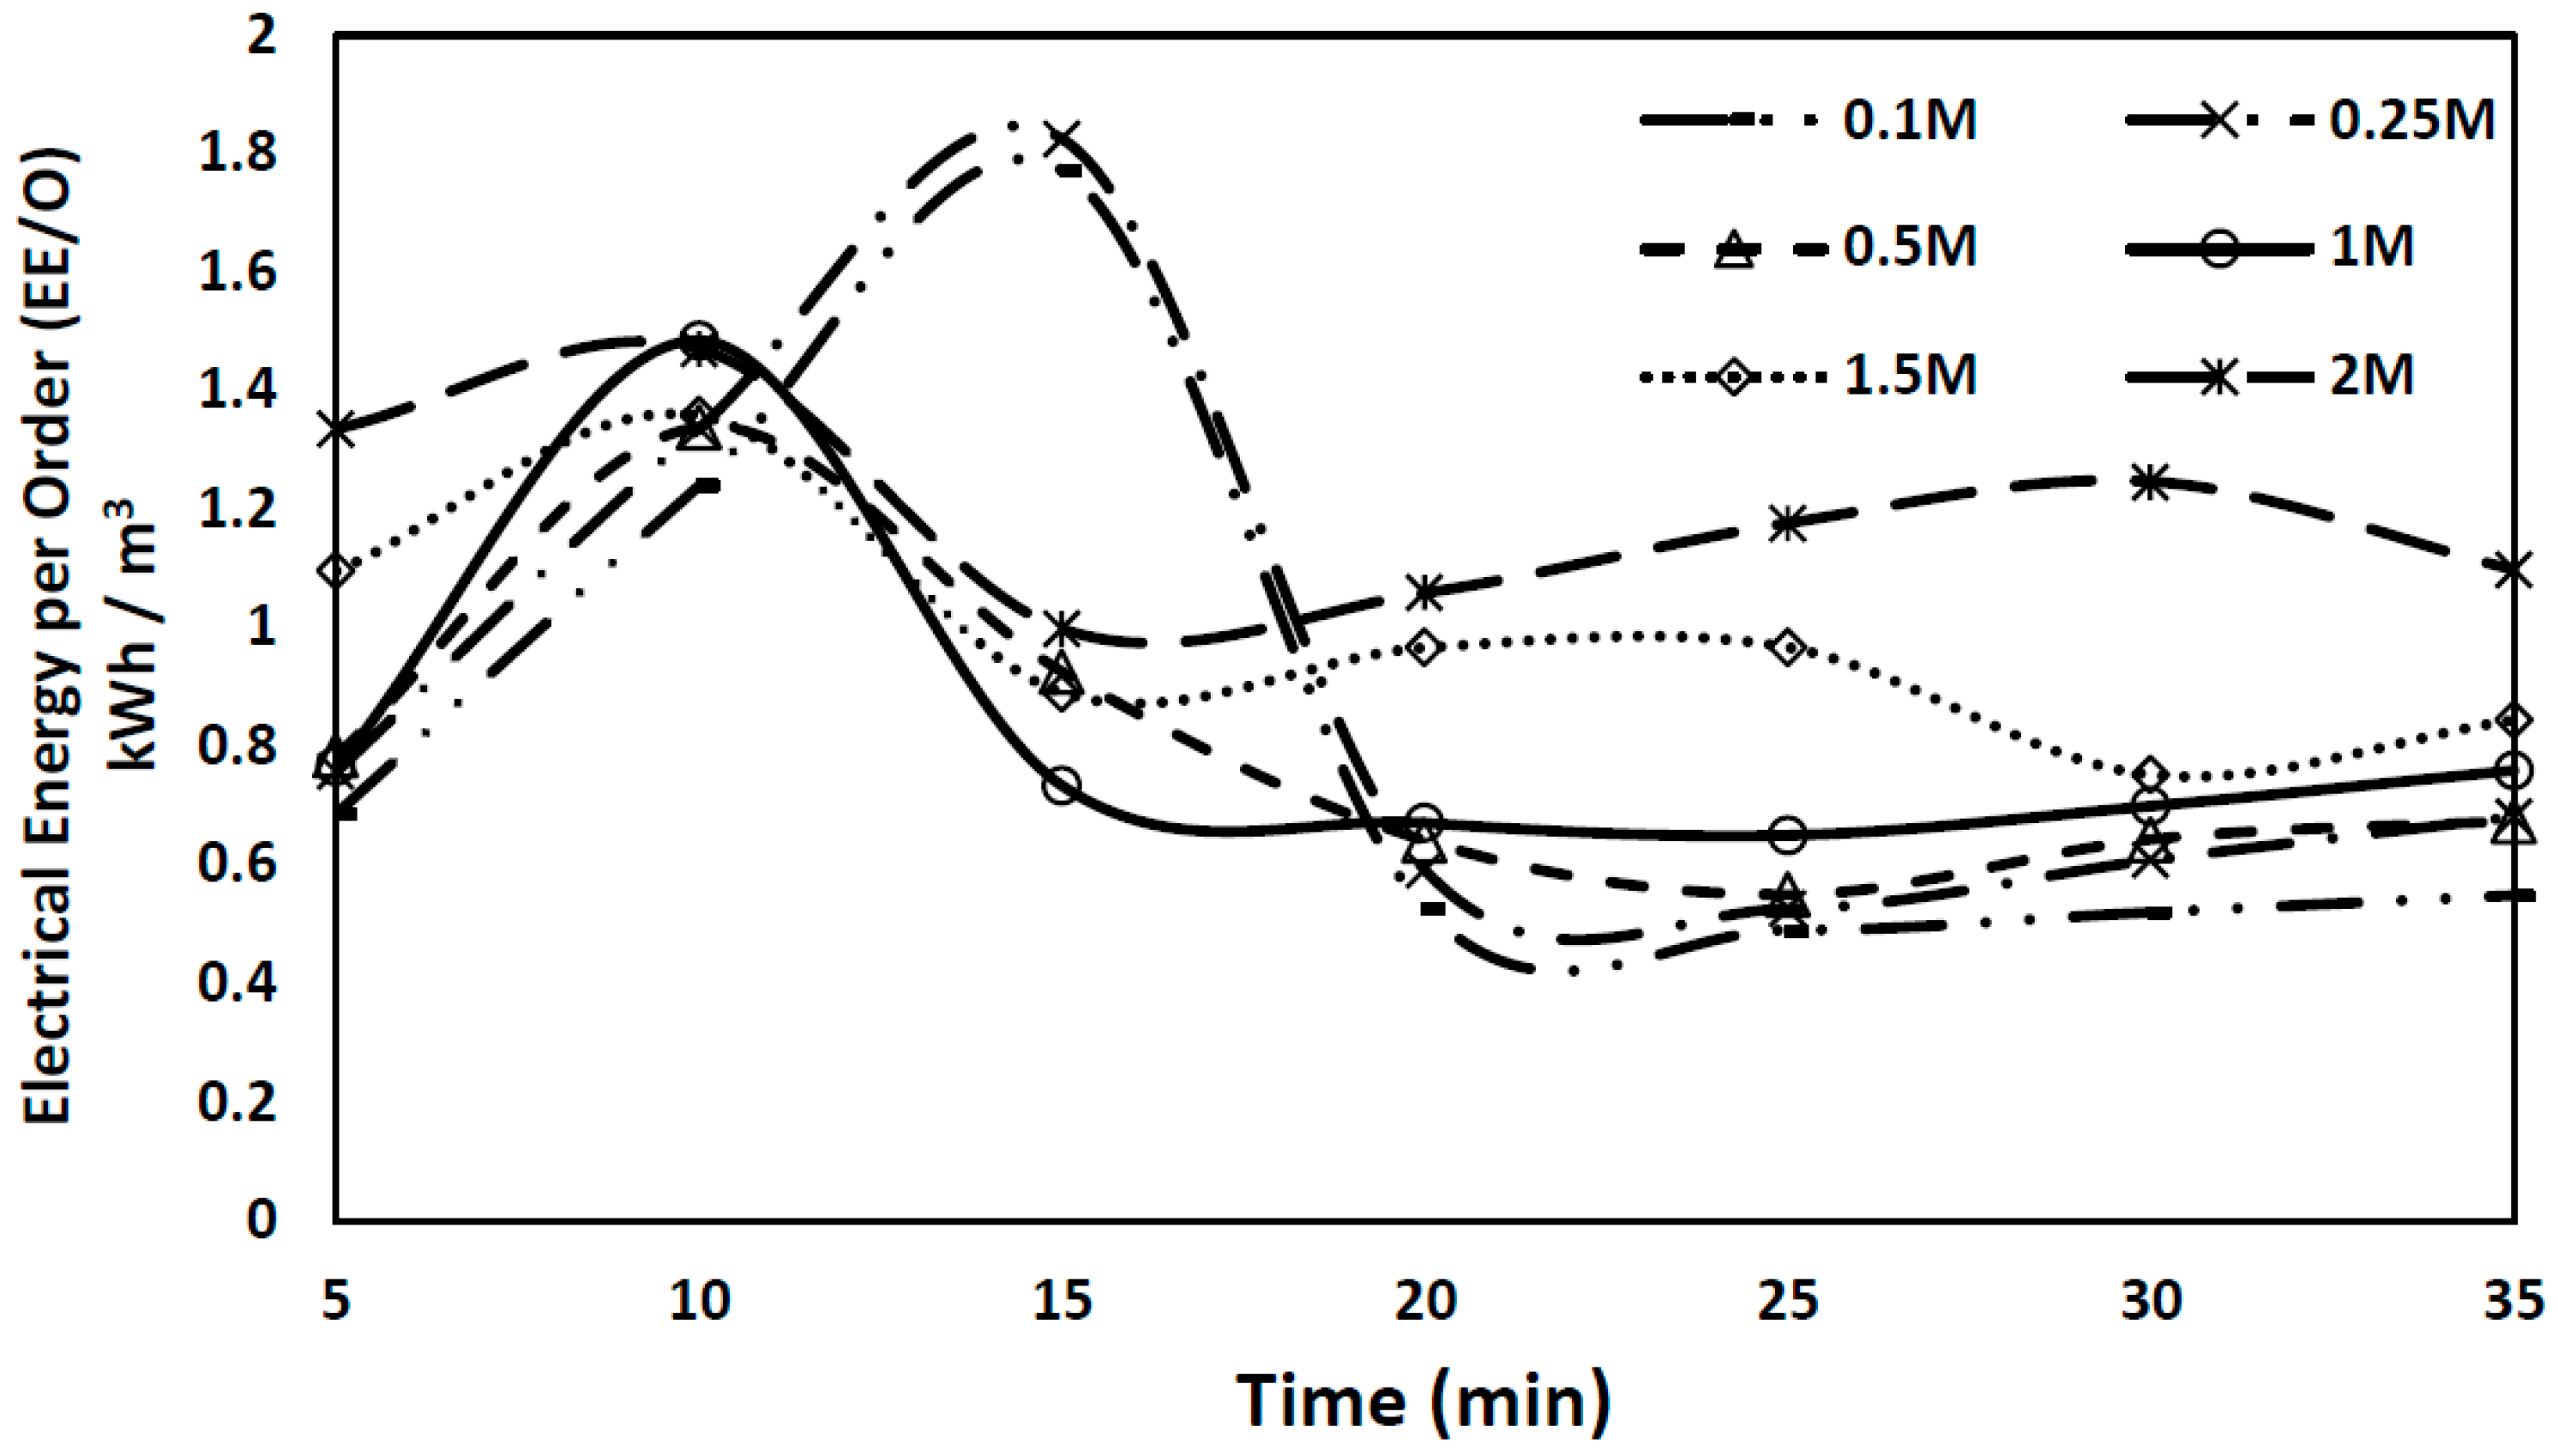
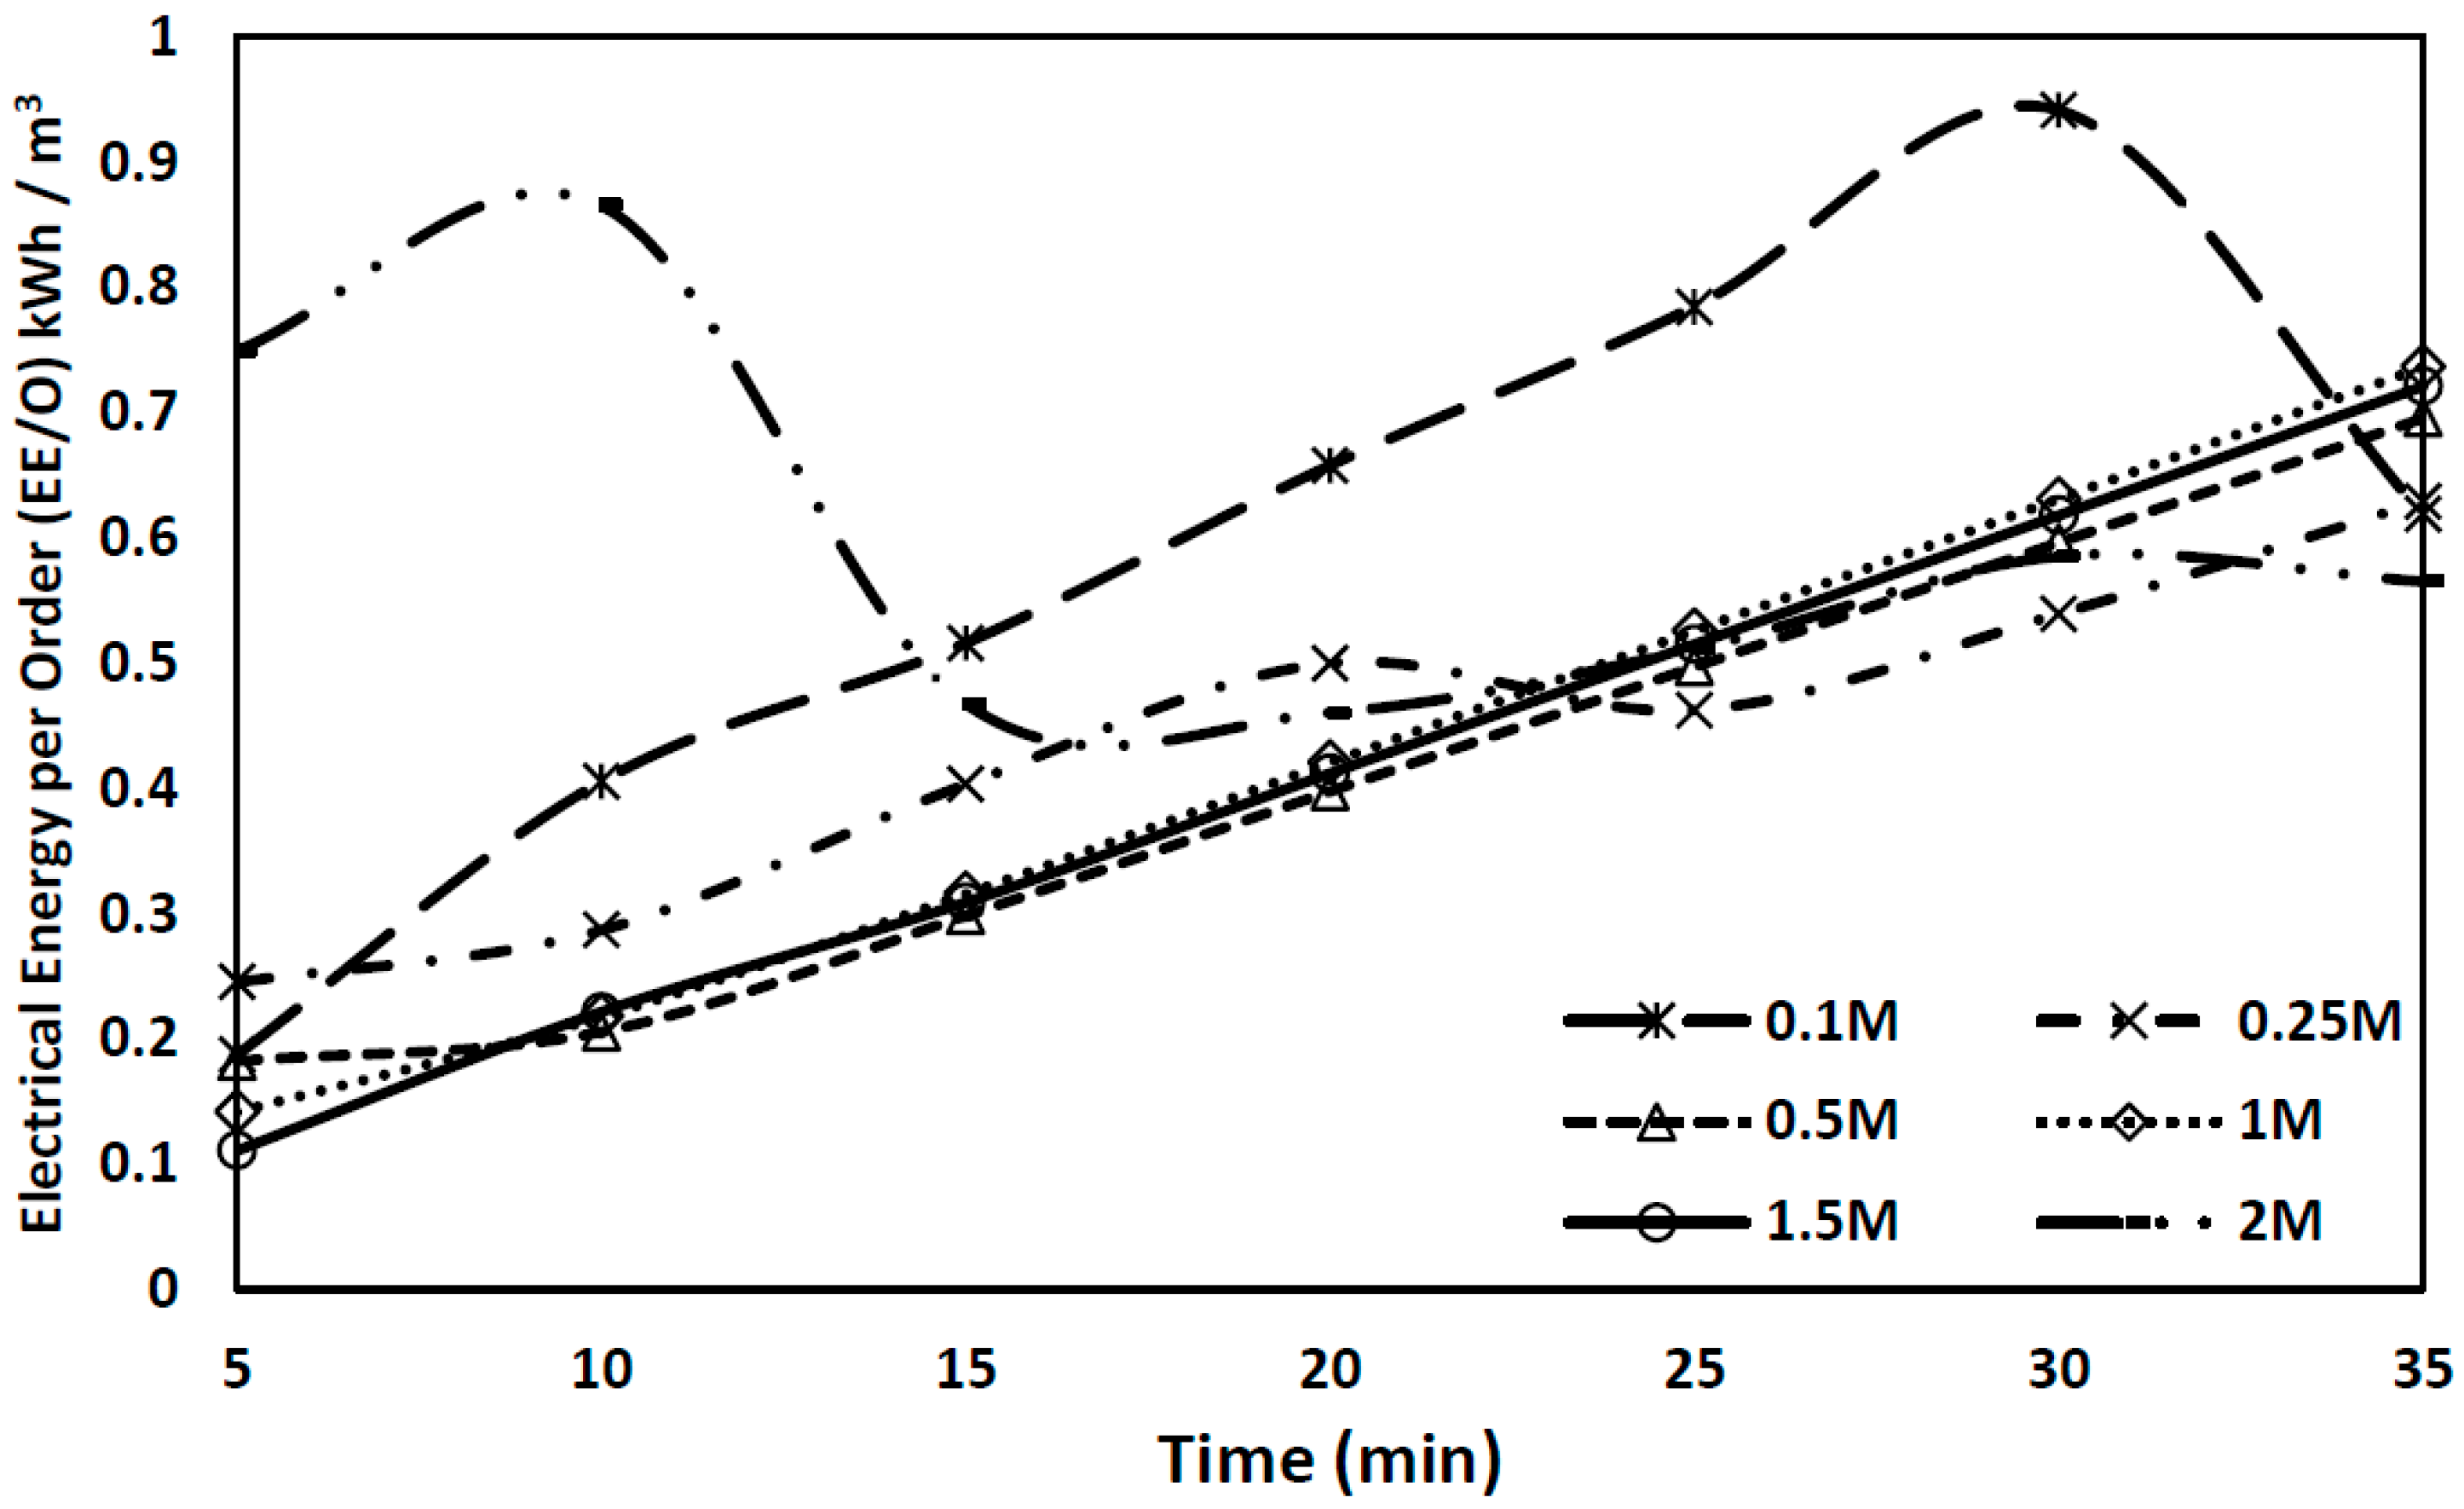
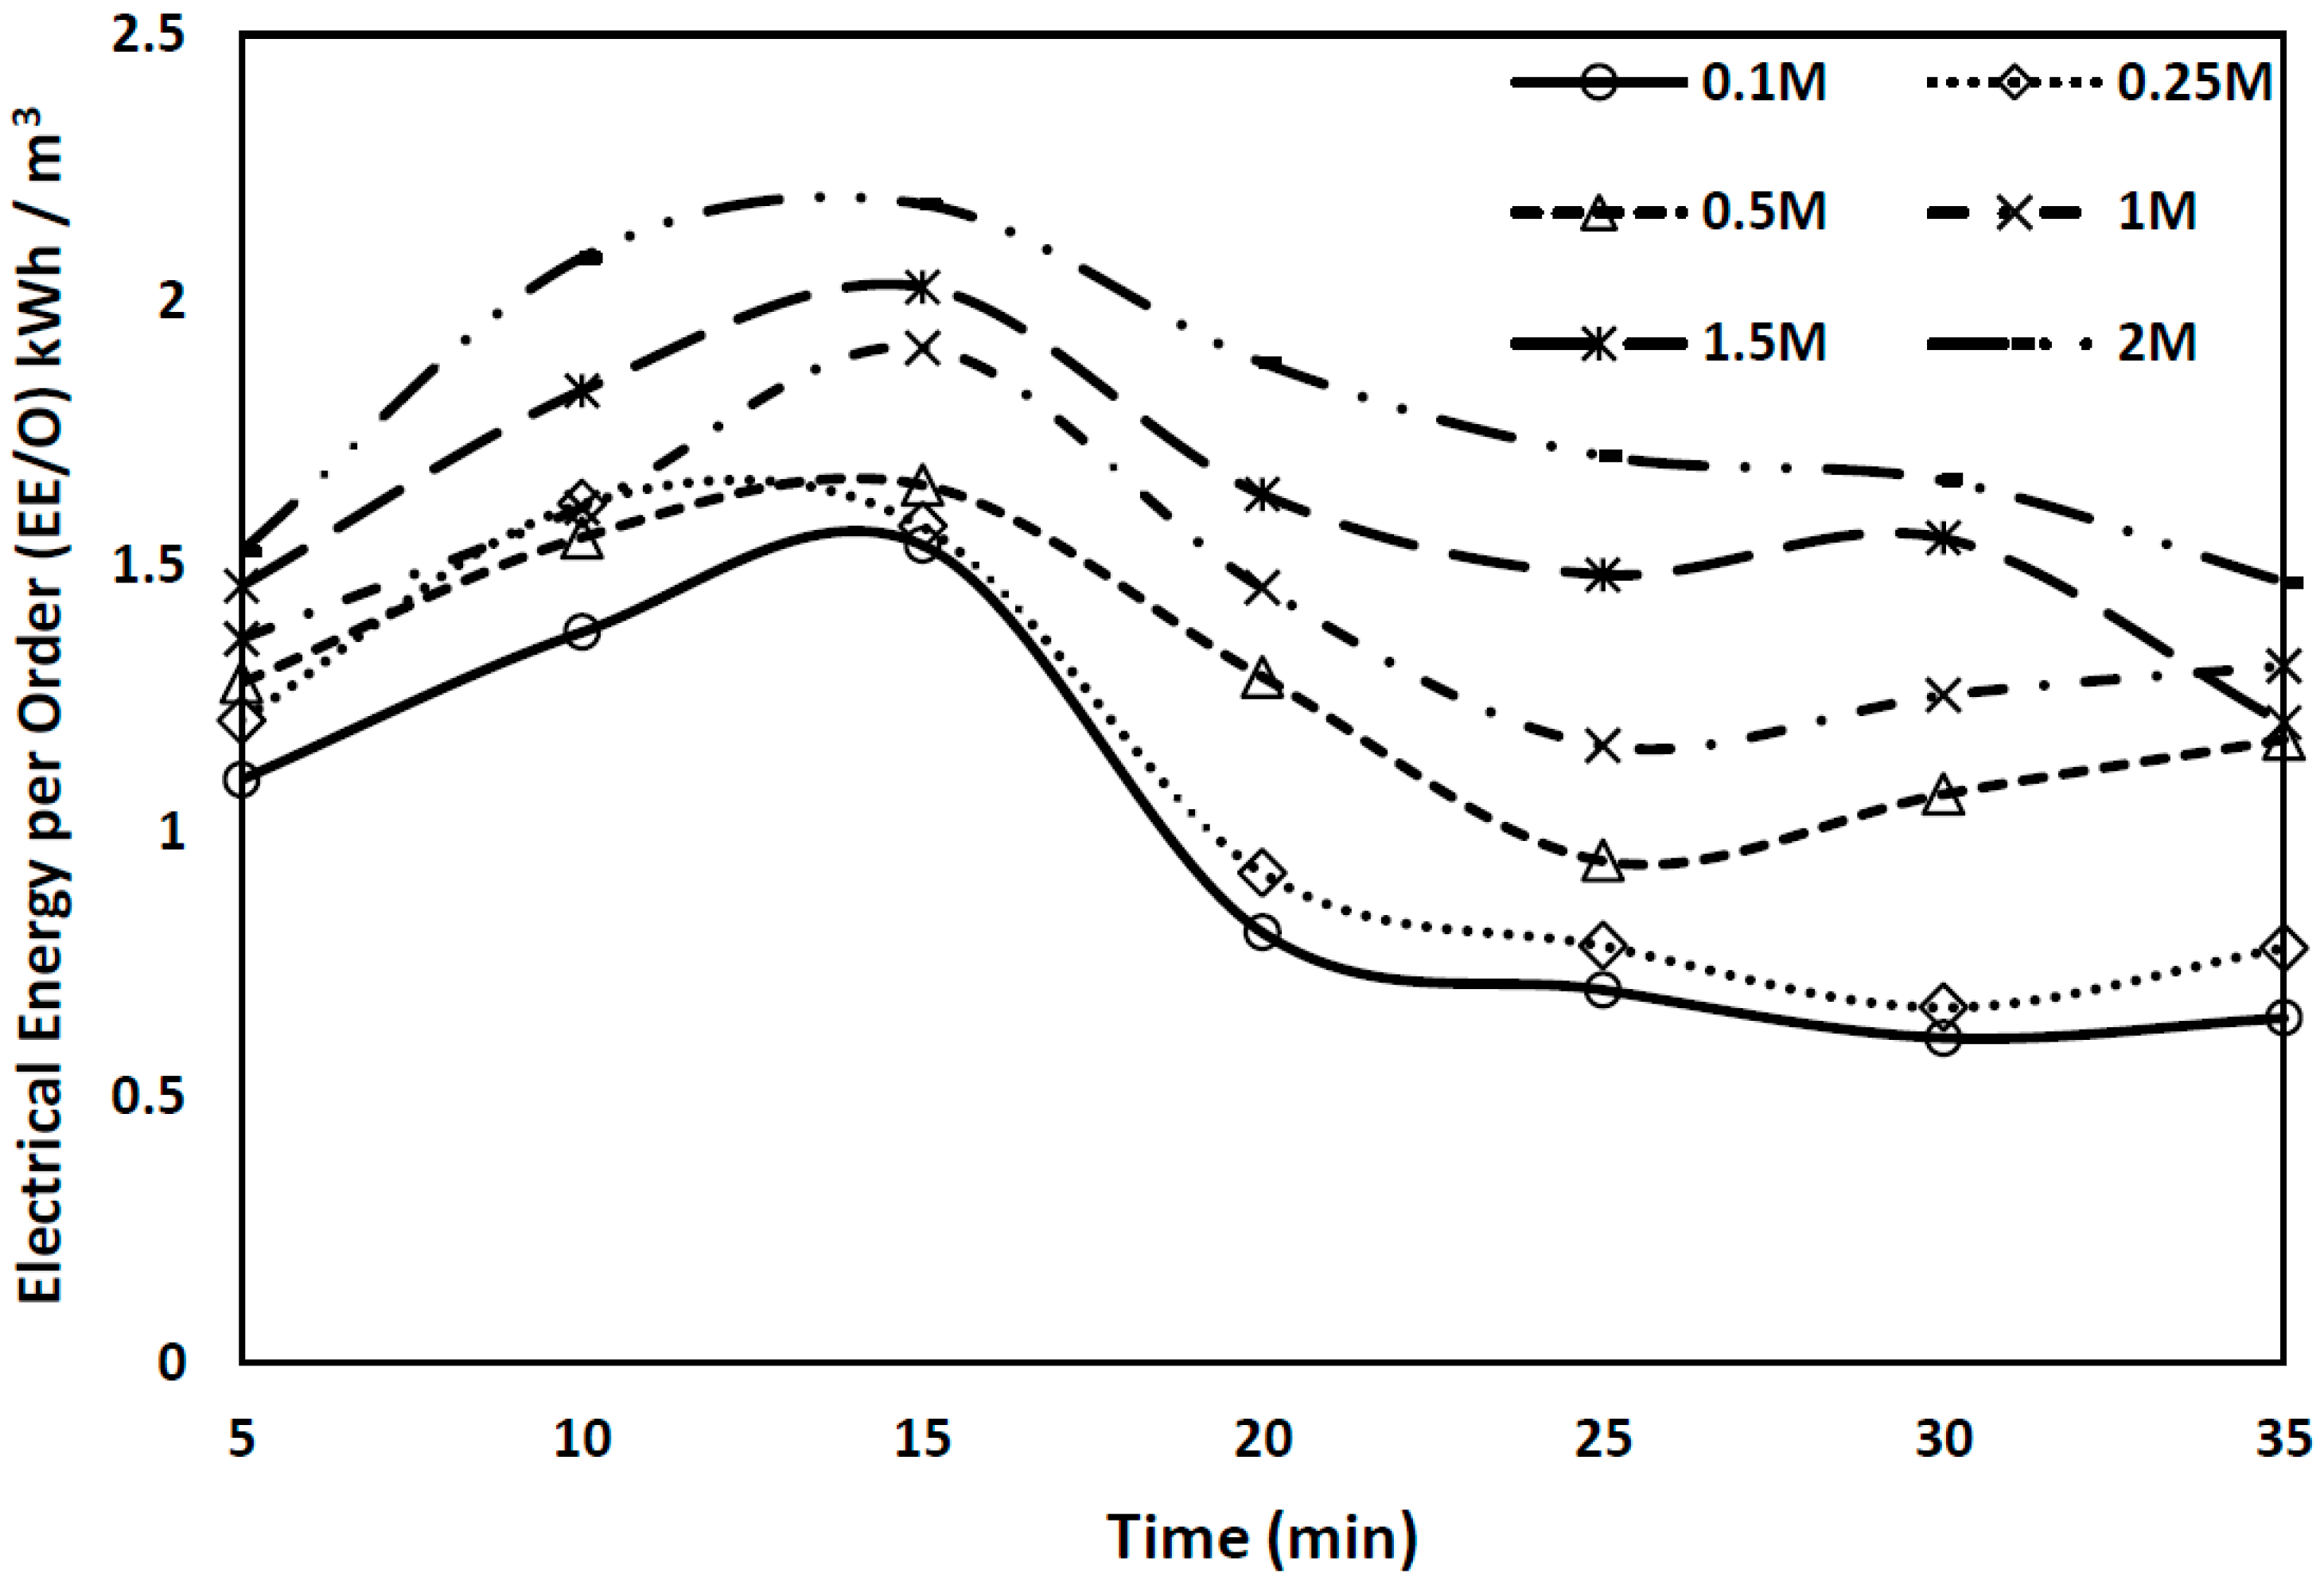
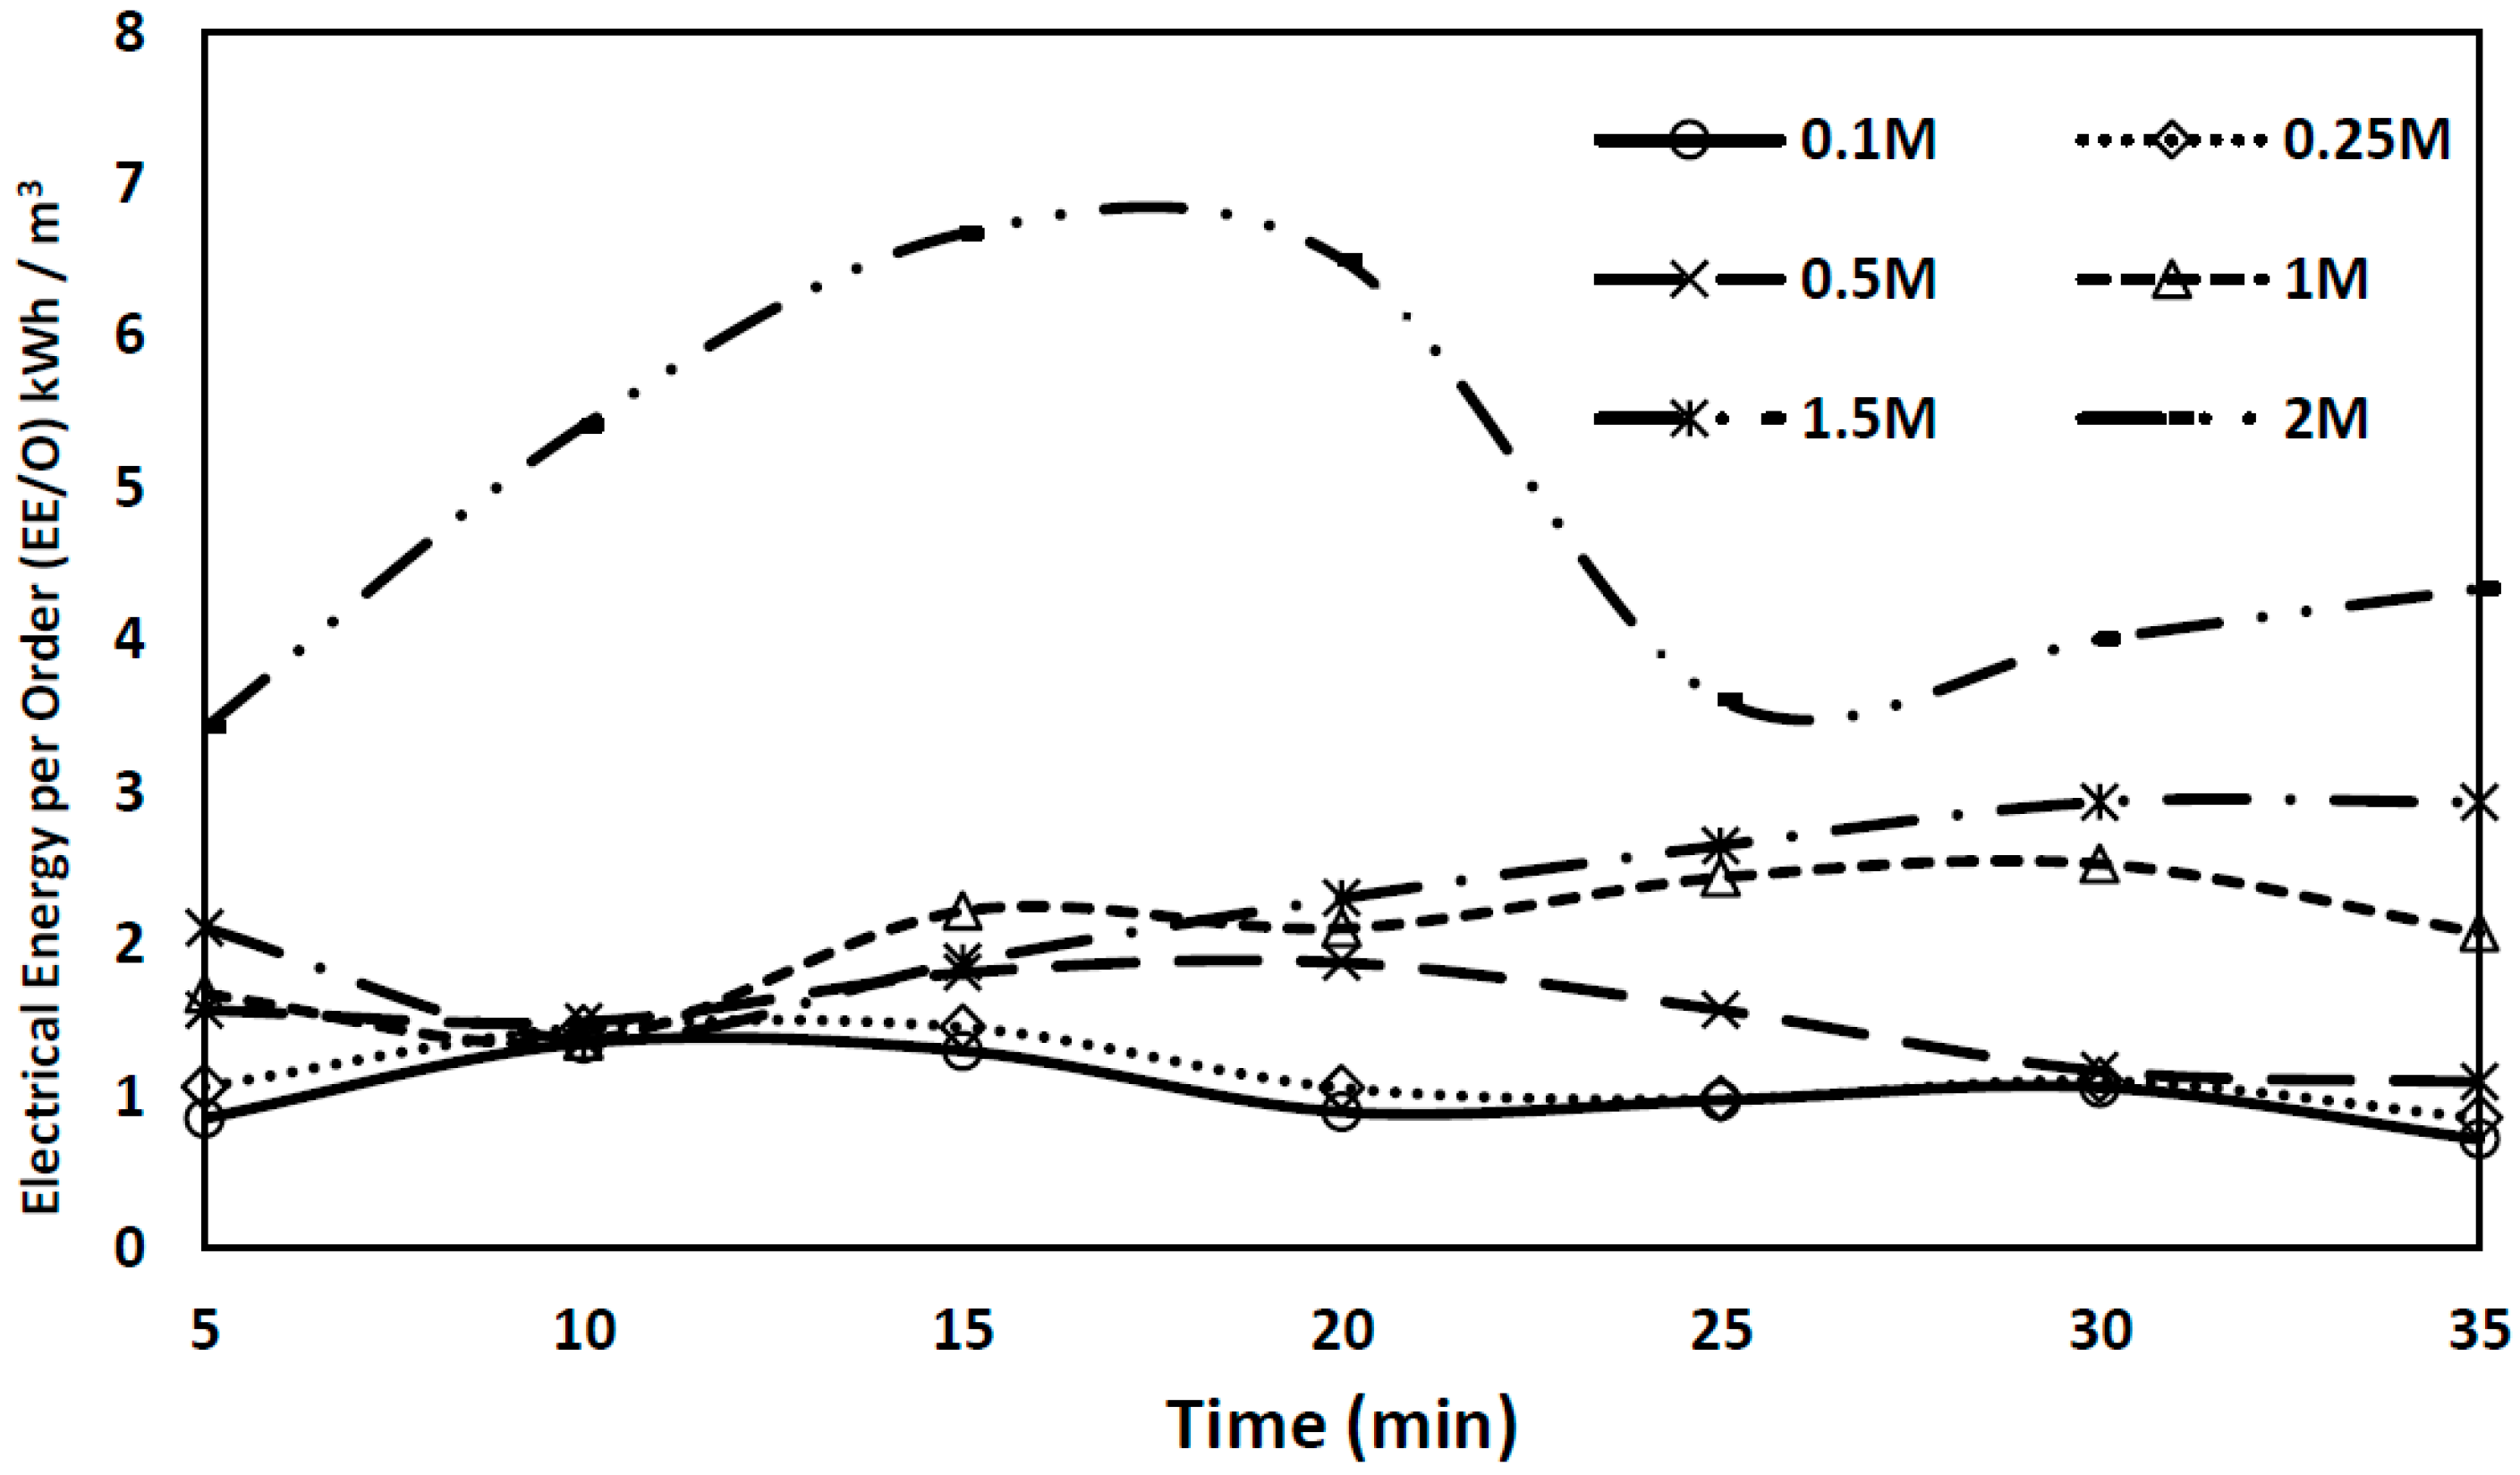
3.5. Electrical Energy Per Order (EE/O)

The electrical energy per order (EE/O) is a powerful scale-up parameter which measures the treatment rate in a fixed volume of contaminated water as a function of the applied specific energy dose. For low pollutant concentrations, the EE/O value can be derived as described in this section. The EE/O value can be utilized to compare the energy efficiency of different systems. For instance, the assessment of the treatment overheads represents one of the aspects which need more consideration. There are various vital elements in selecting a waste-treatment innovation, including financial matters, economy of scale, regulations, operation and strength (adaptability to change/upsets). Generally, all of these aspects are vital, and a financial aspect is regularly central. The characteristic measure of the electrical performance of the treatment processes is the energy yield (g/kW or eV/mol) or the (EE/O), which is often used for many chemical degradation or oxidation processes. The EE/O presented in this article gives a straight connection to the electrical efficiency in an advanced oxidation process (AOP) system. The EE/O allows a fast definition of the energy cost and a sign of the total power consumed that is necessary for a detailed application. The EE/O is defined as the electrical energy in kilowatt hours (kWh) needed to degrade or oxidize a polluted C by one order of magnitude in 1 m3 (1000 L) of polluted water or air. EE/O evaluation (in kWh/m3) can be obtained from the following equation:
E (E/O) = (P × T × 1000)/(60 × V × log (Ci/Cf))
where P = power (kW); V = volume of water (L); T = treatment time t (min); Ci = initial concentrations (mol∙L−1); Cf = final concentrations (mol∙L−1).
The EE/O was calculated using Equation (8) with an initial volume of water V0 = 100 mL and initial concentration of Ci = 10 ppm and final dye concentration at each studied temperature. Figure 22, Figure 23, Figure 24 and Figure 25 show the relations between the EE/O and the treatment time under different concentrations of NaCl, KCl, CaCl2 and AlCl3 in the presence of Acid Blue 25 dye solution.
It is noticed that the EE/O increases with increasing molar concentration of the salts NaCl, KCl, CaCl2 and AlCl3 from 0.1 M to 2 M during the time of treatment. Adoption of the EE/O will let the industry and potential workers have a standardized objective basis for assessment. The EE/O behavior for the four different salts was similar for NaCl, and KCl, however in the case of CaCl2 and AlCl3 the behaviors are different. Regarding the first behavior seen with NaCl and KCL, the EE/O increases with time due to the fact more energy is needed for dye degradation and generation of the active radicals (H2O2, O3 and OH) for 15 min time and the EE/O reduces with time as the amount of radicals generated is increasing and the dye resistance for degradation reduces, so that amount of energy is reduced. In contrast, the behavior of EE/O under the influence of CaCl2 is constant during the whole time but at a higher value of EE/O compared with NaCl and KCl due to the negative influence of Ca on the active radicals so the dye degradation needs more energy for decolorizing the dye. On the other hand, the AlCl3 has a distinguishable behavior in that the EE/O starts by increasing because its EE/O increases with time but with a lower EE/O value than CaCl2 due to the influence of the high Cl ion concentration. Furthermore, the relation between the variations in salt concentration against average of the EE/O for different type of salts is shown in Figure 26. It is noticed from the figure that the EE/O increased at high salt concentration for all salts.
We compared the EE/O with conventional advanced oxidation of these dyes, where the advanced oxidation processes (AOPs) include UV/O3, UV/H2O2, Fenton, photo-Fenton, persulfate, non-thermal plasmas, sonolysis, photocatalysis, radiolysis, electron beam, corona discharge, and supercritical water oxidation processes [26]. It is apparent that the ozonation process proved to be the best option in terms of energy consumption and decolorization of dye solution. The energy consumption and cost of the treatment process increases as the initial dye concentration is increased, and as well as with an increase in the applied dose. EE/O parameters are inversely proportional to fundamental efficiency, the quantum yield of generation of active OH radicals. For UV/H2O2 and UV/H2O2/biosorbent the total electrical energy required is 3.428 kWhm−3 and 2.504 kWhm−3, respectively. From the economical point of view, the H2O2/UV process electrical energy for RBB decolorization (EEO = 59.25 kWhm−3) was much higher than by the UV/H2O2/biosorbent process (EEO = 40 kWhm−3). For a full-scale system, these costs strongly depend on the flow rate of the effluent and the reactor as well as the nature of the effluent [27]. Comparing the EE/O required using different oxidation processes studied in the literature with our corona discharge oxidation process for dye degradation, it was indicated that our process required an average EE/O value of 2 kWhm−3. This value is comparable with the UV/H2O2/biosorbent technique, and our corona discharge system produced ozone, H2O2 and OH which are more efficient than the literature triple UV/H2O2/biosorbent system.

4. Conclusions

The influence of different salts (such as KCl, NaCl, CaCl2 and AlCl3) on the dye degradation process in the presence of corona discharge was studied. The color removal behavior exploiting the high voltage pin-to-ground plate non-thermal plasma NTP system exhibited 82% dye removal at 11 min. The total removal occurred at 28 min. The presence of these salts in dye solutions will change the dye solution conductivity due to its role in changing the energy distribution through the dye solution and thus change the degradation efficiency of the dye. Decomposition efficiency increases with increasing solution conductivity. The increasing conductivity signals a reduction in color removal efficiency. The discharge energy and degradation efficiency are computed for diverse concentrations of NaCl, KCl, CaCl2 and AlCl3. It was detected that the presence of salts reduced the amount and the level of decolorization. The variation at the dye solution conductivity as the action of presence of salts will change the energy required for dye degradation (EE/O and energy yield) and all of these parameters were monitored. Moreover, the influence of the presence of Cl ions with cations in the different studied salts and its role in the dye degradation process was monitored. An investigation of the essential reactive species implicated in the oxidation of dye organic mixtures such as O3 in treated water and H2O2 was condicted. Generally, this work may prove helpful in the designing plasma systems appropriate for the treatment of industrial wastewaters in the presence of different salts.

Acknowledgments

The writers thankfully acknowledge STDF for supporting this investigation under the STDF project No. 10755.

Author Contributions

Ahmed El-Tayeb conceived, designed, and performed the experiments; analyzed the data; and wrote the manuscript. Ahmed H. El-Shazly and Marwa F. Elkady shared the analysis of the data and reviewed the manuscript.

Conflicts of Interest

The authors declare no conflict of interest.

References

  1. Njatawidjaja, E.; Sugiarto, A.T.; Ohshima, T.; Sato, M. Decoloration of electrostatically atomized organic dye by the pulsed streamer corona discharge. J. Electrostat. 2005, 63, 353–359. [Google Scholar] [CrossRef]
  2. Yang, Y.; Cho, Y.I.; Fridman, A. Plasma Discharge in Liquid Water Treatment and Applications; CRC Press: Boca Raton, FL, USA, 2012. [Google Scholar]
  3. Mok, Y.S.; Jo, J.O.; Whitehead, J.C. Degradation of an azo dye Orange II using a gas phase dielectric barrier discharge reactor submerged in water. Chem. Eng. J. 2008, 142, 56–64. [Google Scholar] [CrossRef]
  4. Dojcinovic, B.P.; Roglic, G.M.; Obradovic, B.M.; Kuraicac, M.M.; Kostićd, M.M.; Nešićb, J.; Manojlovićb, D.D. Decolorization of reactive textile dyes using water falling film dielectric barrier discharge. J. Hazard. Mater. 2011, 192, 763–771. [Google Scholar] [CrossRef] [PubMed]
  5. El-Tayeb, A.; El-Shazly, A.H.; Elkady, M.F.; Abdel-Rahman, A. Decolorization of acid blue 25 dye by non-thermal plasma advanced oxidation process for industrial wastewater treatment. In Proceedings of the 15th IEEE International Conference on Environment and Electrical Engineering (EEEIC 2015), Rome, Italy, 10–13 June 2015.
  6. PUBCHEM Open Chemistry Database. Available online: https://pubchem.ncbi.nlm.nih.gov/compound/Acid_Blue_25#section=InChI-Key (accessed on 28 July 2016).
  7. El-Tayeb, A.; El-Shazly, A.H.; Elkady, M.F.; Abdel-Rahman, A. Simulation and Experimental Study for Degradation of Organic Dyes Using Dual pin-to-plate Corona Discharge Plasma reactors for Industrial Wastewater Treatment. Contrib. Plasma Phys. 2016, 56, 855–869. [Google Scholar] [CrossRef]
  8. EL-Tayeb, A.; El Dein Adel, Z. Performance of Ceramic Insulator String for 132 kV under Different Polluted Conditions. J. Energy Power Sources 2014, 1, 152–160. [Google Scholar]
  9. El-Sayed Gouda, O.; El Dein Adel, Z.; EL-Tayeb, A. Prediction of flashover voltage and dry band location for polluted ceramic insulators using dynamic open-model. J. Energy Power Sources 2014, 1, 304–313. [Google Scholar]
  10. El-Tayeb, A.; El-Shazly, A.H.; Elkady, M.F.; Abdel-Rahman, A. Investigation of the Decolorization Efficiency of Two Pin-to-Plate Corona Discharge Plasma System for Industrial Wastewater Treatment. Plasma Phys. Rep. 2016, 42, 887–899. [Google Scholar] [CrossRef]
  11. Cheng, H.H.; Chen, S.S.; Wu, Y.C.; Ho, D.L. Non-Thermal Plasma Technology for Degradation of Organic Compounds in Wastewater Control: A Critical Review. Environ. Eng. Manag. J. 2007, 17, 427–433. [Google Scholar]
  12. El-Tayeb, A.; El-Shazly, A.H.; Elkady, M.F.; Abdel-Rahman, A. Non-thermal plasma as a new advanced technique for intensifying the industrial wastewater treatment. Desalination Water Treat. 2016, in press. [Google Scholar]
  13. Wanga, H.; Lib, J.; Quana, X. Decoloration of azo dye by a multi-needle-to-plate high-voltage pulsed corona discharge system in water. J. Electrostat. 2006, 64, 416–421. [Google Scholar] [CrossRef]
  14. El-Tayeb, A.; El-Shazly, A.H.; Elkady, M.F.; Abdel-Rahman, A. Simulation and experimental study for the effect of corona discharge plasma on the rate of wastewater treatment. Desalination Water Treat. 2016, in press. [Google Scholar]
  15. Zhang, Y.; Zhou, M.; Lei, L. Degradation of 4-chlorophenol in different gas liquid electrical discharge reactors. Chem. Eng. J. 2007, 132, 325–333. [Google Scholar] [CrossRef]
  16. El-Tayeb, A.; El-Shazly, A.H.; Elkady, M.F. Impacts of different salts on the degradation of acid blue 25 dye using non-thermal plasma. In Proceedings of the 16th IEEE International Conference on Environment and Electrical Engineering (EEEIC 2016), Florence, Italy, 7–10 June 2016.
  17. Dojčinovića, B.P.; Roglićb, G.M.; Obradovićc, B.M.; Kuraicac, M.M.; Kostićd, M.M.; Nešićb, J.; Manojlović, D.D. Decolorization of reactive textile dyes using water falling film dielectric barrier discharge. J. Hazard. Mater. 2011, 192, 763–771. [Google Scholar] [CrossRef] [PubMed]
  18. Overzet, L.J.; Leong-Rousey, F.Y. Time-resolved power and impedance measurements of pulsed radiofrequency discharges. Plasma Sources Sci. Technol. 1995, 4, 432443. [Google Scholar] [CrossRef]
  19. Aleksandrov, N.L.; Kindysheva, S.V.; Kosarev, I.N. Plasma decay in air and N2: O2: CO2 mixtures at elevated gas temperatures. In Proceedings of the 47th AIAA Aerospace Sciences Meeting Including The New Horizons Forum and Aerospace Exposition, Orlando, FL, USA, 5–8 January 2009.
  20. Šunka, P. Pulse electrical discharges in water and their applications. Phys. Plasmas 2001, 8, 25–87. [Google Scholar] [CrossRef]
  21. Chang, J.; Lawless, P.; Yamamoto, T. Corona discharge processes. IEEE Trans. Plasma Sci. 1991, 19, 1152–1166. [Google Scholar] [CrossRef]
  22. Ono, R.; Oda, T. Ozone production process in pulsed positive dielectric barrier discharge. J. Phys. D Appl. Phys. 2007, 40, 176. [Google Scholar] [CrossRef]
  23. Hayashi, Y.; Machmudah, S.; Takada, N.; Kanda, H.; Sasaki, K.; Goto, M. Decomposition of methyl orange using pulsed discharge plasm a at atmospheric pressure: Effect of different electrodes. Jpn. J. Appl. Phys. 2014, 53, 1. [Google Scholar] [CrossRef]
  24. Lukes, P.; Locke, B.R. Degradation of Substituted Phenols in a Hybrid Gas-Liquid Electrical Discharge Reactor. Ind. Eng. Chem. Res. 2005, 44, 2921–2930. [Google Scholar] [CrossRef]
  25. Krugly, E.; Martuzevicius, D.; Tichonovas, M.; Jankunaite, D.; Rumskaite, I.; Sedlina, J.; Racys, V.; Baltrusaitis, J. Decomposition of 2-naphthol in water using a non-thermal plasma reactor. Chem. Eng. J. 2015, 260, 188–198. [Google Scholar] [CrossRef]
  26. Khan, H.; Ahmad, N.; Yasar, A.; Shahid, R. Advanced Oxidative Decolorization of Red Cl-5B: Effects of Dye Concentration, Process Optimization and Reaction Kinetics. Pol. J. Environ. Stud. 2010, 19, 83–92. [Google Scholar]
  27. Marandi, R.; Olya, M.E.; Khosravi, M.; Khalilnezhad, R. Decolourisation of the dyes in aques solution using a new combinated system (UV/H2O2/biosorbent). J. Appl. Environ. Biol. Sci. 2013, 3, 71–80. [Google Scholar]
Figure 1. Diagram of the experimental arrangement: 1-Pulsed source; 2-Shell reactor; 3-Pin; 4-Ground; 5-Voltage sensor; 6-Current sensor; 7-Oscilloscope.
Energies 09 00874 g001
Figure 2. Plasma treatment system using corona discharge.
Energies 09 00874 g002
Figure 3. PWM Circuit Based on the 555 Timer.
Energies 09 00874 g003aEnergies 09 00874 g003b
Figure 4. Voltage and current waveform output from the ignition coil.
Energies 09 00874 g004aEnergies 09 00874 g004b
Figure 5. Discharge above the surface of dye solution.
Energies 09 00874 g005
Figure 6. Decolorization efficiency in the presence of NaCl, KCl, CaCl2, and AlCl3 salts at 0.1 M concentration.
Energies 09 00874 g006
Figure 7. Decolorization efficiency in the presence of NaCl, KCl, CaCl2, and AlCl3 salts at 0.25 M concentration.
Energies 09 00874 g007
Figure 8. Decolorization efficiency in the presence of NaCl, KCl, CaCl2, and AlCl3 salts at 0.5 M concentration.
Energies 09 00874 g008
Figure 9. Decolorization efficiency in the presence of NaCl, KCl, CaCl2, and AlCl3 salts at 1 M concentration.
Energies 09 00874 g009
Figure 10. Decolorization efficiency in the presence of NaCl, KCl, CaCl2, and AlCl3 salts at 1.5 M concentration.
Energies 09 00874 g010
Figure 11. Decolorization efficiency in the presence of NaCl, KCl, CaCl2, and AlCl3 salts at 2 M concentration.
Energies 09 00874 g011
Figure 12. Effects of the presence of NaCl, KCl, CaCl2, and AlCl3 salts at various concentrations on solution conductivity.
Energies 09 00874 g012
Figure 13. Effects of presence of NaCl, KCl, CaCl2, and AlCl3 salts at various concentrations on the energy discharge.
Energies 09 00874 g013
Figure 14. Discharge power with the time for Acid Blue 25 dye during the 0.001–0.007 s.
Energies 09 00874 g014
Figure 15. Relation between H2O2 concentrations with the time.
Energies 09 00874 g015
Figure 16. Relation between the generated O3 at treated dye solution with the time.
Energies 09 00874 g016
Figure 17. Relation between the energy yield and time at concentration of NaCl in Acid Blue 25 dye.
Energies 09 00874 g017
Figure 18. Relation between the energy yield and time at concentration of KCl in Acid Blue 25 dye.
Energies 09 00874 g018
Figure 19. Relation between the energy yield and time at concentration of CaCl2 in Acid Blue 25 dye.
Energies 09 00874 g019
Figure 20. Relation between the energy yield and time at concentration of AlCl3 in Acid Blue 25 dye.
Energies 09 00874 g020
Figure 21. Relation between the variations in salt concentration against average of the energy yield for different type of salts.
Energies 09 00874 g021
Figure 22. Relation between the EE/O and time for different concentrations of NaCl.
Energies 09 00874 g022
Figure 23. Relation between EE/O and time for different concentrations of KCl.
Energies 09 00874 g023
Figure 24. Relation between EE/O and time for different concentrations of CaCl2.
Energies 09 00874 g024
Figure 25. Relation between EE/O and time for different concentrations of AlCl3.
Energies 09 00874 g025
Figure 26. Relation between the variations in salt concentration against average of the EE/O for different types of salts
Energies 09 00874 g026
Table 1. Physical properties and chemical structure of the dye used.
NameAcid Blue 25 Dye
Color:Blue
Physical State and appearanceSolid powder
Molecular Weight416.382 g/mol
Exact/Monoisotopic Mass416.044287 g/mol
Surface Area138 Å2
Atom Count29
UV absorption (λmax)600 nm
Molecular formulaC20H13N2NaO5S
Molecular Structure Energies 09 00874 i001

