Article

A Generalized SOC-OCV Model for Lithium-Ion Batteries and the SOC Estimation for LNMCO Battery

1
National Active Distribution Network Technology Research Center (NANTEC), Beijing Jiaotong University, Beijing 100044, China
2
Collaborative Innovation Center of Electric Vehicles in Beijing, Beijing Jiaotong University, Beijing 100044, China
3
Department of Electrical and Computer Engineering, Wayne State University, Detroit, MI 48202, USA
*
Author to whom correspondence should be addressed.
Energies 2016, 9(11), 900; https://doi.org/10.3390/en9110900
Submission received: 19 August 2016 / Revised: 19 October 2016 / Accepted: 26 October 2016 / Published: 1 November 2016
(This article belongs to the Special Issue Advanced Energy Storage Technologies and Their Applications (AESA))

Abstract

:
A state-of-charge (SOC) versus open-circuit-voltage (OCV) model developed for batteries should preferably be simple, especially for real-time SOC estimation. It should also be capable of representing different types of lithium-ion batteries (LIBs), regardless of temperature change and battery degradation. It must therefore be generic, robust and adaptive, in addition to being accurate. These challenges have now been addressed by proposing a generalized SOC-OCV model for representing a few most widely used LIBs. The model is developed from analyzing electrochemical processes of the LIBs, before arriving at the sum of a logarithmic, a linear and an exponential function with six parameters. Values for these parameters are determined by a nonlinear estimation algorithm, which progressively shows that only four parameters need to be updated in real time. The remaining two parameters can be kept constant, regardless of temperature change and aging. Fitting errors demonstrated with different types of LIBs have been found to be within 0.5%. The proposed model is thus accurate, and can be flexibly applied to different LIBs, as verified by hardware-in-the-loop simulation designed for real-time SOC estimation.

1. Introduction

Lithium-ion batteries (LIBs) have been massively deployed in electric vehicles (EVs), hybrid electric vehicles (HEVs), plug-in hybrid electric vehicles (PHEVs), and stationary energy storage systems. Their attractiveness is their high voltage, high energy density, high efficiency, long cycle lifetime, and environmental benignity. Because of these advantages, their rapid growth is likely to continue with a strong likelihood of becoming the dominant storage technology. Along with this growth, accurate modeling of batteries is essential for control, optimization, energy management, diagnosis and prognosis in real time. The developed model will usually rely on the SOC-OCV relationship, which, in general, is for representing the battery electrochemical processes and thermodynamics at various SOCs. It is therefore a meaningful function needed for battery modeling, especially in the case of lumped parameter circuit models with an electromotive force (EMF) and a series of Resistance-Capacity (RC) networks [1,2,3,4,5]. For the RC networks, their parameters are always obtained experimentally based on data fitting, rather than specific physical principles. Similarly, the EMF is acquired by measuring the battery open-circuit terminal voltage when it reaches a steady state. It effectively reflects the concentration ratio of resultants to reactants during battery charging and discharging, and is therefore determined by the inherent electrochemical properties of the battery. This EMF is subsequently used as the approximate OCV.
The SOC-OCV function is therefore representative for a particular battery, and is generally a nonlinear monotone function between SOC and OCV for all LIBs. It is hence widely used in battery management systems (BMS) for correcting SOC calculation. Specific cases can be found in [6,7,8,9], where model based estimation of battery SOC and capacity has been developed using the SOC-OCV relationship. It has also been revealed in [10] that the accuracy of the SOC-OCV curve has great influence on the SOC value estimated. The same applies to battery capacity estimation, which has commonly been relied on for state-of-health (SOH) determination. It is consequently important to determine the SOC-OCV relationship precisely, if an accurate estimation of the battery state is necessary.
For this, some studies have proposed diversified methods for OCV modeling with each having distinctive pros and cons [11,12,13,14,15,16,17,18,19,20,21]. Xiong in [11] proposed a novel systematic state-of-charge estimation framework for accurately estimating SOC of the battery, where the relationship between battery SOC and OCV is highly employed. With the accurate battery model and adaptive filter based battery SOC estimator, the SOC of the battery pack can be accurately estimated. Reference [12] developed an EMF model as a function of the battery temperature, terminal voltage under open-circuit condition (not steady-state) and its slope. Its model parameters were determined from experimental data, but its accuracy gradually reduces as the battery ages. References [13,14] next use exponential and logarithmic functions for describing the relationship among OCV, EMF and time. However, like in [12], they result in battery models with high complexity, and are therefore difficult for usage in real time. Reference [15] proposed an alternative adaptive OCV estimation method based on battery diffusion principles. This method demonstrates high accuracy with its estimated SOC and capacity, but it is complex and has difficulty in online estimation because of its many coupled and non-coupled parameters. Reference [16] then employed a dynamic hysteresis model for predicting the OCV, where a hysteresis voltage has been included in the function for SOC. This model demonstrates high accuracy with Li4Ti5O12 (LTO), LiFePO4 (LFP), LiMn2O4 (LMO) and LiNi1/3Mn1/3Co1/3O2 (LNMCO) batteries, but its OCV hysteresis is generally not suitable for real-time model updating. Reference [17] proposed an OCV model structure in which simplified hyperbolic and exponential functions are used to represent phenomenological characteristics associated with the lithium-ion intercalation/deintercalation process. The developed SOC-OCV model applying to LiFePO4 battery demonstrated higher accuracy compared to five OCV models summarized in [18]. However, its adaptability to other types of lithium-ion batteries needs to be further investigated. Reference [19] developed another type of OCV model that generates OCV vs. SOC curves based on the electrode half-cell data, which is able to be used for battery diagnostics and prognostics, and is an effective method especially for determining the degree of battery degradation in a quantitative manner. This approach requires half-cell data and thus opening the cells to reach high accuracy, which has difficulty in real-time SOC estimate applications.
This paper expands the main ideas in [10] and introduces a new model structure for the SOC-OCV relationship with some distinctive features that are especially important for model updating in real time: (1) the model uses four base functions that capture the fundamental electrochemical foundations over low, middle, and high SOC ranges; (2) it fits the experimental data for a large class of batteries of different types well, with very high accuracy; (3) it is simple and contains much fewer numbers of parameters than common existing models such as piece-wise interpolation types; (4) due to its simplicity, it becomes uniquely suitable for real-time updating on the parameter values. In other words, it is desirable for data-driven model identification, which is essential for adaptive battery management systems that can accommodate aging, environment variations, fault diagnosis, SOC estimation, and SOH monitoring.
Parameters of the generalized model must next be optimized for mapping out the SOC-OCV characteristics of different LIBs. For this, a nonlinear iterative algorithm has been developed, which is beyond the concepts presented in [10]. A real-time SOC estimation algorithm is then presented for online adaptive parameter updating needed for ensuring model accuracy throughout the battery lifetime. The updated model parameters can, in turn, be used for indicating SOH of the tested battery from the perspective of thermodynamics.
Contributions of the paper can thus be summarized as: (i) analysis of electrochemical processes during charging/discharging of commercial lithium-ion batteries, and their related function characteristics; (ii) development of a generalized SOC-OCV model that is simple, accurate and flexible for real-time battery state estimation; (iii) identification and verification of the proposed SOC-OCV model; (iv) analysis of parameter properties of the SOC-OCV model; and (v) hardware-in-the-loop (HIL) demonstration of real-time SOC estimation using the proposed SOC-OCV model.
The above contributions have been organized into five sections with Section 2 describing the SOC-OCV relations and electrochemical processes of various commercial LIBs. They include LMO, LNMCO and LFP batteries with graphite anodes, and novel batteries with LTO anodes. The generalized SOC-OCV mapping model and identification method are also introduced in this section. Section 3 then verifies the model accuracy for a variety of LIBs. The model robustness towards ambient temperature and battery aging is also analyzed in the section. Implementation issues and SOC estimation using the proposed SOC-OCV model are subsequently discussed in Section 4, where efficacy and accuracy of the estimation have been established. Finally, Section 5 summarizes the main findings of the paper, and highlights some related future issues.

2. Generalized SOC-OCV Model for Batteries

2.1. Experimental

Five types of batteries were tested to get their OCV-SOC curves. The battery types and their rated capacities are G//LMO-90 Ah, G//LNMCO-28 Ah, G//LNMCO + LMO-25 Ah, G//LFP-60 Ah, LTO//LNMCO + LMO-8.5 Ah. In the tests, the batteries were first discharged to the cutoff voltage with 1/20 C rated and rested for 2 h. Then, batteries were charged to the cutoff voltage, followed by a 2 h rest and then discharged to the cutoff voltage. Both the charge/discharge rate were 1/20 C. Arbin Instruments BT2000 test systems were used for the tests, and, during the test, batteries were put in the temperature chamber at 25 °C. S O C = Q r e s / Q m a x , where Q r e s represents residual capacity of the battery, and Q m a x is the maximum available capacity at the current of 1/20 C. From the test data, V-SOC curves for charge/discharge regime can be obtained, respectively, and then, by averaging the two V-SOC curves, the OCV-SOC curve of a battery is determined [22].

2.2. Electrochemical Analysis of OCV

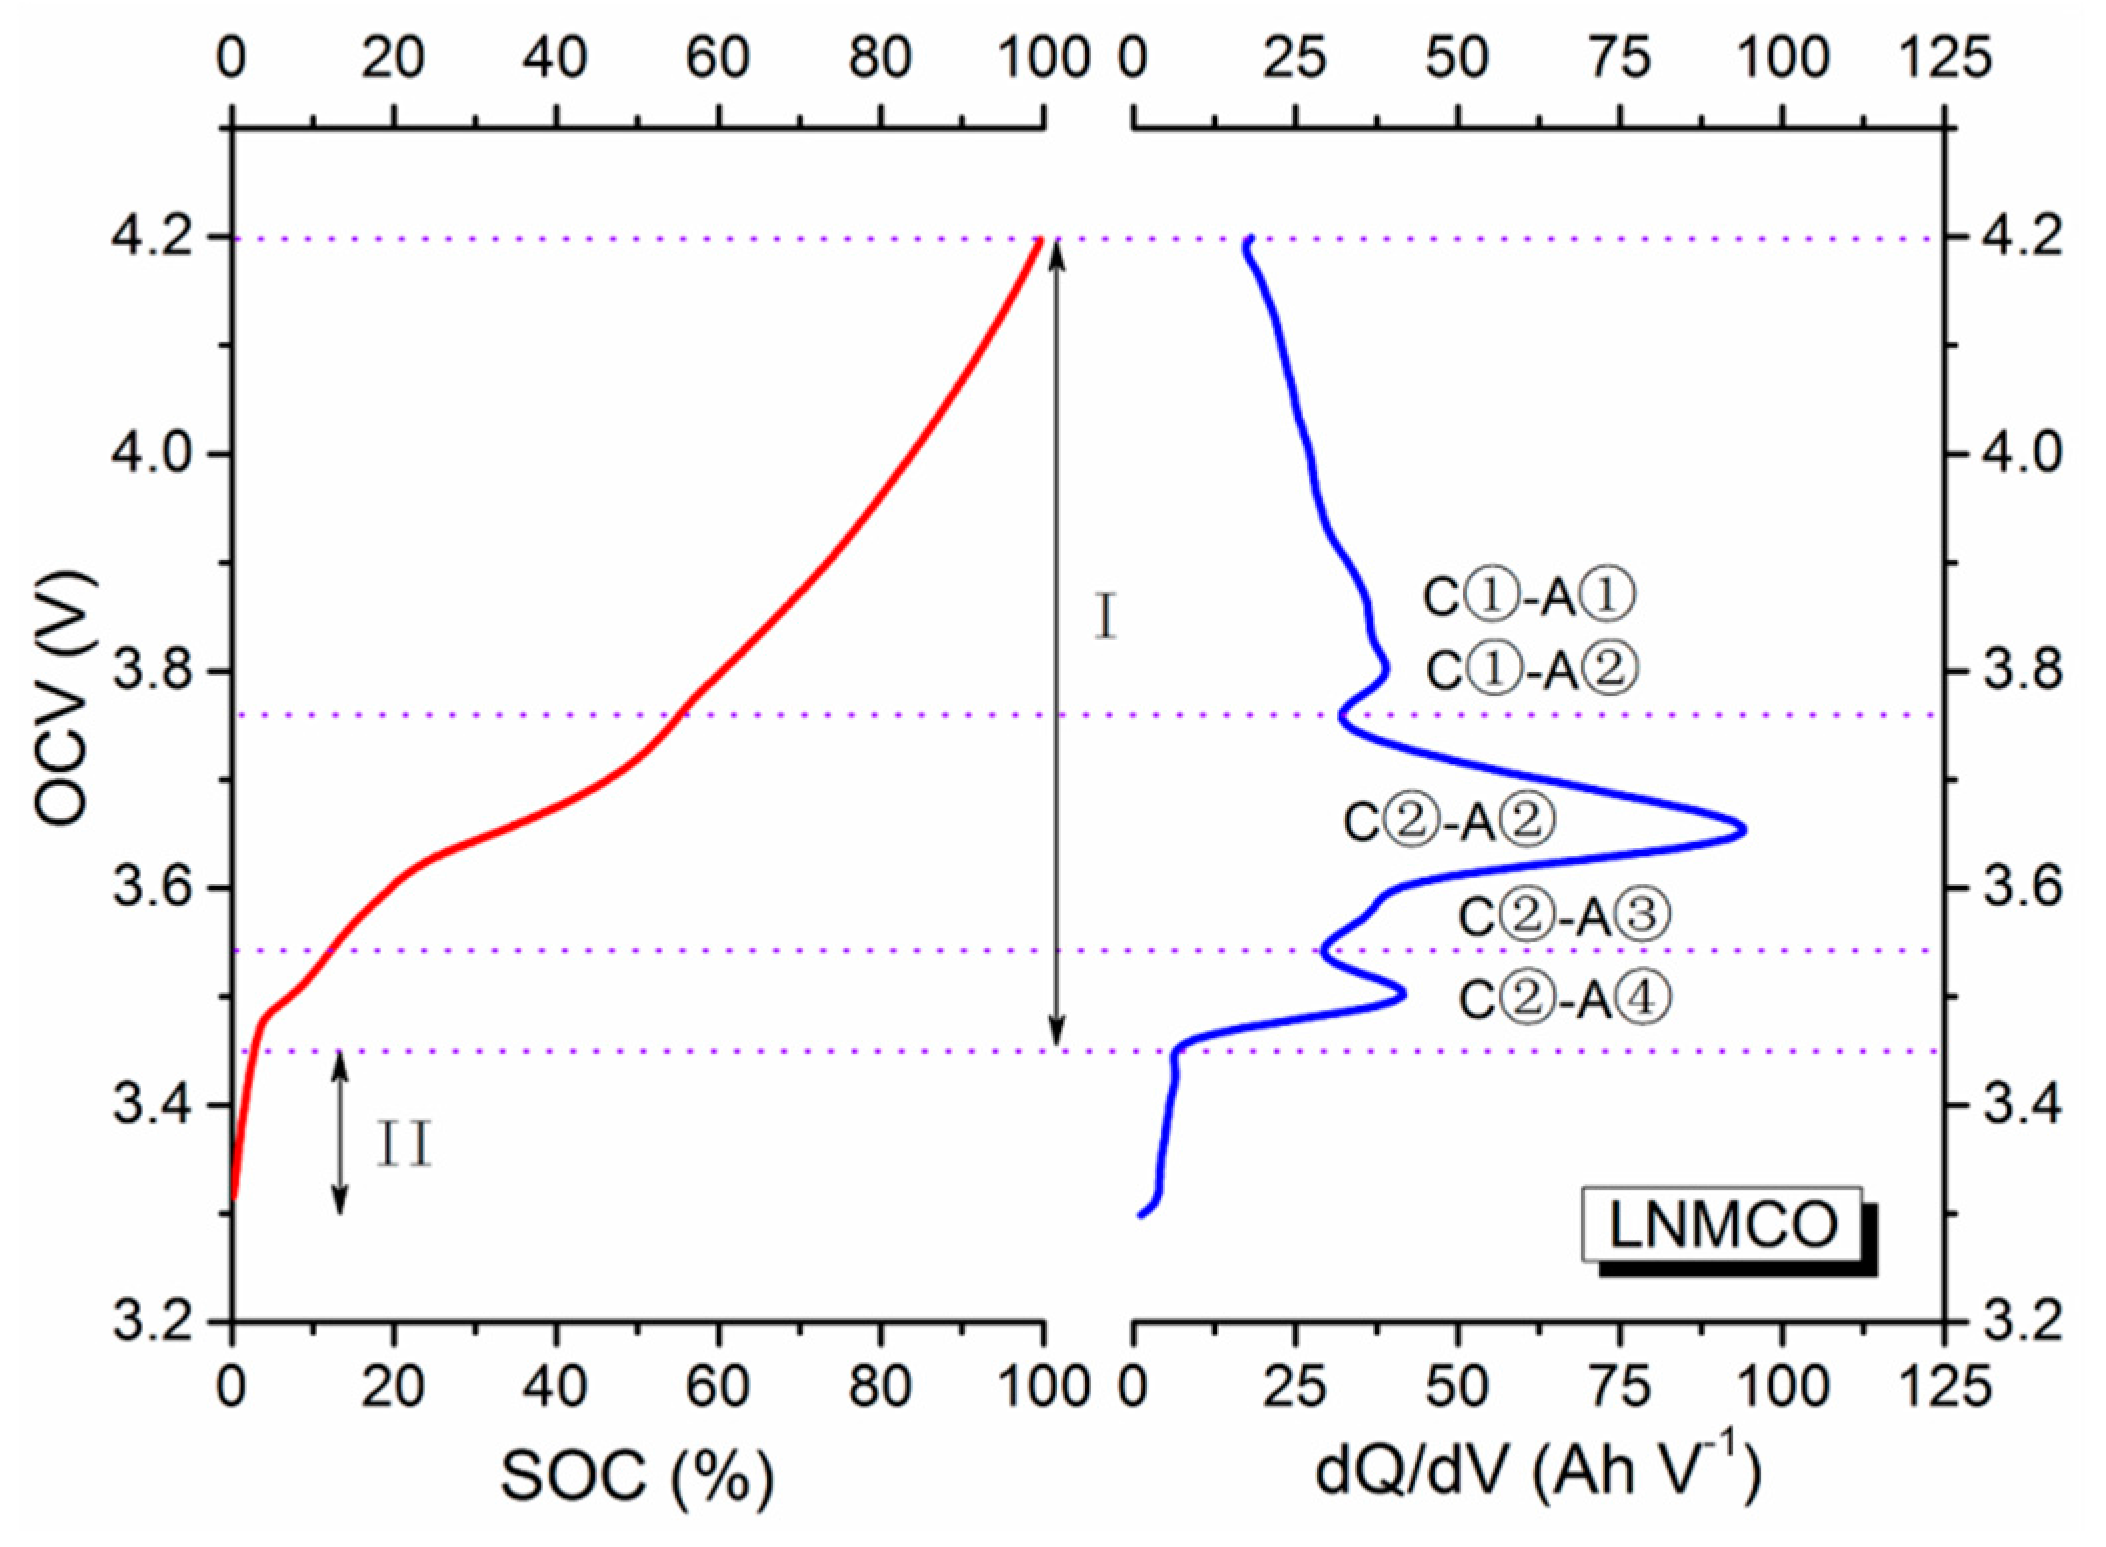
Consider a commercial LIB with an LNMCO cathode and a graphite anode, its experimental OCV curve as a function of SOC and the corresponding dQ/dV profile is displayed in Figure 1, and its schematic presentation of the electrochemical redox reactions is illustrated in Table 1 [23]. The shown OCV behavior is caused by electrode redox reactions experienced by the cathode and anode materials. Particularly, in stage I, where the voltage gradually drops to a certain level, the main electrochemical reactions of the active materials can proceed, resulting in tardy voltage variations. This dynamic voltage decrease can appropriately be represented by a linear function that is associated with the continuous electrochemical redox reactions. In stage II, only small traces of electrochemical reactions occur due to the relatively low cell voltage. The cell voltage then suddenly drops, and can be described by a specific logarithmic function with a real (not complex) power. To better clarify this function form, the dQ/dV profile (differentiates the battery charged capacity (Q) to the terminal voltage (V)) derived from the SOC-OCV curve in Figure 1 is evaluated, beginning with the layered LNMCO cathode.
At the cathode, its presented voltage gradually increases/decreases throughout the whole electrochemical charging/discharging processes. When it is charged to above 4.5 V, all lithium ions deintercalated from the bulk of the material, along with the oxidation from Ni2+ to Ni4+ and from Co3+ to Co4+. The layered LNMCO structure is thus damaged, attributed to the degraded electrochemical performance caused by the high charging voltage [24,25]. Consequently, the layered LNMCO cathode with homogenous phase reactions only works over the range of 0 ≤ x ≤ 2/3 in Li1−xCo1/3Ni1/3Mn1/3O2 [26]. Moreover, according to the first principle calculations reported, there are two solid state redox reactions occurring when the voltage is below 4.5 V. They are ascribed to Li1/3Co1/3Ni1/3Mn1/3O2 and Li2/3Co1/3Ni1/3Mn1/3O2 ranging from 4.2 V to 3.9 V (Ni4+/Ni3+, labeled as C①), and Li2/3Co1/3Ni1/3Mn1/3O2 and LiCo1/3Ni1/3Mn1/3O2 at 3.9 V–3.7 V (Ni3+/Ni2+, labeled as C②), respectively.
In theory, the dQ/dV plot of the LNMCO electrode should therefore show two isolated peaks near these voltage plateaus. The two peaks are not separated, and hence appear as a broad peak in the dQ/dV plot [27]. On the other hand, for the graphite anode, there are five phase transformation stages during the charging/discharging processes over the voltage range from 0.8 to 0.01 V [28]. They include three main plateaus corresponding to the three pairs of redox reaction peaks in the dQ/dV plot of the graphite electrode. They are LiC6↔LiC12 at 0.10/0.08 V (labeled as A①), LiC12↔LiC36 at 0.14/0.11 V (labeled as A②), and LiC36↔LiC72 at 0.22/0.20 V (labeled as A③), respectively. In addition, an unobvious plateau (or peak), LiC72↔C6 above 0.3 V (labeled as A④), usually appears in the SOC-OCV curve and dQ/dV plot.
The overall SOC-OCV curve of the cell in Figure 1 can be obtained using the approach reported in [29]. In other words, when the cathode is on a steady electrochemical reaction plateau, an additional peak will emerge at each distinct anode phase transformation plateau. Therefore, each peak in the dQ/dV plot of the cell can be distinctively identified. For example, C①-A② represents the state in which the cathode is on its first plateau and the anode is on its second plateau. The peak voltage in the dQ/dV plot is the difference in plateau voltage between the cathode and the anode [23]. It is also informative to point out that the number, location and shape of the peaks in the dQ/dV plot usually vary with operating conditions and degradation of the LIBs. It is therefore possible to identify performance decline origins of many cells based only on their dQ/dV variations.
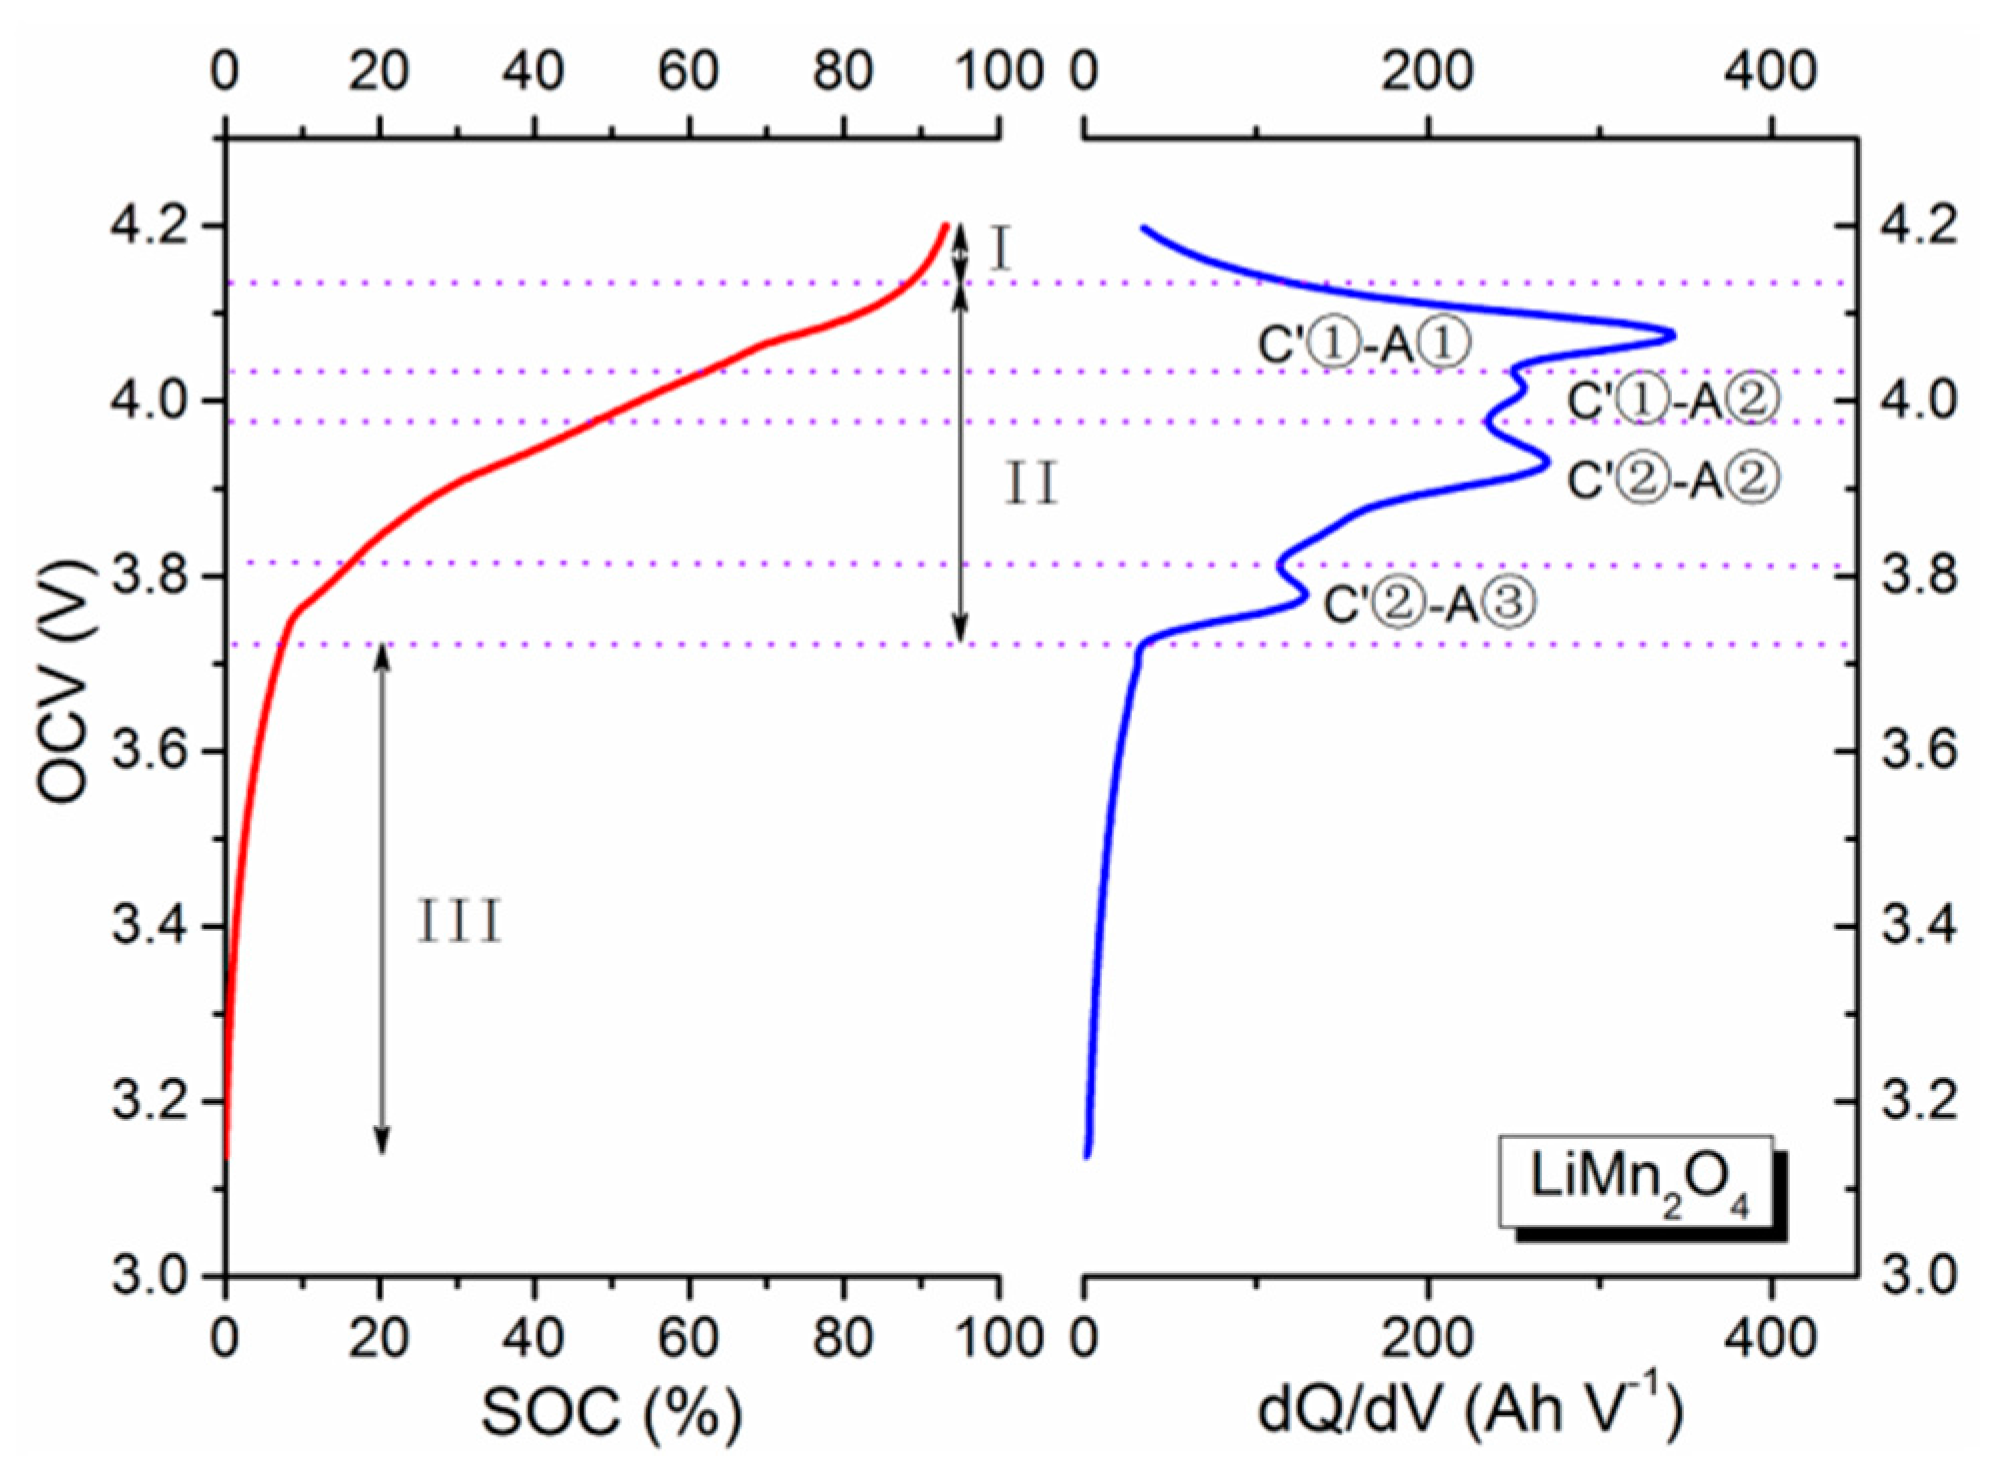
Similarly, in the case of the spinel LMO cathode shown in Figure 2 and Table 2, it exhibits two electrochemical plateaus at 4.1 V (labeled as C′①) and 3.95 V (labeled as C′②). They correspond to the two phase transformations notated as Mn2O4/Li0.5Mn2O4, and Li0.5Mn2O4/LiMn2O4 [30,
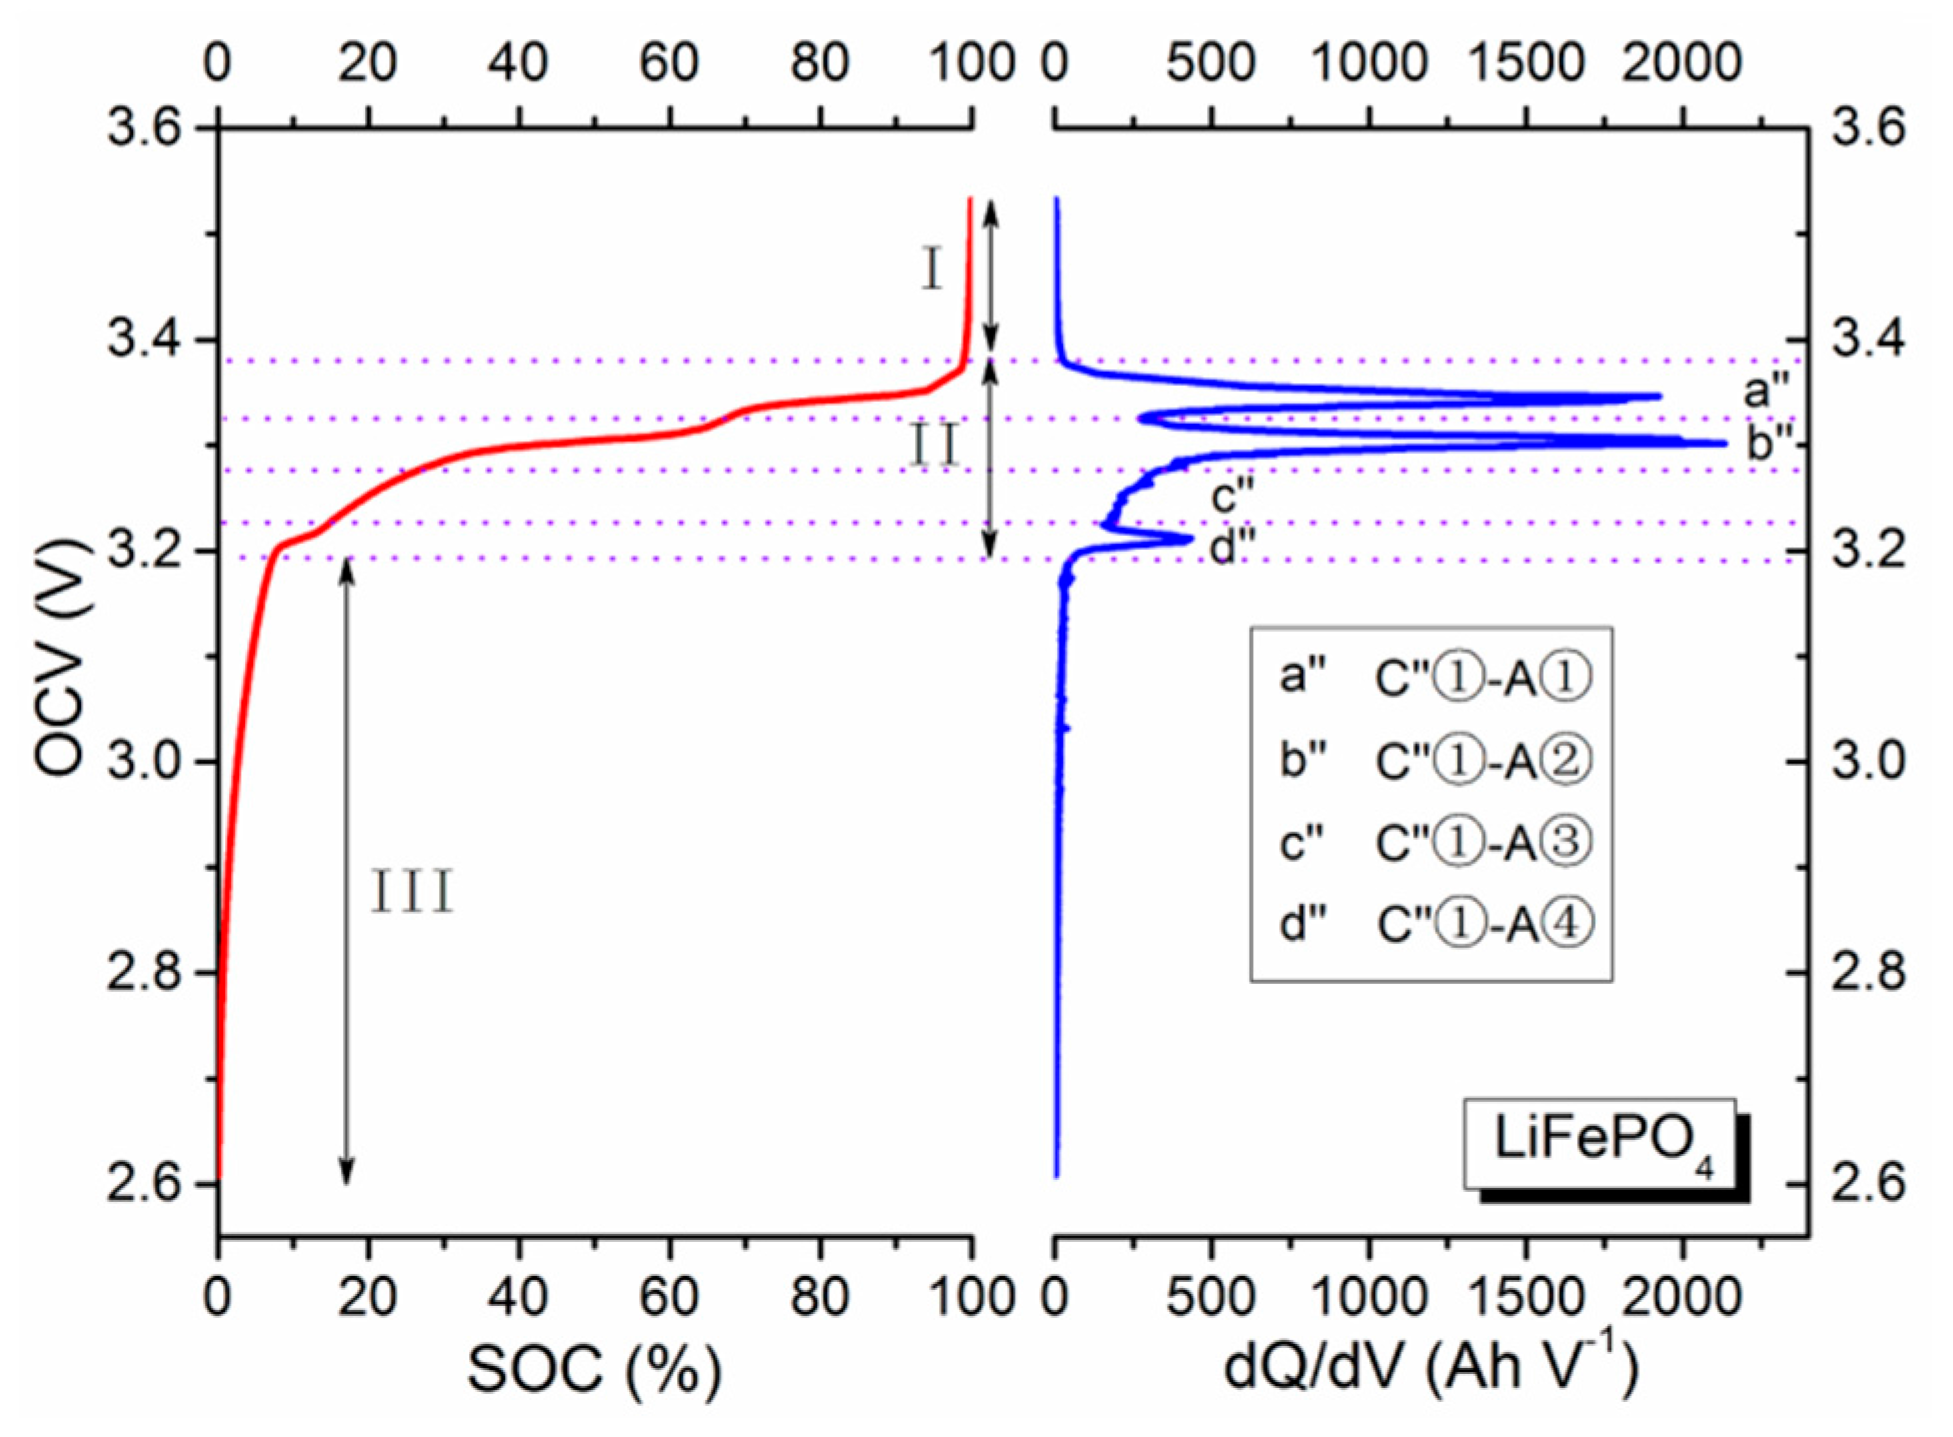
31]. Likewise, for the olive LFP cathode shown in Figure 3 and Table 3 [29], it manifests a unique voltage plateau at 3.45 V (labeled as C″①), which has been verified as the phase transformation between FePO4 and LiFePO4 [32]. In addition, unlike the LNMCO/graphite battery, the SOC-OCV curves of the LMO/graphite and LFP/graphite systems can be divided into three stages. In stage I, redox reactions basically completely with only slight traces of them continuing. The main process in this stage is also charge accumulation, whose effect is a rapid decrease of OCV value that can nicely be described by an exponential function. The latter two stages (II and III) are identical to the two stages (I and II) of LNMCO/graphite batteries, and are for representing the main electrochemical reaction and charge accumulation stages.
For example, the voltage of the LFP batteries rapidly decreased in stage I because the main component is basically the FePO4 without any more phase transformation. Upon reaching stage II, the voltage of the LFP battery remains relatively steady. The low voltage is attributed to the extraction/insertion reactions of the LFP cathode, assigned to the first-order phase transition. A flat voltage plateau is thus produced with two phase regions corresponding to FePO4 and LiFePO4. Taking the stage I into consideration, it may therefore introduce some differences when determining parameters for the SOC-OCV model, as compared to the earlier LNMCO battery. 
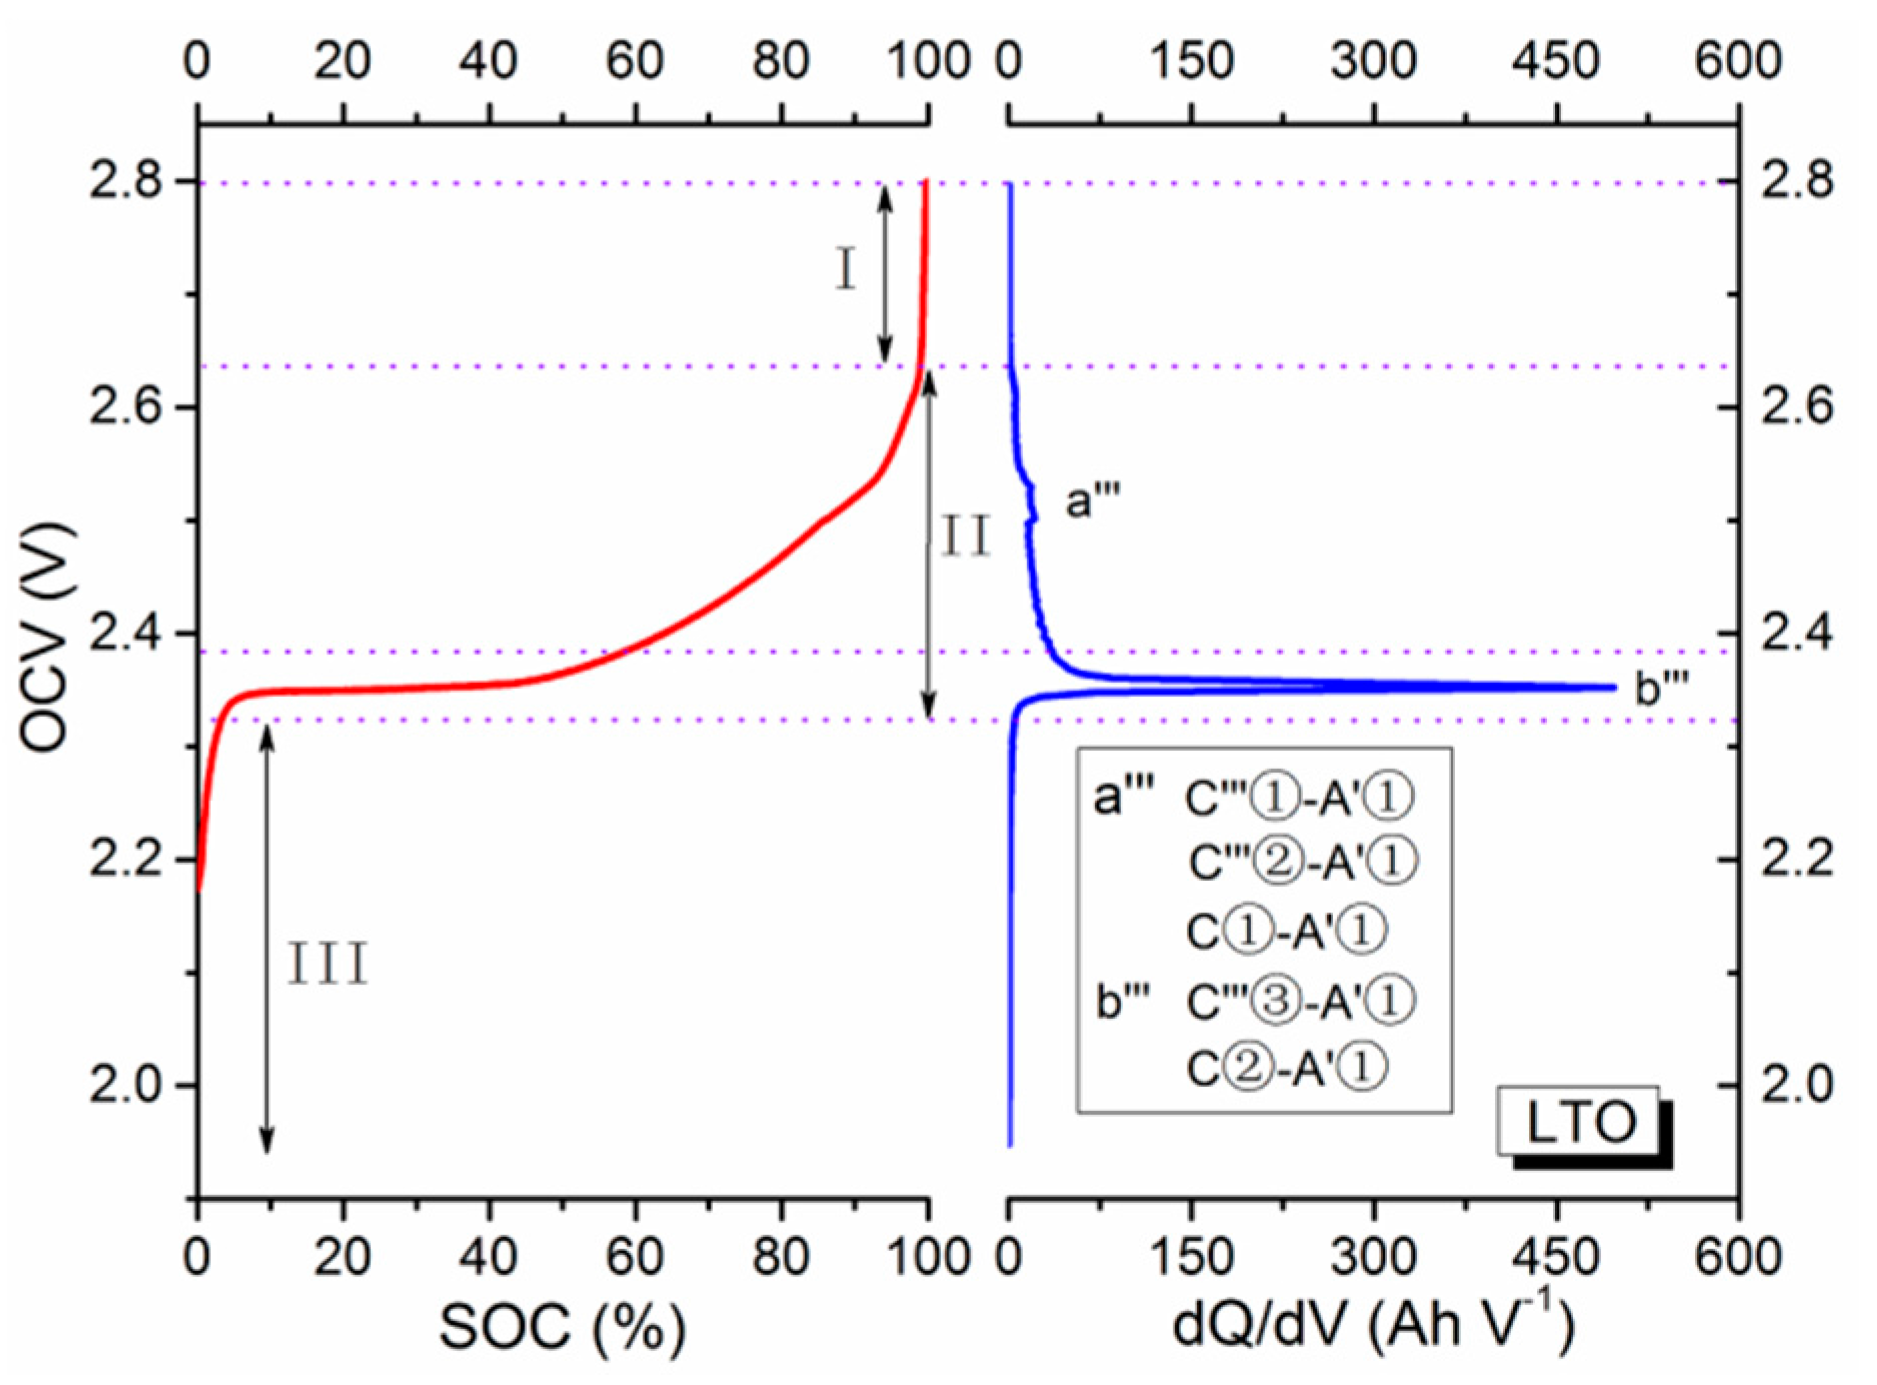
Figure 4 shows the SOC-OCV curve and corresponding dQ/dV profile of the novel lithium-ion batteries with NMC+LiCoO2 (LCO) cathode and LTO anode, and the phase transformation is relatively uncomplicated. Table 4 reports its schematic presentation of the electrochemical redox reactions [33]. For the LTO anode [34], the phase transformation between Li7Ti5O12 and Li4Ti5O12 occurs near 1.55 V, showing a long plateau. For the LiCoO2 cathode, it exhibits two very weak peaks at 4.19/4.13 V and 4.06/4.03 V (labeled as C′′′①and C′′′②) and a pair of strong redox peak at 3.97/3.85 V (labeled as C′′′③), corresponding to the reduction/oxidation reactions of Co4+/Co3+ [35], respectively. In view of the flat plateau of the LTO anode, the dQ/dV curve primarily reflects the characteristics of the NMC+LCO cathode and the LTO anode. However, due to the approximate phase transformation voltage of LCO and NMC, overlaps of peaks will appear in the dQ/dV curve of the LTO lithium-ion battery. The three stages of the SOC-OCV curve of the NMC+LCO/LTO batteries are similar to those of LMO/graphite and LFP/graphite batteries.
It is confirmed from electrochemical analysis of different types of LIBs that a three-segment SOC-OCV model is more potentially suitable for capturing all characteristic features of the described electrochemical processes. This model structure and its suitability for real-time implementation are described next.

2.3. Generalized SOC-OCV Model

The proposed generalized SOC-OCV model is shown in Equation (1), where a logarithmic function with real (not complex) power, a linear function, and an exponential function with a shifted exponent can clearly be seen:
V OCV =   a + b ( ln s ) m + c s + d e n ( s 1 )
where V OCV and s represent the OCV and SOC of the battery, respectively, and 0 s 1 , m > 0 and n > 0 .
To match the processes described in Section 2.2, the logarithmic function must be tuned to play a predominant role at low SOC, where charge accumulations on the surfaces of the active materials happen within the LIB. The linear function, in turn, dominates the middle SOC range, where primary phase transformation of the active materials occurs. The last exponential function then contributes to the high SOC behavior, where both partial redox reaction and charge accumulation occur. The three functions in Equation (1) are therefore essential, and will interact with each other to form the generalized OCV model over the whole SOC range.
Compared with [10], coefficients m and n included in Equation (1) are for adapting the model to match with different types of LIBs, since they depend on active materials of electrodes used in the LIBs. Their specific values and properties will be discussed in Section 3, where the hypothesis of m and n being invariant for a specific type of LIBs will also be proved. In other words, it will be proved that both m and n will not change with temperature and aging. Consequently, the SOC-OCV model is reduced to a sum of only four proportionally scaled terms, whose coefficients are a, b, c and d in Equation (1). Only these four coefficients require tuning in real-time to arrive at the desired SOC-OCV mapping. The complexity of realizing Equation (1) has therefore been considerably reduced, which is certainly encouraged for real-time state estimation.

2.4. Recursive Parameter Identification

For a given class of LIBs, its six model parameters in Equation (1) must collectively be determined from offline experimental data. This determination is nonlinear because of the logarithmic and exponential functions included in Equation (1). Some amount of complexity may therefore be involved, but will subsequently be proven to be otherwise since m and n are fixed for a given class of LIBs, and hence do not need real-time updating. They must, however, be determined for once at the beginning of real-time execution. Typical non-linear algorithm for optimization is thus needed, and is usually run iteratively. One possibility is the gradient based iterative search method, which mathematically, relies on the following equation, expressed in terms of the unknown parameter vector θ = ( a , b , c , d , m , n ) :
V OCV = a + b ( ln s ) m + c s + d e n ( s 1 ) ( 0 s 1 , m > 0 , n > 0 ) ,
y = F ( s ; θ )   =   a + b ( ln s ) m + c s + d e n ( s 1 ) .
The obtained N sets of experimental data (s(k), y(k)), k = 1,…,N, when substituted in Equation (3), further lead to the following equations:
y ( k ) = F ( s ( k ) ; θ ) + e ( k ) ,   k = 1 , , N Y = F ( S ; θ ) + E , where   Y = [ y ( 1 ) , , y ( N ) ] T , S = [ s ( 1 ) , , s ( N ) ] T , E = [ e ( 1 ) , , e ( N ) ] T .
A nonlinear least square estimation problem has thus been formed. The purpose is to find the parameter vector that can minimize the following expression:
min θ ε ( θ ) = 1 2 ( Y F ( S ; θ ) ) T ( Y F ( S ; θ ) ) Let   G ( θ ) = ( F ( S ; θ ) θ ) T = [ 1 ( ln s 1 ) m 1 ( ln s N ) m s 1 e n ( s 1 1 ) s N e n ( s N 1 ) b [ ln ( ln s 1 ) ] ( ln s 1 ) m d ( s 1 1 ) e n ( s 1 1 ) b [ ln ( ln s N ) ] ( ln s N ) m d ( s N 1 ) e n ( s N 1 ) ] T .
The process must usually be executed iteratively, using the gradient based algorithm provided as follows:
θ j + 1 = θ j + μ j G ( θ j ) ( Y - F ( S ; θ j ) ,
where the step size μ j must be selected to ensure algorithm convergence.
The algorithm is stopped only when | | θ j + 1 θ j | | is smaller than a pre-defined small threshold.

3. Verification of OCV Model

3.1. Estimation Accuracy Analysis with Different LIBs

To validate the proposed OCV model, a series of experiments were performed on different classes of LIBs to obtain SOC-OCV mapping data. Each experiment was performed with the battery charged from its fully discharged state at a current of 0.05 C. The charging continued until the terminal voltage of the battery reached the charging voltage limit. The battery was subsequently open-circuited for 2 h, after being discharged at 0.05 C until the battery terminal voltage reached the discharge voltage limit. Taking the average potential between the charge and discharge branch at C/20 and the normalized C/20 capacity, the voltage and its corresponding SOC can be regarded as OCV versus SOC curve [22].
The estimated and experimental SOC-OCV mapping for LMO, LNMCO, LNMCO and LMO, and LTO and LFP LIBs can eventually be illustrated in Figure 5a. Figure 5b shows the relative estimated and experimental error of each SOC-OCV mapping, which clearly indicates their close fitting except at both ends of the curve where there are a few points with larger errors. Other than those, the estimation errors have been kept within 0.5% for the LIBs except for the LFP battery when their SOCs are kept between 15% and 95%. The estimation errors are kept within 0.5% for the LFP battery when its SOC is kept between 15% and 90%. This is, in fact, the most widely used SOC region found in EVs. The larger errors at both ends of each SOC curve are thus not critical, but can still be explained from two aspects. The first is related to the model accuracy at both ends, where the more sensitive logarithmic and exponential functions are used. The second is related to polarization and Ohmic resistance, which are remarkably enlarged around 0% SOC and 100% SOC. The outcome is an enlarged random fluctuation of measured voltage, which can, no doubt, result in OCV measurement inaccuracy.
Different from other types of LIBs, the LFP LIB is attributed to the first-order phase transition mentioned in Section 2. Its freedom degree related to its terminal voltage is thus tiny, leading to very flat voltage plateaus in the middle SOC range. However, the change rate increases significantly at both ends of the SOC curve, which will then bring larger estimation errors to the LFP LIB than other types of LIBs when represented by the same proposed model. Despite that, the model errors are still well kept within 1% throughout the entire SOC range. The proposed generalized OCV model is thus accurate for representing different types of LIBs because of the presence of coefficients m and n. It is also more accurate than the model presented in [10] for the LNMCO battery. This can clearly be read from Figure 6, where the maximum estimation error for the LNMCO battery is noted to be below 0.5% when the proposed OCV model is used. The same battery will have an estimation error of 1% when the model in [10] is used. Precision enhancement is thus doubled with the proposed model, in addition to its flexible adaption to other types of LIBs.
Moreover, it should be highlighted that parameters used with the SOC-OCV model are closely correlated to the intrinsic characteristic features of the LIBs. For example, parameter a is noted to relate to the voltage plateau with its value becoming bigger as the plateau rises higher. This can noticeably be seen in Table 5 and Figure 5. Similarly, parameter c is noted to relate to the rate of increase of voltage in the linear function, included for demonstrating the phase transformation processes. Its value will rise as the voltage increases faster, which certainly matches well with analytical results presented in this subsection.
Two OCV models were selected in the literature, taking NCM and LFP battery, for example, which is compared to the proposed OCV model. All of the parameters in the two OCV models are refitted for the data illustrated in Figure 5 using the Matlab curve fitting toolbox (version, Manufacturer, City, US State abbrev. if applicable, Country), the results with their root mean square (RMS) and maximum errors are shown in Table 6. It can be seen that Model #1 has better accuracy for the LFP battery, while it is poor for the LNMCO battery. The fitting results of Model #2 are in contrast to Model #1. It should be noted that neither of them has good accuracy for both types of batteries. The proposed model has acceptable precisions for both NCM and LFP batteries, manifesting better adaptability compared to the other two models. It therefore can be regarded as a generalized model of commercial lithium-ion batteries.

3.2. Sensitivity Analysis of the Proposed Model

Case I Sensitivity towards temperature variation
The estimated and experimental results for the LNMCO battery at different temperatures are shown in Figure 7a–c. Their relative errors are shown in Figure 7d. Parameters of the model in Equation (1) used are shown in Table 7, where it has been noted that coefficients m and n have been kept constant regardless of temperature. Despite this, it can be seen from Figure 7 that the proposed OCV model fits the measured values well at 10 °C, 25 °C, and 45 °C, respectively. Their relative errors over a wide span of the SOC range are, in fact, always smaller than 0.5%. The proposed model is thus robust since its accuracy is not degraded by battery temperature variation. Moreover, coefficients m and n for the specific battery type have been fixed without affecting the model accuracy. Model updating has therefore been done by adjusting parameters a, b, c and d in Equation (1) only, which is dramatically simpler since they are simply proportional gains.
Case II Sensitivity to battery aging
Conventionally, the battery OCV will change as it ages even at the same SOC. This is caused by variation of battery thermodynamics, which was affected in experiments by cycling the charging and discharging processes for evaluating the proposed OCV model. The estimated and experimental results obtained for the LMO battery at different degradation states are shown from Figure 8a–d, while the model parameters used at different battery aging stages are listed in Table 8. Obviously, coefficients m and n have been kept unchanged after being first determined. Despite this, Figure 8 shows the estimated and experimental results matching well at various battery aging stages. Their relative error is, in fact, within 0.2%, except at a few individual SOC points where the relative error has been bigger at 0.5%. The proposed OCV model is thus robust against battery aging.
From Table 8, it can also be seen that the model parameters change monotonically as the battery degrades. Taking the linear function of Equation (1), for example, its parameters a and c (considering the negative sign of c) increase as the battery ages. These parameters can thus be employed for SOH estimation, but can be rather complex since the SOC-OCV model in Equation (1) manifests the comprehensive effects of three functions (logarithmic, linear and exponential). Estimation of battery degradation mechanism is hence rather complex with the origin of model parameter variations caused by electrochemical dynamics needing to be investigated first. This is, however, beyond the scope of the paper.

4. Application of SOC Estimation

An HIL simulation platform has been set up for validating the proposed generalized OCV model and its feasibility for SOC estimation. In relation to SOC estimation, a first-order equivalent circuit and the proposed OCV model have been used for simulating the battery dynamics. An estimation algorithm based on a proportional-integral (PI) observer has also been employed for determining the estimated SOC for comparison with the actual SOC measured from the tested battery group. Principle of the PI observer has been explained in [36], and will hence not be discussed with the HIL platform described below. It is noticeable that the parameter uncertainties of the equivalent circuit model have an impact on SOC estimation. The detailed theoretical and quantitative analysis can be found in another paper [37].

4.1. HIL Simulation Platform

The HIL simulation platform is shown in Figure 9, where the central processing system is a computer for controlling the hardware experiment, obtaining voltage/current data, and executing the real-time simulated model. Specific hardware used includes the current/voltage acquisition board and the CAN bus to TCP (Transmission Control Protocol) conversion card. Software includes the Matlab/Simulink model, and driver for the CAN-TCP data acquisition card. The CAN-TCP conversion module is for receiving the CAN bus data frame. The real-time data is used by the simulated model in the central processing system for estimating the battery SOC. The estimated SOC will then be compared with the true SOC measured by the Arbin Instruments BT2000. This instrument is inter-faced to the thermal chamber, where the tested battery is placed for verification purposes.

4.2. Accuracy Verification

Two LNMCO cells in series have been used for forming the battery group with a total nominal capacity of 28 Ah. SOCs of each cell in the group have also been estimated by the PI observer and the first-order circuit model, in which the proposed SOC-OCV model has been employed. From the cell SOCs, SOCs of the battery group can then be calculated by using the following formula [38]:
SOC B = Q r e m B Q max B × 100 % = min ( Q max [ 1 ] × SOC [ 1 ] , ... Q max [ n ] × SOC [ n ] ) min ( Q max [ 1 ] × SOC [ 1 ] , ... Q max [ n ] × SOC [ n ] ) + min ( Q max [ 1 ] × ( 1 SOC [ 1 ] ) , ... Q max [ n ] × ( 1 SOC [ n ] ) ) = Q max [ i ] × SOC [ i ] Q max [ i ] × SOC [ i ] + Q max [ j ] × ( 1 SOC [ j ] ) × 100 % ,
where Q max B means the maximum available capacity of the pack, and Q r e m B represents the residual capacity or maximum discharge capacity of the group. It should be noticeable that temperature will affect the SOC estimation, especially at low temperatures. The model parameters will vary with the battery temperature. Therefore, two typical temperatures at 5 °C and 25 °C have been tested with DST (dynamic stress test) profiles included for verifying SOC estimations. The model parameters have also been updated online to ensure estimation accuracy as temperature changes.
The estimated and true SOCs obtained from the HIL simulation platform at DST profiles are successively shown in Figure 10a–d, where the columbic counting results from the Arbin test instrument was regarded as the true SOC. Figure 10a–b show the estimated results at 5 °C, while Figure 10c,d show the estimated results at 25 °C. The estimated error is obviously large at the beginning because of overshooting of the PI observer, but will eventually converge to a very small value as time progresses. The estimated error is also noted to be large at partial SOC, where one possible reason is related to the assumption of resistance and capacitance of the first-order RC model being constant. Such an assumption has, no doubt, simplified calculation, but does not reflect the actual scenario, where resistance and capacitance of the RC model at partial SOC are considerably different from those at low and high SOCs. The other possible reason is related to inherent errors that may occur within the OCV model. These errors will, no doubt, affect estimation accuracy, but will usually not be as significant. Estimation error after the initial overshoot period of the battery group can thus be controlled within 3% in Figure 10 for both 5 °C and 25 °C. In other words, the proposed OCV model is suitable for SOC estimation with high precision and good adaptability demonstrated.

5. Conclusions

From analyzing electrochemical processes of common LIBs, the charge accumulation, primary phase transformation, and partial redox reaction and charge accumulation processes have been identified. To account for these three processes, a generalized OCV model with a logarithmic, a linear and an exponential function has been developed. The model includes six parameters, but with only four proportional parameters requiring real-time updating. The other two parameters, which contribute to its nonlinear characteristics, can be kept constant after first being determined for a particular type of LIB. Complexity is thus reduced, but without affecting precision since the estimation error can still be controlled within 0.5% for all common types of LIBs. Efficacy of the model for SOC estimation has also been proven through HIL simulation and experiments, with errors of smaller than 3% observed at different temperatures and stages of degradation. The proposed model is thus robust and accurate, while retaining simplicity for real-time implementation. Further extension of the model for SOH estimation is also possible but will only be more thoroughly investigated in the future.

Acknowledgments

The authors are grateful for financial support via the National Natural Science Foundation of China (Grant No. 51477009) and the Fundamental Research Funds for the Central Universities (Grant Number E16JB00060).

Author Contributions

In this paper, author contributions are as follows: Caiping Zhang, Jiuchun Jiang and Le Yi Wang conceived the main points of this paper. Linjing Zhang analyzed the electrochemical properties of OCV, Caiping Zhang and Sijia Liu designed and performed the experiments; Poh Chiang Loh contributed materials/analysis tools.

Conflicts of Interest

The authors declare no conflict of interest.

Abbreviations

The following abbreviations are used in this manuscript:
OCVOpen Circuit Voltage
SOCState of Charge
LIBLithium-Ion Battery
BMSBattery Management System
SOHState of Health
HILHardware in Loop
LFPLiFePO4
LMOLiMn2O4
LNMCOLiNi1/3Mn1/3Co1/3O2
LTOLi4Ti5O12

References

  1. Hu, X.; Li, S.; Peng, H. A comparative study of equivalent circuit models for Li-ion batteries. J. Power Sources 2012, 198, 359–367. [Google Scholar] [CrossRef]
  2. Xiong, R.; He, H.; Sun, F.; Liu, X.; Liu, Z. Model-based State of Charge and peak power capability joint estimation of Lithium-Ion battery in plug-in hybrid electric vehicles. J. Power Sources 2012, 229, 159–169. [Google Scholar] [CrossRef]
  3. Castano, S.; Gauchia, L.; Voncila, E.; Sanz, J. Dynamical modeling procedure of a Li-ion battery pack suitable for real-time applications. Energy Convers. Manag. 2015, 92, 396–405. [Google Scholar] [CrossRef]
  4. Samadania, E.; Farhadb, S.; Scottc, W.; Mastali, M.; Gimenez, L.E.; Fowler, M.; Fraser, R.A. Empirical modeling of lithium-ion batteries based on electrochemical impedance spectroscopy tests. J. Electrochim. Acta 2015, 160, 169–177. [Google Scholar] [CrossRef]
  5. Gagneur, L.; Driemeyer-Franco, A.L.; Forgez, C.; Friedrich, G. Modeling of the diffusion phenomenon in a lithium-ion cell using frequency or time domain identification. Microelectron. Reliab. 2013, 53, 784–796. [Google Scholar] [CrossRef]
  6. Xiong, R.; Sun, F.C.; Gong, X.Z.; He, H.W. Adaptive state of charge estimator for lithium-ion cells series battery pack in electric vehicles. J. Power Sources 2013, 242, 699–713. [Google Scholar] [CrossRef]
  7. Liu, L.Z.; Wang, L.Y.; Chen, Z.Q.; Wang, C.; Lin, F.; Wang, H. Integrated system identification and state-of-charge estimation of battery systems. IEEE Trans. Energy Convers. 2013, 28, 12–23. [Google Scholar] [CrossRef]
  8. Rahimi-Eichi, H.; Baronti, F.; Chow, M.Y. Online adaptive parameter identification and state-of-charge co-estimation for Lithium-Polymer battery cells. IEEE Trans. Ind. Electron. 2014, 61, 2053–2061. [Google Scholar] [CrossRef]
  9. Wang, W.G.; Chung, H.S.H.; Zhang, J. Near-Real-Time Parameter Estimation of an Electrical Battery Model with Multiple Time Constants and SOC-Dependent Capacitance. IEEE Trans. Power Electron. 2014, 29, 5905–5920. [Google Scholar] [CrossRef]
  10. Zhang, C.; Wang, L.Y.; Li, X.; Chen, W.; Yin, G.; Jiang, J. Robust and Adaptive Estimation of State of Charge for Lithium-Ion Batteries. IEEE Trans. Ind. Electron. 2015, 62, 4948–4957. [Google Scholar] [CrossRef]
  11. Sun, F.; Xiong, R.; He, H. A systematic state-of-charge estimation framework for multi-cell battery pack in electric vehicles using bias correction technique. Appl. Energy 2016, 162, 1399–1409. [Google Scholar] [CrossRef]
  12. Hoenig, S.; Singh, H.; Palanisamy, T.G. Method for Determining State of Charge of a Battery by Measuring Its Open Circuit Voltage. U.S. Patent 6,366,054 B1, 2 April 2002. [Google Scholar]
  13. Yang, Y.P.; Liu, J.J.; Tsai, C.H. Improved estimation of residual capacity of batteries for electric vehicles. J. Chin. Inst. Eng. 2008, 31, 313–322. [Google Scholar] [CrossRef]
  14. Pop, V.; Bergveld, H.J.; Danilov, D.; Regtien, P.P.L.; Notten, P.H.L. Battery Management Systems: Accurate State-of-Charge Indication for Battery-Powered Applications; Springer: London, UK, 2008. [Google Scholar]
  15. Waag, W.; Sauer, D.U. Adaptive estimation of the electromotive force of the lithium-ion battery after current interruption for an accurate state-of-charge and capacity determination. Appl. Energy 2013, 111, 416–427. [Google Scholar] [CrossRef]
  16. Barai, A.; Widanage, W.D.; Marco, J.; McGordon, A.; Jennings, P. A study of the open circuit voltage characterization technique and hysteresis assessment of lithium-ion cells. J. Power Sources 2015, 295, 99–107. [Google Scholar] [CrossRef]
  17. Weng, C.; Sun, J.; Peng, H. A unified open-circuit-voltage model of lithium-ion batteries for state-of-charge estimation and state-of-health monitoring. J. Power Sources 2014, 258, 228–237. [Google Scholar] [CrossRef]
  18. Hu, X.; Li, S.; Peng, H.; Sun, F. Robustness analysis of State-of-Charge estimation methods for two types of Li-ion batteries. J. Power Sources 2012, 217, 209–219. [Google Scholar] [CrossRef]
  19. Dubarry, M.; Truchot, C.; Liaw, B.Y. Synthesize battery degradation modes via a diagnostic and prognostic model. J. Power Sources 2012, 219, 204–216. [Google Scholar] [CrossRef]
  20. Plett, G.L. Extended Kalman filtering for battery management systems of LiPB-based HEV battery packs: Part 2. Modeling and identification. J. Power Sources 2004, 134, 262–276. [Google Scholar] [CrossRef]
  21. Neumann, D.E.; Lichte, S. A multi-dimensional battery discharge model with thermal feedback applied to a lithium-ion battery pack. In Proceedings of the NDIA Ground Vehicle Systems Engineering and Technology Symposium-Modelling & Simulation, Testing and Validation (MSTV) Mini-Symposium, Dearborn, MI, USA, 9–11 August 2011.
  22. Dubarry, M.; Svoboda, V.; Hwu, R.; Liaw, B.Y. Capacity loss in rechargeable lithium cells during cycle life testing: The importance of determination state-of-charge. J. Power Sources 2007, 174, 1121–1125. [Google Scholar] [CrossRef]
  23. Dubarry, M.; Truchot, C.; Cugnet, M.; Liaw, B.Y.; Gering, K.; Sazhin, S.; Jamison, D.; Michelbacher, C. Evaluation of commercial lithium-ion cells based on composite positive electrode for plug-in hybrid electrical vehicle applications. Part I: Initial characterizations. J. Power Sources 2011, 196, 10328–10335. [Google Scholar] [CrossRef]
  24. Shin, Y.J.; Choi, W.J.; Hong, Y.S.; Yoon, S.; Ryu, K.S.; Chang, S.H. Investigation on the microscopic features of layered oxide Li[Ni1/3Co1/3Mn1/3]O2 and their influences on the cathode properties. Solid State Ion. 2006, 177, 515–521. [Google Scholar] [CrossRef]
  25. Myung, S.T.; Ogata, A.; Lee, K.S.; Komaba, S.; Sun, Y.K.; Yashiro, H. Structural, electrochemical, and thermal aspects of Li[(Ni0.5Mn0.5)1-xCox]O2 (0 ≤ x ≤ 0.2) for high-voltage application of lithium-ion secondary batteries. J. Electrochem. Soc. 2008, 155, A374–A383. [Google Scholar] [CrossRef]
  26. Yabuuchi, N.; Makimura, Y.; Ohzuku, T. Solid-state chemistry and electrochemistry of LiCo1/3Ni1/3Mn1/3O2 for advanced lithium-ion batteries. J. Electrochem. Soc. 2007, 154, A314–A321. [Google Scholar] [CrossRef]
  27. Kim, S.K.; Jeong, W.T.; Lee, H.K.; Shim, J. Characteristics of LiNi1/3Co1/3Mn1/3O2 Cathode Powder. Int. J. Electrocehm. Sci. 2008, 3, 1504–1511. [Google Scholar]
  28. Ohzuku, T.; Lwakoshi, Y.; Sawai, K. Formation of Lithium-Graphite Intercalation Compounds in Nonaqueous Electrolytes and Their Application as a Negative Electrode for a Lithium Ion (Shuttlecock) Cell. J. Electrochem. Soc. 1993, 140, 2490–2498. [Google Scholar] [CrossRef]
  29. Dubarry, M.; Liaw, B.Y. Identify capacity fading mechanism in a commercial LiFePO4 cell. J. Power Sources 2009, 194, 541–549. [Google Scholar] [CrossRef]
  30. Moorhead-Rosenberg, Z.; Allcorn, E.; Manthiram, A. In Situ Mitigation of First-Cycle Anode Irreversibility in a New Spinel/FeSb Lithium-Ion Cell Enabled via a Microwave-Assisted Chemical Lithiation Process. Chem. Mater. 2014, 26, 5905–5913. [Google Scholar] [CrossRef]
  31. Goodenough, J.B.; Kim, Y. Challenges for Rechargeable Li Batteries. Chem. Mater. 2010, 22, 587–603. [Google Scholar] [CrossRef]
  32. Padhi, A.K.; Nanjundaswamy, K.S.; Goodenough, J.B. Phospho-olivines as Positive-Electrode Materials for Rechargeable Lithium Batteries. J. Electrochem. Soc. 1997, 144, 1188–1194. [Google Scholar] [CrossRef]
  33. Devie, A.; Dubarry, M.; Liaw, B.Y. Overcharge study in Li4Ti5O12 based lithium-ion pouch cell, I. Quantitative diagnosis of degradation modes. J. Electrochem. Soc. 2015, 162, A1033–A1040. [Google Scholar] [CrossRef]
  34. Wang, Y.; Liu, H.; Wang, K.; Eiji, H.; Wang, Y.; Zhou, H. Synthesis and electrochemical performance of nano-sized Li4Ti5O12 with double surface modification of Ti(III) and carbon. J. Mater. Chem. 2009, 19, 6789–6795. [Google Scholar] [CrossRef]
  35. Pentyala, N.; Guduru, R.K.; Mohanty, P.S. Binder free porous ultrafine/nano structured LiCoO2 cathode from plasma deposited cobalt. Electrochim. Acta 2011, 56, 9851–9859. [Google Scholar] [CrossRef]
  36. Xu, J.; Mi, C.C.; Cao, B.G.; Deng, J.; Chen, Z.; Li, S. The state of charge estimation of lithium-ion batteries based on a proportional-integral observer. IEEE Trans. Veh. Technol. 2014, 63, 1614–1621. [Google Scholar]
  37. Zhao, T.; Jiang, J.C.; Zhang, C.P.; Bai, K.; Li, N. Robustness online state of charge estimation of lithium-ion battery pack based on error sensitivity analysis. Math. Probl. Eng. 2015, 2015, 573184. [Google Scholar]
  38. Wen, F. Study on Basic Issues of the Li-Ion Battery Pack Management Technology for Pure Electric Vehicles. Ph.D. Thesis, Beijing Jiaotong University, Beijing, China, 2009. [Google Scholar]
Figure 1. SOC-OCV curve (red line) and dQ/dV profile as a function of OCV (blue line) for the LNMCO/graphite lithium-ion battery.
Energies 09 00900 g001
Figure 2. SOC-OCV curve and dQ/dV profile of the LMO/graphite lithium-ion battery.
Energies 09 00900 g002
Figure 3. SOC-OCV curve and dQ/dV profile of the LFP/graphite lithium-ion battery.
Energies 09 00900 g003
Figure 4. SOC-OCV curve and dQ/dV profile of the NMC+LCO/LTO lithium-ion battery.
Energies 09 00900 g004
Figure 5. (a) the estimated and experimental SOC-OCV mapping for various LIBs; and (b) relative error of the OCV estimation.
Energies 09 00900 g005
Figure 6. Comparison results of the old model and improved model for the LNMCO battery.
Energies 09 00900 g006
Figure 7. The estimated and experimental results for the LNMCO battery at different temperatures: (a) 10 °C; (b) 25 °C; (c) 45 °C; and (d) relative errors.
Energies 09 00900 g007
Figure 8. Estimated and experimental results for the LMO battery at different aging states: (a) 92 Ah; (b) 82 Ah; (c) 69 Ah; and (d) relative errors.
Energies 09 00900 g008
Figure 9. Hardware-in-loop simulation platform.
Energies 09 00900 g009
Figure 10. Estimation and true values of SOC at DST profilesat different temperatures, (a) SOC estimation at 5 °C; (b) estimation error at 5 °C; (c) SOC estimation at 25 °C; (d) estimation error at 25 °C
Energies 09 00900 g010
Table 1. Schematic presentation of the electrochemical redox reactions of the LNMCO/Graphite lithium-ion battery.
ElectrodeC①-A①C①-A②C②-A②C②-A③C②-A④
CathodeC①C②
Ni4+↔Ni3+Ni3+↔Ni2+
AnodeA①A②A③A④
LiC6↔LiC12LiC12↔LiC18↔LiC36LiC36↔LiC72LiC72↔C6
Table 2. Schematic presentation of the electrochemical redox reactions of the LMO/Graphite lithium battery.
ElectrodeC′①-A①C′①-A②C′②-A②C′②-A③
CathodeC′①C′②
Mn2O4↔Li0.5Mn2O4Li0.5Mn2O4↔LiMn2O4
AnodeA①A②A③
LiC6↔LiC12LiC12↔LiC18↔LiC36LiC36↔LiC72
Table 3. Schematic presentation of the electrochemical redox reactions of the LFP/Graphite lithium-ion battery.
Electrodea″ C″①-A①b″ C″①-A②c″ C″①-A③d″ C″①-A④
CathodeC″①
FePO4↔LiFePO4
AnodeA①A②A③A④
LiC6↔LiC12LiC12↔LiC18↔LiC36LiC36↔LiC72LiC72↔C6
Table 4. Schematic presentation of the electrochemical redox reactions of the NMC+LCO/Graphite lithium-ion battery.
Electrodea′′′ C′′′①-A′①/C′′′②-A′①/C①-A′①b′′′ C′′′③-A′①/C②-A′①
LCO + NMC cathodeC′′′①C′′′②C①C′′′③C②
Co3+↔Co4+Co3+↔Co4+Ni2+↔Ni3+Co3+↔Co4+Ni3+↔Ni4+
LTO anodeA′①
Li7Ti5O12↔Li4Ti5O12
Table 5. Model parameters for various LIBs.
Battery Type *Parameters
abcdmn
LMO3.875−0.335−0.53320.83150.6530.6
LNMCO3.5−0.0334−0.1060.73991.4032
LNMCO&LMO3.6−0.111−0.51.1131.0931.9
LFP3.135−0.685−1.3421.7340.4780.4
LTO2.235−0.00132−0.35030.68512.9641.6
* LMO: G//LMO battery; LNMCO: G//LNMCO battery; LNMCO&LMO: G//LNMCO+LMO battery; LFP: G//LFP battery; LTO: LTO// LNMCO+LMO battery.
Table 6. Compared fitting results of OCV models.
#OCV ModelReferenceRMS Error for LNMCO Battery (mV)Max Error for LNMCO Battery (mV)RMS Error for LFP Battery (mV)Max Error LFP Battery (mV)
1 V O C ( s ) = K 0 K 1 / s K 2 s + K 3 ln ( s ) + K 4 ln ( 1 s ) [20]16.636.56.214.8
2 V O C ( s ) = K 0 + K 1 e α ( 1 s ) K 2 / s [21]9.721.834.9141
3 V O C = a + b ( ln s ) m + c s + d e n ( s 1 ) Proposed13.020.615.327.3
Table 7. Model parameters of the LNMCO Battery at different temperatures.
Temperature (°C)Parameters
abcdmn
103.517−0.0439−0.24930.91341.42
253.5−0.0334−0.1060.73991.42
453.535−0.0571−0.28470.94751.42
Table 8. Model parameters of the LMO battery at different aging states.
Capacity (Ah)Parameters
abcdmn
923.875−0.3351−0.53320.83150.65370.6
824.061−0.3683−0.49460.59330.65370.6
694.132−0.3838−0.49120.50160.65370.6

