Article

American’s Energy Future: An Analysis of the Proposed Energy Policy Plans in Presidential Election

1
Department of Agricultural and Biosystems Engineering, Iowa State University, Ames, IA 50010, USA
2
Department of Political Science, Iowa State University, Ames, IA 50010, USA
*
Author to whom correspondence should be addressed.
Energies 2016, 9(12), 1000; https://doi.org/10.3390/en9121000
Submission received: 26 August 2016 / Revised: 22 November 2016 / Accepted: 23 November 2016 / Published: 30 November 2016
(This article belongs to the Special Issue Energy Policy and Climate Change 2016)

Abstract

:
As the leader of the largest economy, President of the United States has substantive influence on addressing climate change problems. However, a presidential election is often dominated by issues other than energy problems. This paper focuses on the 2016 presidential election, and examines the energy plans proposed by the leading Democrat and Republican candidates. Our data from the Iowa caucus survey in January 2016 suggests that voters were more concerned about terrorism and economic issues than environmental issues. We then compare the Democratic and Republican candidate’s view of America’s energy future, and evaluate their proposed renewable energy targets. We find that the view on renewable energy is polarized between Democratic and Republican candidates, while candidates from both parties agree on the need for energy efficiency. Results from our ordinal least squares regression models suggests that Democratic candidates have moderate to ambitious goals for developing solar and other renewables. The Republican candidates favor fossil fuels and they choose not to provide any specific target for developing renewable energy. In addition, this trend of party polarization has grown more significant when compared with the past three presidential elections. Our observation suggests that energy policies need to be discussed more often regarding the diversification and decarbonization of the nation’s energy system.

1. Introduction

Global atmospheric temperature has increased by 1 F since industrialization, as reported by the Intergovernmental Panel on Climate Change (IPCC). Temperature increase is higher in sensitive polar regions [1]. In the meantime, emissions of greenhouse gases (GHG)—the main anthropogenic factor causing climate change—have reached the highest level in history. The increasing GHG emissions have caused worldwide discussions. According to the information provided by the U.S. Environmental Protection Agency (U.S. EPA, Washington, DC, USA), fossil fuel consumption is responsible for 79% of the greenhouse gas emissions in the US [2]. Scientists and concerned individuals appeal that decreasing the dependency on fossil fuel is a central step to mitigate climate change.
As a promising substitute of petroleum-based transport fuel, biofuel has been studied thoroughly, and various technological pathways have been developed to convert biomass to biofuels. By all means, our leaders should guide our society to ease this transition by providing visions and plans to address the socioeconomic and environmental challenges of developing renewable energy. President of the U.S. plays an important role because the nation is the largest economy and top energy producer and consumer on earth. The process out of which the next president is chosen is a critical step in educating the public and signaling the need for low-carbon renewable fuels. In previous presidential elections, the environmental impacts of energy consumption have been questioned and discussed extensively [3]. However, scholars noted the absence of voting for strong environmental policies at the ballot box, while public opinion shows strong support for them [4]. In fact, this phenomenon has been observed for a long time since the 1980s. Scholars and political analysts called it a paper tiger, which means it is long on talk, but short on action [5]. Mixed evidence is found regarding the impact of environmental issues on voters’ behavior in presidential elections. There is no clear voting pattern and multiple factors can influence the results of environmental regulations. This may relate to the fact that citizens are less concerned about environmental issues. Rather, economics and other issues are considered to be more important to the public.
At the 2015 United Nations Climate Change Conference (COP21) in Paris, a global agreement on climate change mitigation—the Paris Agreement—was negotiated by more than 170 countries. The Paris climate deal has ended the differentiation of the prior efforts in reducing GHG emissions between developed countries and developing countries. Instead, all participating countries have promised to commit the best efforts and strengths for taking carbon stock and reporting to each other every five years. The long-term goal of the agreement was to keep average warming below 2 °C, while urging the parties to limit the increase to 1.5 °C, especially for developing countries [6].
President Barack Obama of the United States claims that the U.S. played a vital role in solving the global problem of climate change. Given the fact that the recent economic growth in the U.S. occurred without significant growth in carbon emissions, he claims that lowering GHG emissions will not hurt the economy [7]. Although the Paris agreement is not binding and it requires the U.S. to do nothing beyond what is already committed to, President Obama still considers it to be a landmark of global climate governance and could be a turning point for the world [8].
Under the leadership of the current President, the United States has demonstrated its intent toward decarbonization by agreeing on the Paris pack at the end of 2015. In the presidential election of 2016 so far, however, candidates have not demonstrated the same enthusiasm for energy issues as for other public affairs. Only a few candidates expressed their concerns over low-carbon energy and released their energy and environmental plan. Nevertheless, the public has not shown any tendency to vote with regard to their environmental and energy plans.
The objectives of this study are to investigate the 2016 presidential candidates’ vision of American’s energy future to explore how their views are polarized. Current energy models, such as the National Energy Modeling System (NEMS) used by the US Energy Information Administration, are very complex in predicting future energy demand and, thus, not suitable in analyzing the energy policy proposal in the ever-changing presidential election. The purpose of this study is not to provide a novel model for energy demand prediction. Rather, we try to use ordinal least squares (OLS) model to largely simplify energy prediction and policy analysis, while providing reasonable projections about renewable energy growth that are close to the EIA’s projection based on the complex computational general equilibrium model, NEMS. We predict the future development of renewable energy by building an OLS regression model to predict the nation’s energy consumption in the next few years. We use the model as the baseline to compare the energy plans proposed by the leading Democratic and Republican candidates. We evaluate the proposed energy plans with regards to future renewable energy production and electricity used in residential buildings, and assess the degree of party polarization on renewable energy. We support the OLS quantification of party polarization on renewable energy using information from the 2016 Iowa caucus survey and the League of Conservative Voting (LCV) score for Senate and House members’ pro-environment voting.

2. Literature Review

The U.S. has a stable political system where two parties—the Democrats and Republicans—dominate political events. As always, the two parties have very different views and policies in addressing energy and environmental issues.
The core belief of the Republican Party roots from the ideology that individuals are responsible for their own good within society. Also, they believe that the government’s role is to make sure that people are able to secure the benefits of society for themselves, their families, and for those who are unable to do so for themselves. As for energy issues, Republicans believe in pursuing American gas and oil resources, both on- and off-shore. Republicans support developing alternative energy sources from the perspective of having secure and reliable domestic energy supply, as per the policy rationale for former President G.W. Bush to promote biofuel. Republicans oppose mandatory carbon emissions controls because of the concerns of hindering economic growth and destroying jobs.
On the other hand, the Democratic Party is determined to renew America’s most basic bargain: equal opportunities to every American, and responsibility from every American. In general, Democrats value the clean environment very much and they believe that environment must be protected from over-exploitation and the destruction is our destruction. Democrats also value energy independence. They believe that using green energy sources will further the country’s chances of standing energy independence and further save consumers money on energy bills. The Democratic Party is prone to develop clean energy as they favor policy supports, including tax credits for private investment, and funding for research on alternative fuel and clean energy technologies.
As early as the 1980s, the Council on Environmental Quality released a survey before the presidential election, claiming “the United States is a nation willing to pay the price for environmental quality”. However, the public did not put priorities on environmental regulations, as Republicans who supported more fossil fuel production and less environmental regulation controlled the House. Even though reducing air and water pollution were the sixth most important national concerns in 1980s, the requirement for secure energy supplies outweighs concern for the environment [9].
In the 1988 presidential election, environmental issues were not a decisive factor for voter decisions, although environmental spending was the primary interest [10]. The investigation found that voters put priority on the candidates’ preferences on environmental protection, but the final votes did not go to the candidates who favored higher spending on the environment. Even though the two nominated candidates claimed to be environmentalists and pledged to take affirmative procedures, environment protection has never topped the election policy lists. However, environmental problems emerged, playing a key role in the election in 1996. Prior to the election, Bill Clinton highlighted the differences in environmental policies between his and the other candidates’. In particular, he pointed out that the Republicans were trying to add legislative policies to limit EPA’s authority and cut its budget [11]. Based on the poll, Baker [12] found that environmental records have an impact on the votes as well as their willingness to go to the polls for more than half of the so-called Generation X-ers. In the 2004 election, G.W. Bush tried to convince the public about how serious the Republicans care about clean water and climate change problem. However, the analysts said that “the environment is probably the single issue on which Republicans in general—and President Bush in particular—are most vulnerable” [13]. During the presidential campaign, Democratic candidates spent more time discussing environmental issues in order to win the support of the swing voters.
In the midterm election of 2006, Democrats were in control and the environmental legislation regained attention [14]. Campaign activities prioritized energy-related issues including energy dependence on foreign oil, vehicle fuel efficiency, and alternative fuels. However, analysts have been questioning the relationship between environmental issues and the vote in the presidential election for a long time. Observations of elections suggest that, people may not choose the candidate based on their environmental and energy policies, although the public supports clean energy and environmental protection. In many cases, economic, national defense, immigration, and other issues dominate the discussion during political campaigns, while less attention has been paid on environmental and energy issues.
Despite the long-term peripheral relevance of energy issues in elections, the increasing polarization trend of the two parties affects political elections in a more prominent way. Particularly in recent years, the contemporary parties have become more programmatic, cohesive, and increasingly “polarized”. It was observed as a political theme that the Republican Party showing a conservative attitude on nearly all major issues, while the Democratic Party acts more aggressively [15]. A growing number of empirical studies have been conducted on partisan polarization issues. Even though the political position within the parties has become more consistent, the differences between the parties are expanding, especially in Congress. According to Fiorina [16] and Abrams and Pop [17] the differences between Democratic and Republican parties have become greater than in the past. However, research conducted by Sundquist [18] and Carmines and Stimson [19] indicates that party polarization has existed for quite a long time with significant observations of social issues: slavery problem in the 1850s, agrarian and currency issues in the 1890s, the social welfare issues in the 1930s, and civil rights in the 1960s.
Indicators to measure political polarization are avaialble, such as the DW-Nominate scores [20]. Specifically for environmental issue, an overview of poltical polarization on government support of environmental protection is provided by McCright, Xiao, and Dunlap [21]. According this analysis of LCV scores for Congressmen from 1974–2012, party differences in pro-environment voting was relatively small from the 1970s to the early 1990s. The party differences in support of pro-evironment bills started to get larger since the late 1990s, and this trend is primarily driven by the low support of Republicans.
The within-party variation tends to be minor for two senators from the same state and party. However, in the case of two senators from the same state but different parties, their difference is large. In other words, the two senators are highly dissimilar [22]. As Poole and Rosenthal suggested, it has been observed that there are polarization in American politics in ways that do not well represent the interests of middle -class voters at every level of the political system. An analysis of a multiple-year public opinion survey by Gallup Survey [23] suggests that concerns for global warming has declined along with concerns of other environmental issues, while partisanship has “moved front and center” in the climate change debate. The research also supports the trend of elite disagreement along partisan lines, and that the disagreements “extend beyond policy preferences into virtually every aspect of environmental thoughts” [24]. Evidence suggests that the increasing cleavage of ideologies is affecting public policy discussion over climate change issues, and the recent Tea Party movement may contribute to the cleavage [17].
In the election of 2016 also paid attention on environmental, energy, and climate change issues, and a few candidates from the two parties released their environmental and energy plan. Democrat candidates had articulated their visions toward clean energy and environment-related issues. Hillary Clinton targeted to install solar capacity to 140 gigawatts by the end of 2020, and to “generate enough renewable energy to power every home in the U.S.” [25]. Idealist Bernie Sanders claimed in his campaign to achieve 100% clean energy system in the future [26]. Before suspending his campaign, Martin O’Malley also proposed a national, cross-sector renewable electricity standard, which sets a renewable energy target of 100% by 2050 [27]. These plans look ambitious, and feasibility had guaranteed a lot of discussion. The candidates had yet to provide much detail of their environmental and energy plans besides the targets. On the other hand, Republican candidates had paid much less attention to renewable energy than Democrats. The leading Republican candidates supported fossil fuel production, while conveying doubts and concerns about renewable energy.
For presidential candidates from the two parties, evidence from previous elections suggest relatively consistent views on environment and pollution issues, in comparison with their polarized opinions on other subjects such as economic issues and health care. However, Republican and Democratic candidates have shown disagreements about the future trajectory of the nation’s energy market. Assuming that the proposed energy plans root from the candidates’ partisanship and ideology, we conduct an analysis of the disagreements to provide evidence of elite polarization in U.S. politics.

3. Empirical Methodology and Data Collection

Renewable energy plays a critical role in the pursuit of energy security, sustainable development, and climate change mitigation. In 2016 presidential election campaigns, candidates put emphasis on the benefits of using renewable energy to lower environmental impacts and reduce fossil fuel consumption. The proposed targets for renewable energy represent presidential candidates’ vision of America’s energy future, although the targets can be vague and even conflicted sometimes. To evaluate their plans, we put the proposed targets in the context of future energy demand growth by building an econometric model to predict renewable electricity consumption up to 2030. The candidates’ energy views are tested against our projection of renewable energy growth, and the projection by the U.S. Energy Information Administration (EIA) is used as the benchmark.

3.1. OLS Regression Model

An econometric model using multivariate linear regression is commonly used method for studying correlations and projecting future trends for energy consumption, generation, markets, and even political and policy impacts [28]. Equation (1) shows the Bentzen and Engsted model [29] for projecting energy consumption. The price of energy (P), personal disposable income (PI), and heating degree days (HDD) are the factors driving energy consumption of year t, as well as the consumption level of the previous year (t − 1):
ln E t = α + β 1 ln P t + β 2 ln P I t + β 3 ln H D D t + β 4 ln P t 1
Following this rationale, we built three models to predict solar PV installation, renewable energy, and total primary energy used for electricity generation, respectively. The variables we examined include economic factors, such as personal GDP (pGDP) ($/person), disposable personal income (In) ($/person), electricity retail price (EP) (cent/kwh), solar PV cost (PC) ($/kwh), and gasoline retail price (GP) ($/gallon); the climate and society factors include heating degree days (HDD) (days/year), cooling degree days (CDD) (days/year), and population (Pop) (thousand people); the solar PV (PV), total energy production (E) for electricity generation, and renewable electricity generation (R) are included in the energy generation factor, which is represented as million kWh.
We start with generic full models for solar PV (Equation (2)), renewable energy (Equation (3)), and total primary energy (Equation (4)), where the subscript t indicates the data of the predicting year, and the data sources are listed as the notes of the equation. R studio (Boston, MA, USA) is used for multivariate linear regression, with which stepwise variable selection method is employed by choosing the variables with the lowest AIC scores. Then, three restricted model are developed using variables with the lowest AICs to predict electricity generation from distributed solar photovoltaic panels, renewable energy, and from total primary energy, respectively.
ln P V t = α + β 1 ln ( p G D P t ) + β 2 ln ( P o p t ) + β 3 ln ( I n t ) + β 4 ln ( H D D t ) + β 5 ln ( C D D t ) + β 6 ln ( E P t ) + β 7 ln ( G P t ) +   β 8 ln ( E P t 1 ) + β 9 ln ( G P t 1 ) + β 10 ln ( P C t )  
ln R t = α + β 1 ln ( p G D P t ) + β 2 ln ( P o p t ) + β 3 ln ( I n t ) + β 4 ln ( H D D t ) + β 5 ln ( C D D t ) + β 6 ln ( E P t ) + β 7 ln ( G P t ) +   β 8 ln ( E P t 1 ) + β 9 ln ( G P t 1 )
ln E t = α + β 1 ln ( p G D P t ) + β 2 ln ( P o p t ) + β 3 ln ( I n t ) + β 4 ln ( H D D t ) + β 5 ln ( C D D t ) + β 6 ln ( E P t ) + β 7 ln ( G P t ) + β 8 ln ( E P t 1 ) + β 9 ln ( G P t 1 )

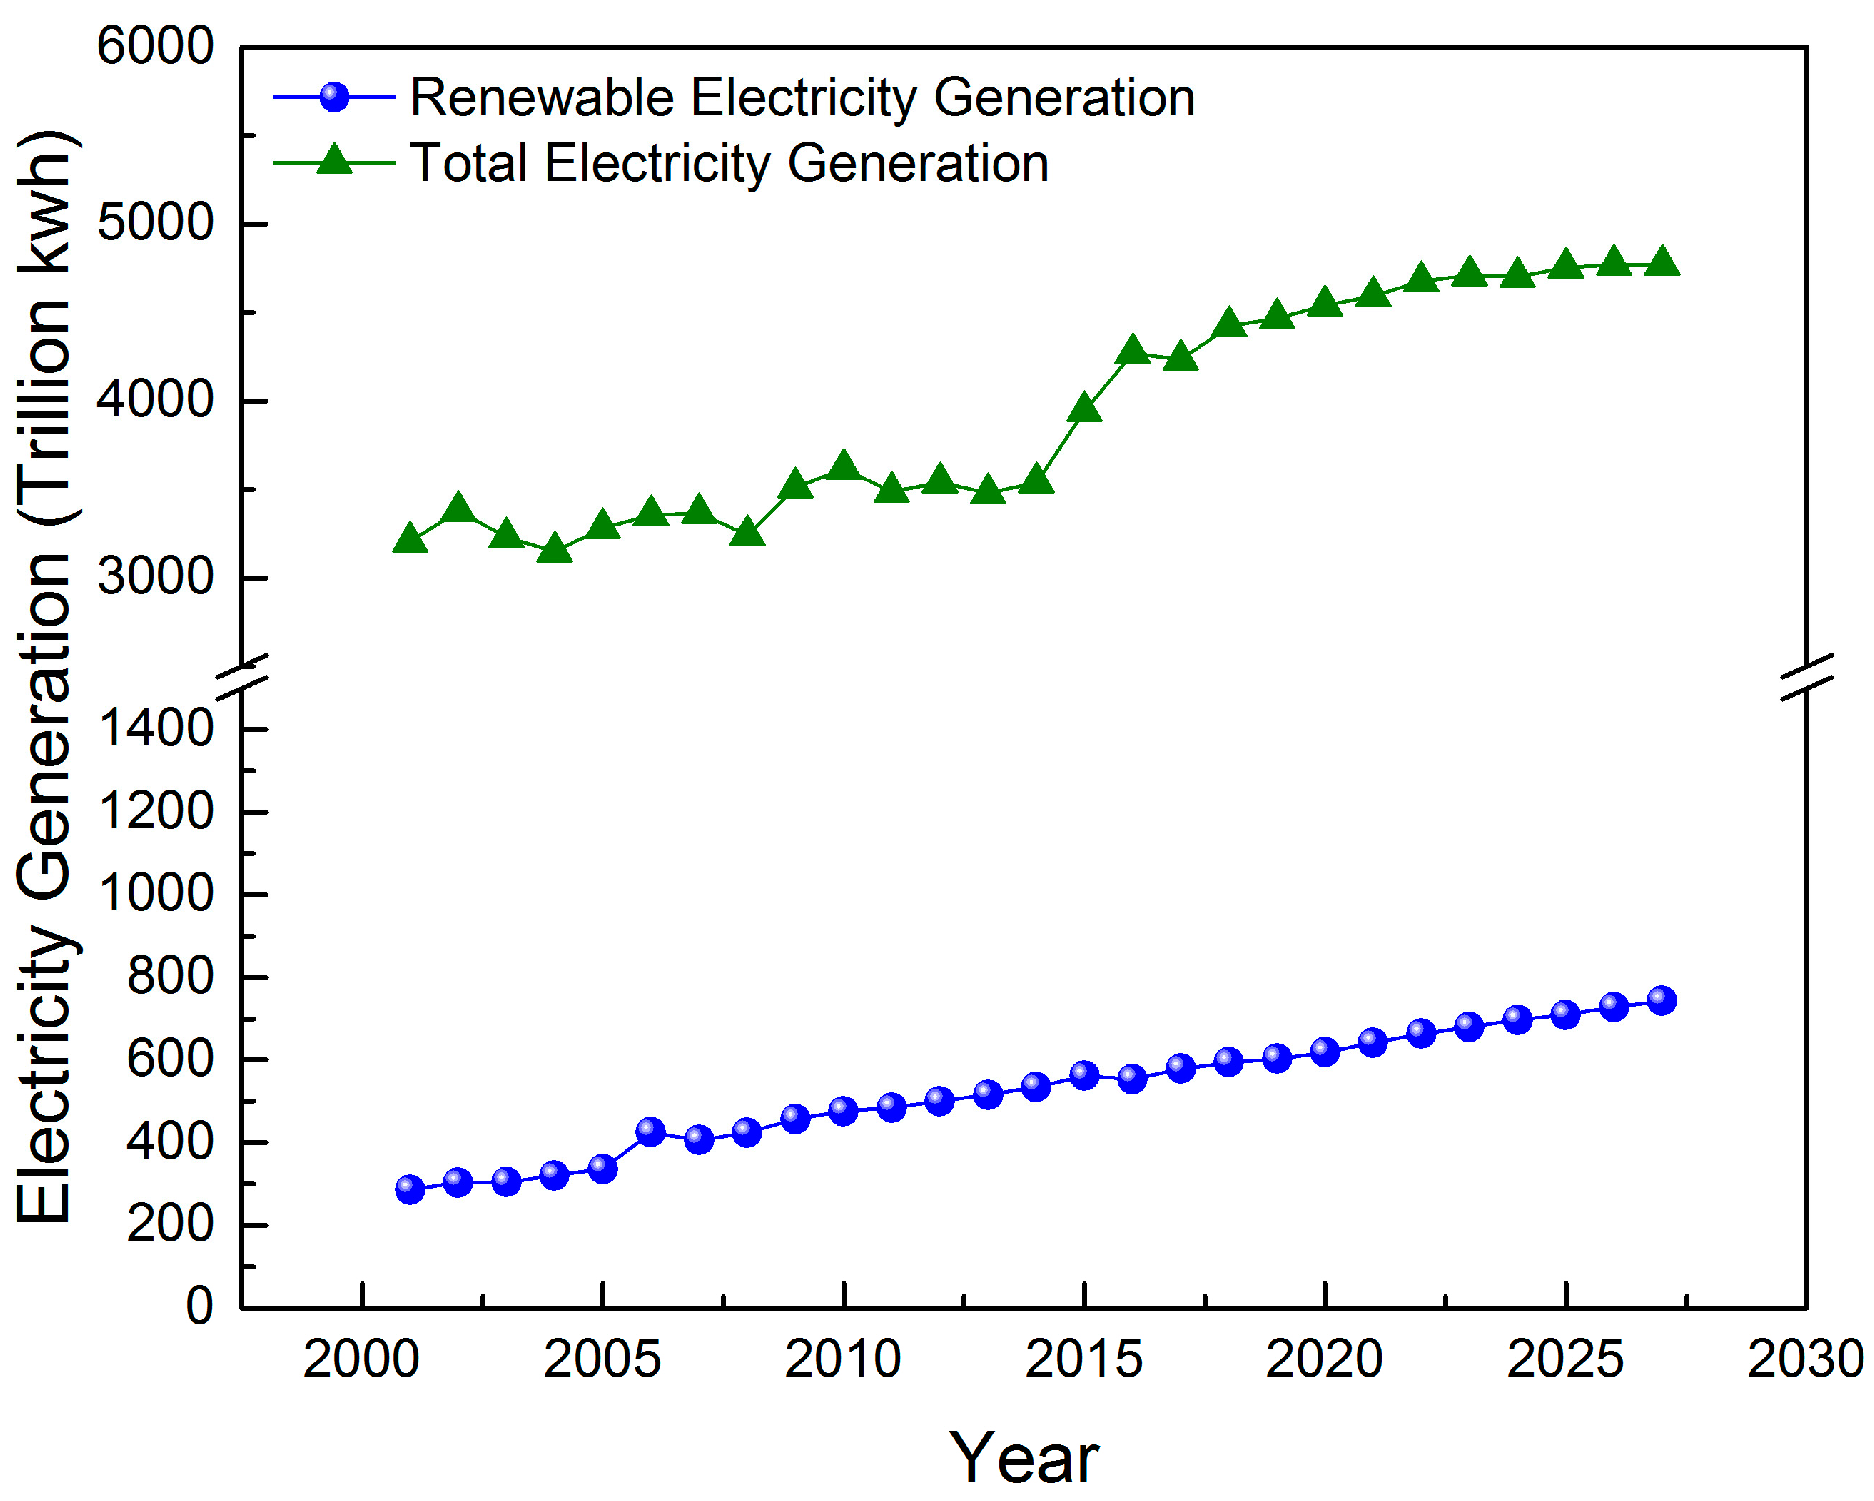
3.2. Data Collection

Data used in the econometrics models includes two components: historical data from 2000–2014, and projection data from 2015–2030. The historical and projected data on population, personal disposable income, and GDP is from the U.S. census bureau [30], bureau of labor statistics [31], and the statistics portal [32], individually. The historical and projected data on solar PV, fossil fuel, renewable energy used for electricity generation, retailed price of gasoline and electricity, CDD, and HDD are taken from the Annual Energy Outlook 2015 [33].

3.3. Iowa Caucus Survey

The 2015–2016 Iowa State University/WHO-TV Caucus Poll was conducted by the ISU Center for Survey Statistics and Methodology. A sample of 12,000 registered voters was selected from the State of Iowa voter registration list using a stratified systematic design referencing five variables (registered party, age, gender, congressional district, and primary election attendance since 2006). This included 5000 Democrats, 5000 Republicans, and 2000 No Party (Independents). Those with no available telephone number were removed from the sample. The first-wave survey was conducted by telephone in November 2015; the second-wave survey was completed in January 2016 based on responses from 722 respondents who also responded to the poll in November. Results are adjusted based on the distribution of registered voters in the Iowa Secretary of State’s voter registration file based on gender, age group, and congressional district within each party. The margin of error for the entire sample is plus or minus about 3.5 percentage points.

4. Survey Results and Candidates’ Energy Visions
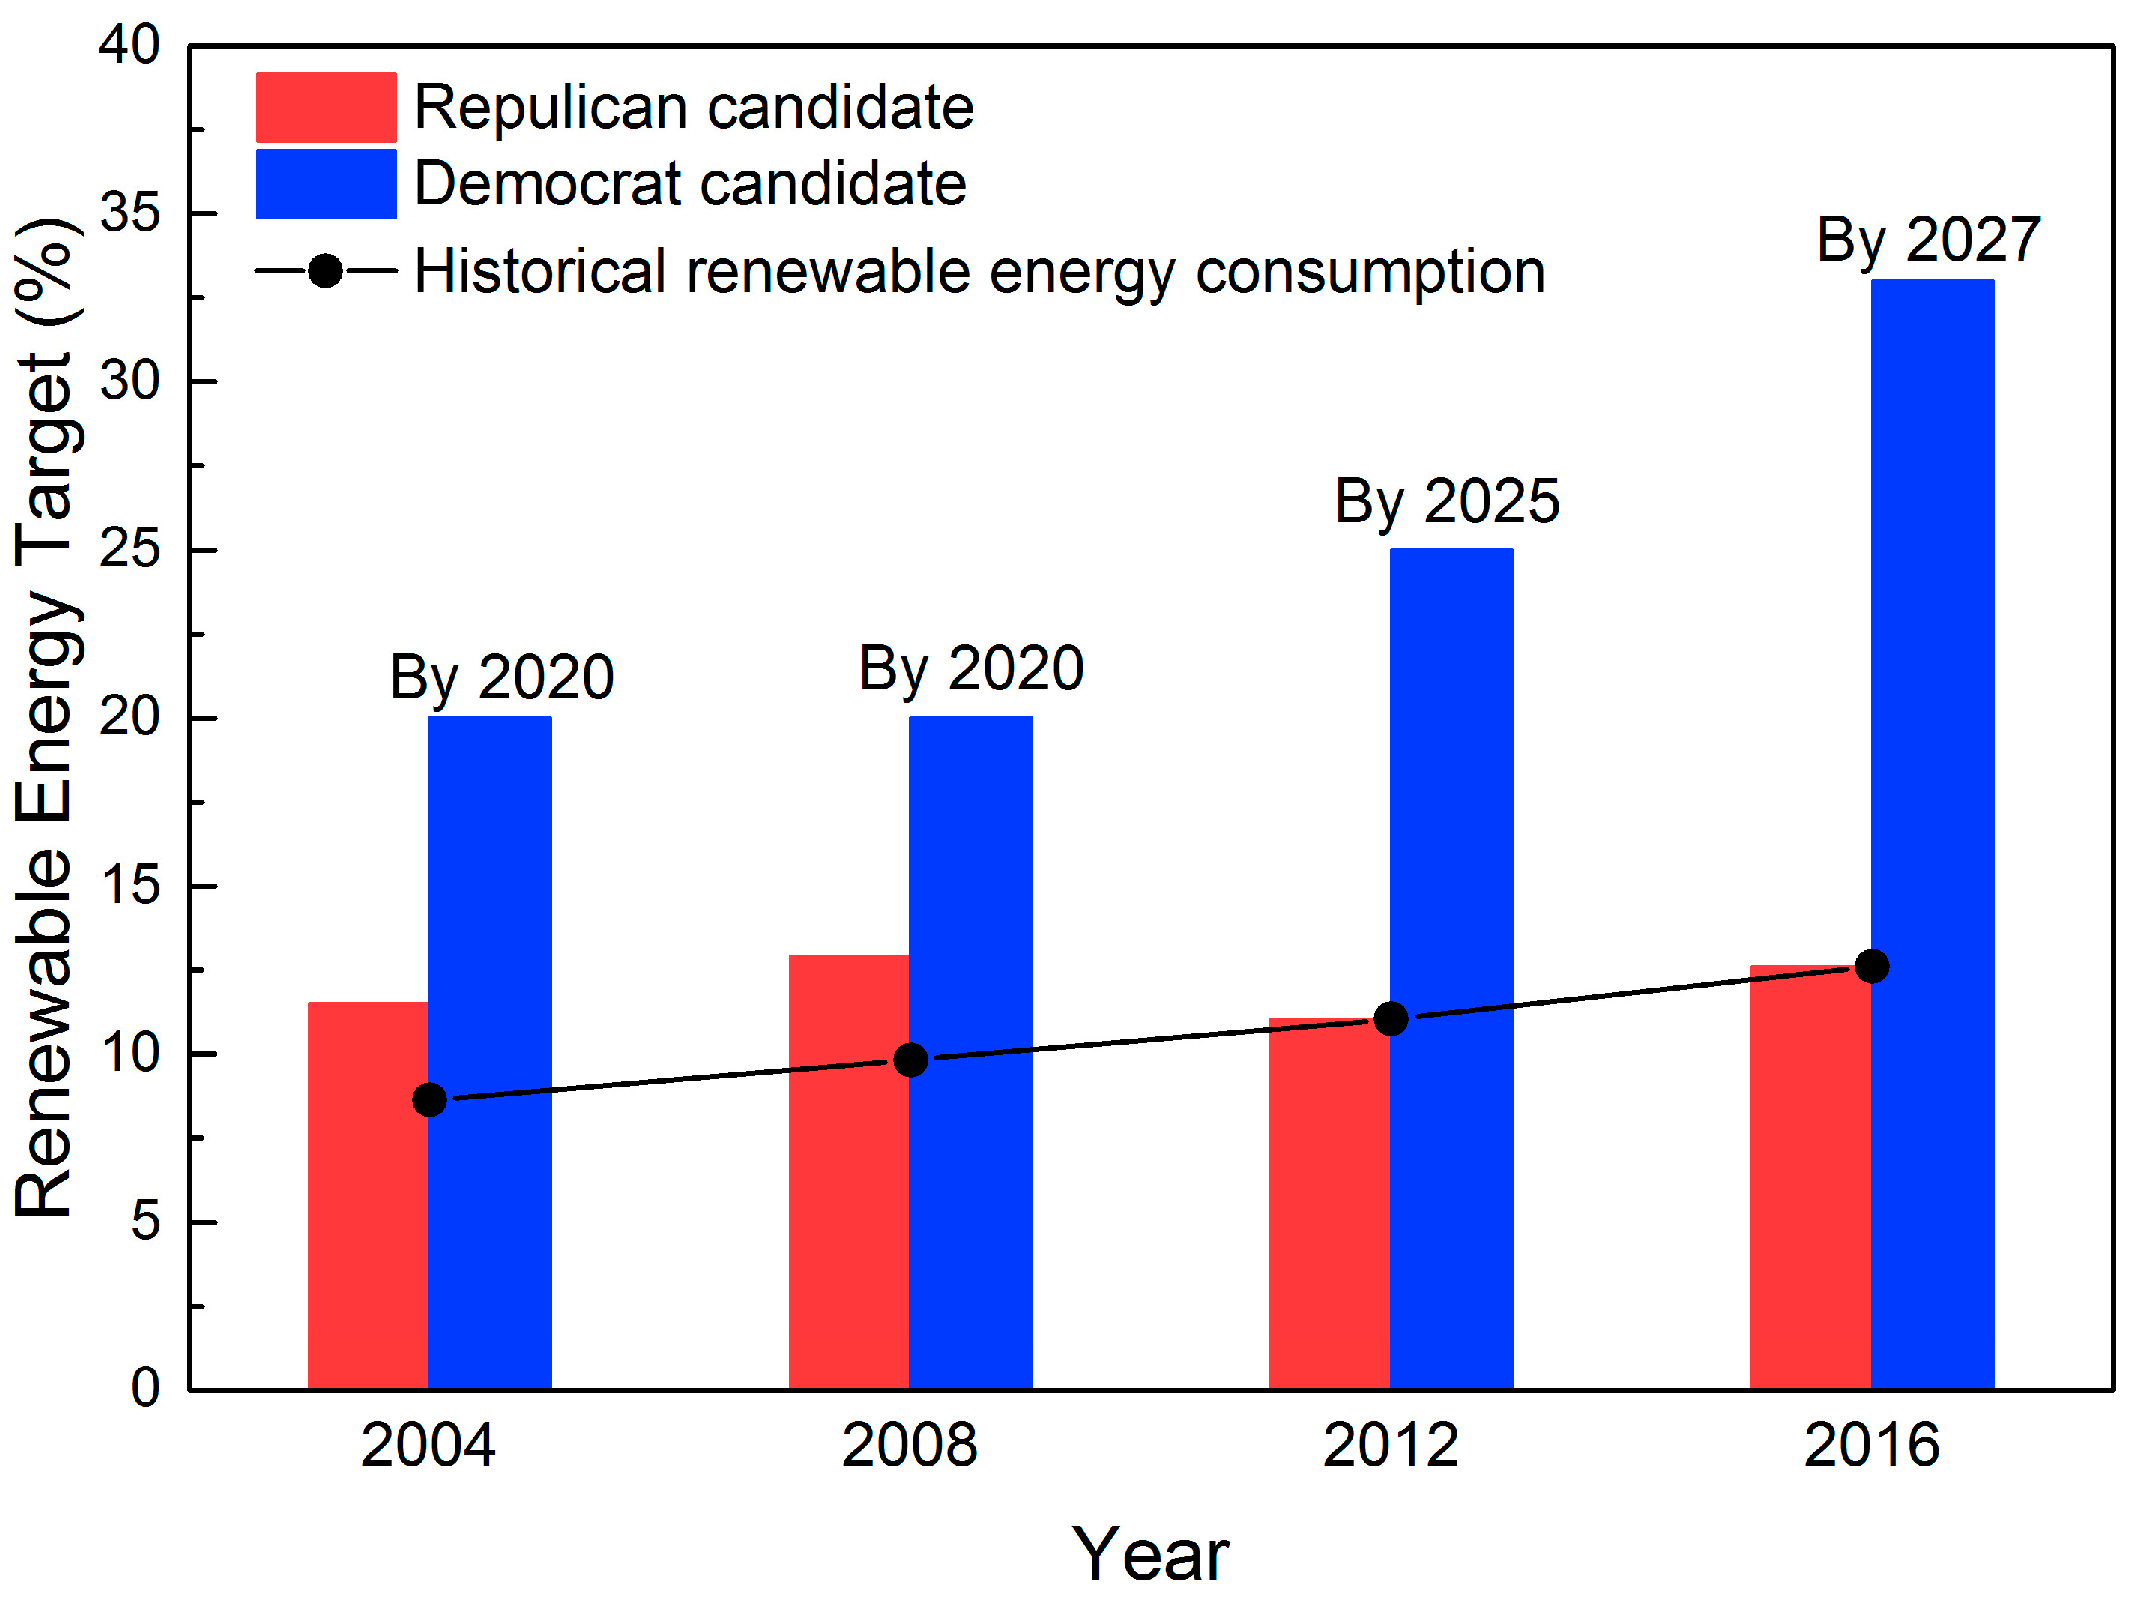
The energy and environment-related issues are becoming critical due to the pressing threats of peak oil, energy security, and climate change. These issues also have implications that affect economic development, national security, and international relations. Energy and climate issues are frequently discussed in political campaigns, while the level of focus and analysis varies case by case. We focus on 2016 presidential election, and provide a brief overview of the public discussion in political campaigns of the leading candidates.
The survey of registered Iowan voters reveals that environment, pollution, and climate change is considered by only 2.0% of the voters to be the most important problem facing the country. Instead, over 20.9% of people are more concerned of terrorism, ISIS, and the growing Muslim populations. More than 18.5% of registered Iowan voters think economic issues are the most important issues, such as limiting government intervention and small business assistance. On the other hand, nearly 10.1% of the survey respondents are dissatisfied with the government and Congress, especially about bipartisanship and concerns of “big government”. Another 8.9% of them expressed their concerns on the gap between rich and poor, more specifically, the income inequality and the shrinking middle class.
Although the majority (67.9%) of the survey respondents believe that the federal government should do more to promote clean energy, this value is not directly related to their stated preferences over presidential candidates. The difference in Democratic and Republican voters in favoring more government support for clean energy is large. In the survey, nearly 80% of the Democratic voters indicate the necessity to promote the green energy by federal government, while only 46% of the Republican voters favor more government support for clean energy. This observation is not surprising given the recent trend of stronger partisanship and growing disagreements in ideology.
In comparison, we calculate the average LCV scores (Senate and House) of the two parties on pro-environmental voting from 2000–2015 (Table 1) [34]. The LCV scores indicate partisan differences on environmental issues are getting larger in recent years, and this trend is driven by Republicans. These scores were evaluated based on environmental and energy bills that congress members voted on, and it indicates how liberal or conservative the congressmen is on environmental issues. After 2000, the divergence between Republicans and Democrats has become more obvious, especially in the House. Republicans tend to be less pro-environment, while Democrats are constantly pro-environment. This finding is consistent with our finding of Iowa caucus survey, and also consistent with a previous study calculating LCV scores from 1974–2012 [21].
Constituents’ opinions are somehow connected to elite’s preferences, since the literature suggests multiple ways that elites shape the mass opinion. As political elites, the energy vision expressed by the candidates reflects well the partisan disagreements. Therefore, we provide a quantitative analysis of the candidates’ energy plans to measure the degree of polarization between Democrats and Republicans on energy issues.

4.1. Democrats

In general, Democrats are pro-climate change and pro-renewable energy. They believe renewable energy will benefit consumers, the economy, and the environment. Acknowledging the high cost, Democratic candidates are willing to invest in renewable energy to gain long-term societal benefits. However, the candidate may take the “environmentalist” stand to varied extents in pursuing a low-carbon economy.

4.1.1. Hillary Clinton

The energy vision of Democratic candidate Hillary Clinton focused on electricity generated from distributed solar and other renewable resources. Clinton’s campaign mainly emphasized on accelerating solar panel installation and renewable electricity generation. If elected, she claimed the United States will have more than half a billion solar panels installed by the end of her first term. In Clinton’s solar energy target, she planned to expand the amount of installed solar capacity to 140 gigawatts by the end of 2020, a 700% increase from current levels. This is the equivalent of having rooftop solar systems on over 25 million homes.
In her vision, Clinton believes that the nation will generate enough clean renewable energy to power every home in America within ten years. To reach this target, she proposed to add new power generation capacity to the grid more quickly than the capacity growth during any decade in American history. This growth of renewable electricity comes from a combination of wind, solar, hydro, geothermal, and other forms of renewable energy. Additionally, her administration would follow a deep decarbonization pathway to raise renewable power to 33% by 2027, a 20% increase from the current level [25].

4.1.2. Bernie Sanders

Bernie Sanders aimed at a 100% clean energy system, which, as declared in his campaign, not only creates millions of good jobs but also cleans air, water, and decreases the U.S. dependence on foreign oil. Sanders also viewed the future to increase the investment in clean and sustainable energy powered by solar, wind, and Earth’s heat. Moreover, he proposed to work on investing in making all American homes more energy efficient, and to re-introduce the Residential Energy Saving Act to provide federal loans to states to perform energy efficiency updates to provide homeowners with valuable energy savings.
Bernie believes that solar energy is one of the most promising sources of clean energy for American’s future. The cost of deploying solar panels has gone down by more than 80% since 2008. This cost decline is assisted by government support, including tax credits and federally-funded research and development. Sanders’ reasoning of investing in solar energy is to “put money back in the pockets of consumers”. Recently, he introduced the Low Income Solar Act to increase low-income families’ access to solar energy by making it more affordable for people who own their own home and incentivize access to community solar project. He planned to introduce wind tax credits, which could spur the development of wind farms, especially in Midwest. He believes that the decreasing cost of wind and solar demonstrates the 100 percent clean energy could be achieved in the future [26].

4.2. Republicans

In contrast to Democrats, Republicans prefer less government intervention to the energy market. As the US energy market has abundant low-cost fossil fuel due to the shale gas boom, Republicans have no intention to change the current status and policy support for renewable energy is a disturbance to the market. Therefore, Republicans disagree with Democrats in the provisions of energy policies in many cases.

4.2.1. Donald Trump

In general, President-elected Trump supports domestic oil and gas production when he emphasizes on the desire for the U.S. to be energy independent. He believes the U.S. has enough natural gas in Marcellus Shale for 110 years of supply, and he also supports fracking and the Keystone XL project—construction of pipelines across multiple states to bring Canadian oil to Illinois and Texas.
The following statement shows Trump’s vision of the nation’s energy future that focuses on energy independence and fossil fuel reliance: “Honestly, we’re taking oil from Canada. We’re paying Canada a lot of money. We don’t even need Canadian oil if we did it right. The really right way is to drill our own oil. We have so much of it we don’t know what to do. Between natural gas and oil and lots of other things, we should be doing our own” [35]. Trump has no plan for the development of renewable energy as his campaign concentrates on fossil fuels.

4.2.2. Marco Rubio

As a moderate Republican, Rubio supported deploying U.S. domestic fossil fuel. In addressing climate change, Rubio has long opposed a cap-and-trade program because he believes that would amount to a massive energy tax. His long-term energy strategy was to optimize America’s resources, minimize government bureaucracy, and maximize private innovation.
Rubio believes in decentralized policies for optimizing America’s resources, as he proposes to empower States and tribes to control onshore energy development within their borders. Rubio also supported the approval of the Keystone XL pipeline and American natural gas export, and the lift of the 1970s-era ban on crude export. Rubios’s vision of the state’s energy plan concentrated in bolstering the energy security of U.S. allies, defending U.S. interests in international climate negotiations, and concluding TTIP negotiation without restrictions on access to U.S. energy exports. To address environmental concerns, Rubio proposed to create a National Regulatory Budget to limit the power of unelected regulators, export the true costs of environmental litigation to taxpayers, and simplify and improve the environmental review process to minimize government bureaucracy. Additionally, Rubio claimed to facilitate private-sector-led development of new technologies, develop the higher education system to support energy jobs, and overhaul the tax code and cut taxes for business of all sizes to maximize private innovation [36].

4.2.3. Ted Cruz

Cruz views the future as the “great American Energy Renaissance” as he proposed to adopt a national energy plan, and an “all-of-the-above” energy approach from oil and natural gas to ethanol [37]. Similarly to other republican candidates, Cruz supports the Keystone pipeline and other infrastructures for fossil fuel. He proposed to empower the private sector to create good-paying American jobs, and to remove federal impediments to energy exploration development and trade. The rationale of his energy plan was slightly different from Trump and Rubio in that his energy policies aimed to improve energy efficiency and economic development.
As a leader of the Tea Party, Cruz might represent core values that national policies should come from the grassroots. His success in Iowa—a state that is big on fuel ethanol production—demonstrated the impact of grassroots activities on elections, although his energy strategy did not align with the interest of the influential Iowan biofuel coalition of corn producers and ethanol suppliers.
To sum up, clear cleavage lay in the candidates’ vision and their partisanship-based views of the country’s energy future. Democratic candidates proposed plans to develop the nation’s efficient and renewable energy resources, while appealing for financial incentives to support clean energy. They framed their energy plans from the perspectives of environment protection, climate change mitigation, and green job creation. On the other hand, Republican candidates supported no carbon pricing policies to address climate change and they tended to ignore renewable energy. Instead, they focused on the policies that would facilitate more and rapid production of fossil fuels to grow the domestic oil and gas industry. Republican candidates frequently use the energy independence and supply security argument to solicit their visions and proposals. Different from the polarized opinions on renewable energy, candidates from both parties supported energy efficiency and conservation, although they constantly have different rationales for energy efficiency policies.

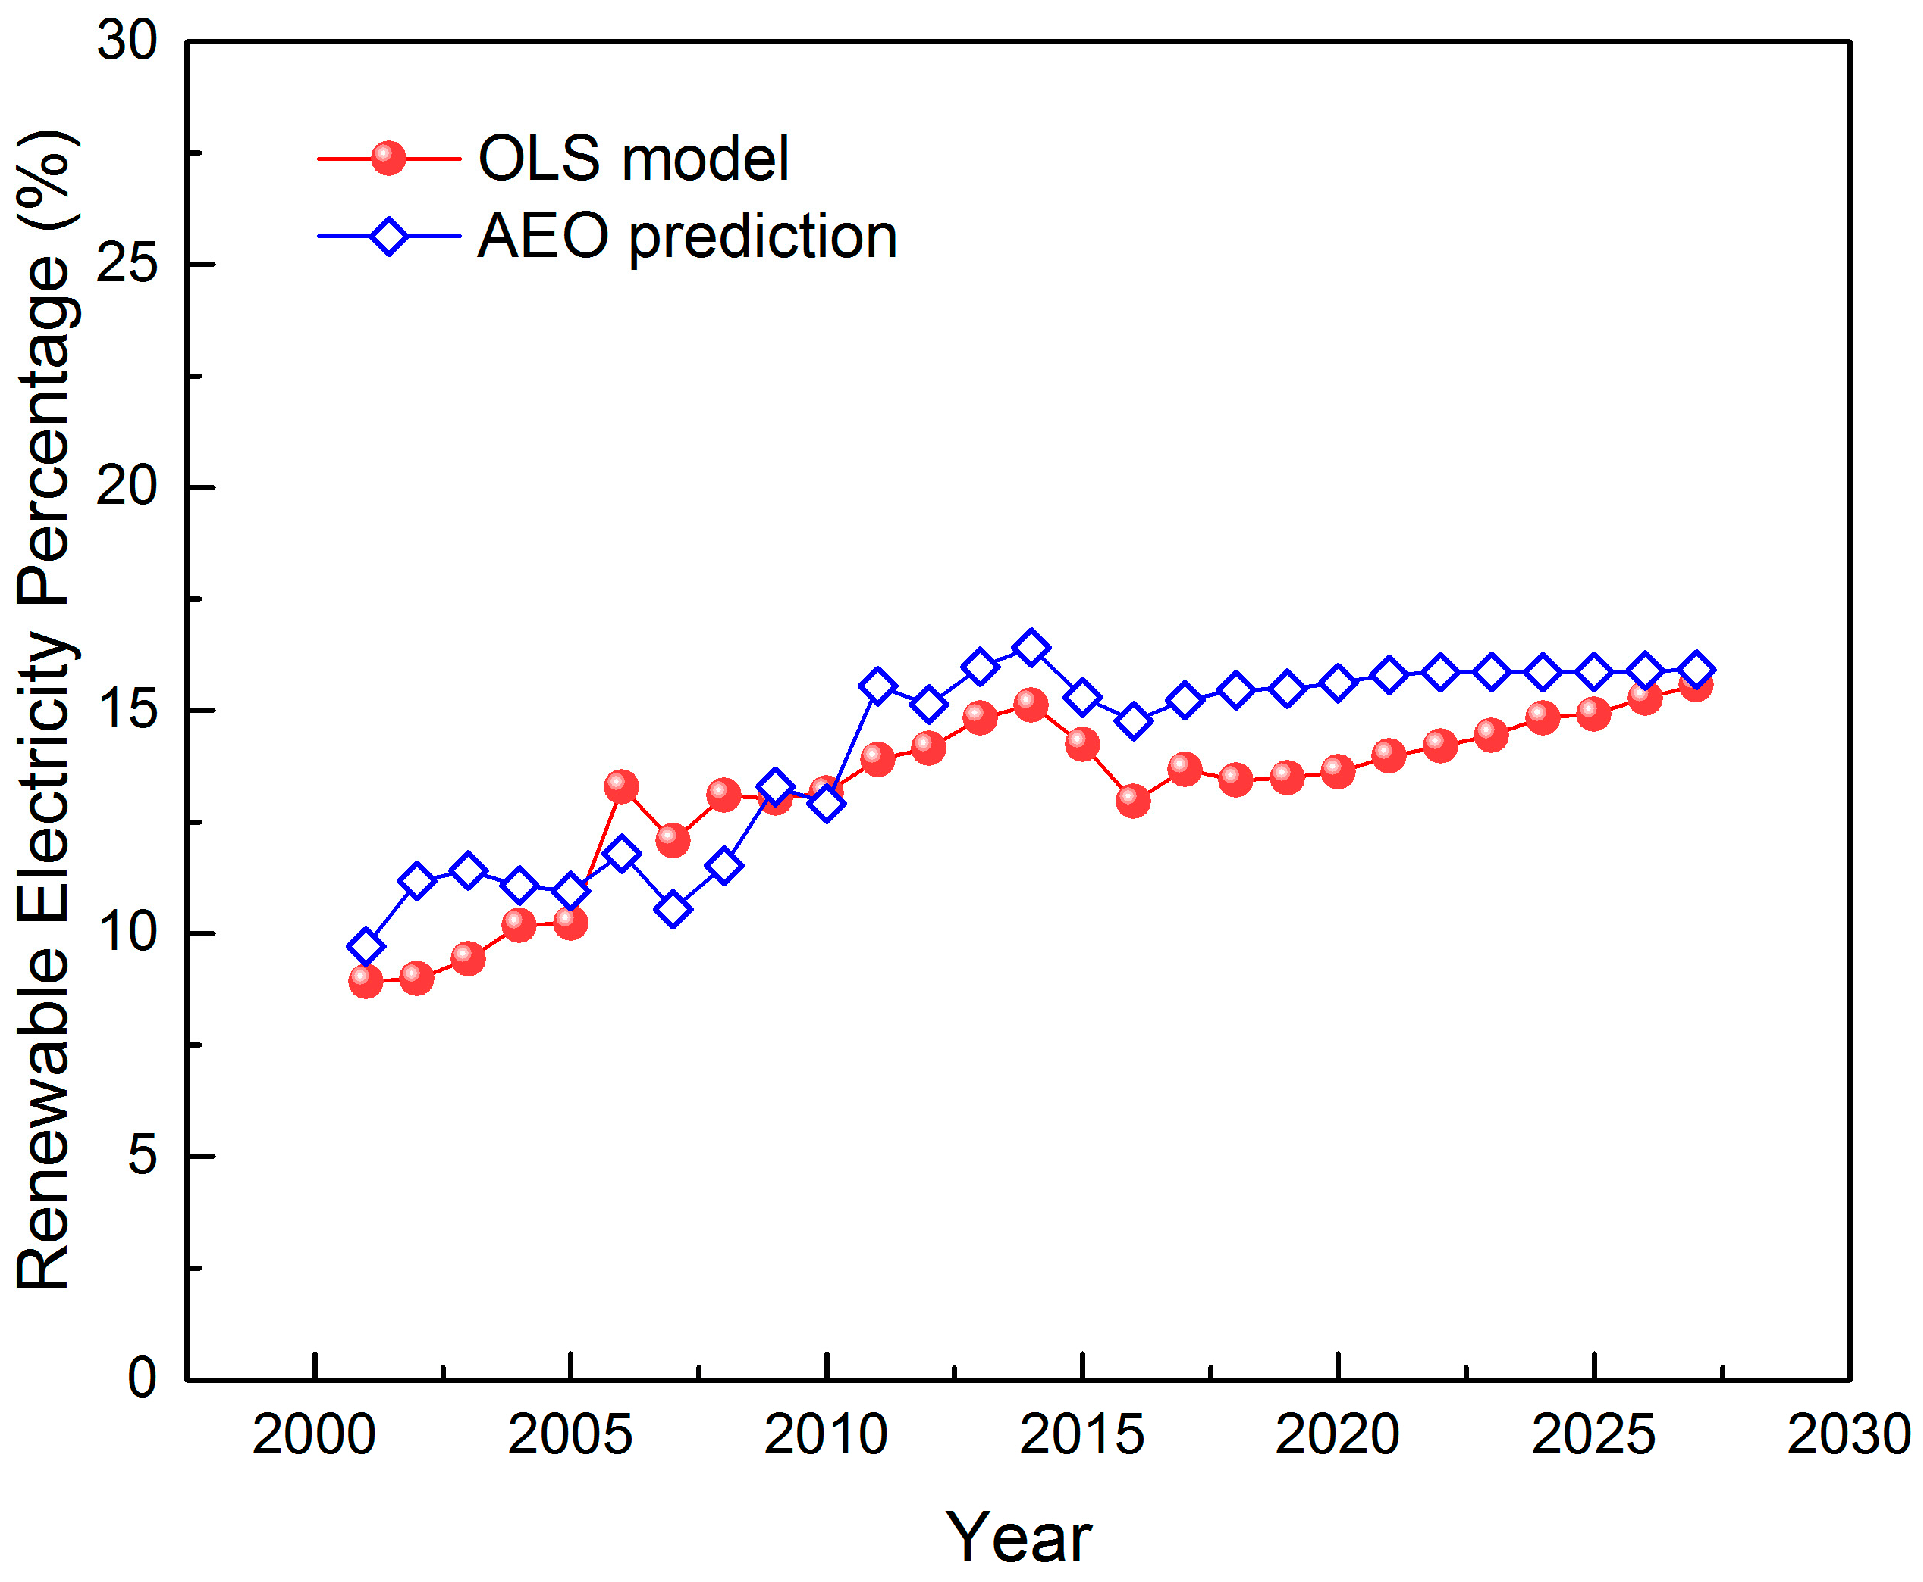
5. Model Results and Discussion
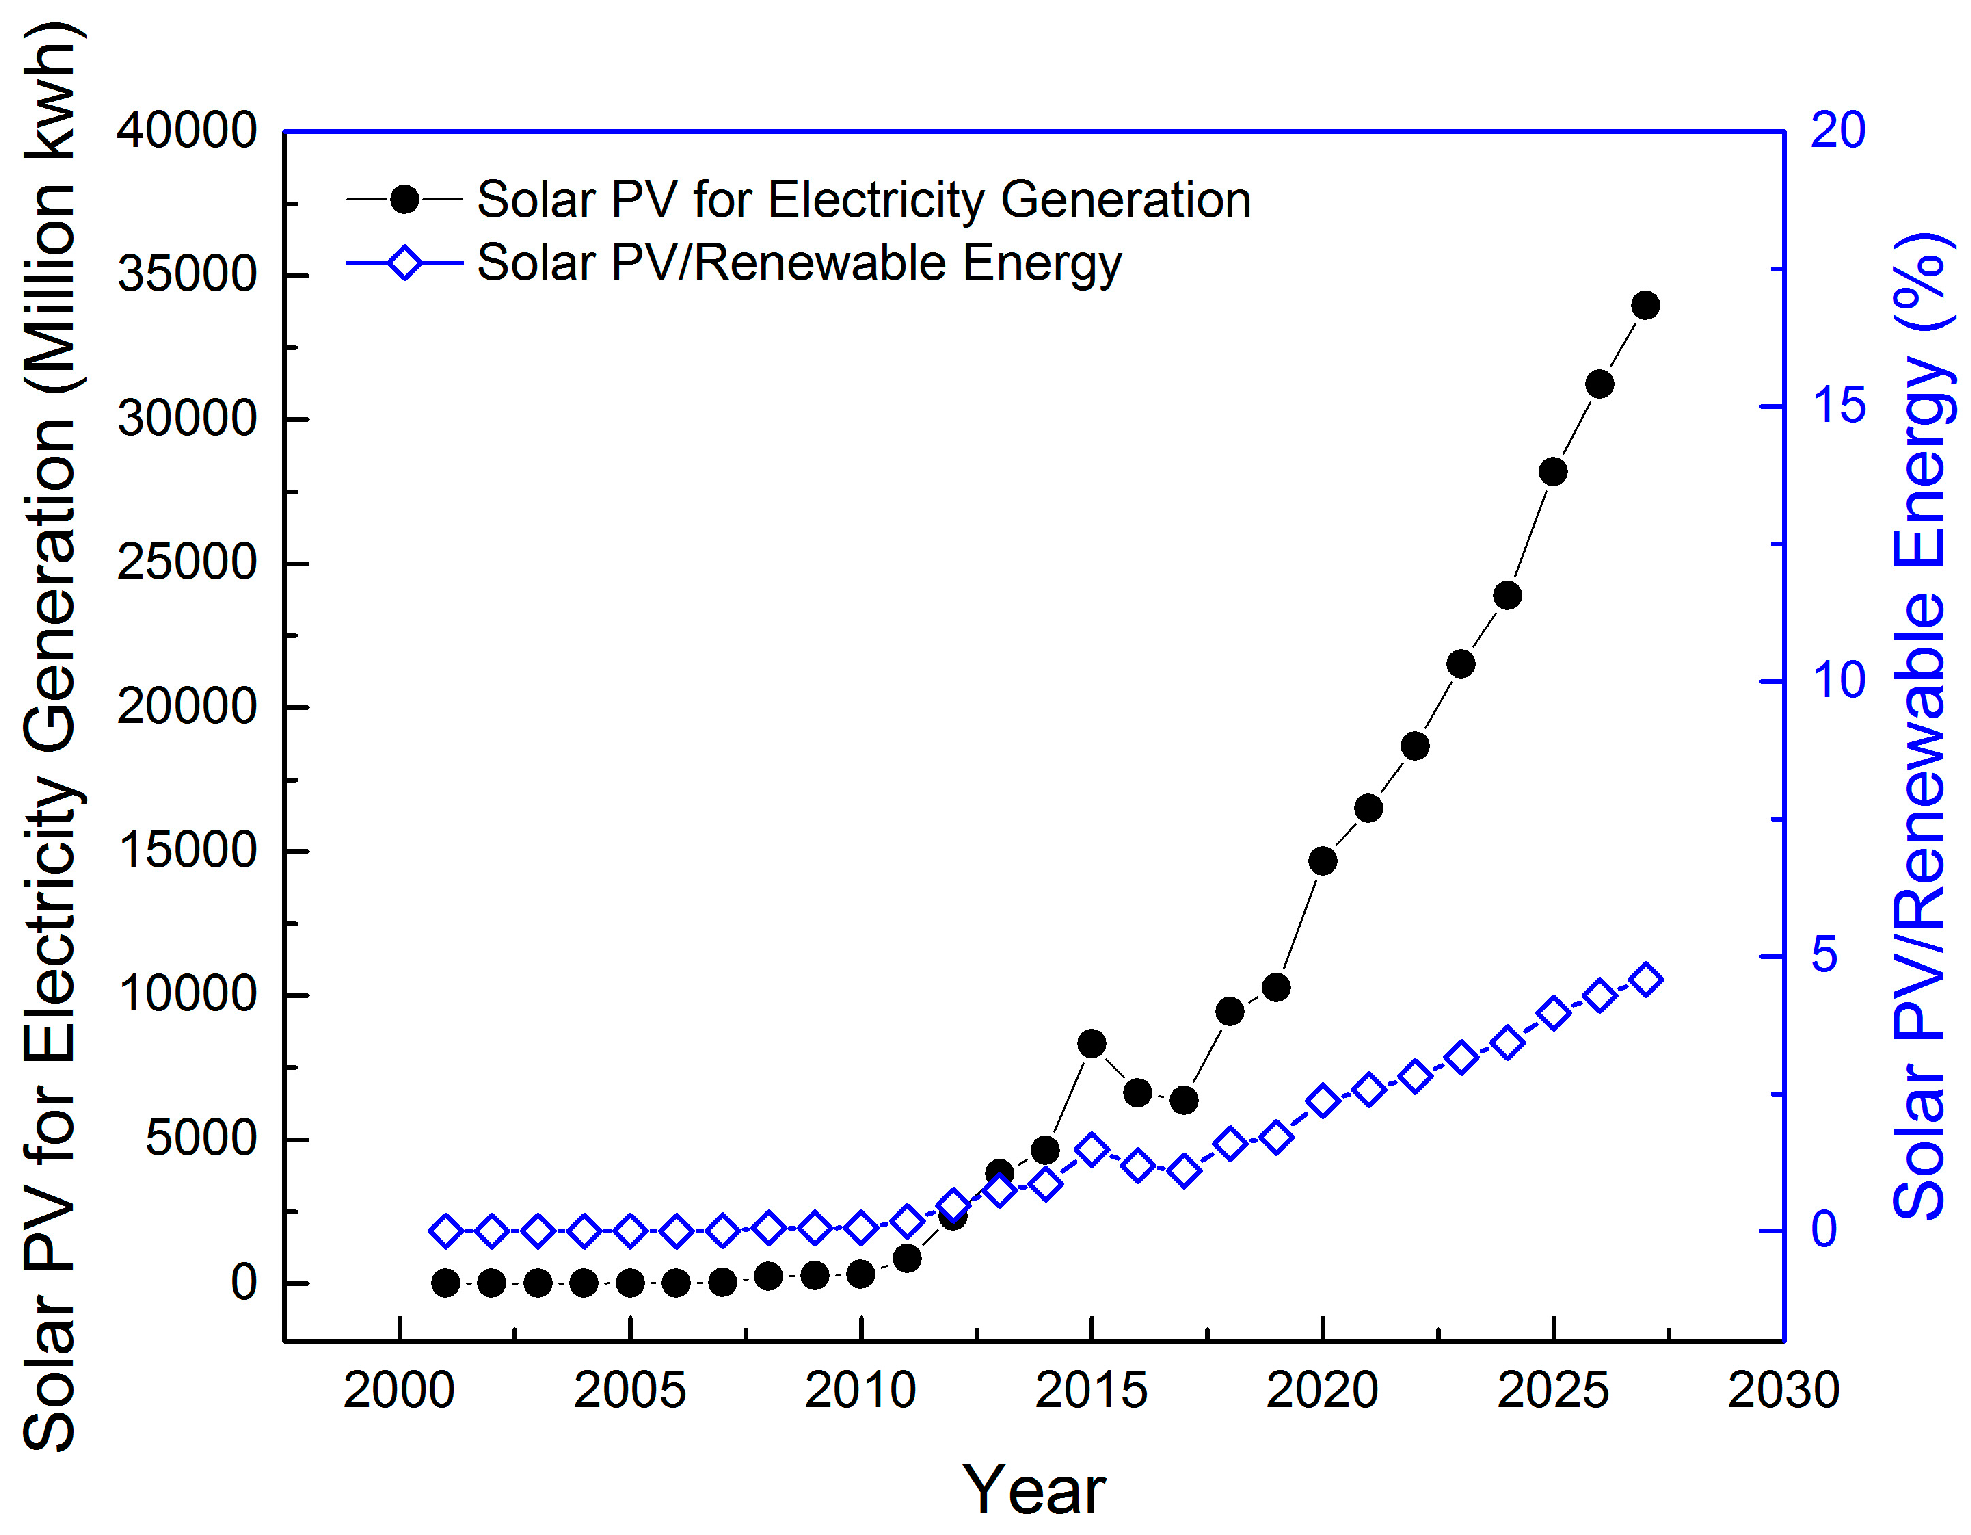
Information collected through the Iowa caucus survey suggests that there is a general consensus that the federal government should do more to promote clean energy, while this belief is more popular with Democrats than Republicans. This preference is not very well reflected by the energy plans proposed by the candidates. Although all candidates agree that energy efficiency is desired and should be pursued, their opinions diverge in terms of government support for renewable energy. Democratic candidates promise to improve the development of renewable resources and believe that the green energy industry will stimulate the economy and be able to create more businesses and jobs. Republican candidates, however, continue hammering the need to incentivize domestic production of fossil fuels because they believe America has sufficient fossil fuels to power the economy.
In this session, we use an OLS regression model to project the growth of total energy consumption and renewable energy production, solar energy in particular, in the nation. Using this projection as the baseline, we compare the renewable energy targets proposed by the candidates to quantify their energy plans and vision of America’s energy future. With this effort, we attempt to measure the degree of polarization of the candidates on renewable energy.

5.1. Solar Energy

For accelerating the deployment of renewable energy, democrat candidates focused on solar energy when they proposed policy supports for the installation of solar panels and concentrated solar power for electricity generation. As the policy proposed by Clinton’s campaign, solar capacity will be expanded to 140 gigawatts by the end of 2020, a 700% increase from current level. Bernie Sanders planned to introduce the Low Income Solar Act and put more effort to invest solar energy technology to increase the installation of solar panels for low-income families.
The Energy Policy Act of 2005 provides investment tax credit (ITC) for distributed solar photovoltaic panels, a 30 percent federal tax credit for solar systems on residential (under Section 25D for homeowner to apply the credit by his/her personal income tax) and commercial (under Section 48 for business that installs, develops and/or finances the project claims the credit) properties, which would expire at the end of 2016. In December 2015, Congress passed an omnibus spending bill extending the 30% solar ITC to the end of 2019 with a three-year phase-down period afterwards. The ITC will drop to 26% in 2020, 22% in 2021, and 10% permanently for commercial and 0% for residential projects. If ITC is not extended, solar installation is expected to decrease by nearly 8 gigawatts (GW) from 2016–2017 [38]. The extension is expected to lead the solar industry to install more than 72 GW of solar PV from 2016 through 2020. This growth represents an increase of over 54% above the baseline without the extension. Ultimately, the U.S. is projected to have 100 GW of solar electricity capacity, including approximately 98 GW of PV and 2 GW of concentrated solar power (CSP). This capacity is sufficient to power more than 20 million U.S. homes. Moreover, solar will provide more than 3.5% of all U.S. electricity, which is an increase of over 3000% in just a decade.
It is still questionable how quickly solar power can reach grid parity due to technology and market uncertainties. Given the fact that solar ITC will be phased out after 2019, other types of incentives may be needed to support the development of solar energy. It makes sense that Sanders advocates for a tax credit for low-income families to adopt solar, although he provides no details about how the cost will be covered. On the other hand, Clinton advocates for a more moderate solar target without proposing any financial support for solar energy.
Our regression model predicts the solar PV growth in electricity generation, using the significant variables (p < 0.05) that have the lowest AIC value of −24.55 and adjusted R2 of 0.96. Significant predictors include CDD, personal GDP, electricity retail price, gasoline retail price in the previous year, and PV cost (Equation (5)). Total solar PV installation for electricity generation will increase with growing energy demand from more CDD, higher GDP, and higher previous-year gasoline price. Lower solar PV cost would motivate more solar PV installations. By the end of 2027, our model projects the total PV electricity generation to be 46.3 GWh (Figure 1), which is higher than the EIA prediction of 14,952 GWh [33]. Electricity generation from solar PV account for only 6.23% of total renewable energy by the end of 2027. The EIA’s Annual Energy Outlook [33] predicts that the total solar PV capacity grows to 8.08 gigawatts by the end of 2027, which is lower than the SIEA prediction based on the ITC extension. Note that Clinton proposes to increase solar by 33% based on SIEA’s study. Thus, it is a challenge to achieve Clinton’s target as suggested by our projection and also the EIA’s. It will be an even harder challenge to meet Sanders’ target.
ln P V t = 15.59 + 3.18 ln ( C D D t ) + 0.78 ln ( p G D P t ) + 1.50 ln ( G P t 1 ) 4.83   ln ( P C t )
Republican candidates questioned the cost of installing solar panels and the validity of financial support including tax credits and federal R and D fund for solar energy. According to SEIA, the solar PV price has dropped by more 73% since the implementation of ITC in 2006. The average solar PV panel price (i.e., turnkey installed cost) is $3.5/Wdc for residential rooftop systems in Q4 2015 [38]. A typical 5 kW residential system would cost $17,500 to install, which is still quite expensive to most American families. Jürgen Weiss, the head of climate change at the Brattle Group consultancy, once commented: “the large percentage of costs for installers of residential solar are already wrapped up in selling the technology to a skeptical public who have relative low electricity costs” [39].
Another concern about the solar energy target is associated with the efficiency of the solar panels. According to Massachusetts Institute of Technology, the efficiency of solar panel is only 15%–21% in terms of how much sunlight can be converted into usable energy, and solar panel efficiency increased by only 5%–11% over the past 50 years [40]. Due to these reasons, the Republican candidates generally favor energy efficiency measures over solar PV energy.
Given the recent multi-year extension of solar ITC, business entrepreneurs feel confident in foreseeing rapid growth in solar industry. In fact, record-breaking increase has been observed in 2015 for new added solar capacity. With regard to the solar targets proposed by Democratic candidates, Americas Chief from Bloomberg New Energy Finance, Ethan Zindler, believes “the ambition was high, but within reach”. Shayle Kann from Greentechnology Media (GTM) thought it was a perfect target, ambitious but possible. According to GTM, in order to achieve 140 GW in 2020, the annual solar growth rate needs to be above 32% in 2017. GTM states this goal could be achieved with the help of four drivers: ITC, the Clean Power Plan, state-level activities, and the decline in solar costs. For sure, ITC is the largest uncertainty in this market, and the recent multi-year extension will set the industry for takeoff. The Clean Power Plan, recently released by EPA in August 2015, which will grant double credits for renewable energy from 2020 to 2021, would boost solar capacity from all over the country. In addition to federal policies, state-level activities, such as permitting, interconnection, incentives, net metering, dynamic pricing, and RPS standards, are also important solar market drivers. Moreover, the learning effect from capacity growth will help decrease costs, and that will assist solar energy development in the future [41].

5.2. Renewable Energy

The models for renewable power production and total energy used for electricity generation are generated using stepwise variable selection. Equations are shown below for renewable energy (Equation (6)) and total energy production (Equation (7)):
ln ( R t ) = 16.78 + 2.17 ln ( P o p t ) + 0.98 ln ( E P t 1 )
ln ( E t ) = 9.46 + 0.4 ln ( C D D t ) + 0.19 ln ( I n t ) + 0.51 ln ( E P t ) 0.26 ln ( G P t )
In forecasting renewable energy used for electricity generation, the significant factors (p < 0.05) include population and electricity retail price in the previous year. The model returns an adjusted R2 of 0.92 and AIC value of −134.22. The prediction of total energy used for electricity depends on CDD, personal disposal income, retail prices of electricity, and gasoline (p < 0.05). The model for total primary energy for electricity generation has an adjusted R2 equal to 0.94 and AIC value of −169.97.
These two models project annual energy production from 2016–2027, which covers the next two presidential terms. According to the models, total electricity generated is estimated to reach 4.7 trillion kWh by the end of 2027. Renewable electricity generation, including wind, solar, hydro, geothermal, and other forms, is projected to reach 0.74 trillion kWh, which amounts to 15.57% of total power production of that year (Figure 2). In comparison, EIA predicts renewable energy and total energy generation to be 0.73 and 4.58 trillion kWh, respectively. AEO’s forecast from EIA suggests renewables account for 15.91% of total energy used for electricity generation. This result is close to our projection (Figure 3).
In comparison, Clinton’s policy target was set at 33% of renewable energy by the end of 2027; Sanders aimed at 100% of clean energy used by 2050. Results from our regression models suggest that the renewable energy used for electricity reaches around 15% of total power production by the end of 2027 (Figure 3). EIA’s Annual Energy Outlook [33] predicts that the renewable energy used for electricity generation is about 16% by the end of 2025. The EIA estimation is produced based on the current provision of policies, including the multi-year production tax credit and investment tax credit for renewables, the Clean Power Plan, state Renewable Portfolio Standards, etc. [42]. EIA’s projection, and ours, question the feasibility of Sanders’ targets, and suggest challenges for Clinton’s energy plan, as well. There is a 20% gap between Clinton’s proposed target and the prediction of this study, while optimists may believe her target is within reach. To achieve Sanders’ ambitious target, financial incentives and other policies are needed to make clean energy increase over 75% from 2025 based on the prediction of this study (Figure 2).
According to Equation (6), population and retail price of electricity from the previous year have positive coefficients in predicting renewable electricity production. In other words, renewable energy generation is positively affected by population growth, and the impact of the electricity rate is lagged for a year. Other factors that affect solar PV power, such as CDD and GDP, are not significant in this model. Rather, population and electricity rate represent the socioeconomic factors leading to the growth of renewable energy demand.
For total energy generation, CDD, personal disposal income, and electricity retail price have positive coefficients, meaning higher CDD, personal disposable income, and electricity price lead to more power production. Gasoline price is a negative coefficient instead, indicating less demand from fossil fuel. In addition, growth of energy demand drives up electricity generation from both renewable and fossil resources. Increasing the market share of renewable energy is a challenge, and government support and policies are needed to better facilitate the expansion of renewable energy.
A 2015 Forbes article [39] noted that the federal government has already spent $150 billion on renewable energy in the past six years. Concerns rise because large incentives may keep the industry afloat [43]. A well-rounded renewable energy policy should correspond highly to the long-run, yet no specific energy plan has been observed from the candidates. Until now, Clinton has proposed a renewable policy schedule without detailed information. Sanders proposed to introduce solar tax credits to low-income families, and to cooperate with the EPA and other relevant agencies to accelerate renewable energy development. Though these targets look promising, implementation is always the critical process that decides whether policies and programs fail in reaching targets. The idea of using energy policies to stimulate economic growth is a very subtle practice. If policies cannot balance economic and environmental goals, these targets may well turn into empty talks.
Current political campaigns provide no details other than standalone targets, such as subsidies and tax credits, for growing renewable energy. We attempt to evaluate the potential policy effects by simply plugging the targets into the OLS models to see how much of a price increase is required to reach the proposed goals. Doing this provides a basis for examining whether the targets claimed by Sanders and Clinton are reasonable or not. According to Clinton’s target, she proposed to increase investments in the renewable energy market and lower energy bills. Therefore, those policies are expected to reflect on electricity prices, which serve as a significant predictor for renewable electricity generation. If 33% of renewable replacement was to be achieved, the total renewable electricity generation has to reach to 1.6 trillion kWh by 2027. Based on our model, the electricity retail price in 2026 needs to be 30.8 cents per kWh to drive the renewable electricity generation to 1.6 trillion kWh. The estimated rate of 30.8 cents/kWh is about 127% higher than the reference case prediction in absent of 33% of renewable energy. Additionally, the potential policy has to maintain an electricity increase of 5%~8% for each year, on average, to meet the 33% renewable energy target by 2027, which is opposite to Clinton’s goal of reducing energy bills for customers. Our OLS model suggests her renewable energy target is questionable without other policy measures to lower the cost, let alone Sanders’ target to reach 100% renewable energy replacement by 2025.
However, there are some voices that think these policies are achievable. Some of the professionals and practitioners in the renewable energy industry believe the 33% clean energy target from Clinton’s energy plan could be achieved by taking wind energy into consideration. Mathiesen’s research [44] shows that wind generated 4.4% of the country’s electricity, compared with 0.4% from the sun in 2014. The Department of Energy (DOE) [45] predicts that wind energy could affordably reach 20% of electricity generation by 2030. EIA believes the Clean Power Plan will be the largest driver of new renewable capacity throughout the 2020s.
Republican candidates generally believe the nation has sufficient fossil fuel resources, and increasing fossil production while improving energy efficiency is sufficient to power the economy. They support the Keystone pipeline project, which receives numerous critics and oppositions from the Democrats. The Republican candidates do not favor renewable energy due to the concern of costs of developing renewable resources when the country is facing with historical low oil and gas prices. They advocate that domestic fossil energy reliance and increased production can lead to energy independence of the country. Being self-sufficient in energy supply would boost the global influence of the United States once the country gains oil independence from OPEC (Organization of the Petroleum Exporting Countries) countries. This argument lays out the key tone of their energy policies, and they believe the economy will revive and jobs will be created as energy efficiency improves.
Additionally, the trend of polarization is observed to be growing by reviewing the renewable policy targets claimed by candidates in the past three presidential elections from 2004–2016 (Figure 4). Either explicitly or implicitly, Republicans favor exploring fossil fuel resources over non-fossil options. In 2004, President Bush claimed to support tax credits for electricity produced from renewables and alternative fuels at a cost of $1.4 billion gallons over ten years. Translating this amount of tax credit to per unit subsidy, President Bush would increase the tax credit from 1.5 cents/kWh in 2004 to 1.9 cents/kWh. Inputting this number into the OLS model, a 0.4 cent/kWh tax credit would lower the electricity price and result in 11.5% of renewable electricity in the year 2004. The Republican candidate of the 2008 presidential election, John McCain, claimed to call for suspension of the tax on fuels and provide 18.4 cents/gal of gasoline. This policy would decrease the gasoline price from 3.61 $/gal to 3.42 $/gal in 2008, and the renewable energy production would decrease from 13.1% to 12.9%, as estimated by our OLS model. In the 2012 and 2016 elections, none of the Republican candidates have proposed plans to support renewable energy. Thus, the renewable energy targets are treated the same as the EIA’s reference case given only existing policy provisions (11.04% in 2012, and 12.60% in 2016). On the contrary, all Democratic Party candidates have proposed policies with clear targets to grow renewable energy’s market. In both 2008 and 2012 elections, Presidential Obama proposed the target of renewable electricity to be 25% by 2025, and in 2016, Hillary elevated this goal to 33% of renewable electricity replacement.
Illustrated by Figure 4, the differences between Democratic and Republican candidates on renewable energy are much more significant than the past three elections. President-elect Donald Trump sticks with the Republican camp while claiming strong support for specific fossil fuel exploration projects, such as coal mining, hydro fracking for shale gas and shale oil, and the Keystone XL pipeline project. Mr. Trump holds a skeptical view on climate change by calling global warming a “hoax” and declaring to quit the Paris Agreement, which was ratified by President Obama in September 2016 [46]. On the other hand, Hillary Clinton was promoting her plan to reach 33% of renewable energy replacement by the end of 2025—a target higher than EIA’s predictions and ours, and also higher than any of targets by Democratic candidates in the 2004, 2008, and 2012 elections. No mention the target by another Democratic candidate, Bernie Sanders, who claimed to replace 100% of fossil fuel by 2050. The polarized phenomena on renewable energy policy has become more obvious. Figure 4 illustrates the polarized believes and views of renewable energy development by the candidates in 2004, 2008, 2012, and 2016 elections [47,48,49,50].
This observation of polarized views of the candidates on renewable energy is only a superficial reflection of partisan conflict. The underpinning factor is related to the ideology of treating public policy as the government intervention to the energy market. Research suggests that party sorting may occur only when citizens are acquiring information to get familiar with the subject [24]. However, this phenomenon has the caveat that the legitimacy of the climate change problem and the need of developing renewable energy may be washed out in the intriguing debates of partisan disagreements. Moreover, the polarization trend raises concerns over the possibilities for the two parties to allow discourse and mute their ideological cleavage to work together on combating environmental and climate change issues.

6. Conclusions and Policy Implications

This study investigates the plans of developing renewable energy proposed by the presidential candidates from the two parties. We studied the energy plans proposed by presidential candidates in the 2016 election. We built OLS regression models to predict future renewable energy consumption to serve as the basis of comparing the candidates’ energy plans. Our analysis suggests that the development of renewable energy needs strong policies and government support, and it is quite a challenge to reach the ambitious targets proposed by the Democratic candidates.
Our analysis finds polarized views regarding the energy future and climate change in the US. The democratic candidates supported the development of renewable energy, especially distributed solar energy, while they target renewable growth to various extents. The Republican candidates, on the other hand, present strong support for domestic fossil fuels to enhance energy independence. President-elect Trump criticizes global warming and declares to quit the Paris Climate Agreement. Unlike the obviously polarized view on renewable energy, Democrat and Republican candidates all support energy efficiency, as they believe efficiency will stimulate economic growth and create jobs. Republican candidates do not oppose to climate change mitigation as long as mitigation options are deployed by using energy more efficiently.
We provide a holistic analysis of the proposed policies in the 2016 election cycle by using different quantification methods. Based on our OLS model estimation, renewable electricity growth resulted from the proposed policies in presidential elections from 2004–2016 suggests that partisan difference is growing on renewable energy development. This finding is backed by our data on the Iowa caucus survey and analysis of LCV scores of the two parties. In addition, the OLS model quantification suggests Democrats are more likely to present higher renewable targets than before. The other two measures suggest that political polarization is driven by Republicans, who are becoming more conservative.
Although difference is usually a point of attention, there is still not enough discussion on renewable energy in election campaigns. This phenomenon may reflect the fact that Americans believe there are other issues more important than energy that face the country, as revealed by the Iowa Caucus survey. In the meantime, the two parties do not diverge that much on energy efficiency and environmental issues and climate change in general.
Nevertheless, it is a salient issue to the discussion of the nation’s energy future and the presidential election is the best venue to draw people’s attention to it. The elite should spend more time discussing energy-related topics to get citizens familiar with the issues. Given the recent agreed upon Paris Climate Deal, the next president of the United States will have to address energy issues and problems under the regime of increasing international peer pressure and global collaboration on mitigating climate change.

Author Contributions

M.-H.C. conceived and designed the OLS approach for the study, and analyzed data; M.Y. collected data for analysis; Y.W., conceived the ideal to analyze LCV scores and provided an approach to analyze political factor with OLS model; M.-H.C., M.Y. and Y.W. wrote the paper.

Conflicts of Interest

The authors declare no conflict of interest.

References

  1. Intergovernmental Panel on Climate Change. Climate Change 2014: Synthesis Report; Intergovernmental Panel on Climate Change: Geneva, Switzerland, 2014. [Google Scholar]
  2. United States Environmental Protection Agency. Overview of Greenhouse Gases. 2013. Available online: http://www3.epa.gov/climatechange/ghgemissions/gases/co2.html (assessed on 10 September 2015). [Google Scholar]
  3. Davis, F.L.; Wurth, A.H.; Lazarus, J.C. The green vote in presidential elections: Past performance and future promise. Soc. Sci. J. 2008, 45, 525–545. [Google Scholar] [CrossRef]
  4. Guber, D. The Grassroots of a Green Revolution: Polling America on the Environment; MIT Press: Cambridge, UK, 2003. [Google Scholar]
  5. Zaller, J. Report on 1991 Pilot Items on Environment; National Election Studies: Ann Arbor, MI, USA, 1992. [Google Scholar]
  6. Center for Climate Change and Energy Solution. Outcomes of the U.N. Climate Change Conference in Paris; Center for Climate Change and Energy Solution: Arlington, VA, USA, 2015. [Google Scholar]
  7. Bianco, N.; Igusky, K.; Gasper, R.; Obeiter, M.; Aden, N.; Forbes, S. By the Numbers: How the U.S. Economy Can Benefit from Reducing Greenhouse Gas Emissions. World Resource Institute, 2014. Available online: http://www.wri.org/blog/2014/10/numbers-how-us-economy-can-benefit-reducing-greenhouse-gas-emissions (assessed on 10 September 2015).
  8. Sutter, J.D.; Berlinger, J.; Ellis, R. Obama: Climate Agreement ‘Best Change We Have’ to Save the Planet. 14 December 2015. Available online: http://www.cnn.com/2015/12/12/world/global-climate-change-conference-vote/ (assessed on 28 February 2016).
  9. Ford, J. The election and the environment—1980. Environ. Sci. Policy Sustain. Dev. 1980, 22, 25–28. [Google Scholar] [CrossRef]
  10. Lanoue, D.J. Retrospective & schematic assessments of presidential candidates: The environement & the 1988 election. Polity 1993, 25, 547–563. [Google Scholar]
  11. Jeff, J. Environment emerges as key issue in 1996 election. Environ. Sci. Technol. 1995, 29, 541. [Google Scholar] [CrossRef]
  12. Baker, B. Washington watch: The environment as election issue. BioSci 1996, 46, 574. [Google Scholar] [CrossRef]
  13. DiPeso, J. The environment and the 2004 election. Environ. Qual. Manag. 2003, 13, 103–108. [Google Scholar] [CrossRef]
  14. Bergeson, L.L. Changing of the guard: Implications of the Democratic midterm election win on environment, energy, and resources legislation. Environ. Qual. Manag. 2007, 16, 89–93. [Google Scholar] [CrossRef]
  15. Layman, G.C.; Carsey, T.M.; Horowitz, J.M. Party polarization in American politics: Characteristics, causes and consequences. Annu. Rev. Political Sci. 2006, 9, 83–110. [Google Scholar] [CrossRef]
  16. Fiorina, M.P.; Abrams, S.J.; Pope, J.C. Culture War? The Myth of a Polarized America; Pearson Longman: New York, NY, USA, 2005. [Google Scholar]
  17. Abramowitz, A. Partisan Polarization and the Rise of the Tea Party Movement. APSA Annual Meeting Paper. 2011. Available online: http://ssrn.com/abstract=1903153 (assessed on 10 September 2015).
  18. Sundquist, J.L. Dynamics of the Party System: Alignment and Realignment of Political Parties in the United States; The Brookings Institution: Washington, DC, USA, 1983. [Google Scholar]
  19. Carmines, E.G.; Stimson, J.A. Issue Evolution: Race and the Transformation of American Politics; Princeton University Press: Princeton, NJ, USA, 1989. [Google Scholar]
  20. Poole, K.T.; Rosenthal, H. A spatial model for legislative roll call analysis. Am. J. Political Sci. 1985, 29, 357–384. [Google Scholar] [CrossRef]
  21. McCright, A.M.; Xiao, C.; Dunlap, R.E. Political polarization on support for government spending on environmental protection in the USA. Soc. Sci. Res. 2014, 48, 251–260. [Google Scholar] [CrossRef] [PubMed]
  22. Poole, K.T.; Rosentral, H. The polarization of American politics. J. Politics 1984, 46, 1061–1079. [Google Scholar] [CrossRef]
  23. Gallup Survey, U.S. Concern about Global Warming about Eight-Year High. Available online: http://www.gallup.com/poll/190010/concern-global-warming-eight-year-high.aspx (assessed on 10 September 2015).
  24. Guber, D.L. A cooling climate for change? Party polarization and the politics of global warming. Am. Behav. Sci. 2012, 57, 93–115. [Google Scholar] [CrossRef]
  25. Hillary, C.R. Making America the Clean Energy Superpower of the 21st Century. Available online: https://www.hillaryclinton.com/issues/climate/ (assessed on 10 September 2015).
  26. Bernie, S. Combating Climate Change to Save the Plant. Available online: https://berniesanders.com/people-before-polluters/invest-in-clean-sustainable-energy/ (assessed on 15 January 2016).
  27. O’Malley, M. Clean Energy Future. A Job Agenda for Our Renewable Energy Future. 2015. Available online: http://martinomalley.com/policy/clean-energy-future/ (assessed on 10 September 2015).
  28. Yi, H.; Feiock, R.C. Renewable energy politics: Policy typologies, policy tools, and state deployment of renewables. Policy Stud. J. 2014, 42, 391–415. [Google Scholar] [CrossRef]
  29. Bentzen, J.; Engsted, T. A revival of the autoregressive distributed lag model in estimating energy demand relationships. Energy 2001, 26, 45–55. [Google Scholar] [CrossRef]
  30. U.S. Census Bureau. Population Projection. Available online: http://www.census.gov/population/projections/data/national/2014/summarytables.html (assessed on 10 September 2015).
  31. Bureau of Labor Statistics. Income. Available online: http://www.bls.gov/emp/ep_table_410.htm (assessed on 10 September 2015).
  32. The Statistical Portal. GDP Projection. Available online: http://www.statista.com/statistics/216985/forecast-of-us-gross-domestic-product/ (assessed on 10 September 2015).
  33. U.S. Energy Information Administration. Annual Energy Outlook 2015. 2015. Available online: https://www.eia.gov/forecasts/aeo/section_elecgeneration.cfm (assessed on 10 September 2015). [Google Scholar]
  34. National Environmental Scorecard 2000–2015. League of Conservation Voters. Available online: http://scorecard.lcv.org/ (assessed on 26 October 2016).
  35. Wold Energy Source. Trump on Energy in Politics. Available online: http://www.worldenergysource.com/worldenergy-blog/trump-on-energy-in-politics (assessed on 15 January 2016).
  36. Marco, R. Powering the New American Century. Available online: https://marcorubio.com/issues-2/energy-policy-proposals/ (assessed on 15 January 2016).
  37. Ted, C. Job and Opportunity, Energy Renaissance. Available online: https://www.tedcruz.org/issues/jobs-and-opportunity/ (assessed on 15 January 2016).
  38. Solar Income Tax Credit. Solar Energy Industries Association. Available online: http://www.seia.org/policy/finance-tax/solar-investment-tax-credit (assessed on 10 September 2015).
  39. Forbes. Business/Energy. Available online: http://www.forbes.com/energy/#f4911ca193a2 (assessed on 10 September 2015).
  40. Johnson, A. How Many Solar Panels Do I Need on My House to Become Energy Independent? 19 November 2013. Available online: http://engineering.mit.edu/ask/how-many-solar-panels-do-i-need-my-house-become-energy-independent (assessed on 10 September 2015).
  41. Kann, S. Green Technology Media: Solar. Can the US Reach Hillary Clinton’s New Solar Goal? Available online: http://www.greentechmedia.com/articles/read/can-the-us-reach-hillary-clintons-new-solar-goal (assessed on 10 September 2015).
  42. U.S. Energy Information Administration. Annual Energy Outlook. 2016. Available online: http://www.eia.gov/forecasts/aeo/pdf/0383(2016).pdf (assessed on 31 October 2016). [Google Scholar]
  43. Biek, R. Newsy.com. What’s Wrong with Hillary Clinton’s Solar Panel Plan? Available online: http://www.newsy.com/videos/what-s-wrong-with-hillary-clinton-s-solar-panel-plan/ (assessed on 10 September 2015).
  44. Mathiesen, K. The Guardian.com. Is Hillary Clinton’s Ambitious Solar Energy Goal for the US Workable? Available online: http://www.theguardian.com/environment/2015/jul/28/is-hillary-clintons-ambitious-solar-energy-goal-for-the-us-workable (assessed on 10 September 2015).
  45. Department of Energy. A Record Year for the American Wind Industry. Available online: http://www.energy.gov/articles/record-year-american-wind-industry (assessed on 15 January 2016).
  46. Fortune, Leadership. Available online: http://www.fortune.com/2016/11/10/donald-trump-climate-change-paris-agreement/ (assessed on 20 November 2016).
  47. On The Issues, John Kerry on Energy and Oil. Available online: http://www.ontheissues.org/2004/John_Kerry_Energy_+_Oil.htm (assessed on 13 August 2016).
  48. The New York Times. Election 2008, On the Issue: Energy. Available online: http://elections.nytimes.com/2008/president/issues/energy.html (assessed on 13 August 2016).
  49. PolitiFact. Promises about Energy on the Obameter. Available online: http://www.politifact.com/truth-o-meter/promises/obameter/subjects/energy/ (assessed on 13 August 2016).
  50. Bresswein, K. Presidential Race 2012: Barak Obama and Mitt Romney Energy Policies Boken Down. 2012. Available online: http://www.lehighvalleylive.com/elections/index.ssf/2012/10/2012_barack_obama_mitt_romney.html (assessed on 13 August 2016).
Figure 1. The OLS (Ordinal Least Squares) projection of solar PV (photovoltaics) used in electricity generation.
Energies 09 01000 g001
Figure 2. OLS projection of renewable and total energy used in electricity generation.
Energies 09 01000 g002
Figure 3. Renewable electricity percentage.
Energies 09 01000 g003
Figure 4. Trends of partisan difference on energy policy.
Energies 09 01000 g004
Table 1. LCV (League of Conservative Voting) national environmental scores of Congress.
YearSenateHouse
RepublicanDemocratRepublicanDemocrat
20008.3481.0713.6877.05
20047.7283.3111.2987.16
200822.6088.4016.6389.42
201213.9388.309.8381.74
201317.2690.185.6086.45
20149.3372.454.2687.07
20155.2691.813.4790.62

