Article

Energy Optimization and Fuel Economy Investigation of a Series Hybrid Electric Vehicle Integrated with Diesel/RCCI Engines

Mechanical Engineering-Engineering Mechanics Department, Michigan Technological University, Houghton, MI 49931, USA
*
Author to whom correspondence should be addressed.
Energies 2016, 9(12), 1020; https://doi.org/10.3390/en9121020
Submission received: 26 September 2016 / Revised: 14 November 2016 / Accepted: 24 November 2016 / Published: 4 December 2016
(This article belongs to the Special Issue Internal Combustion Engines 2017)

Abstract

:
Among different types of low temperature combustion (LTC) regimes, eactively controlled compression ignition (RCCI) has received a lot of attention as a promising advanced combustion engine technology with high indicated thermal efficiency and low nitrogen oxides ( NO x ) and particulate matter (PM) emissions. In this study, an RCCI engine for the purpose of fuel economy investigation is incorporated in series hybrid electric vehicle (SHEV) architecture, which allows the engine to run completely in the narrow RCCI mode for common driving cycles. Three different types of energy management control (EMC) strategies are designed and implemented to achieve the best fuel economy. The EMC strategies encompass rule-based control (RBC), offline, and online optimal controllers, including dynamic programing (DP) and model predictive control (MPC), respectively. The simulation results show a 13.1% to 14.2% fuel economy saving by using an RCCI engine over a modern spark ignition (SI) engine in SHEV for different driving cycles. This fuel economy saving is reduced to 3% in comparison with a modern compression ignition (CI) engine, while NO x emissions are significantly lower. Simulation results show that the RCCI engine offers more fuel economy improvement in more aggressive driving cycles (e.g., US06), compared to less aggressive driving cycles (e.g., UDDS). In addition, the MPC results show that sub-optimal fuel economy is achieved by predicting the vehicle speed profile for a time horizon of 70 s.

1. Introduction

Two-thirds of the oil consumption in the world is currently used in the transportation sector and half of that goes to passenger cars and light trucks [1]. Prevalent consumption of the petroleum-based fuels leads to high greenhouse gas (GHG) emissions. The transportation sector in the U.S. and Europe accounts for around 25% of the total GHG emissions. In the U.S., the goal is to decrease the transportation GHG by 35% by 2025 [2] and in Europe the goal is to cut the transportation GHG by 67% by 2050 [3]. In this context, automakers must reduce the GHG emissions by introducing advanced fuel-efficient technologies and also by using alternative fuels. low temperature combustion (LTC) engines include a family of internal combustion engines (ICEs) technologies, including premixed charge compression ignition (PCCI), Homogeneous Charge compression ignition (HCCI), and reactivity controlled compression ignition (RCCI) engines, which offer low engine-out NO x and low soot emissions [4], and peak net indicated thermal efficiency as high as 53% [5]. Moreover, improvement in ICE fuel efficiency has the largest potential in improving hybrid electric vehicle (HEV) fuel economy improvement and reducing GHG emissions, compared to enhancement in other HEV component efficiency [6]. Thus, integrating fuel-efficient LTC engines in HEVs has the potential to improve the vehicle fuel economy and decrease the GHG emissions.
However, utilizing the LTC engines in vehicles faces two major challenges: (i) limited engine operating range; and (ii) control complexity in mode transitions (e.g., SI ↔ LTC, CI ↔ LTC). To tackle these two challenges, this paper investigates the integration of an LTC engine with a series hybrid electric vehicle (HEV) by taking advantage of decoupling the ICE from the drivetrain. This allows the LTC engine to operate in a narrow operating range, removes the engine mode transients, and simplifies the LTC engine control. In addition, SHEVs are already available on the market, such as the Chevrolet Volt, Fisker Karma, and BMWi3.
Another important factor in improving the fuel economy of HEV powertrains is developing optimal energy management control (EMC) strategies to maximize fuel saving. 
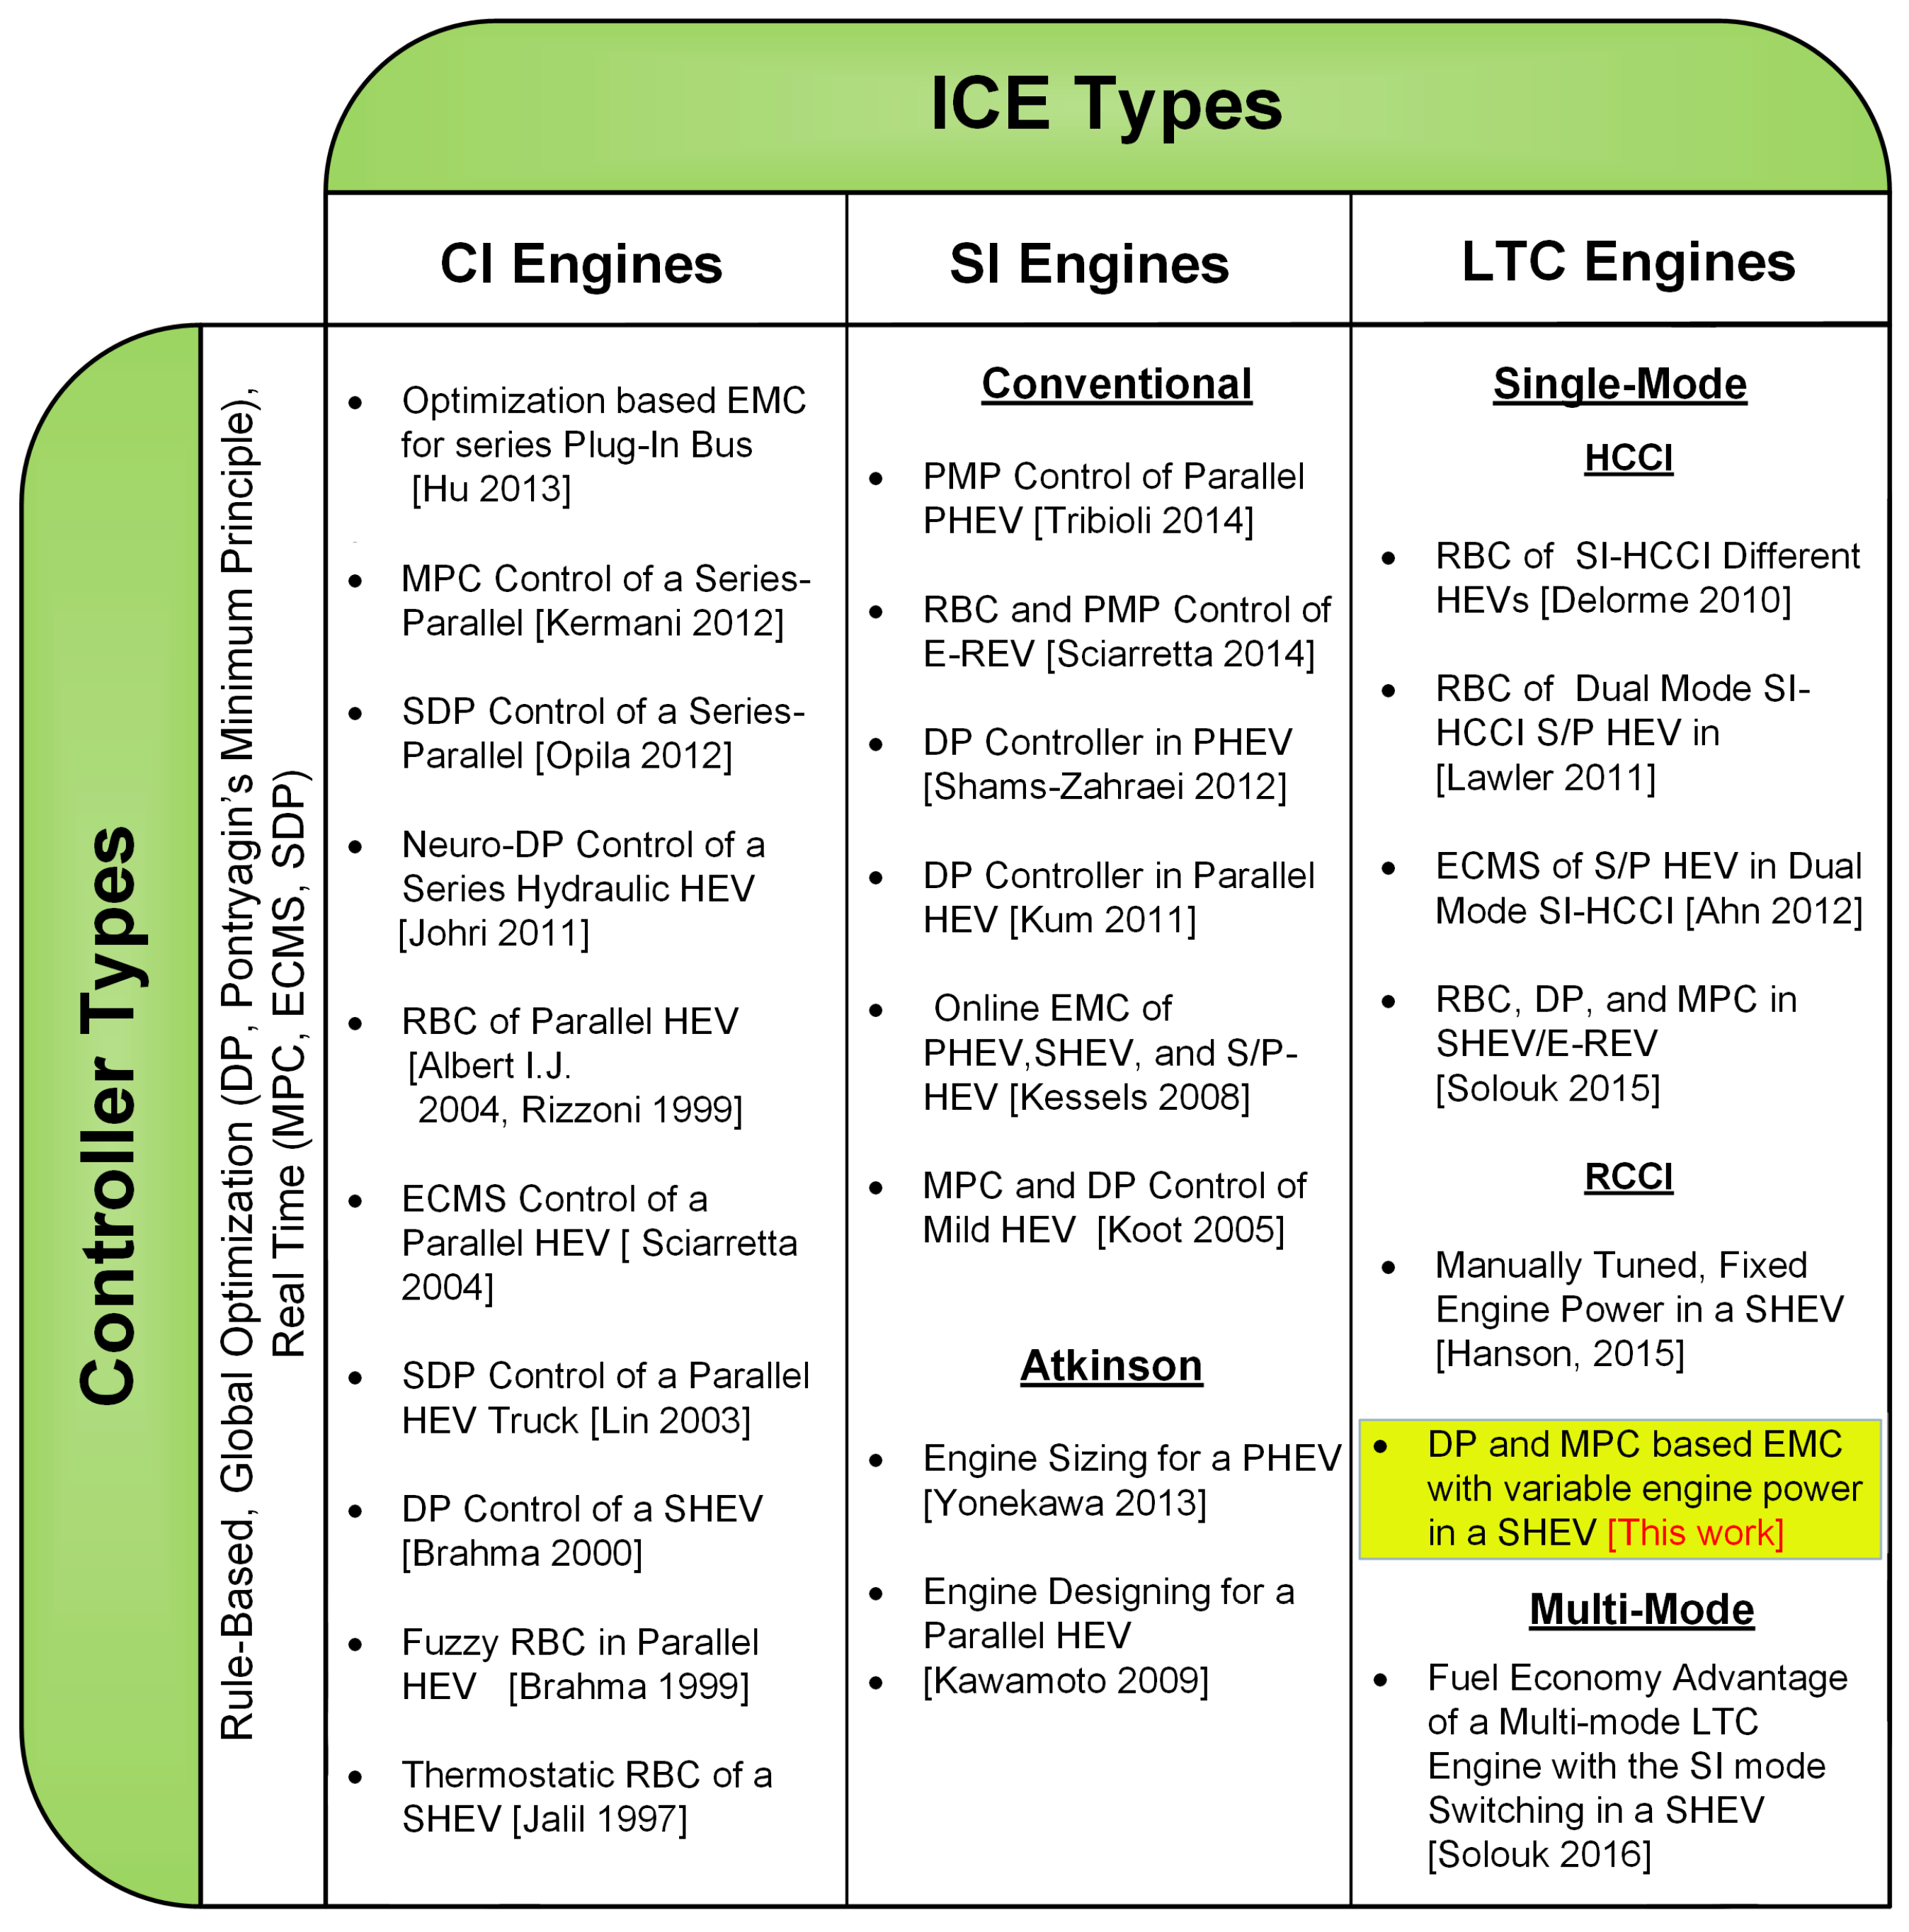
Figure 1 lists the major EMC approaches in HEVs. These include (1) a rule-based controller (RBC) such as fuzzy [7] and on–off [8] strategies. These strategies are implementable in real-time applications due to their robustness and low computational cost. However, the RBC strategies do not offer the best HEV fuel saving [9,10] due to their offline design; (2) Global optimization strategies such as pontryagin minimum principle (PMP) [11,12,13] and dynamic programming (DP) [14,15,16,17]. These strategies require the complete information of the driving cycle to determine the optimum EMC. While these global optimization strategies cannot be applied in real-time, the solution from these strategies can be used as a platform to find the ultimate fuel saving for evaluating other EMC strategies [9]; (3) Real-time optimization controllers such as stochastic dynamic programming (SDP) [18,19], equivalent consumption minimization strategy (ECMS) [20,21,22], and model predictive controllers (MPC) [23,24,25]. These sub-optimal EMC strategies can be implemented in real-time.
Prior HEV studies are divided into three groups according to the ICE type (Figure 1). In the first group, CI engines have been used in different HEV architectures [8,14,18,20,23,26,27,28]. The CI engines have been mostly used in sport utility vehicles (SUVs), trucks, and buses [7,18,27,28,29]. In the second group, SI engines have been used in HEV [11,12,30,31]. Recently, SI engines with Atkinson cycle have become more popular in the market (e.g., Ford C-Max, Honda Accord PHEV, Lexus RX 450h, and Toyota Prius). In [32], an Atkinson cycle SI engine was used by Toyota R&D group to increase the fuel economy benefit of HEVs. In another study [33], a Honda Accord PHEV was redesigned based on the Atkinson cycle and 10% lower fuel consumption was reported compared to the SI engine.
Few studies are found in the literature that investigated integrating LTC engines with HEVs. Among different types of LTC engines, HCCI was the first type explored in hybrid electric powertrains. In the first study at Argonne National Laboratory in U.S., the effects of using a dual mode SI-HCCI engine in different vehicle electrification levels were analyzed [34]. Their simulation results predicted from 6% to 15% fuel consumption reduction, depending on powertrain configurations and driving cycles. In another study [35], fuel economy improvement of a HCCI engine versus a SI engine for both mild and medium parallel HEVs was investigated. The authors reported a range from 17% to 35% fuel economy improvement with using a dual-mode SI-HCCI in comparison to a conventional SI non-hybrid powertrain. In both studies [34,35], a dual mode (SI-HCCI) engine was used with a rule-based EMC. Another study [21] was conducted to investigate the effect of utilizing a dual mode SI-HCCI engine on a power-split HEV acceleration performance. The authors quantified the trade-off between the vehicle fuel economy and the vehicle performance. In [36], we carried out the first study on utilizing a pure HCCI mode engine in a series hybrid powertrain and we found a 12.6% improvement in fuel economy in comparison with a SHEV running with a SI engine. In our next study [37], we investigated the impact of engine startup fuel penalty on SHEV HCCI-based powertrains. Our results show that the HCCI fuel economy improvement compared to the SI engine is independent of the engine start/up fuel penalty amount.
RCCI is the second type of LTC engine that has been recently investigated for HEVs. The study in [38] is the only study available in the literature for an RCCI-based HEV. In [
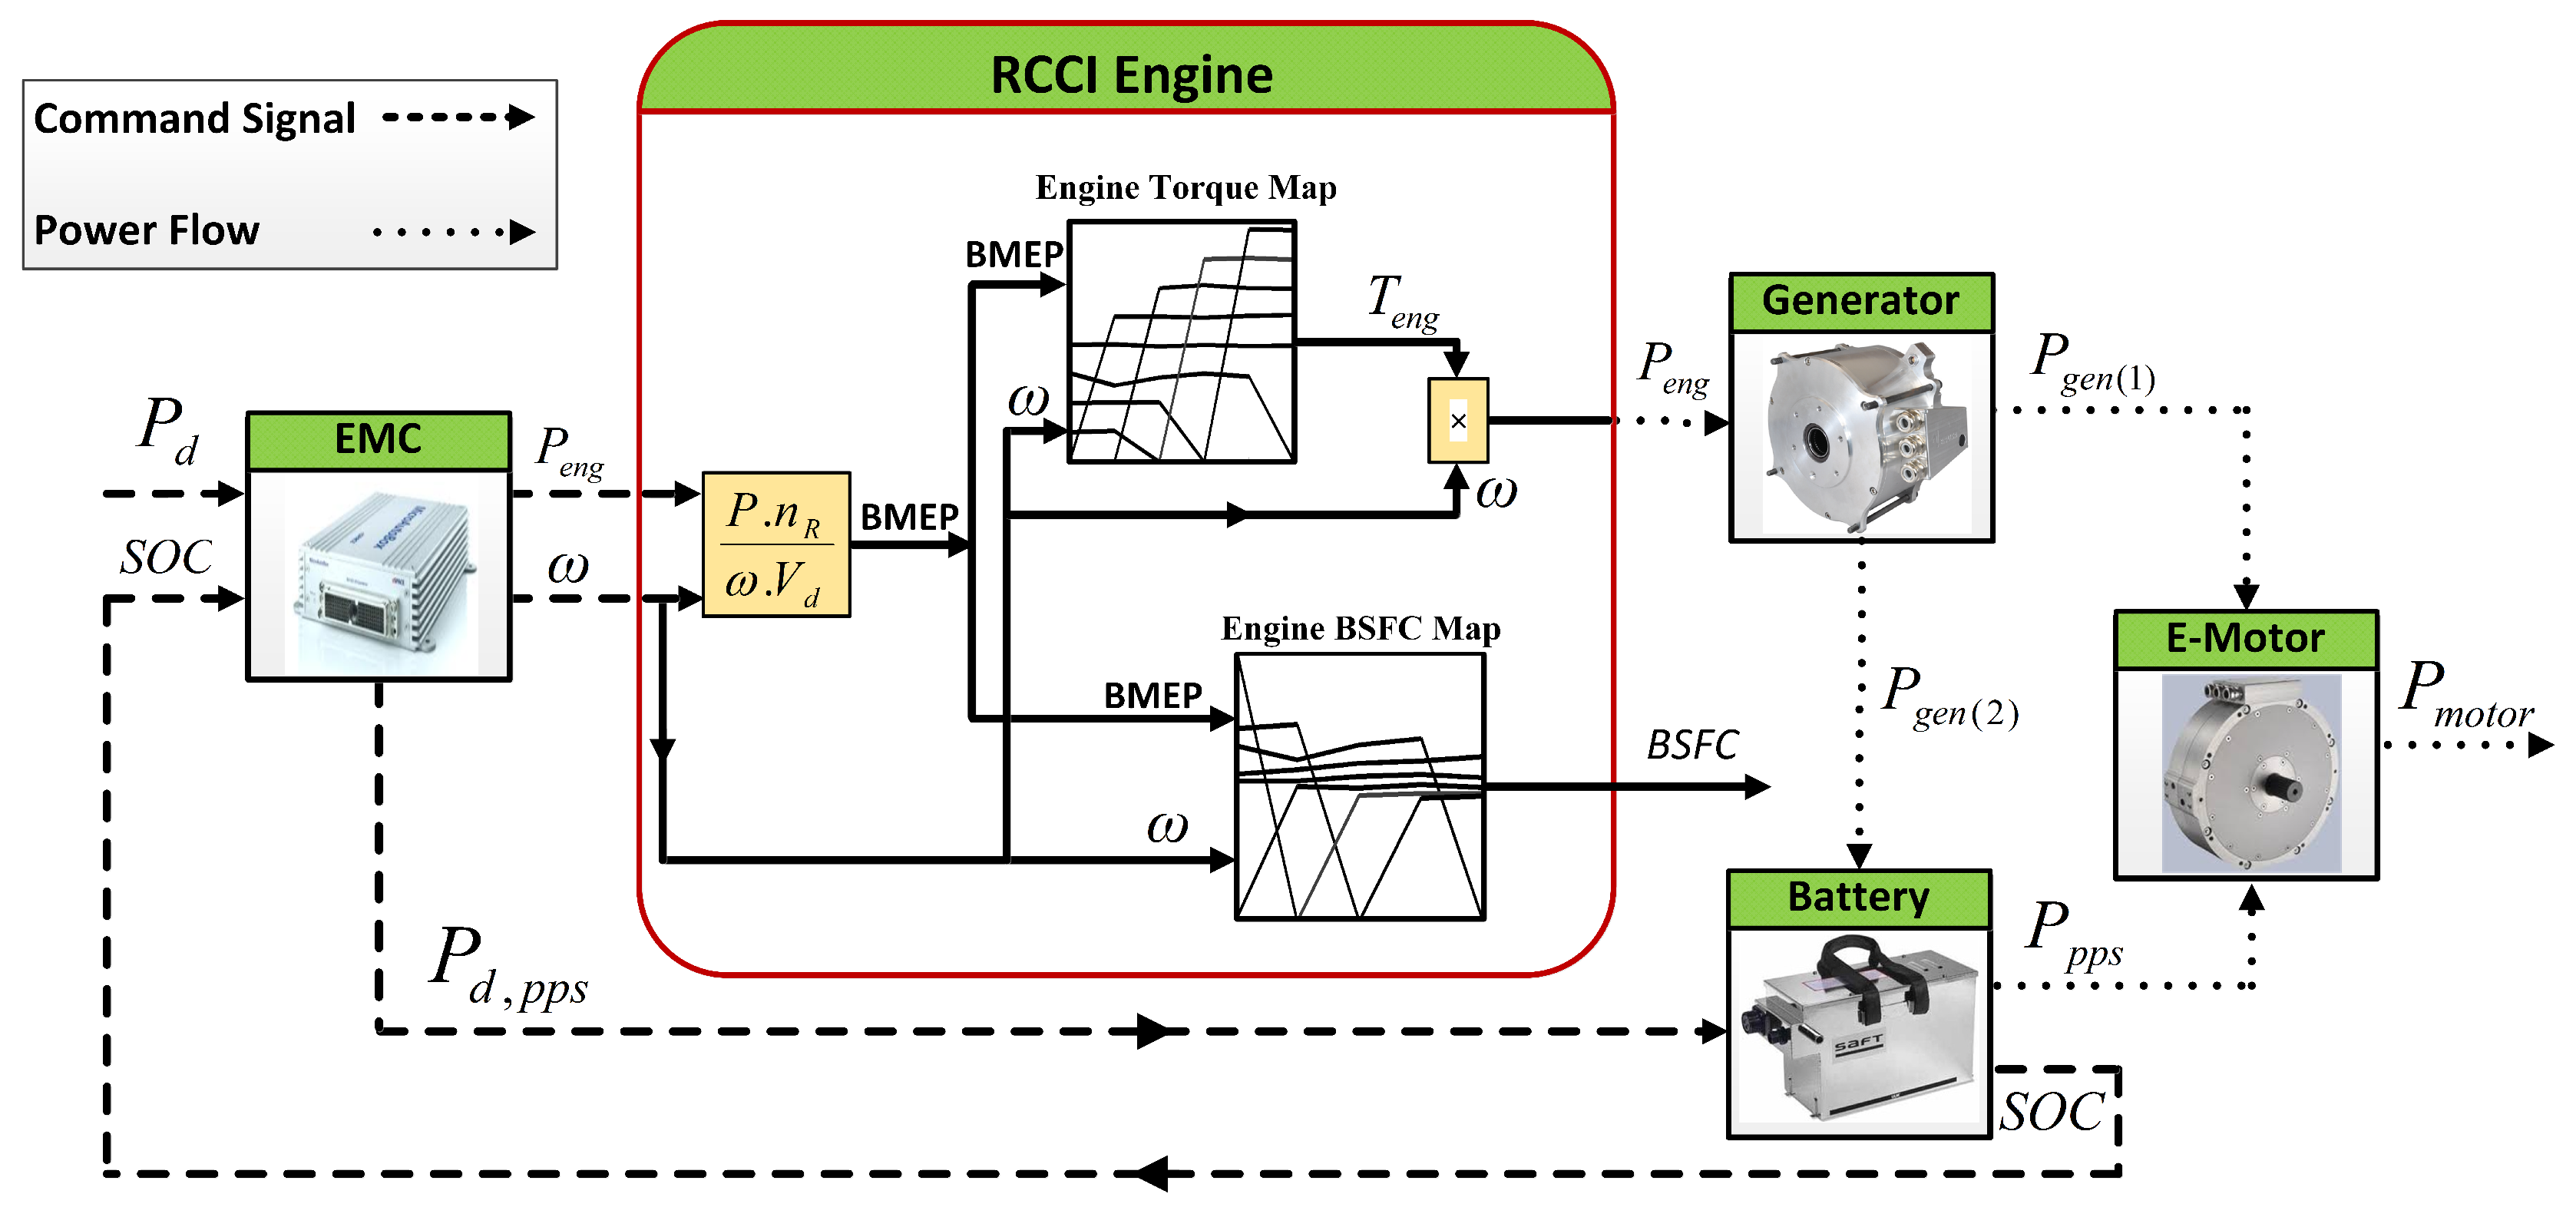
38], researchers at the University of Wisconsin-Madison and Oak Ridge National Laboratory in U.S. used an RCCI engine in a series hybrid electric powertrain. The authors tested the vehicle for the US environmental protection agency (EPA) highway fuel economy test (HWFET) procedure to measure the vehicle fuel economy and emissions. Based on simulation results, the authors predicted that a series-parallel RCCI-HEV configuration will lead to a 12% fuel economy improvement for the Chevrolet Volt, which currently uses a SI engine. The study in [38] included preliminary results and no model-based EMC strategy was used for optimizing the energy balance between the battery and ICE energy sources. In addition, the results were presented only for the HWFET driving cycle. The EMC type and driving cycles will affect the RCCI-HEV performance and fuel saving results, as will be shown in this paper.
Moreover, in [39] we carried out the first study on integrating a multi-mode LTC engine with a SHEV architecture. The multi-mode LTC engine was able to switch between the HCCI, RCCI and conventional SI modes by incorporating a fuel penalty. Our results show a 9% to 13.1% fuel economy improvement, compared to an identical SHEV platform running with a single-mode SI engine.
To the best of the authors’ knowledge, this is the first study undertaken to investigate the fuel economy benefit of integrating an RCCI engine in SHEV with advanced EMCs. The contribution from this study is threefold. First, it investigates the ultimate fuel saving of a dedicated RCCI-mode engine in SHEV configuration. Second, it investigates the effect of EMCs on the potential of fuel economy improvement for SHEV using an RCCI engine. Third, it studies the impact of driving cycle and also the battery initial SOC on the fuel economy of the RCCI-based SHEV.
This paper is organized as follows. In Section 2, the developed HEV model is presented and the main components of the HEV model are described. Section 3 explains three different EMC strategies, including on–off RBC, global optimization DP and MPC. In Section 4, the optimum number of engine operating points are selected with regards to the fuel economy. The SHEV results are presented in Section 5. Finally, Section 6 summarizes all findings from this paper.

2. SHEV Model Description

A SHEV with specifications listed in Table 1 is modeled in this section.
The SHEV model encompasses different submodels including the RCCI engine, longitudinal vehicle dynamics (LVD), E-motor, and battery. The model is a forward-in-power HEV model developed in Matlab®/Simulink to evaluate the EMC strategies and fuel economy benefits. Using the LVD model, the vehicle speed profile is calculated based on the available supplied traction torque by the E-motor after subtracting for drag and rolling resistance forces. The supervisory controller specifies the battery required power and the engine power based on the battery state of charge (SOC), and the driver power demand. Figure 2 shows the high level schematic of the model. The description for sizing and selection of HEV electrical components are found in [37]. The SHEV model is briefly explained as follows.

2.1. IC Engines

Three different ICEs will be studied as part of the SHEV. These ICEs include RCCI, CI (diesel), and SI (gasoline) engines. The RCCI engine used in this work is based on a modified GM Z19DTH diesel engine. The diesel engine was converted to an RCCI engine by a group of scholars from the University of Wisconsin-Madison and Oak Ridge National Laboratory [40]. The RCCI engine has a new piston design and its compression ratio is reduced from 17:1 to 15:1 [40]. Table 2 lists the RCCI engine specifications and Figure 3 shows the RCCI engine Brake Specific Fuel Consumption (BSFC) map using the data from [40].
The engine speed range is from 1000 rpm to 3500 rpm. The BSFC map of the engine (Figure 3) was created using the engine brake thermal efficiency (BTE) data from [40] and lower heating value (LHV) of fuels. The RCCI engine model is designed such that it takes the required brake mean effective pressure (BMEP) and the required engine power and then calculates the engine fuel consumption.
For the comparative study, the BSFC model of a CI engine and a SI engine are included in the HEV model. The same base engine is used for both RCCI and CI (diesel) modes. Thus, the original GM Z19DTH diesel engine data from [40] is used for the CI engine model. Figure 4 shows the BSFC map for the CI engine. For a fair comparison, the SI engine is selected such that it has optimum power rating for the HEV size in this study. To this end, a GM A14XFL SI (gasoline) engine from a mid-size HEV on the market is chosen.
Figure 5 shows the SI engine’s BSFC map based on the data from [41]. This figure demonstrates that the selected engine operating points (i.e., points # 1, 2, 3) are located in the lowest BSFC region of the SI engine.

2.2. Longitudinal Vehicle Dynamics

The LVD model calculates the vehicle actual speed V based on the vehicle traction and resistance forces and the dynamics associated with the vehicle. The following equation shows the governing dynamic model used for the LVD model:
M d V d t = F t r a c t i o n F d r a g F r o l l F g r a v i t y
where M is the vehicle total mass; F g r a v i t y , F d r a g , and F r o l l are gravity force, aerodynamic drag force, and rolling resistance force, respectively. The resistive forces are calculated from the following equations:
F g r a v i t y = M g sin θ
F d r a g = 1 2 ρ A C d V 2
F r o l l = M g f r ( 1 + V 100 )
where θ is the road slope, C d is the vehicle drag coefficient, ρ is the air density, A is the vehicle frontal area, and f r is the rolling resistance coefficient. The main parameters of the LVD model are listed in Table 1.

2.3. E-Motor Model

A single gear ratio 75 kW E-motor [42] is utilized in this study. The E-motor requested power is calculated based on the supervisory controller’s demanded power as the input to a map-based E-motor model. The E-motor model includes an efficiency map versus power request and rotational speed up to the maximum of 7500 rpm. Based on the E-motor operating point, the E-motor actual generated power is obtained from the efficiency map. Then, the E-motor traction torque is calculated using the electrical available power and the motor speed. The available electrical power consists of the E-motor generated power and the battery power by including a constant auxiliary load used for the entire driving cycle [43]. The E-motor efficiency map covers both traction ( η t r a c t i o n ) and regenerative braking ( η b r a k i n g ) modes. Equation (5) shows the torque relation of the E-motor:
T m o t o r = P a v a i l a b l e η t r a c t i o n ω m o t o r ( a ) traction P a v a i l a b l e ω m o t o r η b r a k i n g ( b ) regenerative braking
where, P a v a i l a b l e refers to the available electrical power in the battery. Consequently, the vehicle traction force ( F t r a c t i o n ) and the E-motor speed ( ω m o t o r ) are calculated by:
F t r a c t i o n = T m o t o r R w G r
ω m o t o r = V R w G r
where, R w is radius of the wheels and G r is the final gear ratio between the E-motor and the driveline. The G r is designed to match the vehicle maximum designed speed with the E-motor maximum speed (i.e., the maximum vehicle speed is 100 mph and the maximum E-motor speed is 7500 rpm). The actual vehicle speed is obtained from the LVD model. In addition, the E-motor was sized and selected based on the required traction torque and power for the vehicle gradeability and acceleration performances [37]. Table 1 lists the main specifications of the E-motor.

2.4. Battery Model

Based on the E-motor operating point, the E-motor actual generated power is obtained from the efficiency map. The supervisory controller specifies the battery required power, as shown in Figure 2. A battery energy capacity and power is sized to meet the SHEV design requirements. The battery supplies 40 miles AER, which is a common range for SHEVs such as 2015 Cadillac ELR. A battery model is employed to estimate the battery SOC and the battery voltage. The battery model is from [44] and it is widely used in previous HEV and EV investigations. This model extracts a nonlinear model (experimental data [45]) for the battery characteristic discharge curve. Finally, the S O C is calculated by:
S O C = 1 i d t Q
where i is the battery current and Q is the battery nominal capacity. More discussions on the battery sizing and models are available in [37].

2.5. Vehicle Acceleration and Braking Performance

The HEV model is implemented in Matlab®/Simulink. The vehicle acceleration performance was designed to reach 60 mph in 12.2 s, which is similar to a common mid-size HEV on the market [46]. The vehicle braking performance was designed so as to be able to stop from 60 mph in less than 53.4 m, similar to that in [46].

2.6. Model Validation

The BSFC maps of the RCCI and CI engines are developed experimentally in [40] and the experimental data are used in this study. The models for two other HEV major components, including the E-motor and battery were validated against experimental data [37]. The selected E-motor is UQM PowerPhase 75 and the E-motor efficiency model was validated against the manufacturer’s experimental data [42] with RMSE less than 1.5% [37]. Moreover, the battery model was validated against the experimental data from SAFT VL7P Li-ion battery [45] with the RMSE of 0.17 V [37].

3. Energy Management Controller (EMC) Design

The EMC strategies in this work aim to (i) keep the hybrid powertrain to operate in the charge sustaining (CS) mode; (ii) fulfill the driver power demand; and (iii) maximize the powertrain fuel saving [47]. Here, three types of EMC strategies are designed for the SHEV-RCCI powertrain. These strategies include on–off RBC, DP, and MPC. A desired SOC window of 0.55 S O C 0.9 is used in all of the three EMCs.

3.1. EMC Type I: RBC

In on–off RBC, the EMC rules are designed heuristically without driving cycle information. The battery SOC is the only input to the control unit, which forces the battery to keep the SOC in the desired window (i.e., 0.55 S O C 0.9 ), by controlling the engine on/off status. The on–off RBCs cannot adapt their rules with changing driving cycles. This results in non-optimal efficiency for a wide operating range. Simple implementation for real-time EMC applications is the major advantage of on–off RBC strategies [48]. Here, a heuristic RBC is designed to keep the battery SOC within the desired window.

3.2. EMC Type II: Global Optimization—DP

In a SHEV, the engine power profile is determined by an optimization-based EMC while minimizing a cost function for fuel/energy consumption. If the driving cycle is known, meaning that the driver power request is known, then a global optimal solution can be found [48]. While this approach cannot be applied in real-time EMC applications, this method can provide an ideal baseline to assess different EMCs. In this work, the DP method is employed for structuring an optimization problem to find optimum strategies for minimizing a performance index. By doing the calculation backwards over the time horizon based on Bellman’s Principle of Optimality [49], DP searches for the best control action among all the possible actions offline in time by assuming the entire driving cycle information is available.
The engine requested power is the control variable ( u k ) and the battery SOC is the state variable in this formulation. The control variable is discretized by a time step of 1 s. An energy based performance index consisting of the fuel energy and the battery energy is formed in Equation (9):
J j ( t , u k ) = Δ E f j ( t , u k ) + α Δ E b j ( t , u k )
where, the index j represents the feasible transitions to the next time ( t + 1 ) and the index k is the control variable indicator. k is a finite number and its size is equal to the number of possible values for the digitized control variable. In this work k [ 1 , 2 , 3 , 4 ] , where k = 1 represents the engine off situation, and k = 2 , 3 , or 4 represents the engine’s three selected power levels (modes). Furthermore, Δ E f j ( t , u k ) and Δ E b j ( t , u k ) are the energy consumptions of the ICE path and the battery path respectively for the jth transition between two states. α is an equivalent factor to equate the electrical usage of the battery to virtual fuel consumption. α is a constant number and is sensitive to driving cycles. In this paper, α is specified offline to enforce the battery to operate in a charge-sustaining mode. Δ E f j ( t , u k ) and Δ E b j ( t , u k ) are calculated by the following equations:
Δ E f j ( t , u k ) = 1 2 P f p a t h ( t , u k ) η f p a t h ( t , u k ) + P f p a t h ( t + 1 , u k ) η f p a t h ( t + 1 , u k ) Δ t + N k j m f , s t a r t Q L H V
Δ E b j ( t , u k ) = 1 2 P b p a t h ( t , u k ) η b p a t h ( t , u k ) + P b p a t h ( t + 1 , u k ) η b p a t h ( t + 1 , u k ) Δ t
where, η f p a t h and η b p a t h represent the combined efficiency in the ICE path and the battery path for the transition between the kth states in the successive times. P b p a t h and P f p a t h are the battery power and the engine produced power, respectively. m f , s t a r t in Equation (10) is the fuel penalty for each engine start-up. The cost associated with the engine start-up is incorporated in Equation (10) by introducing the N k j constant which is equal to 1 when the engine is at start-up and it is equal to 0 during the rest of the engine operation. Q L H V is the gasoline fuel lower heating value. By finding the engine optimum requested power ( u k ) to fulfill the driver power request, the battery produced power is calculated according to the following constraint at each state:
P b p a t h ( t , u k ) = P r e q ( t , u k ) P f p a t h ( t , u k )
In the backward DP, the optimal cost-to-go from the current time (t) to the end of the driving cycle is defined as:
S * ( t , u k ) = min j [ J j ( t , u k ) + S * ( t + 1 , u k ) ]
where, S * ( t , u k ) is the optimal cost-to-go from the kth state at the current time t to the end of the driving cycle. S ( t + 1 , u k ) represents the optimal cost in the next time (i.e., t + 1 ) to the end of the driving cycle. At each time a state (k) which has the minimum cost among the different states as determined by the DP strategy as the optimal control variable. A nonlinear backward HEV model, which does not include the driver model, is used to increase flexibility for the real-time implementation of the optimal EMC model. This backward model assumes that the vehicle tracks exactly the driving cycle; thus, the vehicle power demand is directly calculated from the driving cycle. In addition, a high fidelity forward Simulink vehicle model is designed for assessing the EMC strategy and analyzing the HEV performance. The purpose for including DP results in this paper is to present the ultimate energy saving using the RCCI hybrid electric powertrain. The DP values serve as a benchmark for the comparison with RBC and MPC results with different time horizons.

3.3. EMC Type III: MPC

The MPC concept is deployed to form the EMC optimization problem on a moving receding horizon. Given that the vehicle speed can be predicted over a short time horizon (TH), the DP strategy is used over a short horizon to find a sequence of the sub-optimal control strategy. The MPC strategy is developed by assuming that the future driving cycle information over the TH is provided from the GPS data. The cost function (J) at the nth TH is shown in Equation (14). J is minimized over TH by selecting optimal ICE/generator power request.
J ( n ) = t n t n + T H ( E f p a t h + α . E b p a t h ) d t
subject to:
P e , m i n < P e < P e , m a x P m , m i n < P m < P m , m a x N e , m i n < N e < N e , m a x N m , m i n < N m < N m , m a x S O C m i n < S O C < S O C m a x S O C @ t = 0 = 0.8
where, the subscripts m a x and m i n denote maximum and minimum, respectively. The first term in Equation (14) refers to the fuel energy consumed by the ICE and the second term refers to the battery electrical energy consumed or recharged during the driving cycle. The subscripts e and m in Equation (15) denote engine and motor, respectively. The DP formulation in Section 3.2 is used over the TH to calculate the optimal ICE/generator power at time step n. A closed-loop MPC is designed to reject disturbances such as sudden changes in the estimated driving cycle data. However, this EMC strategy does not provide a globally optimal solution, but it can be used for real-time implementation. In the current formulation, the time domain is discretized into one-second intervals. The solutions consist of local optimum control signal at each time step.

4. Selection of Engine Operating Points

In SHEVs, the engine can operate independently of the vehicle speed and the wheel torque. Thus, the engine has the opportunity to work most of the time at high efficiency operating points and low engine-out emission region. In this section, the engine operating points are selected for three different constant power levels as low, mid, and high to fulfill the vehicle power requirements and also to guarantee low engine BSFC and low engine-out emissions. The low BSFC and low engine-out emission constraints are discussed in subsections A and B.
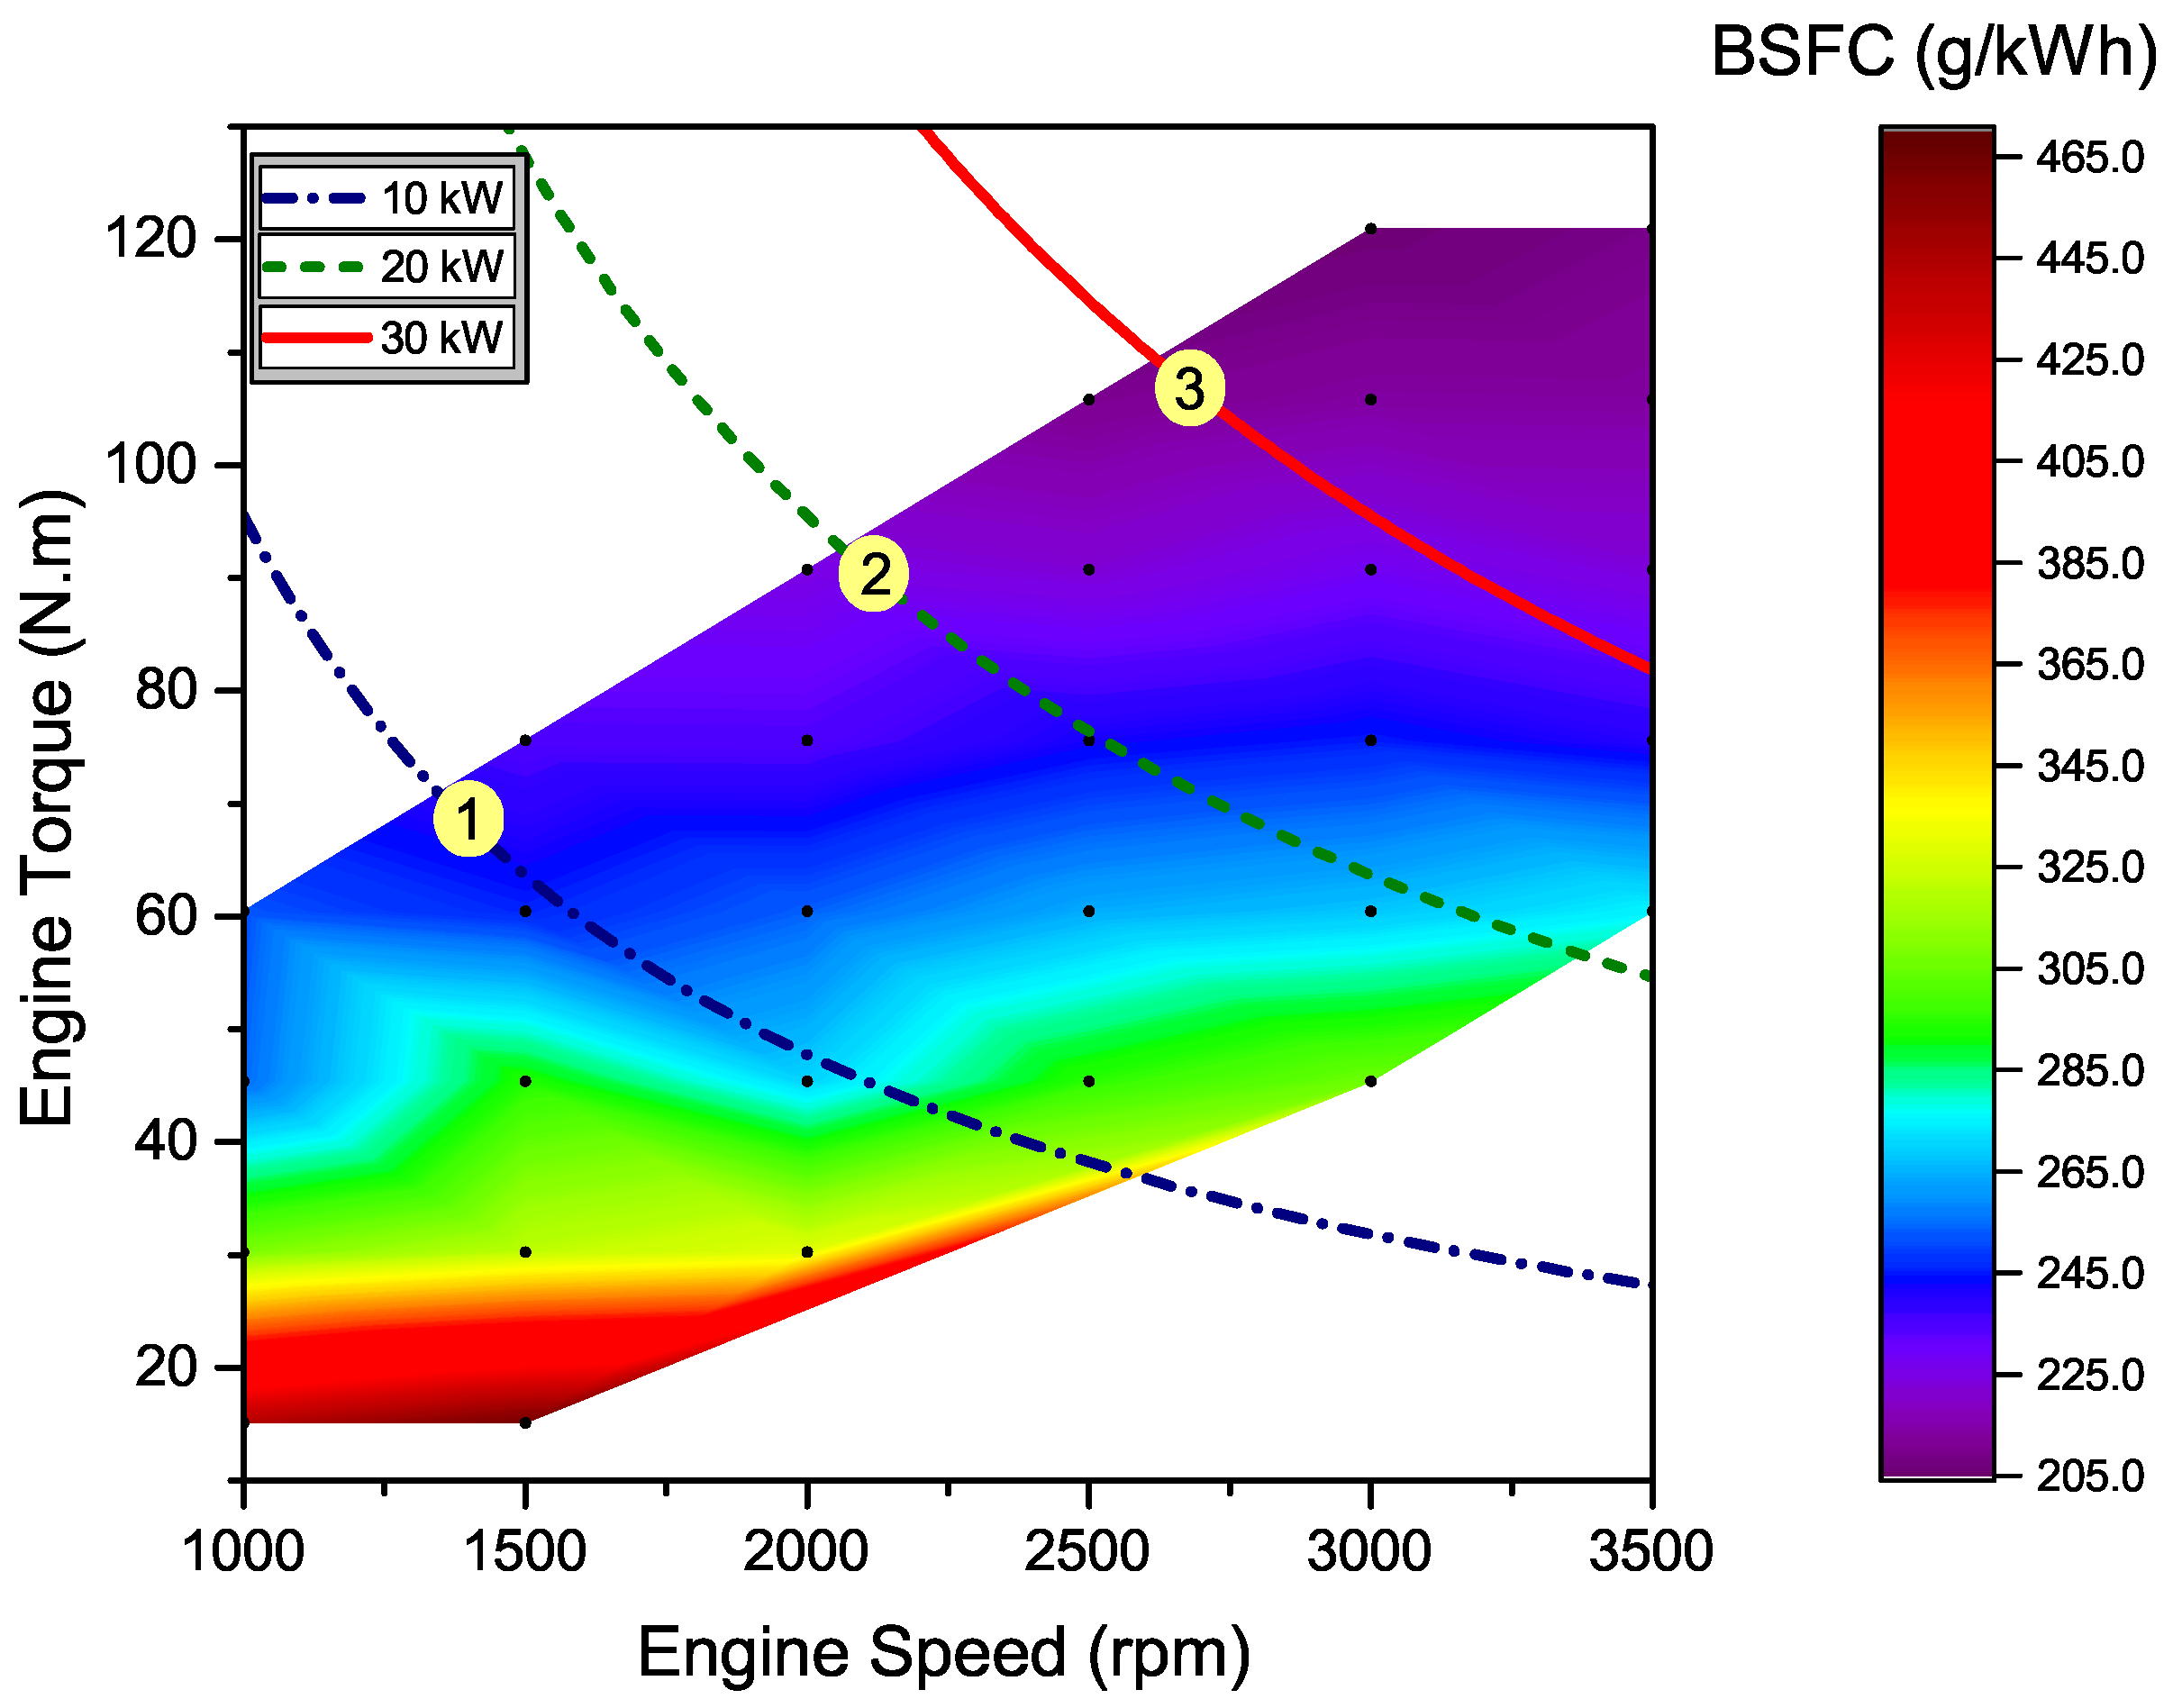
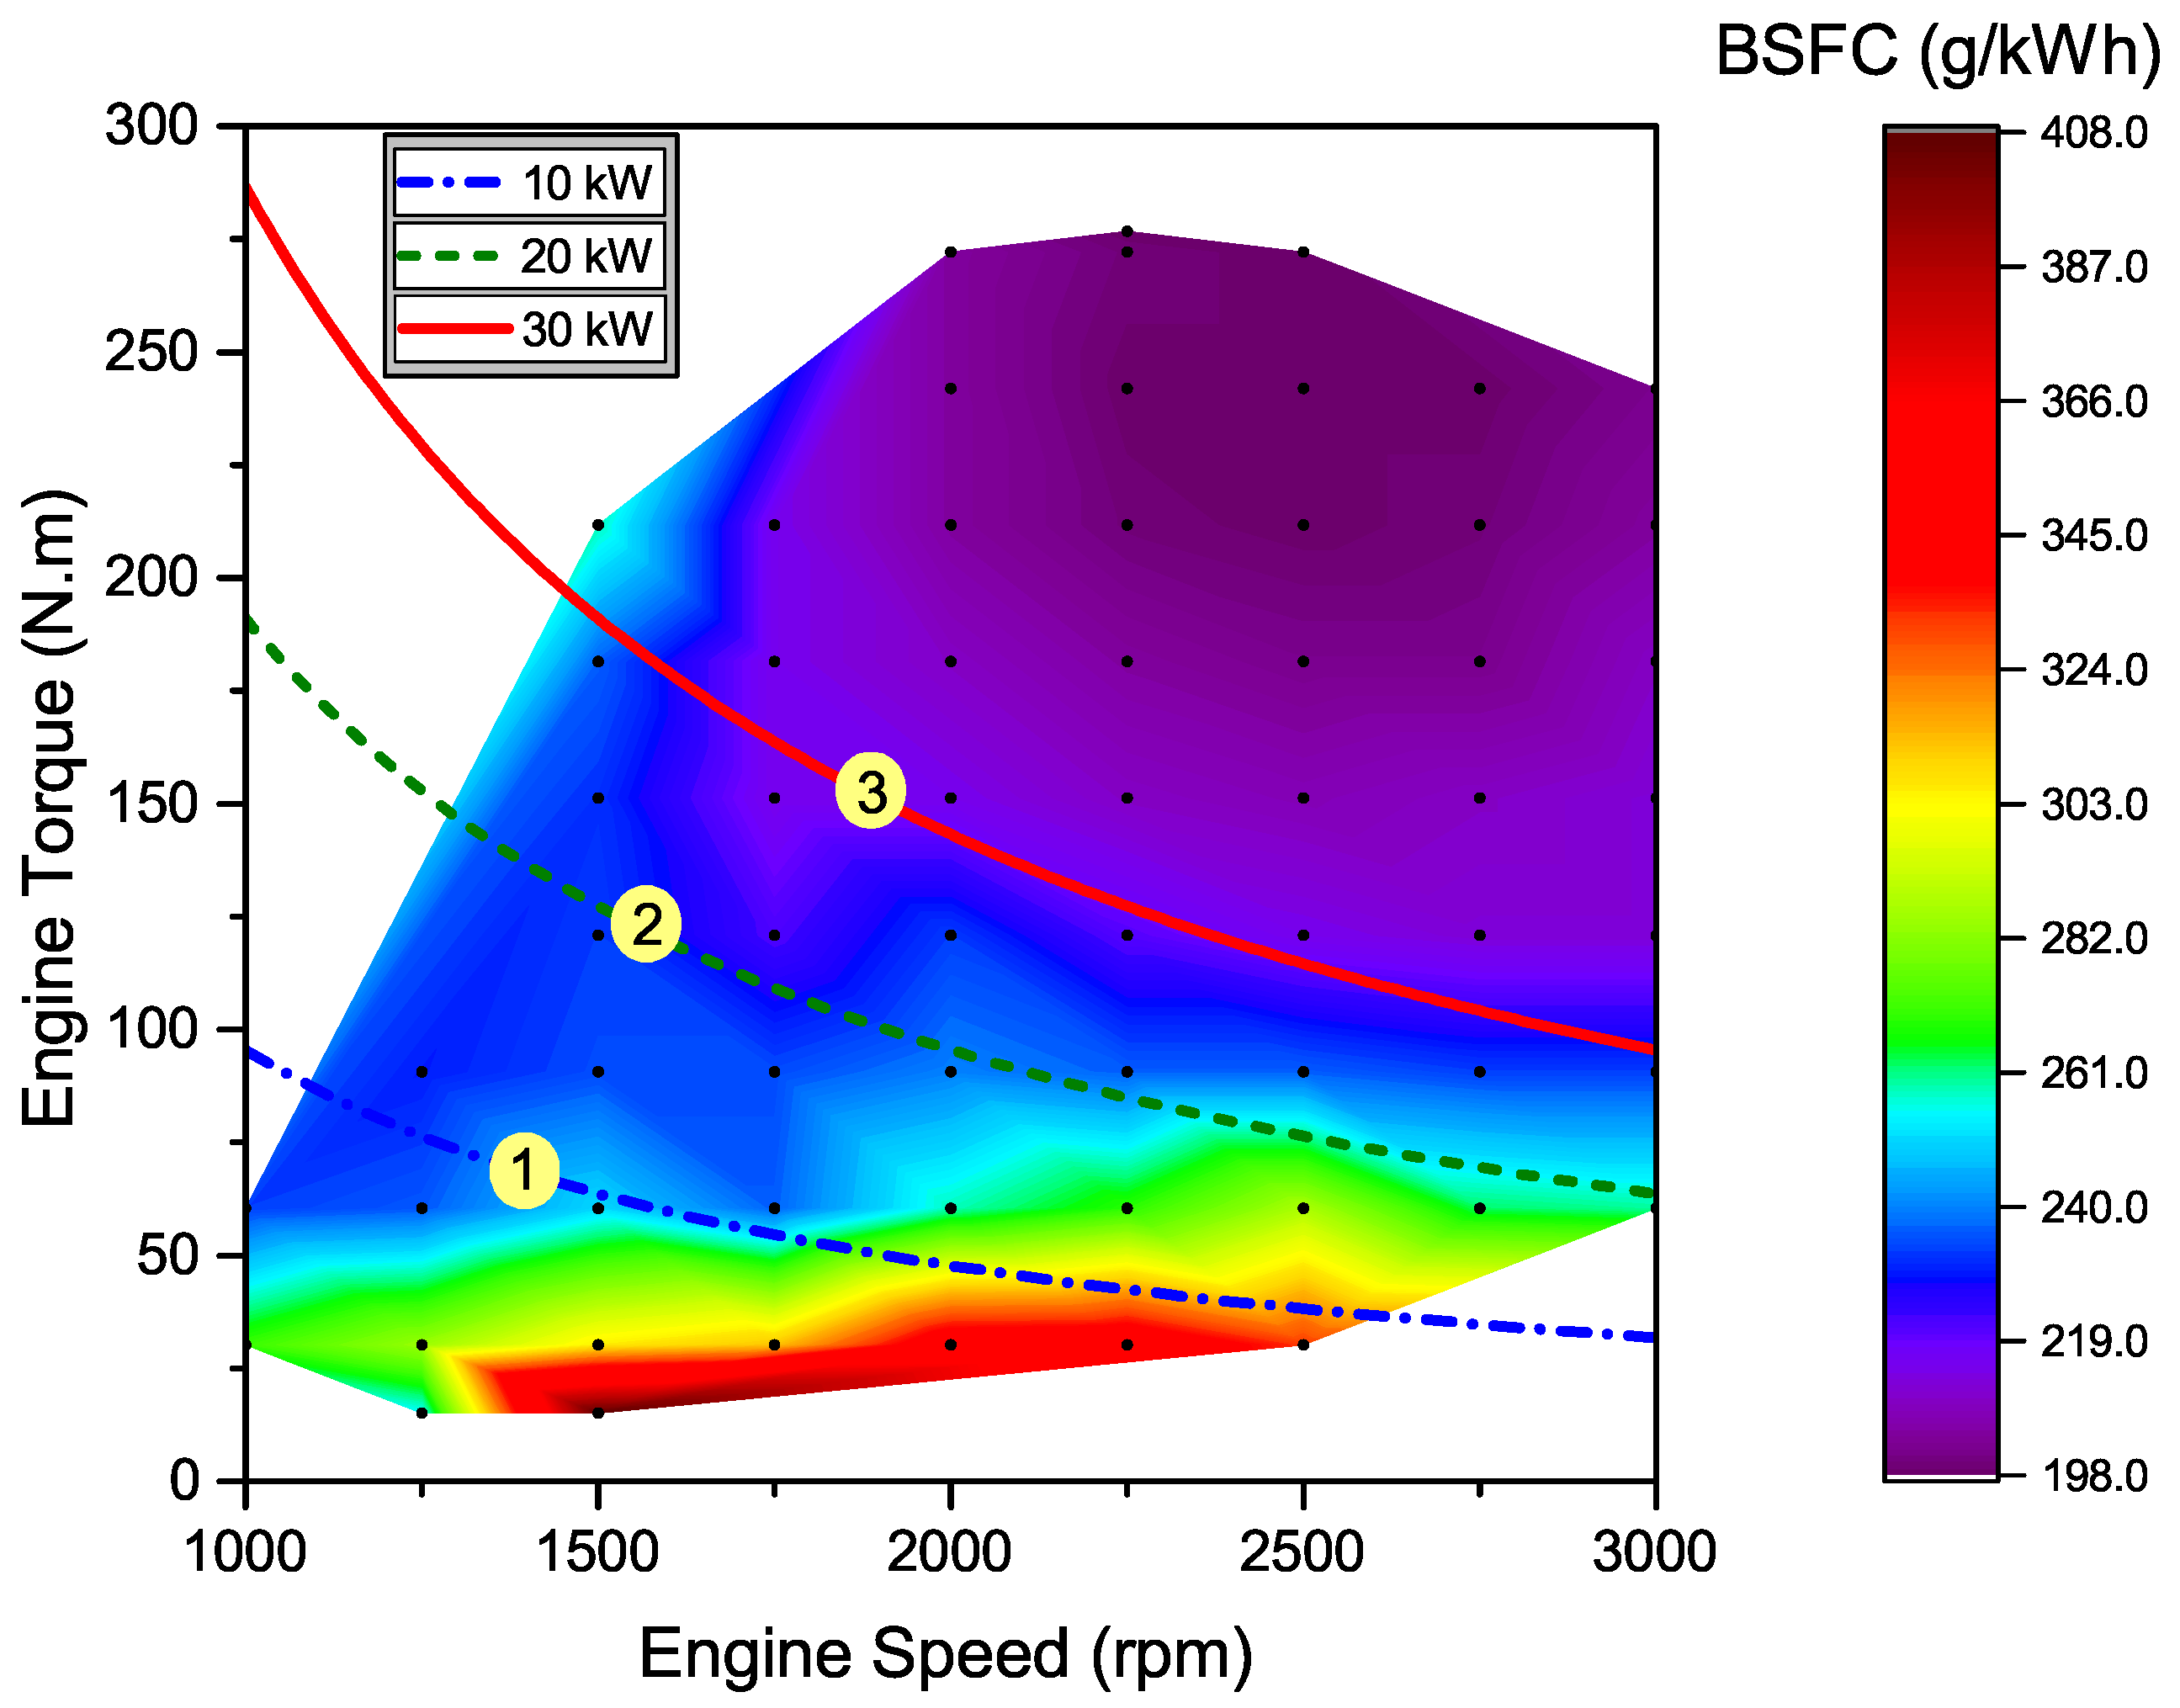
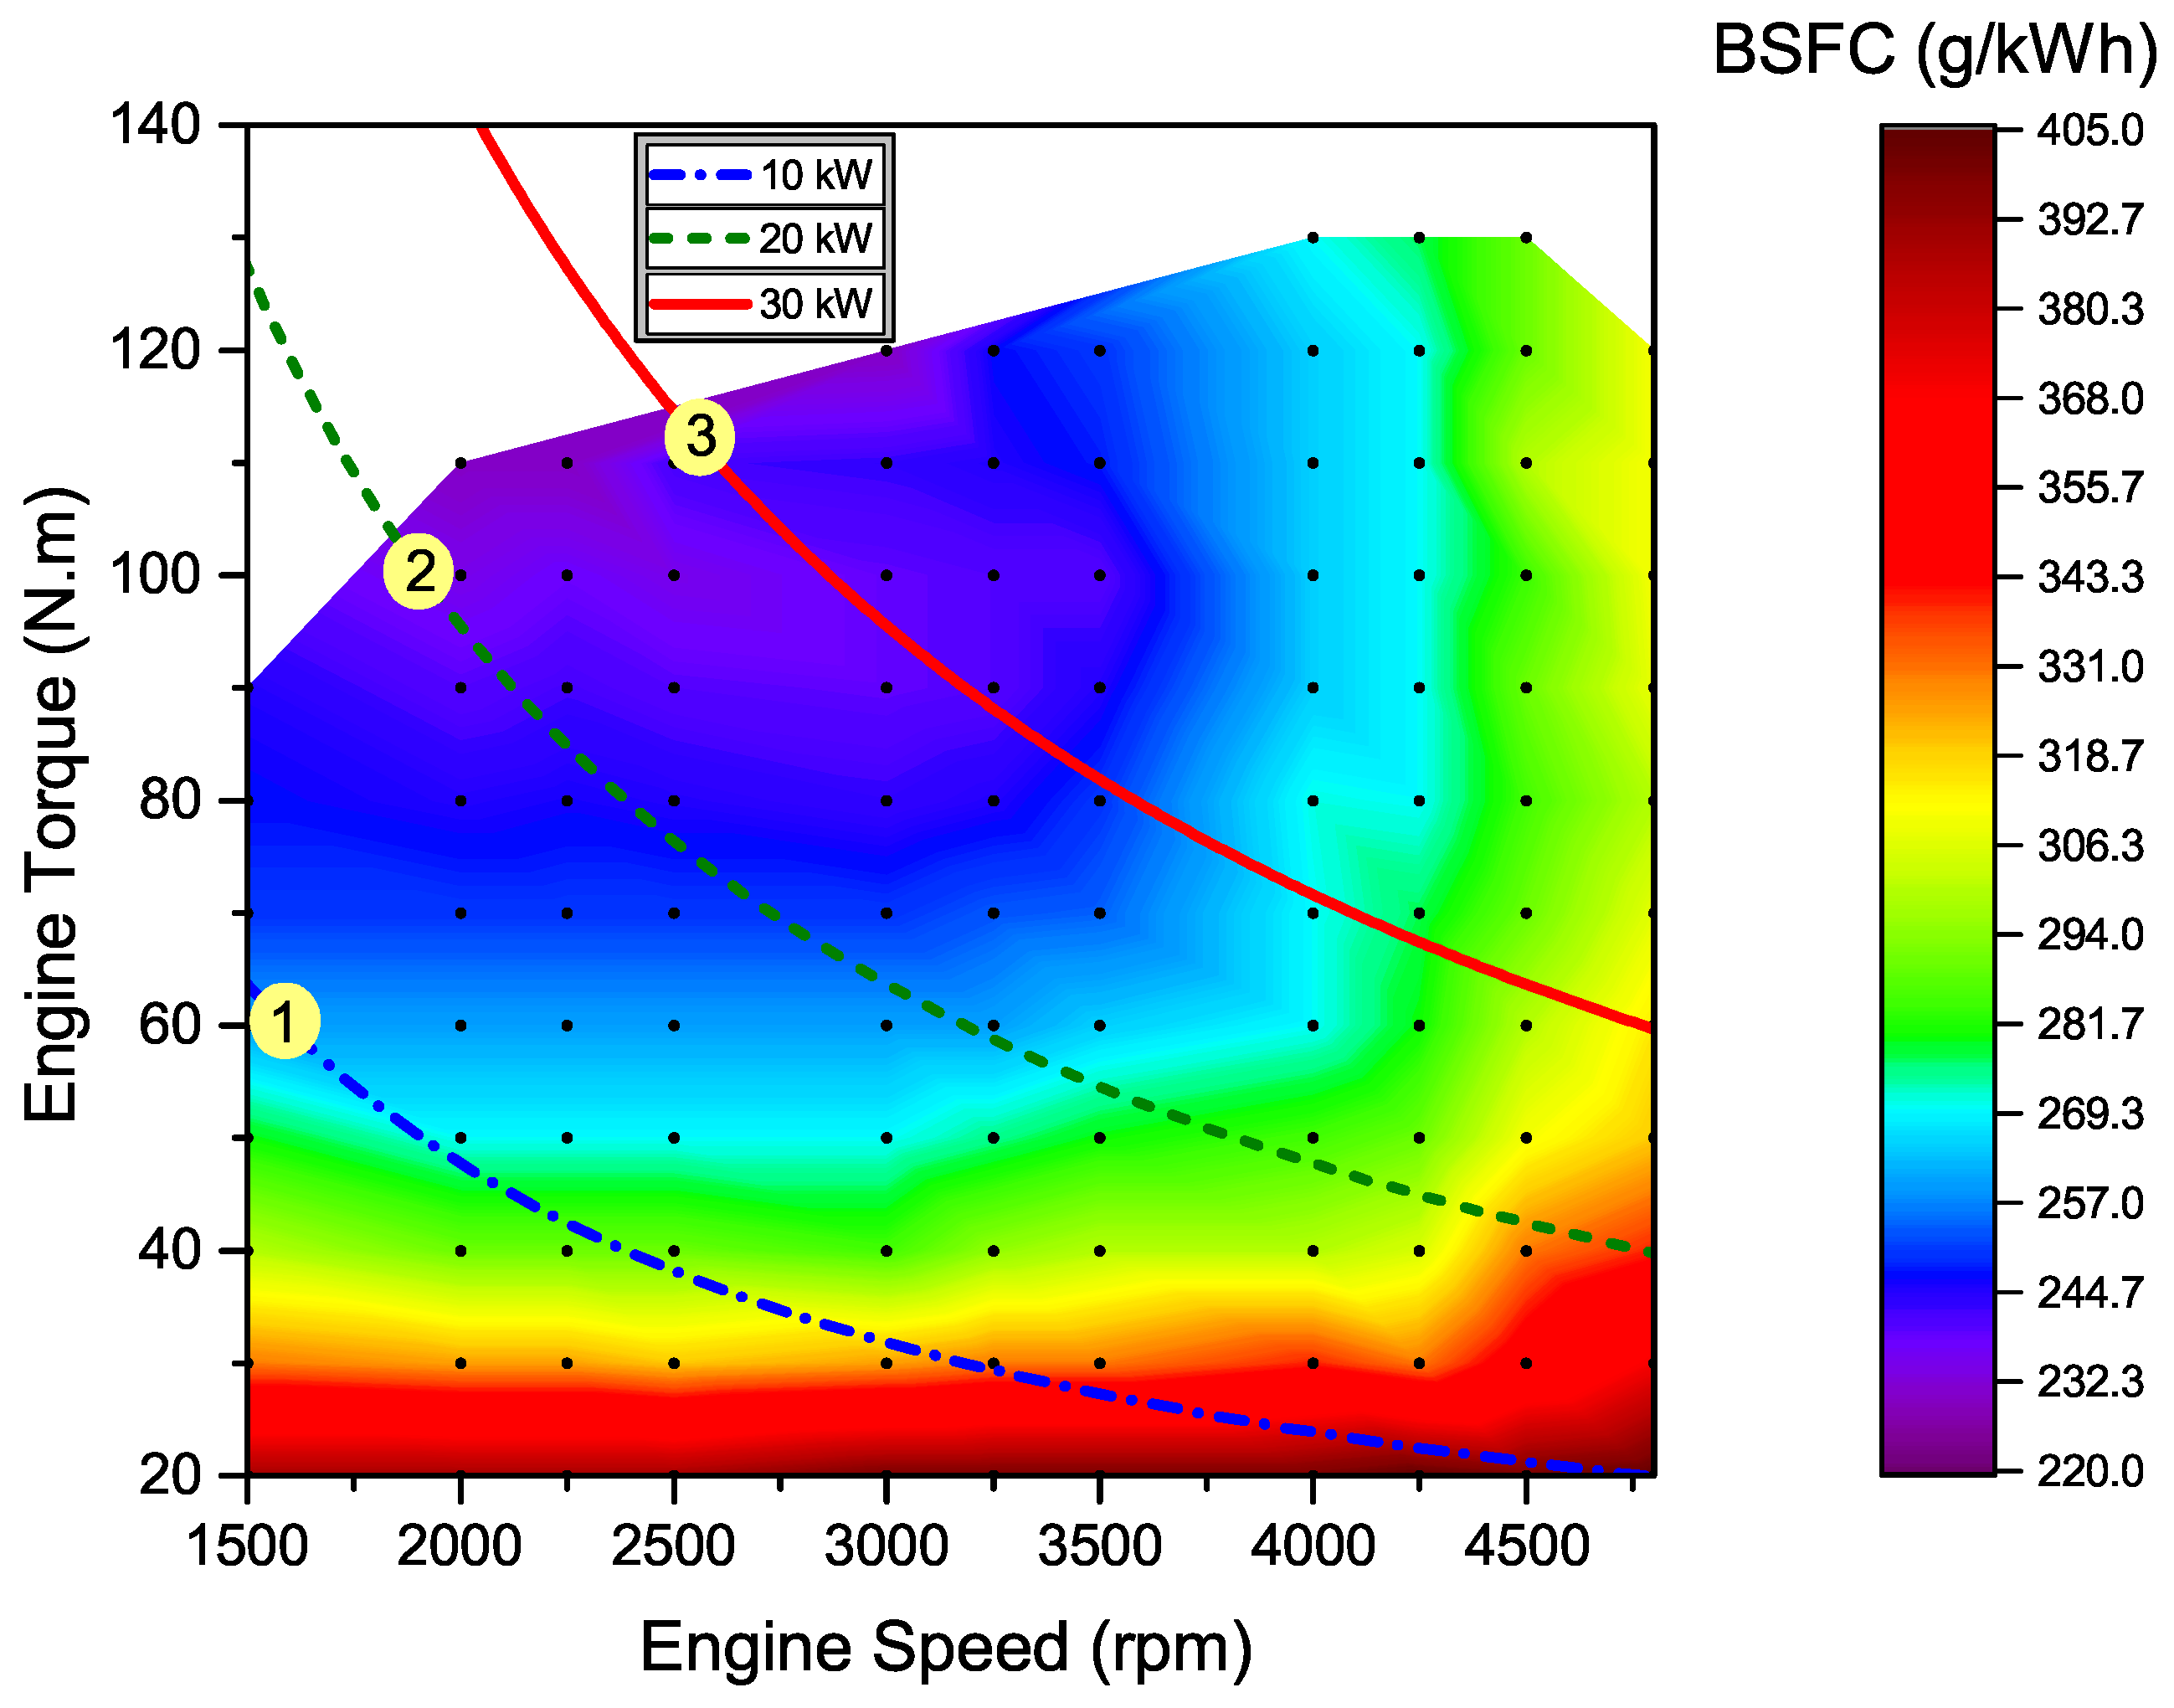
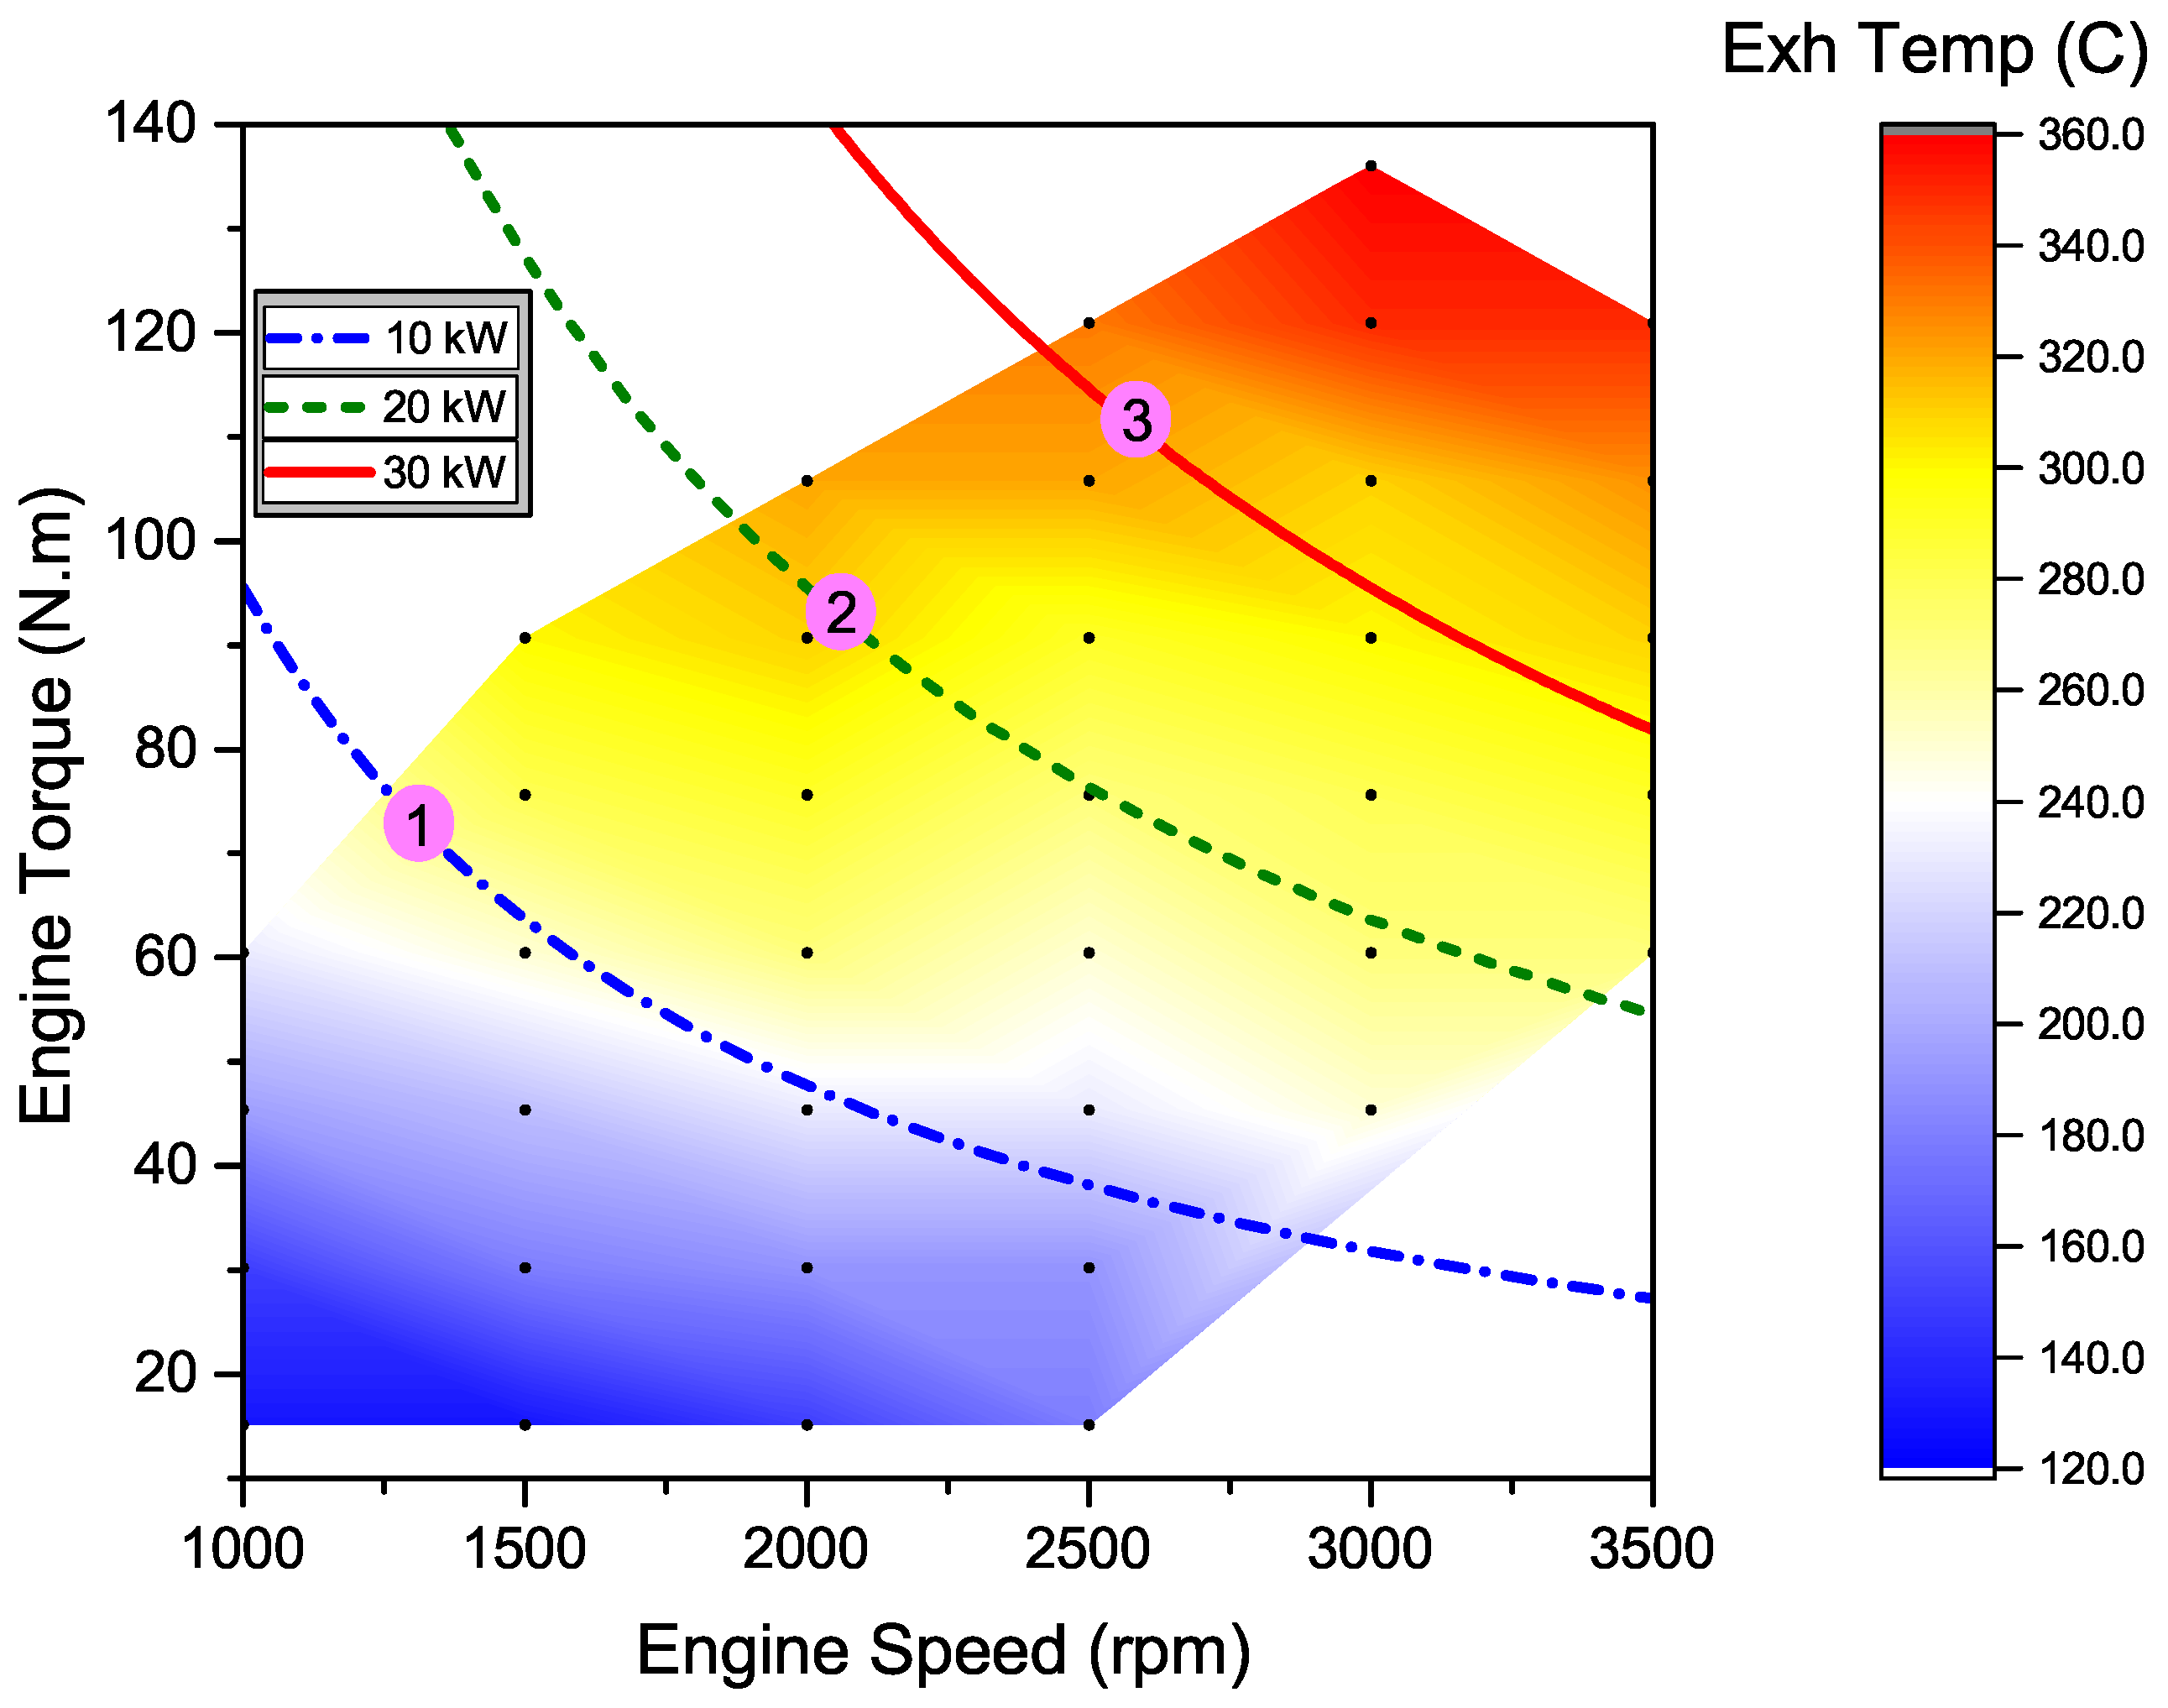
A. Engine BSFC Constraint: The selected operating points are at three power levels designated as 10 kW, 20 kW, and 30 kW. Within a range of 10 percent for each power level, a search is done to find the lowest BSFC value. Figure 3 shows the three final selected operating points for the RCCI engine. In the single operating mode, the mid power level (i.e., point no. 2 in Figure 3) is selected since the engine can provide the mean power requirement for the vehicle at this operating point. For the 2-mode operation, a low level power and a mid level power are selected for the engine operating points (i.e., points no. 1 and 2 in Figure 3), and for the 3-mode operation all the three selected points are considered.
B. Engine Emissions Constraint: The engine HC, CO, and NO x emissions are considered in selecting the engine operating points. CO and HC conversions in diesel oxidation catalysts (DOC) are a function of the exhaust gas temperature. Thus, the engine operating points are selected to meet the minimum DOC light-off temperature. The RCCI engine exhaust gas temperature for different engine speeds and torques are shown in Figure 6 based on the data from [40] along with the selected operating points. It is shown in Figure 6 that the exhaust gas temperature for all of the three engine operating points are above 290 °C. Moreover, in reference [50], it is shown that the DOC for the same RCCI engine achieved 90% and 100% HC and CO conversions, respectively, when the exhaust gas temperature in the RCCI engine was higher than 290 °C. Thus, the selected RCCI engine operating points meet the DOC light-off temperature to achieve low HC and CO emissions, similar to those in the CI and SI engines.
In addition to the HC and CO emissions, the NO x emission is also taken into account for selecting the engine operating points. Table 3 lists the NO x emission associated with the selected operating points in both RCCI and CI engines. The table shows that the selected engine operating points in RCCI produce much less NO x compared to the selected operating points in the CI engine. This is a well-recognized fact in literature [5,40,51] and considered as one of the main advantages of RCCI engines. Thus, a smaller NO x after-treatment system is required in RCCI engines, compared to CI engines.
Given that the SI and CI engines are production engines, the engines and exhaust after-treatment systems are optimized to meet HC, CO, and NO x constraint for the emission standard. In addition, the discussions above demonstrate that the RCCI engine produces low HC, CO, and NO x emissions in the three selected operating points. Thus, all the three engine operating points in the SI, CI, and RCCI engines have both low BSFC and low emissions advantages over the other engine operating regions at the designated power levels.
In this section, the effect of the number of the engine operating points on the HEV fuel economy is also discussed. Table 4 shows the effect of number of engine operating points and the engine start-up fuel penalty on the RCCI-SHEV fuel economy.
The simulation results in Table 4 show that the RCCI fuel economy increases by increasing the number of engine operating points. This can be explained by improved overall ICE efficiency when three modes are utilized in RCCI for different driver power request levels. Given better fuel economy results by using the 3-mode EMC, the rest of the results in this paper are presented for the 3-mode EMC.

5. Results and Discussion

In this section, the results for the SHEV with the RCCI, CI, and SI engines are discussed. In Section 5.1, sensitivity of the driving cycle’s prediction time horizon on the vehicle’s fuel economy is studied. Moreover, the initial battery SOC effect on the vehicle’s fuel economy is investigated in Section 5.2. Lastly, the effect of the type of the driving cycle is presented in Section 5.3.
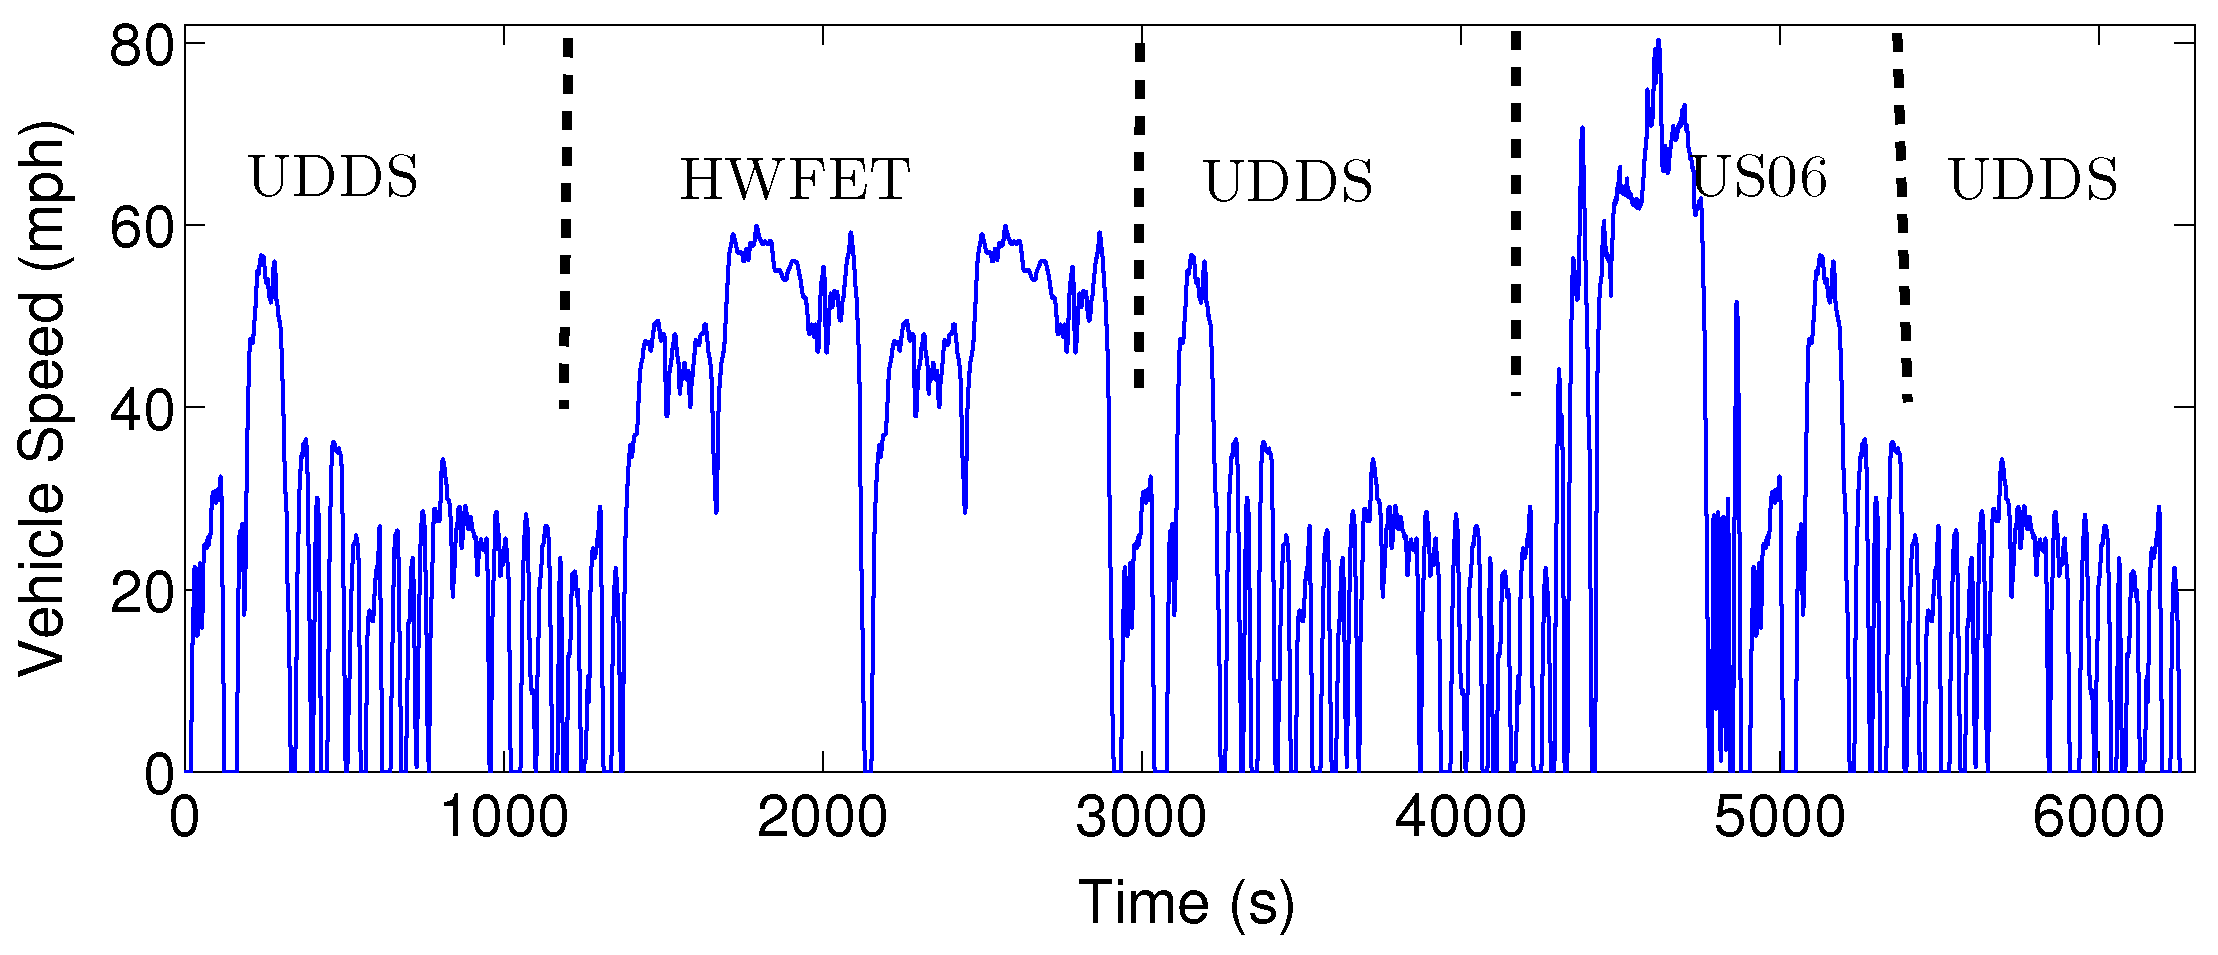
In this work, a combined driving cycle (Figure 7) consisting of three standard driving cycles including UDDS (urban dynamometer driving schedule), HWFET (highway fuel economy test), and US06 is used to test the EMC strategies. The combined driving cycle is the base driving cycle for all the analyses in this paper except for Section 5.3, where different driving cycles are compared.
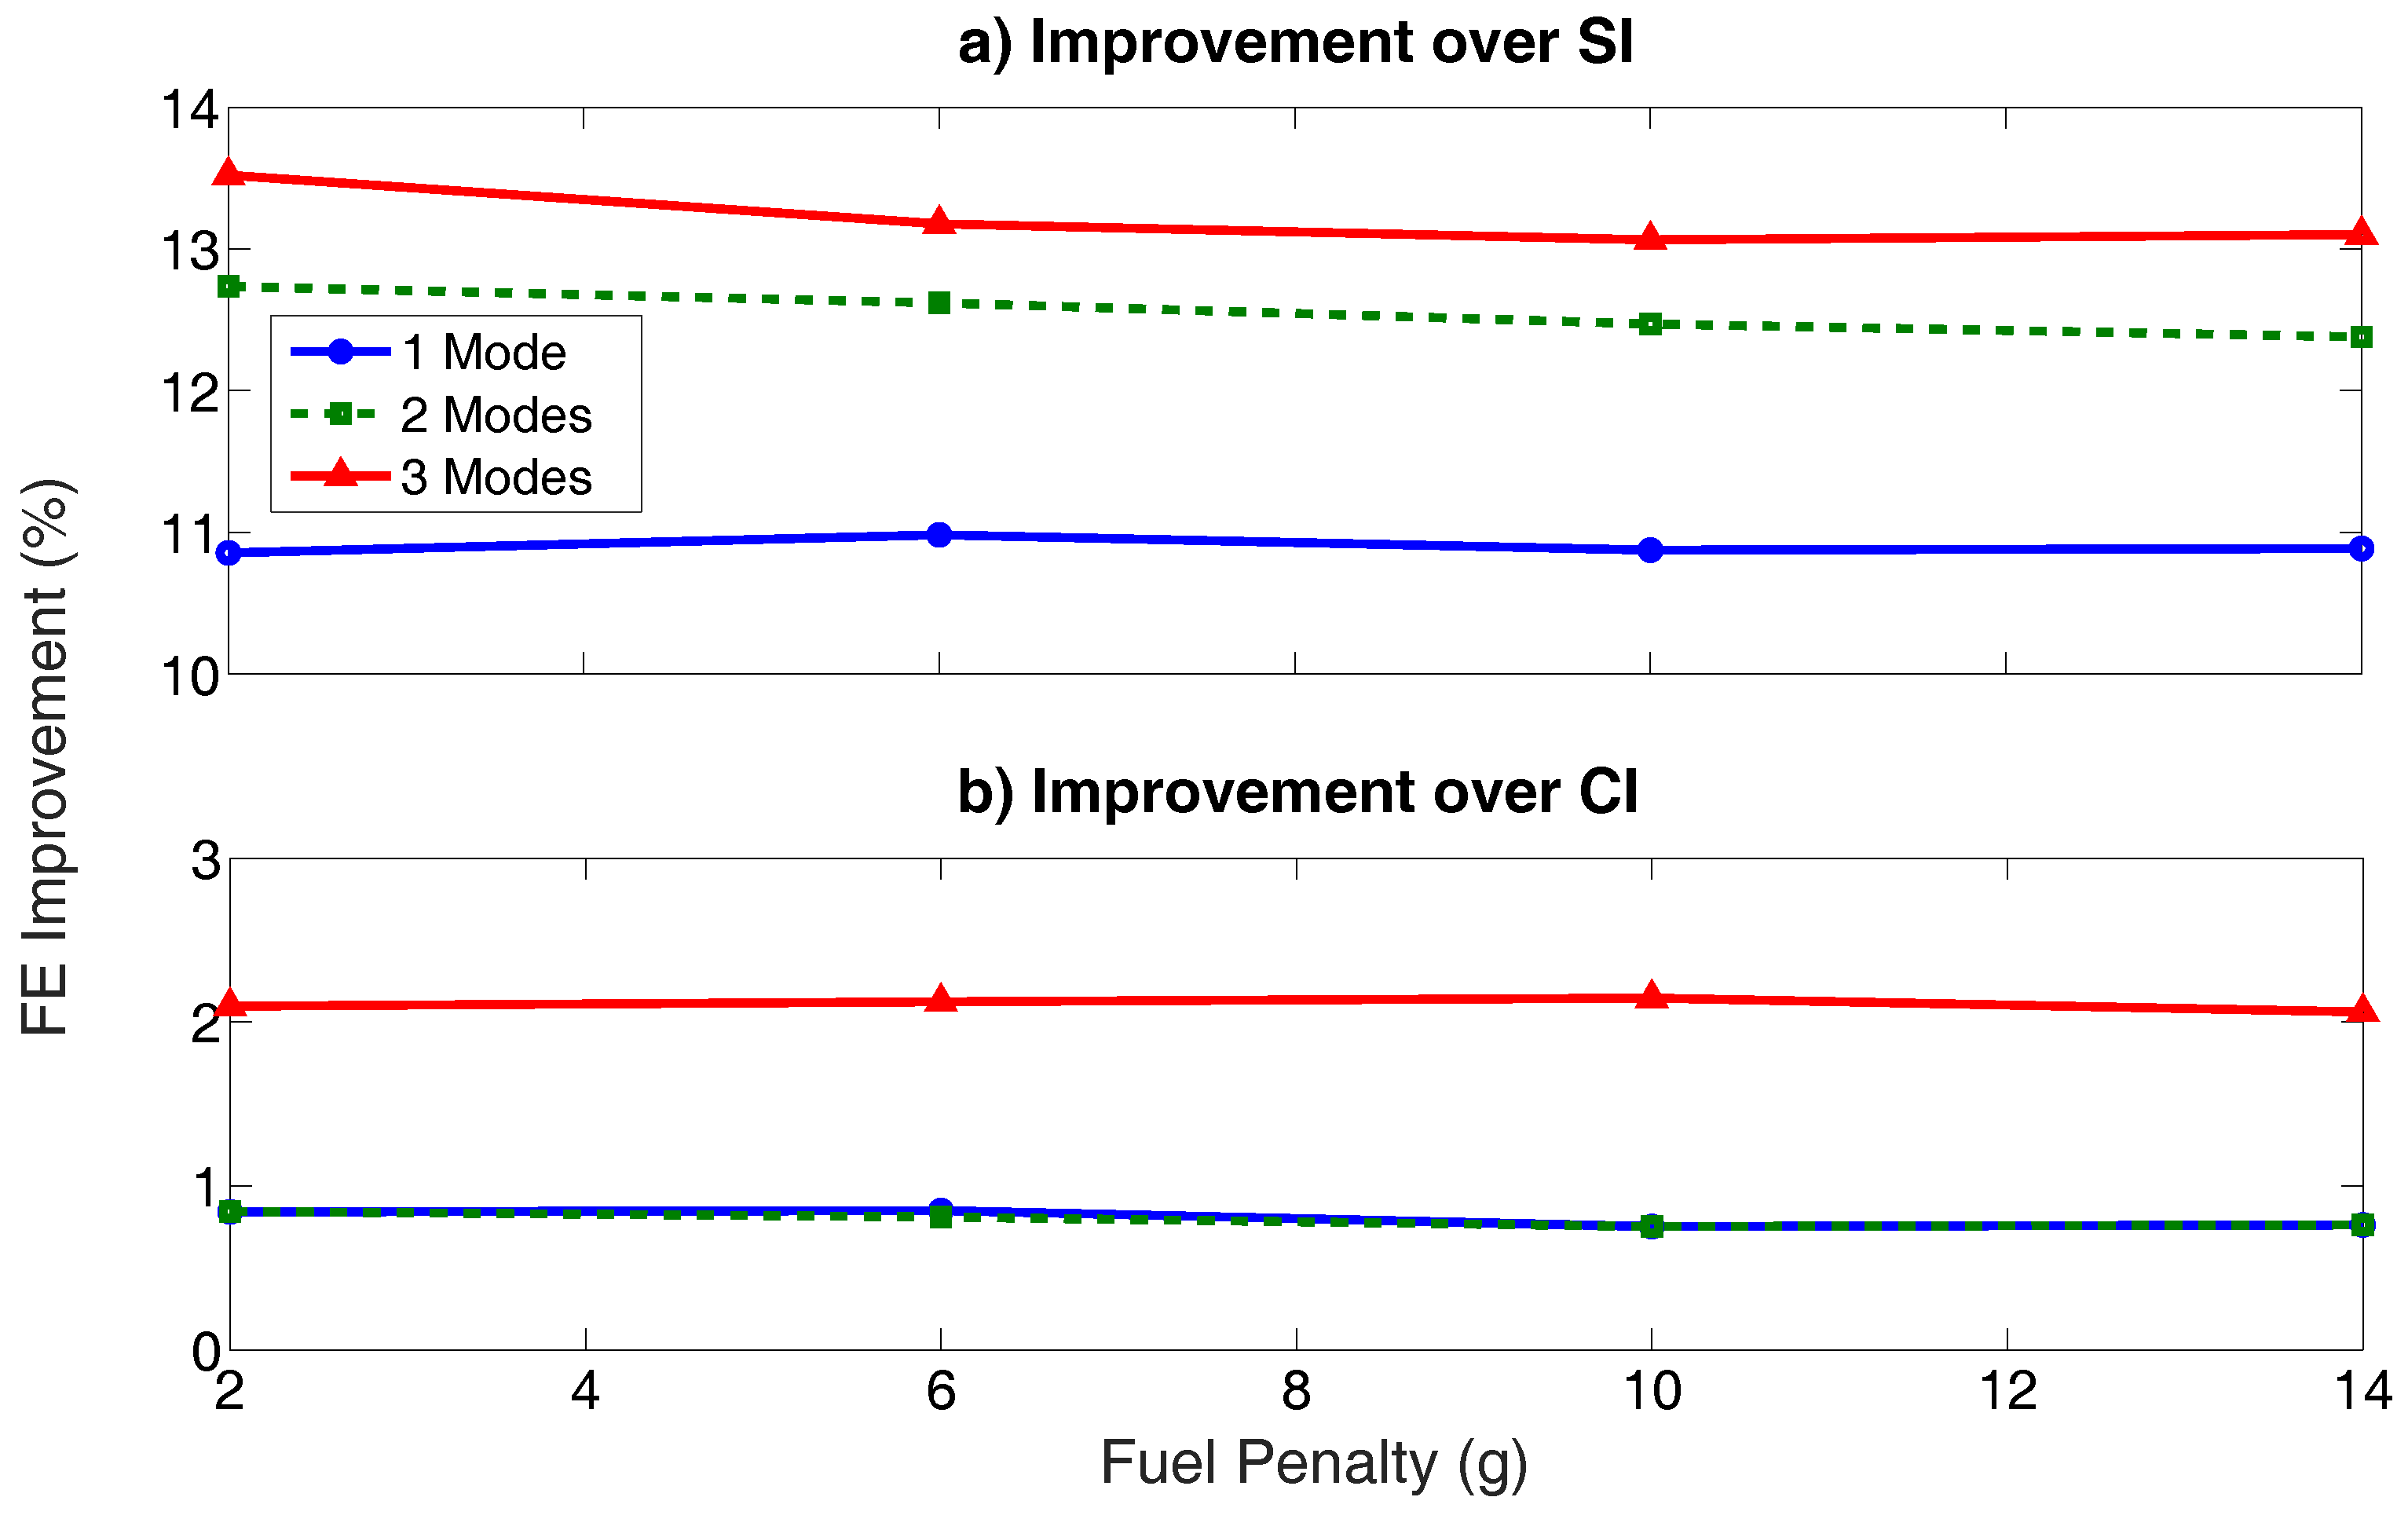
Figure 8 describes the effect of the engine start-up fuel penalty ( m f , s t a r t ) on the fuel saving. The RCCI fuel economy improvement is constant versus the amount of m f , s t a r t . This is because the power levels for each engine are similar; thus, the number of engine on/off switching will remain constant. This makes the RCCI fuel economy improvement independent of the m f , s t a r t value. Figure 8 also shows the same trend for the RCCI fuel saving over the number of engine operating points and the fuel economy improves with increasing number of the engine operating points.
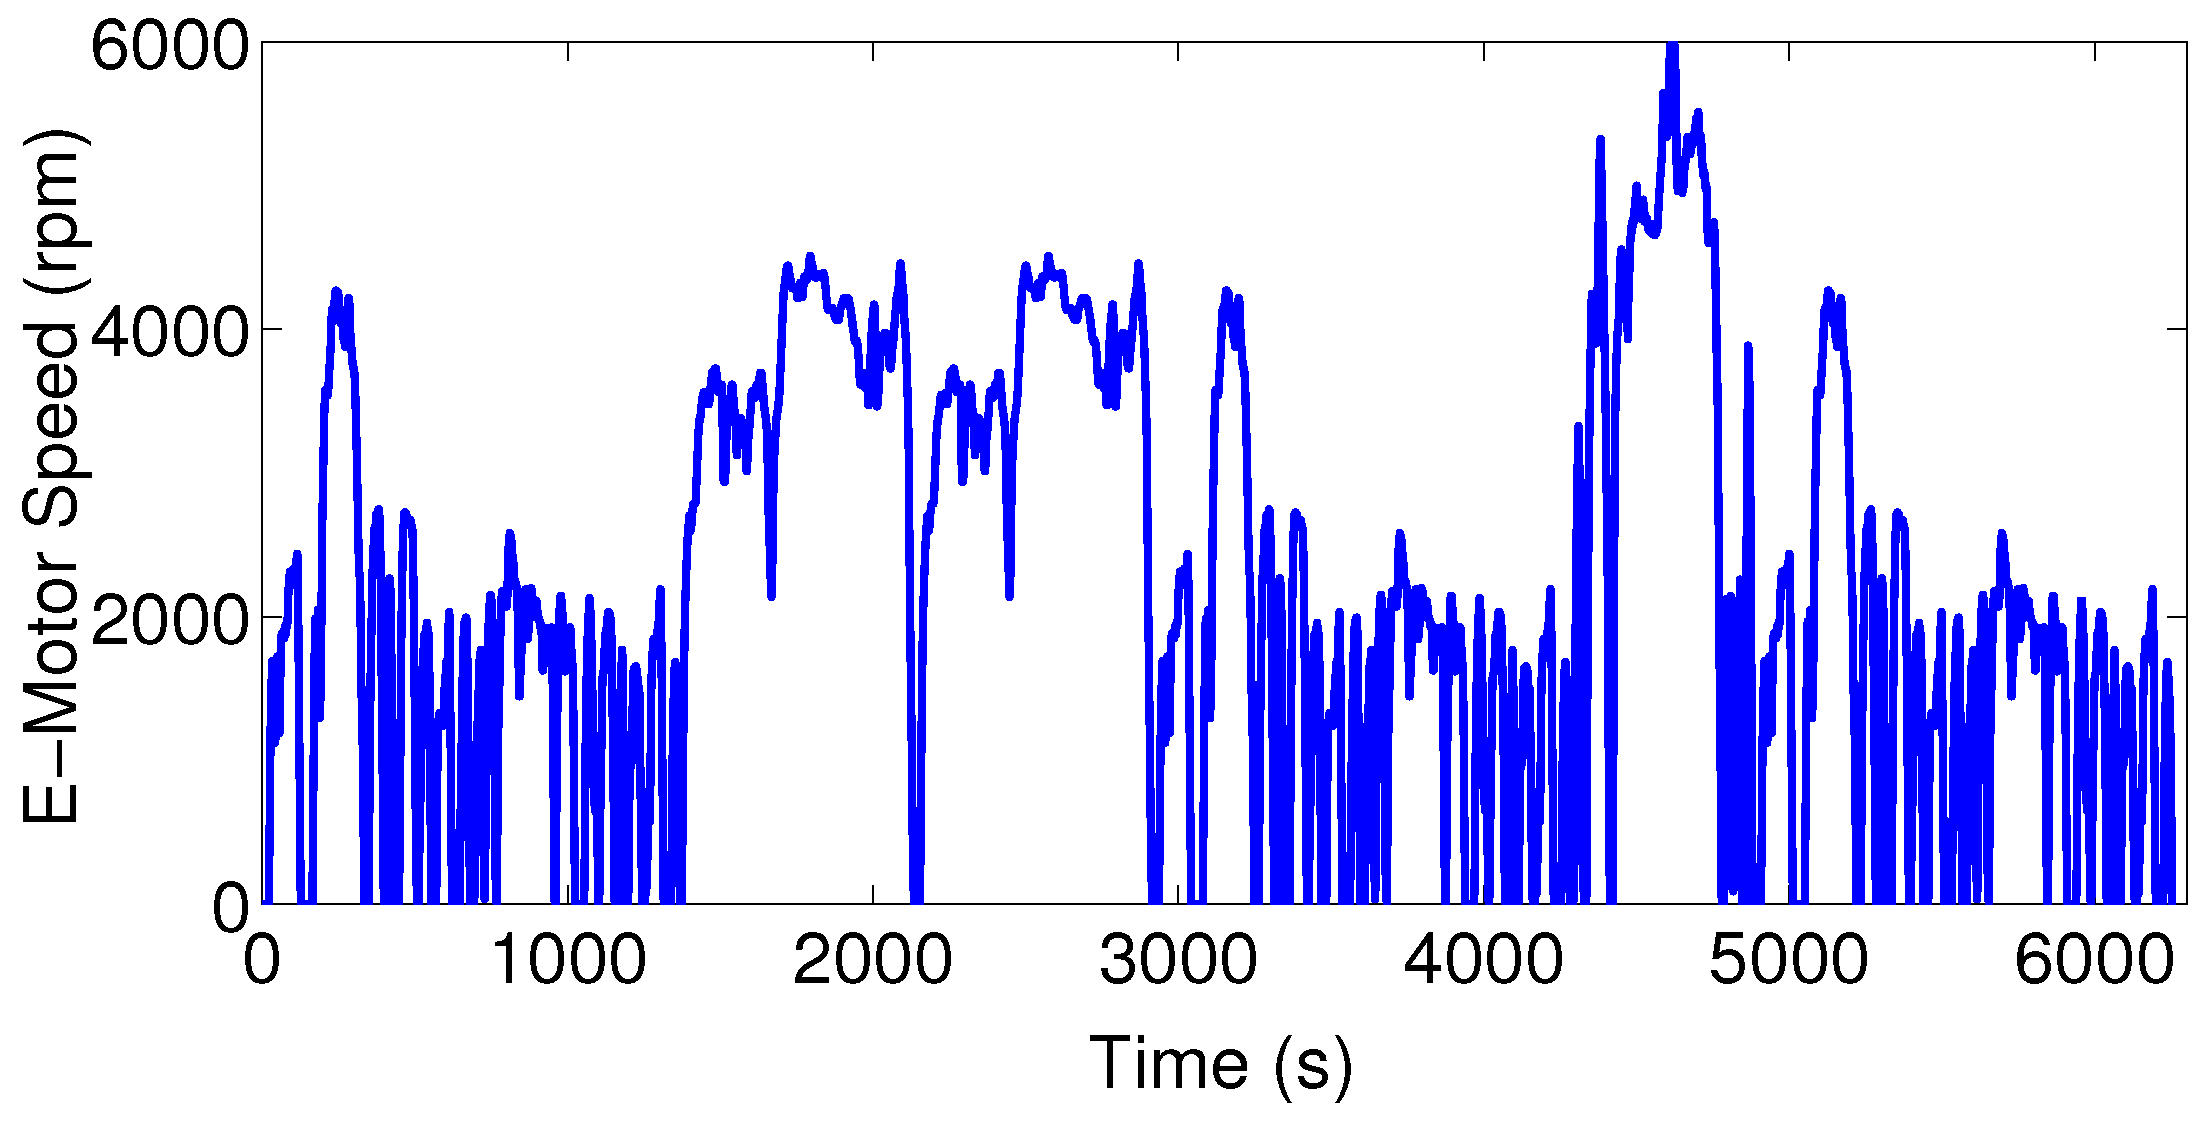
Figure 9 illustrates the E-motor speed variation for the combined driving cycle. A single gear is designed to synchronize the E-motor and vehicle maximum speeds in order to expand the E-motor operating points to the whole E-motor operating region. In Figure 9, for the portion of the US06 driving cycle that the vehicle speed reaches to 80 mph, the E-motor speed is 6000 rpm.
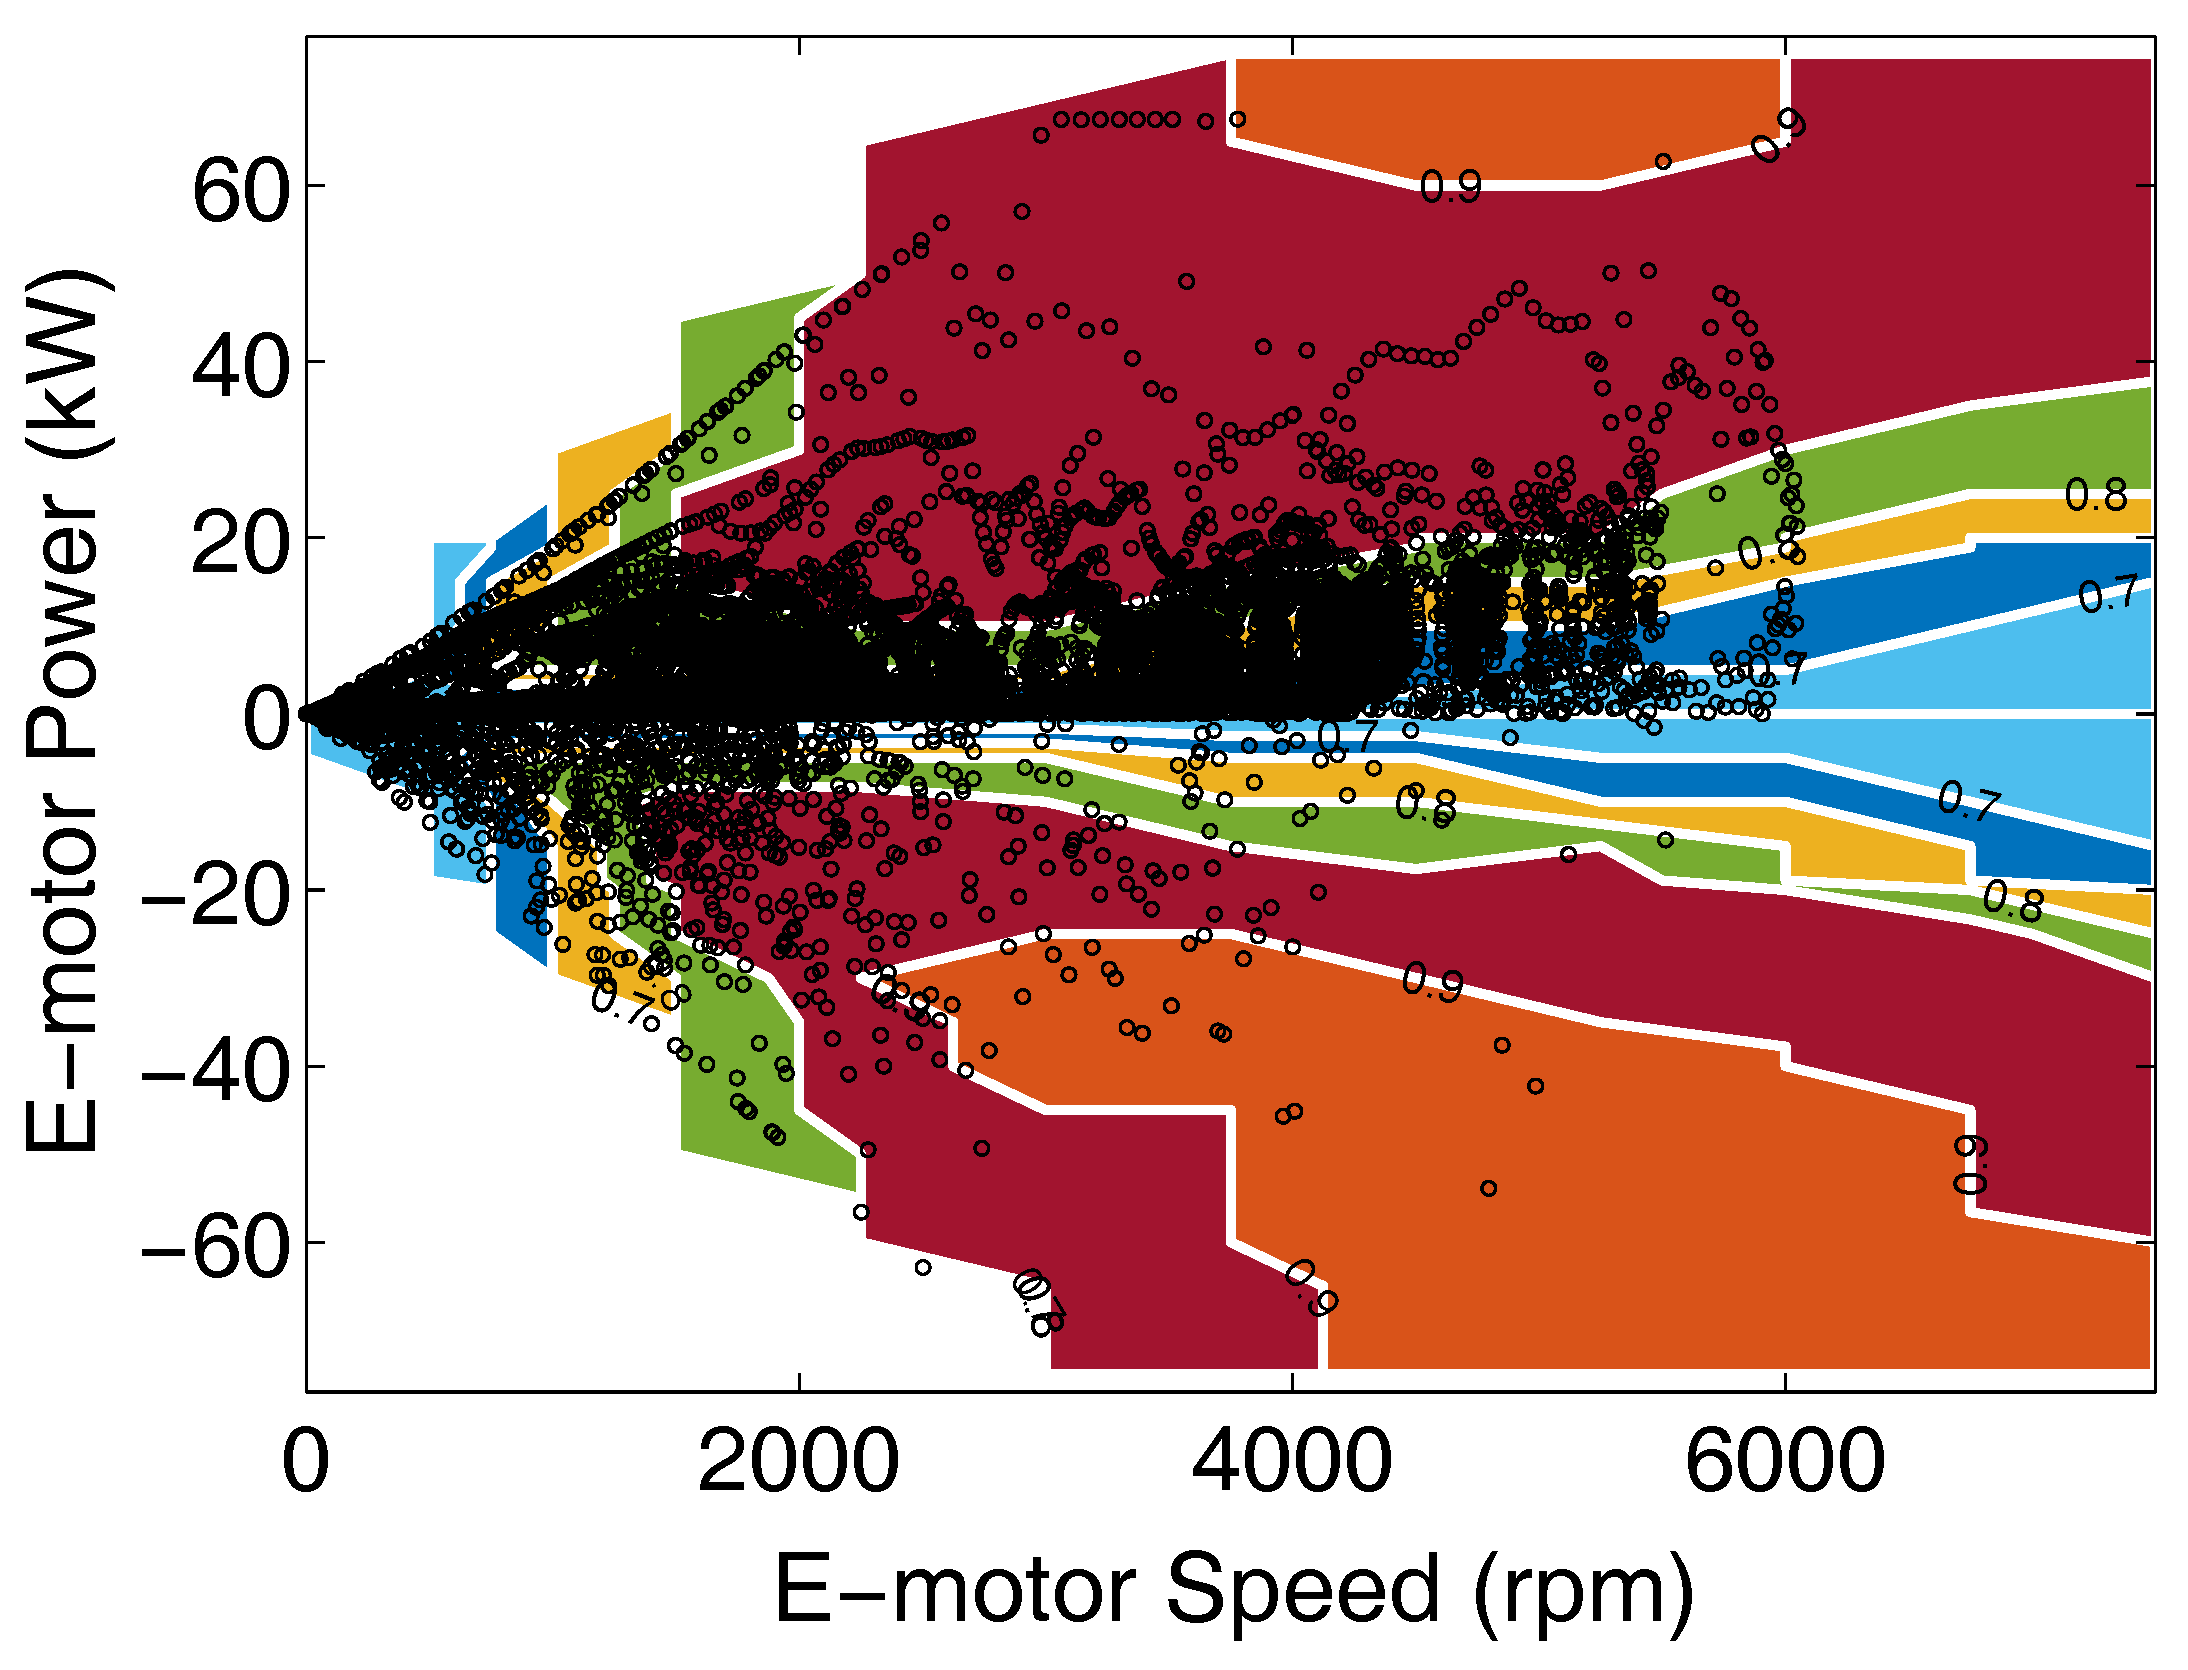
The E-motor operating points during the combined driving cycle are depicted in Figure 10. The E-motor efficiency points range from 70% to 90% in the traction and regenerative braking modes. The E-motor efficiency is higher at higher E-motor power (i.e., P e > 40 kW) and the E-motor efficiency improves with increasing the E-motor power.
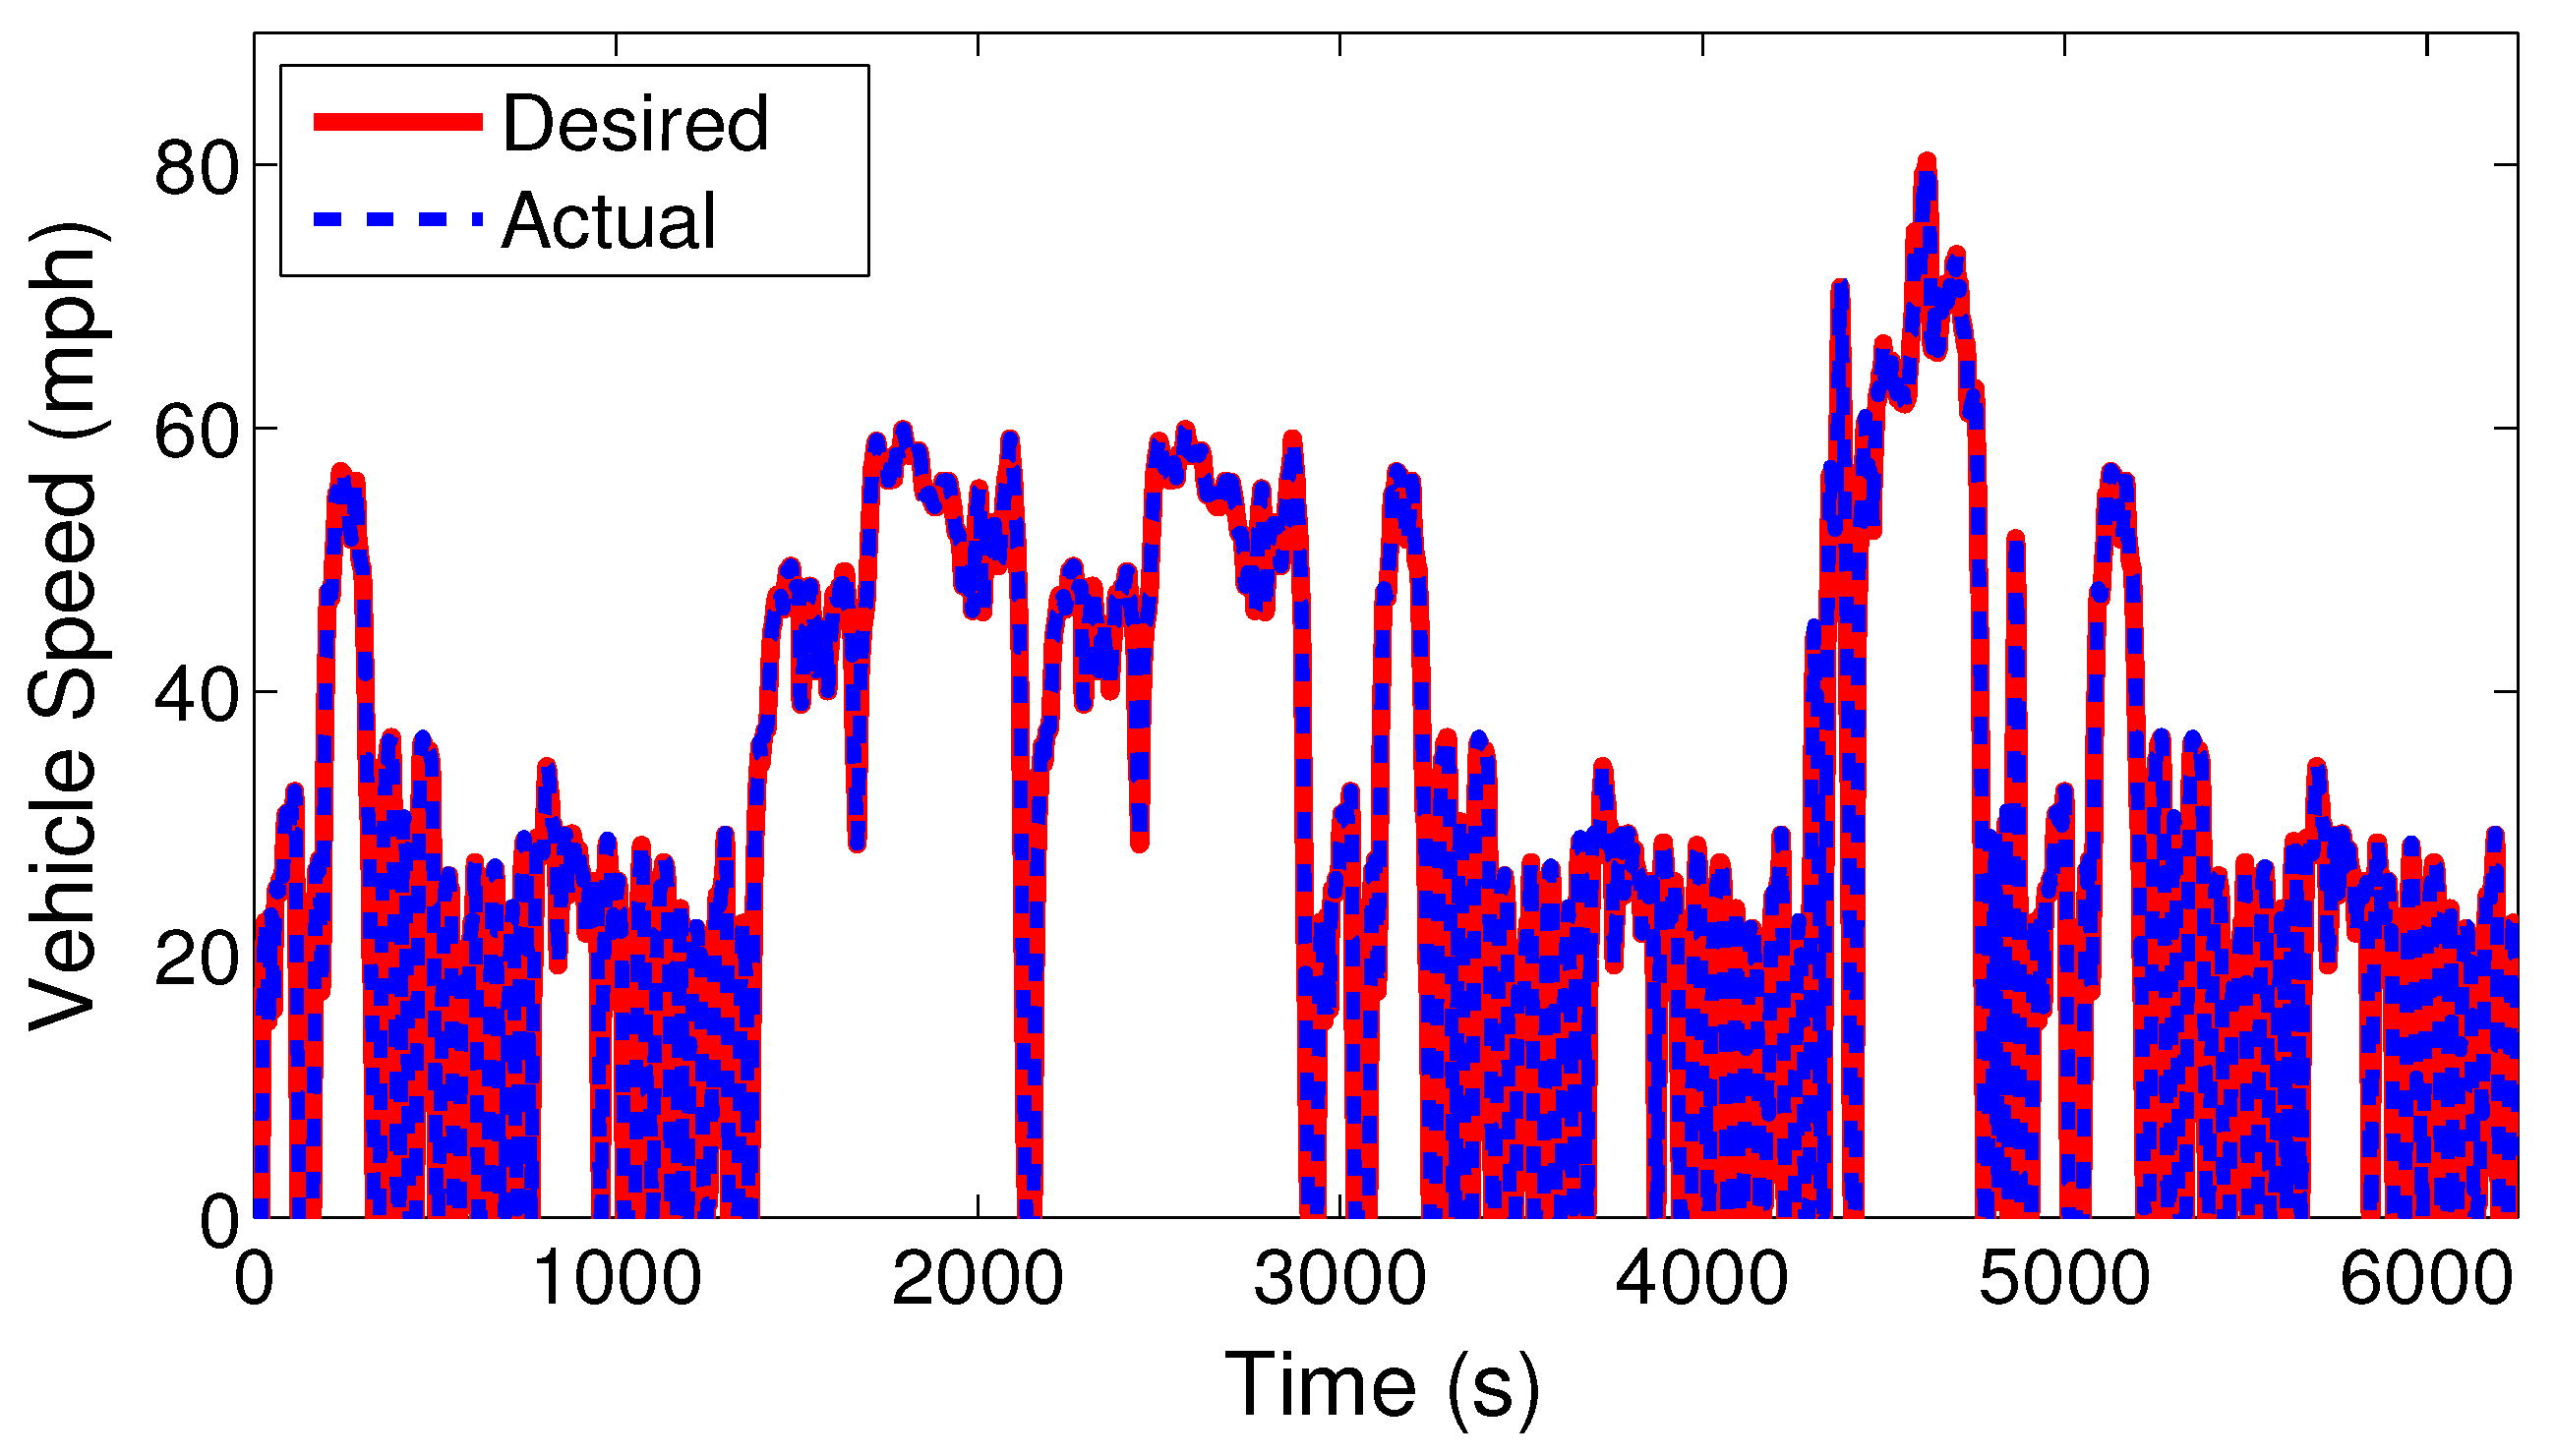
Figure 11 shows the vehicle tracking performance. The vehicle is able to follow the reference driving cycle with a root mean square error (RMSE) of 0.8 mph. This result also confirms that the HEV components’ sizing meets the performance requirements during the driving cycle. Thus, the HEV model can be used as a testbed for evaluation of EMCs.
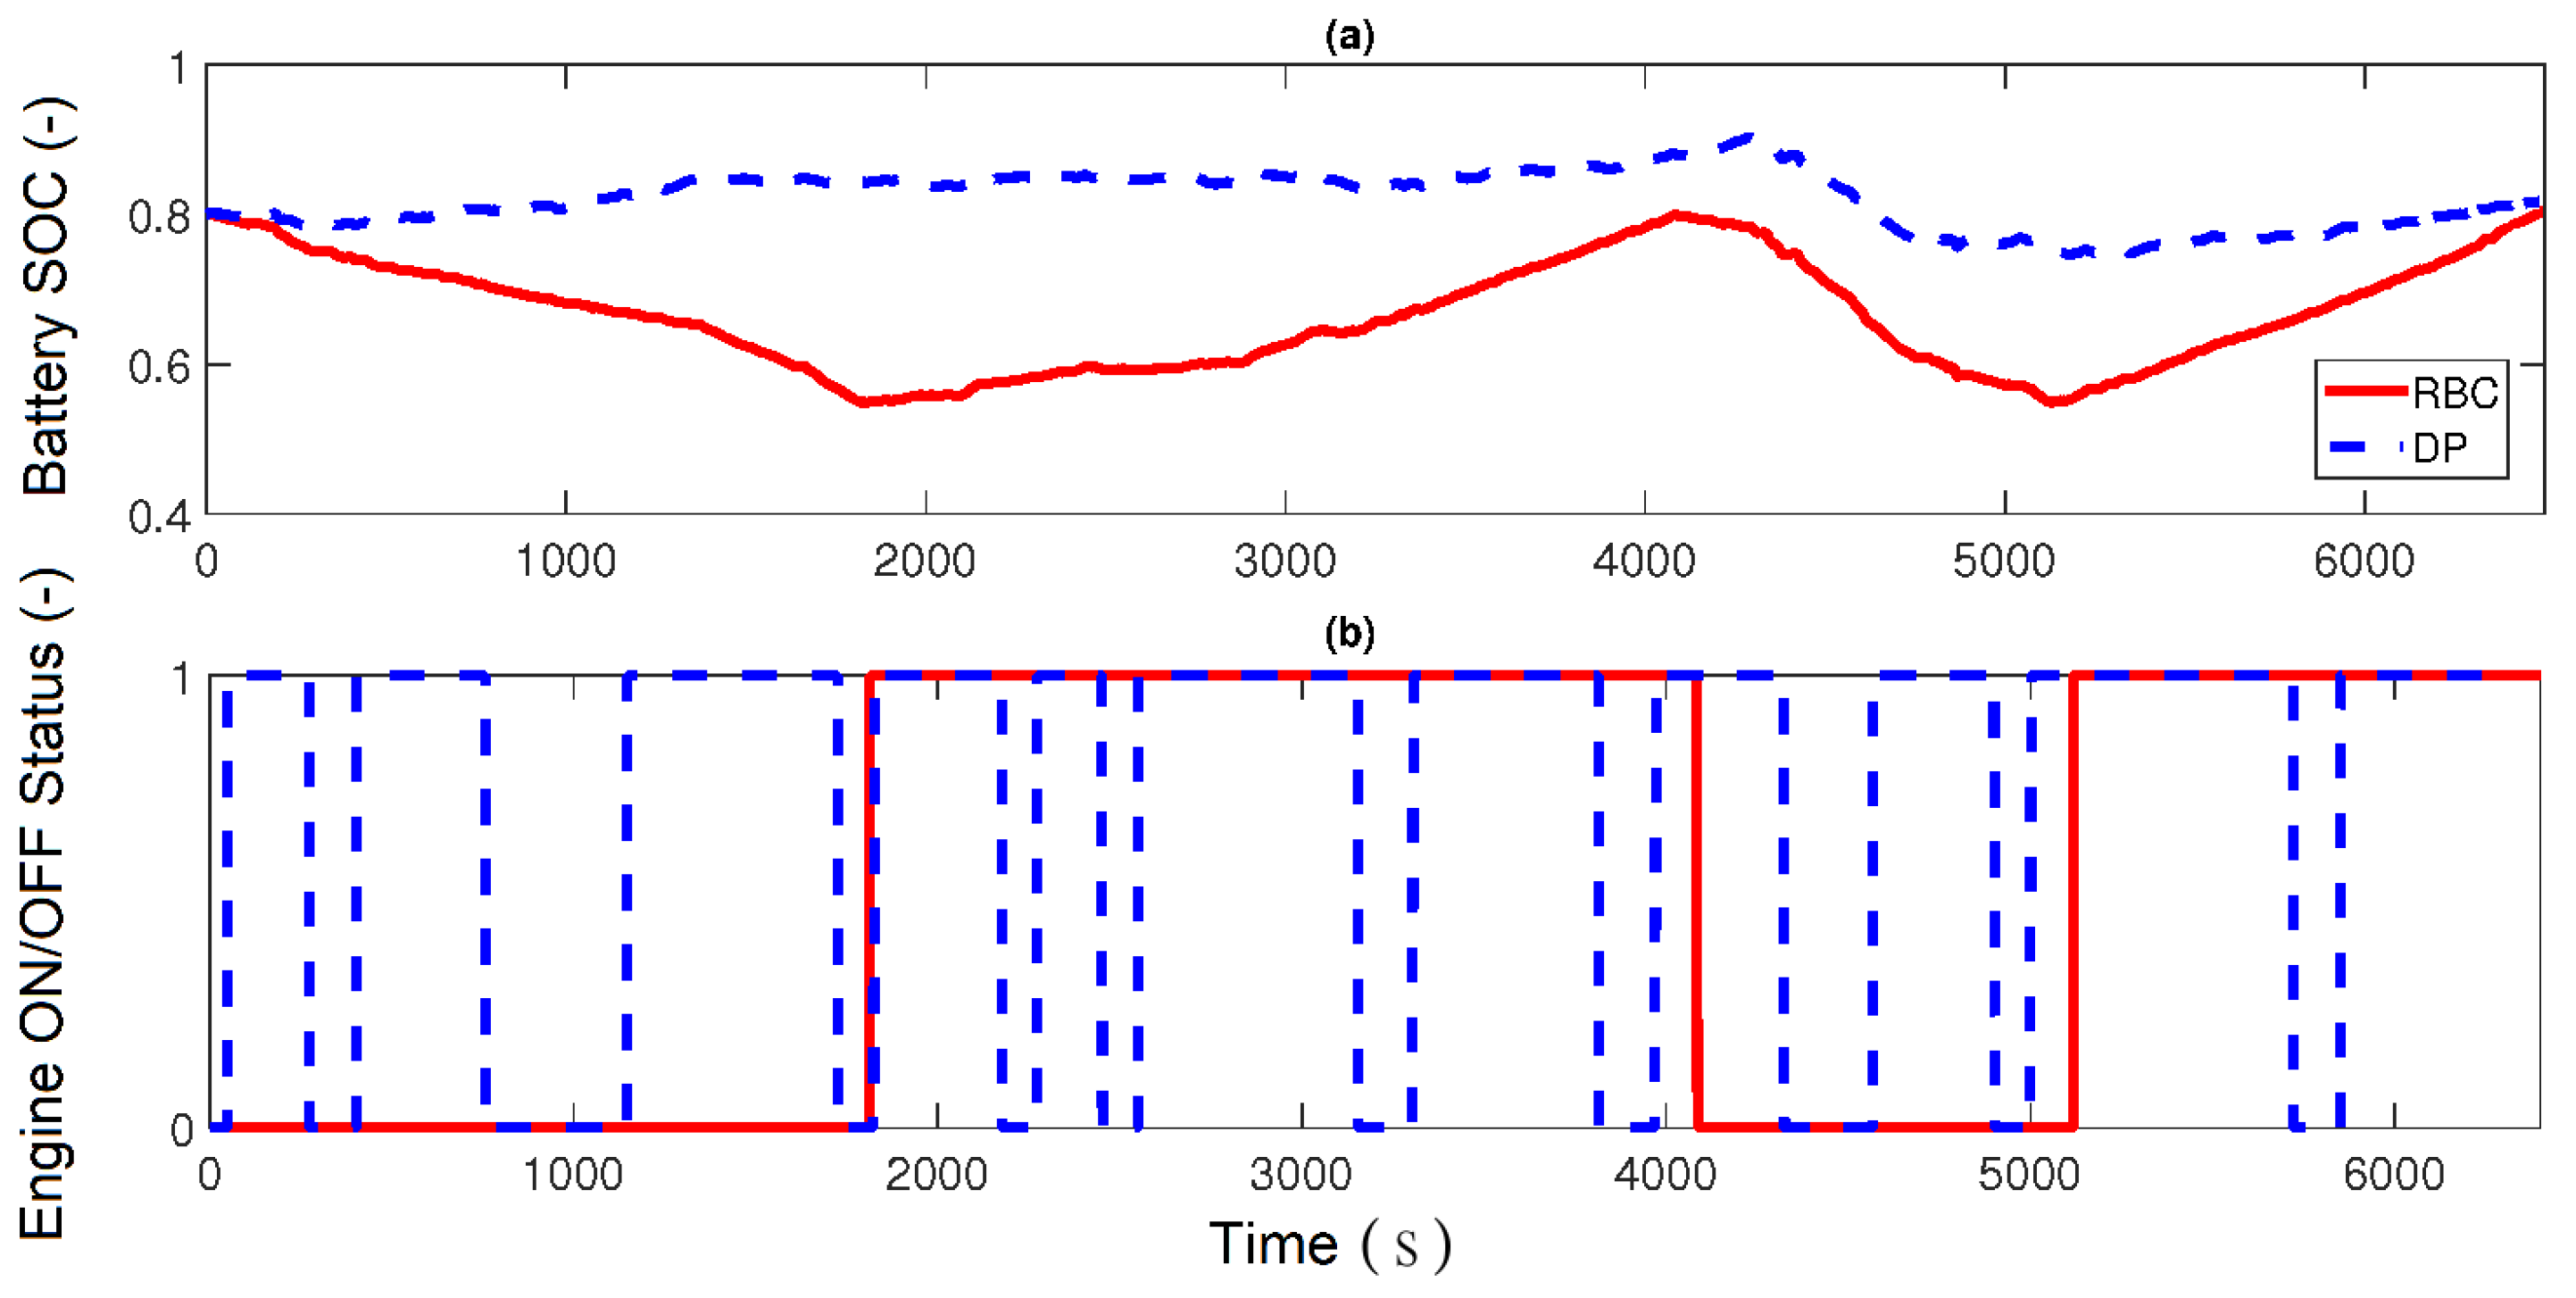
Figure 12 compares the engine on/off status and the battery SOC variation for both RBC and DP EMCs. The RBC strategy regulates the engine status command based on the SOC value. The RBC switches the engine on when the SOC reaches to its lowest allowed value (i.e., S O C m i n = 0.55 ). In the DP controller, the SOC variation is much less than that of the RBC. This allows the EMC to choose the most optimal control strategy over the driving cycle at each time. However, in the DP strategy, the engine switches on and off more frequently (Figure 12b).
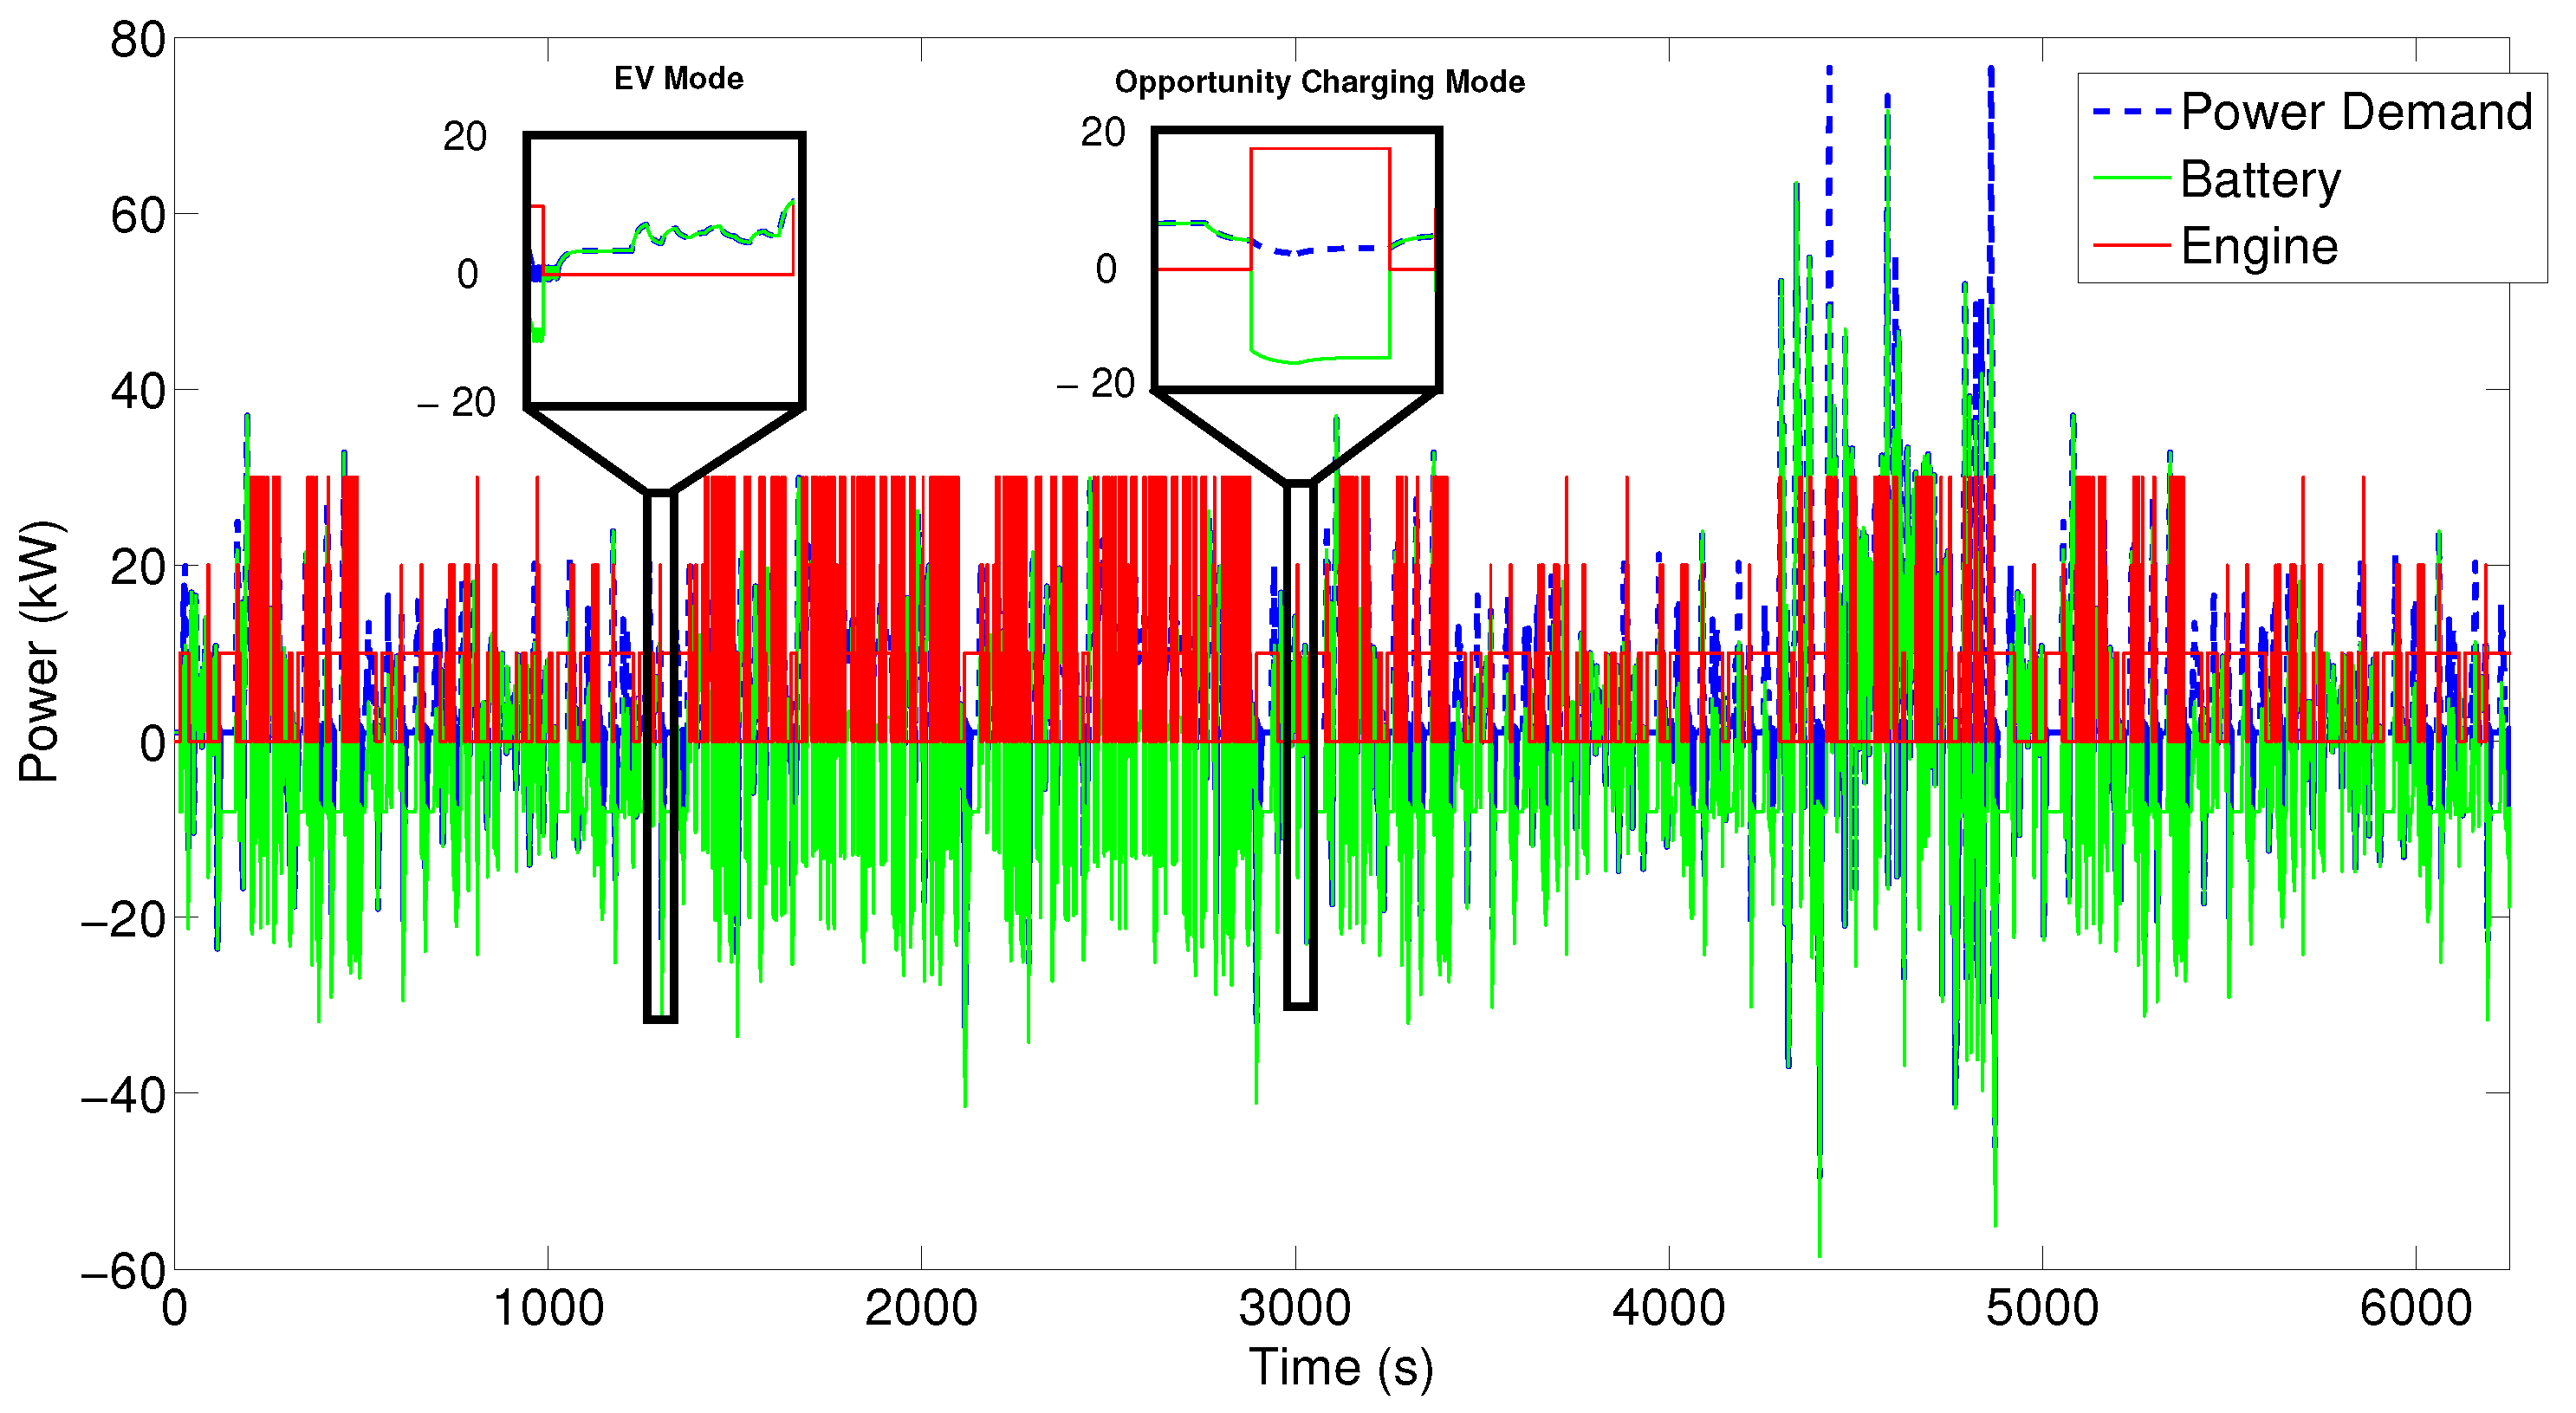
Figure 13 indicates the power distribution of the battery and the engine during the driving cycle for the DP control strategy. There are different operating modes, such as fully electric mode and opportunity charging mode based on Figure 13. For instance, the battery only supplies the driver power demand at t = 1282 s and runs the vehicle on the fully electric mode. For low power demands, at t = 3005 s, the vehicle runs in the opportunity charging mode, in which the engine/generator supplies the power demand and charges the battery simultaneously. In RBC, the engine is turned off during the braking, but in the DP strategy, the engine can either be on or off to minimize the cost function. In addition, at the low vehicle speeds, the mechanical braking assists the regenerating braking to supply the braking torque, however, at the high vehicle speeds, all the braking torque is supplied by the regenerative braking.
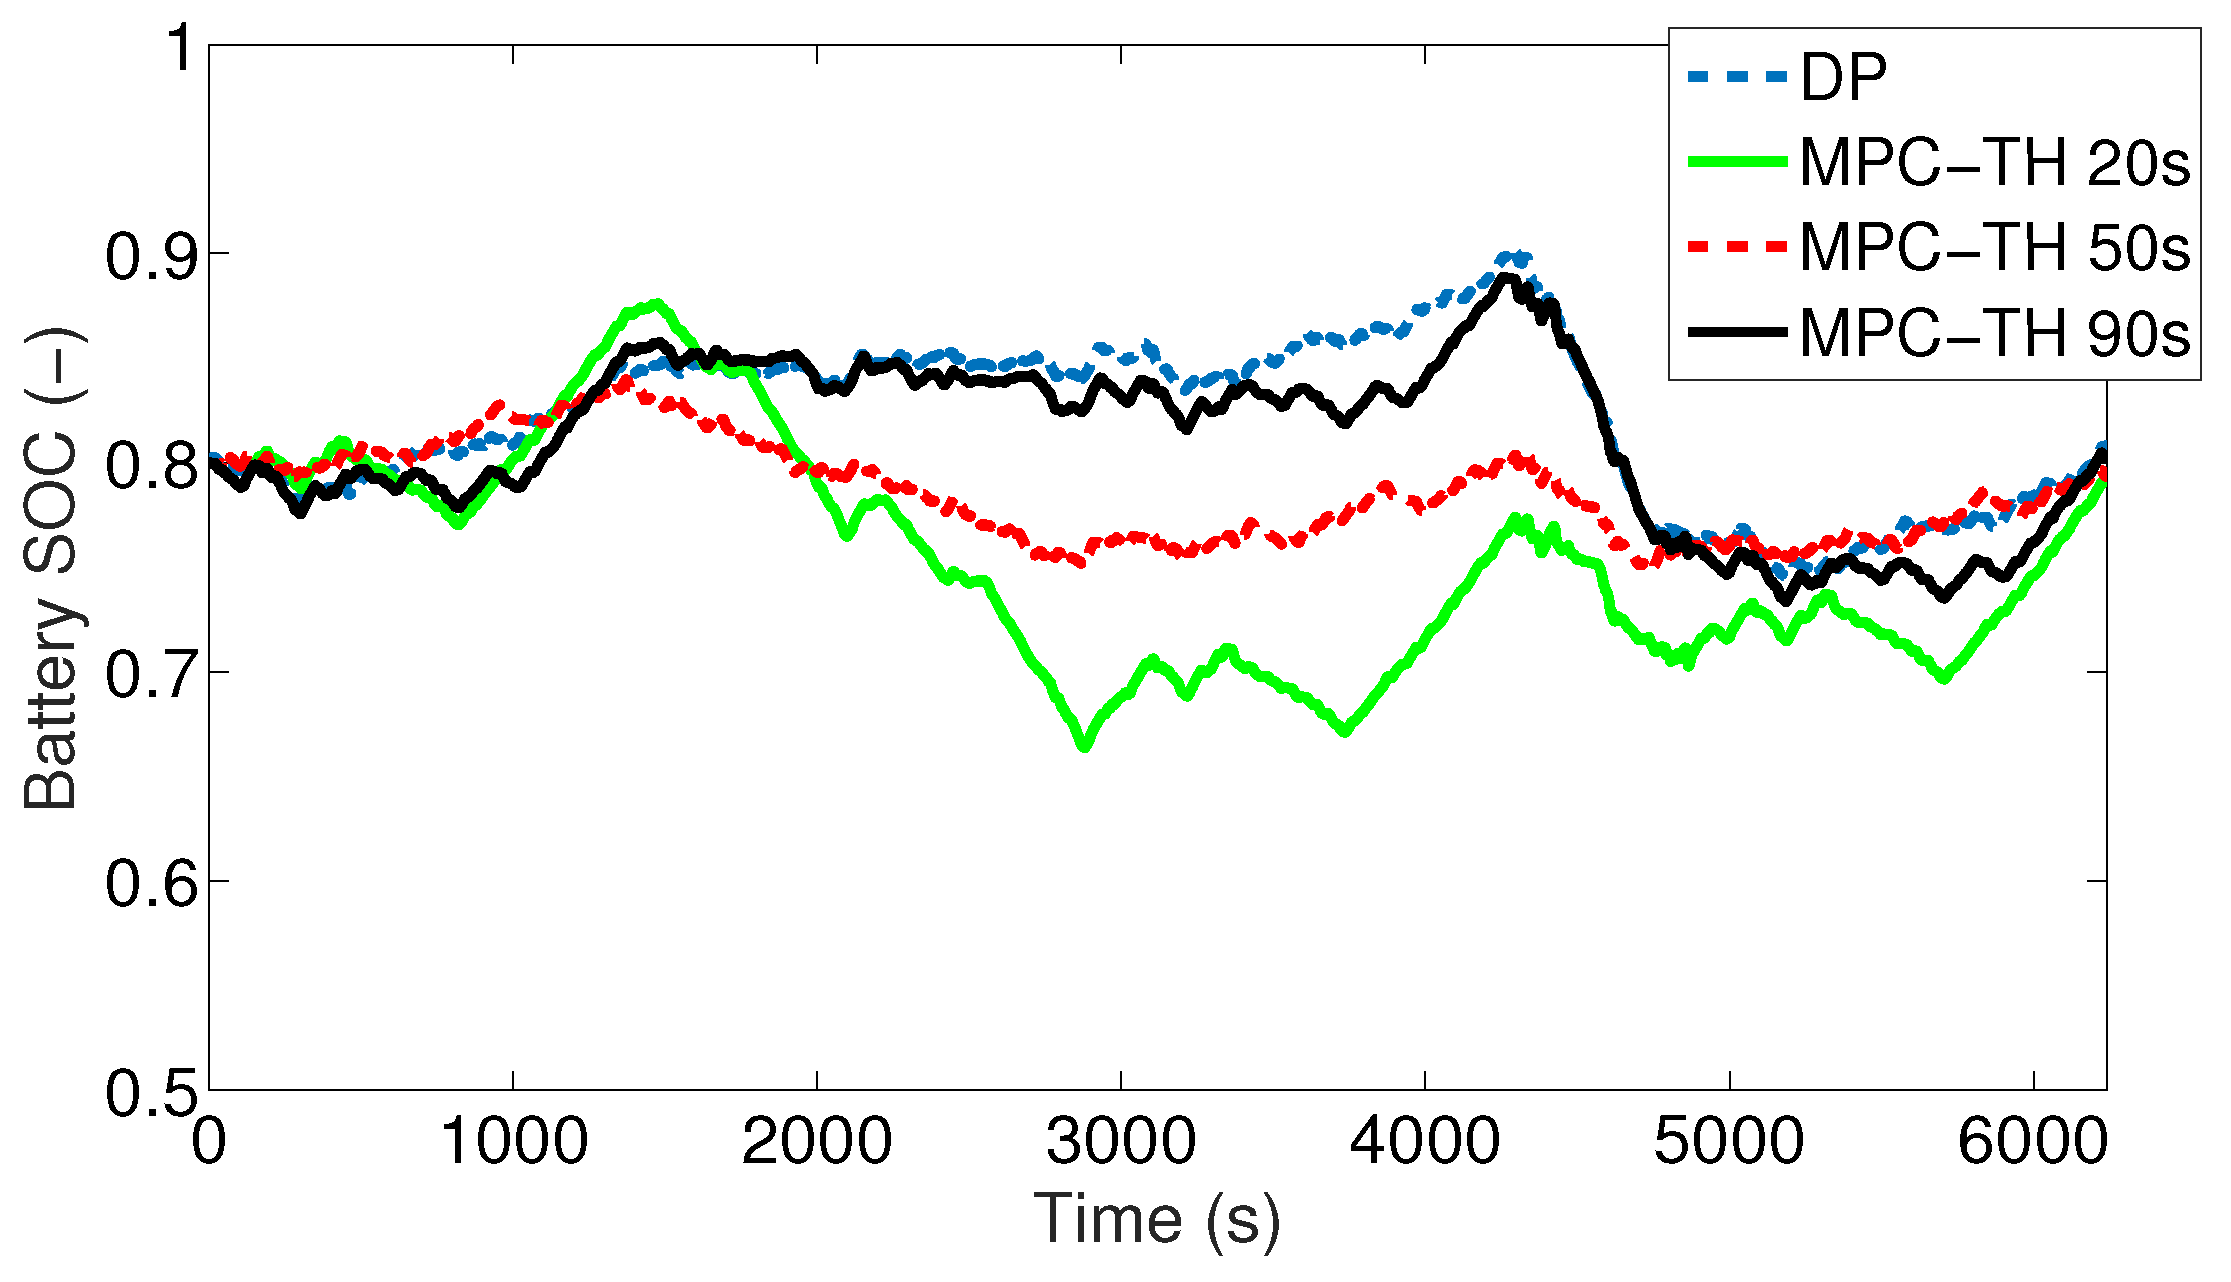
The SOC variations over the driving cycle for the DP and MPC controllers are illustrated in Figure 14. The EMC is in the charge-sustaining mode and the EMC strategy is tuned to enforce the final SOC value to match the initial SOC value at the end of the driving cycle. Moreover, Figure 14 compares the SOC profile for each EMC. The SOC variation for different prediction TH is also shown. The results in Figure 14 show that all the designed EMCs can sustain SOC at the initial SOC by the end of the driving cycle. The designed DP EMC algorithm in this work is computationally efficient. The simulation processing time on a 2.20 GHz Intel processor is about 72.6 s for the whole combined driving cycle (i.e., 11.5 ms per one second of the driving cycle).

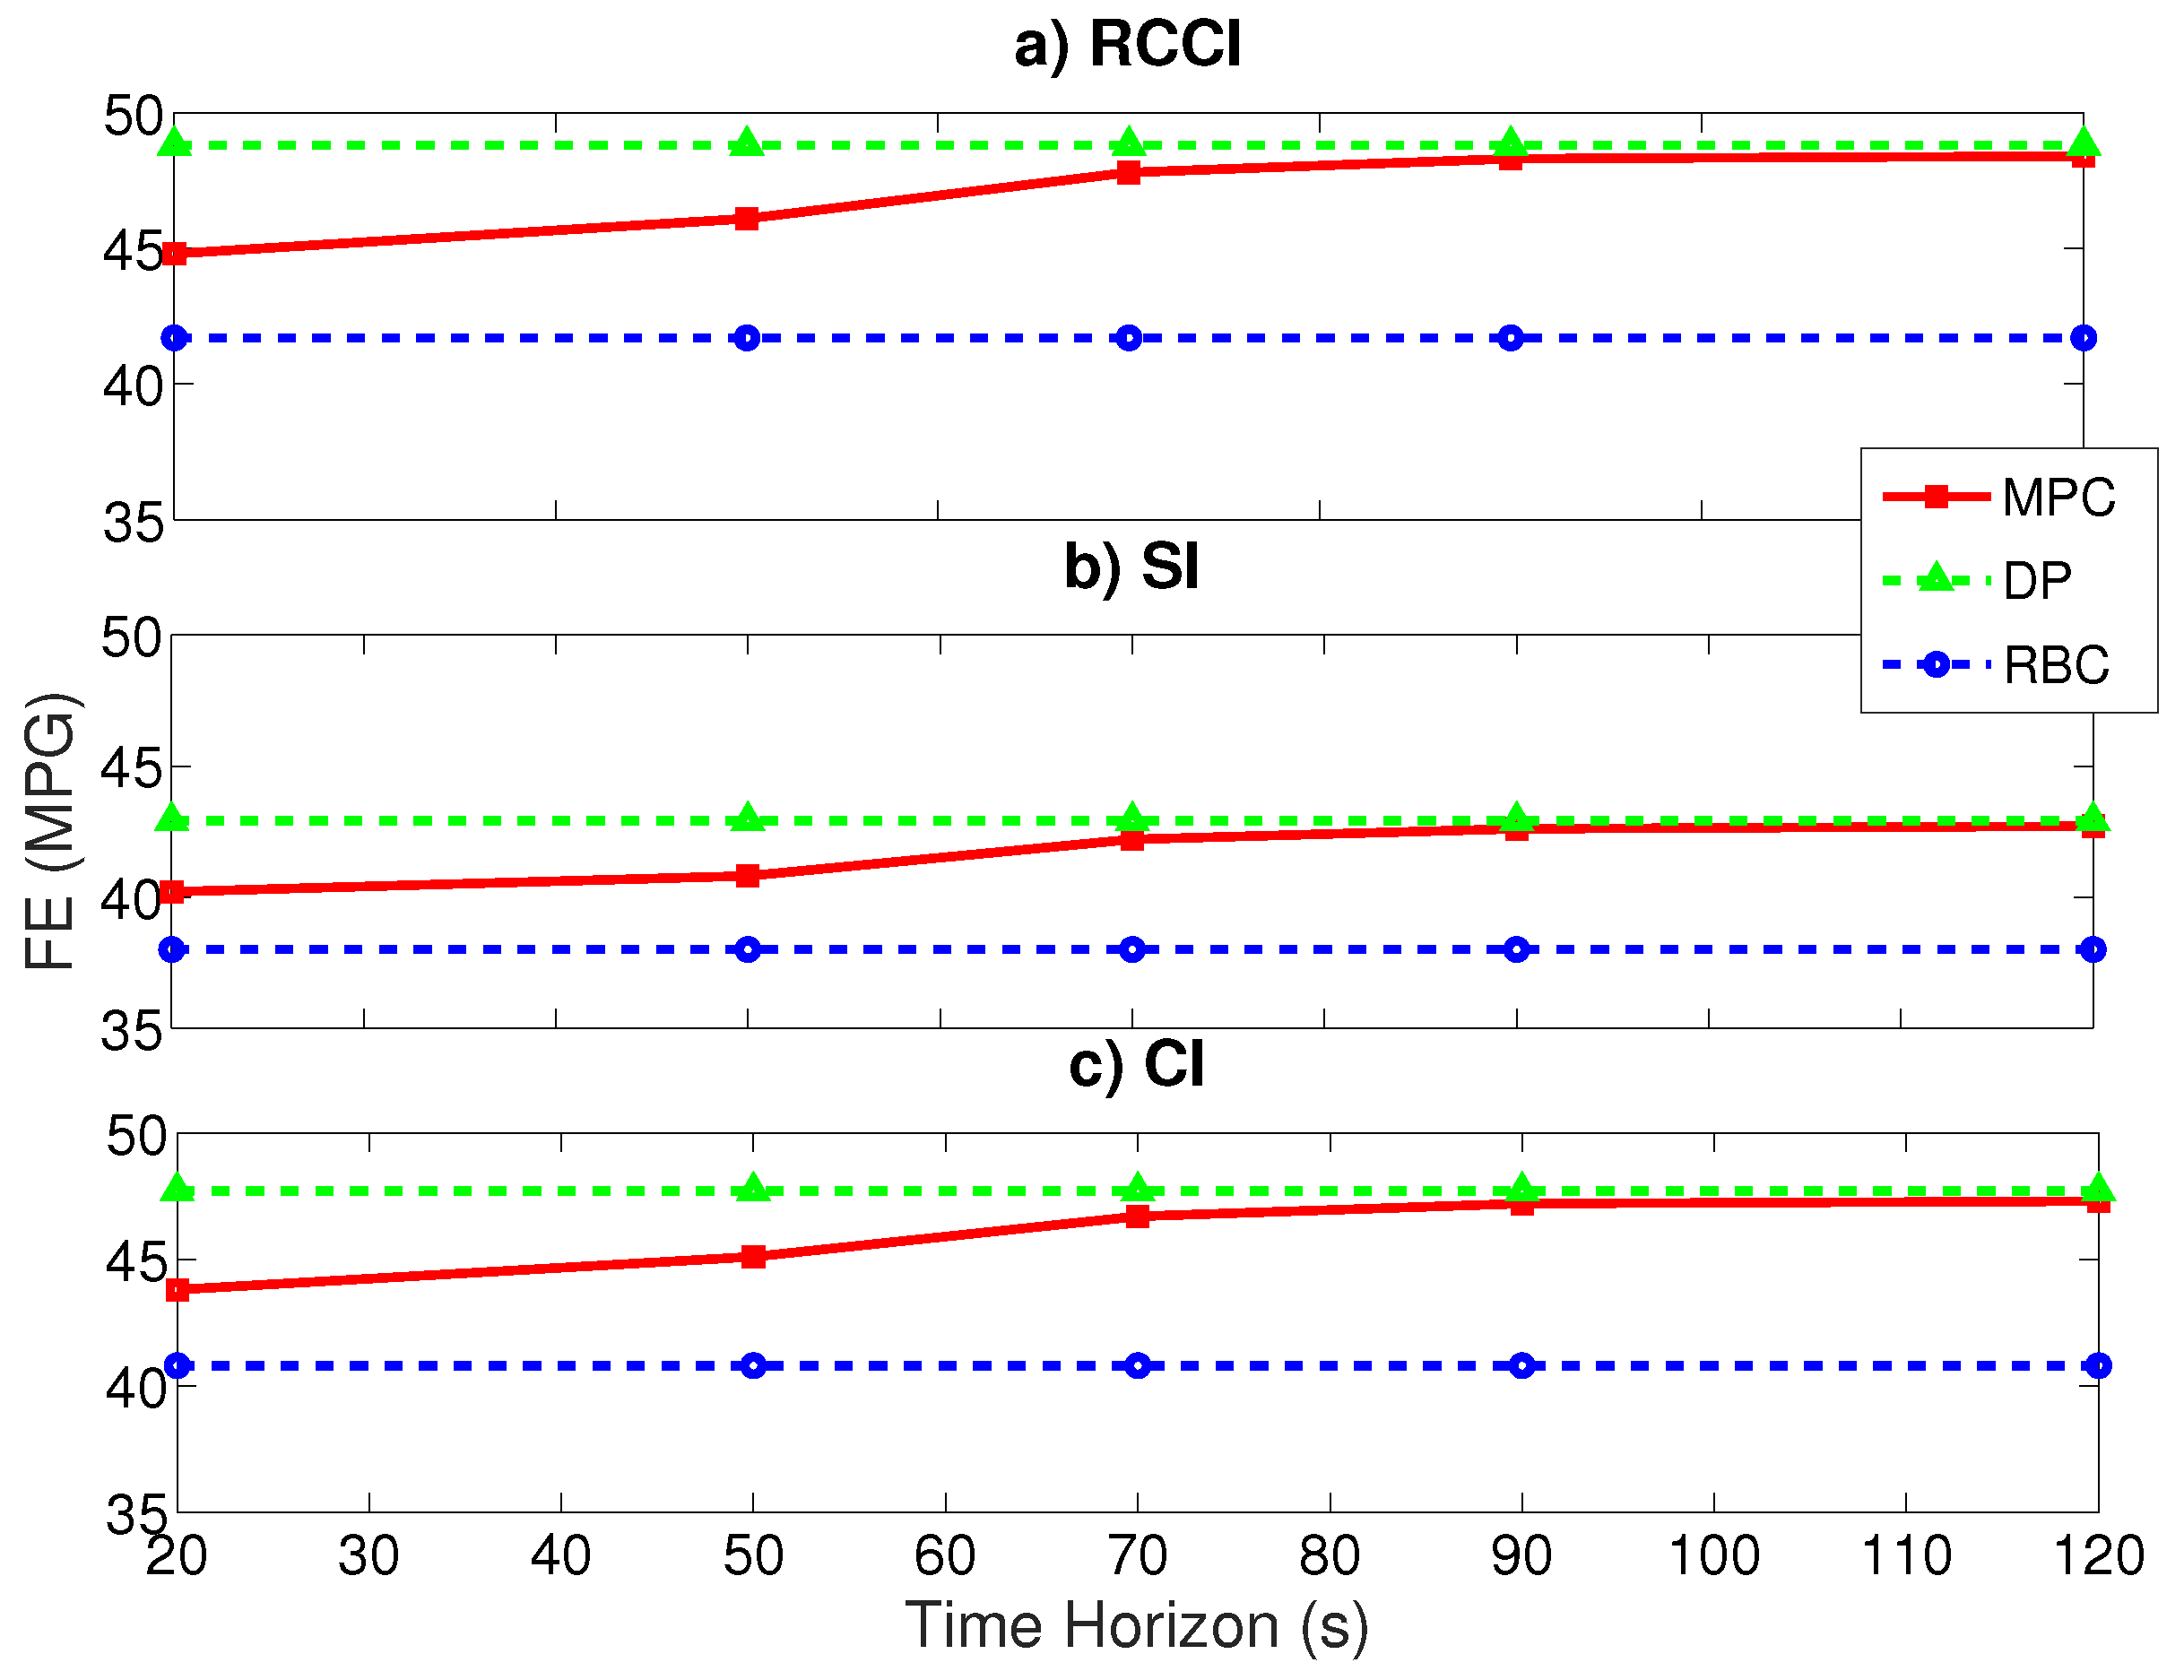
5.1. Prediction Time Horizon Sensitivity

Figure 15 demonstrates the HEV fuel economy sensitivity with the driving cycle prediction TH for different engines. It is observed that the fuel economy increases by knowing more driving cycle information (i.e., larger TH) and it reaches a plateau, in which at TH = 120 s the HEV fuel economy merges to the DP results. There is a trade-off between the computational cost and fuel saving by the MPC strategy. Higher TH improves the HEV fuel economy at the cost of needing more computation time. In these simulations, TH TH = 70 s offers a good compromise between computation load and fuel economy improvement. These results show that by knowing a short time horizon information of the vehicle’s speed profile (i.e., TH = 70 s), 95% of the global optimal fuel economy (i.e., DP) is achieved. This figure also compares different engines’ fuel economy variations with the EMC types. The RCCI engine offers the highest fuel economy compared to SI and CI engines. In the DP EMC, the RCCI engine has 5.9 and 1.1 MPG greater fuel economy than the SI and CI engines, respectively.

5.2. Initial SOC Sensitivity

In this section, the effect of running the RCCI engine in a lower initial SOC on the fuel economy is studied. The low SOC can represent operation in an extended range electric vehicle (E-REV). It is assumed the battery is operating at a lower initial SOC value (i.e., S O C i n i t i a l = 0.3 ) during the charge-sustaining mode. Fuel economy of the HEV integrated with RCCI, SI, and CI engines for different EMCs are shown in Table 5.
Comparing Figure 15 and Table 5 shows that the fuel economy is greater when the S O C i n i t i a l is higher. In the lower S O C i n i t i a l 
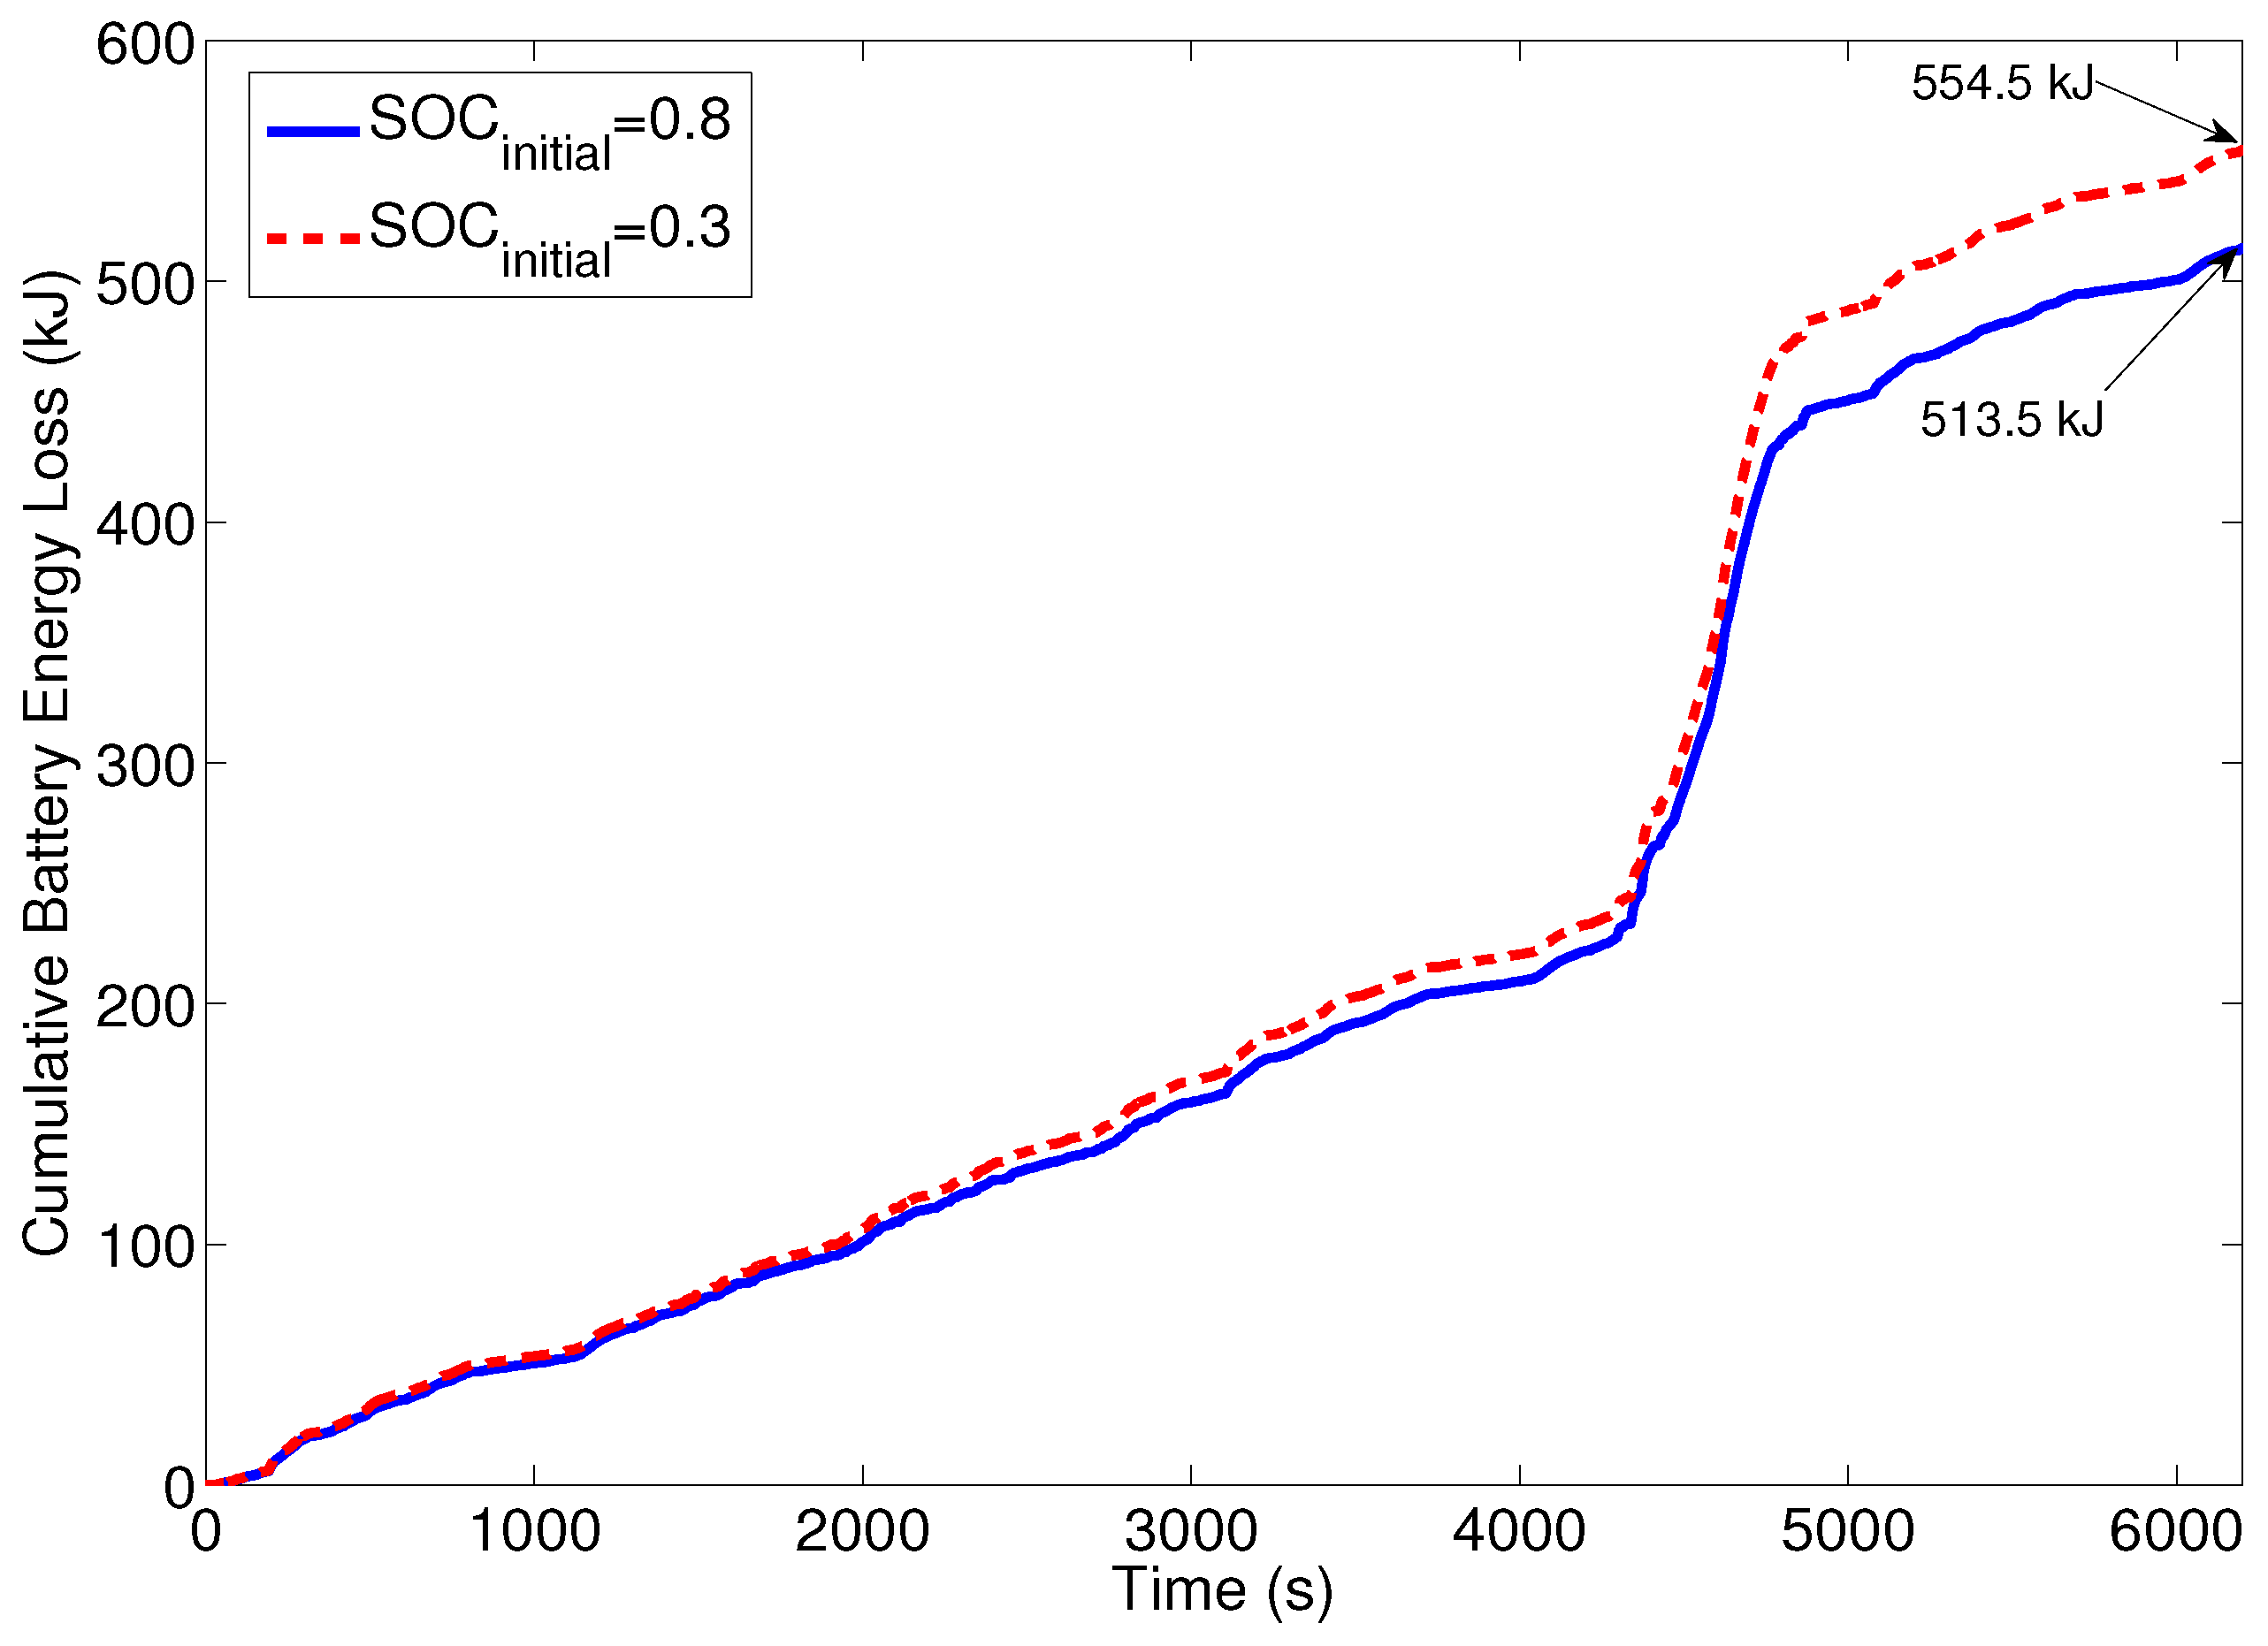
scenario, the battery has greater losses than that in higher initial SOC since the battery loss is greater in the low SOC region. Figure 16 shows the battery energy losses in both the scenarios. It can be seen that the SHEV with lower initial SOC has 31 kJ more battery energy losses than the larger SOC case in the combined driving cycle. The battery energy losses should be compensated by running the ICE for a longer time, which leads to lower fuel economy in the low S O C i n i t i a l scenario.
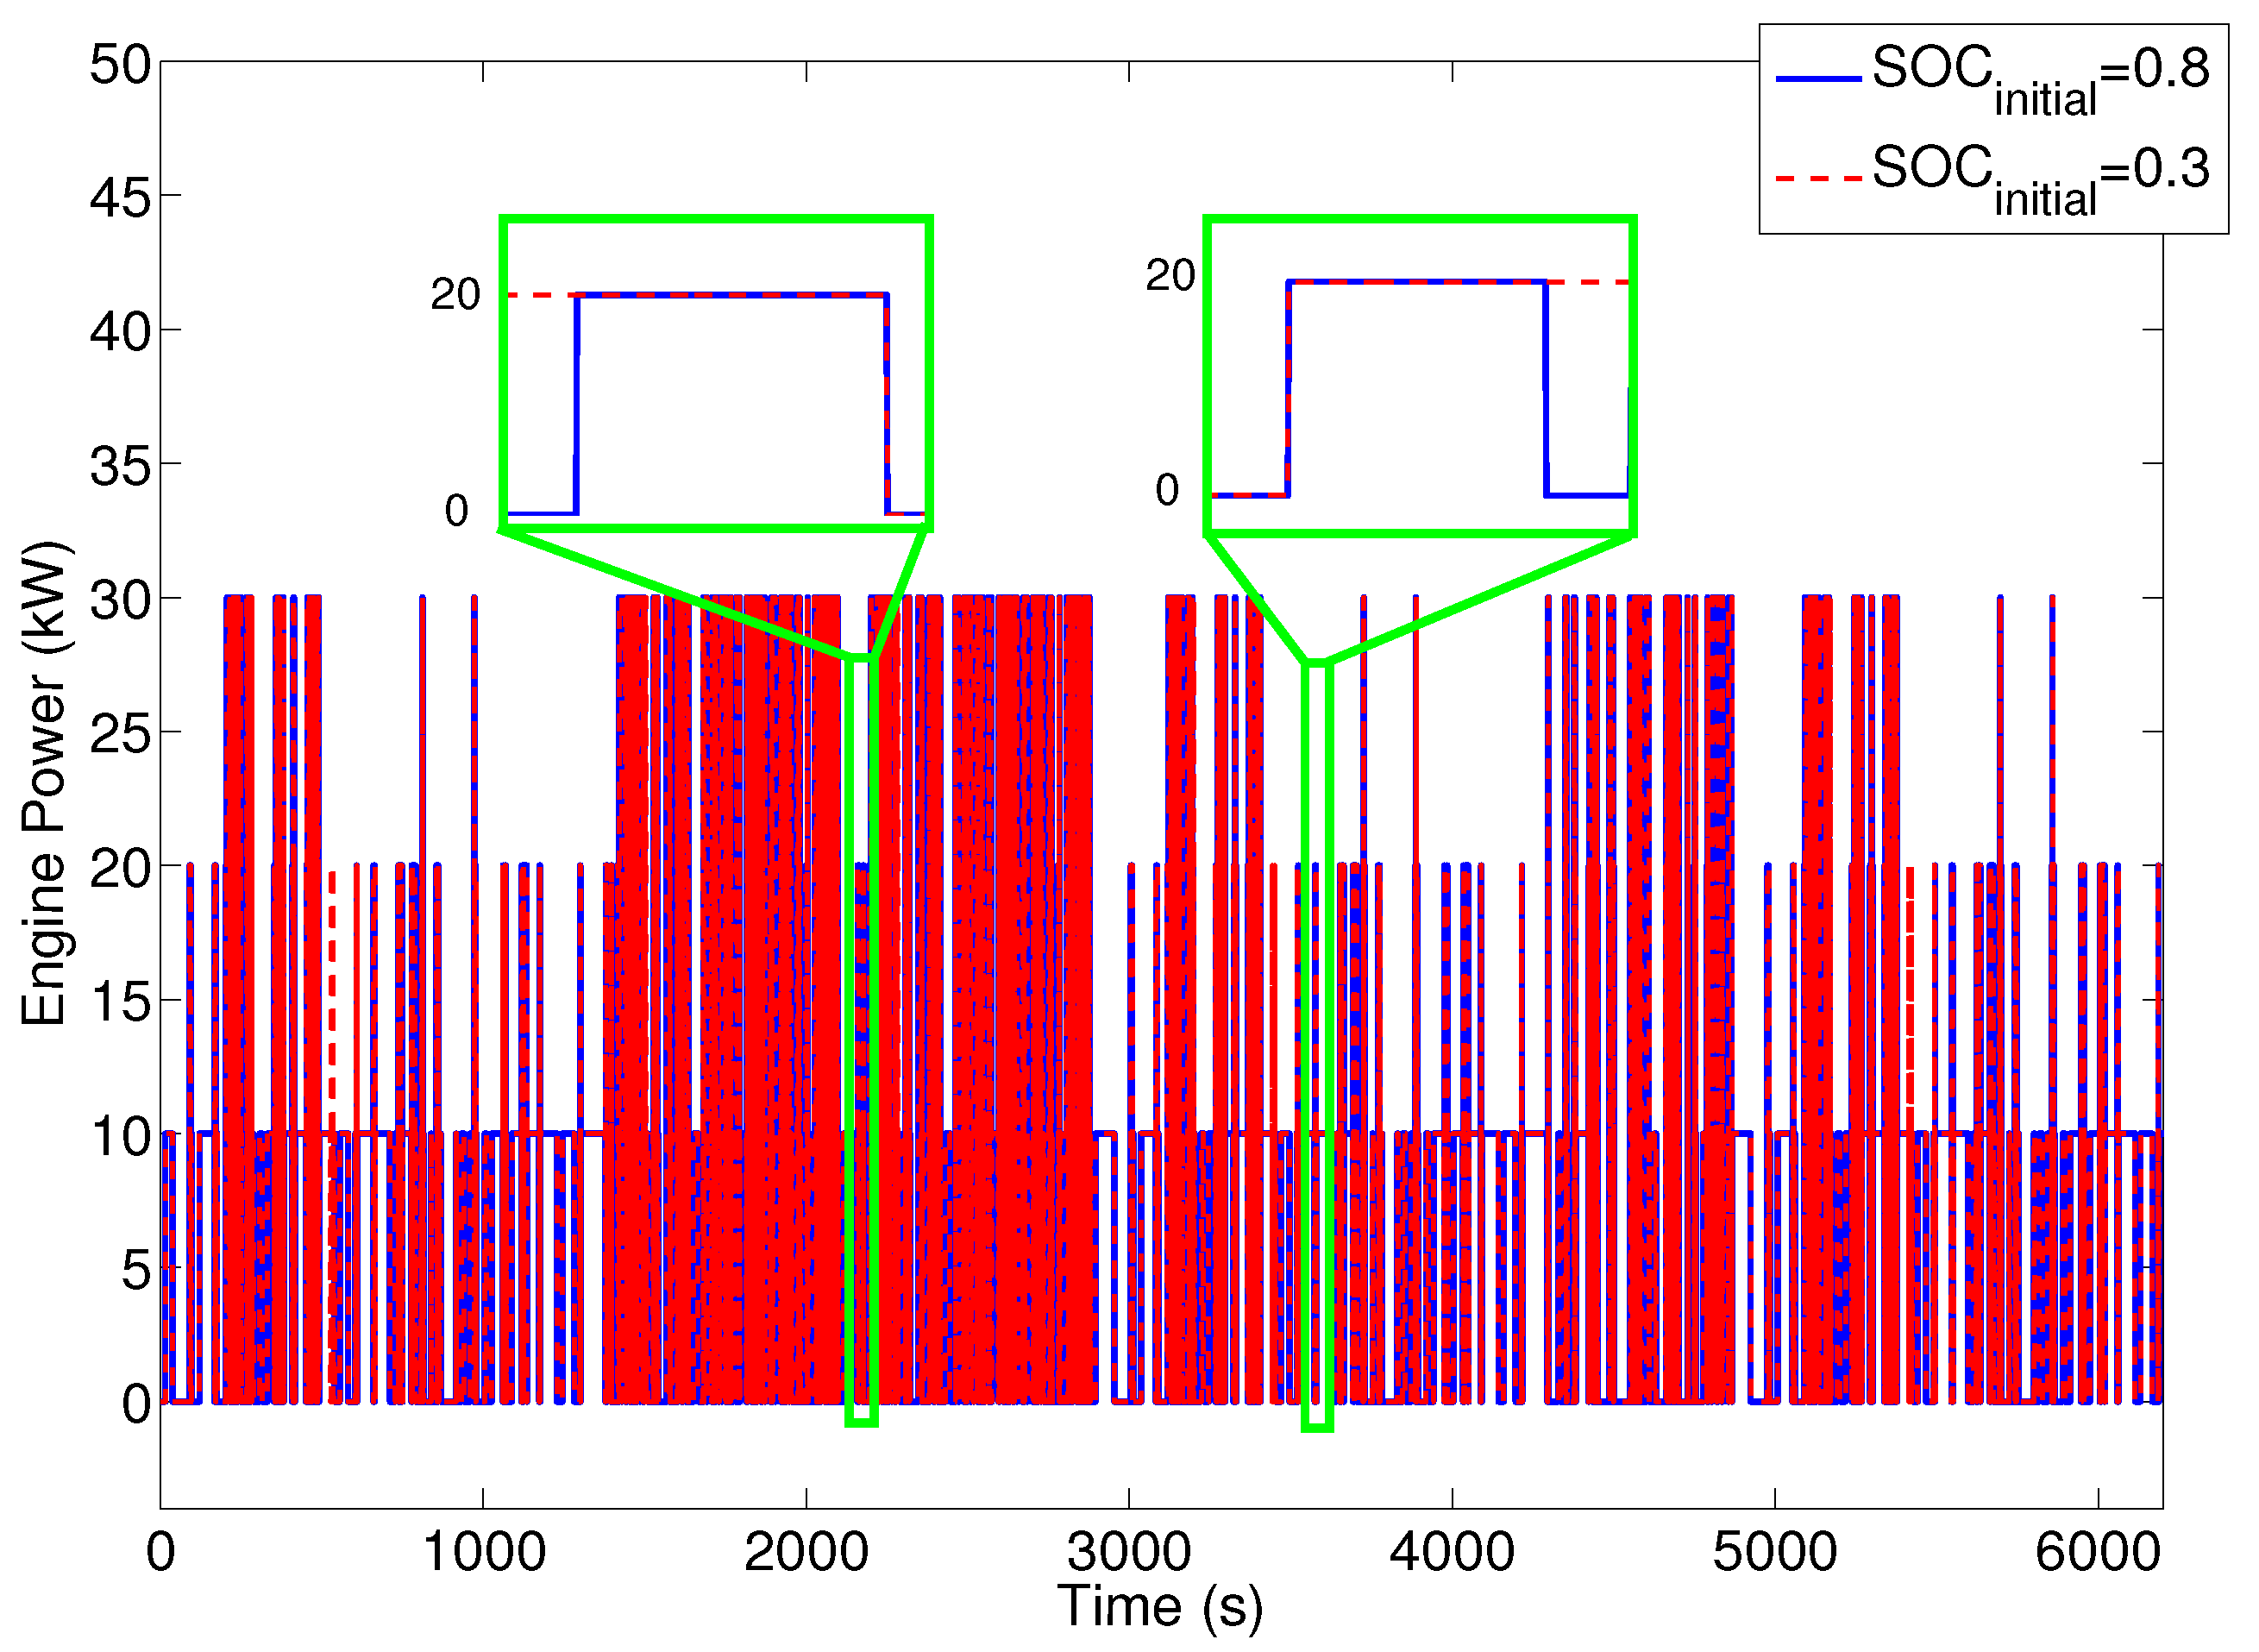
Figure 17 shows the engine produced power profile in both low S O C i n i t i a l SOC and high S O C i n i t i a l 
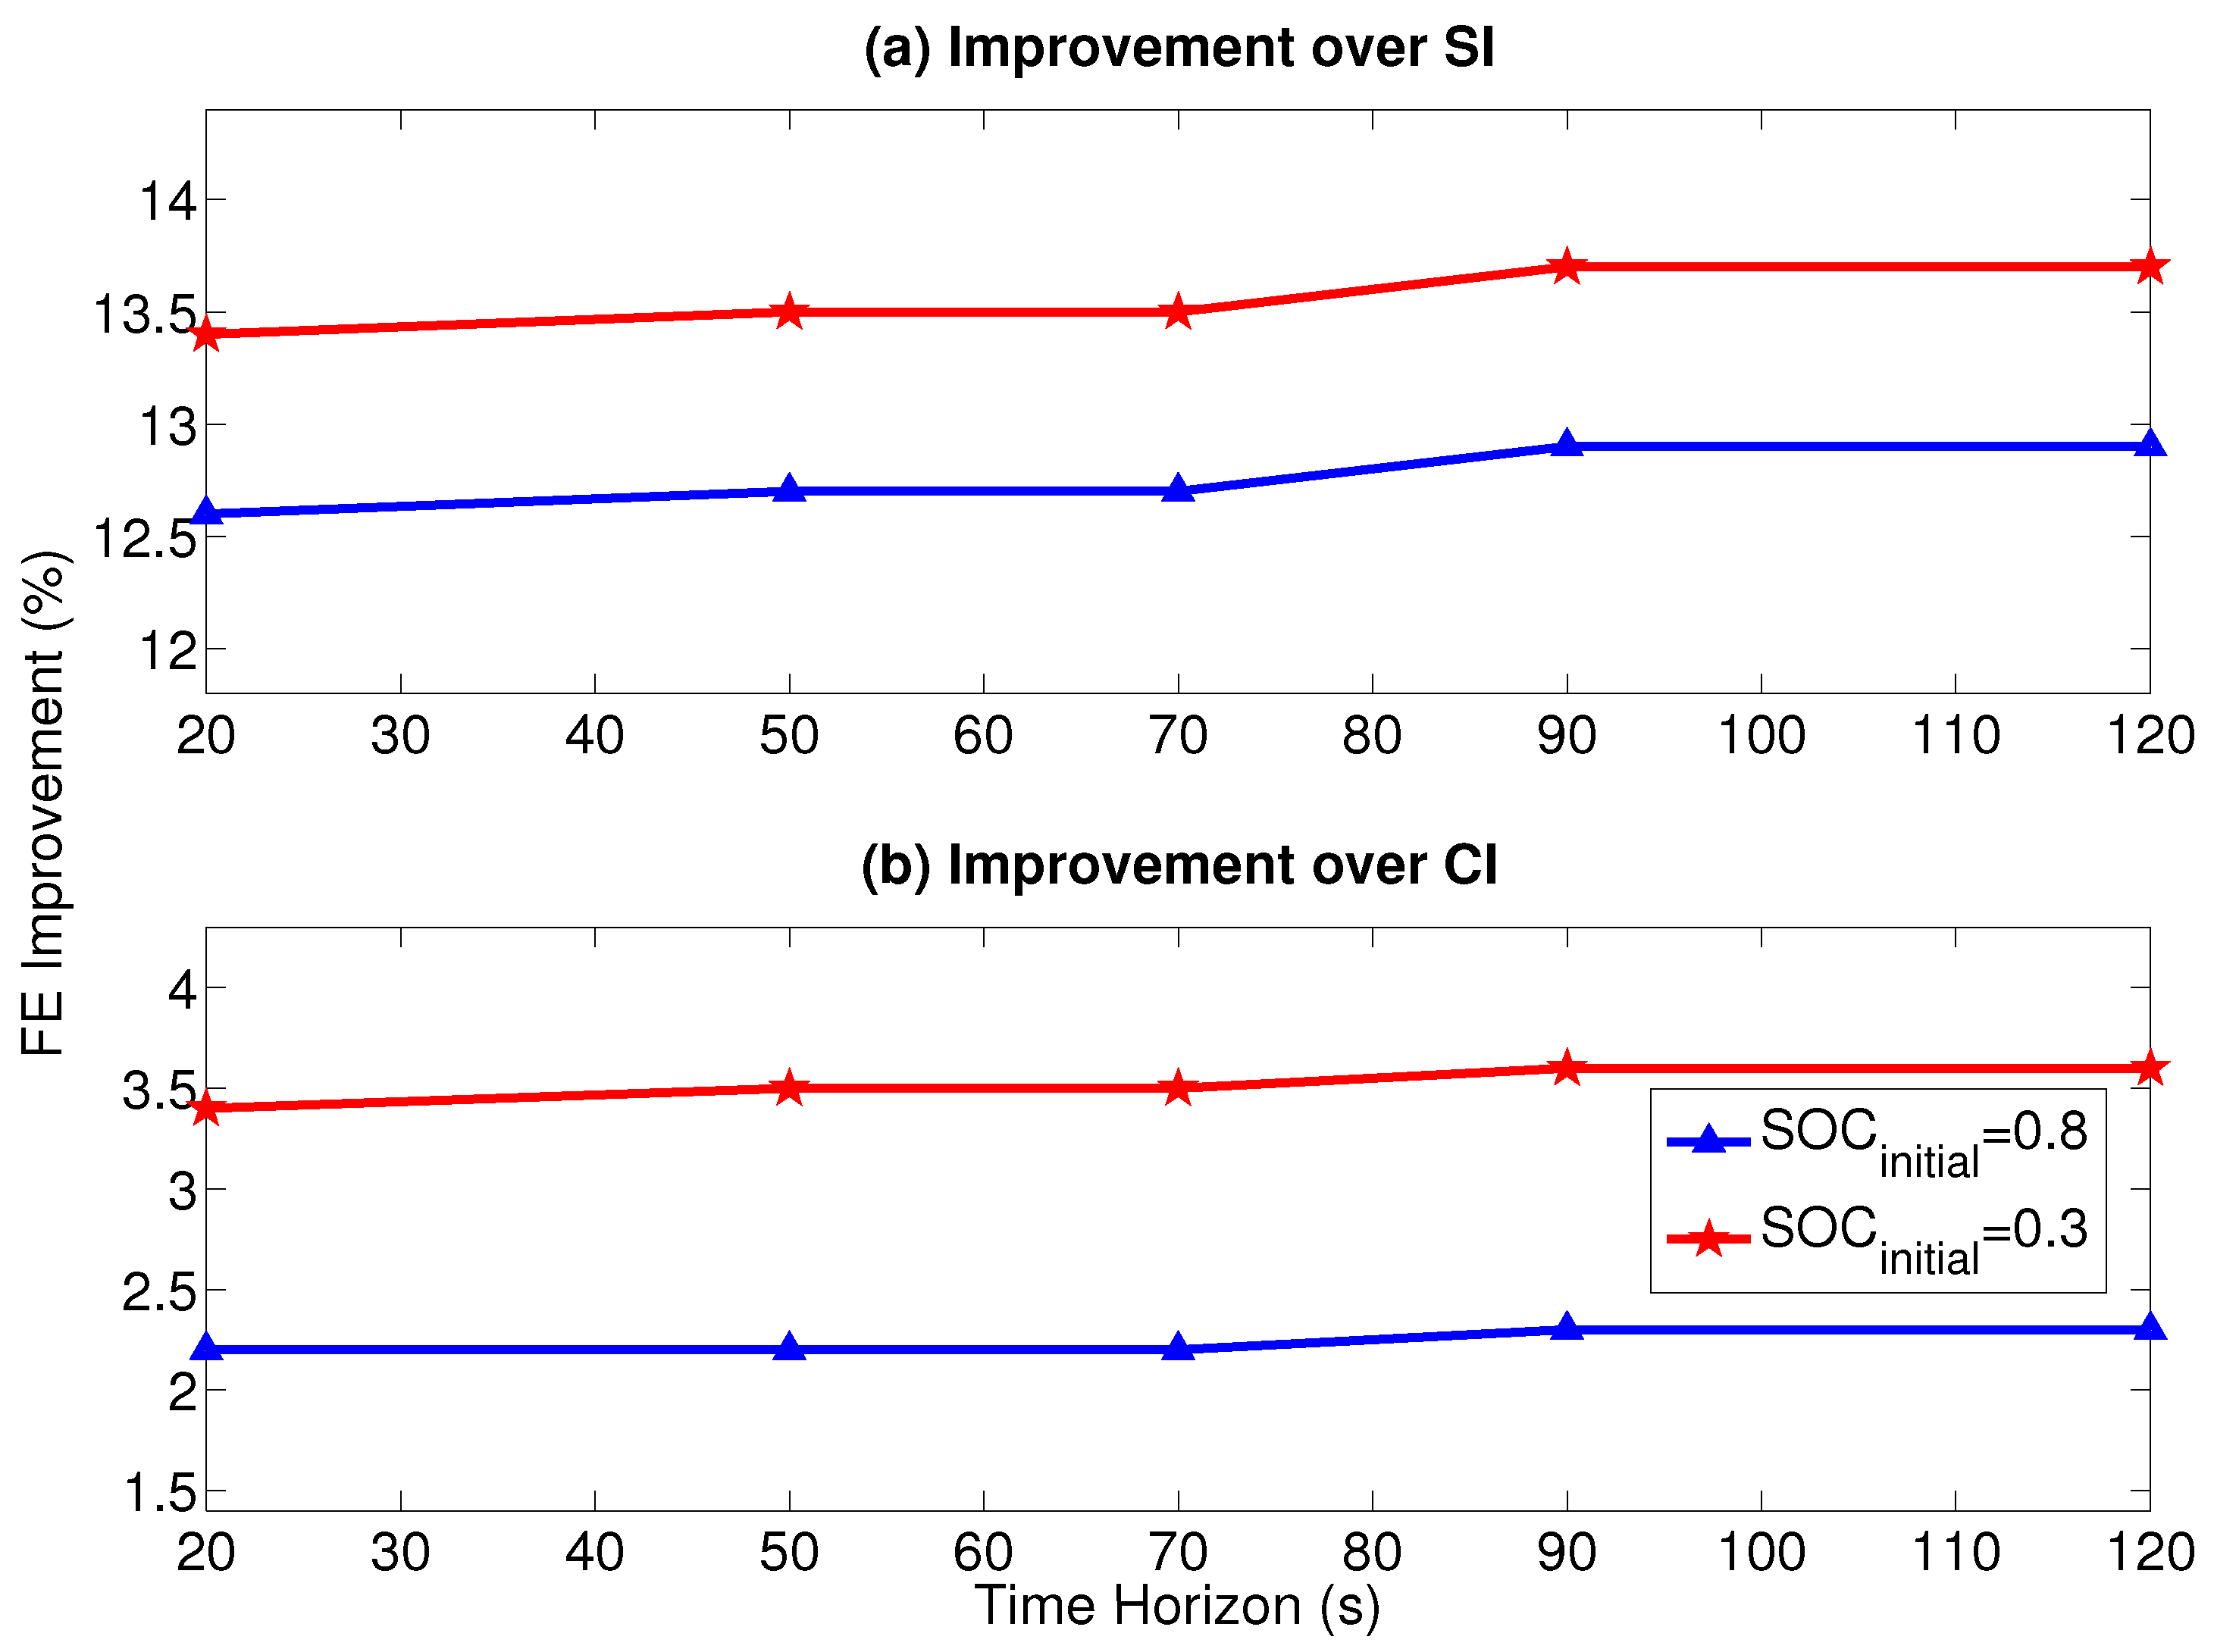
scenarios. The number of ICE on/off switching is identical in the two cases, but the engine runs for a longer time in the low initial SOC case. Therefore, the RCCI engine in this condition has more opportunity to work and consequently more fuel saving is achieved compared to the SI and CI engines. This is shown in Figure 18, where the SHEV with low S O C i n i t i a l has higher fuel economy improvement (Fuel economy improvement is calculated by F E H E V R C C I F E H E V F E H E V × 100 where F E H E V R C C I is the fuel economy for the RCCI-HEV powertrain, and F E H E V is the fuel economy for SI-HEV or CI-HEV powertrain) compared to the high S O C i n i t i a l scenario.

5.3. Driving Cycle Effect

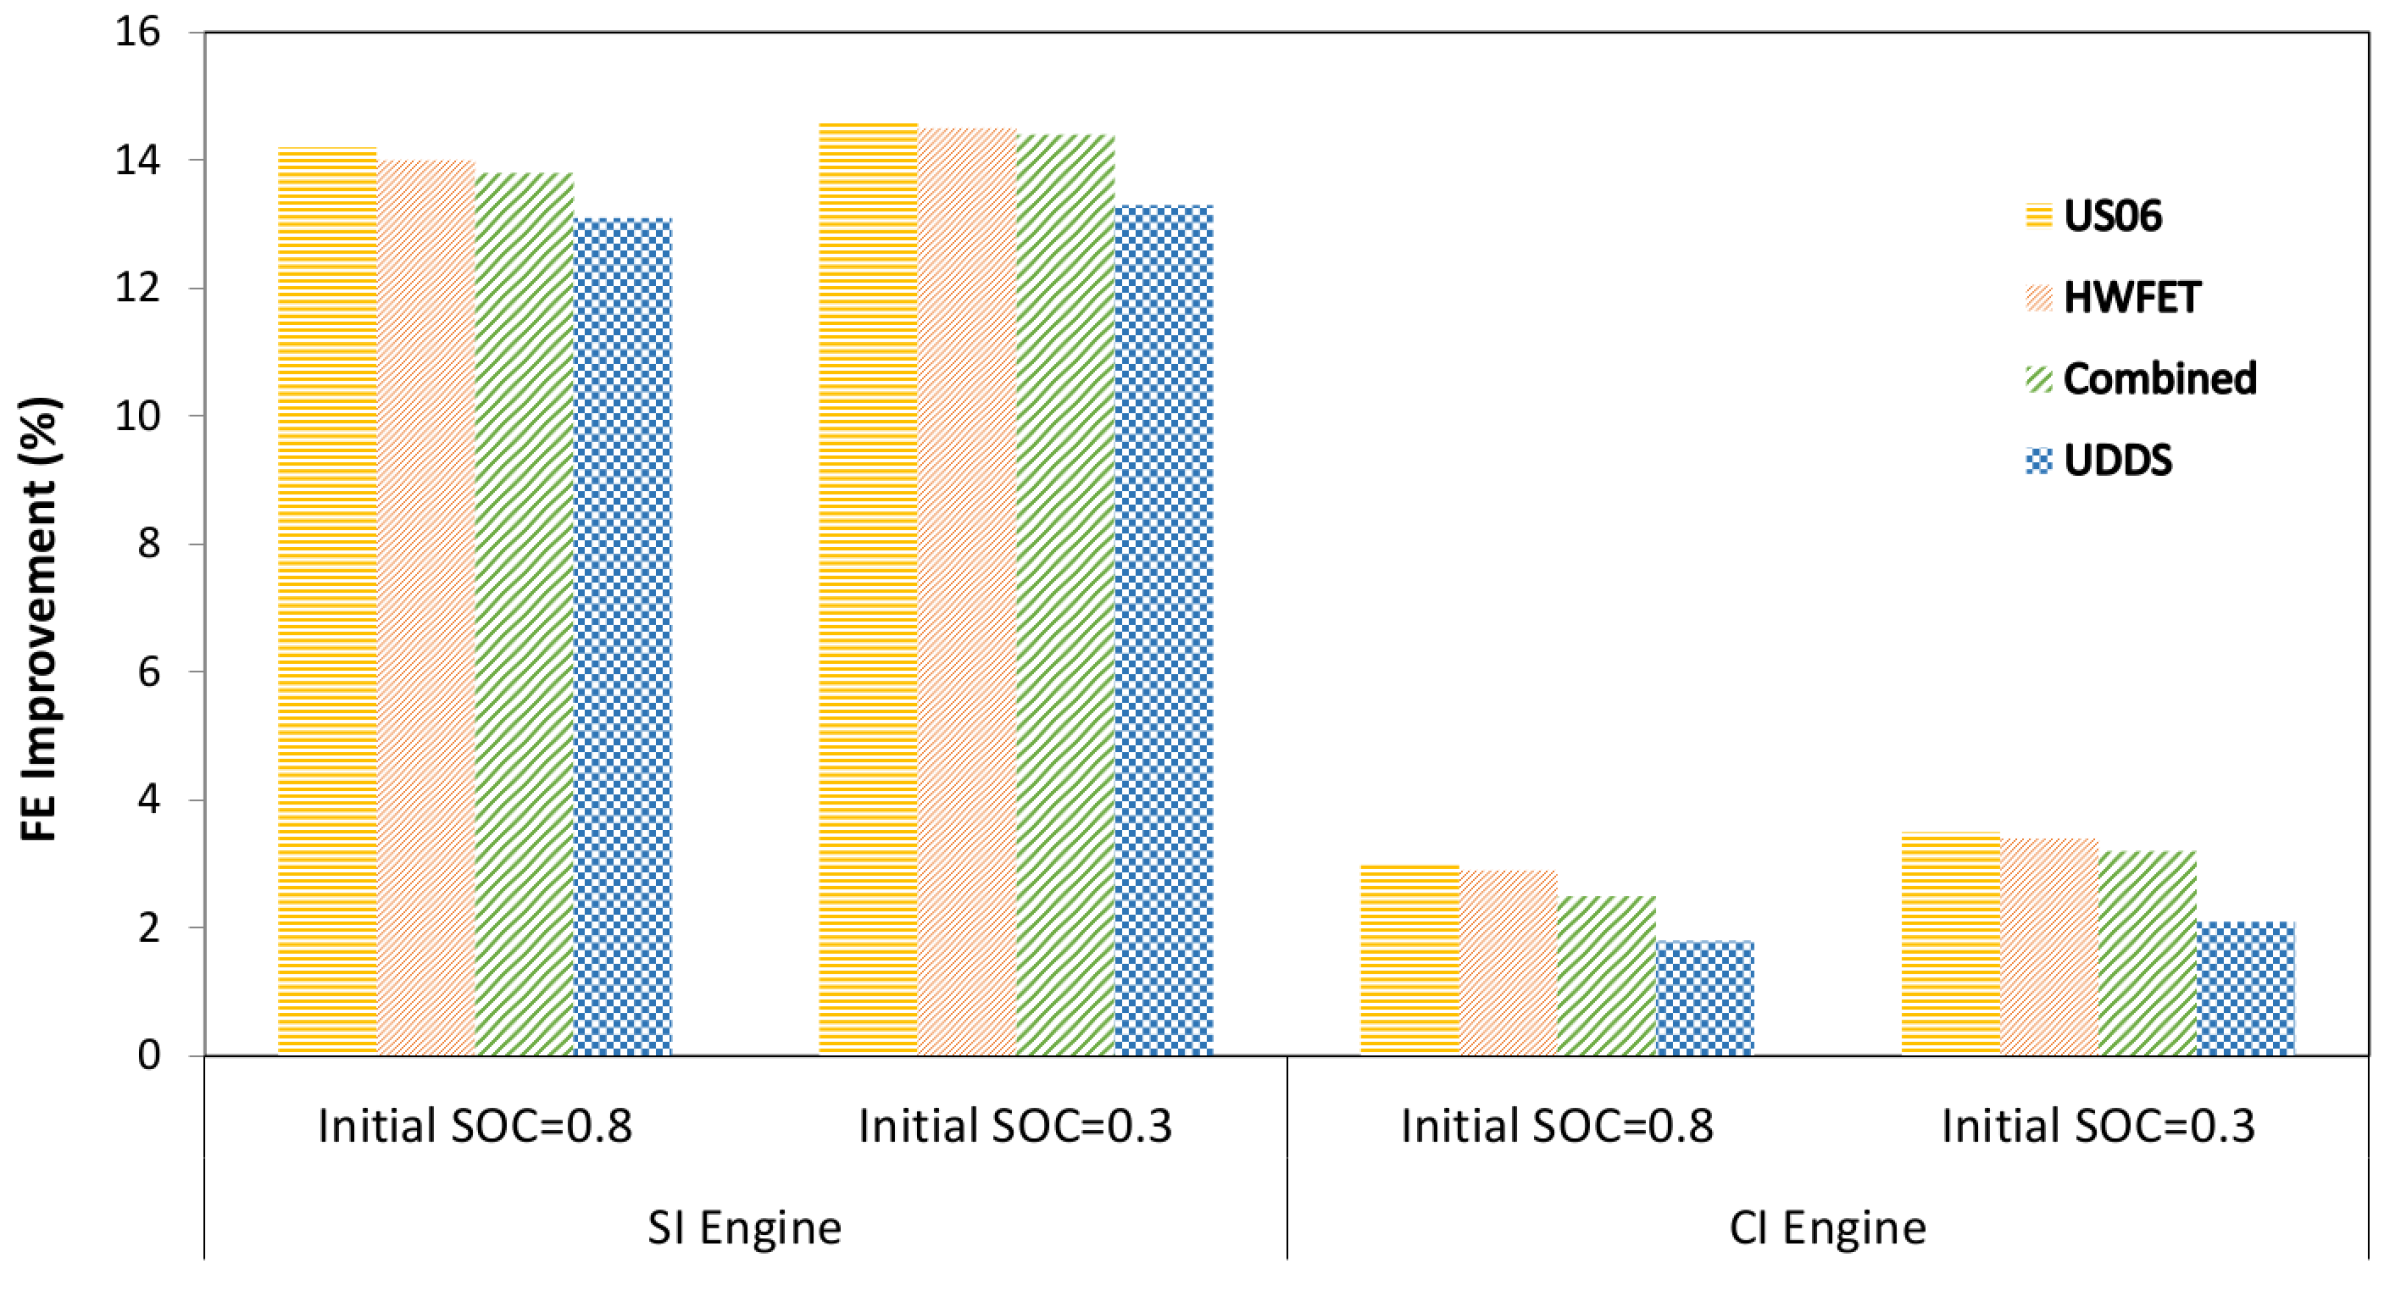
Here, the effect of using various driving cycles is investigated for the RCCI fuel economy improvement for both SHEVs with low initial SOC and high initial SOC scenarios. Four different driving cycles including US06, HWFET, UDDS, and the combined driving cycle are studied. Figure 19 shows the effect of the various driving cycles on the HEV fuel economy improvement by incorporating the RCCI engine versus conventional SI and CI engines. The fuel economy improvement of the RCCI engine versus the SI engine varies from 13.1% to 14.2% depending on driving cycles. Moreover, the fuel economy improvement versus the CI engine varies from 1.8% to 3.0%.
Table 6 lists the required average power of the HEVs in each of the studied driving cycles. By comparing Table 6 and Figure 19, it becomes clear that the average power of a driving cycle has a direct effect on the RCCI fuel economy saving over the SI and CI engines. In high power demand driving cycles (e.g., US06), the engine needs to run longer to charge the battery and compensate for the higher power demand. This gives the RCCI engine more opportunities to save more fuel since it is generally more fuel-efficient than conventional SI and CI engines. In addition, the initial SOC effect in Figure 19 is related to the difference in the length of the engine runtime, as previously mentioned in Section 5.2.

6. Conclusions

In this work, an RCCI engine was integrated with a SHEV powertrain. The fuel economy benefit of the RCCI-HEV powertrain was compared with the conventional ICE-HEV powertrains. Three different ICEs were studied, including a GM Z19DTH engine in CI and RCCI modes and a GM A14XFL SI (gasoline) engine. For a meaningful comparison among the different powertrains, the ICE produced the same amount of power for each powertrain. In selecting engine operating points, the engine-out emission constraints were considered. A high-fidelity forward-in-power SHEV model was developed in Matlab®/Simulink with experimentally validated submodels. Three different types of EMC strategies, including RBC, DP, and MPC were developed to investigate the effect of the control strategy on the potential fuel saving from an RCCI-based HEV. The following summarizes the main findings from this work:
  • The simulation results showed that the RCCI engine offers significant potential for fuel saving in SHEV architecture. In the combined driving cycle, integrating an RCCI engine with a SHEV powertrain provided up to 12.6% higher fuel economy over a modern SI engine, while the improvement over the CI-based HEV was 2.2% for the combined driving cycle.
  • An increasing number of the engine operating points can increase the RCCI-HEV fuel economy (FE) improvement by 2.1% by utilizing more engine operating points. This study did not consider fuel penalty during ICE transients between engine modes. It is anticipated that excessively frequent mode switching is not desirable for fuel saving once a large number of engine operating points is used.
  • The 3-mode DP provides the best FE improvement among the EMCs studied. Using the 3-mode DP leads to 17.0% more FE improvement compared to the RBC EMC. This demonstrates the importance of designing optimal EMC strategies to maximize the FE improvement of the RCCI-HEV.
  • In the MPC strategy, more available information from the driving cycle (larger prediction time horizon) naturally leads to better fuel economy improvement and the MPC results eventually merge to the DP optimal controller results. A prediction horizon length of 70 s showed a compromise between the computational cost and fuel economy improvement in this work.
  • Among the four driving cycles studied, the driving cycle that has higher average power ( P ¯ ) has higher RCCI fuel saving. Thus, the RCCI-HEV operating in the US06 driving cycle ( P ¯ = 19.1 kW) offered 14.2% fuel economy improvement versus 13.1% in the UDDS driving cycle ( P ¯ = 5.2 kW) in the SHEV. This was because the engine needs to run for a longer time to compensate for the higher power demand. This leads to more opportunity for the RCCI engine to save more fuel compared to the SI and CI engines.
  • RCCI-SHEV operation with a battery at low SOC in charge-sustaining mode resulted in a slightly higher fuel economy improvement for the RCCI engine in comparison to a higher initial SOC scenario. This is because the battery in a low SOC region has a larger energy loss which means that the engine is required to run for a longer time to compensate for the higher battery losses. This provides more opportunity for the RCCI engine to save more fuel in comparison to the SI and CI engines.
This study did not include a cost analysis of the HEV powertrain using the RCCI engine versus SI and CI engines in SHEV architecture. Cost analysis versus fuel saving will be the subject of future studies.

Acknowledgments

The authors acknowledge CLEERS team for providing the RCCI and CI engine maps via CLEERS on-line database. This work was partially supported by the United States National Science Foundation under Grant No. 1434273.

Author Contributions

Ali Solouk designed the optimization framework and conducted modeling, simulations, and analysis in this study. Mahdi Shahbakhti provided guidance during the course of this study and contributed in discussions for analysis of the results.

Conflicts of Interest

The authors declare no conflict of interest.

Abbreviations

BSFCBrake specific fuel consumption
CICompression ignition
DPDynamic programing
DOCDiesel oxidation catalysts
EMCEnergy management control
ECMSEquivalent consumption minimization strategy
FEFuel economy
HEVHybrid electric vehicle
HCCIHomogeneous charge compression ignition
HWFETHighway fuel economy cycle
ICEInternal combustion engine
LTCLow temperature combustion
LVDLongitudinal vehicle dynamics
MPCModel predictive control
MPGMiles per gallon
NOxNitrogen oxides
PHEVPlug-in hybrid electric vehicle
PCCIPremixed charge compression ignition
PMParticulate matter
PMPPontryagin minimum principle
RCCIReactivity controlled compression ignition
RMSERoot mean square error
RBCRule-based controller
SDCStochastic dynamic programming
SOCState of charge
P d Driver power demand (kW)
P e n g Engine generated power (kW)
P d , e n g Engine demand power (kW)
P p p s Generated peak power source (kW)
P d , p p s Demanded peak power source (kW)
P g e n ( 1 ) Generated power from the generator to supply the E-motor (kW)
P g e n ( 2 ) Generated power from the generator to charge the battery (kW)
P m o t o r Motor generated power (kW)
P a v a i l a b l e Available electrical power in the battery (kW)
P r e q Driver requested power (kW)
P f p a t h Required engine power (kW)
P b p a t h Required battery power (kW)
QBattery nominal capacity (Ah)
RBattery internal resistance (Ω)
R w Wheel radius (m)
ρAir density ( kg m 3 )
SMinimum energy consumption (J)
T e n g Engine generated torque (Nm)
T m o t o r E-motor applied torque to wheels (Nm)
VActual vehicle speed (mph)

References

  1. Malikopoulos, A.A. Supervisory Power Management Control Algorithms for Hybrid Electric Vehicles: A survey. IEEE Trans. Intell. Transp. 2014, 15, 12–71. [Google Scholar] [CrossRef]
  2. Davis, S.C.; Diegel, S.W.; Boundy, R.G. EPA and NHTSA Set Standards to Reduce Greenhouse Gases and Improve Fuel Economy for Model Years 2017–2025 Cars and Light Trucks; U.S. Environmental Protection Agency: Washington, DC, USA, 2012.
  3. European Commission Climate Action. Available online: http://ec.europa.eu/clima/policies (accessed on 10 May 2016).
  4. Li, J.; Yang, W.M.; An, H.; Zhao, D. Effects of Fuel Ratio and Injection Timing on Gasoline/Biodiesel Fueled RCCI Engine: A Modeling Study. Appl. Energy 2015, 155, 59–67. [Google Scholar] [CrossRef]
  5. Reitz, R.; Duraisamy, G. Review of High Efficiency and Clean reactivity controlled compression ignition (RCCI) Combustion in internal combustion engines. Prog. Energy Combust. Sci. 2015, 46, 12–71. [Google Scholar] [CrossRef]
  6. McCarthy, T. Systems Approach to Making Optimal Powertrain Technology Choices—A Global OEM’s Perspective. In Proceedings of the ASME ICE Fall Technical Conference, Dearborn, MI, USA, 13–16 October 2013.
  7. Brahma, A.; Glenn, B.; Guezennec, Y.; Miller, T.; Rizzoni, G.; Washington, G. Modeling, Performance Analysis and Control Design of a Hybrid Sport-Utility Vehicle. In Proceedings of the 1999 IEEE International Conference on Control Applications, Kohala Coast, HI, USA, 22–27 August 1999.
  8. Jalil, N.; Salman, M. A Rule-Based Energy Management Strategy for a Series Hybrid Vehicle. In Proceedings of American Control Conference, Albuquerque, NM, USA, 4–6 June 1997.
  9. Serrao, L.; Onori, S.; Rizzoni, G. A Comparative Analysis of Energy Management Strategies for Hybrid Electric Vehicles. ASME J. Dyn. Syst. Meas. Control 2000, 133, 031012. [Google Scholar] [CrossRef]
  10. Li, S.G.; Sharkh, S.M.; Walsh, F.C.; Zhang, C.N. Energy and Battery Management of a Plug-In series hybrid electric vehicle Using Fuzzy Logic. IEEE Trans. Veh. Technol. 2011, 60, 3571–3585. [Google Scholar] [CrossRef]
  11. Sciarretta, A.; Serrao, L.; Dewangan, P.C.; Tona, P.; Bergshoeff, E.; Bordons, C.; Charmpa, L.; Elbert, P.; Eriksson, L.; Hofman, T. A Control Benchmark on The Energy Management of a Plug-In Hybrid Electric Vehicle. Control Eng. Pract. 2014, 29, 287–298. [Google Scholar] [CrossRef]
  12. Tribioli, L.; Barbieri, M.; Capata, R.; Sciubba, E.; Jannelli, E.; Bella, G. A Real Time Energy Management Strategy for Plug-In Hybrid Electric Vehicles Based on Optimal Control Theory. Energy Procedia 2014, 45, 949–958. [Google Scholar] [CrossRef]
  13. Xia, C.; Zhang, C. Power management strategy of hybrid electric vehicles based on quadratic performance index. Energies 2015, 8, 12458–12473. [Google Scholar] [CrossRef]
  14. Brahma, A.; Guezennec, Y.; Rizzoni, G. Optimal Energy Management in series hybrid electric vehicles. In Proceedings of the American Control Conference, Chicago, IL, USA, 28–30 June 2000.
  15. Chen, B.C.; Wu, Y.Y.; Tsai, H.C. Design and Analysis of Power Management Strategy for Range Extended Electric Vehicle Using dynamic programming. Appl. Energy 2014, 113, 1764–1774. [Google Scholar] [CrossRef]
  16. Rezaei, A.; Burl, J.B. Prediction of Vehicle Velocity for model predictive control. IFAC-PapersOnLine 2015, 48, 257–262. [Google Scholar] [CrossRef]
  17. Wang, X.; He, H.; Sun, F.; Zhang, J. Application Study on the dynamic programming Algorithm for Energy Management of Plug-in Hybrid Electric Vehicles. Energies 2015, 8, 3225–3244. [Google Scholar] [CrossRef]
  18. Lin, C.; Peng, H.; Grizzle, J.W. A Stochastic Control Strategy for Hybrid Electric Vehicles. In Proceedings of the American Control Conference, Boston, MA, USA, 30 June–2 July 2004.
  19. Zhang, S.; Xiong, R. Adaptive Energy Management of a Plug-in Hybrid Electric Vehicle Based on Driving Pattern Recognition and dynamic programming. Appl. Energy 2015, 155, 68–78. [Google Scholar] [CrossRef]
  20. Sciarretta, A.; Back, M.; Guzzella, L. Optimal Control of Parallel Hybrid Electric Vehicles. IEEE Trans. Control Syst. Technol. 2004, 12, 352–363. [Google Scholar] [CrossRef]
  21. Ahn, K.; Whitefoot, J.; Babajimopoulos, A.; Ortiz-Soto, E.; Papalambros, P. Homogenous charge compression ignition Technology Implemented in a Hybrid Electric Vehicle: System Optimal Design and Benefit Analysis for a Power-Split Architecture. J. Automob. Eng. 2012, 227, 87–98. [Google Scholar] [CrossRef]
  22. Shabbir, W.; Evangelou, S.A. Real-Time Control Strategy to Maximize Hybrid Electric Vehicle Powertrain Efficiency. Appl. Energy 2014, 135, 512–522. [Google Scholar] [CrossRef]
  23. Kermani, S.; Delprat, S.; Guerra, T.; Trigui, R.; Jeanneret, B. Predictive Energy Management for Hybrid Vehicle. Control Eng. Pract. 2012, 20, 408–420. [Google Scholar] [CrossRef]
  24. Back, M.; Simons, M.; Kirschaum, F.; Krebs, V. Predictive control of drivetrains. In Proceedings of the 15th IFAC World Congress, Barcelona, Spain, 21–26 July 2002.
  25. Fan, J.; Zhang, J.; Shen, T. Map-Based Power-Split Strategy Design with Predictive Performance Optimization for Parallel Hybrid Electric Vehicles. Energies 2015, 8, 9946–9968. [Google Scholar] [CrossRef]
  26. Opila, D.F.; Wang, X.; McGee, R.; Gillespie, R.B.; Cook, J.; Grizzle, J.W. An energy management controller to Optimally Trade Off Fuel Economy and Drivability for Hybrid Vehicles. IEEE Trans. Control Syst. Technol. 2012, 20, 1490–1506. [Google Scholar] [CrossRef]
  27. Johri, R.; Salvi, A.; Filipi, Z. Optimal Energy Management For a Hybrid Vehicle Using Neuro-dynamic programming to Consider Transient Engine Operation; ASME DSCC Paper No. 2011-6138; ASME DSCC: New York, NY, USA, 2011. [Google Scholar]
  28. Albert, I.J.; Kahrimanovic, E.; Emadi, A. Diesel Sport Utility Vehicles with Hybrid Electric Drive Trains. IEEE Trans. Veh. Technol. 2004, 53, 1247–1256. [Google Scholar] [CrossRef]
  29. Hu, X.; Murgovski, N.; Johannesson, L.; Egardt, B. Energy Efficiency Analysis of a Series Plug-In Hybrid Electric Bus with Different Energy Management Strategies and Battery Sizes. Appl. Energy 2013, 111, 1001–1009. [Google Scholar] [CrossRef]
  30. Shams-Zahraei, M.; Kouzani, A.; Kutter, S.; Bäker, B. Integrated Thermal and Energy Management of Plug-in Hybrid Electric Vehicles. J. Power Sources 2012, 216, 237–248. [Google Scholar] [CrossRef]
  31. Kessels, J.T.B.A.; Koot, M.W.T.; Van den Bosch, P.P.J.; Kok, D.B. Online Energy Management for Hybrid Electric Vehicles. IEEE Trans. Veh. Technol. 2008, 57, 3428–3440. [Google Scholar] [CrossRef]
  32. Kawamoto, N.; Naiki, K.; Kawai, T.; Shikida, T.; Tomatsuri, M. Development of New 1.8-Liter Engine for Hybrid Vehicles; SAE Paper No. 2009-01-1961; SAE: Troy, MI, USA, 2009. [Google Scholar]
  33. Yonekawa, A.; Ueno, M.; Watanabe, O.; Ishikawa, N. Development of New Gasoline Engine for ACCORD Plug-in Hybrid; SAE Paper No. 2013-01-1738; SAE: Troy, MI, USA, 2013. [Google Scholar]
  34. Delorme, A.; Rouseau, A.; Wallner, T.; Ortiz-Soto, E.; Babajimopolous, A.; Assanis, D. Evaluation of Homogeneous Charge compression ignition (HCCI) Engine Fuel Savings for Various Electric Drive Powertrains. In Proceedings of the 25th World Battery, Hybrid and Fuel Cell Electric Vehicle Symposium & Exhibition, Shenzhen, China, 5–9 November 2010.
  35. Lawler, B.; Ortiz-Soto, E.; Gupta, R.; Peng, H.; Filipi, Z. Hybrid Electric Vehicle Powertrain and Control Strategy Optimization to Maximize the Synergy with a Gasoline HCCI Engine. SAE Int. J. Engines 2011, 4, 1115–1126. [Google Scholar] [CrossRef]
  36. Solouk, A.; Shahbakhti, M.; Mahjoub, M.J. Energy Management and Control of a Hybrid Electric Vehicle with an Integrated low temperature combustion (LTC) Engine. In Proceedings of the ASME Dynamic Systems and Control Conference, San Antonio, TX, USA, 22–24 October 2014.
  37. Solouk, A.; Shahbakhti, M. Modeling and Energy Management of an HCCI based Powertrain for Series Hybrid and extended range electric vehicles. Int. J. Powertrains 2017, in press. [Google Scholar]
  38. Hanson, R.; Spannbauer, S.; Gross, C.; Reitz, R.D.; Curran, S.; Storey, J.; Huff, S. Highway Fuel Economy Testing of an RCCI Series Hybrid Vehicle; SAE Paper No. 2015-01-0837; SAE: Warrendale, PA, USA, 2015. [Google Scholar]
  39. Solouk, A.; Shakiba-herfeh, M.; Kannan, K.; Solmaz, H.; Dice, P.; Bidarvatan, M.; Kondipati, N.N.T.; Shahbakhti, M. Fuel Economy Benefits of Integrating a Multi-Mode low temperature combustion (LTC) Engine in a Series Extended Range Electric Powertrain; SAE Technical Paper No. 2016-01-2361; SAE: Warrendale, PA, USA, 2016. [Google Scholar]
  40. Curran, S.; Hanson, R.; Wagner, R.; Reitz, R. Efficiency and Emissions Mapping of RCCI in a Light-Duty Diesel Engine; SAE Paper No. 2013-01-0289; SAE: Troy, MI, USA, 2013. [Google Scholar]
  41. Nitz, T.L.; Grebe, U.D. Voltec the Propulsion System for Chevrolet Volt and Opel Ampera. MTZ Mag. 2011, 11, 28–35. [Google Scholar]
  42. UQM Technologies Inc. Powerphase 75 Traction System. Available online: http://www.neweagle.net/support/wiki/docs/Datasheets/UQM/PP75.pdf (accessed on 20 December 2015).
  43. Zaremba, A.T.; Soto, C.; Shakiba-herfeh, M.; Jennings, M. Power management of hybrid electric vehicles based on pareto optimal maps. SAE Int. J. Altern. Powertrains 2014, 3, 56–63. [Google Scholar] [CrossRef]
  44. Byeon, G.; Yoon, T.; Oh, S.; Jang, G. Energy Management Strategy of the DC Distribution System in Building Using the EV Service Model. IEEE Trans. Power Electron. 2013, 28, 1544–1554. [Google Scholar] [CrossRef]
  45. High Power Lithium-ion VL7P Cells. Available online: http://www.houseofbatteries.com/documents/VL30P.pdf (accessed on 26 September 2016).
  46. 2010 Honda Insight Hybrid Electric Vehicle Testing Report. Available online: http://avt.inel.gov/pdf/hev/fact2010hondainsight.pdf/ (accessed on 29 November 2015).
  47. Torres, J.L.; Gonzalez, R.; Gimenez, A.; Lopez, J. Energy Management Strategy for Plug-in Hybrid Electric Vehicles. A Comparative Study. Appl. Energy 2014, 113, 816–824. [Google Scholar] [CrossRef]
  48. Salmasi, F. Control Strategies for Hybrid Electric Vehicles: Evolution, Classification, Comparison, and Future Trends. IEEE Trans. Veh. Technol. 2007, 56, 2393–2404. [Google Scholar] [CrossRef]
  49. Lewis, F.; Vrabie, D.L.; Syrmos, V. Optimal Control, 3rd ed.; John Wiley & Sons, Inc.: Hoboken, NJ, USA, 2012; Chapter 5. [Google Scholar]
  50. Prikhodko, V.Y.; Curran, S.; Parks, J.E.; Wagner, R. Effectiveness of Diesel Oxidation Catalyst in Reducing HC and CO Emissions from reactivity controlled compression ignition. SAE Int. J. Fuels Lubr. 2014, 6, 329–335. [Google Scholar] [CrossRef]
  51. Ansari, E.; Poorghasemi, K.; Irdmousa, B.K.; Shahbakhti, M.; Naber, J. Efficiency and Emissions Mapping of a Light Duty Diesel-Natural Gas Engine Operating in Conventional Diesel and RCCI Modes; SAE Technical Paper No. 2016-01-2309; SAE: Troy, MI, USA, 2016. [Google Scholar]
Figure 1. Prior studies categorized based on different types of internal combustion engines (ICEs) and energy management control (EMCs) incorporated in hybrid electric vehicle (HEVs).
Energies 09 01020 g001
Figure 2. A schematic diagram to illustrate the power and control flows among the main components of an RCCI-based SHEV.
Energies 09 01020 g002
Figure 3. BSFC map (g/kWh) of the RCCI engine in this study. The data from [40] was used to generate this figure.
Energies 09 01020 g003
Figure 4. BSFC map (g/kWh) of the GM Z19DTH CI (diesel) engine. The data from [40] was used to generate this figure.
Energies 09 01020 g004
Figure 5. BSFC map (g/kWh) of GM A14XFL SI (gasoline) engine. The data from [41] was used to generate this figure.
Energies 09 01020 g005
Figure 6. RCCI exhaust gas temperature map for selecting the RCCI engine operating points. The data from [40] was used to generate this figure.
Energies 09 01020 g006
Figure 7. The combined driving cycle used for the evaluation of the designed energy management control (EMCs).
Energies 09 01020 g007
Figure 8. Fuel economy (FE) improvement by using RCCI versus (a) SI and (b) CI engines as a function of number of engine operating points and engine start-up fuel penalty. (EMC: DP).
Energies 09 01020 g008
Figure 9. Traction E-motor speed during the combined driving cycle.
Energies 09 01020 g009
Figure 10. E-motor operating points, shown with ‘o’ symbol, plotted over the E-motor efficiency map.
Energies 09 01020 g010
Figure 11. Desired vehicle speed vs. actual vehicle speed with a root mean square tracking error of 0.8 mph.
Energies 09 01020 g011
Figure 12. Engine on/off status and the battery SOC pattern in the 3-mode DP and RBC strategies. (a) Engine on/off status and (b) the battery SOC pattern in the 3-mode DP and RBC strategies.
Energies 09 01020 g012
Figure 13. Power distribution in the SHEV during the combined driving cycle (EMC: 3-mode DP).
Energies 09 01020 g013
Figure 14. Battery SOC variations in MPC and DP controllers (EMC: 3-mode).
Energies 09 01020 g014
Figure 15. Fuel economy (FE) comparison for (a) RCCI; (b) SI; and (c) CI engines for different EMCs.
Energies 09 01020 g015
Figure 16. Comparison between battery energy loss for the low S O C i n i t i a l and high S O C i n i t i a l operating conditions (EMC: 3-mode DP).
Energies 09 01020 g016
Figure 17. The RCCI engine power pattern in the SHEV for two initial SOC operating conditions (EMC: 3-mode DP).
Energies 09 01020 g017
Figure 18. Fuel economy (FE) improvement by using the RCCI engine over the (a) SI or (b) CI at two initial SOC operating conditions (EMC: 3-mode MPC).
Energies 09 01020 g018
Figure 19. HEV fuel economy (FE) improvement by using the RCCI engine versus the SI and CI engines in four different driving cycles (EMC: 3-mode DP).
Energies 09 01020 g019
Table 1. Vehicle specifications.
ParametersValues
M (kg)1431
f r (-)0.01
μ (-)0.8
ρ ( kg / m 3 )1.224
C d (-)3.25
R w (m)0.381
A ( m 2 )2.0
G r (-)3.25
P b (kW)215
Battery capacity (kWh)18.5
E-motor peak power (kW)75
E-motor peak torque (N·m)240
E-motor maximum speed (rpm)7500
E-motor maximum efficiency (-)0.94
Generator efficiency (-)0.95
Table 2. Specification of GM Z19DTH diesel engine converted for RCCI operation [40].
ParametersValues
Bore (mm)82
Stroke (mm)90.4
Displacement (L)1.9
Compression Ratio15.1
Max. Power (kW) @ 3000 rpm32.0
Engine Speed Range (rpm)1000–3500
Table 3. Engine-out NO x emissions in RCCI and CI engines operating points. The data is from [40].
Engine Operating PointsNOx Emission (g/kWh)
RCCICI
Point 10.40.6
Point 20.46.0
Point 30.46.0
Table 4. RCCI engine fuel economy values in the SHEV architecture as a function of engine start-up fuel penalty and number of operating modes utilized in the engine (EMC: DP).
Fuel PenaltyEngine Modes
m f , start (g)1-Mode (MPG)2-Modes (MPG)3-Modes (MPG)
247.848.048.8
647.347.548.1
1046.946.947.6
1446.346.347.0
Table 5. Fuel economy comparison for different EMCs including the effect of MPC time horizon (TH) in the SHEV with S O C i n i t i a l = 0.3 (EMC: 3-mode).
energy management controllerFuel Consumption (MPG)
RCCISICI
On–off RBC41.437.440.0
MPC—TH20s44.439.243.0
MPC—TH50s45.740.344.2
MPC—TH70s47.441.745.8
MPC—TH90s47.942.146.2
MPC—TH120s48.042.246.3
DP48.442.346.7
Table 6. Average power in the studied driving cycles.
Driving CyclesAverage Base Power (kW)
US0619.1
HWFET12.0
Combined8.2
UDDS5.2

