
Gas Hydrate Growth Kinetics: A Parametric Study

Department of Petroleum Engineering, University of Stavanger, 4036 Stavanger, Norway
*
Authors to whom correspondence should be addressed.
Energies 2016, 9(12), 1021; https://doi.org/10.3390/en9121021
Submission received: 11 August 2016
/
Revised: 28 October 2016
/
Accepted: 28 November 2016
/
Published: 5 December 2016
(This article belongs to the Special Issue Methane Hydrate Research and Development)
Abstract
:Gas hydrate growth kinetics was studied at a pressure of 90 bars to investigate the effect of temperature, initial water content, stirring rate, and reactor size in stirred semi-batch autoclave reactors. The mixing energy during hydrate growth was estimated by logging the power consumed. The theoretical model by Garcia-Ochoa and Gomez for estimation of the mass transfer parameters in stirred tanks has been used to evaluate the dispersion parameters of the system. The mean bubble size, impeller power input per unit volume, and impeller Reynold’s number/tip velocity were used for analyzing observed trends from the gas hydrate growth data. The growth behavior was analyzed based on the gas consumption and the growth rate per unit initial water content. The results showed that the growth rate strongly depended on the flow pattern in the cell, the gas-liquid mass transfer characteristics, and the mixing efficiency from stirring. Scale-up effects indicate that maintaining the growth rate per unit volume of reactants upon scale-up with geometric similarity does not depend only on gas dispersion in the liquid phase but may rather be a function of the specific thermal conductance, and heat and mass transfer limitations created by the limit to the degree of the liquid phase dispersion is batched and semi-batched stirred tank reactors.
1. Introduction
Gas hydrate formation has been an important subject in the petroleum industry, because when gas hydrate forms in oil and gas pipelines and processing equipment, it plugs them. This would cause flow assurance issues, and may create operational and safety contingencies that may lead to huge economic losses, potential environmental risk due to pollution, and safety hazards to operational personnel in the case of pipeline rupture [1,2,3,4].
More recently, there has been increased interest in the potential applications of gas-hydrate-related technology in the areas of gas separation [5,6,7,8,9,10,11], gas transportation and storage [12,13,14,15,16,17,18,19,20,21,22,23], CO2 capture and sequestration [11,13,17,18,19,20,21,22,23,24,25,26,27,28,29,30], and as a potential energy source [20,31,32,33,34]. In the area of gas transportation and storage, gas hydrate technology offers simplicity and safer conditions. Compared with building new pipelines and railway systems for transportation, which are expensive and labor-intensive, or storing the gas as compressed natural gas (CNG, requiring very high pressures; 20–25 MPa) and liquefied natural gas (LNG, requiring cryogenic temperatures below −161 °C), which are also capital-intensive and have a very high safety demand [35], CO2 capture and sequestration would contribute to a greener environment, while gas hydrates as an energy source will play a significant role in the transition to cleaner energy sources. To implement these gas-hydrate-related technologies at an industrial scale so that they can compete with existing technologies, emphasis must be placed on forming hydrates in a fast and efficient manner. This requires an improved understanding of the factors that influence the formation kinetics of gas hydrates. A brief review of some of these factors follows.
Factors that affect the kinetics of gas hydrate formation, such as temperature, pressure, driving force, agitation, and the concentration of guest and water phases, have been extensively studied [4,36,37,38,39]. Some research findings have suggested that gas hydrate formation increases with decreasing system temperature, though an increase in pressure would promote hydrate growth rate; a unit increase in pressure has a less significant effect on gas hydrate growth rate at constant temperature [4,37,38,39,40]. On the other hand, the combined effect of temperature and pressure on gas hydrate formation is coupled into a parameter called the “driving force” of gas hydrate formation. Models and correlations of gas hydrate nucleation and growth have presented the driving force as the fugacity, concentration, chemical potential, temperature differences at equilibrium, experimental conditions, and supersaturation of the system [39,41,42,43,44]. Arjmandi et al. [41], went on to prove that the temperature difference or subcooling (ΔT = Teq − Texp) can solely represent the driving force for pure component hydrate forming systems at given pressure conditions. Using the temperature difference as the driving force offers a simple option in modeling gas hydrate nucleation and growth. From previous works, and as we will come to see from this work, gas hydrate nucleation and growth rates increase with an increase in driving force/subcooling. However, in the Ph.D. work by Mork, it was suggested that increasing subcooling did not increase the gas hydrate growth rate [45].
Another parameter crucial to gas hydrate formation is the degree of agitation of the reacting mixture or stirring rate. During stirring, more of the hydrate-forming guest molecules are brought in contact with the liquid bulk. This, along with an increase in the amount of dissolved gas, promotes gas hydrate formation. As various publications have shown, hydrate growth rate tends to increase with stirring [39,40,46,47,48], though the effective gain in hydrate formation rate diminishes with each subsequent increase in stirring rate [40].
Several works have also indicated that the reactor design, reactor type, and hydrate formation technique also play important roles in fast and efficient hydrate formation [9,14,35,49]. At industrial scale, energy efficiency and cost effectiveness are crucial measures of the feasibility of a process. Thus, an optimal combination of these factors in reactor design, for developing new gas-hydrate-related technologies, would hinge on gains in hydrate formation rate compared with the additional energy demands caused by increased pump rate, agitation rate, subcooling, or gas compression demands. As a way of reducing compression demands, Linga et al. [50,51] and Kumar et al. [30] have used very low concentrations of additives like tetrahydrofuran (THF) and propane, which reduce the operating pressure for hydrate-based CO2 capture applications. However, they noted that the use of these additives reduced the rate of hydrate formation. Other works have proposed to overcome the gas-water contact limitations without stirring, by contacting the gas phase with water dispersed in the pores of silica gel to form hydrate [24,28,52,53], or by the use of cyclopentane as an additive, which improves gas diffusion across the gas-water interface in an unstirred reactor [9]. Linga et al. also proposed a reactor design with a second impeller close to the gas–liquid contact level in the reactor that enabled enhanced recirculation of the gas from the gas phase of the crystallizer, thereby improving the gas–liquid mass transfer after hydrates form [54].
In this work, experiments were conducted in two different sized high-pressure semi-batch autoclave reactors with geometric similarity, at a pressure of 90 bars. We have carefully analyzed the effect of temperature, subcooling, water content, stirring rate, and reactor size on the growth kinetics of methane hydrate. Our findings show that system temperature, water content, and reactor size have a considerable impact on the growth rate of gas hydrates. The effect of stirring rate plateaus once the system attains heat and mass transfer equilibrium; furthermore, the effect of reactor size scale-up seems to be more a function of the specific thermal conductance of the system than the power input per unit volume of liquid into the system.
2. Experimental Section
All experiments were conducted with distilled water and 99.9995 purity scientific grade methane gas (Methane 5.5).
2.1. Experimental Setup
The growth kinetics of methane hydrate was studied in titanium autoclave reactors of two sizes, 142.4 mL and 318.1 mL. A schematic diagram of the experimental setup is shown in Figure 1, and Table 1 gives details of the geometry of the autoclave reactors and their component parts. The autoclave cell has an upper chamber where the reaction takes place, and a lower chamber where the stirrer magnet is seated. A single flat blade impeller is used. The impeller was screwed on to the stirrer magnet placed in the bottom chamber through a channel from the upper chamber. Gas was supplied by a gas bottle charged up to 200 bars, while the pressure in the cell was set to 90 bars during the experiments. The overpressure in the gas bottle ensured that the pressure in the cell remained within ±2 of 90 bars during hydrate growth. The gas was supplied to the cell through an opening in the top lid, via a mass flow meter. Depending on the stirring rate and the level of mixing of the gas and liquid in the cell, the gas supplied during the hydrate growth may make contact only with the gas phase, or with the gas-liquid mixture.
A Bronkhorst HIGH-TECH flow meter (BRONKHORST High-Tech B.V., Ruurlo, The Netherlands) is connected in the line between the gas container and the reactor cell for measuring gas flow rate into the cell during hydrate growth. Two 1/10 DIN Pt-100 temperature sensors (MRC Teamtrade AS, Dpt. Hyp Teck, Skotselv, Norway) (accuracy ± 0.03 °C) are installed through the top lid of the cell to enable temperature monitoring in the gas and bulk phase during experiments. Pressure monitoring is enabled using a Rosemount 3051TA absolute pressure transmitter (Emerson Electric Co., St. Louis, MO, USA) connected to the line along the inlet to the cell. To enable circulation of the cooling fluid, a coolant jacket envelops the cell body. Cooling and temperature control are enabled using a Julabo F34-HL refrigerating/heating circulator (JULABO GmbH, Seelbach, Germany). The cooling fluid used is water. The stirring rate is controlled using a magnetic stirrer drive (REO basic C) with an rpm sensor.
2.2. Experiment Runs
All experiments were run at a pressure of 90 bar. The cell content was cooled down at a constant cooling rate of 3 °C/h from an initial temperature of 13.5 °C to the required experimental temperature. System pressure was maintained constant at 90 bar within a deviance of ±2 bar, by adding “fresh” methane from the gas container through the flow meter. We ran experiments in the 141.4 mL cell at temperatures of 8, 7, and 6 °C, and at stirring rates of 350, 425, 500, 575, 650 700, 800, and 1200 rpm. Experiments in the 318.1 mL cell were at 8, 7, and 6 °C, and at stirring rates of 185, 370, 500, 700, and 1200 rpm. The experiments run in the 318.1 mL (large) cell allowed us to analyze scale-up effects on the growth kinetics. The water content used was 50 mL and 100 mL for the small cell, and 112.5 mL and 225 mL for the large cell for parallel experiments.
3. Theoretical Background
Gas hydrate formation involves coupled heat and mass transfer [4]; therefore, in our effort to describe hydrate growth behavior, we see the importance of employing parameters that characterize the mass and heat transfer of our system. In stirred reactors, the gas disperses into the liquid in the form of bubbles. When gas hydrates form, the system will consist of gas bubbles and hydrate crystals, dispersed in a continuous water phase. The existence of three phases implies that there exists a gas–liquid interface between the gas and liquid phases, and a crystal–solution interface between the liquid phase and the hydrate crystal. Furthermore, the two-film theory suggests that there are film layers on the gas and liquid sides of the gas-liquid interface [55]. Gas transport occurs through these film layers into the bulk liquid phase. Heat and mass transfer resistance are considered negligible on the gas side film layer, for sparingly soluble gases like methane [56], thus gas transport into the liquid bulk is controlled by mass transfer of gas molecules across the liquid side film layer at the gas-liquid interface. Similarly, crystal growth theories suggest a two-step model for the hydrate crystal growth; first gas transport occurs from the liquid bulk across a hypothetical stagnant film to the crystal-solution interface, then gas molecules are included into the hydrate structure [57,58,59]. Figure 2 shows a schematic illustration of gas-liquid and crystal-solution interfaces for mass transfer of gas through the bulk phase to the crystal surface in a hydrate forming system. At the gas–liquid interface, the gas and liquid phases are at equilibrium at the system temperature and pressure. There is a drop in concentration of the gas from the gas–liquid interface across the liquid side film layer to the liquid bulk from Cint to Cb. Also, the temperature rises across the liquid side film layer due to gas dissolution from Tint to Tb. At the crystal-solution interface the gas is at the hydrate equilibrium conditions. The concentration of the gas drops to its value at the hydrate equilibrium conditions, Ceq, and the temperature increases to the hydrate equilibrium temperature, Teq. The concentration and temperature gradients serve as driving forces for the transport of gas. Accordingly, the hydrate crystal growth rate has been modeled based on gas diffusion from the bulk phase to the crystal surface, e.g., by Englezos et al. [38] and others [60,61]. Skovborg and Rasmussen [62] have, on the other hand, modeled gas hydrate growth based on the mass transport of gas across the gas-liquid interface. The gas to liquid volumetric mass transfer coefficient (kLa) provides indispensable information in describing gas–liquid mass transfer processes; and is an intricate part of mass-transfer-based modeling attempts of gas hydrate growth [62,63].
The mean bubble diameter and concentration of gas in the liquid phase (gas fraction), and the degree of dispersion of gas bubbles in the liquid will affect the volumetric gas liquid mass transfer coefficient. The degree of dispersion of the gas bubbles within the liquid phase is defined by the rate of turbulence energy dissipation, which is a function of the power input of the system. Though there are established techniques for measuring or estimating the gas fraction, and the mean bubble diameter, which are in turn used for the estimation of the gas–liquid contact area; we are unable to measure them directly in our lab facilities. However, there are some well-established correlations proposed by other researchers, which may be used to estimate these parameters [64].
The volumetric mass transfer coefficient is a product of two parameters, the gas-liquid mass transfer coefficient (kL), and the gas-liquid specific contact area (a). One can estimate the gas–liquid mass transfer coefficient if the gas-liquid phase diffusion coefficient and the density of the liquid phase are known. On the other hand, the gas–liquid specific contact area is a function of the gas fraction or gas hold-up, and the mean bubble diameter of the gas dispersed into the liquid phase. The simplest correlation for the gas–liquid specific contact area is generally given as:
where φ is the gas hold-up, and db is the mean bubble diameter.
Saravanan et al. [65] measured the gas hold-up in a stirred tank by direct visual measurement of the increase in the height of the liquid column with aeration. The gas hold-up was calculated as φ = (HG − H)/HG. Where HG is the liquid column height with aeration, and H is the liquid column height without aeration. Saravanan et al. also proposed a correlation for the gas hold-up as φ = a (P/V)b (VG)c, where P is the power consumed by the impeller in aerated conditions (W), V is the volume of liquid in the vessel (m3), VG is the gas superficial velocity (m/s), and a, b, and c are constants that may be obtained from linear regression of experimental data. Their comparison of the experimental measurements to estimates from the correlations gave deviations within 15%. It is reasonable to expect errors in measurements using this technique due to fluctuations in the liquid surface from varying flow patterns and turbulence during stirring. A number of optical imaging techniques as well as computational fluid dynamics (CFD) simulations have also been used for estimating the gas hold-up, mean bubble diameter, and the gas and liquid phase velocities [66,67,68,69]. Yang et al. [66] performed gas–liquid–solid dispersion studies using CFD simulations and compared with experimental measurements in a stirred reactor. They expressed the gas and liquid phase velocity in the axial and radial directions as functions of the velocity of the impeller tip (UTIP) in good agreement with the experimental data. The average liquid phase velocity in the radial direction was about 0.25 UTIP, in the axial direction it was about 0.07 UTIP, while that of the gas phase velocity in the radial direction was about 0.2 UTIP. Chung et al. also reported average gas phase velocities in the range of 0.03–0.2 UTIP in the radial direction, and 0.02–0.11 UTIP in the axial direction [68]. The velocities were also higher within the impeller region, reaching a maximum value around the tip of the impeller, and decreases towards the axis of rotation of the impeller and the reactor wall [66,67,68,69]. The gas hold-up in the impeller region was as high as 0.1–0.2, but decreased as we moved from the impeller in the radial direction to almost zero near the reactor wall. The mean bubble size in Yang et al.’s simulations was based on the model by Zhang et al. [70], which estimates the bubble diameter with consideration of the influence of the turbulence dissipation rate in the liquid phase:
where σlg is the surface tension, ρl is the density of the liquid phase, and εl is the liquid phase turbulence eddy dissipation.
Both the simulation results and those of Chung et al. showed a very small size distribution of the bubbles in the impeller region (0.0008–0.0024 m) compared with the bulk region (0.003–0.005).
Several semi-empirical correlations have also been used to estimate gas hold-up, mean bubble size, and the gas–liquid specific interfacial area. However, Garcia-Ochoa and Gomez [64] proposed a theoretical approach for predicting these parameters, using equations proposed by different scientists to calculate the gas hold-up, mean bubble size, and the gas–liquid specific interfacial area. The following equations were used by Garcia-Ochoa and Gomez [64].
3.1. Liquid Phase Mass Transfer Coefficient (kL)
For non-Newtonian fluids that obey the power law viscosity model,
where DL is the liquid phase diffusion coefficient, k is a consistency index, and n is a flow index.
For non-Newtonian fluids that obey the Casson viscosity model,
where μc is the Casson viscosity and αr is the apparent yield stress to shear stress ratio.
3.2. Gas Hold-Up
A modified equation for the gas hold-up based on the derivation by Kudrewizki [71] using isotropic turbulence theory as follows:
If the liquid phase is viscous, a modification is made to the equation to account for viscous forces:
where μL is liquid viscosity and μG is gas viscosity.
3.3. Mean Bubble Diameter
The mean bubble diameter is given by [72]:
3.4. Volumetric Mass Transfer Coefficient, kLa
The volumetric mass transfer coefficient (kLa) was calculated by multiplying kL and a. Garcia-Ochoa and Gomez’s simulation results of kLa by this approach were found to fit the experimental data from different reactor sizes (2 L–500 L), and impeller blade configurations. Simulations for non-Newtonian fluids required the use of non-Newtonian viscosity models, with the Casson viscosity model giving a better fit with the experimental data.
3.5. Rheological Properties of the Hydrate-Water Slurry
In gas hydrate systems, as gas hydrates form, the viscosity and density of the hydrate–water slurry will change with hydrate concentration. While the slurry viscosity increases, the slurry density will decrease with increasing hydrate concentration [73]. In Andersson and Gudmundsson’s work on the rheological properties of gas hydrate–water slurry [74], they could describe the viscosity of gas hydrate–water slurry with the Bingham viscosity model for up to 12% hydrate concentration. However, at higher concentrations, the power-law viscosity model better described the gas hydrate–water slurry viscosity. The following relation relates the power input per unit volume of fluid in the cell (P/V) to the shear stress (τ) and the shear rate (γ) [75]:
For water, which is a Newtonian fluid, the viscosity is equal to the ratio of the shear stress to the shear rate:
Combining Equations (8) and (9) gives the shear rate as
The subsequent apparent viscosity of the hydrate–water slurry when hydrate forms will be
which, when combined with Equations (8) and (10), gives
The density of the hydrate slurry is estimated as a volume-weighted average of the hydrate and water phases as
4. Data from a Typical Experimental Run
Figure 3 illustrates the temperature, pressure, and gas consumption during a typical experimental run. While cooling the cell content down to the experimental temperature, the stirring was turned off. We see that some gas is consumed during the cooling stage. This is due to gas compensation, mainly for the drop in pressure, and partly to the increase in gas solubility as a function of decreasing temperature. The amount of gas consumed during the initial stirring prior to the start of growth is low, and the temperature remains constant, indicating that the gas saturation process has a low influence on the measured gas consumption during initial hydrate formation.
At point 1, hydrate growth commences, as seen from the rapid increase in temperature and gas consumption. The period between point 1 and 2 is referred to as growth stage I in this work. During growth stage I there is a minimal impact from mass transfer and heat transfer restrictions. The gas consumption rate at this point will be strongly dependent on the hydrodynamics of the system, which is affected by the hydrate content and the stirring rate. We see that stage I is a rather brief period that makes way for growth stage II between points 2 and 3. The start of growth stage II is marked by a drop in the initial temperature. The initial gas consumption rate is also characterized by a similar trend of spike and drop. The average rate of gas consumption during growth stage II is sustained until point 3, where the stirring stops in the cell due to plugging by the agglomerated hydrate mass.
The saturation level of methane in water is lower in a system with hydrate present than in a system without hydrates [4]. At incipient hydrate formation, the methane saturation adjusts to a lower value [76] and the “released” excess gas contributes to the growth. The saturation level of methane in water at 90 bar is shown in Figure 4 for both a hydrate-free system and a system in equilibrium with methane hydrate. At incipient hydrate formation, excess gas is available due to a reduction in gas solubility (Δxn at given Tn). This affects the measured gas consumption rate during the initial growth stage I, which most probably becomes underestimated. We have used the method of Duan et al. [77] to predict the mole fraction of methane dissolved in pure water and CSMGem program [4] to estimate the amount of methane dissolved in water in a system containing hydrate. Table 2 shows the amount of excess gas released from the solution at incipient hydrate formation.
In Figure 5, we see power readings during an experimental run. As expected, the power is zero when the power supply to the stirrer motor is turned off during cooling, but upon start of stirring the active power attains a value, about 8 watts in this case, and remains roughly constant. At hydrate growth, the power builds up due to the increased resistance to flow from increasing hydrate content. Eventually the power drops sharply, indicating a complete impediment to stirring at point 3, due to plugging in the cell by the hydrate mass. Therefore, we do not analyze the growth data beyond point 3. We thus consider growth stage II to be representative of the actual instantaneous growth kinetics of the process, taking into consideration the heat transfer limitations caused by a temperature increase in the cell. It is also during growth stage II that the bulk of the hydrate forms, so further parametric analysis and discussion of the data focus on growth stage II.
5. Parameter Response during Growth
In the following, we will look at how some of the parameters for the gas–liquid dispersion process respond during hydrate growth. In Section 4, we have seen that power consumption increased during hydrate growth. Using the equations from Section 3, we will briefly discuss how the mixing power per unit fluid volume (Pmix/V), apparent slurry viscosity, and mean bubble diameter were influenced during hydrate formation.
5.1. Power Input per Unit Volume during Hydrate Growth
The power input per unit volume is a measure of the turbulent energy dissipated into the system from stirring. The active power consumed by the system is a sum of the static power when the stirring is switched off (Ps), the power required to overcome friction from the stirrer blade and magnet plus the weight of the cell content (Pf), and the power dissipated into the fluid for mixing the cell content (Pmix). To estimate the mixing power (Pmix), the power consumed by the system loaded with gas and water just to move the stirrer blade is measured and subtracted from the active power at the specified stirring rate in “revolutions per minute” (RPM), as Pmix = Pactive − Pf − Ps. The left-hand panel of Figure 6 shows the mixing power, Pmix, as a function of the hydrate fraction present in the solution. The power input per unit volume is given by Pmix/V, where Pmix is the mixing power, and V is the volume of the carrier fluid. The right-hand panel of Figure 6 shows that the power input per unit volume increases with hydrate content, though the stirring rate remained constant during hydrate growth. Increasing hydrate concentration leads to increased resistance to stirring, and an increase in the power consumption to keep the stirring rate constant.
5.2. Apparent Slurry Viscosity during Hydrate Growth
Water–hydrate slurries are said to exhibit non-Newtonian flow behavior [74]. With the assumption of non-Newtonian flow behavior, Equation (12) was used to estimate the apparent slurry viscosity of the water–hydrate slurry with increasing hydrate content. Here the power input per unit volume at the onset of hydrate growth (Pmix/V)0 is that of water, and µw is the viscosity of water. Figure 7 shows a plot of the estimated apparent slurry viscosity with Pmix/V. It can be seen that the viscosity increases with Pmix/V, which, as we can see from Figure 6, increased with the hydrate content. This observation is in agreement with previous work by Andersson and Gudmundsson who performed viscosity measurements for water–hydrate slurries for up to 20% hydrate fraction [74], as well as other works [78].
5.3. Mean Bubble Diameter during Hydrate Growth
The mean bubble size diameter was estimated using Equation (7). The surface tension was taken as that between ice and water [79]. The slurry density was estimated using Equation (13), but it showed little variance from the density of water, since the density of gas hydrate and water are very close [59,73]; attaining a value of about 980 kg/m3 at 33% hydrate fraction. (Pmix/V)0 was used to represent the actual turbulent energy dissipation rate as the observed increase in the power consumption is ascribed to additional resistance to flow due to increasing slurry viscosity from hydrate formation. In addition, we have used the apparent slurry viscosity as the viscosity of the liquid phase. Figure 8 shows an increase in the mean bubble diameter with an increase in the hydrate fraction, which is a result of increasing apparent slurry viscosity. However, the change in mean bubble diameter is moderate, about 15% of the average value.
In our discussion of the hydrate growth results, we will use estimated power input per volume at the onset of hydrate growth, and the average values of the mean bubble diameter as a reference to analyze the scale-up effects of the system.
6. Results and Discussion
We present some of the main observations from the growth experiments with a focus on how system parameters such as experimental temperature and subcooling, water content (gas/water mole ratio), stirring rate, and the cell size affect gas hydrate growth. Growth was preceded by supercooling [37] the system from an initial temperature of 13.5 °C, just outside the hydrate stability region at the system pressure, to the required experimental temperature. In cooling down the system, we used a constant cooling rate. Thus possible effects from cooling rate have been eliminated [40,80].
To keep the cell pressure constant at 90 bars during gas hydrate growth, gas was supplied from a gas container via a mass flow meter to replenish gas used up from hydrate formation.
6.1. Nucleation Process
In a crystallization process, the necessary condition for nucleation to occur is the supersaturation of the system. System supersaturation results from subcooling the system by decreasing system temperature below the equilibrium temperature or increasing the pressure above the equilibrium pressure. Normally nucleation does not occur immediately when a system reaches a supersaturated state; some time may elapse between the point of supersaturation and nucleation. This time is usually referred to as the induction time. The induction time, as defined by Mullin [57], is the amount of time between the achievement of constant supersaturation and the detection of crystals [81]. In this work and related works in our laboratory, the system is first cooled down to a specified temperature, and then stirring starts. Thus, we measured the induction time as the time that elapses between when stirring starts and hydrate growth begins. Table 3 shows average induction time measurements for some experiments performed in the two cells used for the growth experiments. The data in the table indicate that the induction time decreases with a decrease in temperature, a decrease in water content, an increase in stirring rate, and an increase in cell volume/diameter. The nucleation rate or induction time is a function of the fluid volume in systems for crystallization processes taking place in the bulk [81,82,83] or the contact area at the gas-water interface in the case of hydrate nucleation [83]. In hydrate formation, the probability of nucleation will increase with increasing gas-water contact area [83]. Rapid hydrate formation processes aim at reducing the induction time, and if possible eliminating it. In this respect, agitation or stirring will strongly affect the nucleation processes due to increased contact between gas and water molecules via disturbances in the gas–water contact area, as well as an increased concentration of gas bubbles in the bulk phase and the formation of pockets of smaller water droplets [84]. It has been reported that, for the same set of conditions, the induction time measurements usually vary due to the stochastic nature of the nucleation process [81,82,83,85,86,87]. Longer induction time measurements give lower nucleation rates, and vice versa [81], but induction time variation has not shown any impact on hydrate growth rate. The growth rates were independent of the induction times estimated for each individual growth experiment. Some studies have reported on the effect of temperature and subcooling [81,82,88,89,90,91], and stirring rate [40,89,91] on the induction time and nucleation rate [91] (p. 56) of hydrate formation. Results from laboratory experiments have shown that the average induction time decreases with decreasing temperature and increasing subcooling, and decreases with increasing stirring rate [81,82,88,89,90,91]. Experimental results from the same cells used for the growth experiments in this work have corroborated reports from previous works.
6.2. Amount of Hydrate Formed
The amount of hydrate formed, and gas consumption were estimated by direct measurements of the gas inflow into the cell during hydrate growth using a mass flow meter. The mass flow meter gives gas consumption as NmL/min (normal mL/min, Tref = 0 °C, Pref = 1 bar) and is independent of temperature and pressure elsewhere in the system (e.g., in the gas container or cell). Based on material balance, we assume that the gas inflow to the cell equals the gas used up for hydrate formation, given a constant pressure in the cell during hydrate growth [92].
6.2.1. Gas Consumption
In Figure 3, we have identified three growth stages during hydrate formation in our cells. At the onset of hydrate growth the cell temperature rapidly increases, due to the exothermic nature of hydrate growth. This point corresponds with the point at which the gas consumption also increases rapidly. According to the work by Clark and Bishnoi [61] who used the FBRM (Focused Beam Reflectance Measurement) technique to observe the number of particles during hydrate formation, the number of hydrate particles increases rapidly at the turbidity point, but quickly reaches a plateau at the point when particle agglomeration begins. In Hashemi et al.’s [60] review of Clark and Bishnoi’s [61] work, they interpreted the earlier observation to mean that after the critical nuclei have formed during nucleation, the rate of gas consumption from crystal growth is much greater than by primary nucleation. Thus, it is reasonable to assume that the contribution of nucleation to the measured gas consumption is negligible. Figure 9 shows a plot of the gas consumption for three experiments performed under similar conditions, showing the effects of mass transfer restriction and agglomeration on the growth as we go from stage I to II and III. As indicated earlier, the gas initially consumed during growth stage I is mainly the dissolved gas that saturated the water phase before growth commenced. Here the intrinsic kinetics mechanisms, as described by the Englezos-Bishnoi model [38], may play a dominant role. During stage II, all gas consumed is supplied from the free gas phase through the water. Thus, the gas consumed during growth stage II is more representative of the hydrate growth kinetics in our cell system, but at this point the growth is already limited by heat and mass transfer restrictions. At stage III the hydrate crystals have agglomerated and plugged the cell, preventing further stirring of the cell content. The amount of water converted to hydrate reported in this work was calculated from the total gas consumed at the end of growth stage II with a hydration number of 6. The water converted to hydrate at the end of stage II was between 15%–44% in the 141.4 mL cell, and 8%–44% in the 318.1 mL cell; leaving a bulk of the water in the cell unconverted (see Table 4, Table 5 and Table 6 for average growth data and a detailed summary of experimental results). Since plugging in the cell occurred at different times for the same experimental conditions, the amount of water converted to hydrate may vary greatly, even for the same experimental conditions.
6.2.2. Growth Rate
We estimate the growth rate as a linear average of the gas consumed over the time duration at each growth stage. The effects of temperature, initial water content, and cell size were analyzed based on the estimated growth rates and gas consumption data. A minimum of three experiments was performed at each experimental condition. The average growth rate from these experiments is what we present in the main text of this work (Table 4). The works from Bishnoi’s laboratory [38,61,93,94] and others have focused on determining the intrinsic rate constant of hydrate growth. Hashemi et al. [60] showed that only a small growth driving force is required to match the gas dissolution rate, with an estimated kLa value an order of magnitude lower than the kras value. This means that the contribution of gas dissolution to the gas consumption rate during growth is negligible, and thus the consumption rate can be used to represent the average growth rate of the hydrate-forming system.
In a brief review of growth stage I, we observed that during this period the duration and gas consumption rate were strongly affected by the water content, stirring rate, and temperature of the system. Lower temperatures and higher stirring rates led to an increase in the gas consumption rate, while the higher water content led to a decrease in the gas consumption rate. Since the solubility of methane increases with decreasing temperature in the absence of hydrate, more gas is dissolved prior to hydrate formation at lower temperatures, which partly explains the higher gas consumption rates at lower temperatures during stage I of hydrate growth. The growth response with stirring is largely due to improved mixing and turbulence in the system. However, at higher water content more gas is converted to hydrate at the end of stage I [95], since more gas was dissolved in the water bulk prior to hydrate formation, but the gas consumption rate was lower. This may be attributed to the hydrodynamic effects, which result in poorer mixing conditions and less turbulence at higher water content. An earlier report in a preliminary work [95] stated that the growth rate was highest at growth stage I compared with stage II, but recent additional work at lower stirring rates has shown a lower growth rate at growth stage I compared with stage II. Observations on the fluid flow pattern in the open cell at different stirring rates (see Figure 10) seem to suggest that the gas–liquid contact area and gas fraction due to mixing are very low at these lower stirring rates, but even lower for the same stirring rates at higher water content.
Figure 11 gives a schematic description of the observed flow patterns pictured in Figure 10. Upon stirring, the gas–liquid interface initially assumes a conical shape at very low stirring rates, due to the vortices and flow fields generated by the stirring (Figure 11A). The gas–liquid interface increases compared to a case without stirring, and some gas bubbles disperse into the liquid phase; which increases the gas–liquid contact area. As the stirring rate is increased, the base of the cone moves upwards, while its tip moves downwards. At the same time, the turbulent mixing increases and more gas disperses into the liquid phase, while some of the liquid begins to break up into droplets. At point D, the gas and liquid are finely mixed, the liquid fills the entire cell volume forming pockets of liquid droplets, and the gas completely disperses in the liquid. The transition between the flow patterns depicted in Figure 11A–D depends on the water content in the cell. Scheme A is a good representation of flow at or below 350 RPM in the 141.4 mL cell. At 500 RPM and above, we should be at D, with increasing turbulence intensity as the stirring rate increase.
The flow patterns described in Figure 9 are analogous to the flow regimes for gas–liquid mixing described by Tatterson [96], with A–B corresponding to a flooding regime, for which gas dispersion is very poor and the gas–liquid interfacial area is very small. C corresponds to the loaded regime, where the mixing effects from the impeller are improved but the gas is still not fully dispersed in the liquid phase. D corresponds to the complete dispersion flow regime, which gives complete and uniform distribution of the gas phase in the liquid phase [45,58].
In the cases with very low stirring rates (350 RPM in the 141.4 mL cell and 185 RPM in the 318.1 mL cell), the growth rate is higher during growth stage II. Apparently, this observation is due to hydrodynamic effects, but it is unclear how exactly the changes in flow pattern affect the transition in gas consumption rates with stirring. Further discussion of the results is primarily on the gas consumption rate during stage II of hydrate growth. Note that the growth rates have been normalized by dividing by the initial volume of water used for each experiment.
6.3. Effect of Experimental Temperature and Subcooling
Several studies found in the literature have looked into the effect of system temperature on gas hydrate growth rate and there are different conclusions drawn on the effect of temperature on the rate of gas hydrate growth. Vysniauskas and Bishnoi’s [39] work on the kinetics of methane hydrate formation in a semi-batched stirred reactor showed an increase in gas consumption rate with a decrease in temperature. Peng et al.’s [97] study on the hydrate film growth on a gas bubble suspended in a water droplet showed an increase in the film growth rate with increasing subcooling. Their results also showed that at constant subcooling the film growth rate increased with increasing temperature, which was explained as an effect of the significantly higher pressures at higher temperatures, giving higher solubility when the subcooling is constant. The work by Happel et al. [98] in a continuous stirred tank reactor (CSTR) also showed an increase in growth rate, with increased subcooling at constant pressure. Meanwhile, Mork and Gudmundsson [45,58], who also formed hydrates in a continuous stirred tank reactor, did not see any clear effect of subcooling on hydrate growth rate.
Figure 12 shows results from our present work at the three different experimental temperatures of 6, 7, and 8 °C, with 50 mL water content and a stirring rate of 700 rpm. Note that similar to Vysniauskas and Bishnoi, Happel et al., and Mork and Gudmundsson, the pressure in this present work was kept constant, thus a decrease in temperature corresponds to a proportionate increase in subcooling. Our results show that the hydrate growth rate increased with an increase in subcooling or a decrease in experimental temperature. While our results agree with those of Vysniauskas and Bishnoi, and Happel et al., it is not clear why the results of Mork and Gudmundsson have not shown a similar trend. Mork and Gudmundsson’s results were presented for a natural gas mixture as opposed to those of Vysniauskas and Bishnoi, Happel et al., and our present work, which are for pure components. Mork and Gudmundsson offered validation for their results by comparing the results for methane hydrate at 7 °C with those for the natural gas at a specified subcooling of 3 K; there was no difference in the estimated growth rates for both cases. Their comparison of the results for methane and natural gas seems to also suggest that, at constant subcooling, the gas composition has no effect on the hydrate growth rate. However, this needs to be further investigated, because work by Abay et al. [99] with two different synthetic natural gas compositions showed that the composition had an effect on the hydrate growth rate, with the seven-component synthetic natural gas having a growth rate double that of the two-component synthetic natural gas.
6.4. Water Content (Gas–Water Mole Ratio)
Figure 13 shows hydrate growth rates for water contents of 50 mL and 100 mL in the 141.4 mL cell. The gas–water mole ratio is 0.154 and 0.035 with 50 and 100 mL water, in the 141.4 mL cell, and 112.5 and 225 mL water in the 318.1 mL cell, respectively.
We see that the growth rate at 50 mL water content is almost double that at 100 mL water content at all temperatures. This observation may be attributed to two factors: hydrodynamic effects and the amount of gas available in the cell. While lower water content would be associated with lower bubble size and a more dispersed mixture of gas and water, a higher water content will be characterized by the opposite, leading to more favorable kinetics at lower water content. Figure 10 gives examples of the hydrodynamics in the cell at different water content. We see that at specified stirring rates the turbulence intensity is higher with lower water content in the cell. The turbulent energy dissipation rate can be represented by the power input per unit volume of liquid in the cell. A plot of the power input per unit volume of liquid (Pmix/V) as a function of stirring rate (RPM) for the different water content is presented in Figure 14, which shows that the Pmix/V is higher at lower water content. Thus, the mean bubble diameter (Equation (7)) is lower at lower water content, which supports our suggestion of increased gas–liquid contact area and agrees with the observed flow patterns in the cell.
The second contributor to the favorable kinetics is that comparatively, at constant pressure, there is more gas available in the cell at lower water content, which gives a higher gas to liquid volume ratio. In a study by Chaudhari and Gholap on gas–liquid mass transfer in “dead-end” autoclave reactors like the one used in this work, it was shown that an increased gas to liquid volume ratio leads to more effective gas recirculation and strongly promotes the gas–liquid volumetric mass transfer coefficient [100]. Better gas recirculation is also credited for the increase in growth rate in a reactor re-designed to enhance hydrate formation, proposed by Linga et al. [54]. More effective gas recirculation gives better gas–liquid dispersion, and increases the rate of gas–liquid contact, which would promote the hydrate growth rate.
6.5. Effect of Stirring Rate (RPM)
Figure 15 shows the hydrate growth rate at three different experimental temperatures as function of stirring rate during growth stage II. The growth rate increased with stirring rate during growth stage I (Table 4). However, this trend did not continue at stage II of hydrate growth. Instead, the system gave an optimal growth rate around 500–575 rpm. This behavior was consistent at all three experimental temperatures. However, the variation in the growth rate with stirring may be due to minor variations in the temperature buildup in the cell (Figure 16) at the various stirring rates, which would have some impact on the gas solubility [59] (p. 162).
Works from Bishnoi’s laboratory, where a similar experimental setup has been used, reported that the rate constant evens out at stirring rates of 400 rpm and above; this observation was made for different works with methane gas, and with CO2 [38,61]. Clark and Bishnoi, in their work, suggested that the intrinsic rate constant remaining roughly constant from 400 rpm and above means that the heat and mass transfer resistances could be considered negligible above 400 rpm.
The present work suggests that heat accumulation, leading to temperature buildup in the cell during hydrate growth, limits the hydrate growth rate. However, findings from an earlier work show that the heat transfer coefficient decreases during the hydrate formation process but remains roughly constant at each growth stage, i.e., there is an equilibration in the heat transfer out of the cell during growth stage II [92]. Other related works have indicated an increase in hydrate formation rate with an increase in stirring rate [40,47,48], and in general stirring has been shown to promote mass transfer [60,64,100,101]. The differences in response to stirring between growth stages II and I may be explained by the following. (1) The promotional effect observed for stage I is mainly due to intrinsic kinetics without any mass or heat transfer limitation since the gas converted to hydrate had already been dissolved in the water phase; (2) Growth stage II is analogous to an instantaneous hydrate formation process, but with obvious mass and heat transfer limitations; (3) For an instantaneous hydrate formation process the heat and mass transfer resistance are negligible at high enough stirring rates (above 500 rpm in this case), beyond which additional increase in the stirring rate does not enhance the growth rate.
Linga et al. [54] suggested a reactor design with a gas-inducing impeller that enables efficient recycling of the gas phase of the crystallizer into the liquid with an extra impeller blade near the gas–liquid contact, to reduce the mass transfer resistance after hydrate forms. However, this solution proves inadequate, judging by the low percentage water converted to hydrate at the end of the experiments (7.6%–15.4%) after several hours of hydrate formation. THF was used as an additive to reduce the operating pressure in Linga et al.’s work, but it gave the adverse effect of also decreasing the water conversion rate. Moreover, the current work, for which a single flat-blade impeller with a 5% clearance from the top and 12.5% from the sides of the reactor is used, gave much higher growth rates and higher percentage water conversion over a shorter period. Reports from several other works have given conversion rates for methane hydrate that differ significantly, but these results were obtained under varying conditions, with reactors of different designs.
6.6. Effect of Reactor Size
Several factors need to be taken into consideration when scaling up gas dispersion processes like the one in this work. These include the impeller tip speed, Reynold’s number, gas–liquid interfacial area, impeller power consumption per volume, gas–liquid volume ratio, liquid–tank height ratio, and impeller–tank diameter ratio, among others [45,96]. In Tatterson’s review on the scale-up of gas dispersion processes [96], maintaining a constant gas–liquid interfacial area is recommended; “this can be achieved by constant impeller tip speed, and constant impeller diameter/tank diameter ratio upon scale-up; or by constant gas volume/liquid volume ratio” [45]. However, scale-up according to one parameter alone may have an adverse effect on other parameters. To examine the effect of cell size on the growth, some experiments were conducted in the 318.1 mL cell, described in Section 2.1. The gas–liquid volume ratio, liquid–tank height ratio, impeller–tank height ratio, and impeller–tank diameter ratio were kept constant upon scale-up in this work (Table 1). Figure 17 shows the growth rate in the 141.4 mL cell and the 318.1 mL cell at the different experimental temperatures. We see that the growth rate is considerably lower as we scale up in size, even at lower subcooling values. Linga et al. [54] reported an increase in water conversion rate by a factor of 1.4 upon scale-up of a reactor, but the impeller design was changed in the larger reactor to give better gas recirculation after hydrates form, which would change the flow pattern in the reactor. In Mori’s article, “On the scale-up of gas-hydrate-forming reactors…” [49] it was argued that to maintain the same hydrate-forming capacity upon reactor scale-up, the specific thermal conductance/thermal conductance per unit volume of the liquid phase, and the gas–liquid flow pattern (flow regime) that ensures sufficient gas–liquid mixing and mass transfer, must be maintained. The heat transfer from the hydrate–water slurry to the cell wall, and the mass transfer in the gas–hydrate–water dispersion, depend on the power input per unit volume of suspension, the mean bubble size, and the impeller Reynold’s number or impeller tip velocity.
Plots of the growth rate versus the mean bubble size (db), impeller Reynold’s number (NRe), impeller tip velocity (UTIP), and impeller power consumption per unit volume liquid in the cell (Pmix/V) are presented in Figure 17. The mean bubble diameter and the power input per unit volume were estimated as described in Section 3 and Section 5.
Conventional knowledge suggests that decreasing the mean bubble diameter, increasing the power input per unit volume, and increasing the impeller Reynold’s number or impeller tip velocity increases the gas–liquid dispersion, mass transfer, and heat transfer. The investigation by Ochoa and Gomez on gas liquid dispersion systems included results for different fluid types, stirrer types, and reactor volumes. Their analysis showed that for all systems, the volumetric mass transfer coefficient increased with increasing power input per unit volume of liquid in the reactor [64]. The work by Chaudhari et al. with acetylene-distilled water and hydrogen–ethanol systems as the liquid phase also shows that the volumetric gas–liquid mass transfer coefficient increases with increasing agitation speed [100]. Moreover, the review by Beenackers and Swaaij on mass transfer in gas–liquid slurry reactors shows that the mass transfer coefficient increases with increasing Reynold’s number [101]. Likewise, several works have given evidence of a positive correlation between heat transfer and the Reynold’s number [102,103,104]. The work by Meindinyo et al. on the heat transfer through hydrate slurry also showed that heat transfer through hydrate slurry increased with an increase in stirring rate when the hydrate slurry could still flow; when the hydrate formed solid deposits on the reactor wall, stirring no longer enhanced the heat transfer [104].
From Figure 18 it is difficult to establish a clear relationship between the hydrate growth rate and any of the parameters considered, but we see that hydrate growth rate plateaus at a value beyond which a further increase in Reynold’s number, tip velocity, power input per unit volume, or decrease in mean bubble diameter does not increase the growth rate. The Reynold’s number calculations in Figure 14 were done with the viscosity for pure water, which was about 0.0014 Pa∙s at the experimental temperature. If we recalculate the Reynold’s number with the average slurry viscosity (Figure 7) (which will be about 0.003 Pa·s, assuming about the same value at all stirring rates; though one must note that gas hydrate–water slurry is considered shear thinning, which means the viscosity is expected to decrease with increasing stirring rate, but this needs to be further investigated for our system), we see that the growth rate plateaus when we have fully turbulent flow. This is not a conclusive statement but an observation worth looking into in other systems.
Perhaps the most glaring observation from the scale-up is that even at a similar Reynold’s number, tip velocity, power input per unit volume, and mean bubble diameter, the growth rate in the 141.4 mL cell remains higher than the growth rate in the 318.1 mL cell. The work by Ochoa and Gomez indicates that reactor size has no significant impact on the volumetric mass transfer coefficient; moreover, since an increase in power input per unit volume did not increase the growth rate once it plateaued, the argument cannot be made based on insufficient power input in the larger cell, as proposed by Mori [49]. On the other hand, the specific thermal conductance of the reactor will drop upon scale-up with geometric similarity, since the specific surface area for heat transfer will be equal to 4/D, assuming the liquid covers the entire cell wall when stirred. This argument is supported by the analysis of Nauman [105]. He suggested that to maintain the specific thermal conductance of the reactor upon scale-up of stirred tank reactors, the driving force for heat transfer must be increased. Some recommendations for maintaining the specific thermal conductance upon scale-up are discussed in the work by Nauman [105].
On the other hand, the high power demand from stirring is still a valid concern for hydrate formation at an industrial scale. Clearly, increased fluid volumes in an industrial-scale reactor would require power demands that may not be economically efficient for stirred tank reactors [54]. The use of silica gels offers a potential option to improve the gas–liquid mass transfer without the need for stirring [6,24,28,52]. Adeyemo et al. [28] obtained increased water conversion rates and up to 45% water converted to hydrate after four hours by contacting flue gas and fuel gas mixtures with water dispersed in silica gel in a fixed bed column for CO2 capture. Ho et al. [9] also reported higher gas consumption rates in an unstirred reactor compared with a stirred reactor used for CO2 capture in the presence of cyclopentane as a promoter. These methods offer the advantage of energy efficiency, but have the disadvantage of relatively low water conversion rates over a long duration. Brown et al. [35] reported on a reactor designed for rapid hydrate formation based on the dispersion of water droplets and gas into a reactor for continuous production of hydrates, which converted up to 80% of water to hydrate within two minutes, and above 90% water converted after six hours in a 100 mL cell. A scale-up of the process to a 15 L cell was reported to give a methane uptake above 80%, with instantaneous hydrate formation. The efficiency of the technique proposed by Brown et al. [35] can be attributed to the effective dispersion of the water phase, which gave micron-sized water droplets, resulting in highly improved heat and mass transfer during hydrate growth. Batched and semi-batched stirred tank reactors have the water and hydrate mixed within the reactor in volumes that limit the degree of dispersion obtainable. The limit in the degree of dispersion creates a limit to the heat and mass transfer in the reactor, which would increase with an increase in reactor size.
7. Conclusions
We have conducted experiments in two (141.4 mL and 318.1 mL) geometrically similar, semi-batch autoclave reactors to study the effect of temperature, water content, stirring rate, and reactor scale-up on gas hydrate growth rate. The results show a clear promotional effect from increasing the subcooling. Increased subcooling increases the driving force of hydrate formation and growth and the decreased cooling bath temperature increases the temperature difference across the cell wall and thus the heat flux and heat removal per time unit. The latter suggests that heat fluxes and heat transfer play an important role in the growth kinetics. Higher water content led to a decrease in hydrate growth rate due to unfavorable hydrodynamic effects, suggesting that higher hydrate growth rates can be obtained by applying techniques that increase the gas–liquid contact area by reducing bubble and droplet size. The results also indicate that batched/semi-batched production of gas hydrates is severely limited by mass and heat transfer restrictions. In the absence of mass and heat transfer restrictions, the hydrate growth rate continuously increased with an increase in stirring rate (stage I), but with mass/heat transfer limitations the hydrate growth rate effectively plateaus at a specific stirring rate beyond which no further growth promotion occurs (stage II). Our results also show a decrease in the hydrate growth rate upon geometric scale-up of the reactor, which we believe is mainly due to a decrease in the specific thermal conductance upon scale-up, and heat and mass transfer limitations created by the limit to the degree of the liquid phase dispersion in batched and semi-batched stirred tank reactors.
Acknowledgments
The authors thank the Ministry of Education and Research of Norway (Kunnskapsdepartementet) and the University of Stavanger for the financial support of this work.
Author Contributions
Both Remi-Erempagamo Tariyemienyo Meindinyo and Thor Martin Svartaas. conceived and designed the experiments; Remi-Erempagamo Tariyemienyo Meindinyo performed the experiments with the assistance from Thor Martin Svartaas and some students in the lab; Remi-Erempagamo Tariyemienyo Meindinyo analyzed the data with assistance from Thor Martin Svartaas; Remi-Erempagamo Tariyemienyo Meindinyo wrote the paper, with Thor Martin Svartaas contributing to the in-depth theoretical discussion and adding essential details to improve the quality of the paper.
Conflicts of Interest
The authors declare no conflict of interest.
Nomenclature
| Latin letters | |
| a | gas–liquid specific contact area, m−1 |
| db> | mean bubble diameter, m |
| DL | liquid phase diffusion coefficient, m2·s−1 |
| g | acceleration due to gravity, m·s−2 |
| k | consistency index in power law viscosity model, Pa·sn |
| kL | liquid phase mass transfer coefficient, m·s−1 |
| n | flow index in power law model, dimensionless |
| N | stirrer speed, rps |
| P | impeller power consumption/mixing power under gassed conditions, w |
| T | stirrer diameter in Equation (5), m |
| V | volume of liquid in reactor, m3 |
| VS | superficial gas velocity, m·s−1 |
| Greek letters | |
| αhyd | hydrate phase fraction |
| αr | apparent yield stress to shear stress ratio |
| γ | shear rate, s−1 |
| ε | turbulent energy dissipation rate, w·kg−1 |
| µ | viscosity, Pa·s |
| µC | Casson viscosity, Pa·s |
| µG | viscosity of gas phase, Pa·s |
| µL | viscosity of liquid phase, Pa·s |
| µw | viscosity of water, Pa·s |
| ρ | density, kg·m−3 |
| ρhyd | hydrate phase density, kg·m−3 |
| ρG | gas phase density, kg·m−3 |
| ρL | liquid phase density, kg·m−3 |
| ρslurry | hydrate–water slurry density, kg·m−3 |
| ρw | density of water, kg·m−3 |
| σ | interfacial tension, N·m−1 |
| τ | shear stress, N·m−2 |
| φ | gas hold-up, dimensionless |
| φV | gas hold-up in viscous system, dimensionless |
References
- Sloan, E.D.; Koh, C.A.; Sum, A.K.; Ballard, A.L.; Shoup, G.J.; McMullen, N.; Creek, J.L.; Palermo, T. Hydrates: State of the art inside and outside flowlines. J. Petrol. Technol. 2009, 61, 89–94. [Google Scholar] [CrossRef]
- Zerpa, L.E.; Salager, J.; Koh, C.A.; Sloan, E.D.; Sum, A.K. Surface chemistry and gas hydrates in flow assurance. Ind. Eng. Chem. Res. 2010, 50, 188–197. [Google Scholar] [CrossRef]
- Sloan, E.D. A changing hydrate paradigm—From apprehension to avoidance to risk management. Fluid Phase Equilib. 2005, 228, 67–74. [Google Scholar] [CrossRef]
- Sloan, E.D., Jr.; Koh, C. Clathrate Hydrates of Natural Gases; CRC Press: Boca Raton, FL, USA, 2007. [Google Scholar]
- Eslamimanesh, A.; Mohammadi, A.H.; Richon, D.; Naidoo, P.; Ramjugernath, D. Application of gas hydrate formation in separation processes: A review of experimental studies. J. Chem. Thermodyn. 2012, 46, 62–71. [Google Scholar] [CrossRef]
- Yang, M.; Song, Y.; Jiang, L.; Wang, X.; Liu, W.; Zhao, Y.; Liu, Y.; Wang, S. Dynamic measurements of hydrate based gas separation in cooled silica gel. J. Ind. Eng. Chem. 2014, 20, 322–330. [Google Scholar] [CrossRef]
- Aaron, D.; Tsouris, C. Separation of CO2 from flue gas: A review. Sep. Sci. Technol. 2005, 40, 321–348. [Google Scholar] [CrossRef]
- Babu, P.; Linga, P.; Kumar, R.; Englezos, P. A review of the hydrate based gas separation (HBGS) process for carbon dioxide pre-combustion capture. Energy 2015, 85, 261–279. [Google Scholar] [CrossRef]
- Ho, L.C.; Babu, P.; Kumar, R.; Linga, P. HBGS (hydrate based gas separation) process for carbon dioxide capture employing an unstirred reactor with cyclopentane. Energy 2013, 63, 252–259. [Google Scholar] [CrossRef]
- Tajima, H.; Yamasaki, A.; Kiyono, F. Energy consumption estimation for greenhouse gas separation processes by clathrate hydrate formation. Energy 2004, 29, 1713–1729. [Google Scholar] [CrossRef]
- Yang, M.; Song, Y.; Jiang, L.; Zhao, Y.; Ruan, X.; Zhang, Y.; Wang, S. Hydrate-based technology for CO2 capture from fossil fuel power plants. Appl. Energy 2014, 116, 26–40. [Google Scholar] [CrossRef]
- Gudmundsson, J.S. Method for Production of Gas. Hydrates for Transportation and Storage. U.S. Patent 5,536,893A, 16 July 1996. [Google Scholar]
- Masoudi, R.; Tohidi, B. Gas hydrate production technology for natural gas storage and transportation and CO2 sequestration. In Proceedings of the SPE Middle East Oil and Gas Show and Conference, Manamah, Bahrain, 12–15 March 2005.
- Rossi, F.; Filipponi, M.; Castellani, B. Investigation on a novel reactor for gas hydrate production. Appl. Energy 2012, 99, 167–172. [Google Scholar] [CrossRef]
- Gudmundsson, J.S.; Parlaktuna, M.; Khokhar, A. Storage of natural gas as frozen hydrate. SPE Prod. Facil. 1994, 9, 69–73. [Google Scholar] [CrossRef]
- Hao, W.; Wang, J.; Fan, S.; Hao, W. Evaluation and analysis method for natural gas hydrate storage and transportation processes. Energy Convers. Manag. 2008, 49, 2546–2553. [Google Scholar] [CrossRef]
- Herzog, H.; Golomb, D. Carbon capture and storage from fossil fuel use. Encycl. Energy 2004, 1, 1–11. [Google Scholar]
- Husebø, J.; Ersland, G.; Graue, A.; Kvamme, B. Effects of salinity on hydrate stability and implications for storage of CO2 in natural gas hydrate reservoirs. Energy Procedia 2009, 1, 3731–3738. [Google Scholar] [CrossRef]
- Kumar, R.; Linga, P.; Moudrakovski, I.; Ripmeester, J.A.; Englezos, P. Structure and kinetics of gas hydrates from methane/ethane/propane mixtures relevant to the design of natural gas hydrate storage and transport facilities. AlChE J. 2008, 54, 2132–2144. [Google Scholar] [CrossRef]
- Kvamme, B. Feasibility of simultaneous CO2 storage and CH4 production from natural gas hydrate using mixtures of CO2 and N2. Can. J. Chem. 2015, 93, 897–905. [Google Scholar] [CrossRef]
- Mori, Y.H. Recent advances in hydrate-based technologies for natural gas storage—A review. J. Chem. Ind. Eng. (China) 2003, 54, 1–17. [Google Scholar]
- Uchida, T.; Ikeda, I.Y.; Takeya, S.; Kamata, Y.; Ohmura, R.; Nagao, J.; Buffett, B.A. Kinetics and stability of CH4–CO2 mixed gas hydrates during formation and long-term storage. ChemPhysChem 2005, 6, 646–654. [Google Scholar] [CrossRef] [PubMed]
- Yang, M.; Song, Y.; Jiang, L.; Zhu, N.; Liu, Y.; Zhao, Y.; Dou, B.; Li, Q. CO2 Hydrate formation and dissociation in cooled porous media: A potential technology for CO2 capture and storage. Environ. Sci. Technol. 2013, 47, 9739–9746. [Google Scholar] [CrossRef] [PubMed]
- Park, S.; Lee, S.; Lee, Y.; Seo, Y. Hydrate-based pre-combustion capture of carbon dioxide in the presence of a thermodynamic promoter and porous silica gels. Int. J. Greenh. Gas Control 2013, 14, 193–199. [Google Scholar] [CrossRef]
- ZareNezhad, B.; Mottahedin, M. A rigorous mechanistic model for predicting gas hydrate formation kinetics: The case of CO2 recovery and sequestration. Energy Convers. Manag. 2012, 53, 332–336. [Google Scholar] [CrossRef]
- Theoretical Studies of CO2 Hydrates Formation and Dissociation in Cold Aquifers Using Retrasocodebright Simulator. Available online: https://bora.uib.no/handle/1956/9247 (accessed on 11 August 2016).
- Vafaei, M.T.; Kvamme, B.; Chejara, A.; Jemai, K. Nonequilibrium modeling of hydrate dynamics in reservoir. Energy Fuels 2012, 26, 3564–3576. [Google Scholar] [CrossRef]
- Adeyemo, A.; Kumar, R.; Linga, P.; Ripmeester, J.; Englezos, P. Capture of carbon dioxide from flue or fuel gas mixtures by clathrate crystallization in a silica gel column. Int. J. Greenh. Gas Control 2010, 4, 478–485. [Google Scholar] [CrossRef]
- Linga, P.; Kumar, R.; Englezos, P. The Clathrate hydrate process for post and pre-combustion capture of carbon dioxide. J. Hazard. Mater. 2007, 149, 625–629. [Google Scholar] [CrossRef] [PubMed]
- Kumar, R.; Linga, P.; Ripmeester, J.A.; Englezos, P. Two-stage clathrate hydrate/membrane process for precombustion capture of carbon dioxide and hydrogen. J. Environ. Eng. 2009, 135, 411–417. [Google Scholar] [CrossRef]
- Li, Q.; Zeng, H.; Dong, W.; Wang, Z.; Feng, Z.P.; Tang, L.G.; Li, X.S. The experimental studies and development concept for the offshore natural gas hydrate. In Proceedings of the Seventh (2007) ISOPE Ocean Mining Symposium, Lisbon, Portugal, 1–6 July 2007.
- Makogon, Y.; Holditch, S.; Makogon, T. Natural gas-hydrates—A potential energy source for the 21st century. J. Petrol. Sci. Eng. 2007, 56, 14–31. [Google Scholar] [CrossRef]
- Graue, A.; Kvamme, B.; Baldwin, B.A.; Stevens, J.; Howard, J.; Aspenes, E.; Zornes, D. Environmentally friendly CO2 storage in hydrate reservoirs benefits from associated spontaneous methane production. In Proceedings of the Offshore Technology Conference, Houston, TX, USA, 1–4 May 2006.
- Kvamme, B.; Baig, K.; Qasim, M.; Bauman, J. Thermodynamic and kinetic modeling of CH4/CO2 hydrates phase transitions. Int. J. Energy Environ. 2013, 7, 1–8. [Google Scholar]
- Brown, T.D.; Taylor, C.E.; Bernardo, M.P. Rapid gas hydrate formation processes: Will they work? Energies 2010, 3, 1154–1175. [Google Scholar] [CrossRef]
- Bishnoi, P.; Natarajan, V.; Kalogerakis, N. A unified description of the kinetics of hydrate nucleation, growth, and decompositiona. Ann. N. Y. Acad. Sci. 1994, 715, 311–322. [Google Scholar] [CrossRef]
- Bishnoi, P.R.; Natarajan, V. Formation and decomposition of gas hydrates. Fluid Phase Equilib. 1996, 117, 168–177. [Google Scholar] [CrossRef]
- Englezos, P.; Kalogerakis, N.; Dholabhai, P.D.; Bishnoi, P.R. Kinetics of formation of methane and ethane gas hydrates. Chem. Eng. Sci. 1987, 42, 2647–2658. [Google Scholar] [CrossRef]
- Vysniauskas, A.; Bishnoi, P. A kinetic study of methane hydrate formation. Chem. Eng. Sci. 1983, 38, 1061–1072. [Google Scholar] [CrossRef]
- Ke, W.; Svartaas, T.M. Effects of stirring and cooling on methane hydrate formation in a high-pressure isochoric cell. J. Mater. Sci. Eng. B 2013, 3, 436–444. [Google Scholar]
- Arjmandi, M.; Tohidi, B.; Danesh, A.; Todd, A.C. Is subcooling the right driving force for testing low-dosage hydrate inhibitors? Chem. Eng. Sci. 2005, 60, 1313–1321. [Google Scholar] [CrossRef]
- Natarajan, V.; Bishnoi, P.R.; Kalogerakis, N. Induction phenomena in gas hydrate nucleation. Chem. Eng. Sci. 1994, 49, 2075–2087. [Google Scholar] [CrossRef]
- Anklam, M.R.; Firoozabadi, A. Driving force and composition for multicomponent gas hydrate nucleation from supersaturated aqueous solutions. J. Chem. Phys. 2004, 121, 11867–11875. [Google Scholar] [CrossRef] [PubMed]
- Kashchiev, D.; Firoozabadi, A. Driving force for crystallization of gas hydrates. J. Cryst. Growth 2002, 241, 220–230. [Google Scholar] [CrossRef]
- Mork, M. Formation Rate of Natural Gas Hydrates-Reactor Experiments and Models. Ph.D. Thesis, Norwegian University of Science and Technology, Trondheim, Norway, 2002. [Google Scholar]
- ZareNezhad, B.; Varaminian, F. A unified approach for description of gas hydrate formation kinetics in the presence of kinetic promoters in gas hydrate converters. Energy Convers. Manag. 2013, 73, 144–149. [Google Scholar] [CrossRef]
- Roosta, H.; Khosharay, S.; Varaminian, F. Experimental study of methane hydrate formation kinetics with or without additives and modeling based on chemical affinity. Energy Convers. Manag. 2013, 76, 499–505. [Google Scholar] [CrossRef]
- Takahata, M.; Kashiwaya, Y.; Ishii, K. Kinetics of methane hydrate formation catalyzed by iron oxide and carbon under intense stirring conditions. Mater. Trans. 2010, 51, 727–734. [Google Scholar] [CrossRef]
- Mori, Y.H. On the scale-up of gas-hydrate-forming reactors: The case of gas-dispersion-type reactors. Energies 2015, 8, 1317–1335. [Google Scholar] [CrossRef]
- Linga, P.; Kumar, R.; Englezos, P. Gas Hydrate formation from hydrogen/carbon dioxide and nitrogen/carbon dioxide gas mixtures. Chem. Eng. Sci. 2007, 62, 4268–4276. [Google Scholar] [CrossRef]
- Linga, P.; Adeyemo, A.; Englezos, P. Medium-pressure clathrate hydrate/membrane hybrid process for postcombustion capture of carbon dioxide. Environ. Sci. Technol. 2007, 42, 315–320. [Google Scholar] [CrossRef]
- Seo, Y.T.; Moudrakovski, I.L.; Ripmeester, J.A.; Lee, J.W.; Lee, H. Efficient recovery of CO2 from flue gas by clathrate hydrate formation in porous silica gels. Environ. Sci. Technol. 2005, 39, 2315–2319. [Google Scholar] [CrossRef] [PubMed] [Green Version]
- Kang, S.-P.; Lee, J.-W.; Ryu, H.-J. Phase behavior of methane and carbon dioxide hydrates in meso-and macro-sized porous media. Fluid Phase Equilib. 2008, 274, 68–72. [Google Scholar] [CrossRef]
- Linga, P.; Kumar, R.; Lee, J.D.; Ripmeester, J.; Englezos, P. A new apparatus to enhance the rate of gas hydrate formation: Application to capture of carbon dioxide. Int. J. Greenh. Gas Control 2010, 4, 630–637. [Google Scholar] [CrossRef]
- Froment, G.F.; Bischoff, K.B.; de Wilde, J. Chemical Reactor Analysis and Design; Wiley: New York, NY, USA, 1990. [Google Scholar]
- Whitton, M. Gas Liquid Mixing in Tall Vessels Fitted with Multiple Impellers; Cranfield Institute of Technology: Cranfield, UK, 1992. [Google Scholar]
- Mullin, J.W. Crystallization; Butterworth-Heinemann: Oxford, UK, 2001. [Google Scholar]
- Mork, M.; Gudmundsson, J.S. Hydrate formation rate in a continuous stirred tank reactor: Experimental results and bubble-to-crystal model. In Proceedings of the 4th International Conference on Gas Hydrates, Yokohama, Japan, 19–23 May 2002.
- Sloan, E.D.; CKoh, A. Clathrate Hydrates of Natural Gases, 3rd ed.; Speight, J.G., Ed.; CRC Press: Boca Raton, FL, USA, 2008. [Google Scholar]
- Hashemi, S.; Macchi, A.; Servio, P. Gas hydrate growth model in a semibatch stirred tank reactor. Ind. Eng. Chem. Res. 2007, 46, 5907–5912. [Google Scholar] [CrossRef]
- Clarke, M.A.; Bishnoi, P. Determination of the intrinsic kinetics of CO2 gas hydrate formation using in situ particle size analysis. Chem. Eng. Sci. 2005, 60, 695–709. [Google Scholar] [CrossRef]
- Skovborg, P.; Rasmussen, P. A mass transport limited model for the growth of methane and ethane gas hydrates. Chem. Eng. Sci. 1994, 49, 1131–1143. [Google Scholar] [CrossRef]
- Ribeiro, C.P.; Lage, P.L. Modelling of hydrate formation kinetics: State-of-the-art and future directions. Chem. Eng. Sci. 2008, 63, 2007–2034. [Google Scholar] [CrossRef]
- Garcia-Ochoa, F.; Gomez, E. Theoretical prediction of gas–liquid mass transfer coefficient, specific area and hold-up in sparged stirred tanks. Chem. Eng. Sci. 2004, 59, 2489–2501. [Google Scholar] [CrossRef]
- Saravanan, K.; Ramamurthy, V.; Chandramohan, K. Gas hold up in multiple impeller agitated vessels. Mod. Appl. Sci. 2009, 3, 49. [Google Scholar] [CrossRef]
- Yang, S.; Li, X.; Yang, C.; Ma, B.; Mao, Z.S. Computational fluid dynamics simulation and experimental measurement of gas and solid holdup distributions in a gas-liquid-solid stirred reactor. Ind. Eng. Chem. Res. 2015, 55, 3276–3286. [Google Scholar] [CrossRef]
- Laakkonen, M.; Honkanen, M.; Saarenrinne, P.; Aittamaa, J. Local bubble size distributions, gas-liquid interfacial areas and gas holdups in a stirred vessel with particle image velocimetry. Chem. Eng. J. 2005, 109, 37–47. [Google Scholar] [CrossRef]
- Chung, K.; Simmons, M.; Barigou, M. Local gas and liquid phase velocity measurement in a miniature stirred vessel using PIV combined with a new image processing algorithm. Exp. Therm. Fluid Sci. 2009, 33, 743–753. [Google Scholar] [CrossRef]
- Stoykova, R.; Moutafchieva, D.; Popova, D.; Iliev, V. Gas hold-up prediction in gas-liquid stirred tank reactor using CFD simulation. J. Chem. Technol. Metall. 2014, 49, 469–472. [Google Scholar]
- Zhang, Y.; Bai, Y.; Wang, H. CFD analysis of inter-phase forces in a bubble stirred vessel. Chem. Eng. Res. Des. 2013, 91, 29–35. [Google Scholar] [CrossRef]
- Kudrewizki, F.; Rabe, P. Model of the dissipation of mechanical energy in gassed stirred tanks. Chem. Eng. Sci. 1986, 41, 2247–2252. [Google Scholar] [CrossRef]
- Bhavaraju, S.M.; Russell, T.; Blanch, H. The design of gas sparged devices for viscous liquid systems. AlChE J. 1978, 24, 454–466. [Google Scholar] [CrossRef]
- Andersson, V. Flow Properties of Natural Gas Hydrate Slurries. Ph.D. Thesis, Department of Petroleum Engineering and Applied Geophysics, NTNU, Trondheim, Norway, 1999. [Google Scholar]
- Andersson, V.; Gudmundsson, J.S. Flow Properties of Hydrate-in-Water Slurries. Ann. N. Y. Acad. Sci. 2000, 912, 322–329. [Google Scholar] [CrossRef]
- Pérez, J.S.; Porcel, E.R.; López, J.C.; Sevilla, J.F.; Chisti, Y. Shear rate in stirred tank and bubble column bioreactors. Chem. Eng. J. 2006, 124, 1–5. [Google Scholar] [CrossRef]
- Lekvam, K.; Ruoff, P. A reaction kinetic mechanism for methane hydrate formation in liquid water. J. Am. Chem. Soc. 1993, 115, 8565–8569. [Google Scholar] [CrossRef]
- Duan, Z.; Møller, N.; Greenberg, J.; Weare, J.H. The prediction of methane solubility in natural waters to high ionic strength from 0 to 250 c and from 0 to 1600 bar. Geochim. Cosmochim. Acta 1992, 56, 1451–1460. [Google Scholar] [CrossRef]
- Webb, E.B.; Koh, C.A.; Liberatore, M.W. Rheological properties of methane hydrate slurries formed from AOT + water + oil microemulsions. Langmuir 2013, 29, 10997–11004. [Google Scholar] [CrossRef] [PubMed]
- Hardy, S. A grain boundary groove measurement of the surface tension between ice and water. Philos. Mag. 1977, 35, 471–484. [Google Scholar] [CrossRef]
- Abay, H.K.; Svartaas, T.M. Multicomponent gas hydrate nucleation: The effect of the cooling rate and composition. Energy Fuels 2011, 25, 42–51. [Google Scholar] [CrossRef]
- Jiang, S.; ter Horst, J.H. Crystal nucleation rates from probability distributions of induction times. Cryst. Growth Des. 2010, 11, 256–261. [Google Scholar] [CrossRef]
- Kulkarni, S.A.; Kadam, S.S.; Meekes, H.; Stankiewicz, A.I.; ter Horst, J.H. Crystal nucleation kinetics from induction times and metastable zone widths. Cryst. Growth Des. 2013, 13, 2435–2440. [Google Scholar] [CrossRef]
- Svartaas, T.M.; Ke, W.; Tantciura, S.; Bratland, A.U. Maximum likelihood estimation—A reliable statistical method for hydrate nucleation data analysis. Energy Fuels 2015, 29, 8195–8207. [Google Scholar] [CrossRef]
- Kvamme, B. Kinetics of hydrate formation from nucleation theory. Int. J. Offshore Polar Eng. 2002, 12, 256–263. [Google Scholar]
- Abay, H.K. Kinetics of Gas Hydrate Nucleation and Growth. Ph.D. Thesis, University of Stavanger, Stavanger, Norway, 2011. [Google Scholar]
- Krüger, S.; Deubener, J. Stochastic nature of the liquid-to-crystal heterogeneous nucleation of supercooled lithium disilicate liquid. J. Non-Cryst. Solids 2014, 388, 6–9. [Google Scholar] [CrossRef]
- Lee, K.; Lee, S.-H.; Lee, W. Stochastic nature of carbon dioxide hydrate induction times in Na-montmorillonite and marine sediment suspensions. Int. J. Greenh. Gas Control 2013, 14, 15–24. [Google Scholar] [CrossRef]
- Kashchiev, D.; Firoozabadi, A. Induction time in crystallization of gas hydrates. J. Cryst. Growth 2003, 250, 499–515. [Google Scholar] [CrossRef]
- Skovborg, P.; Ng, H.J.; Rasmussen, P.; Mohn, U. Measurement of induction times for the formation of methane and ethane gas hydrates. Chem. Eng. Sci. 1993, 48, 445–453. [Google Scholar] [CrossRef]
- Zhong, D.; Yang, C.; Liu, D.P.; Wu, Z.M. Experimental investigation of methane hydrate formation on suspended water droplets. J. Cryst. Growth 2011, 327, 237–244. [Google Scholar] [CrossRef]
- Høvring, E. On the Activation Energy for the Formation of a Critical Size Water Cluster in Structure I and Structure II Gas Hydrates. Master’s Thesis, University of Stavanger, Stavanger, Norway, 2012. [Google Scholar]
- Meindinyo, R.-E.T.; Svartaas, T.M.; Nordbø, T.N.; Bøe, R. Gas hydrate growth estimation based on heat transfer. Energy Fuels 2015, 29, 587–594. [Google Scholar] [CrossRef]
- Englezos, P.; Kalogerakis, N.; Dholabhai, P.D.; Bishnoi, P.R. Kinetics of gas hydrate formation from mixtures of methane and ethane. Chem. Eng. Sci. 1987, 42, 2659–2666. [Google Scholar] [CrossRef]
- Malegaonkar, M.B.; Dholabhai, P.D.; Bishnoi, P.R. Kinetics of carbon dioxide and methane hydrate formation. Can. J. Chem. Eng. 1997, 75, 1090–1099. [Google Scholar] [CrossRef]
- Meindinyo, R.-E.; Svartaas, T.M. A parametric study of hydrate growth behaviour. In Proceedings of the 8th International Conference on Gas Hydrates, Beijing, China, 28 July–1 August 2014.
- Tatterson, G.B. Fluid Mixing and Gas Dispersion in Agitated Tanks; McGraw-Hill Companies: New York, NY, USA, 1991. [Google Scholar]
- Peng, B.; Dandekar, A.; Sun, C.Y.; Luo, H.; Ma, Q.L.; Pang, W.X.; Chen, G.J. Hydrate film growth on the surface of a gas bubble suspended in water. J. Phys. Chem. B 2007, 111, 12485–12493. [Google Scholar] [CrossRef] [PubMed]
- Happel, J.; Hnatow, M.A.; Meyer, H. The study of separation of nitrogen from methane by hydrate formation using a novel apparatusa. Ann. N. Y. Acad. Sci. 1994, 715, 412–424. [Google Scholar] [CrossRef]
- Abay, H.K.; Svartaas, T.M.; Ke, W. Effect of gas composition on sII hydrate growth kinetics. Energy Fuels 2011, 25, 1335–1341. [Google Scholar] [CrossRef] [Green Version]
- Chaudhari, R.; Dandekar, A.; Sun, C.Y.; Luo, H.; Ma, Q.L.; Pang, W.X.; Chen, G.J. Gas-liquid mass transfer in “dead-end” autoclave reactors. Can. J. Chem. Eng. 1987, 65, 744–751. [Google Scholar] [CrossRef]
- Beenackers, A.; van Swaaij, W. Mass transfer in gas—Liquid slurry reactors. Chem. Eng. Sci. 1993, 48, 3109–3139. [Google Scholar] [CrossRef]
- Engeskaug, R.; Thorbjørnsen, E.; Svendsen, H.F. Wall heat transfer in stirred tank reactors. Ind. Eng. Chem. Res. 2005, 44, 4949–4958. [Google Scholar] [CrossRef]
- Debab, A.; Chergui, N.; Bekrentchir, K.; Bertrand, J. An investigation of heat transfer in a mechanically agitated vessel. J. Appl. Fluid Mech. 2011, 4, 43–50. [Google Scholar]
- Meindinyo, R.-E.T.; Bøe, R.; Svartås, T.M.; Bru, S. Experimental study on the effect of gas hydrate content on heat transfer. In Proceedings of the ASME 2015 34th International Conference on Ocean, Offshore and Arctic Engineering, St. John’s, NL, Canada, 31 May–5 June 2015; American Society of Mechanical Engineers: New York, NY, USA, 2015. [Google Scholar]
- Nauman, E.B. Chemical Reactor Design, Optimization, and Scaleup; John Wiley & Sons: Hoboken, NJ, USA, 2008. [Google Scholar]
Figure 1.
Experimental apparatus.

Figure 2.
Schematic illustration of gas-liquid and crystal-solution interfaces for mass transfer of gas through the bulk phase to the crystal surface in a hydrate forming system (concept has been adopted from Mork (2002) [58]).
Figure 2.
Schematic illustration of gas-liquid and crystal-solution interfaces for mass transfer of gas through the bulk phase to the crystal surface in a hydrate forming system (concept has been adopted from Mork (2002) [58]).

Figure 3.
Pressure, temperature, and gas consumption data from a typical experimental run (141.4 mL cell, 50 mL water).
Figure 3.
Pressure, temperature, and gas consumption data from a typical experimental run (141.4 mL cell, 50 mL water).
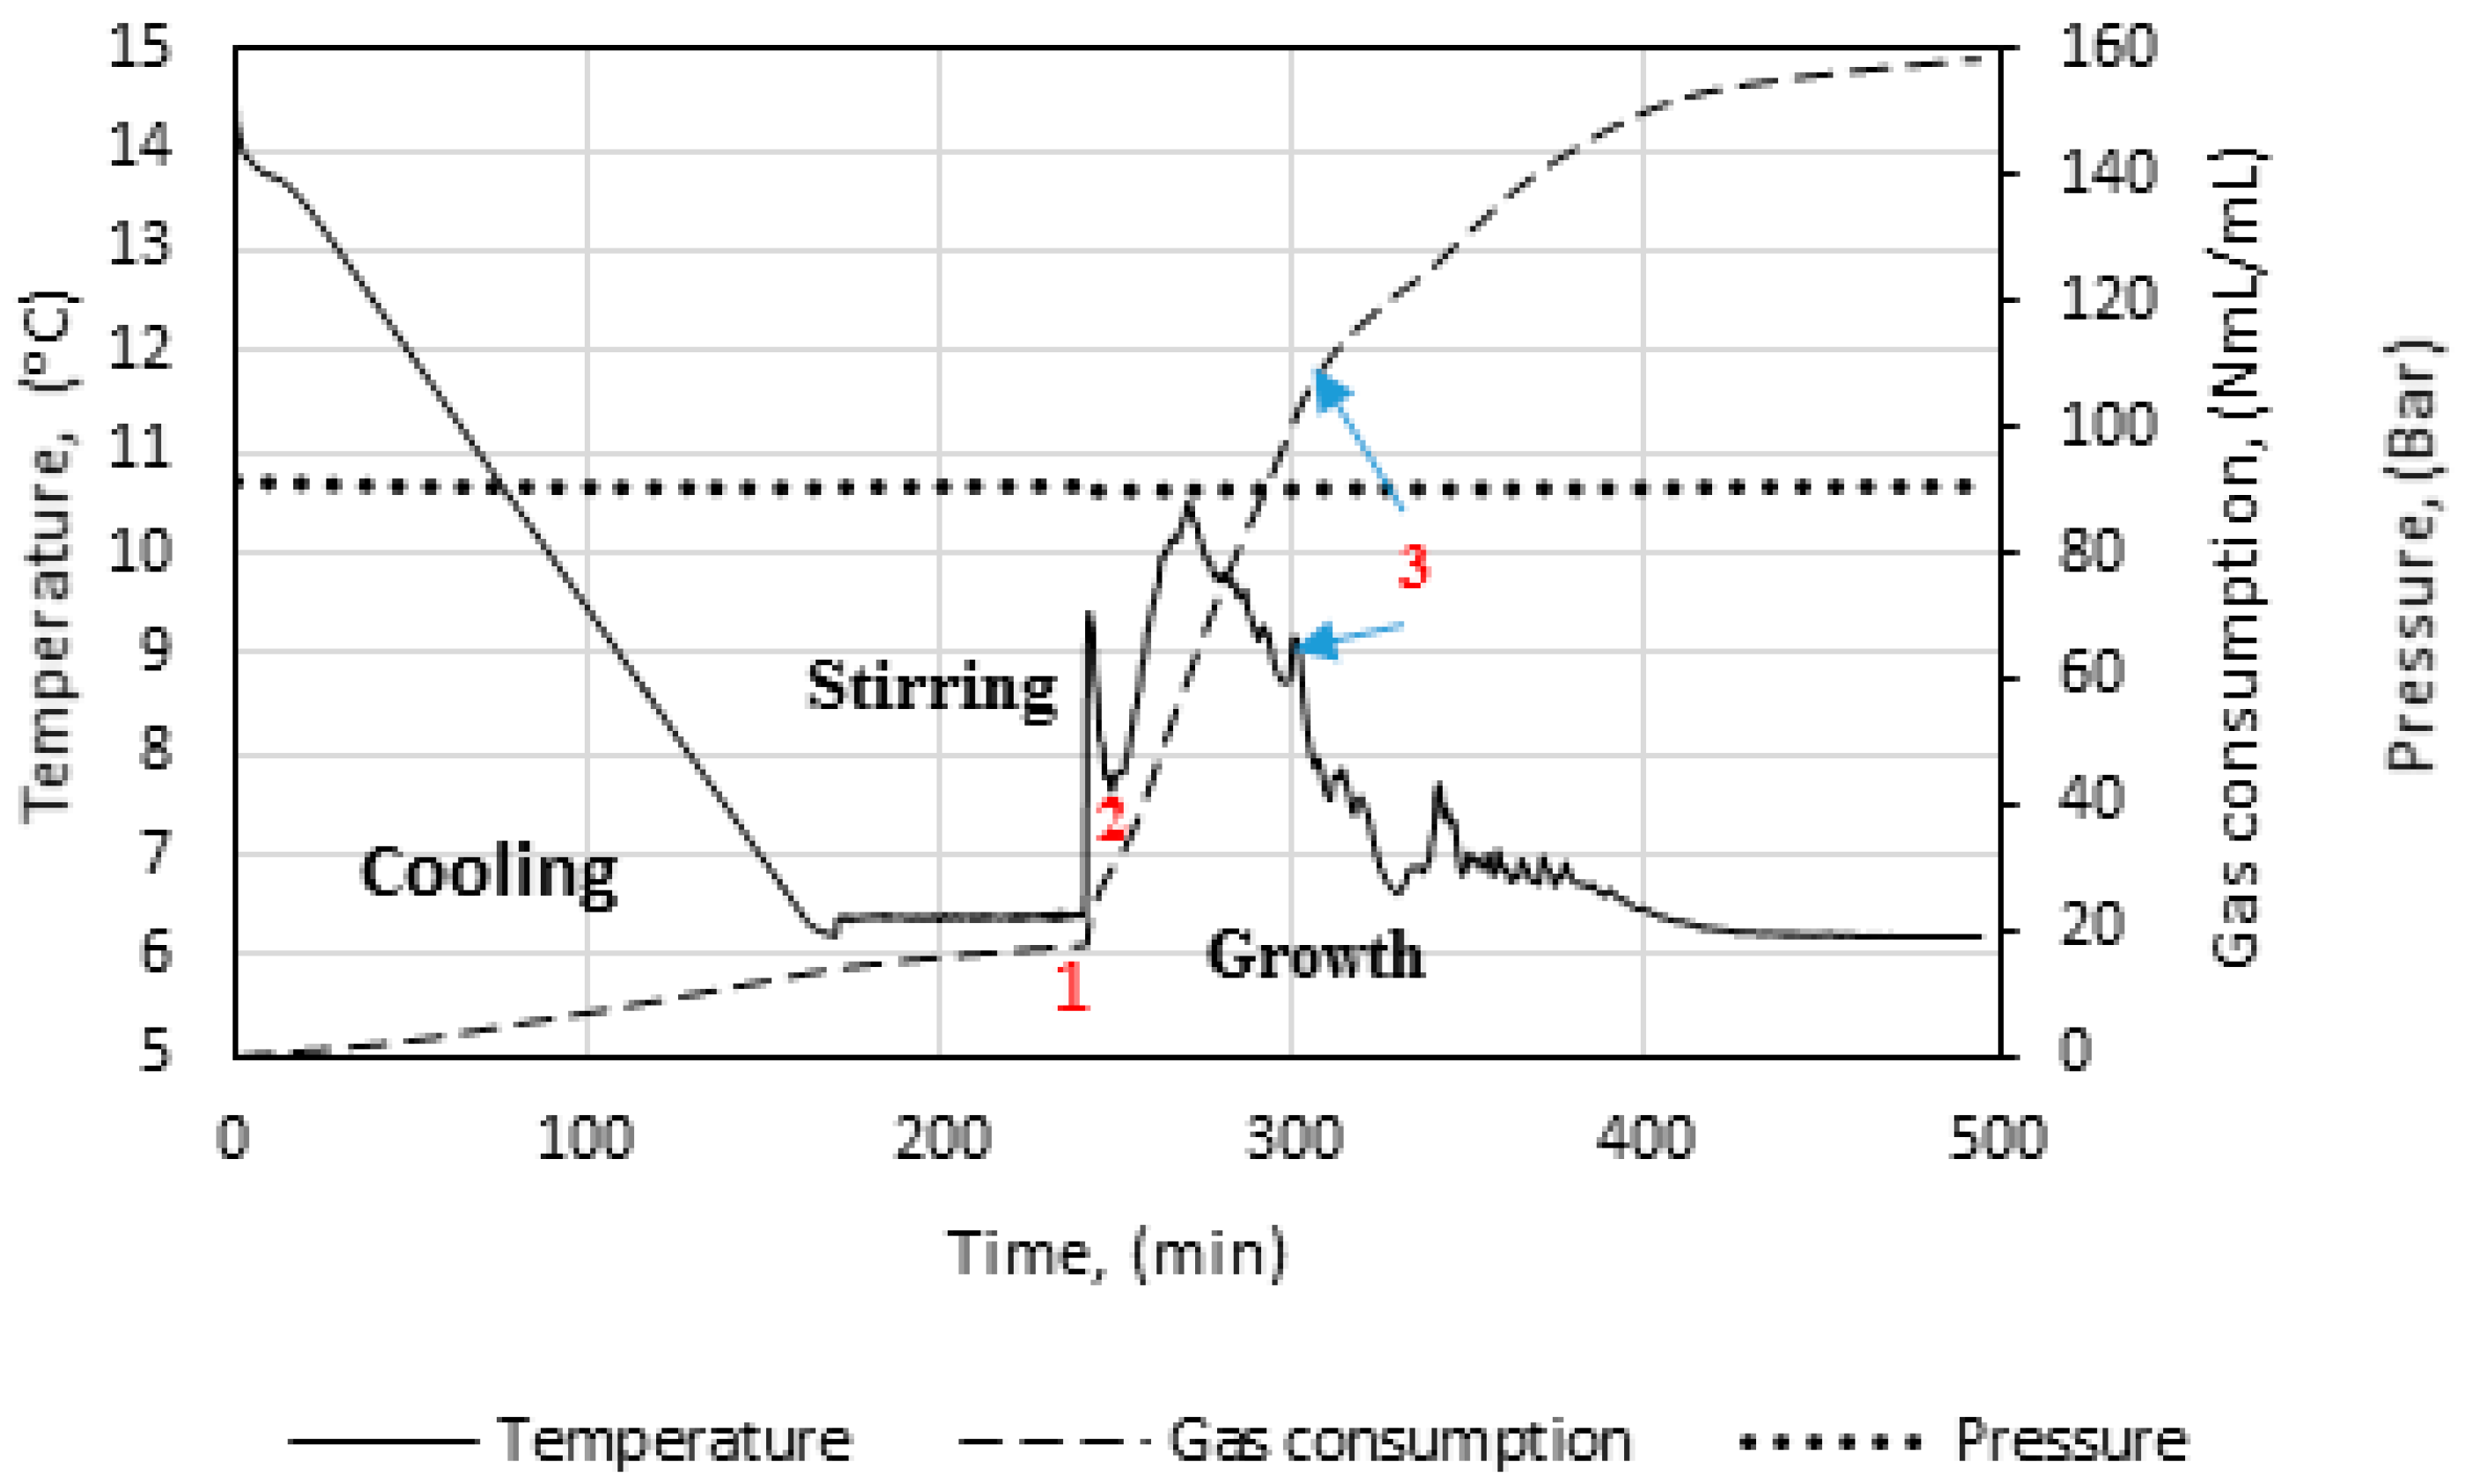
Figure 4.
Mole fraction of methane dissolved in water as a function of temperature in systems with and without methane hydrate present.
Figure 4.
Mole fraction of methane dissolved in water as a function of temperature in systems with and without methane hydrate present.
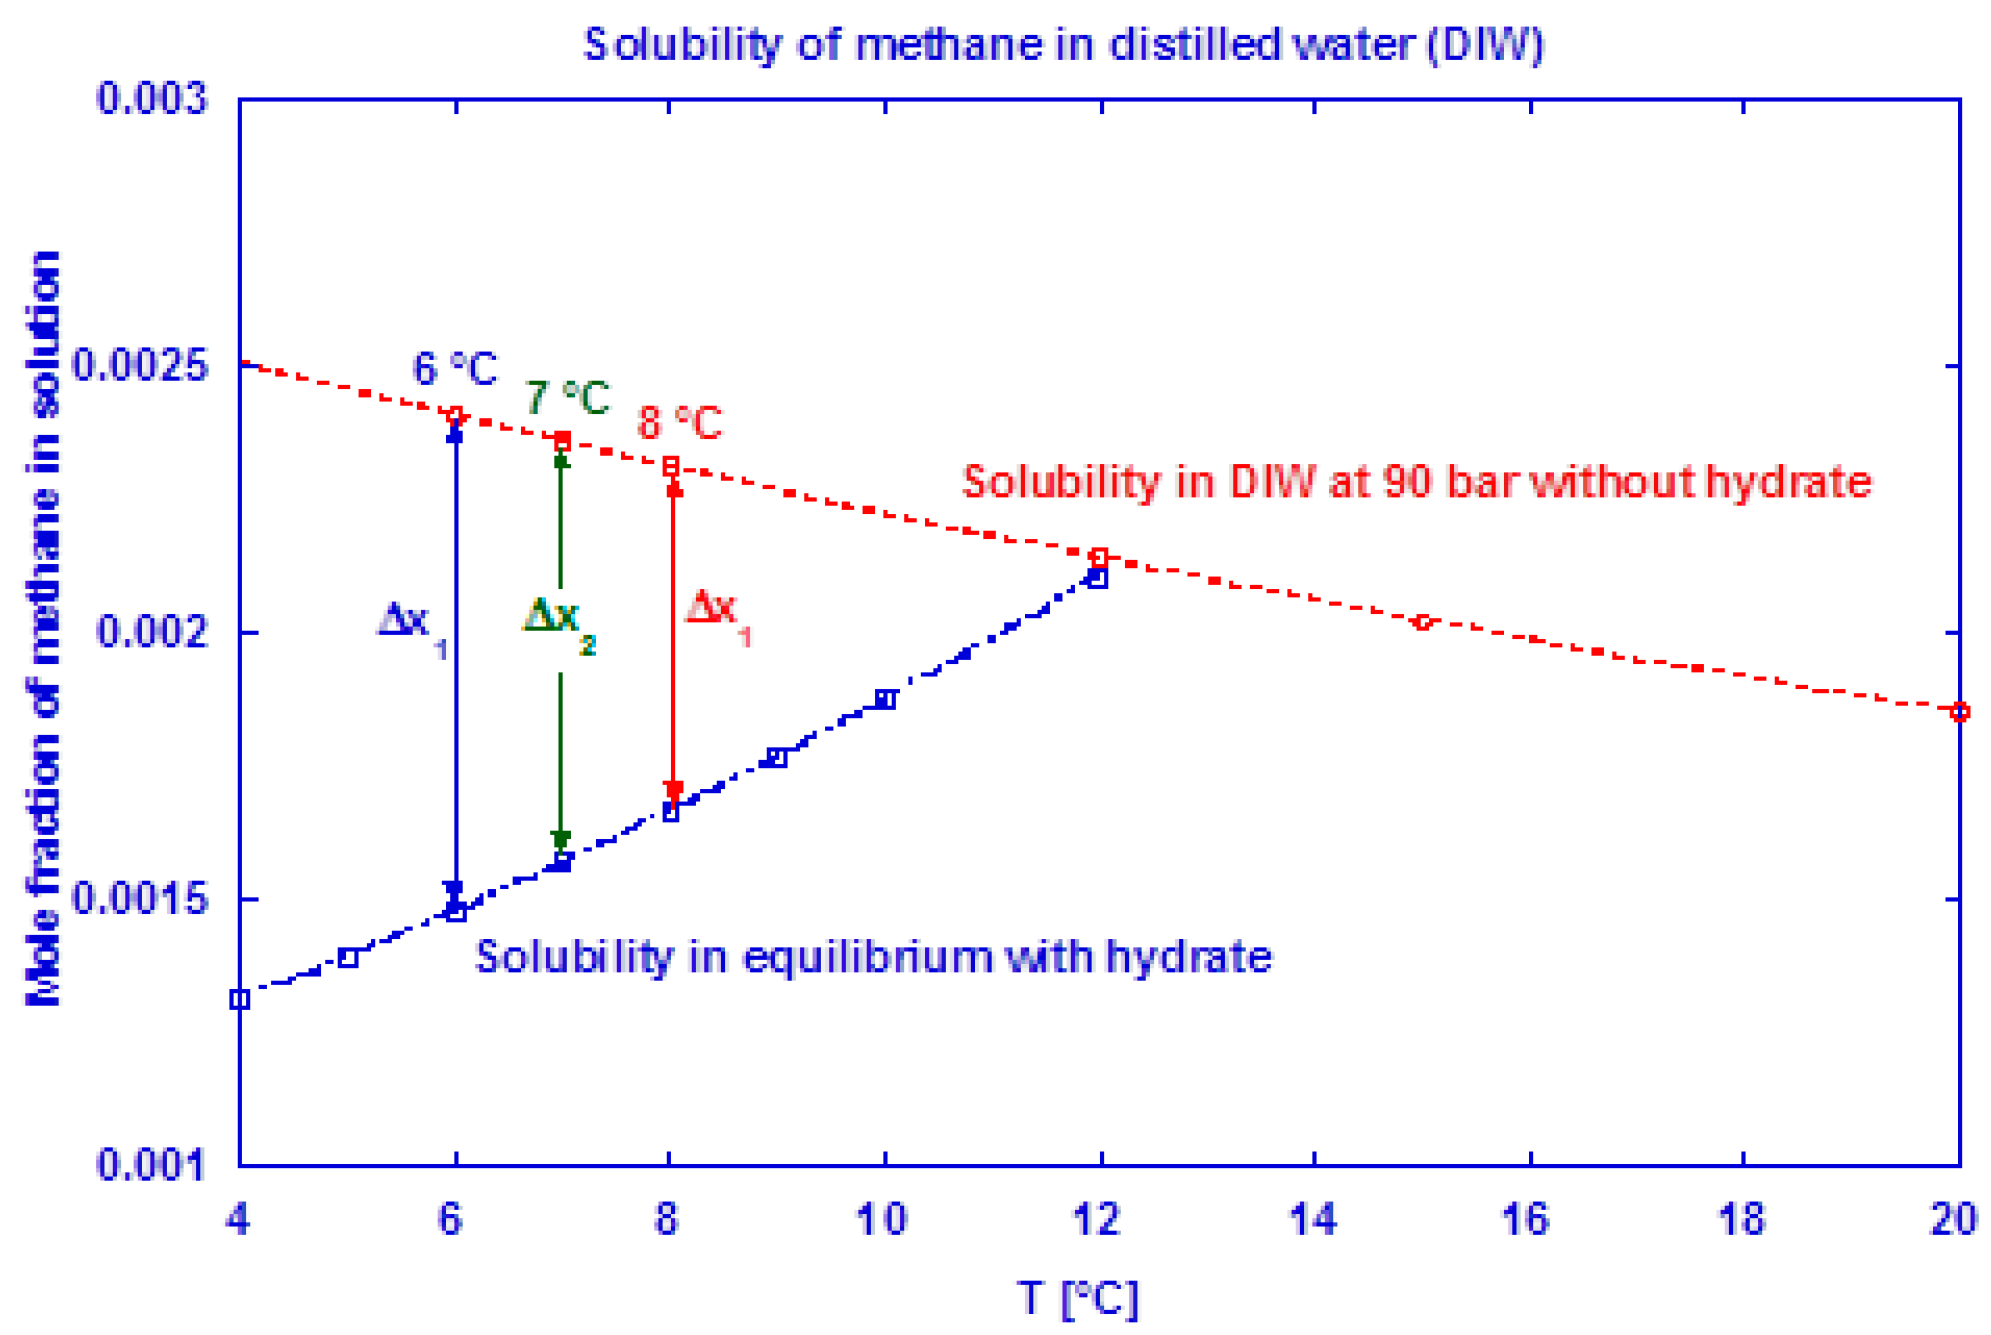
Figure 5.
Power logging during a typical experimental run.
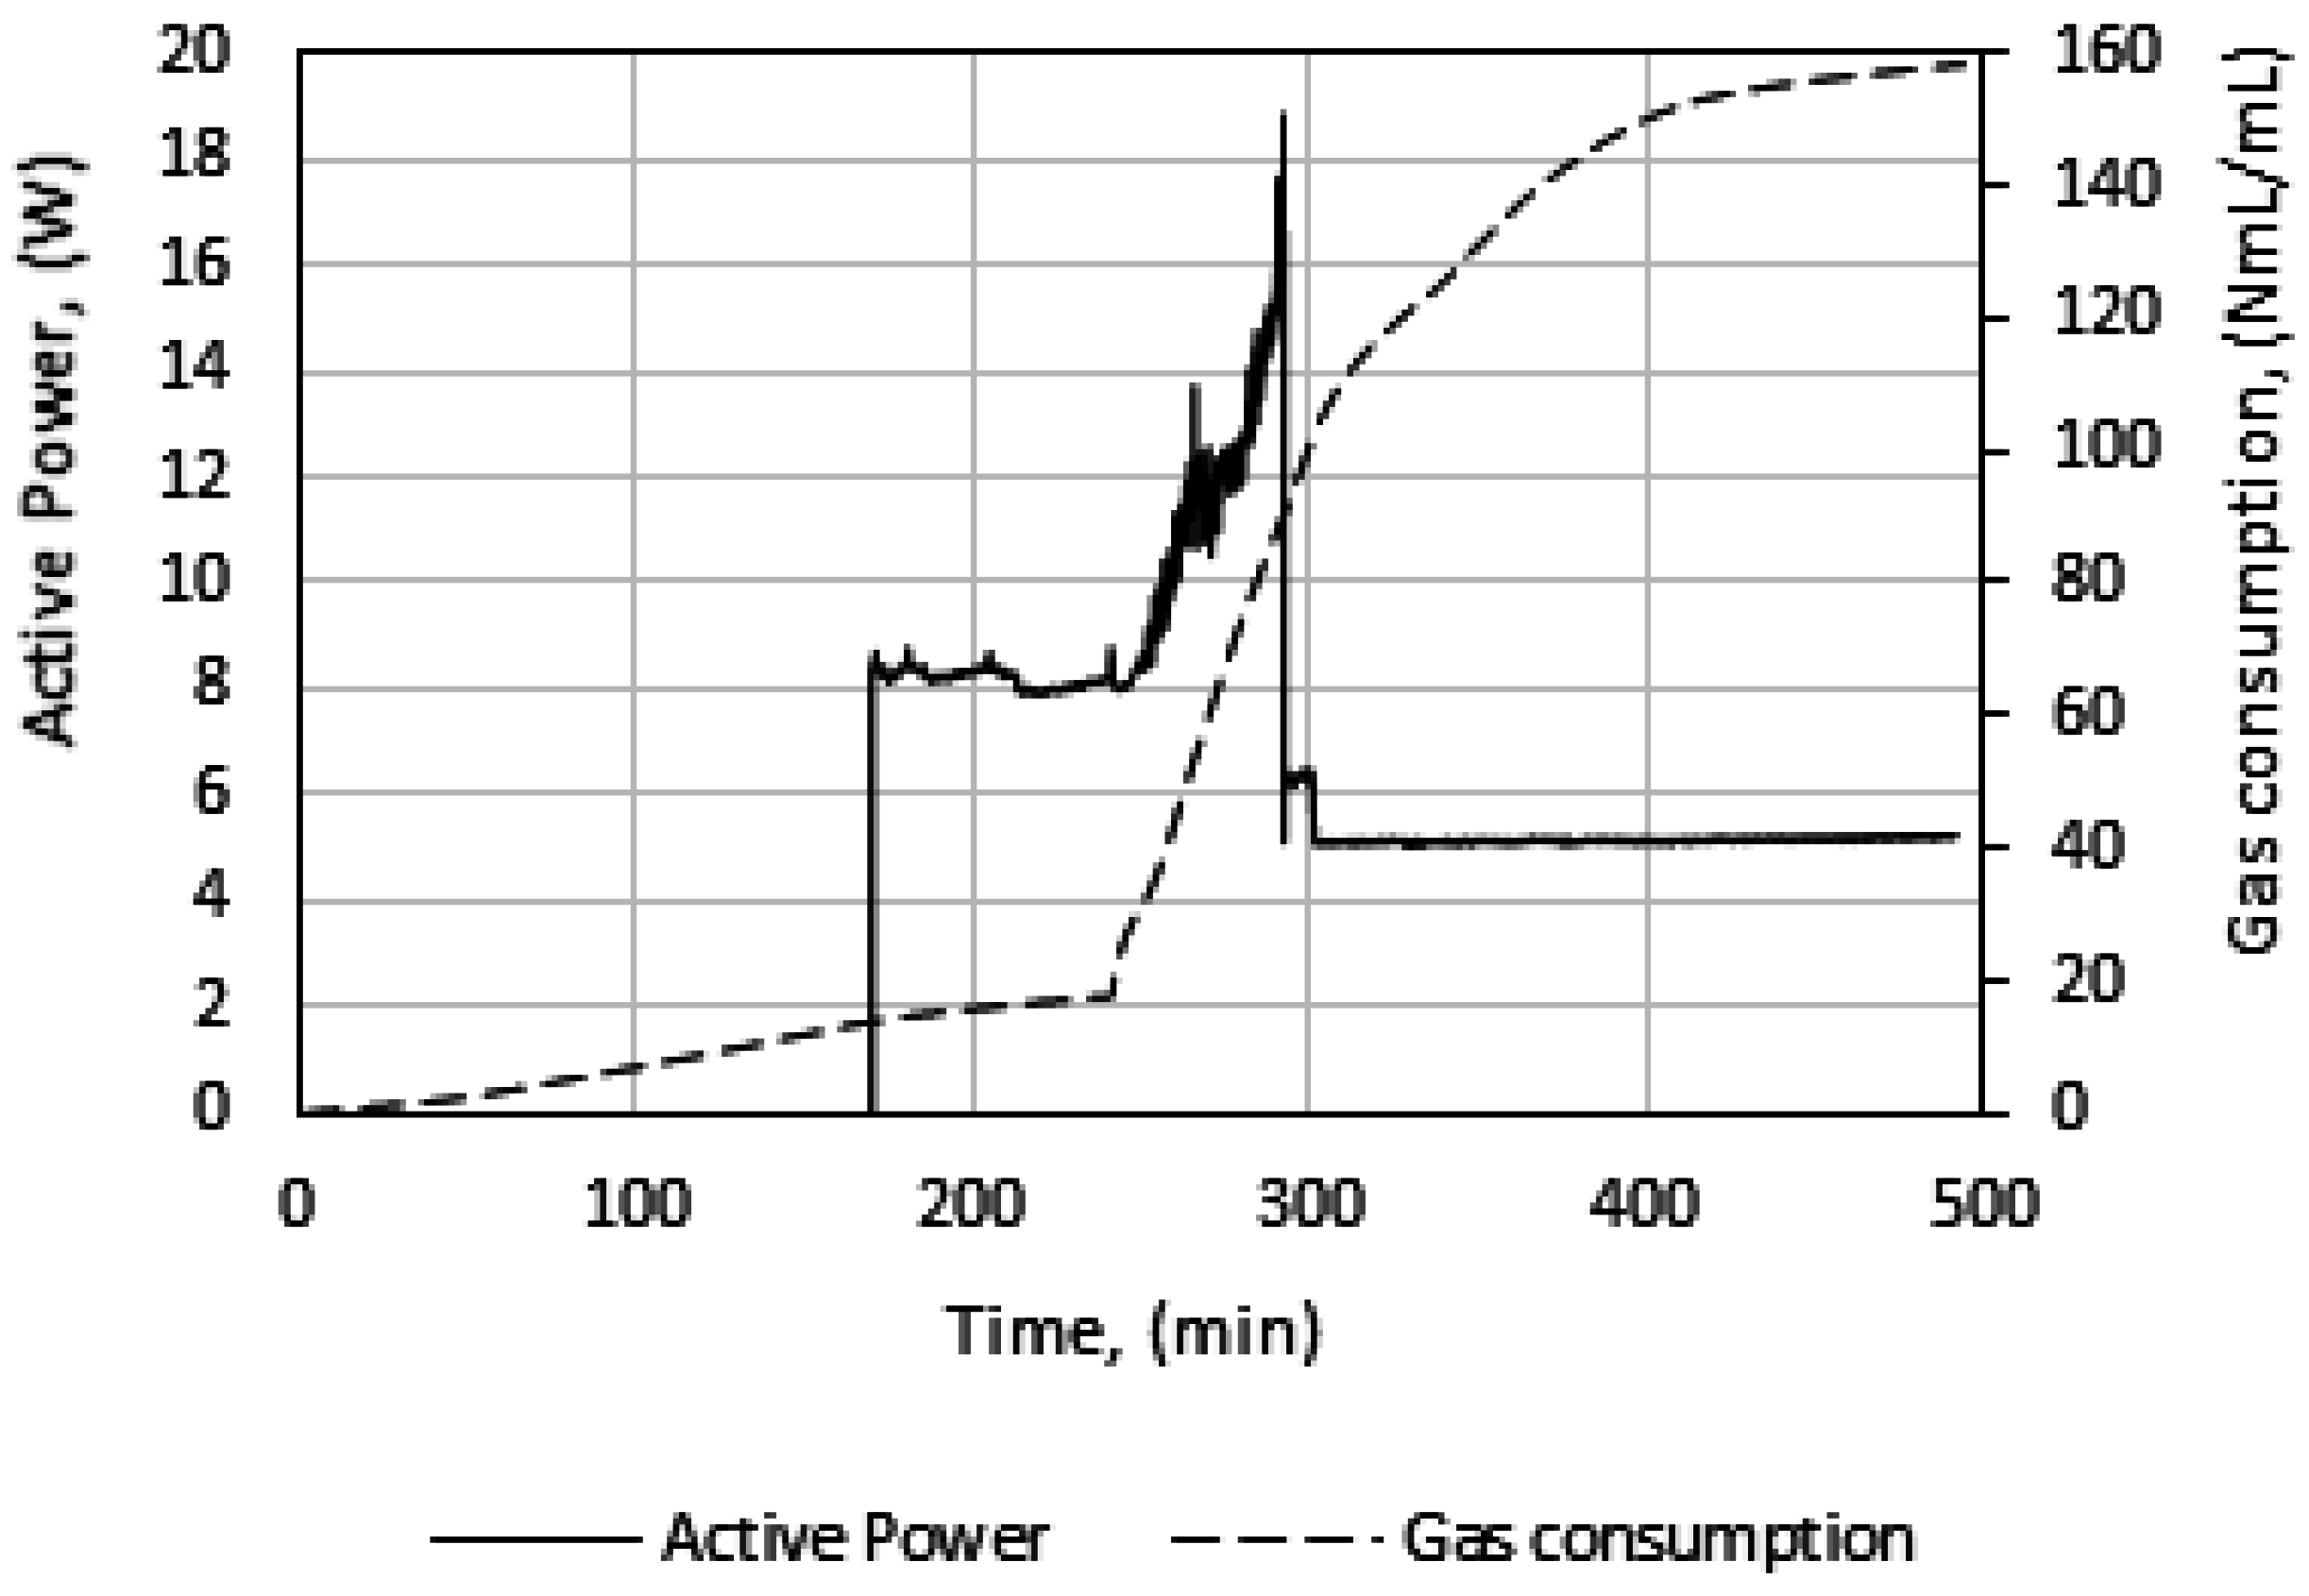
Figure 6.
Impeller power consumption during hydrate growth.

Figure 7.
Estimated viscosity during hydrate growth.
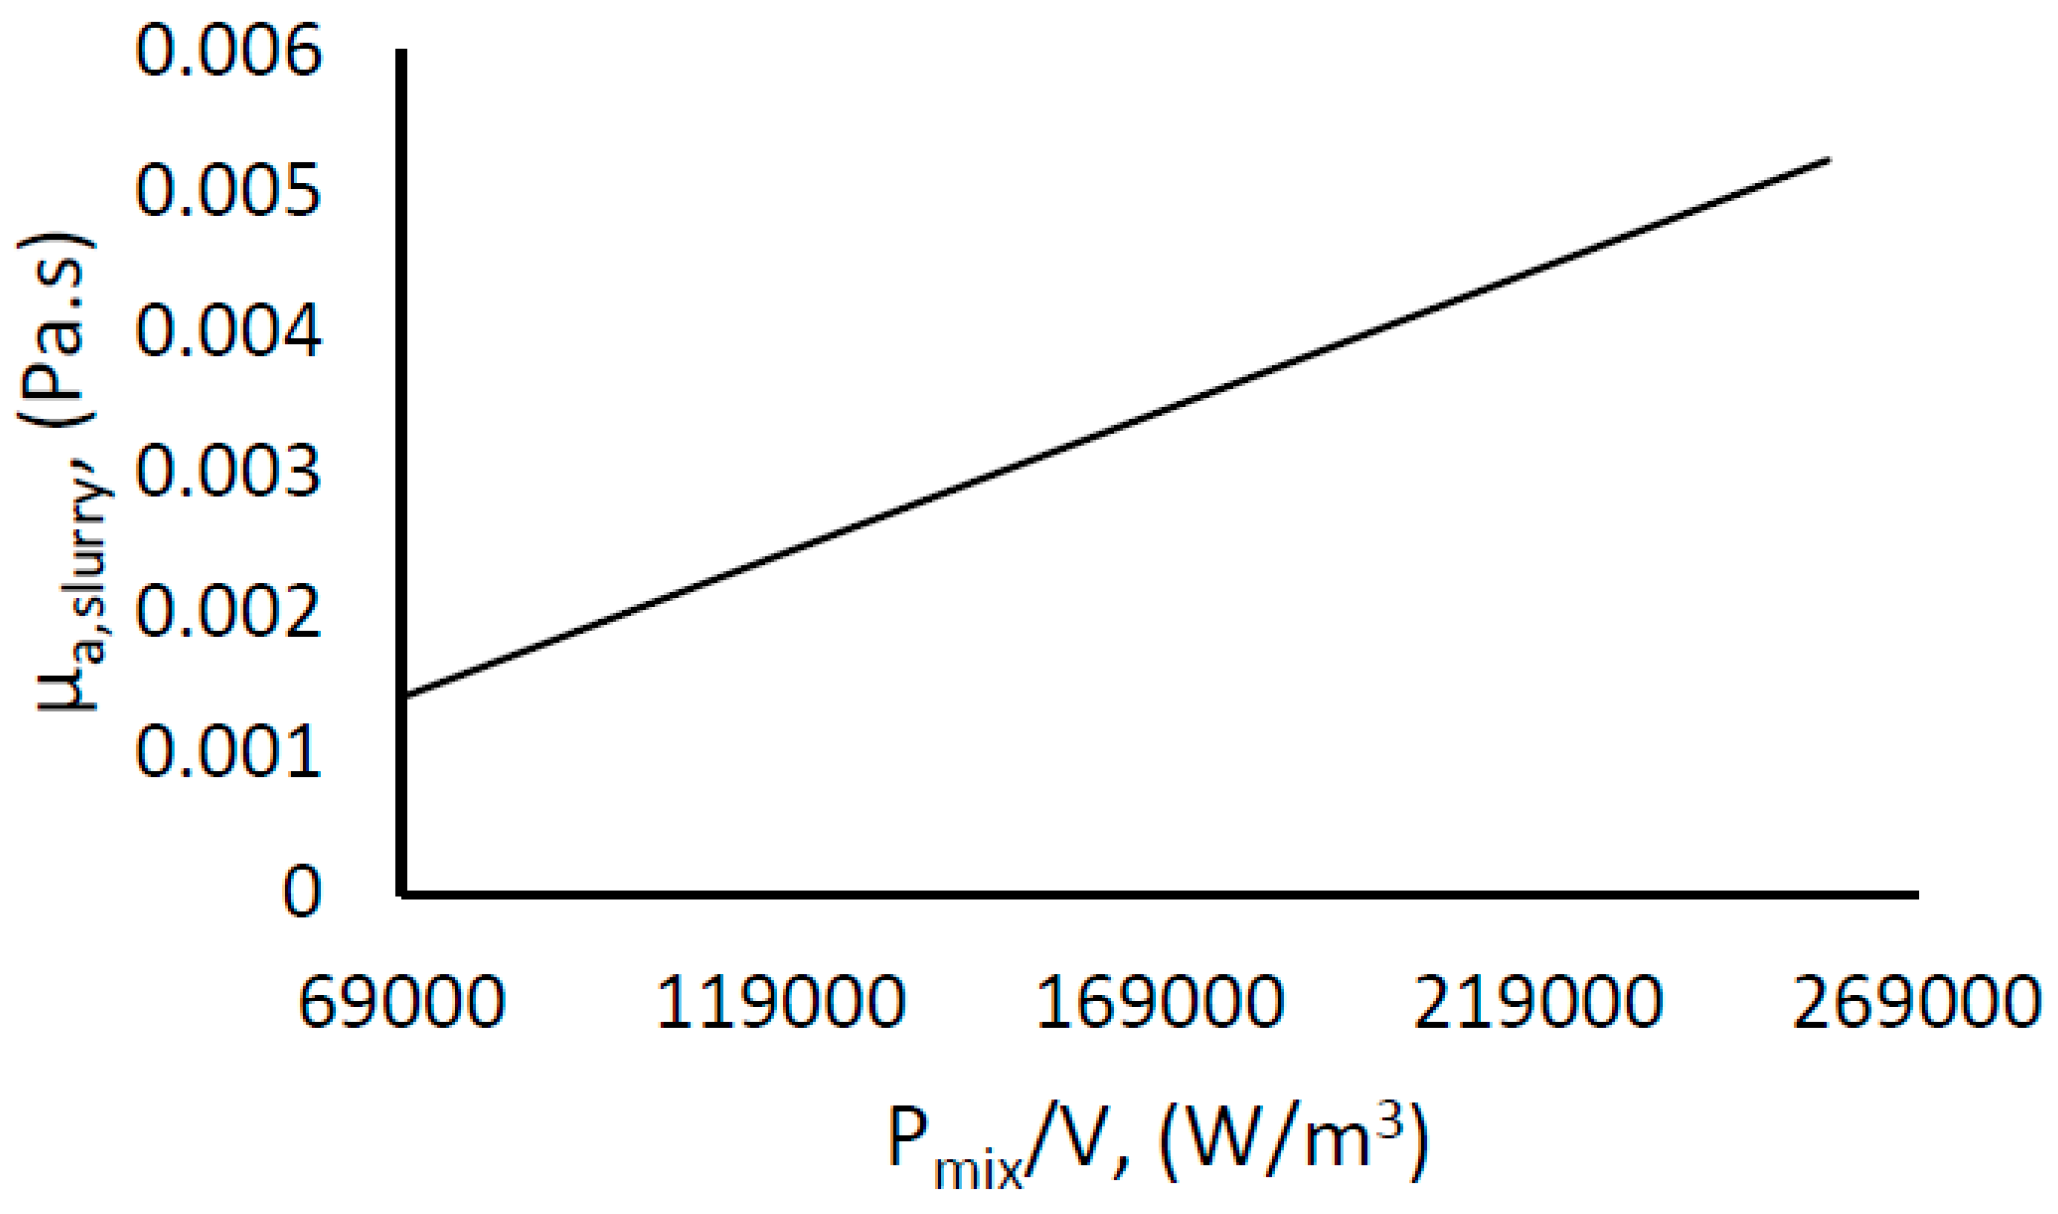
Figure 8.
Estimated mean bubble diameter during hydrate growth.
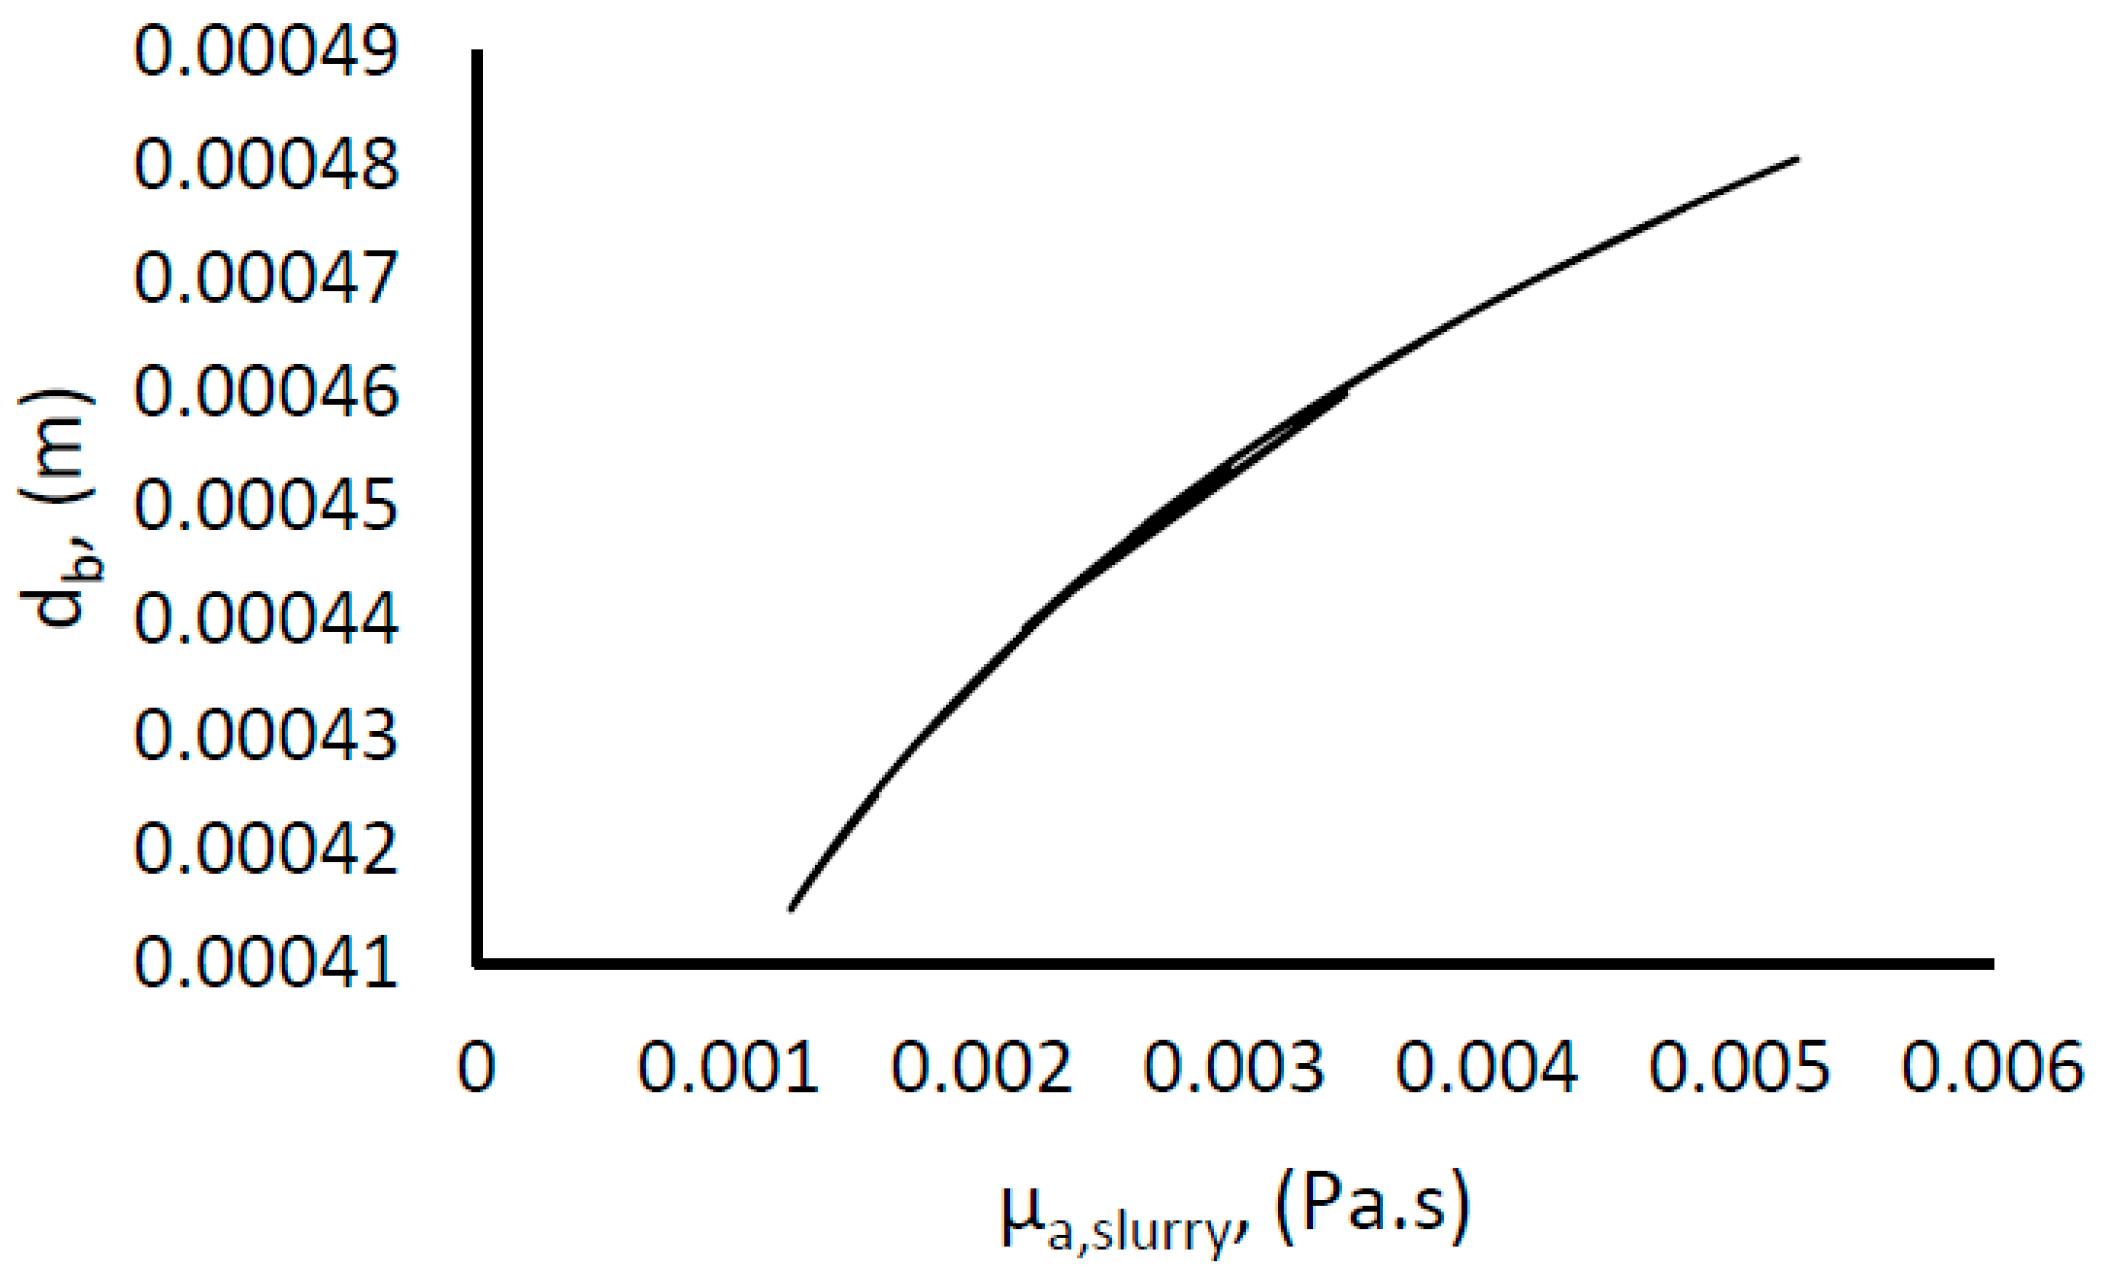
Figure 9.
Three experiments performed under similar conditions (50 mL water, 141.4 mL cell), showing the effects of mass transfer restriction and agglomeration as we go from growth stage I through II and III.
Figure 9.
Three experiments performed under similar conditions (50 mL water, 141.4 mL cell), showing the effects of mass transfer restriction and agglomeration as we go from growth stage I through II and III.

Figure 10.
Flow pattern at (A) 50 mL and (B) 100 mL water in a 141.4 mL cell.

Figure 11.
Schematic description of observed flow patterns in open cell. Gas bubbles in red represent the gas phase, and the blue line represents the liquid level in the reactor. Starting at (A), at low stirring rates below 350 RPM, the gas liquid contact area is very low. As the stirring rate increases, the liquid level rises, more gas is dispersed into the liquid phase as seen in (B,C). At (D) the stirring rate is high enough to disperse the liquid within the entire cell volume, obscuring the distinct contact boundary between the gas and liquid phases.
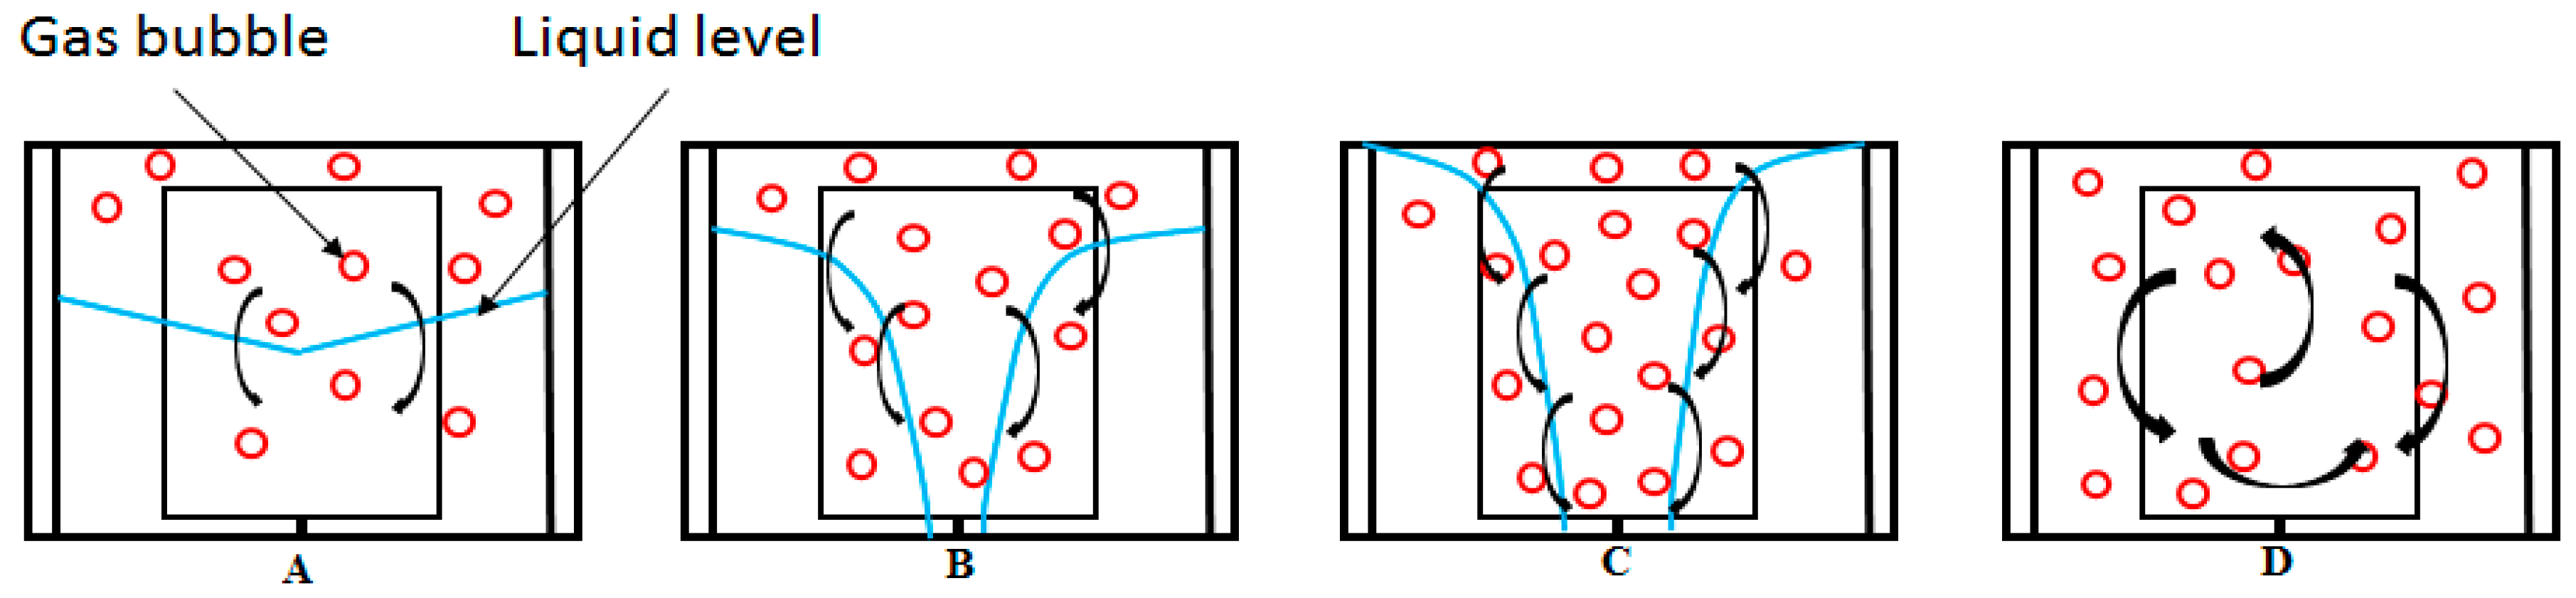
Figure 12.
Effect of temperature on gas hydrate growth rate (50 mL water content, 700 rpm stirring rate, 141.4 mL cell).
Figure 12.
Effect of temperature on gas hydrate growth rate (50 mL water content, 700 rpm stirring rate, 141.4 mL cell).

Figure 13.
Effect of water content on hydrate growth (700 rpm).

Figure 14.
Power input per unit volume of water at different water content in a 141.4 mL cell at 6 °C bath temperature.
Figure 14.
Power input per unit volume of water at different water content in a 141.4 mL cell at 6 °C bath temperature.

Figure 15.
Effect of stirring rate on growth rate in a 141.4 mL cell (50 mL water content).

Figure 16.
Temperature buildup in a 141.4 mL cell due to exothermic heat release during gas hydrate growth (50 mL water content, 6 °C in cooling bath).
Figure 16.
Temperature buildup in a 141.4 mL cell due to exothermic heat release during gas hydrate growth (50 mL water content, 6 °C in cooling bath).
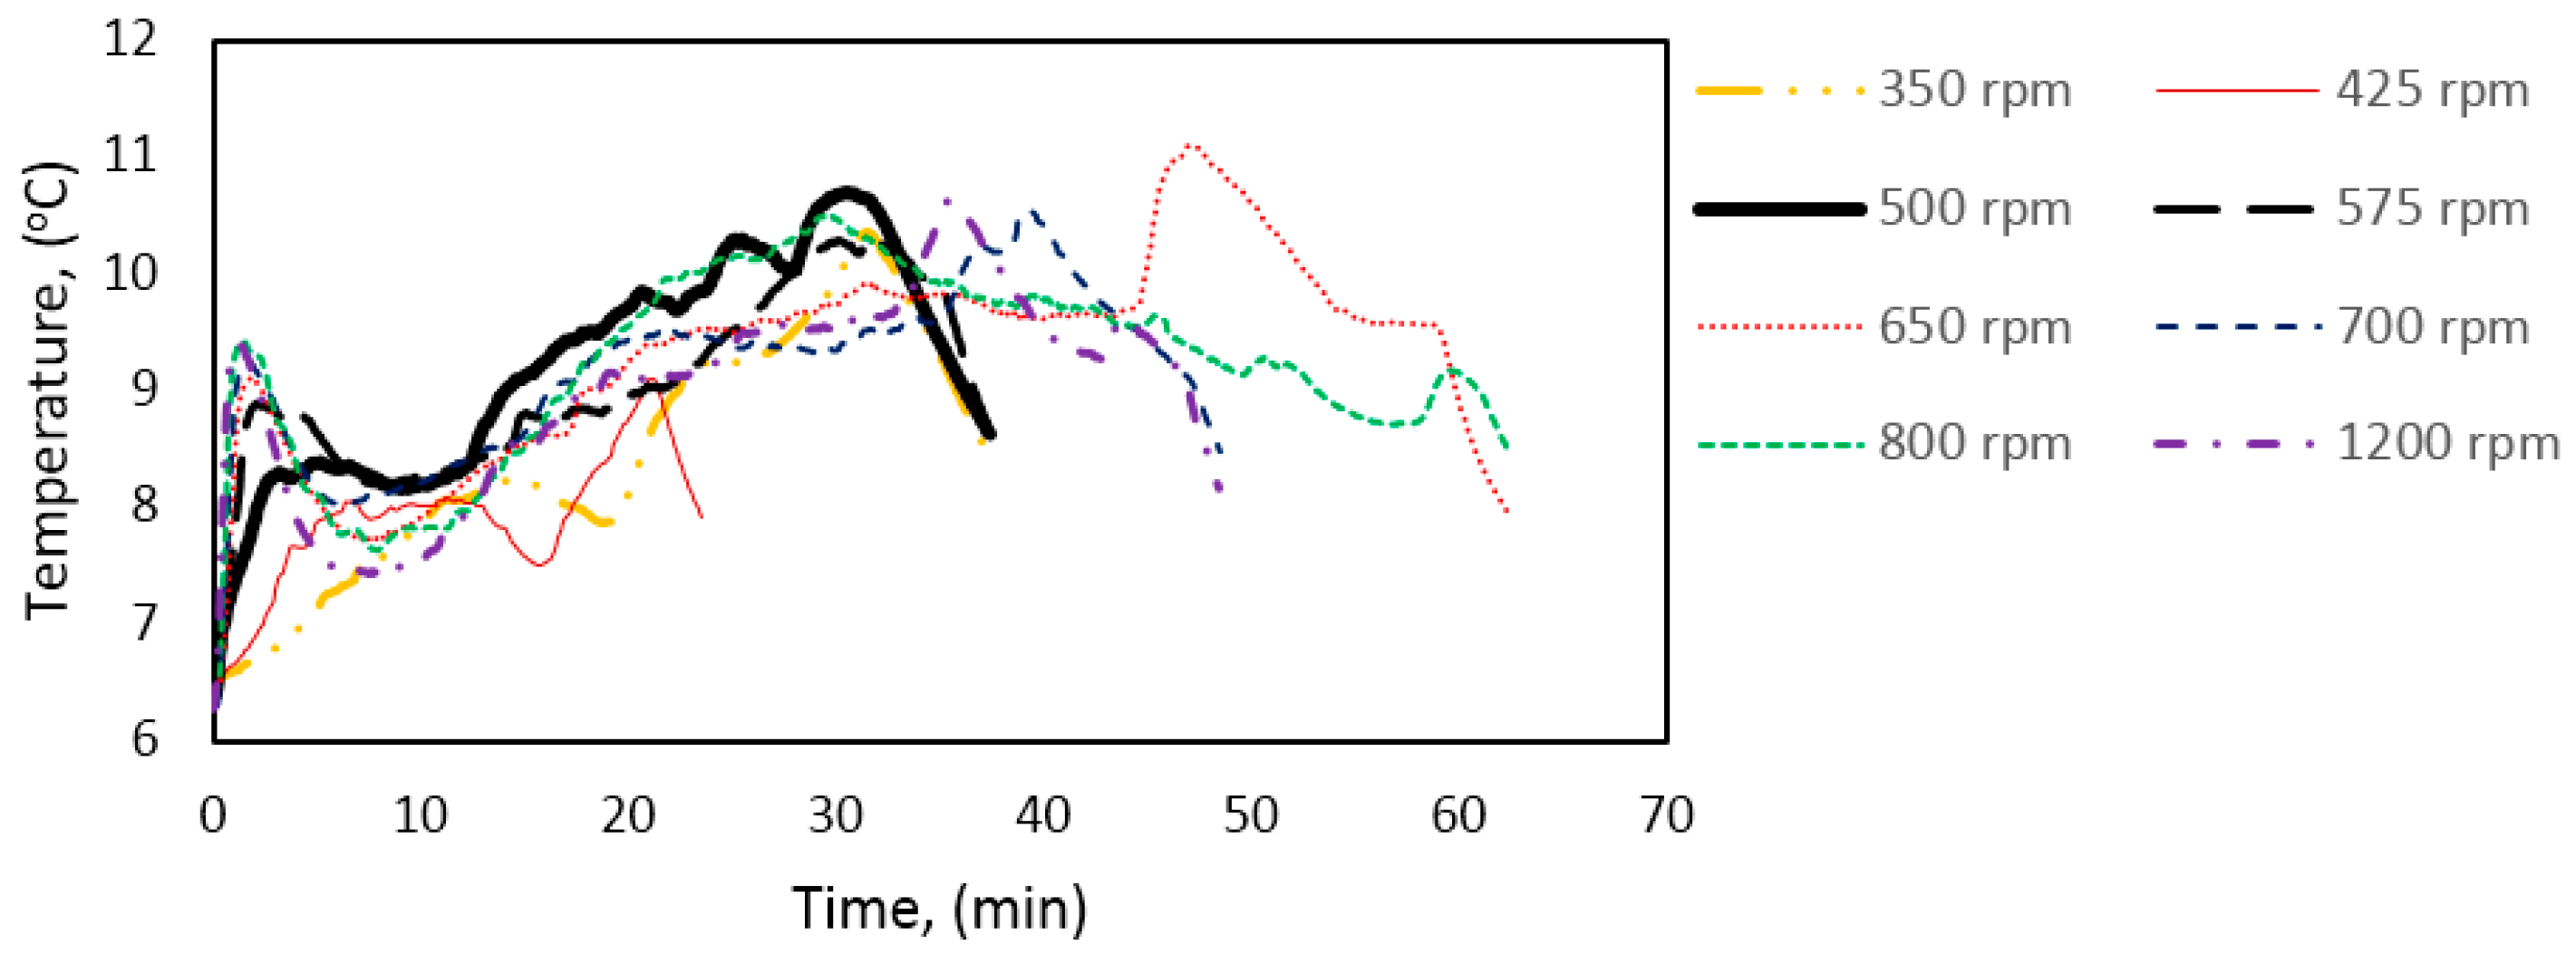
Figure 17.
Effect of reactor size on gas hydrate growth at a gas-water volume ratio, VG/VL, of 1.828 (cf. Table 1) and at different experimental temperatures (700 rpm).
Figure 17.
Effect of reactor size on gas hydrate growth at a gas-water volume ratio, VG/VL, of 1.828 (cf. Table 1) and at different experimental temperatures (700 rpm).

Figure 18.
Hydrate growth rate as a function of db, NRe, UTIP, and P/V in the 141.4 mL and 318.1 mL cells (6 °C). The gas-water volume ratio, VG/VL, was 1.828 (cf. Table 1) in all experiments.
Figure 18.
Hydrate growth rate as a function of db, NRe, UTIP, and P/V in the 141.4 mL and 318.1 mL cells (6 °C). The gas-water volume ratio, VG/VL, was 1.828 (cf. Table 1) in all experiments.
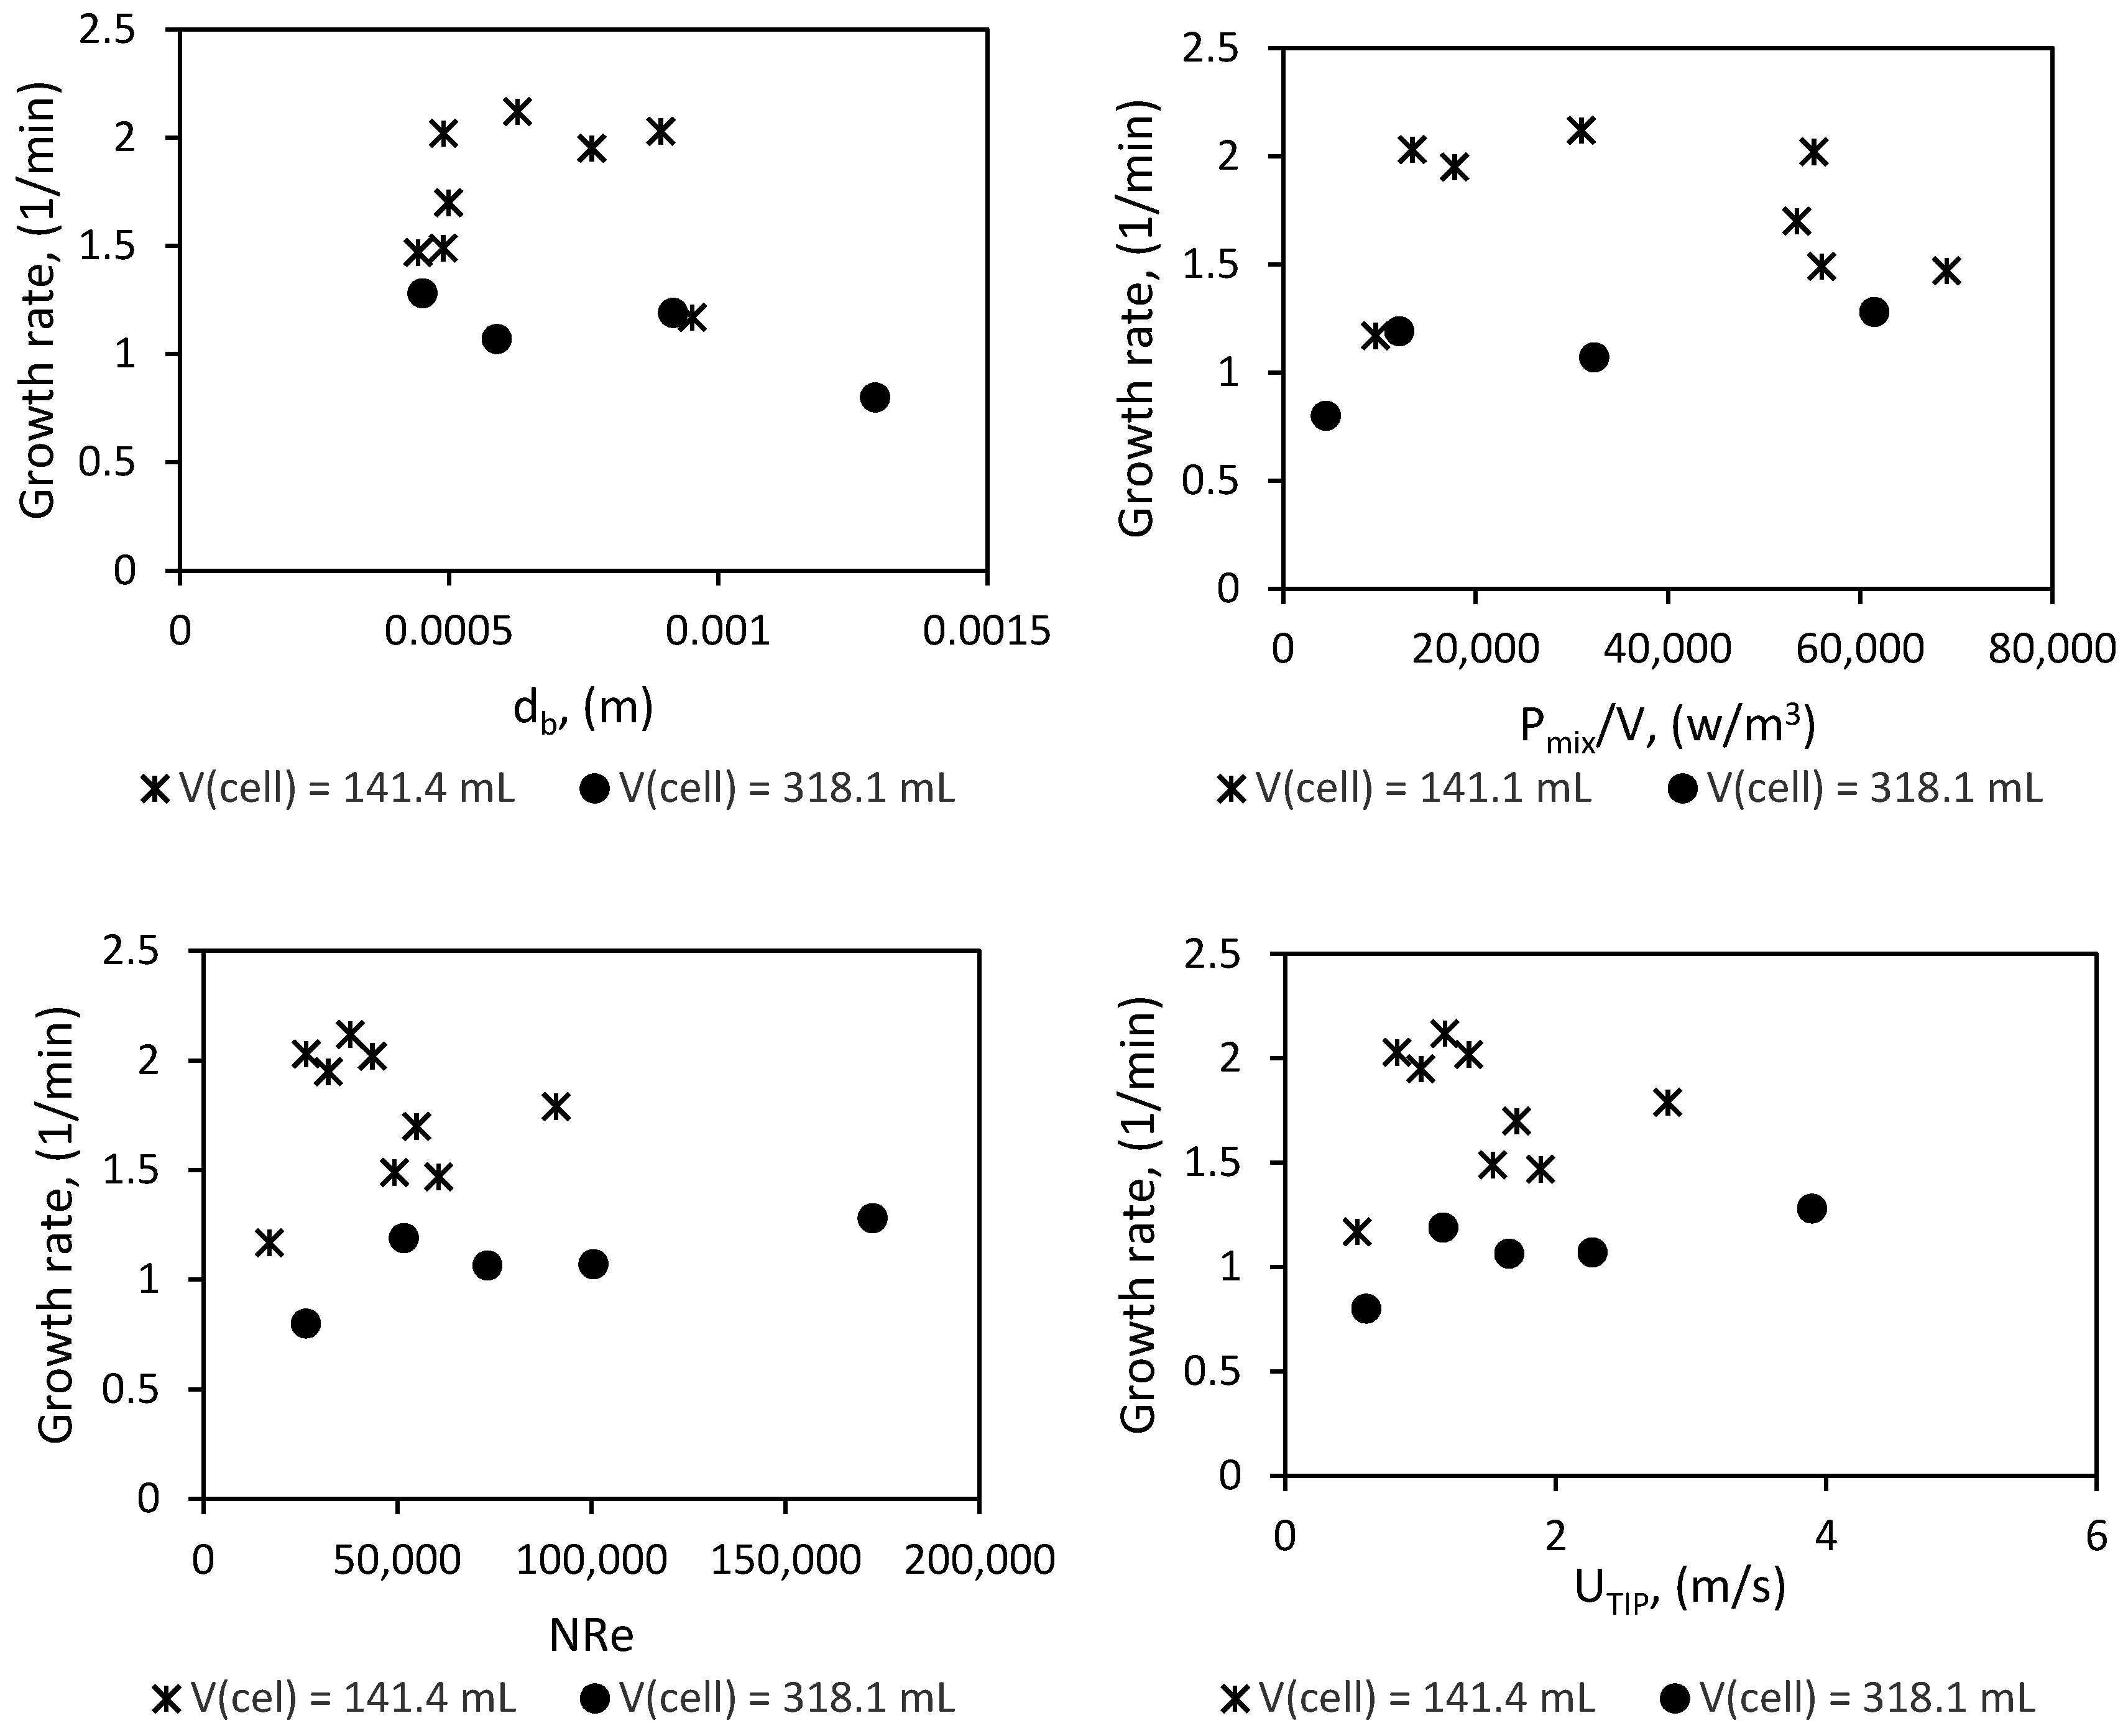

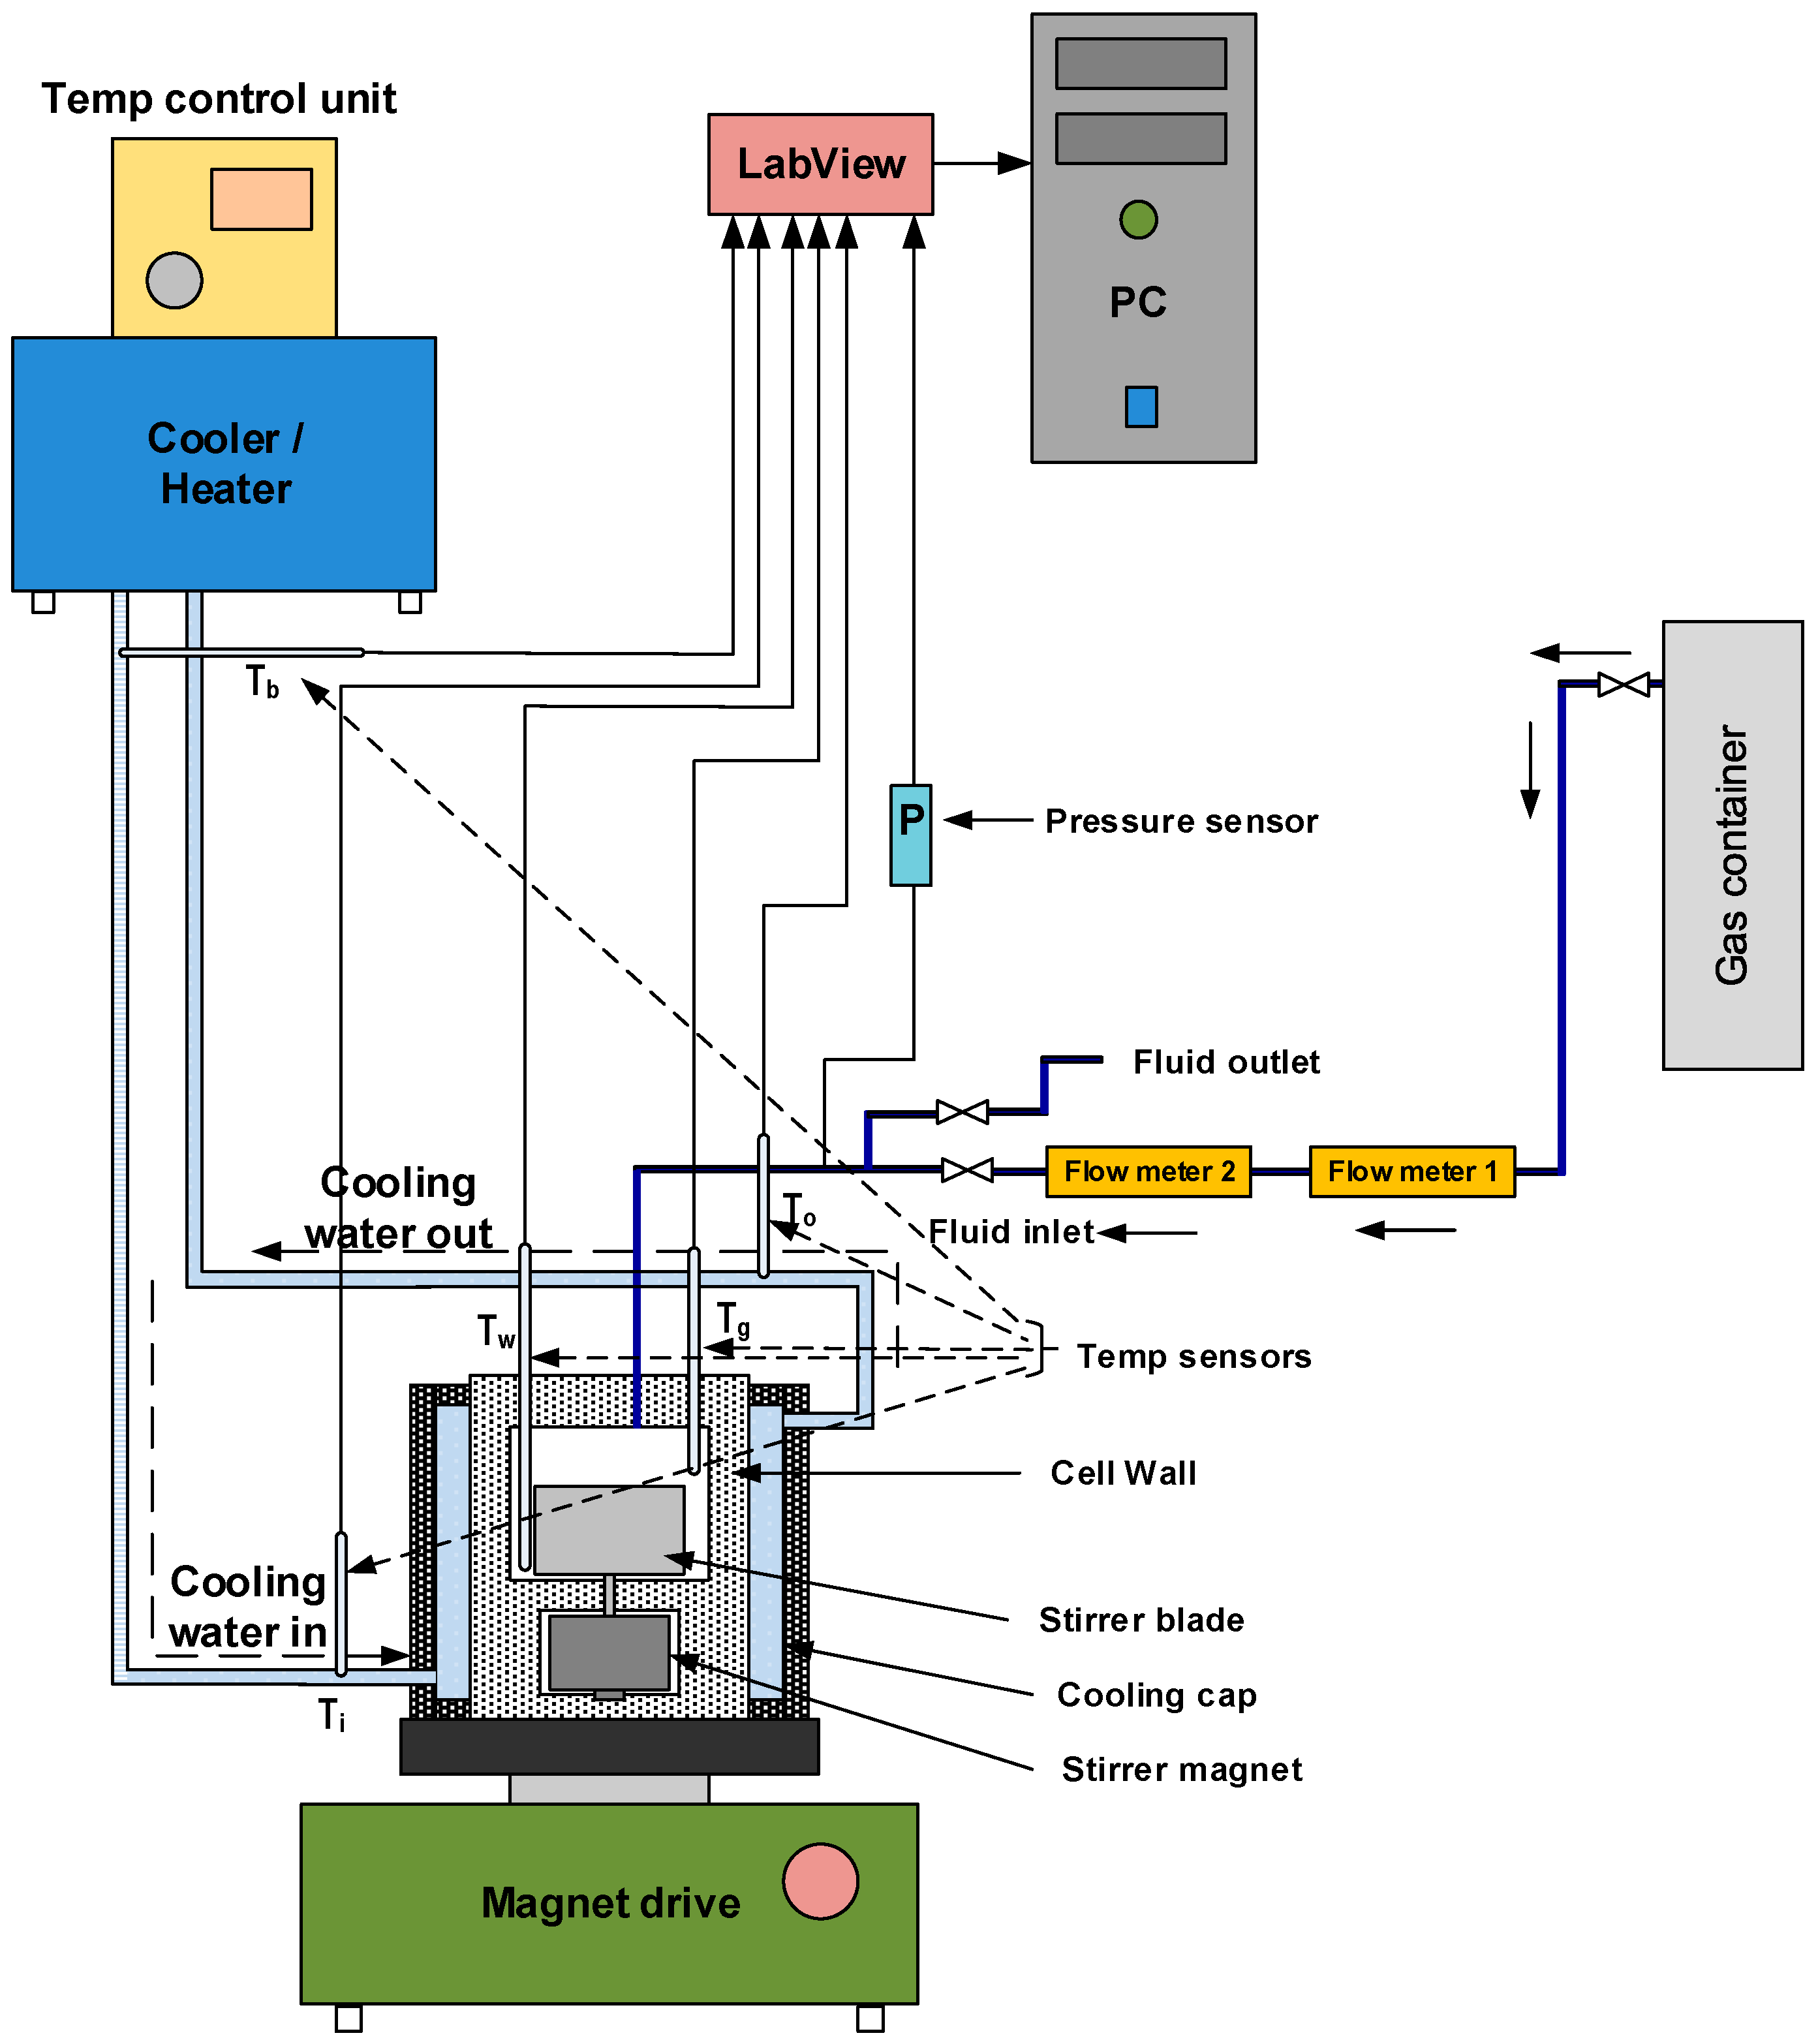
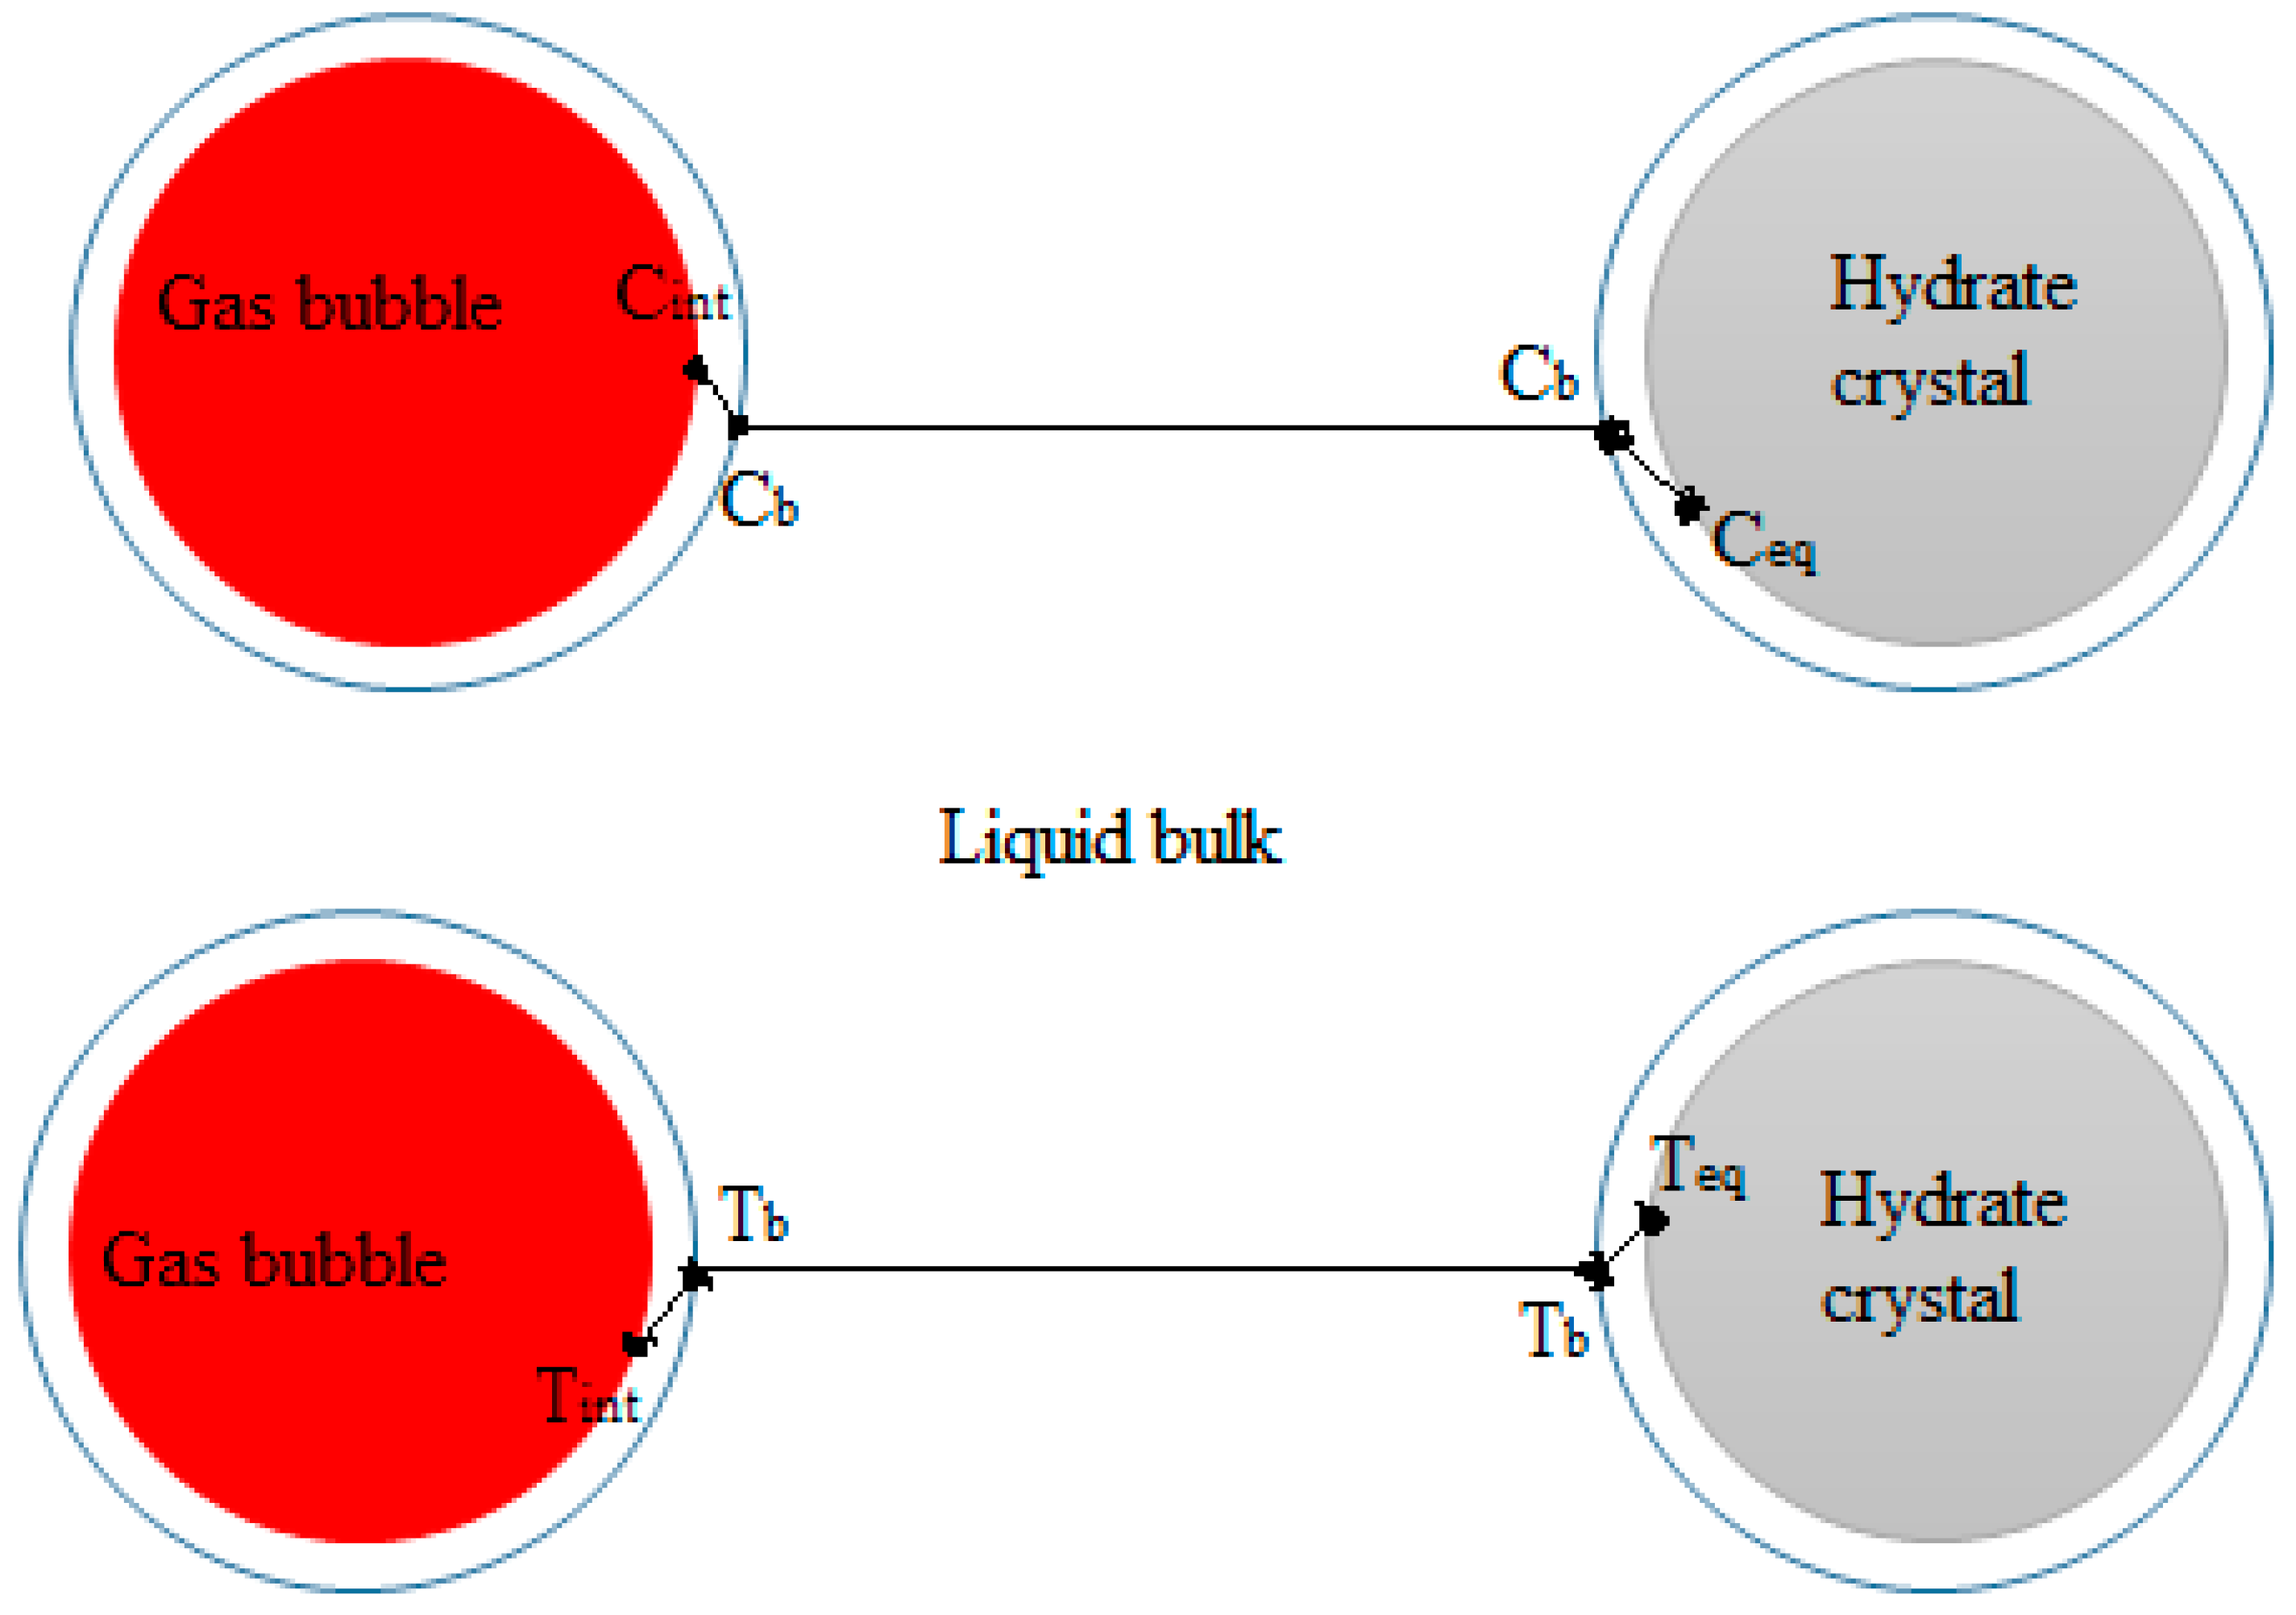
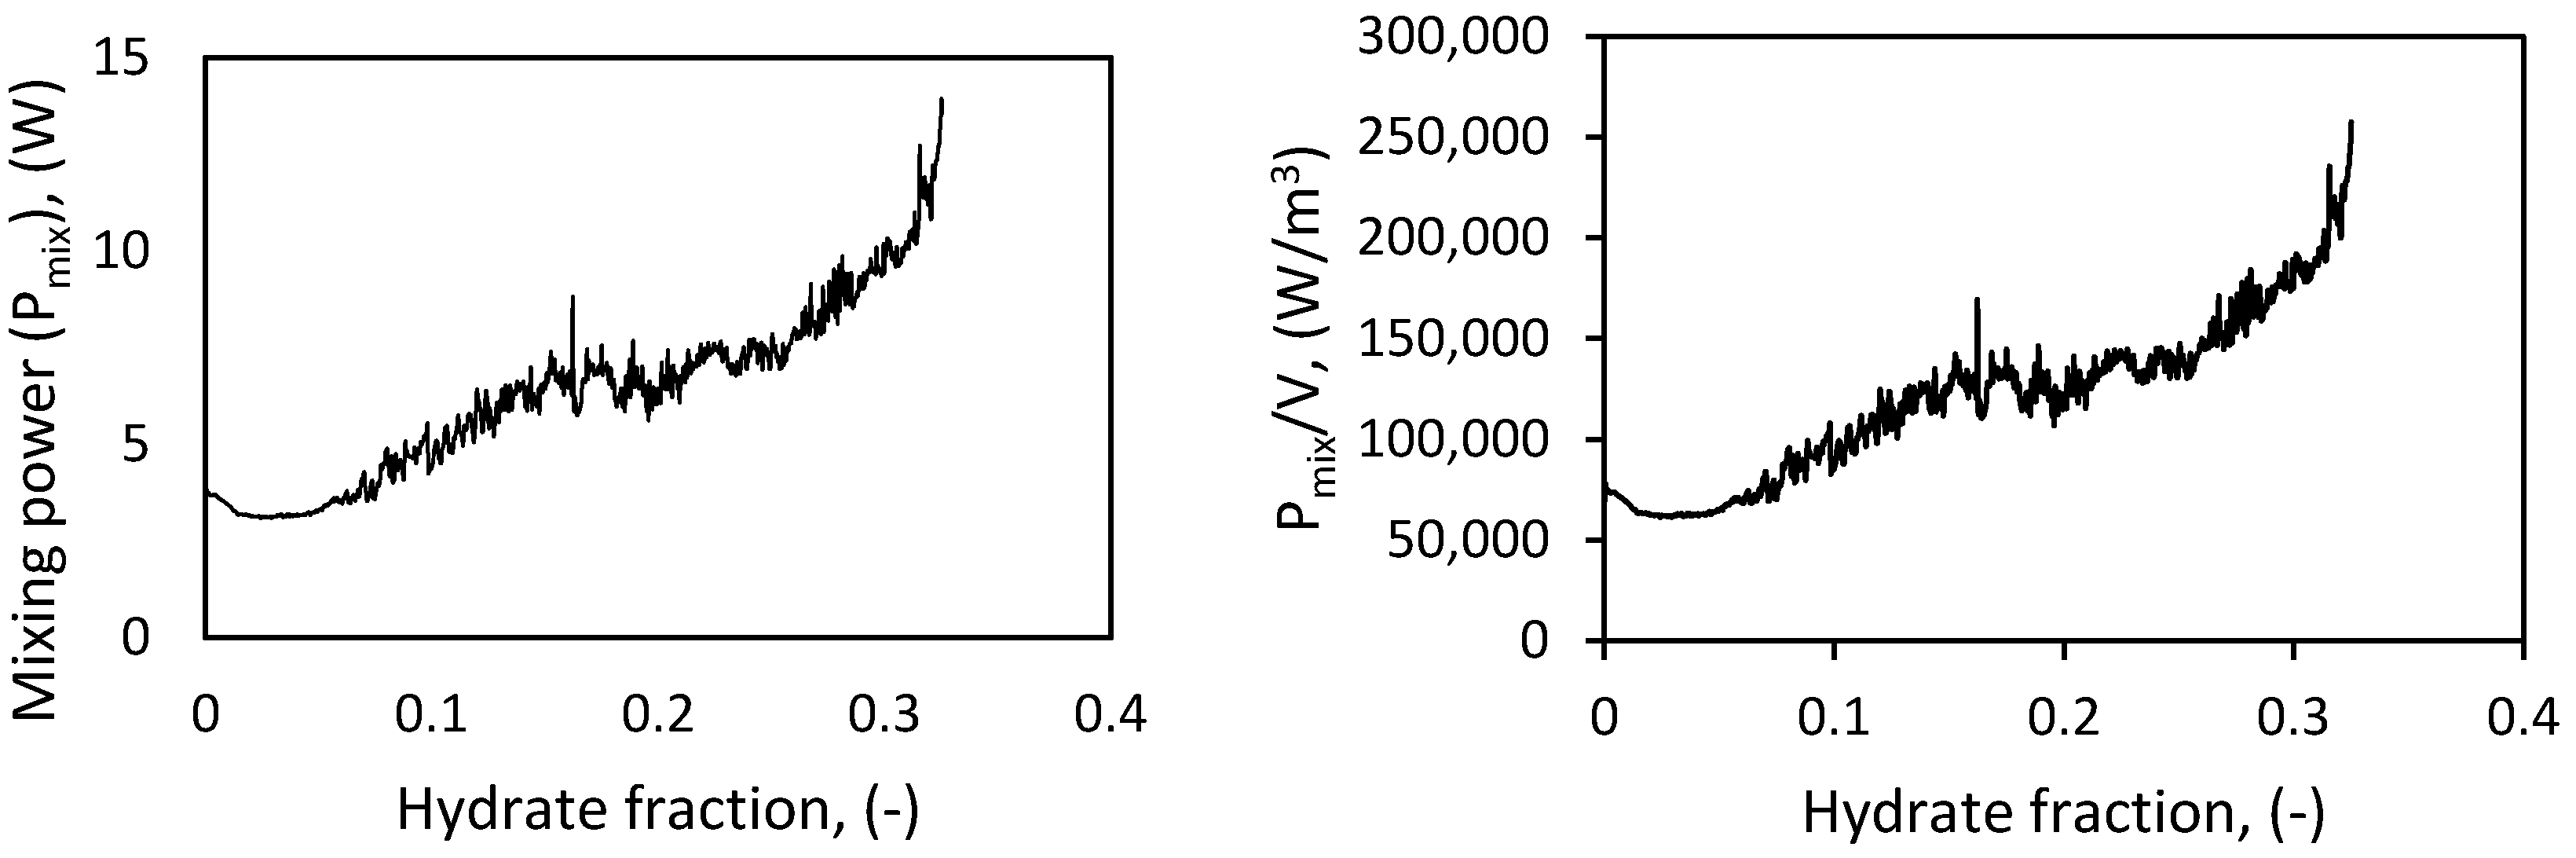
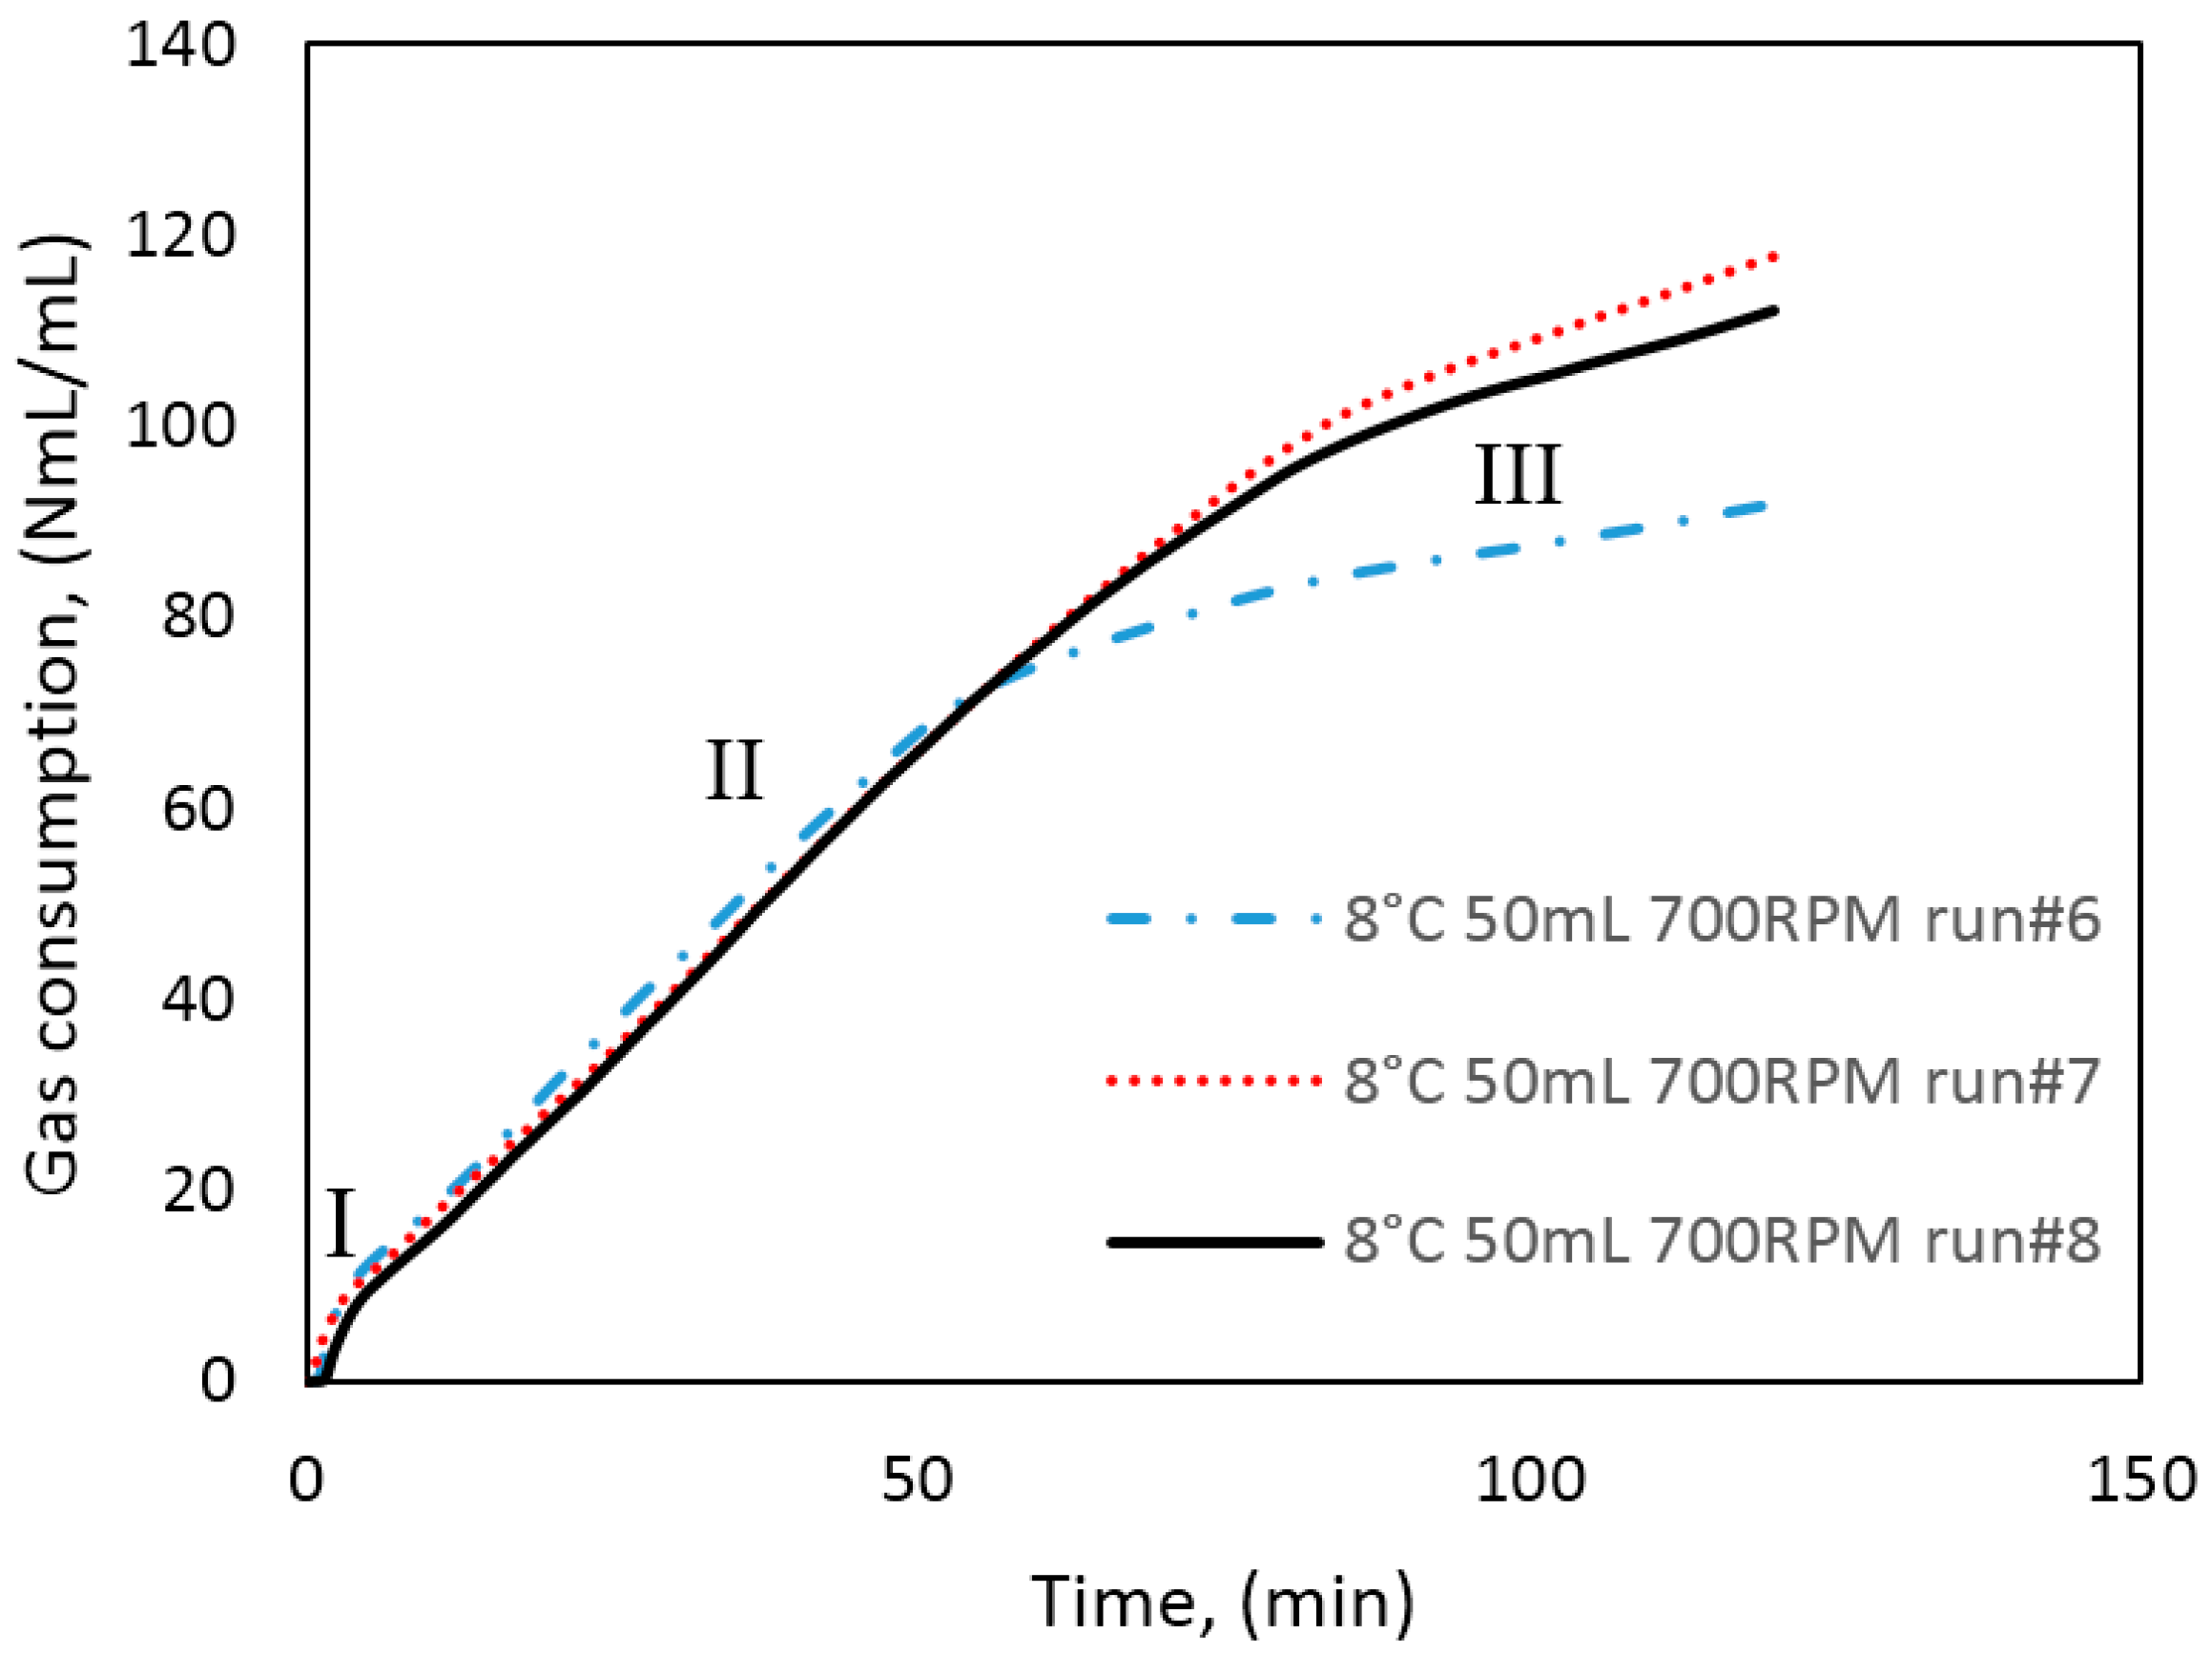
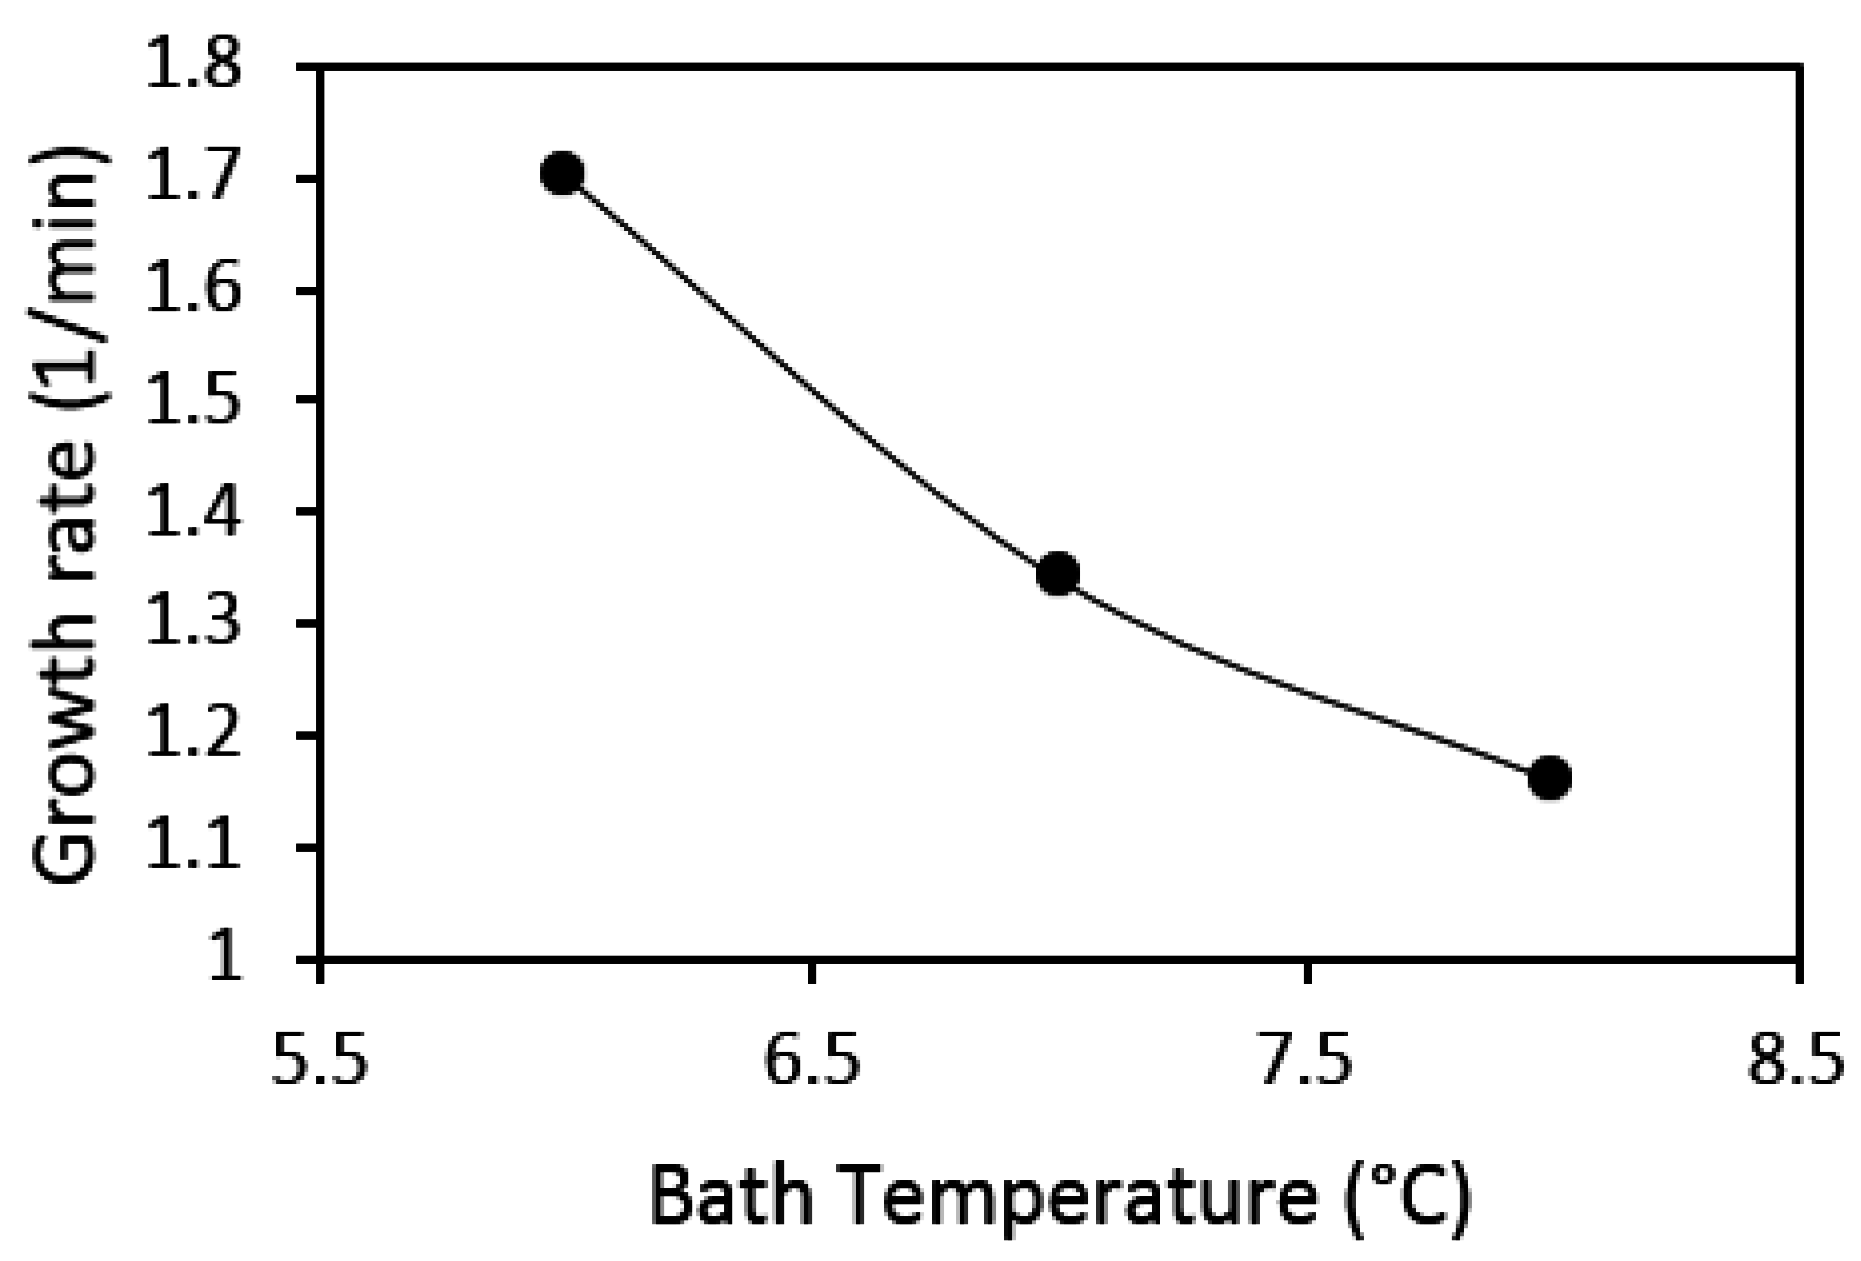
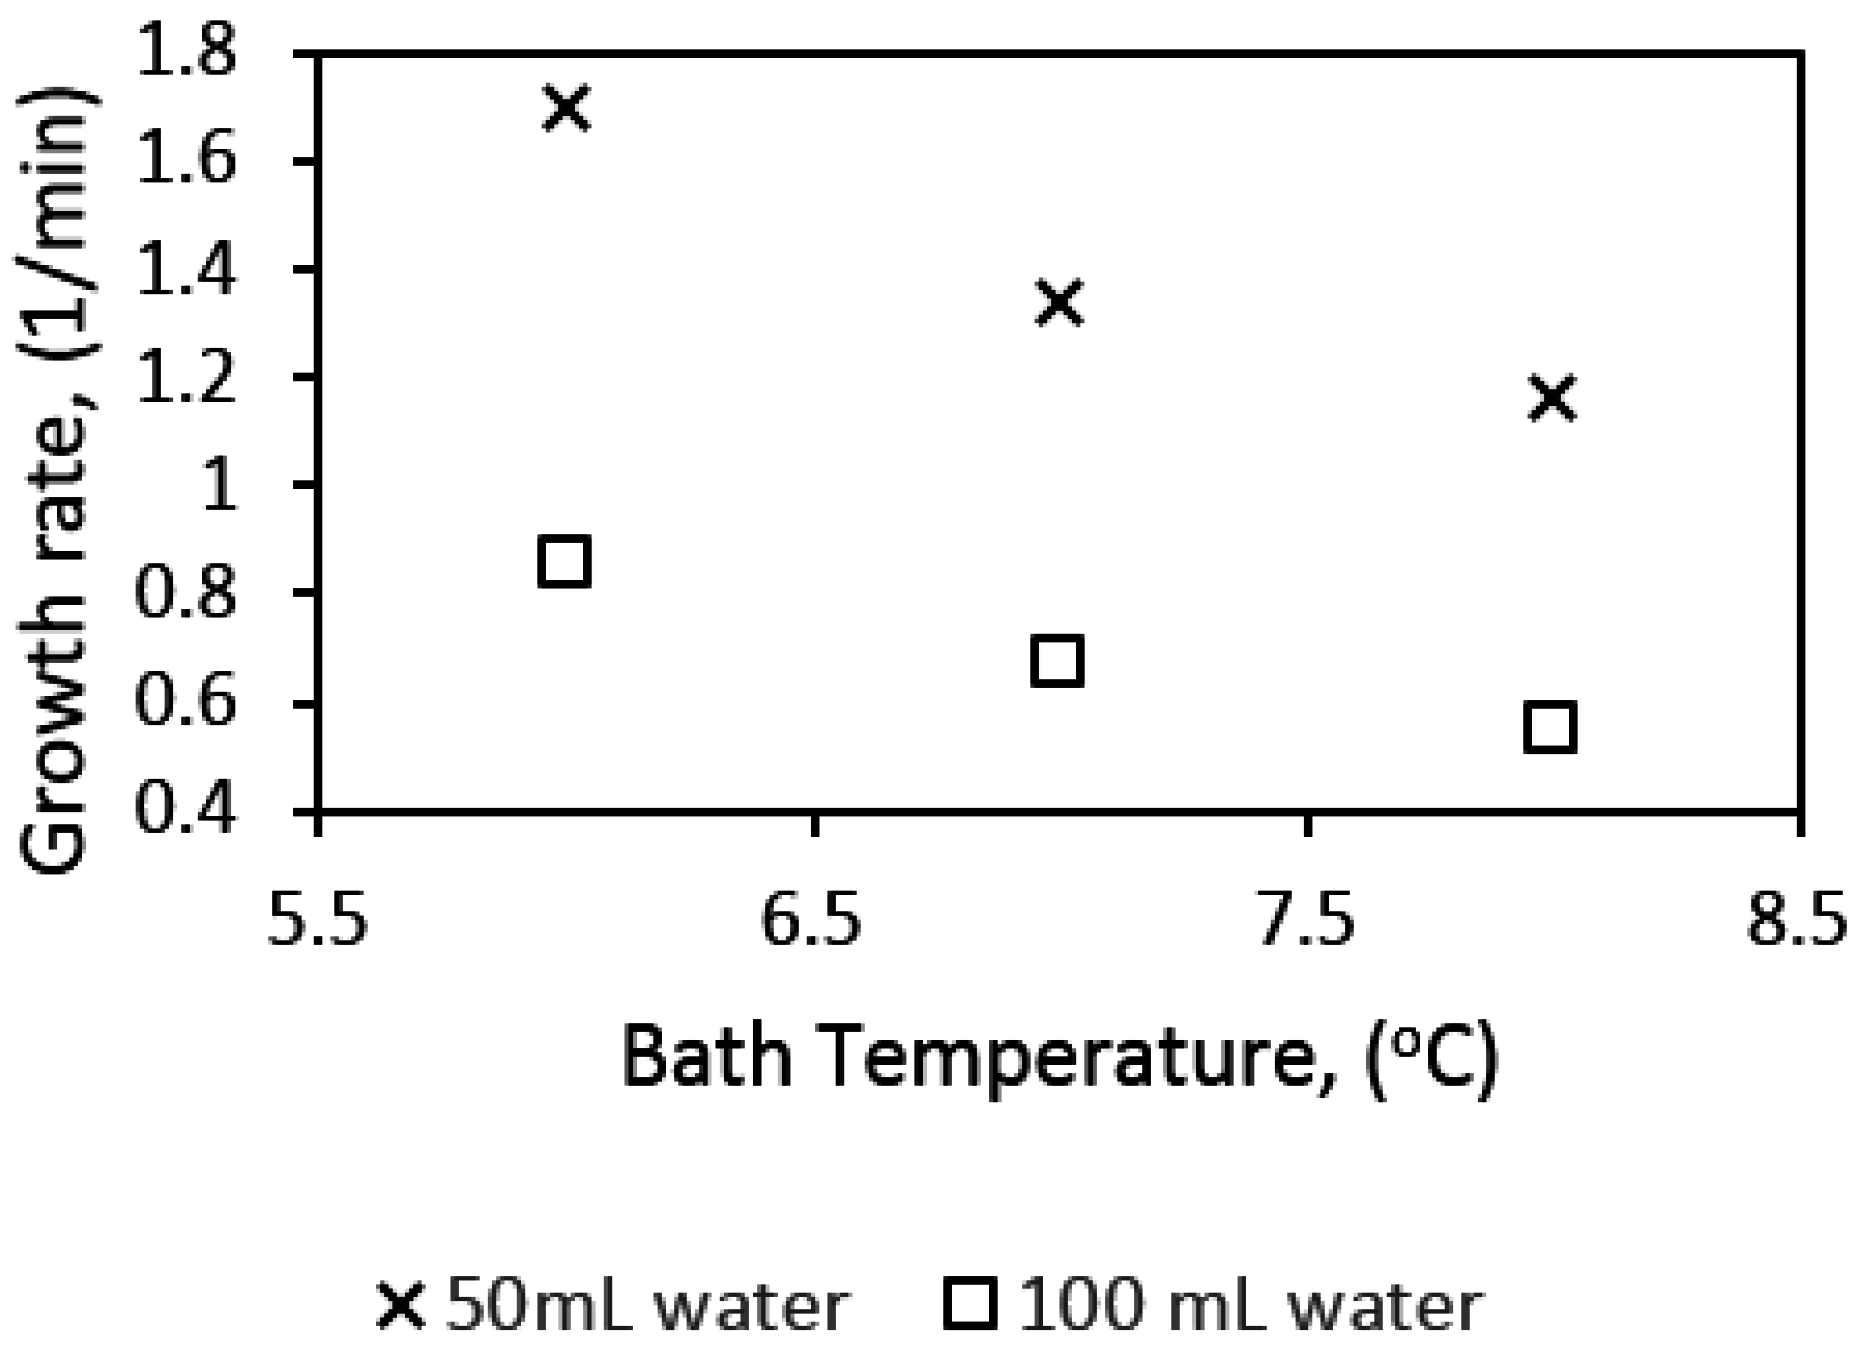
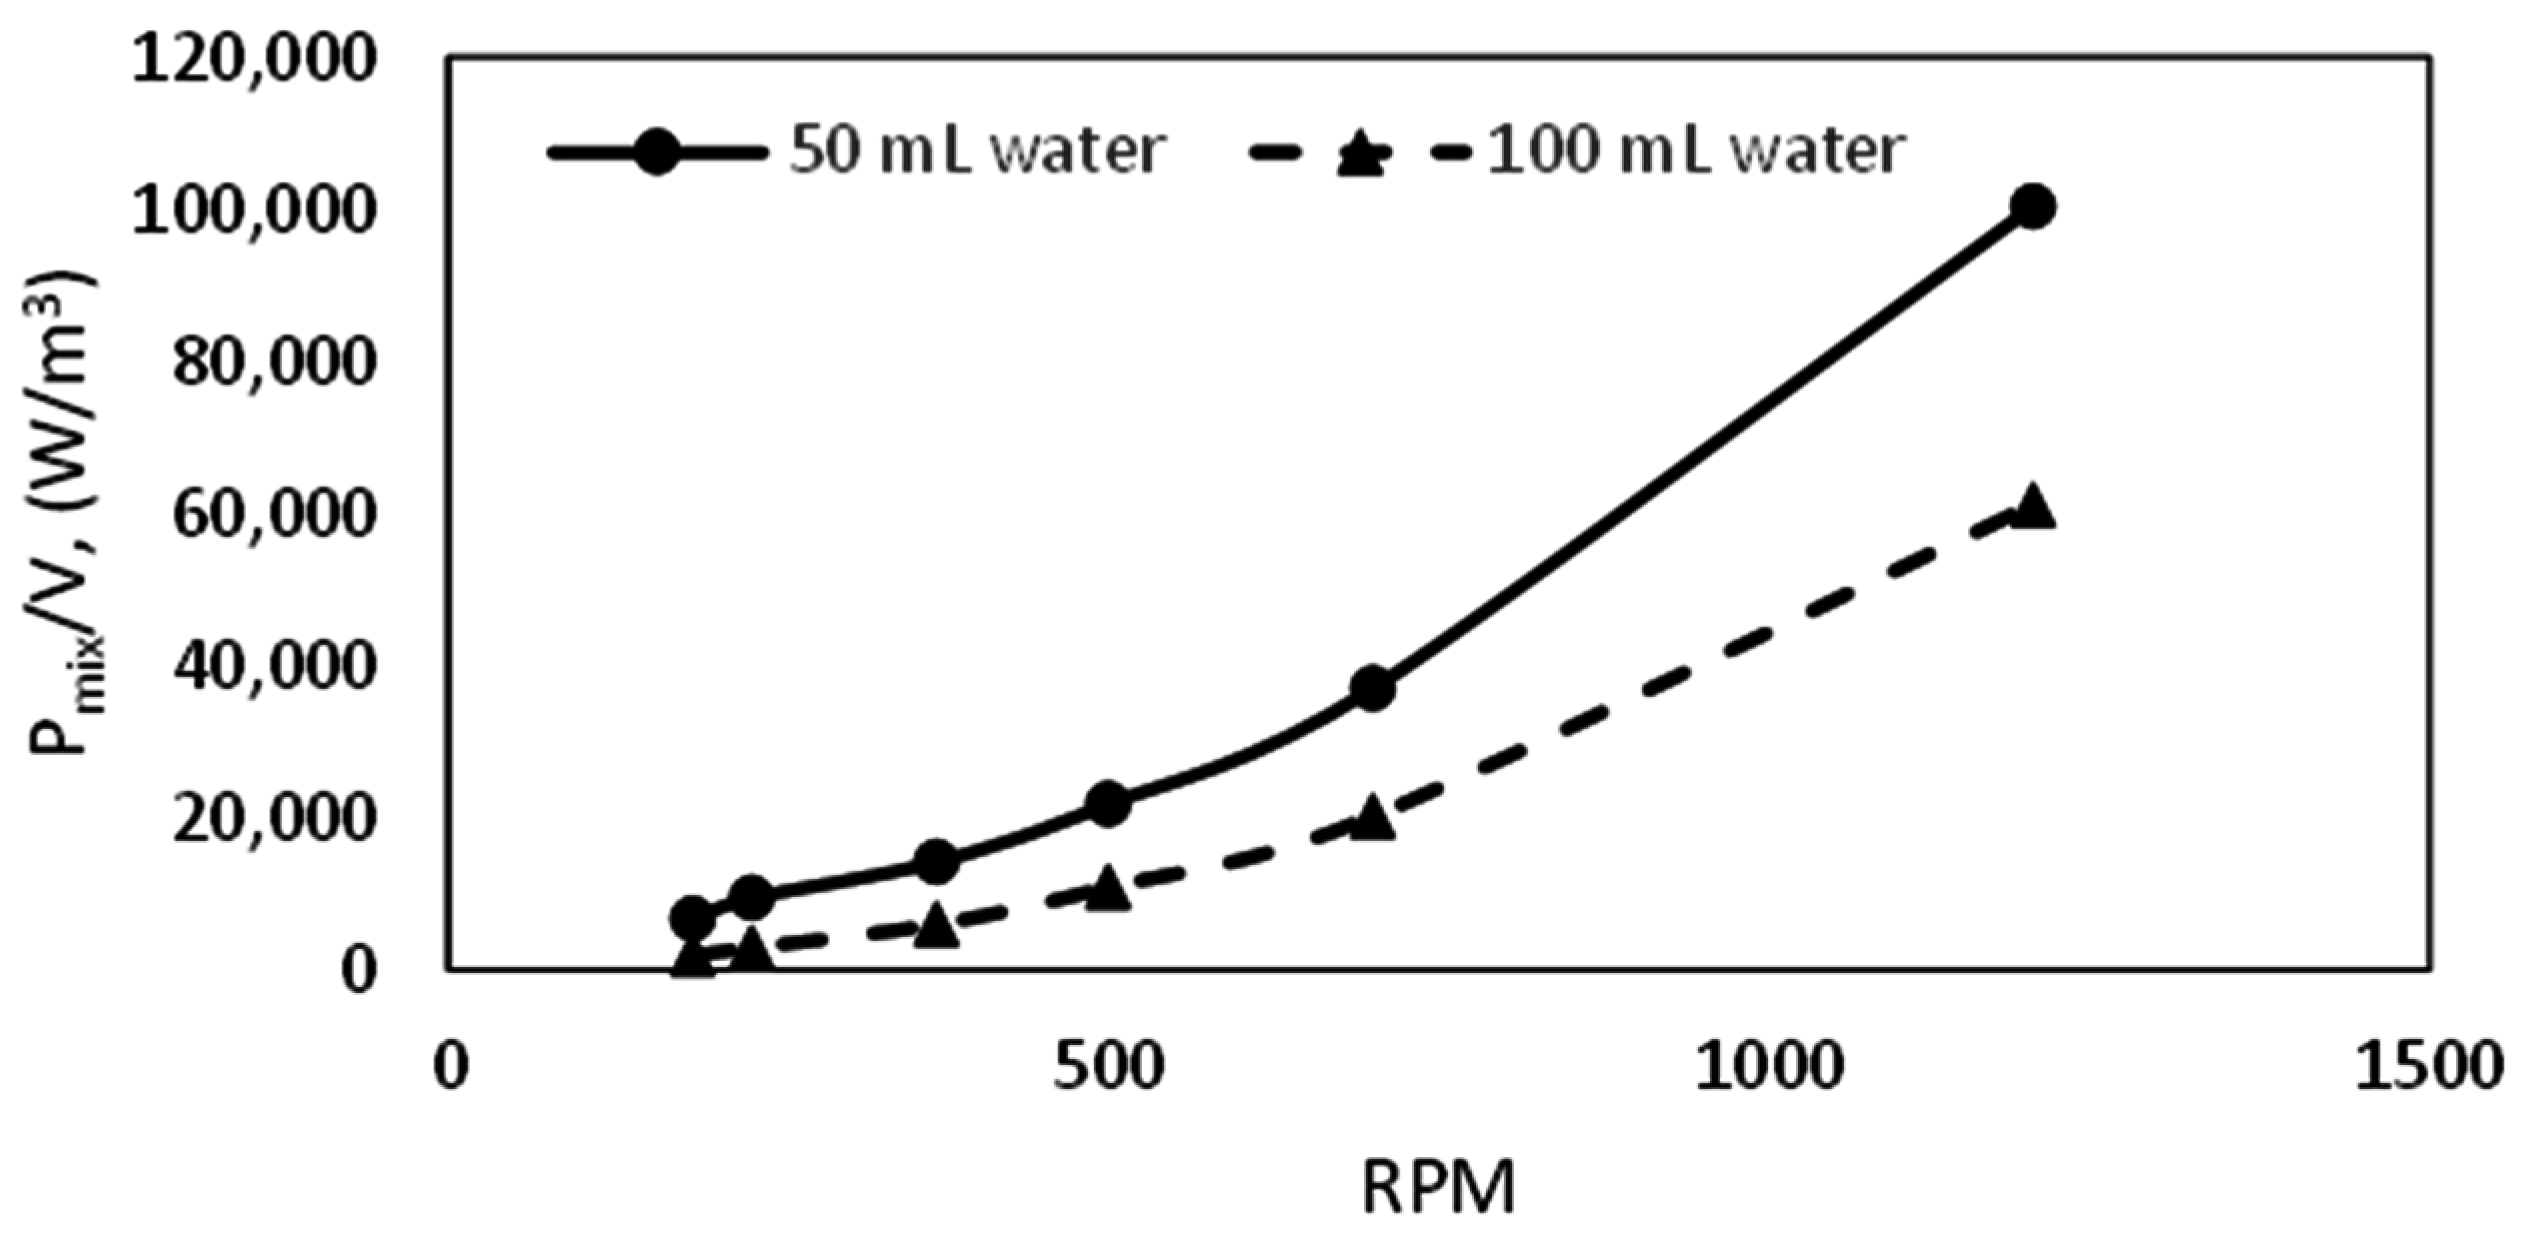
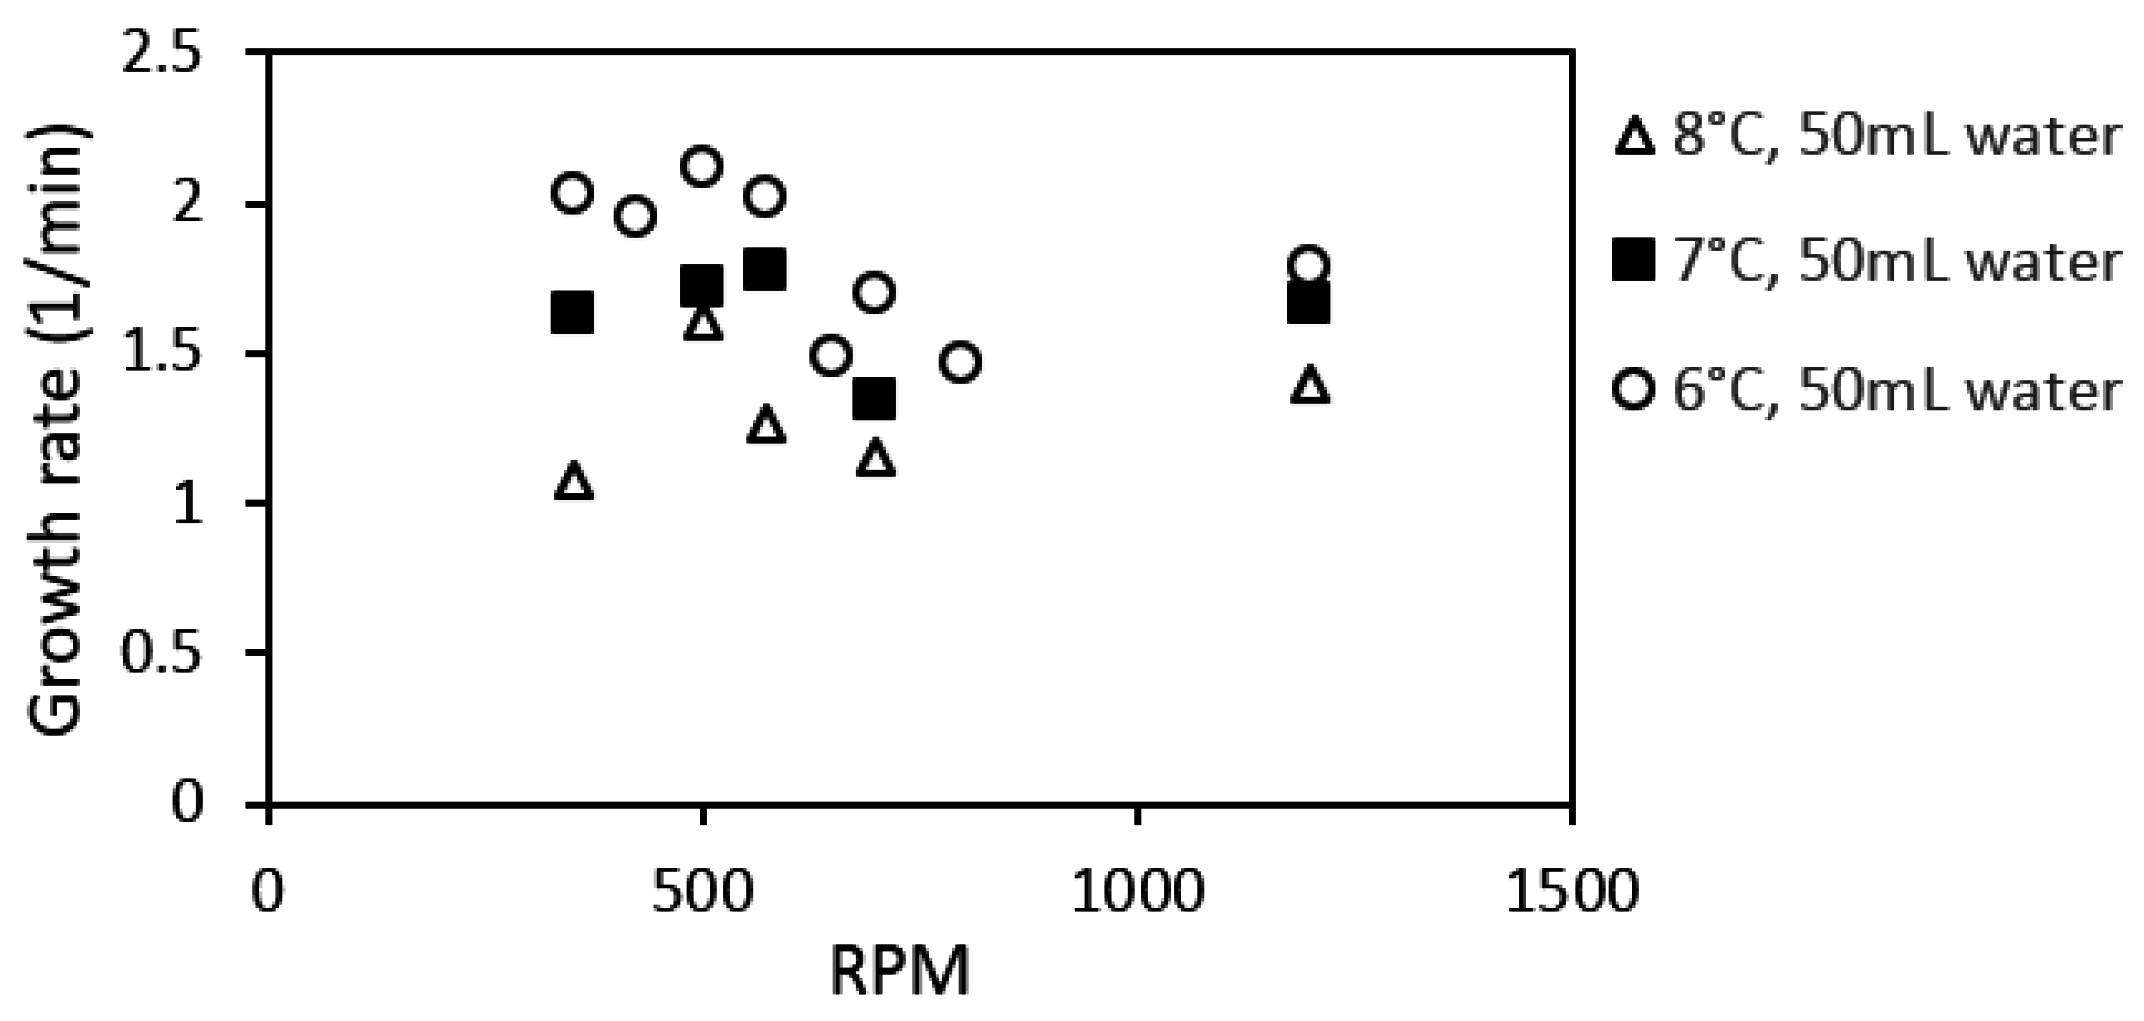
| Cell Volume, mL | 141.4 | 318.1 |
| Reaction chamber height, H, m | 0.05 | 0.05 |
| Reaction chamber diameter, DR, m | 0.06 | 0.09 |
| Impeller diameter, DI, m | 0.045 | 0.062 |
| Impeller height, HI, m | 0.045 | 0.045 |
| Volume of liquid, VL × 103, m3 | 0.05, 0.1 | 0.1125, 0.225 |
| Volume of gas, VG × 103, m3 | 0.0914, 0.0414 | 0.2056, 0.0931 |
| VG/VL | 1.828, 0.414 | 1.828, 0.414 |
| Liquid height, HL, m | 0.0177, 0.0354 | 0.0177, 0.0354 |
| Material | Titanium | Titanium |
Table 2.
Solubility of methane in water in systems with and without hydrates. The right-hand columns show the volume of excess gas at incipient hydrate formation due to reduced solubility in system with hydrate in standard mL (S·mL, Tref = 15 °C) and normal mL (N·mL, Tref = 0 °C), respectively.
| Temp (°C) | Vwater (mL) | Solubility (mol Fraction) | Gas “Released” at Hydrate Formation | ||
|---|---|---|---|---|---|
| With Hydrate (CSM Gem) | Without Hydrate Duan et al. [77] | ΔV (S·mL) | ΔV (N·mL) | ||
| 8 | 50 | 0.001662 | 0.0023099 | 35.63 | 33.78 |
| 7 | 50 | 0.001566 | 0.0023562 | 43.31 | 41.06 |
| 6 | 50 | 0.001475 | 0.0024038 | 50.74 | 48.10 |
| 8 | 100 | 0.001662 | 0.0023099 | 71.26 | 67.55 |
| 7 | 100 | 0.001566 | 0.0023562 | 86.63 | 82.12 |
| 6 | 100 | 0.001475 | 0.0024038 | 101.48 | 96.20 |
| Cell Volume | Experimental Conditions | Number of Experiments | Average Induction Time (min) |
|---|---|---|---|
| 141.4 mL | 700 rpm, 6 °C, 50 mL | 8 | 32.20 |
| 700 rpm, 6 °C, 100 mL | 3 | 57.05 | |
| 700 rpm, 7 °C, 50 mL | 3 | 8.47 | |
| 700 rpm, 7 °C, 100 mL | 3 | 197.07 | |
| 700 rpm, 8 °C, 50 mL | 8 | 137.16 | |
| 700 rpm, 8 °C, 100 mL | 9 | 183.08 | |
| 500 rpm, 6 °C, 50 mL | 4 | 80.28 | |
| 1200 rpm, 6 °C, 50 mL | 6 | 0.35 | |
| 318.1 mL | 700 rpm, 8 °C, 112.5 mL | 4 | 3.89 |
Table 4.
Average growth data at different experimental conditions with standard deviations, for stages I and II. SD: Standard Deviations.
| Parameter | No. of Expr. | Value | Growth Rate (1/min) | Duration (min) | |||||||
|---|---|---|---|---|---|---|---|---|---|---|---|
| Stage I | SD | Stage II | SD | Stage I | SD | Stage II | SD | ||||
| Small cell | Temperature (°C) (50 mL, 700 rpm) | 7 | 6 | 7.12 | 0.14 | 1.7 | 0.02 | 0.65 | 0.05 | 42 | 13.22 |
| 3 | 7 | 6.76 | 0.82 | 1.34 | 0.11 | 0.85 | 0.2 | 53.87 | 7.37 | ||
| 8 | 8 | 4.23 | 0.54 | 1.16 | 0.12 | 1.26 | 0.11 | 70.13 | 11.62 | ||
| Water content (mL) (8 °C, 700 rpm) | 8 | 50 | 4.23 | 0.54 | 1.16 | 0.12 | 1.26 | 0.11 | 70.13 | 11.62 | |
| 3 | 100 | 1.45 | 0.04 | 0.52 | 0.05 | 11.22 | 1.06 | 56.33 | 17.64 | ||
| Stirring rate (rpm) (50 mL, 6 °C) | 5 | 350 | 0.88 | 0.2 | 2.04 | 0.06 | 1.65 | 0.1 | 17.6 | 2.61 | |
| 3 | 425 | 3.64 | 0.74 | 1.95 | 0.09 | 2.5 | 0.71 | 16.33 | 2.52 | ||
| 4 | 500 | 4.11 | 0.07 | 2.12 | 0.15 | 2.28 | 0.28 | 17.88 | 3.28 | ||
| 3 | 575 | 4.82 | 0.18 | 2.02 | 0.16 | 1.83 | 0.15 | 27.17 | 4.54 | ||
| 3 | 650 | 6.06 | 1.42 | 1.49 | 0.17 | 1.07 | 0.06 | 46.67 | 11.15 | ||
| 7 | 700 | 7.12 | 0.14 | 1.7 | 0.02 | 0.65 | 0.05 | 42 | 13.22 | ||
| 6 | 1200 | 11.53 | 1.75 | 1.89 | 0.32 | 0.59 | 0.13 | 33.58 | 11.5 | ||
| Large Cell | Stirring rate (rpm) (112.5 mL, 6 °C) | 3 | 185 | 0.56 | 0.12 | 0.8 | 0.12 | 34.67 | 5.03 | 17 | 4.24 |
| 3 | 370 | 2.34 | 0.25 | 1.19 | 0.04 | 5 | 1 | 15.33 | 4.93 | ||
| 2 | 510 | 4.55 | 0.02 | 1.07 | 0.04 | 1.15 | 0.21 | 60.5 | 2.12 | ||
| 3 | 700 | 5.29 | 0.53 | 1.07 | 0.15 | 1.07 | 0.12 | 59 | 28.51 | ||
| 3 | 1200 | 6.67 | 0.15 | 1.28 | 0.08 | 1.02 | 0.26 | 52 | 8.54 | ||
Table 5.
Summary of results including total gas consumption and percentage water converted to hydrate at the end of growth stage II, and induction time measurements for each experiment (141.4 mL cell).
| System | Exp. No. | Ind. Time (min) | Growth Rate (1/min) | Gas Consumed (NmL/mL) | % Water Converted | Duration | ||||
|---|---|---|---|---|---|---|---|---|---|---|
| Stage I | Stage II | Stage I | Stage II | Stage I | Stage II | Stage I | Stage II | |||
| 50 mL, 700 rpm, 6 °C | 1 | 0.46 | 6.83 | 1.71 | 7.34 | 91.52 | 3.26 | 40.63 | 1.07 | 49.00 |
| 50 mL, 700 rpm, 6 °C | 2 | 133.95 | 5.92 | 1.80 | 5.03 | 69.44 | 2.23 | 30.83 | 0.85 | 35.50 |
| 50 mL, 700 rpm, 6 °C | 3 | 30.70 | 6.27 | 1.93 | 5.55 | 59.65 | 2.46 | 26.48 | 0.89 | 29.00 |
| 50 mL, 700 rpm, 6 °C | 4 | 44.10 | 5.85 | 1.69 | 7.00 | 76.44 | 3.11 | 33.94 | 1.20 | 41.00 |
| 50 mL, 700 rpm, 6 °C | 5 | 1.07 | 5.40 | 1.74 | 3.98 | 58.30 | 1.77 | 25.88 | 0.70 | 31.00 |
| 50 mL, 700 rpm, 6 °C | 6 | 1.15 | 7.00 | 1.70 | 4.88 | 82.50 | 2.17 | 36.63 | 0.65 | 47.00 |
| 50 mL, 700 rpm, 6 °C | 7 | 13.95 | 7.09 | 1.68 | 5.11 | 50.47 | 2.27 | 22.41 | 0.70 | 27.00 |
| 50 mL, 700 rpm, 7 °C | 8 | 0.20 | 7.13 | 1.43 | 7.13 | 75.36 | 3.17 | 33.46 | 1.00 | 48.00 |
| 50 mL, 700 rpm, 7 °C | 9 | 25.05 | 6.18 | 1.37 | 4.18 | 74.65 | 1.86 | 33.14 | 0.67 | 51.00 |
| 50 mL, 700 rpm, 7 °C | 10 | 0.16 | 6.40 | 1.22 | 5.28 | 80.57 | 2.34 | 35.77 | 0.85 | 62.00 |
| 50 mL, 700 rpm, 8 °C | 11 | 22.50 | 4.20 | 1.06 | 4.82 | 85.58 | 2.14 | 38.00 | 1.15 | 80.00 |
| 50 mL, 700 rpm, 8 °C | 12 | 0.30 | 4.63 | 1.21 | 6.01 | 82.35 | 2.67 | 36.56 | 1.30 | 66.00 |
| 50 mL, 700 rpm, 8 °C | 13 | 34.35 | 4.21 | 1.28 | 4.98 | 73.67 | 2.21 | 32.71 | 1.20 | 56.00 |
| 50 mL, 700 rpm, 8 °C | 14 | 302.20 | 3.53 | 1.02 | 4.64 | 69.12 | 2.06 | 30.69 | 1.20 | 62.00 |
| 50 mL, 700 rpm, 8 °C | 15 | 225.25 | 3.59 | 0.96 | 3.96 | 79.51 | 1.76 | 35.30 | 1.10 | 79.00 |
| 50 mL, 700 rpm, 8 °C | 16 | 0.90 | 5.16 | 1.25 | 6.89 | 72.40 | 3.06 | 32.14 | 1.33 | 55.00 |
| 50 mL, 700 rpm, 8 °C | 17 | 510.55 | 4.50 | 1.23 | 4.53 | 97.94 | 2.01 | 43.48 | 1.00 | 80.00 |
| 50 mL, 700 rpm, 8 °C | 18 | 1.25 | 3.99 | 1.24 | 4.00 | 95.80 | 1.78 | 42.53 | 1.00 | 80.00 |
| 100 mL, 700 rpm, 8 °C | 19 | 39.95 | 1.48 | 0.56 | 20.38 | 35.80 | 9.05 | 15.89 | 14.00 | 40.00 |
| 100 mL, 700 rpm, 8 °C | 20 | 350.35 | 1.43 | 0.58 | 20.58 | 69.50 | 9.14 | 30.86 | 15.00 | 100.00 |
| 100 mL, 700 rpm, 8 °C | 21 | 412.70 | 1.45 | 0.52 | 19.11 | 55.71 | 8.48 | 24.73 | 14.00 | 78.00 |
| 100 mL, 700 rpm, 8 °C | 22 | 158.40 | 1.44 | 0.55 | 14.09 | 36.37 | 6.26 | 16.15 | 10.00 | 48.00 |
| 100 mL, 700 rpm, 8 °C | 23 | 218.15 | 1.50 | 0.55 | 14.68 | 37.55 | 6.52 | 16.67 | 10.00 | 48.00 |
| 100 mL, 700 rpm, 8 °C | 24 | 115.95 | 1.37 | 0.52 | 14.80 | 36.61 | 6.57 | 16.25 | 11.05 | 50.50 |
| 100 mL, 700 rpm, 8 °C | 25 | 56.71 | 1.48 | 0.45 | 17.45 | 36.51 | 7.75 | 16.21 | 12.00 | 50.00 |
| 100 mL, 700 rpm, 8 °C | 26 | 234.85 | 1.43 | 0.45 | 15.59 | 33.48 | 6.92 | 14.86 | 11.60 | 48.00 |
| 100 mL, 700 rpm, 8 °C | 27 | 60.67 | 1.48 | 0.47 | 16.88 | 33.72 | 7.49 | 14.97 | 12.00 | 45.00 |
| 50 mL, 350 rpm, 6 °C | 28 | 7.30 | 1.23 | 2.02 | 4.36 | 44.87 | 1.94 | 19.92 | 3.20 | 18.00 |
| 50 mL, 350 rpm, 6 °C | 29 | 2.13 | 0.82 | 2.00 | 0.48 | 47.39 | 0.21 | 21.04 | 0.55 | 22.00 |
| 50 mL, 350 rpm, 6 °C | 30 | 368.90 | 0.78 | 2.06 | 0.68 | 38.48 | 0.30 | 17.08 | 0.85 | 16.00 |
| 50 mL, 350 rpm, 6 °C | 31 | 0.25 | 0.78 | 2.03 | 0.60 | 41.05 | 0.27 | 18.23 | 0.75 | 16.00 |
| 50 mL, 350 rpm, 6 °C | 32 | 14.85 | 0.78 | 1.99 | 2.03 | 39.17 | 0.90 | 17.39 | 2.40 | 18.20 |
| 50 mL, 425 rpm, 6 °C | 33 | 251.52 | 3.30 | 1.91 | 4.05 | 40.47 | 1.80 | 17.97 | 1.22 | 17.50 |
| 50 mL, 425 rpm, 6 °C | 34 | 206.53 | 3.98 | 1.86 | 8.08 | 40.30 | 3.59 | 17.89 | 2.05 | 16.00 |
| 50 mL, 425 rpm, 6 °C | 35 | 283.09 | 3.11 | 2.03 | 9.77 | 39.60 | 4.34 | 17.58 | 3.10 | 13.50 |
| 50 mL, 500 rpm, 6 °C | 36 | 320.15 | 4.15 | 2.12 | 8.26 | 42.62 | 3.67 | 18.92 | 2.10 | 15.00 |
| 50 mL, 500 rpm, 6 °C | 37 | 0.16 | 4.08 | 2.07 | 9.08 | 50.58 | 4.03 | 22.46 | 2.40 | 19.00 |
| 50 mL, 500 rpm, 6 °C | 38 | 0.22 | 4.02 | 1.97 | 7.96 | 46.98 | 3.53 | 20.86 | 2.00 | 19.50 |
| 50 mL, 500 rpm, 6 °C | 39 | 0.60 | 4.17 | 2.32 | 10.23 | 59.22 | 4.54 | 26.29 | 2.60 | 20.00 |
| 50 mL, 575 rpm, 6 °C | 40 | 0.24 | 4.74 | 2.20 | 8.12 | 61.83 | 3.61 | 27.45 | 1.75 | 23.00 |
| 50 mL, 575 rpm, 6 °C | 41 | 6.35 | 5.03 | 1.88 | 9.32 | 73.00 | 4.14 | 32.41 | 1.92 | 36.05 |
| 50 mL, 575 rpm, 6 °C | 42 | 57.71 | 4.70 | 1.98 | 7.59 | 59.76 | 3.37 | 26.53 | 1.70 | 26.50 |
| 50 mL, 650 rpm, 6 °C | 43 | 17.78 | 5.15 | 1.68 | 6.52 | 67.27 | 2.89 | 29.87 | 1.27 | 34.00 |
| 50 mL, 650 rpm, 6 °C | 44 | 42.27 | 5.33 | 1.43 | 5.21 | 79.20 | 2.31 | 35.16 | 1.00 | 51.00 |
| 50 mL, 650 rpm, 6 °C | 45 | 0.22 | 7.70 | 1.36 | 8.03 | 85.89 | 3.57 | 38.13 | 1.10 | 55.00 |
| 50 mL, 1200 rpm, 6 °C | 46 | 0.55 | 9.43 | 1.66 | 5.61 | 64.01 | 2.49 | 28.42 | 0.50 | 36.00 |
| 50 mL, 1200 rpm, 6 °C | 47 | 0.20 | 9.67 | 1.74 | 5.00 | 71.00 | 2.22 | 31.52 | 0.50 | 48.00 |
| 50 mL, 1200 rpm, 6 °C | 48 | 0.35 | 12.55 | 2.18 | 8.59 | 72.20 | 3.81 | 32.05 | 0.70 | 26.00 |
| 50 mL, 1200 rpm, 6 °C | 49 | 0.30 | 13.88 | 2.06 | 11.08 | 75.74 | 4.92 | 33.63 | 0.80 | 30.50 |
| 50 mL, 1200 rpm, 6 °C | 50 | 0.25 | 11.27 | 2.13 | 5.04 | 56.24 | 2.24 | 24.97 | 0.55 | 20.50 |
| 50 mL, 1200 rpm, 6 °C | 51 | 0.45 | 12.38 | 1.96 | 5.92 | 86.45 | 2.63 | 38.38 | 0.50 | 47.50 |
Table 6.
Summary of results including total gas consumption and percentage water converted to hydrate at the end of growth stage II, and induction time measurements for each experiment (318.1 mL cell).
| System | Exp. No. | Ind. Time (min) | Growth Rate (1/min) | Gas Consumed (NmL/mL) | % Water Converted | Duration (min) | ||||
|---|---|---|---|---|---|---|---|---|---|---|
| Stage I | Stage II | Stage I | Stage II | Stage I | Stage II | Stage I | Stage II | |||
| 112.5 mL, 185 rpm, 6 °C | 52 | 0.28 | 0.56 | 0.86 | 8.44 | 18.85 | 3.75 | 8.37 | 14.53 | 27.07 |
| 112.5 mL, 185 rpm, 6 °C | 53 | 0.35 | 0.43 | 0.73 | 17.47 | 33.03 | 7.76 | 14.67 | 39.66 | 62.60 |
| 112.5 mL, 185 rpm, 6 °C | 54 | 3.25 | 0.54 | 0.88 | 18.93 | 33.17 | 8.41 | 14.73 | 34.00 | 51.00 |
| 112.5 mL, 370 rpm, 6 °C | 55 | 0.21 | 2.43 | 1.17 | 9.47 | 25.89 | 4.20 | 11.50 | 5.00 | 18.00 |
| 112.5 mL, 370 rpm, 6 °C | 56 | 0.16 | 2.06 | 1.17 | 13.43 | 29.43 | 5.96 | 13.07 | 6.00 | 21.00 |
| 112.5 mL, 370 rpm, 6 °C | 57 | 0.56 | 2.54 | 1.23 | 10.50 | 37.90 | 4.66 | 16.83 | 4.00 | 26.00 |
| 112.5 mL, 510 rpm, 6 °C | 58 | 42.75 | 4.56 | 1.09 | 4.47 | 69.91 | 1.98 | 31.04 | 1.00 | 62.00 |
| 112.5 mL, 510 rpm, 6 °C | 59 | 7.20 | 4.53 | 1.04 | 5.68 | 67.12 | 2.52 | 29.80 | 1.30 | 60.70 |
| 112.5 mL, 700 rpm, 6 °C | 60 | 37.05 | 5.00 | 1.06 | 5.35 | 66.77 | 2.38 | 29.65 | 1.07 | 64.00 |
| 112.5 mL, 700 rpm, 6 °C | 61 | 1.46 | 5.08 | 1.07 | 5.62 | 99.56 | 2.50 | 44.21 | 1.10 | 100.00 |
| 112.5 mL, 700 rpm, 6 °C | 62 | 0.16 | 5.90 | 1.12 | 6.93 | 49.84 | 3.08 | 22.13 | 1.34 | 38.85 |
| 112.5 mL, 1200 rpm, 6 °C | 63 | 0.35 | 6.70 | 1.31 | 6.90 | 85.30 | 3.06 | 37.87 | 1.00 | 64.50 |
| 112.5 mL, 1200 rpm, 6 °C | 64 | 107.00 | 6.50 | 1.35 | 6.18 | 66.25 | 2.74 | 29.42 | 0.95 | 46.50 |
| 112.5 mL, 1200 rpm, 6 °C | 65 | 0.37 | 6.80 | 1.19 | 9.05 | 78.79 | 4.02 | 34.98 | 1.40 | 65.86 |
© 2016 by the authors; licensee MDPI, Basel, Switzerland. This article is an open access article distributed under the terms and conditions of the Creative Commons Attribution (CC-BY) license (http://creativecommons.org/licenses/by/4.0/).
Share and Cite
MDPI and ACS Style
Meindinyo, R.-E.T.; Svartaas, T.M. Gas Hydrate Growth Kinetics: A Parametric Study. Energies 2016, 9, 1021. https://doi.org/10.3390/en9121021
AMA Style
Meindinyo R-ET, Svartaas TM. Gas Hydrate Growth Kinetics: A Parametric Study. Energies. 2016; 9(12):1021. https://doi.org/10.3390/en9121021
Chicago/Turabian StyleMeindinyo, Remi-Erempagamo Tariyemienyo, and Thor Martin Svartaas. 2016. "Gas Hydrate Growth Kinetics: A Parametric Study" Energies 9, no. 12: 1021. https://doi.org/10.3390/en9121021
Note that from the first issue of 2016, this journal uses article numbers instead of page numbers. See further details here.