Article

Development of Seismic Demand for Chang-Bin Offshore Wind Farm in Taiwan Strait

1
Department of Hydraulic and Ocean Engineering, National Cheng Kung University, Tainan 701, Taiwan
2
National Center for Research on Earthquake Engineering, Taipei 106, Taiwan
*
Author to whom correspondence should be addressed.
Energies 2016, 9(12), 1036; https://doi.org/10.3390/en9121036
Submission received: 13 September 2016 / Revised: 31 October 2016 / Accepted: 28 November 2016 / Published: 9 December 2016
(This article belongs to the Special Issue Wind Turbine 2017)

Abstract

:
Taiwan is located on the Pacific seismic belt, and the soil conditions of Taiwan’s offshore wind farms are softer than those in Europe. To ensure safety and stability of the offshore wind turbine supporting structures, it is important to assess the offshore wind farms seismic forces reasonably. In this paper, the relevant seismic and geological data are obtained for Chang-Bin offshore wind farm in Taiwan Strait, the probabilistic seismic hazard analysis (PSHA) is carried out, and the first uniform hazard response spectrum for Chang-Bin offshore wind farm is achieved. Compared with existing design response spectrum in the local regulation, this site-specific seismic hazard analysis has influence on the seismic force considered in the design of supporting structures and therefore affects the cost of the supporting structures. The results show that a site-specific seismic hazard analysis is required for high seismic area. The paper highlights the importance of seismic hazard analysis to assess the offshore wind farms seismic forces. The follow-up recommendations and research directions are given for Taiwan’s offshore wind turbine supporting structures under seismic force considerations.

1. Introduction

Taiwan’s natural resources are limited. In order to achieve the objectives of energy efficiency, carbon reduction, and stable power supply, the government of Taiwan fully supports the development of renewable energy and related industries. Offshore wind energy is one of the key strategies. By 2030, Taiwan plans to have an installed offshore wind energy capacity of 4 GW. To ensure safe operation of offshore wind turbines, ocean and marine engineering entities must construct safe and stable supporting structures for these turbines. These structures must be able to withstand loading conditions in an offshore wind farm environment throughout the useful life of the turbines. In addition to the common environmental loading conditions such as wind, waves, and currents observed at other offshore wind farms, offshore wind turbines erected off the west coast of Taiwan must also withstand forces due to earthquakes. Taiwan is located along the earthquake belt that surrounds the Pacific Ocean and has unique geographical conditions. Taiwan is a young island formed by uplifting due to the collision of the Luzon Arc with the Eurasian landmass. Geologically, the seabed off the west coast of Taiwan mostly comprises modern alluvial layers formed by rivers and is composed mainly of sand mixed with miscellaneous clay; the soil there is quite soft. Because of these special geological conditions, wind farms located there are inevitably susceptible to the effects of earthquakes and active faults. Therefore, when designing supporting structures for wind turbines off the west coast of Taiwan, careful consideration must be given to seismic factors, and a reasonable assessment of the vibrational characteristics of the seabed at the site should be completed.
Japan is also located along the earthquake belt that surrounds the Pacific Ocean. After the large earthquake and tsunami that hit Japan on 11 March 2011, Umar and Ishihara [1] carried out earthquake damage assessments of land-based wind farms in Japan. They discovered that the earthquake had caused the supporting structures of wind turbines in these farms to tilt beyond allowable limits, damaging the supporting structures. Buried transmission cables were also exposed owing to soil liquefaction caused by the earthquake. Asareh et al. [2] did fragility analyses of NREL (National Renewable Energy Laboratory) wind turbine and demonstrated that earthquake loads have considerable effects on the wind turbines. As no existing European offshore wind farms are built in active earthquake zones, the relatively mature and commonly seen wind turbine standards [3,4,5,6,7,8] do not include instructions on how to reasonably assess seismic forces, nor do they incorporate seismic force considerations into the design of supporting structures for offshore wind turbines. Therefore, when designing supporting structures for offshore wind turbines in Taiwan’s seismic environment, a careful study of the safety and stability of the supporting structures gains importance. At present, a reasonable assessment of seismic forces is an urgent priority for the development of wind farms off the coast of Taiwan.
In terms of offshore seismic force assessment methods, IEC 61400-1 [6] recommends that local design specifications can be referred while calculating seismic forces on offshore wind turbines. Currently, the main source of references for designing land-based wind turbines in Taiwan is the manuscript Seismic Design Specifications and Commentary of Buildings [9] released by the Construction and Planning Agency of Taiwan’s Ministry of Interior. ISO 19901-2 [10] and API RP 2EQ [11] requires that offshore structures located in highly active earthquake zones undergo a site-specific seismic hazard assessment. A seismic hazard analysis is an assessment of the degree of risk or potential for seismic damage at the selected site over a certain period of time [12]. Depending on the object being assessed, the seismic hazard potential due to earthquakes is usually expressed in terms of surface motion parameters such as peak ground acceleration (PGA), peak ground velocity (PGV), spectral acceleration (Sa) or other seismic parameters that sufficiently represent the degree of ground motion.
This article presents a collection of information on earthquakes and geology related to Taiwan’s Chang-Bin offshore wind farm and uses probabilistic seismic hazard analysis (PSHA) methods to analyze seismic conditions at the site. Based on the results of this analysis, the seismic force parameters and simplified uniform hazard response spectra used in earthquake design are developed. These earthquake response spectra are then compared to the response spectrum obtained from Taiwan’s Seismic Design Specifications and Commentary of Buildings [9]. The static analytical method is used to carry out an initial seismic force assessment on hypothetical NREL OC3 turbines [13,14] situated at Chang-Bin offshore wind farm to explain the limitations of the current code when considering seismic forces in offshore wind farms. Finally, the recommendations are given for calculating seismic forces for supporting structures of offshore wind turbines off the west coast of Taiwan.

2. Geological Data on the Seabed Soil at the Offshore Wind Farm Outside of Taiwan’s Changhua County

Taiwan’s offshore wind farm is located off the coast of Changhua County, Taiwan, between the mouths of the Dadu and Zhuoshui rivers. It includes two offshore wind power plant sites [15]. The southern site is the Fangyuan site and the northern site is the Chang-Bin site, as shown in Figure 1. The wind farm is approximately 35 km long and 7 km wide, and it is located 8 to 15 km away from the shore. The sea at the site is 20 to 40 m deep. In addition, surveys by Taiwan’s Ministry of Economic Affairs’ Central Geological Survey reveal that the seabed sediment at the wind farm and the alluvium in the Zhuoshui River basin are part of the same system. This means that the soil properties at the offshore site are similar to that at the Changhua plain.
In order to understand the soil conditions at the offshore wind farm off western Taiwan and decide on earthwork design parameters, the data from 14 exploration drill sites, each 80 m to 90 m deep, are considered. Two sites are selected for the following analyses: BH01 (Taiwan Ocean Research Institute, TORI) (Universal Transverse Mercator (UTM) coordinates E175290.1, N2656259.6); and BH02 (TORI) (UTM coordinates E172724.6, N2652211.9). The BH02 (TORI) drilling site is the proposed location for Taiwan’s offshore wind turbine demonstration. The depth of water at BH01 (TORI) and BH02 (TORI) are 19.75 m and 22.88 m, respectively. The soil at both sites is mainly silty sand interspersed with layers of silty clay. The simplified soil layers are shown in Table 1 and Table 2 [14].

3. Analysis of Seismic Conditions at Taiwan’s Chang-Bin Offshore Wind Farm

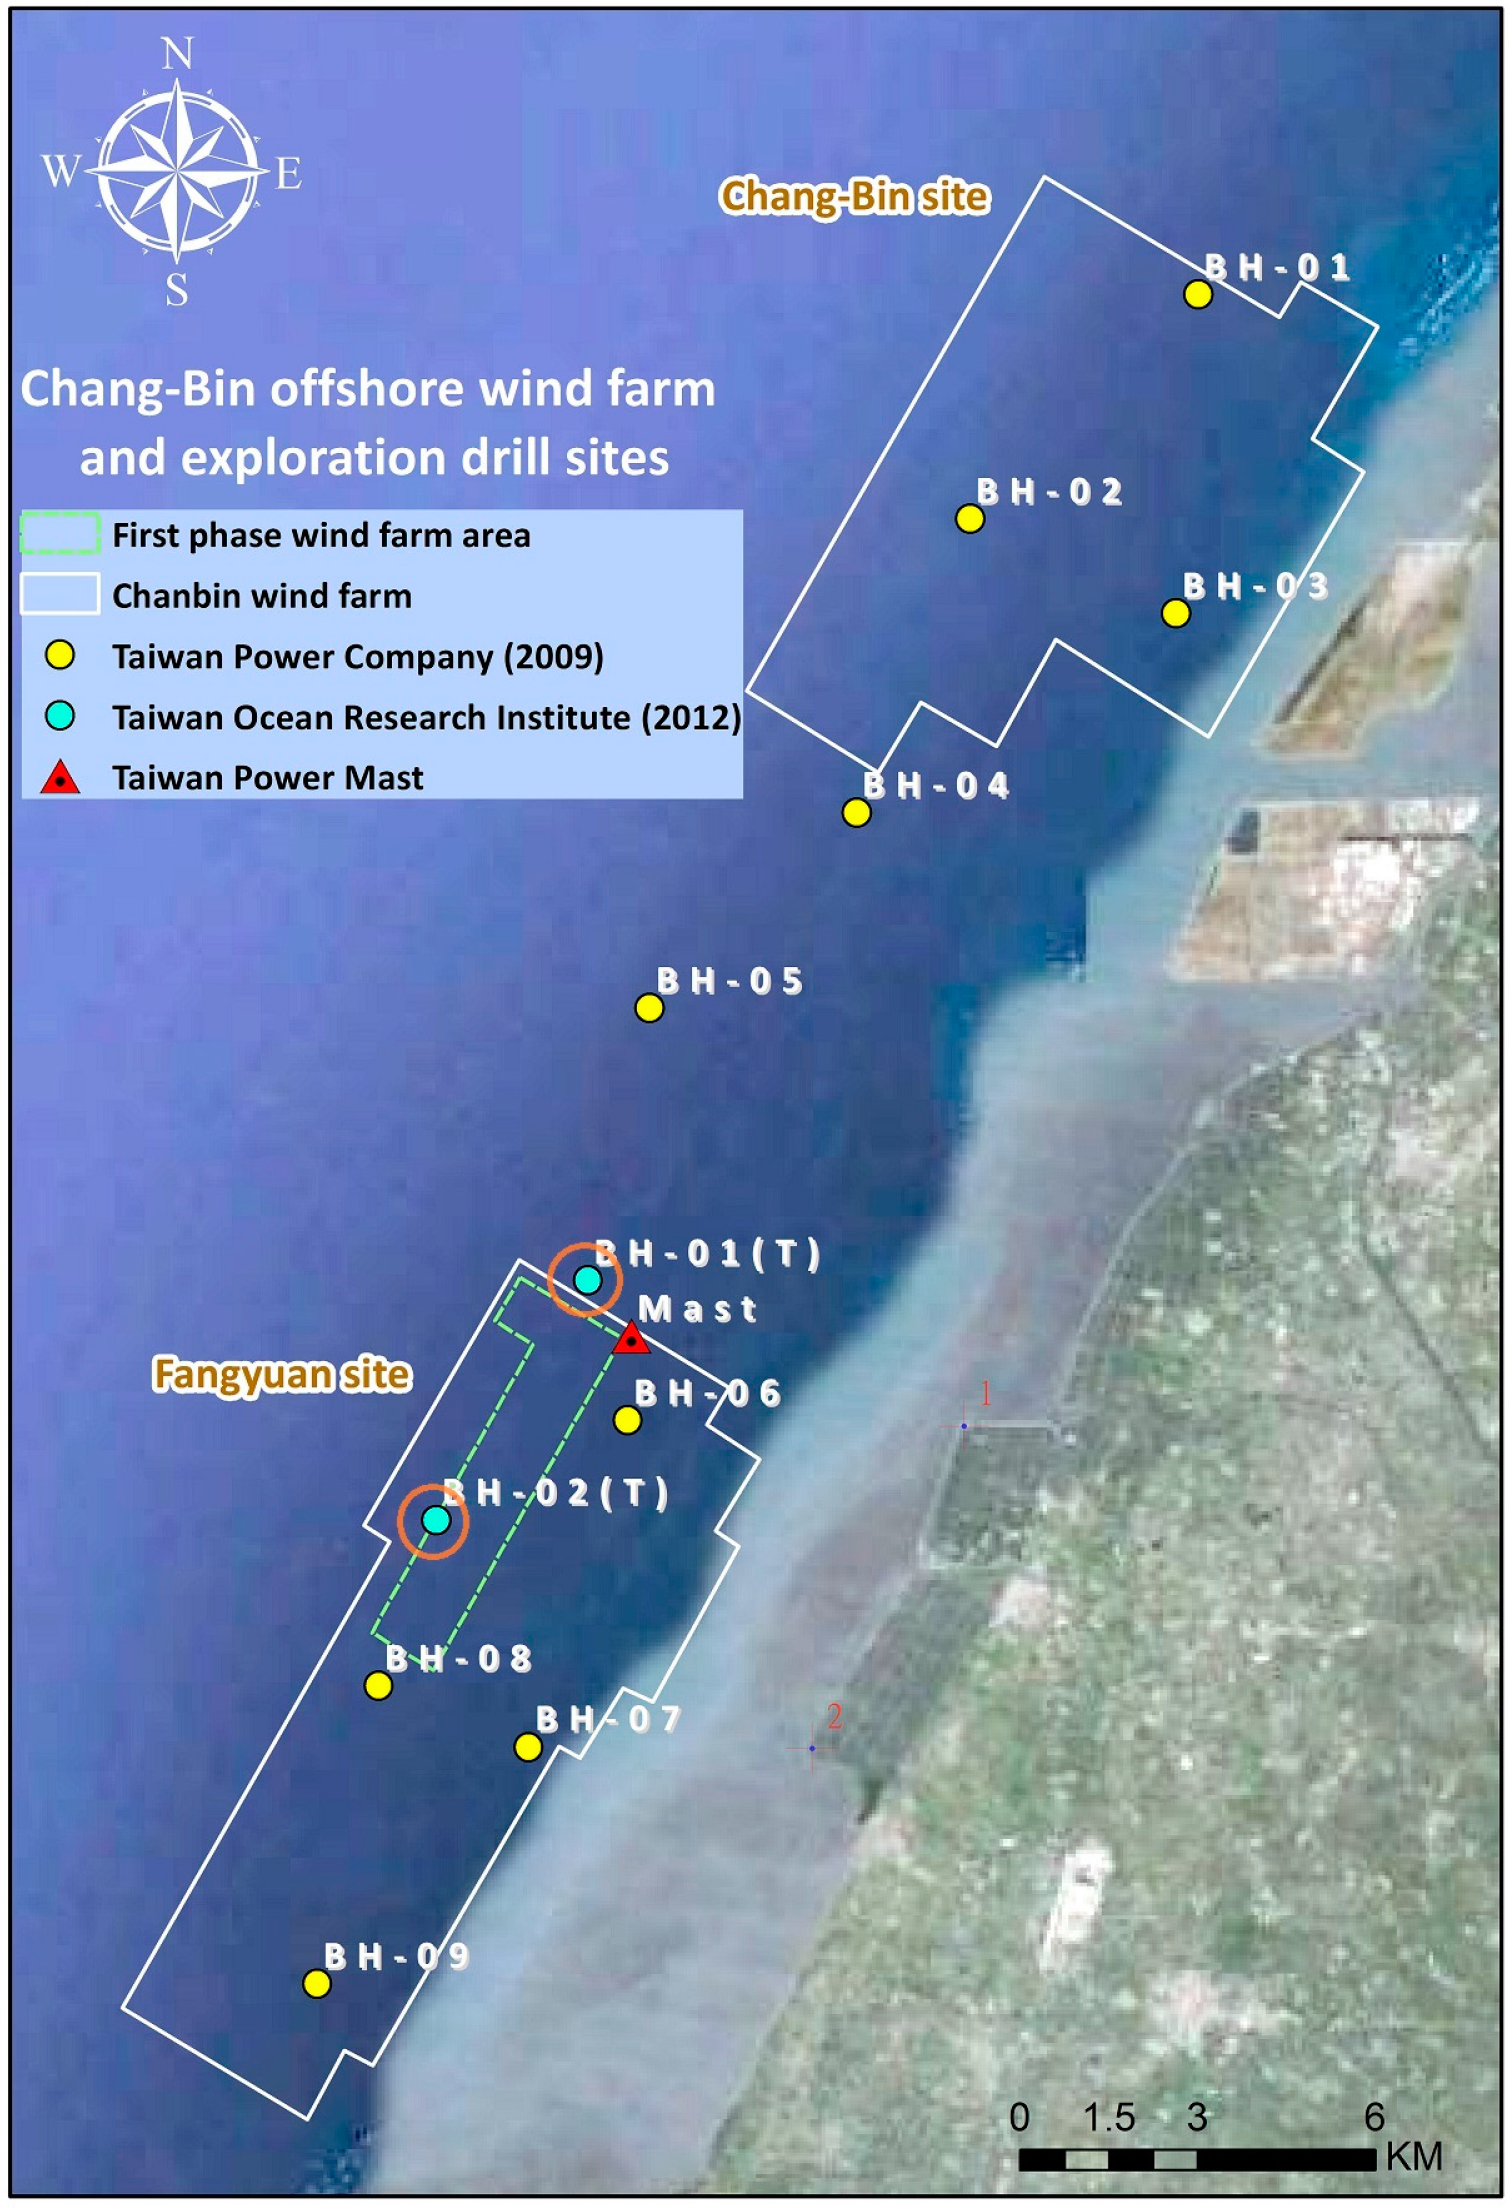
The seismic hazard analysis of the Chang-Bin offshore wind farm at the exploration drill sites BH01 (TORI) and BH02 (TORI) is carried out in this study. The Universal Transverse Mercator coordinates of these two sites are E175290.1, N2656259.6 (BH01 (TORI)), and E172724.6, N2652211.9 (BH02 (TORI)). The objective of the seismic hazard analysis is to establish the annual probability of exceedance curves for ground motion parameters specific to the worksite such as peak ground acceleration (PGA), peak ground velocity (PGV), maximum ground displacement, spectral acceleration (Sa), spectral velocity, spectral displacement, etc. The probabilities of exceedance curves are generally referred to as hazard curves. After obtaining the spectral acceleration hazard curves for structures with different natural vibration periods, it is possible to obtain the uniform hazard response spectra for a specific annual probability of exceedance (earthquake return period) to be used in the design of foundations and supporting structures for wind turbines.

3.1. Seismic Activities in the Taiwan Strait

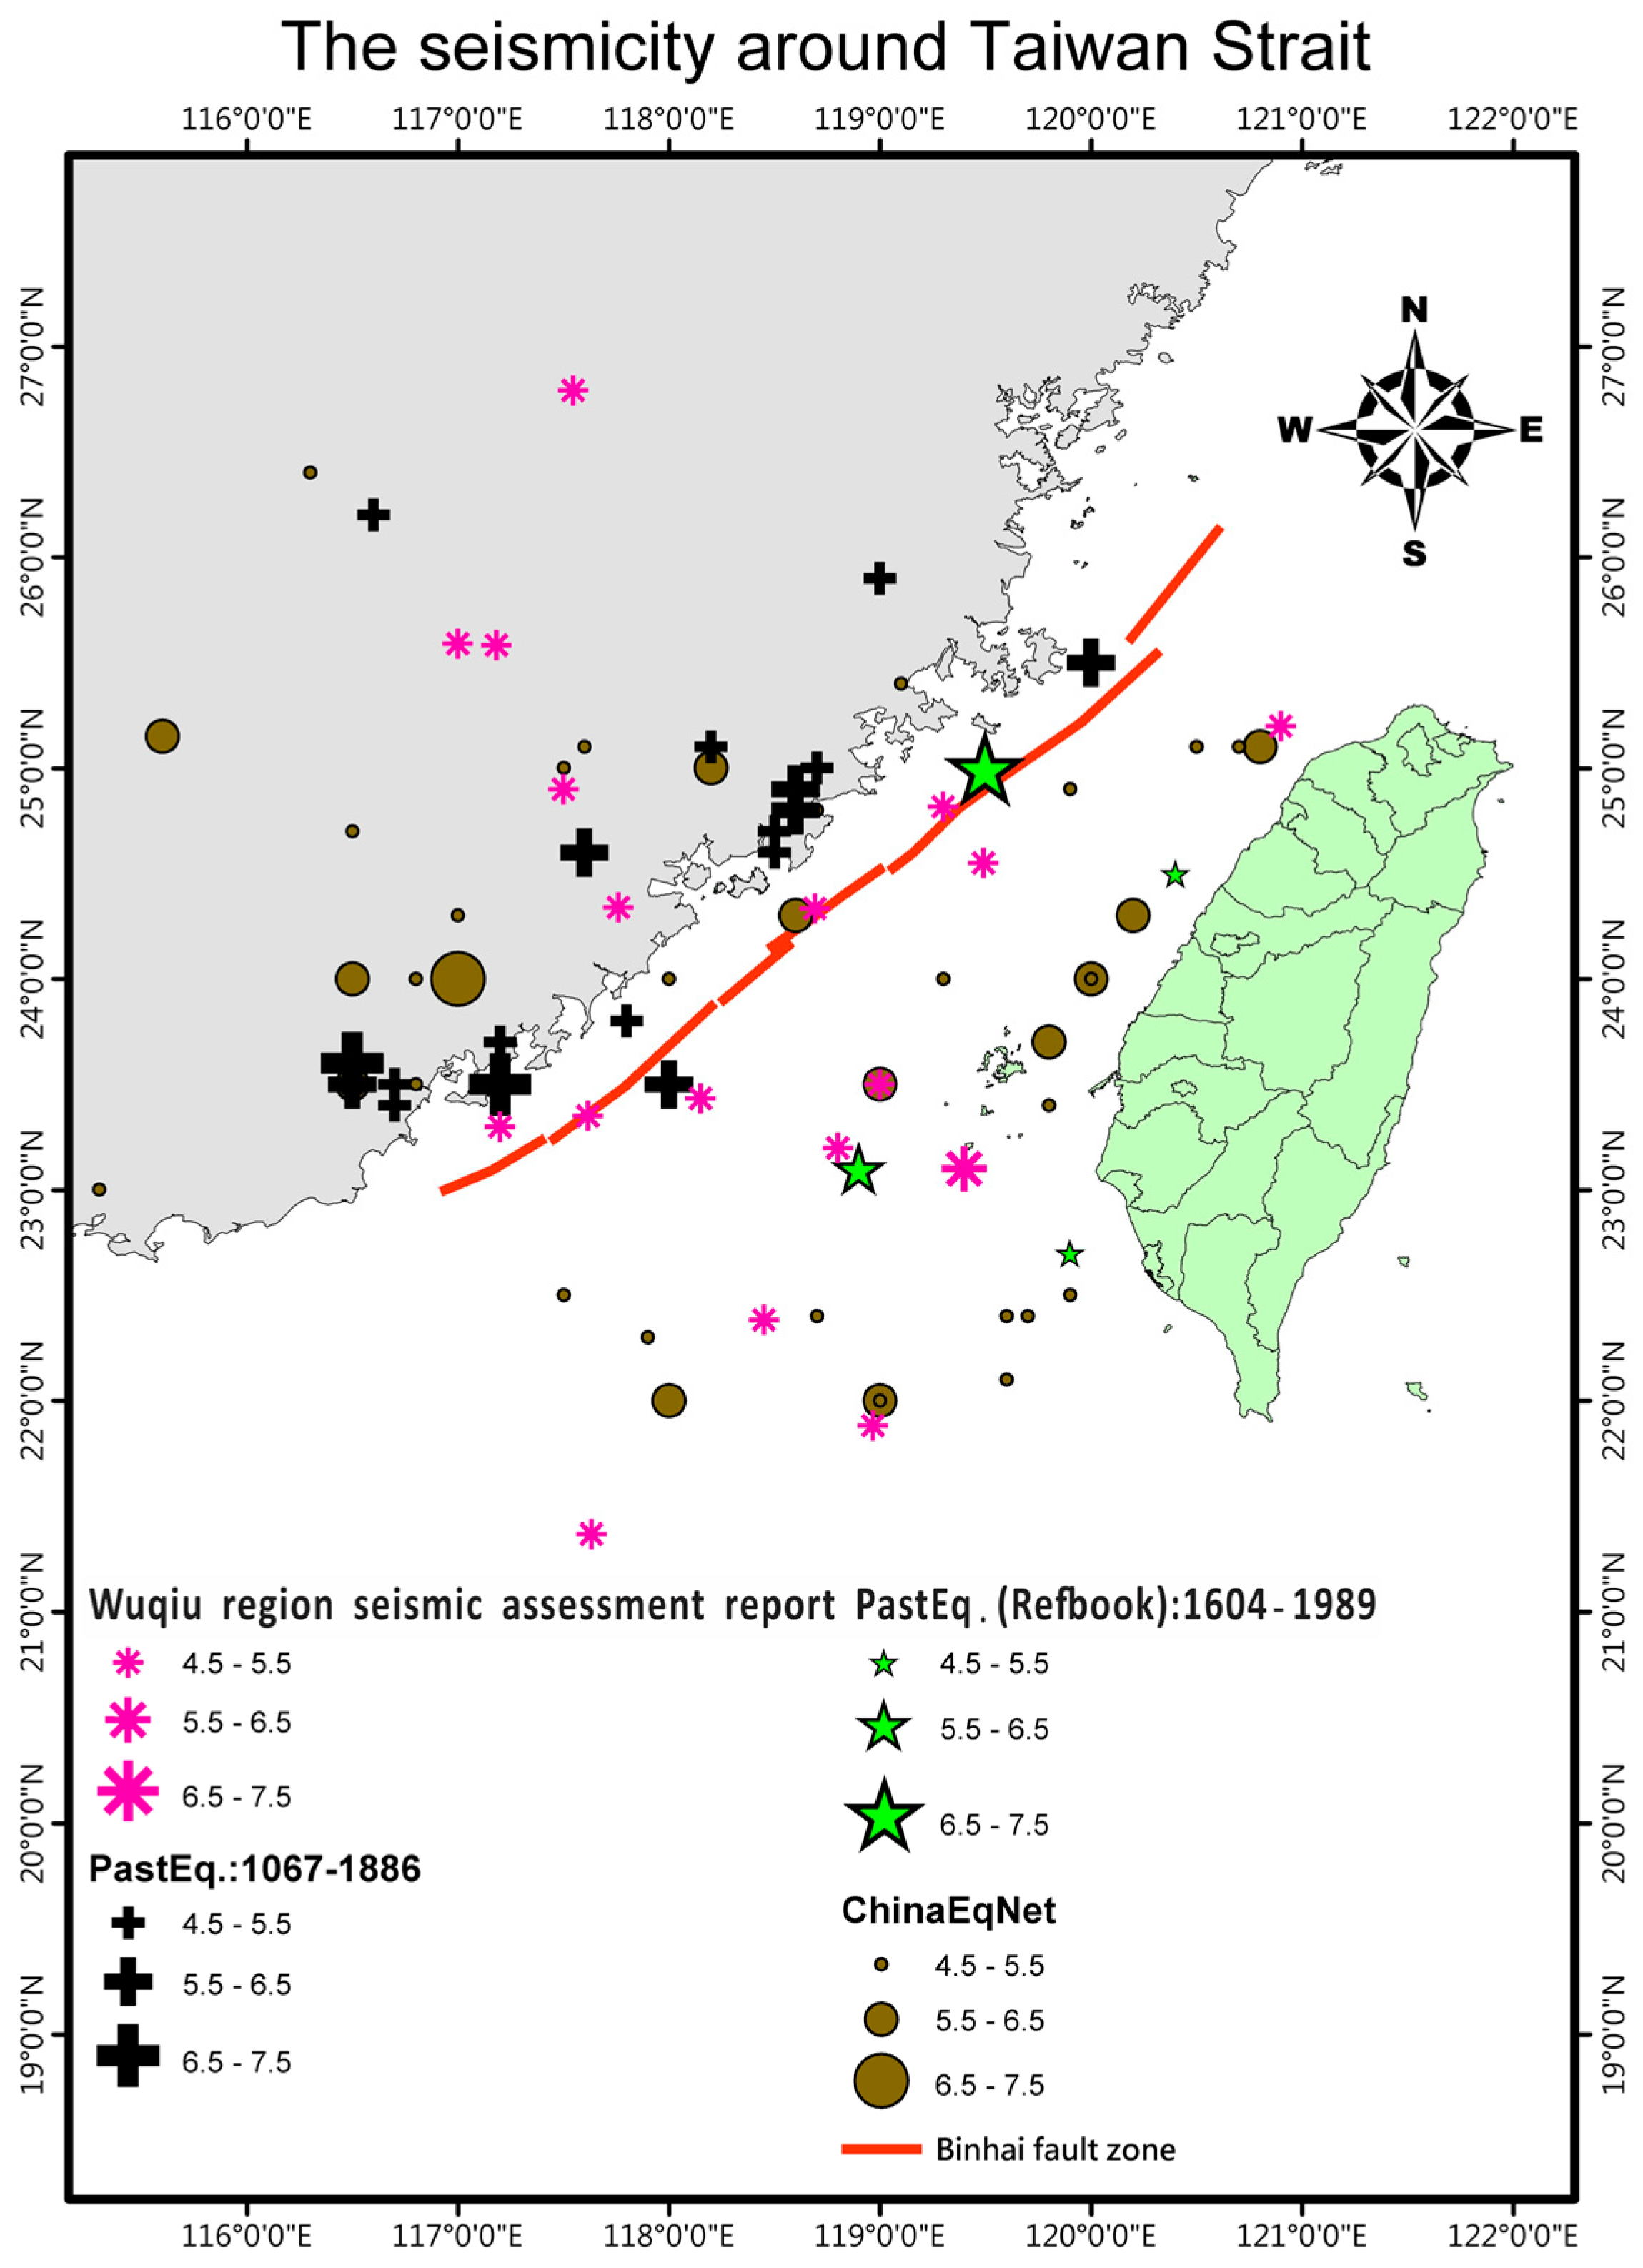
The geological structure of Taiwan is primarily a result of the interaction of the Eurasian Plate and the Philippine Sea Plate. Seismic data indicate that the Philippine Sea Plate begins a northward subduction beneath the Eurasian Plate near Hualien, Taiwan at approximately 24° north latitude. The inclination of the subduction is 45° to 50°. Its western boundary is roughly parallel to 121.5° east longitude. Therefore, primarily deep earthquakes occur in the northeastern part of Taiwan, i.e., east of 121.5° E and north of 24° N. Another subduction zone with deep earthquakes is located in southern Taiwan where the Eurasian Plate disappears beneath the Philippine Sea Plate at 121° E longitude. Seismic activities in the Taiwan Strait were also considered in this study to accurately calculate the seismic design specifications for the Chang-Bin offshore wind farm. The spatial distribution of earthquake activities in the Taiwan Strait reviewed by Wen et al. [17] was considered. The data reveals a region of relatively concentrated seismic activities to the west of Taiwan Island. The region is wider in the east and narrower in the west and most earthquake activities in this region are influenced by the nearby Binhai fault zone, which is a NEE-trending tectonic belt. It is a recently active fault to control the differential sedimentation of Cenozoic stratum and forms a tectonic boundary to the west of Taiwan Strait.
Because Taiwan’s earthquake observation network is spread out evenly over the main island of Taiwan, earthquakes that occur in the Taiwan Strait are technically outside this network. There is a rather high uncertainty when calculating the locations of these earthquakes, and their historical records may also be incomplete. To build the database of earthquake in the Taiwan Strait, the historical earthquake information from the following sources are collected and compiled in this paper:
  • China Earthquake Data Center’s record of earthquakes in the Taiwan Strait of magnitude 4.0 or higher from 1832 to 1969.
  • The record of destructive earthquakes in the Taiwan Strait over the past 1900 years, compiled by Wen et al. [18] in their assessment of earthquakes in Wuqiu Township. In their report, the earthquake data in the Taiwan Strait obtained from the China Earthquake Networks Center, the United States Geological Survey’s Global Seismographic Network and Taiwan Central Weather Bureau’s Strong Earthquake Observation Network were also compiled using ML scale. This earthquake catalog covers the years from 1901 to 2000.
  • The Taiwan Strait seismic activity record compiled by Zhu et al. [18] in their assessment of seismic hazards in the Fujian region. This earthquake catalog includes earthquakes of magnitude 3.0 or higher from 1604 to 1989.
  • Taiwan Central Weather Bureau’s earthquake catalog from 1900 to 2008.
This paper relied on the Taiwan Central Weather Bureau’s earthquake catalog as the primary reference to compare data from other sources and eliminate multiple entries for the same seismic events. In this way, a database of seismic activities in the Taiwan Strait was created (as shown in Figure 2) and integrated with the Taiwan Central Weather Bureau’s earthquake catalog, to be used in seismic hazard analyses for Taiwan’s Chang-Bin offshore wind farm.

3.2. Seismic Hazard Analysis

The seismic hazard analysis estimates the level of a ground-motion intensity parameter at the worksite that would be produced by future earthquakes. The seismic sources include faults and typical area sources, which are mainly characterized by geological and seismotectonic studies. Characteristic earthquake recurrence models were used to consider the earthquake potential of nearby faults. The general Poisson process [19], combined with a fault rupture model was used in this study to characterize the temporal distribution of earthquake recurrence and carry out the seismic hazard analysis. The main components of the analysis were: (1) demarcation and modeling of seismic sources; (2) earthquake recurrence relationship; (3) upper (mu) and lower (m0) limits of earthquake magnitude; (4) earthquake magnitude probability density function; (5) ground motion attenuation law; and (6) hazard curve.
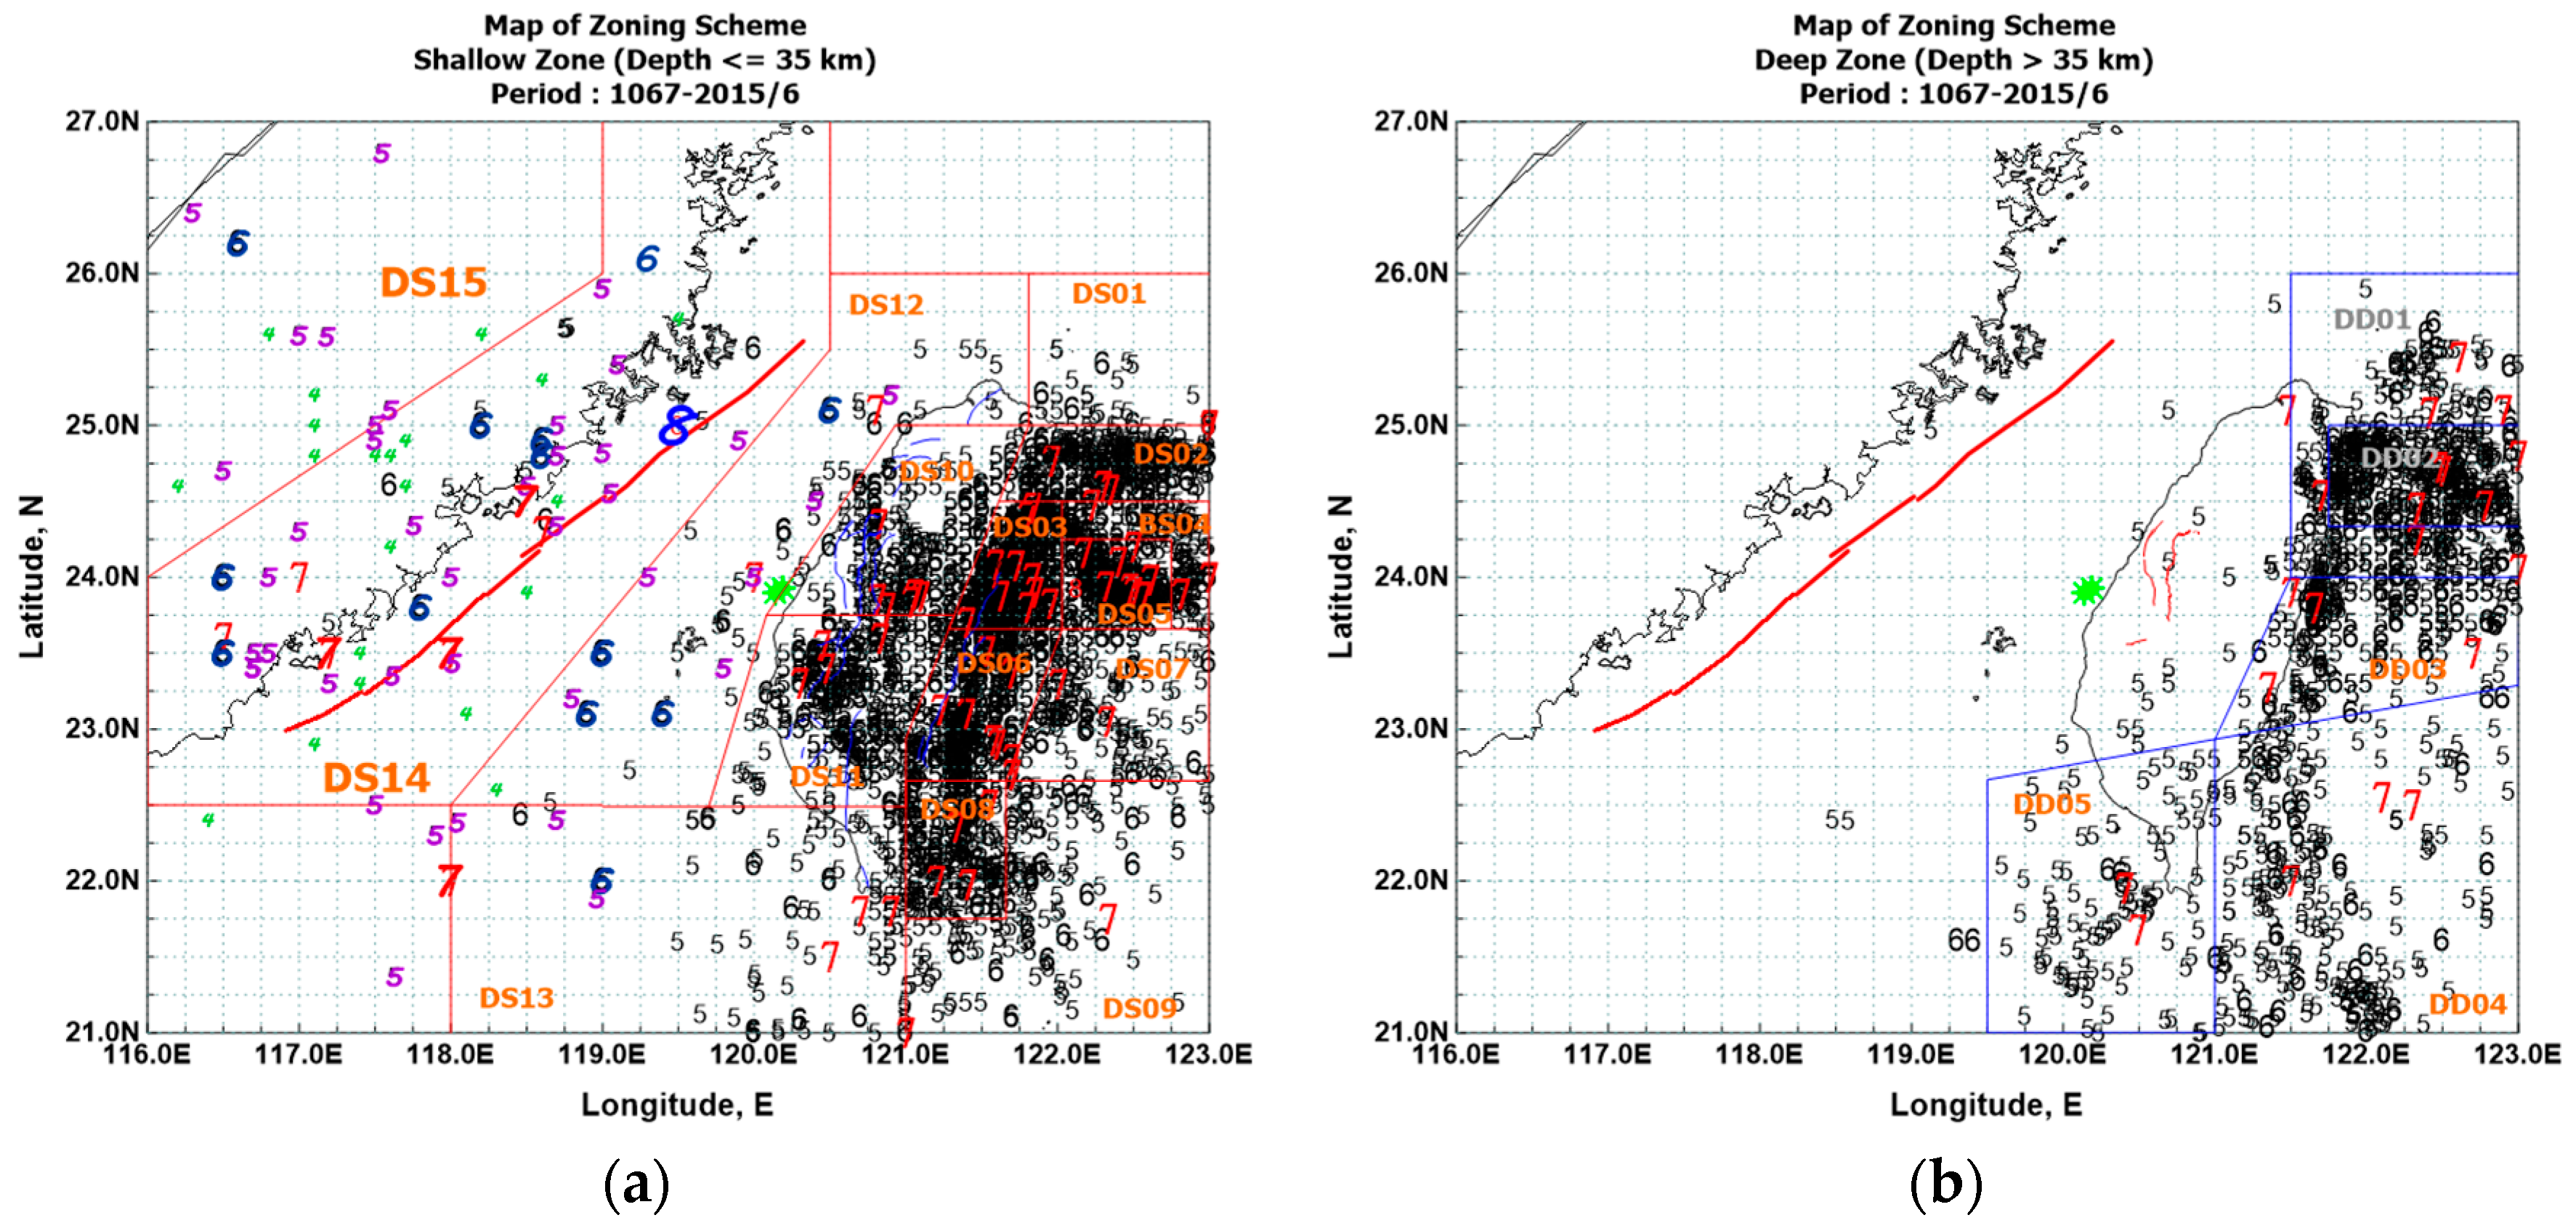
Because of the special geological structure of the Taiwan region, there is a clear earthquake focus depth boundary at 35 km. Therefore, 35 km is used as the boundary separating deep and shallow earthquake zones in this study. Figure 3 shows the seismic zonation map used in this study. A unique set of model parameters for seismic hazard analysis can be established for each zone. The deep earthquakes were modeled as point sources, whose energy was considered to be released at the focus, and the shockwaves transmitted radially from the focus to the worksite. The active faults were modeled as TYPE I linear sources with definite positions and strikes. The rupture extended out along the fault surface in both directions from the focus and the energy was released evenly along the length of the rupture. Other shallow earthquakes were modeled as TYPE III linear sources with uncertain positions and strikes. The rupture directions were assumed to be uniformly distributed in 360°.
The Gutenberg–Richter (G-R) magnitude–recurrence relationship [20] is used in this study:
log N ( m ) = a b m ,
where m is the earthquake magnitude, N(m) is the number of earthquakes of magnitude equal to or greater than m, and a and b are constants that can be obtained from earthquake data regression analysis. This relationship is suitable within a certain range of magnitudes, therefore, the upper (mu) and lower (m0) magnitude limits are to be determined. Since sensitivity analyses showed that earthquakes of magnitude less than 4.5 make only a tiny contribution to seismic hazard. As a result, the lower magnitude limits are set as m0 = 4.5. The upper earthquake magnitude limit is related to the maximum amount of energy that can accumulate in each source zone. Using parameters a, b, m0 and mu, earthquake magnitude probability density functions fM can be obtained from Equation (1) and the differential of the earthquake magnitude cumulative distribution function FM(m):
F M ( m ) = { 0    ; m m 0 N ( m ) N ( m u ) N ( m 0 ) N ( m u )   ; m 0 m m u 1    ; m u m
The parameters a, b and mu for each source zone used in this study are listed in Table 3.
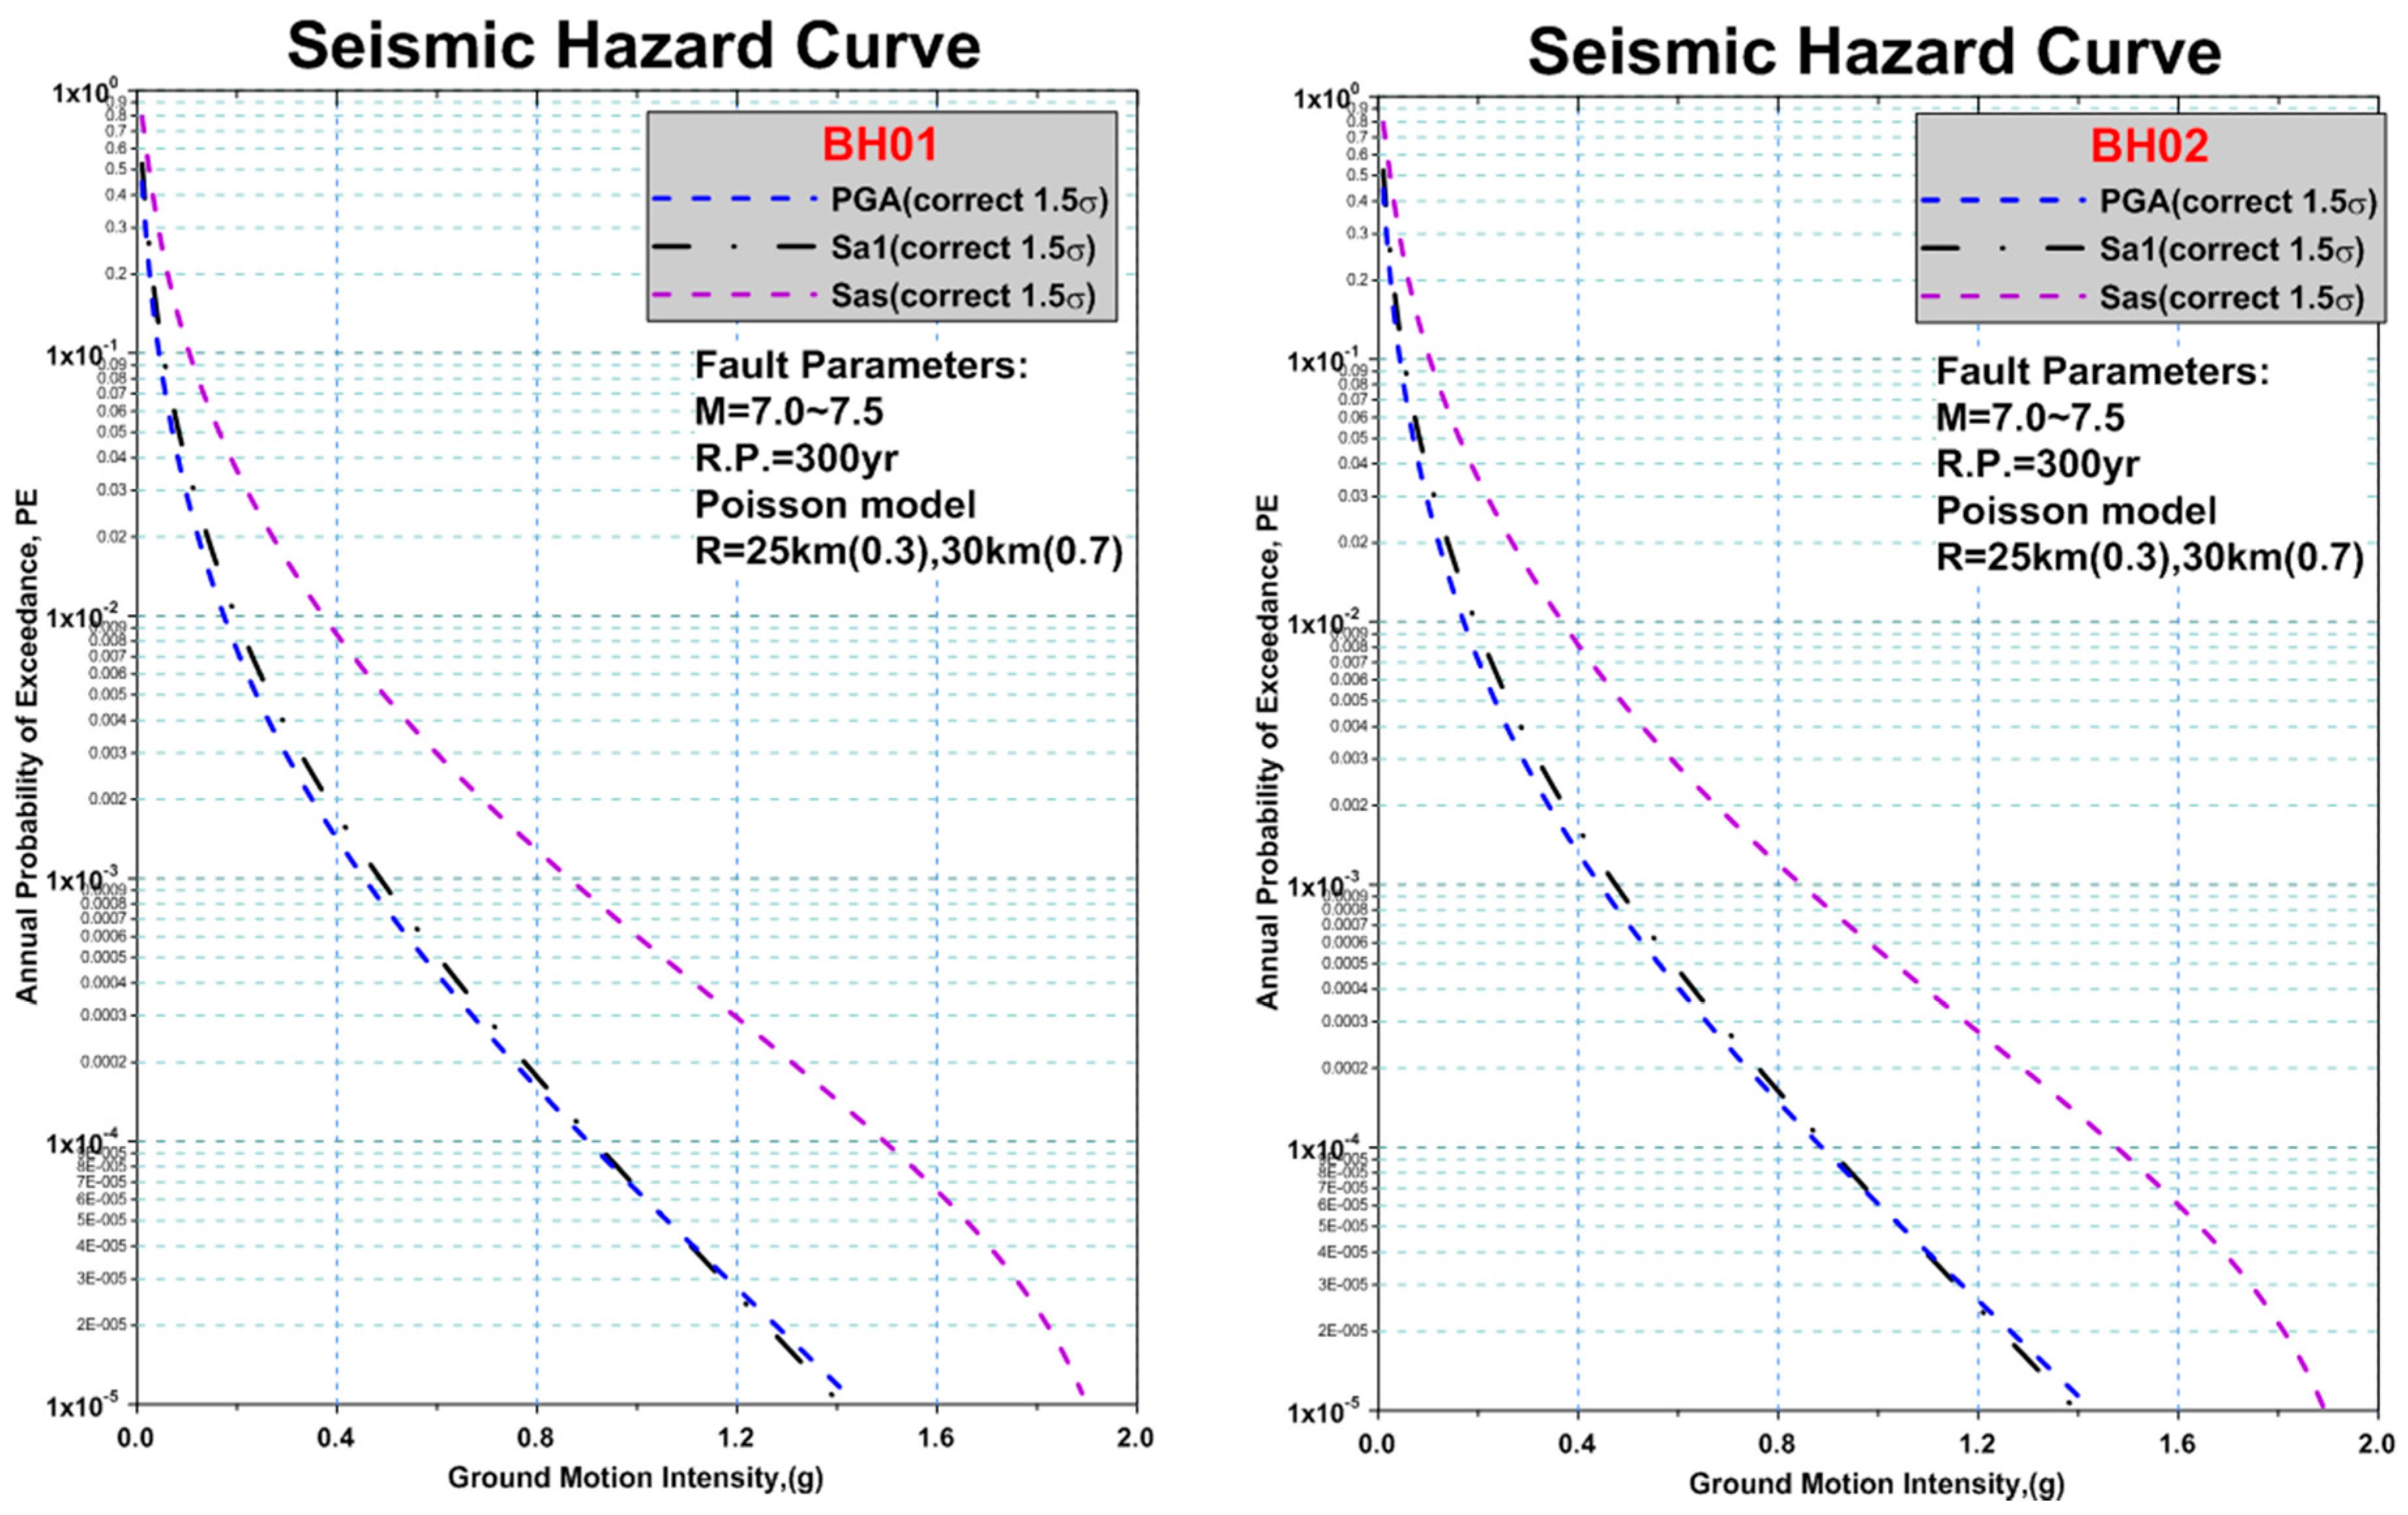
The study assumes that the probability of earthquakes occurring along the Binhai fault zone can be predicted using a Poisson process, in which the earthquake magnitude is between ML 7.0 and ML 7.5, and the return period is 300 years. In the analysis, the seismic activities along the Binhai fault zone are separated into two parts: (1) The earthquakes with upper limit of earthquake magnitude, mu = 7.0, where the earthquake recurrence model of Gutenberg and Richter is applied; and (2) the earthquakes with magnitude between ML 7.0 and ML 7.5, where the characteristic earthquake model is applied. For characteristic earthquake model, since there is an average of 3.5 ruptures during each Binhai fault zone earthquake event, the average annual rate is 1/300 × 3.5 = 0.011667.
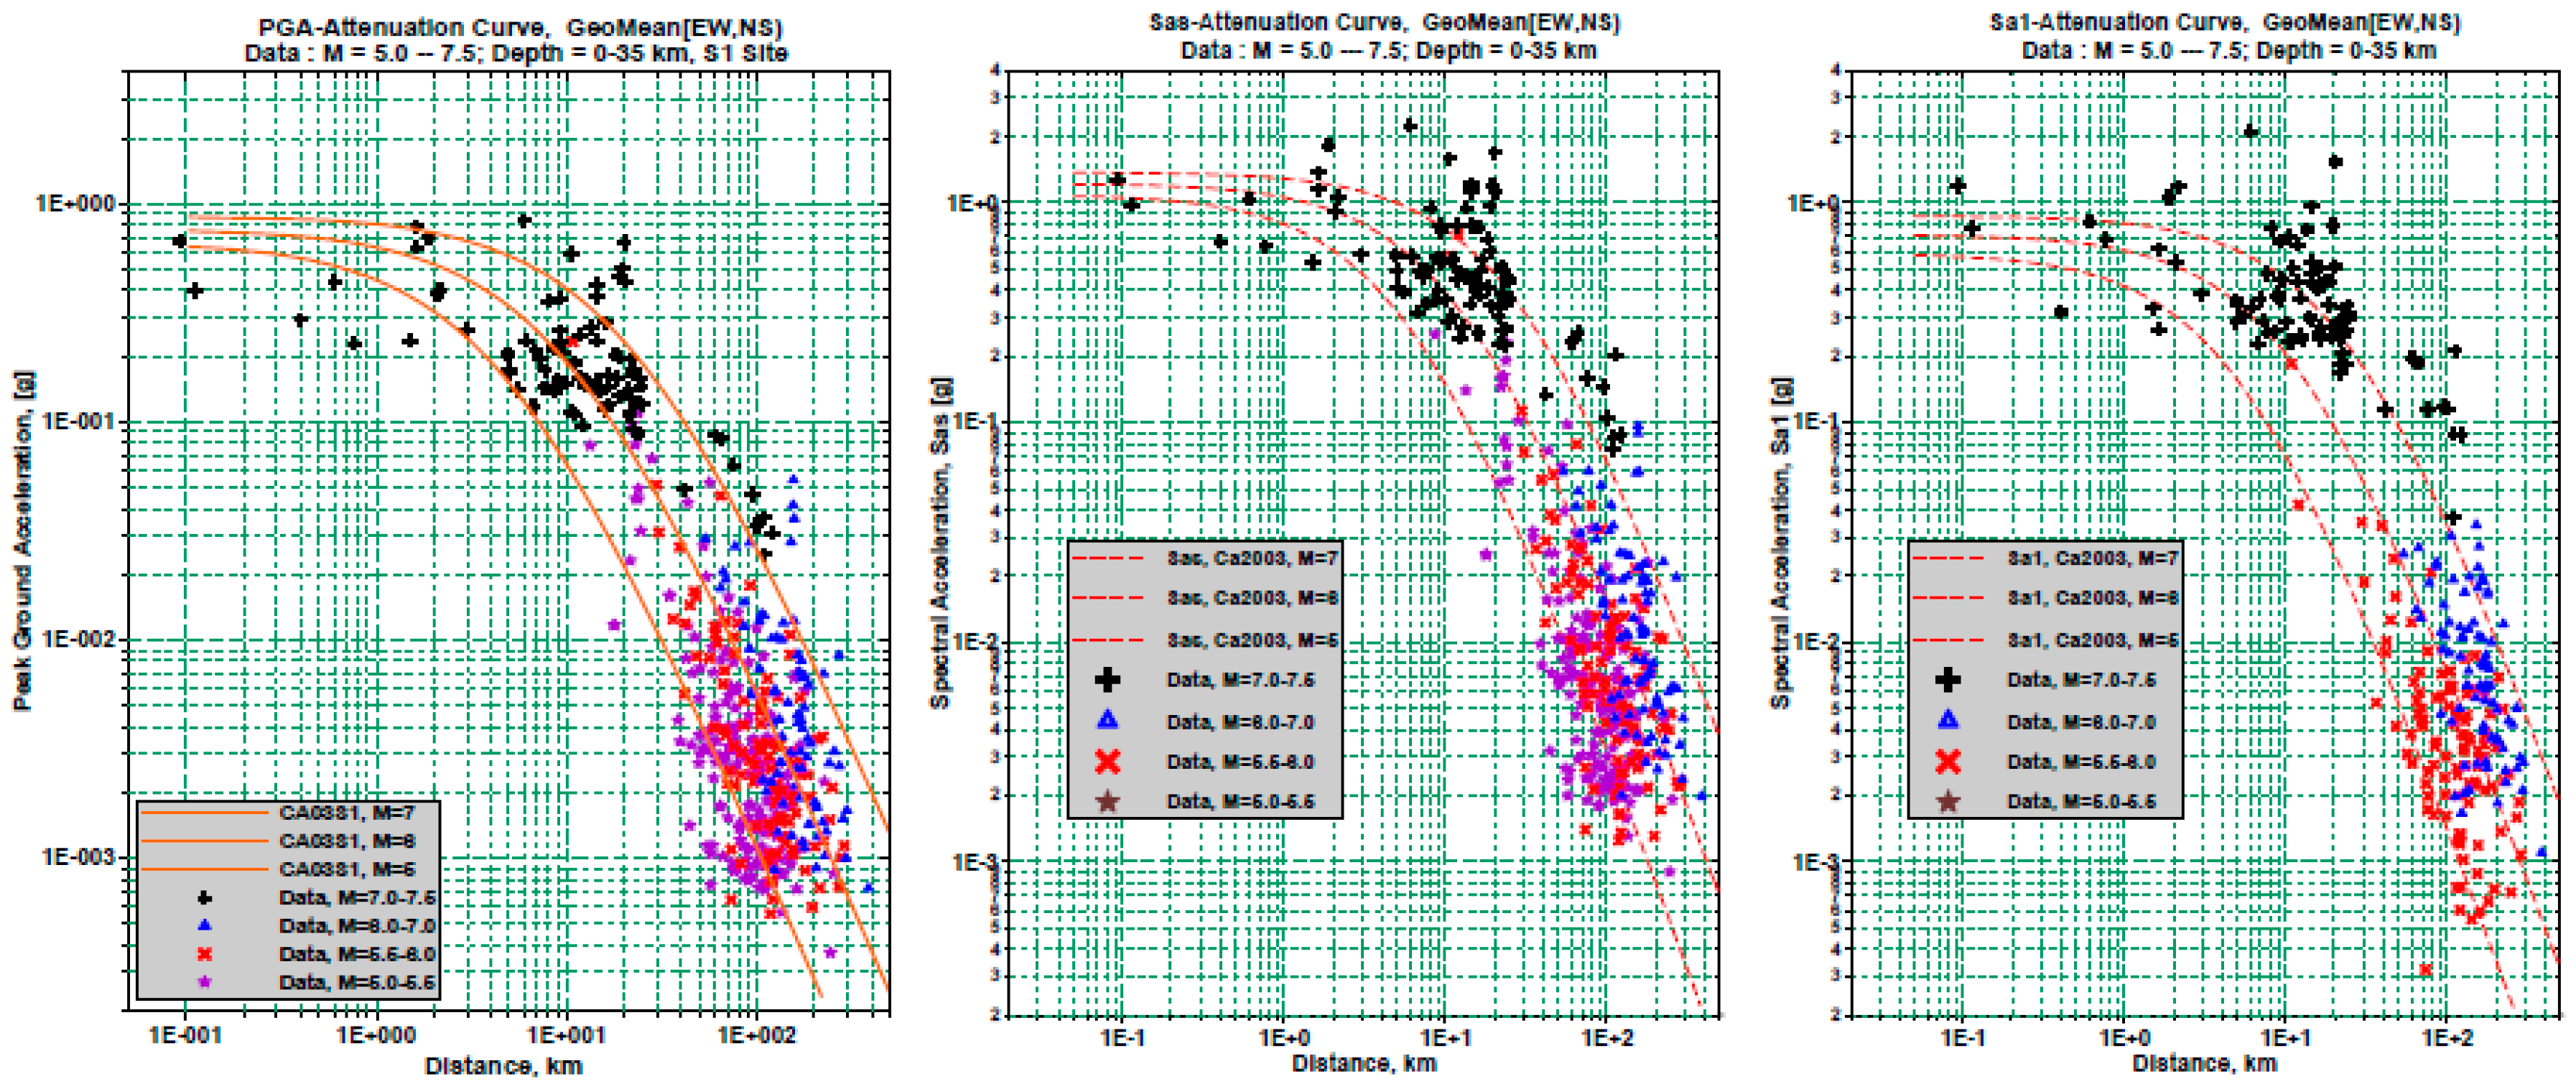
When earthquakes occur, energy propagates in waves from the fault zone to the worksite. Because of the propagation medium and geometry, the intensity of ground motion attenuates. There are several attenuation relationships commonly used in engineering. While analyzing earthquake data from the Central Weather Bureau’s Taiwan Strong Motion Instrumentation Program, it was discovered that the attenuation equation proposed by Campbell [21] most closely conforms to the attenuation characteristics of Taiwan region [22]. It is expressed as follows:
Y r = f ( M , R ) = b 1 e b 2 M [ R + b 4 exp ( b 5 M ) ] b 3 ,
where Y r could be any of three ground motion parameters—PGA, short-period spectral acceleration coefficient (SaS), or one-second-period spectral acceleration coefficient (Sa1). R and M are the distance from the focus and the earthquake magnitude, respectively; b 1 ~ b 5 are constant coefficients that can be obtained by regression analysis of earthquake data. The obtained hard site attenuation models are shown in Figure 4, and the constant coefficients b 1 ~ b 5 used in this study are listed in Table 4. When calculating the hazard curve, it is necessary to consider the probability characteristics of the attenuation law. Generally, standard deviation values of 1.5σ to 2.0σ are used.

3.3. Chang-Bin Offshore Wind Farm Seismic Response Spectrum

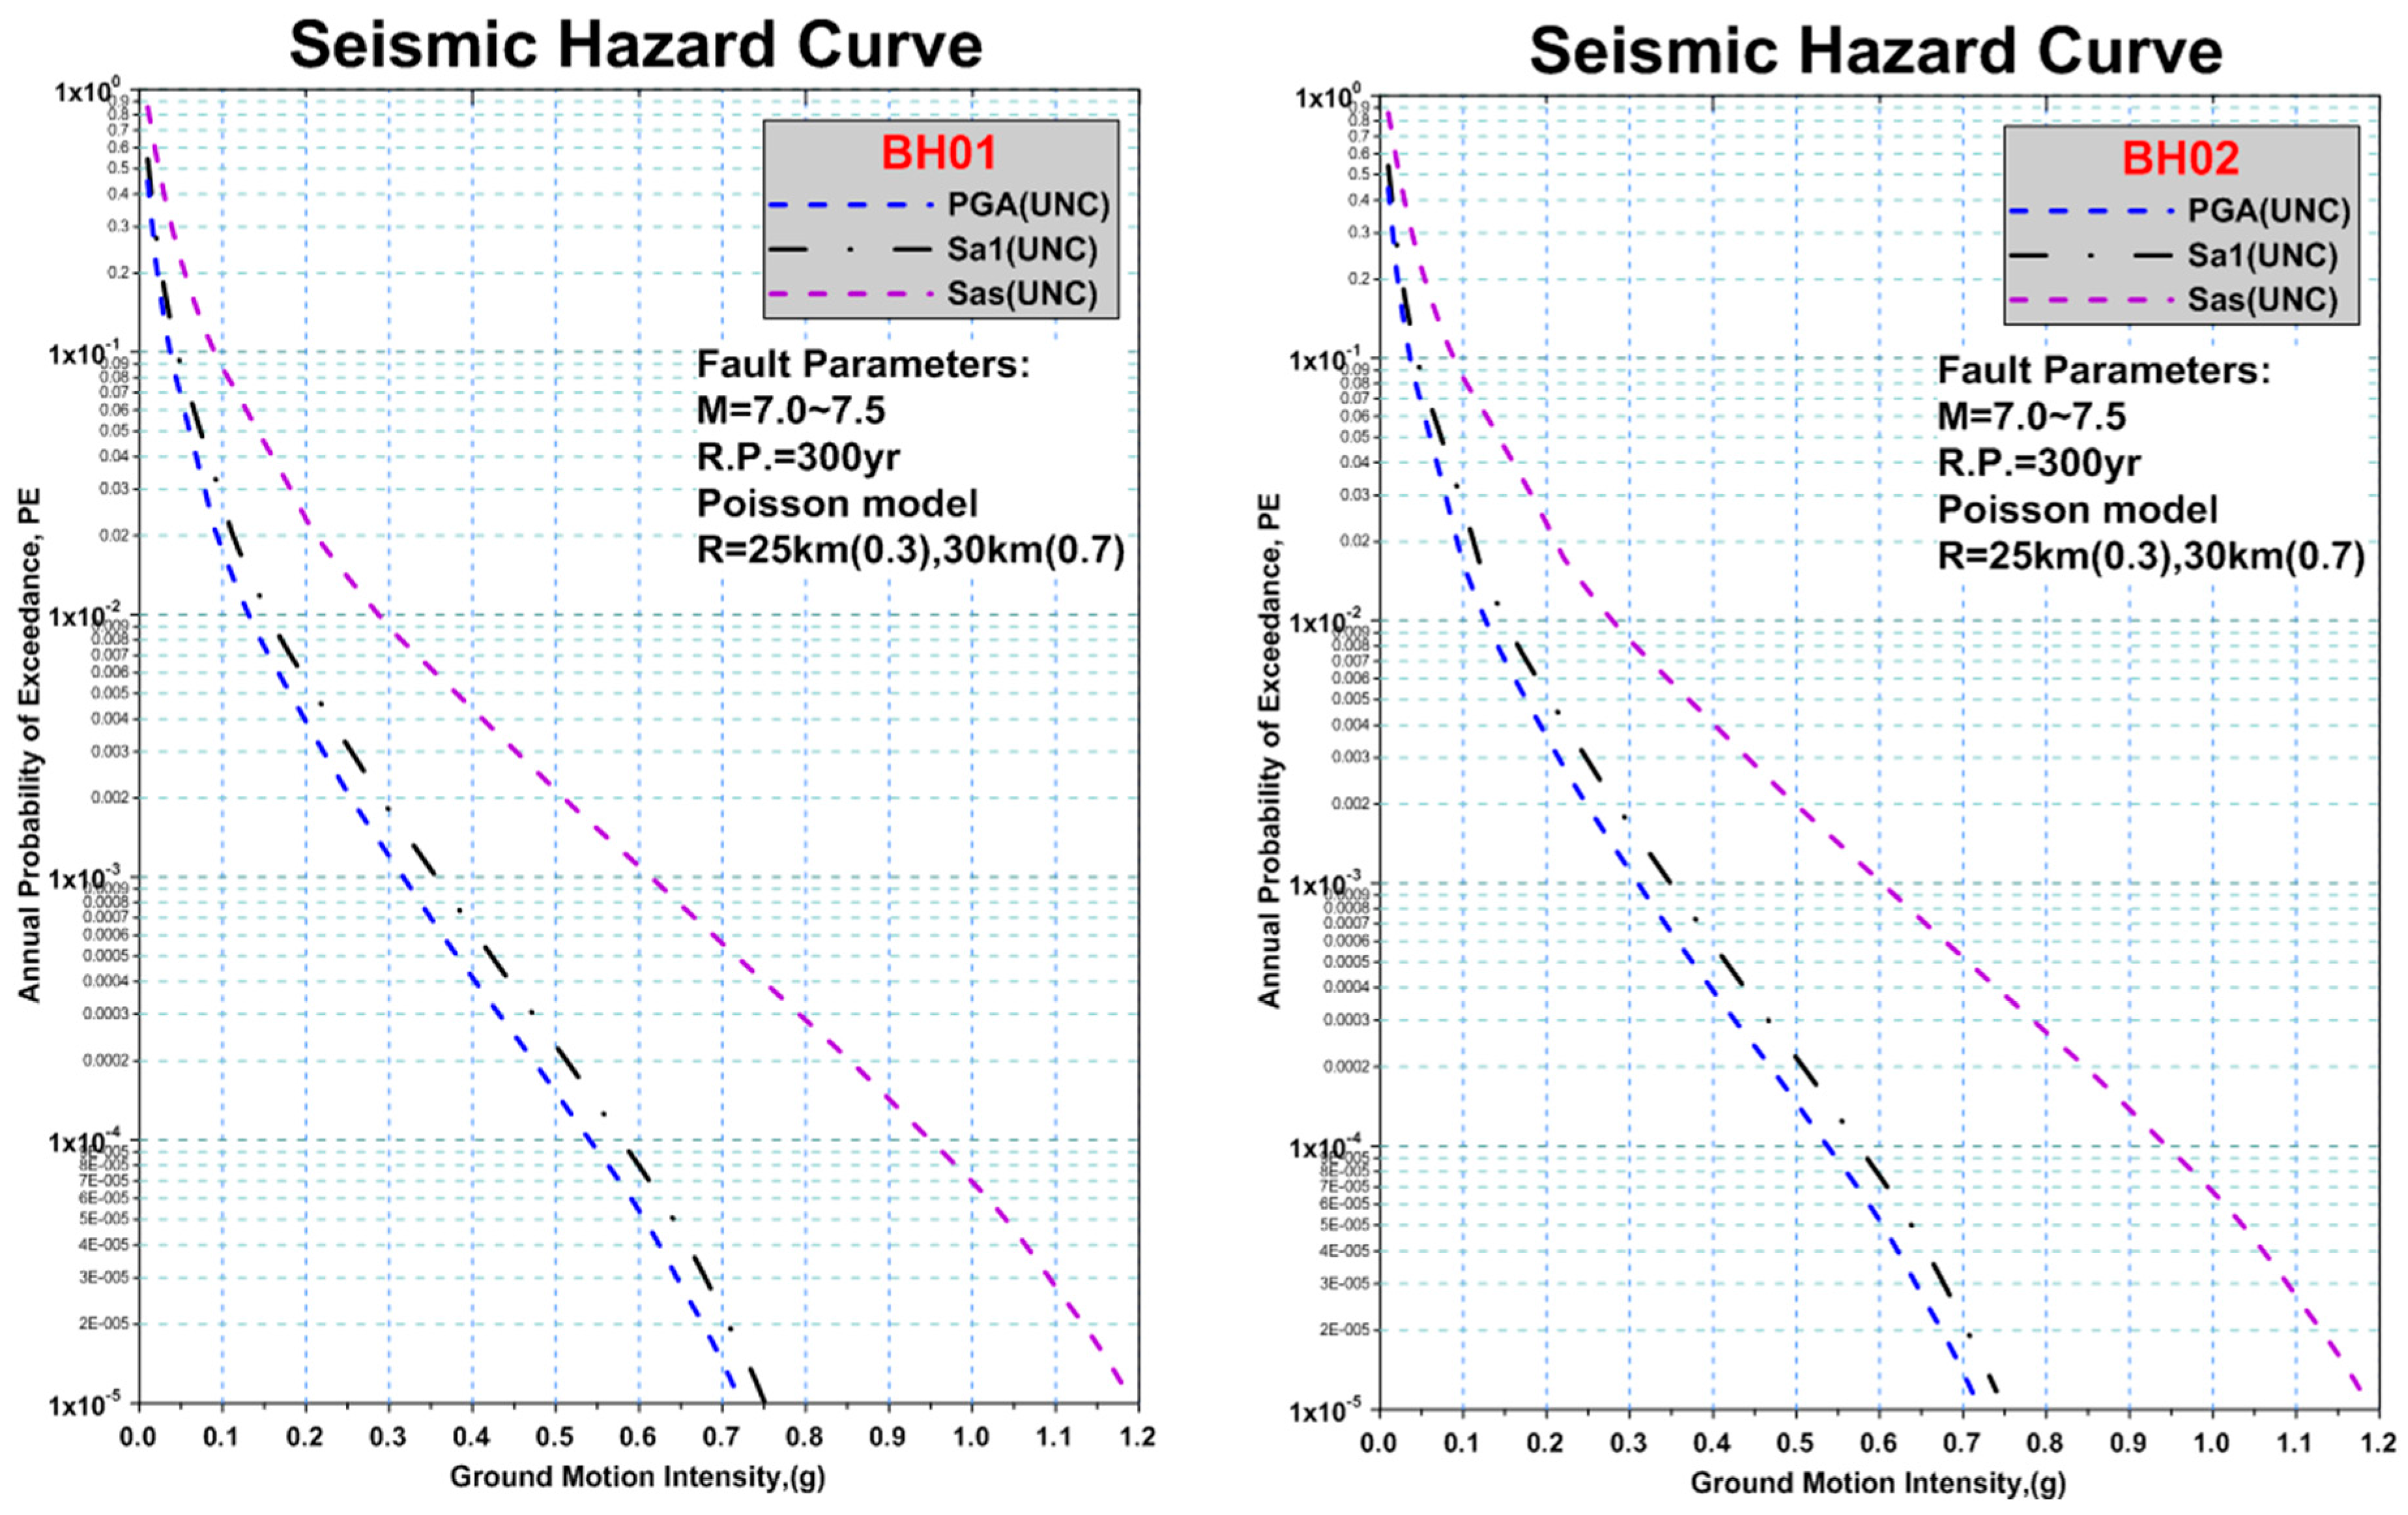
The seismic hazard curves for the Chang-Bin offshore wind farm using median values and values corrected to 1.5 standard deviations are shown in Figure 5 and Figure 6. The corresponding bedrock spectral acceleration coefficients at oscillator periods of 0.3 s and 1.0 s for the design basis earthquake (DBE) with a 475 years return period, and the maximum considered earthquake (MCE) with a 2500 years return period are shown in Table 5 and Table 6.
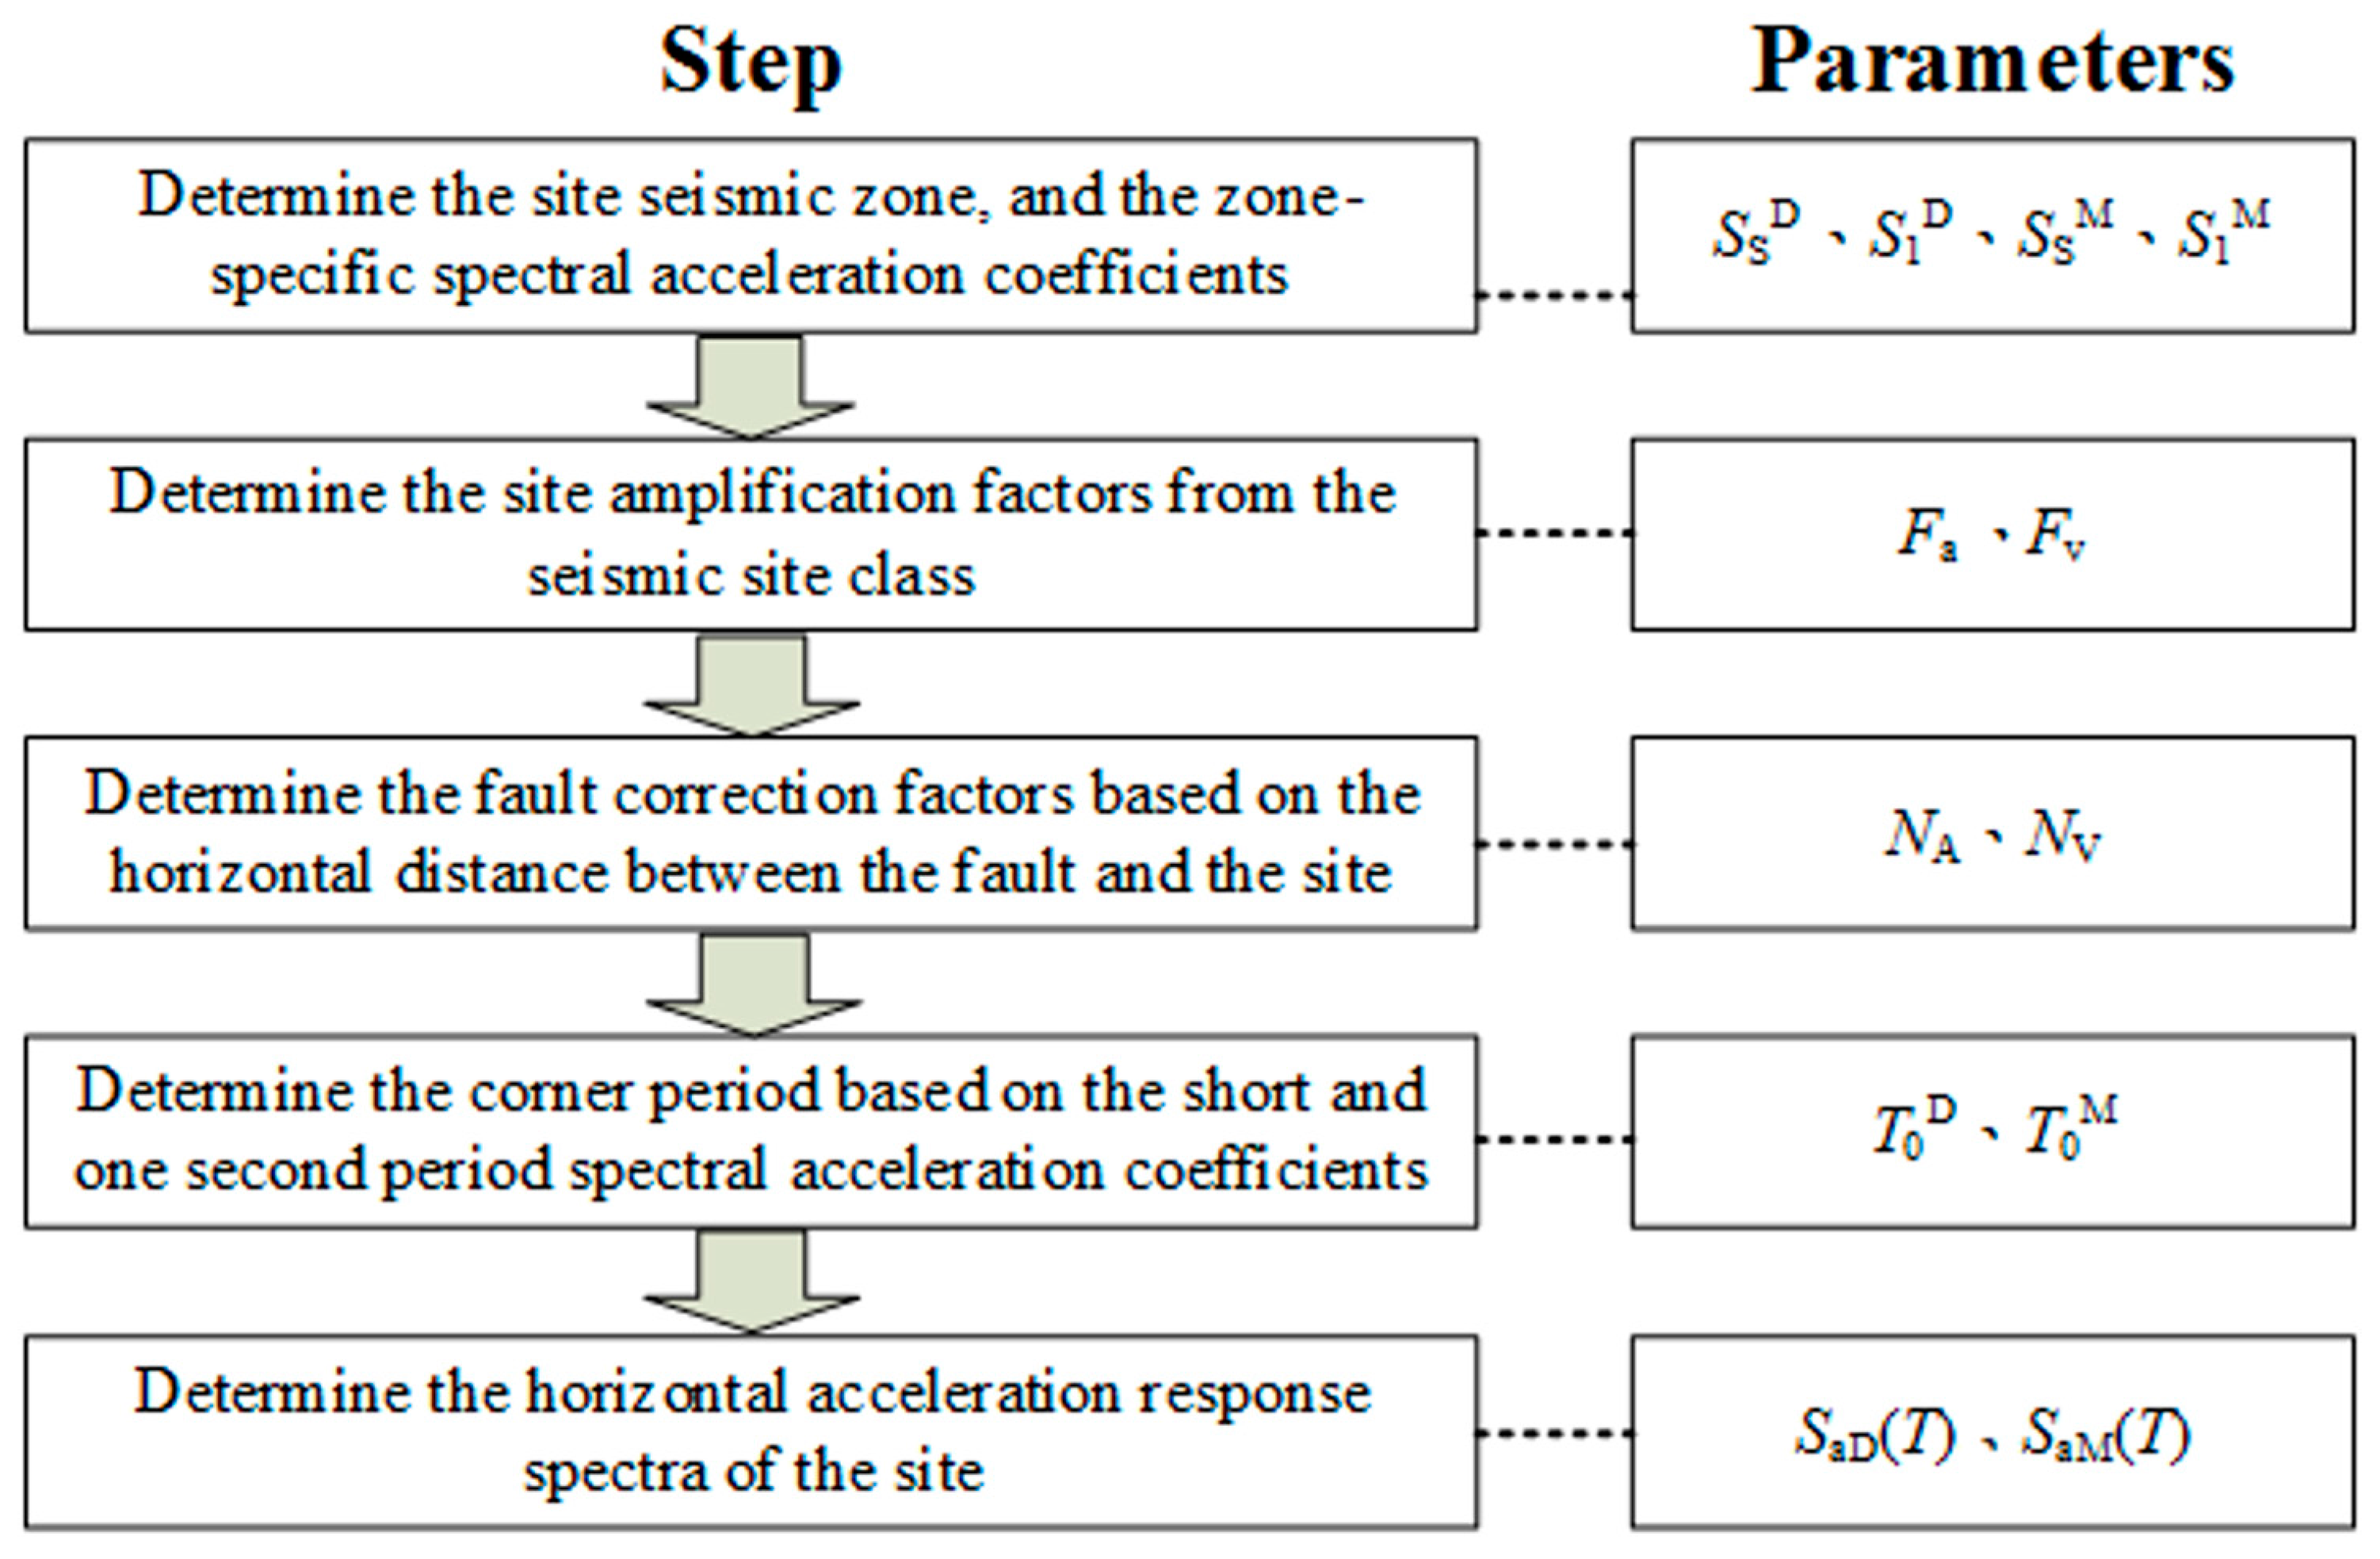
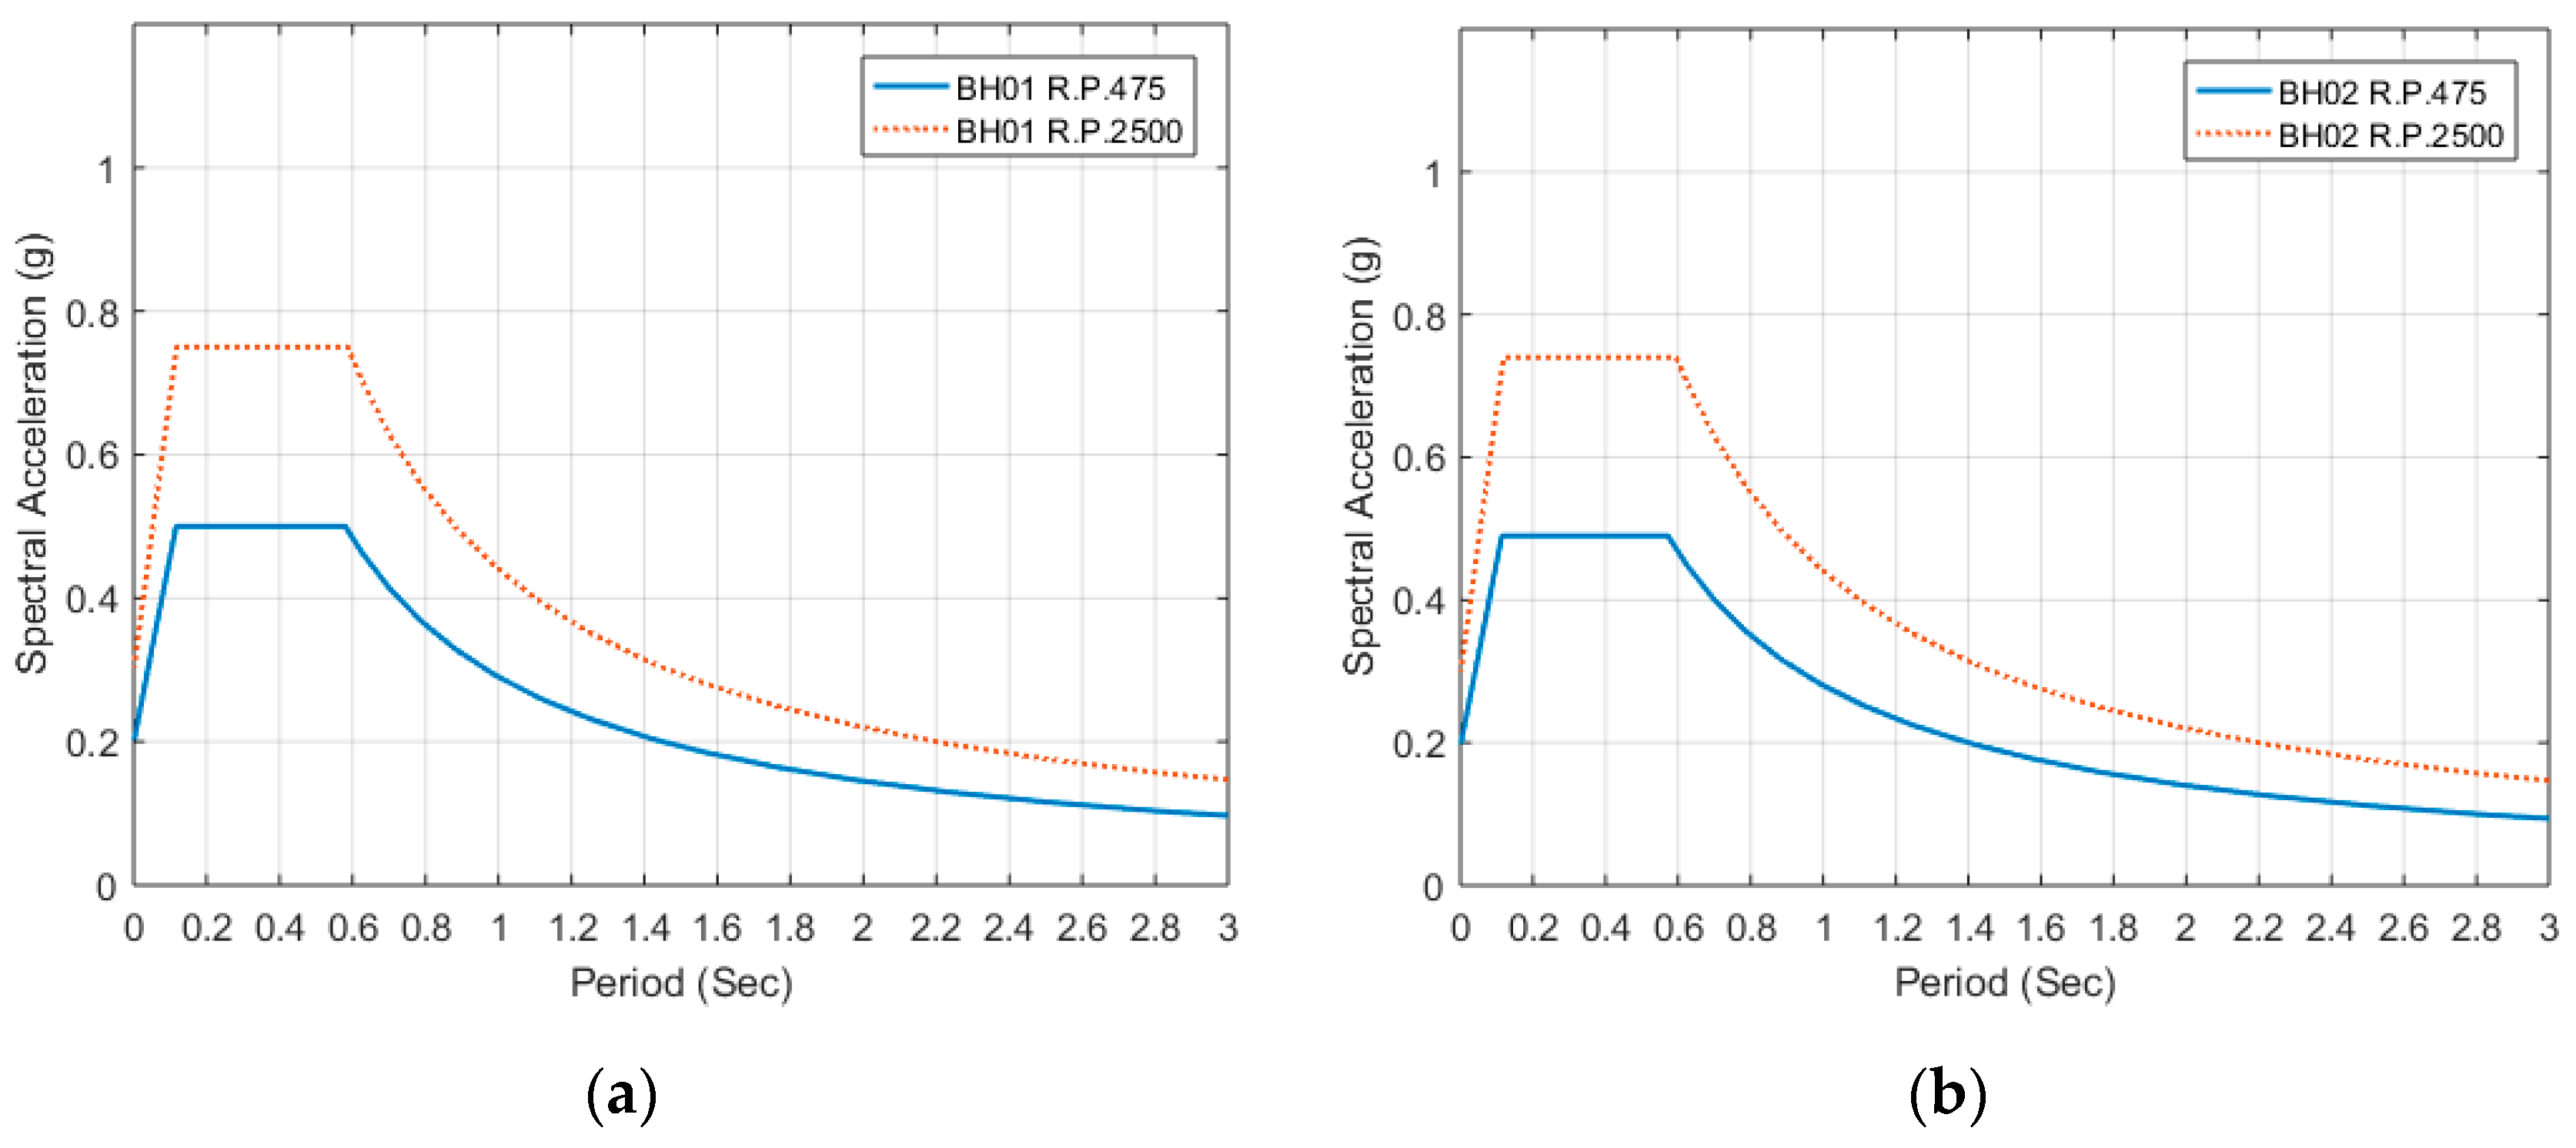
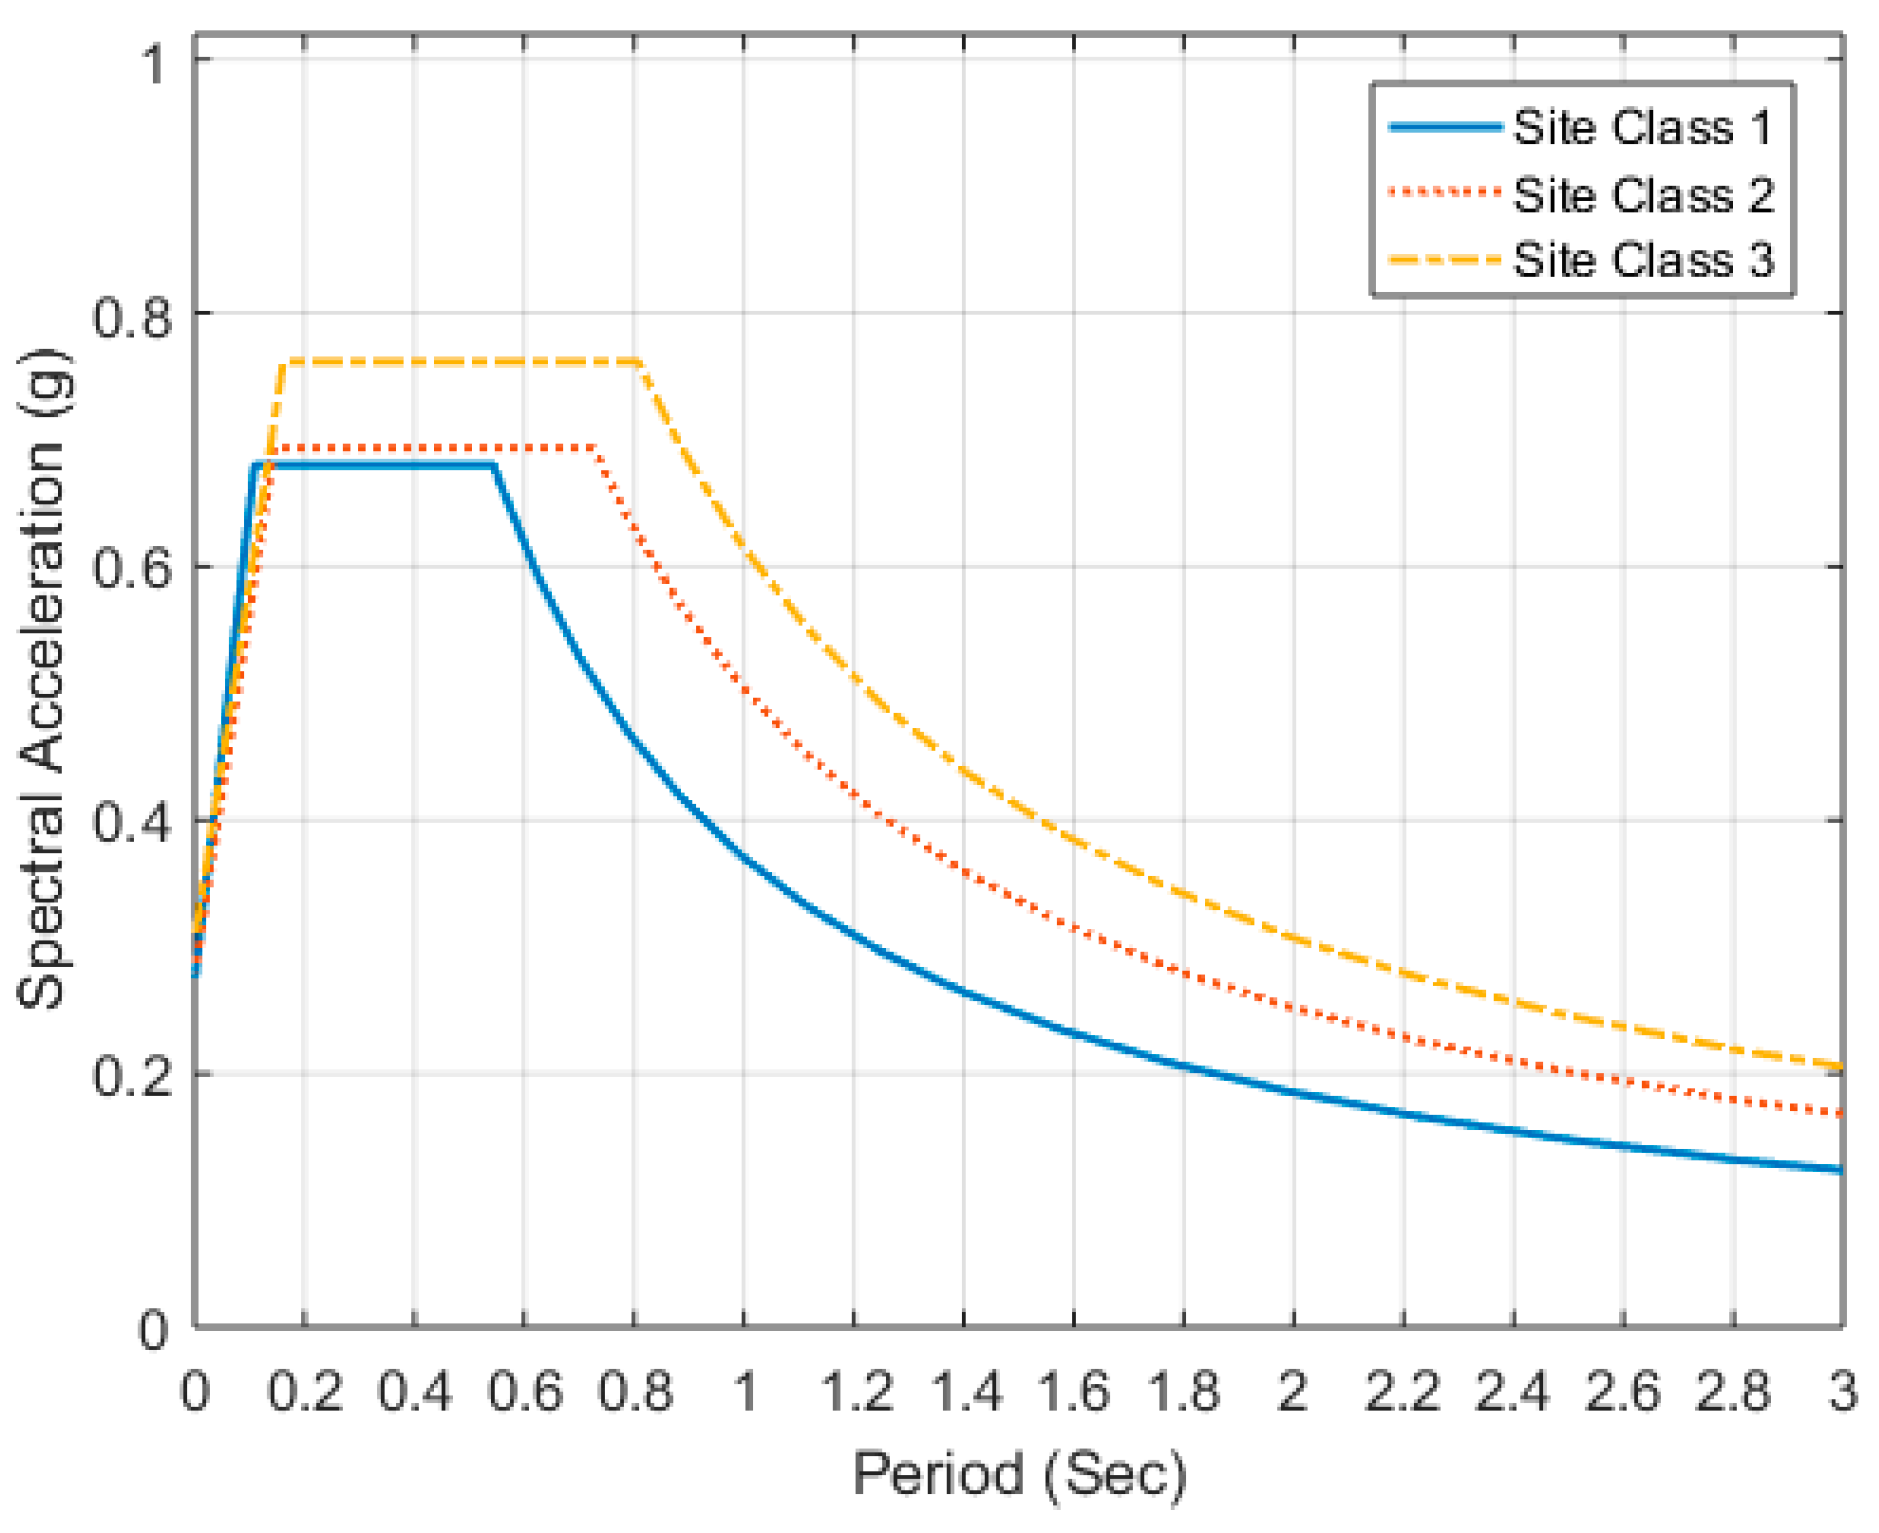
From the bedrock spectral acceleration coefficients, the site-specific ground motion parameters such as the short-period spectral acceleration coefficients (SaS, for either DBE or MCE) and the one-second-period spectral acceleration coefficients (Sa1, for either DBE or MCE) can also be obtained. Using the uniform hazard concept with the short- and one-second-period spectral acceleration coefficients, the design earthquake acceleration response spectrum SaD and maximum considered earthquake acceleration response spectrum SaM can be achieved:
S aD ( M ) ( T ) = { S aS ( 0.4 + 3 T / T 0 )   ; T 0.2 T 0 S aS    ; 0.2 T 0 < T T 0 S a 1 / T    ; T 0 < T ,
where the corner period T0 delineate the constant-acceleration and constant-velocity spectral region, defined as T0 = Sa1/
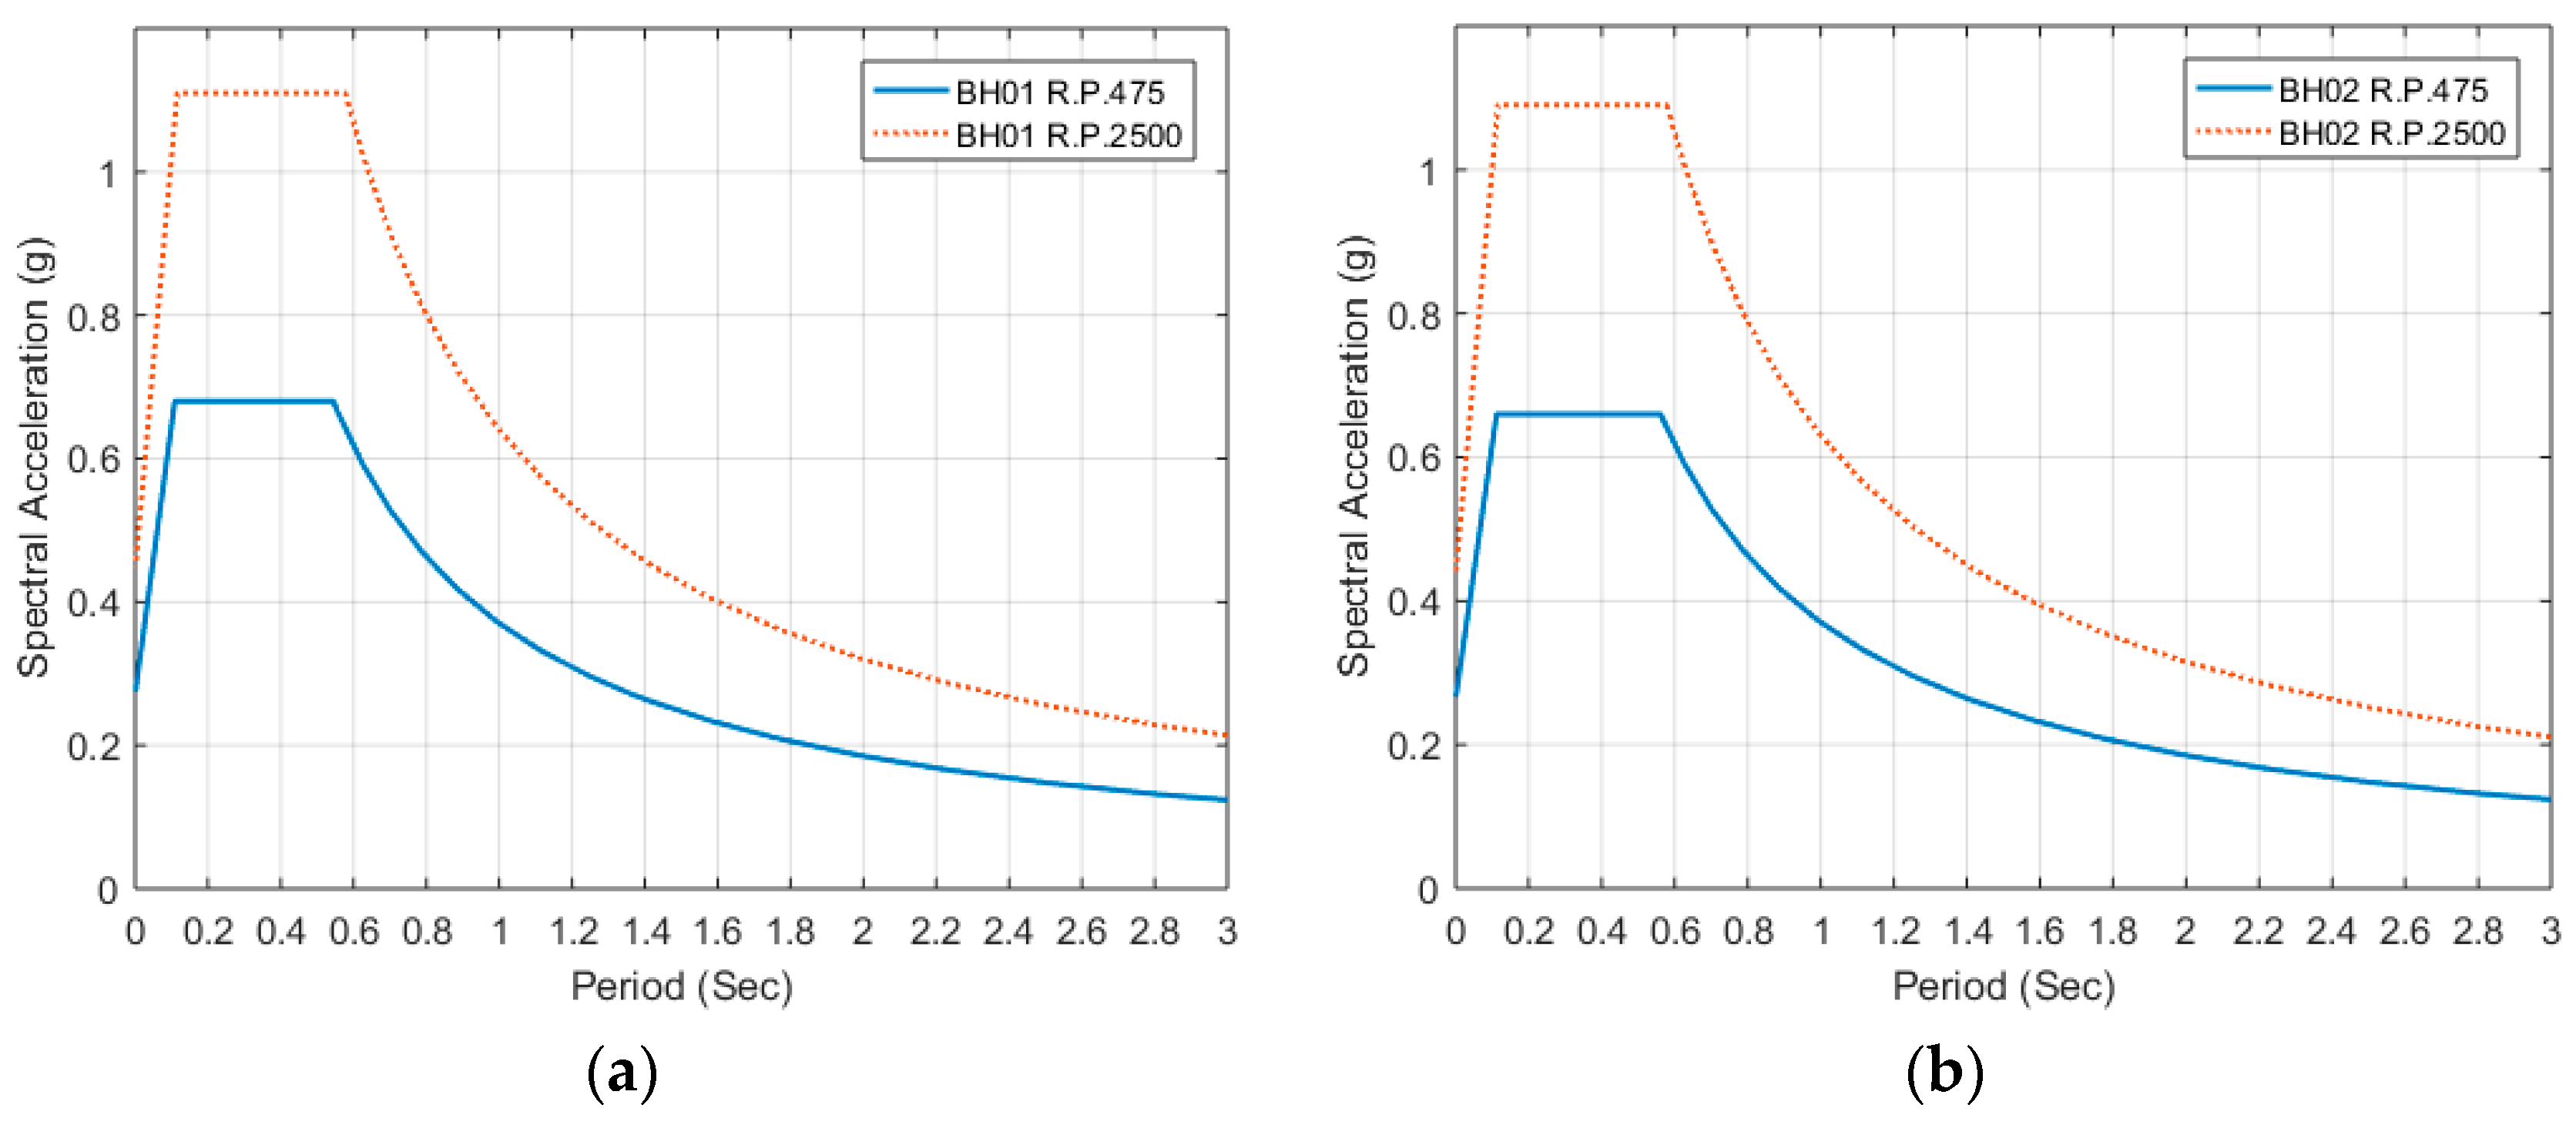
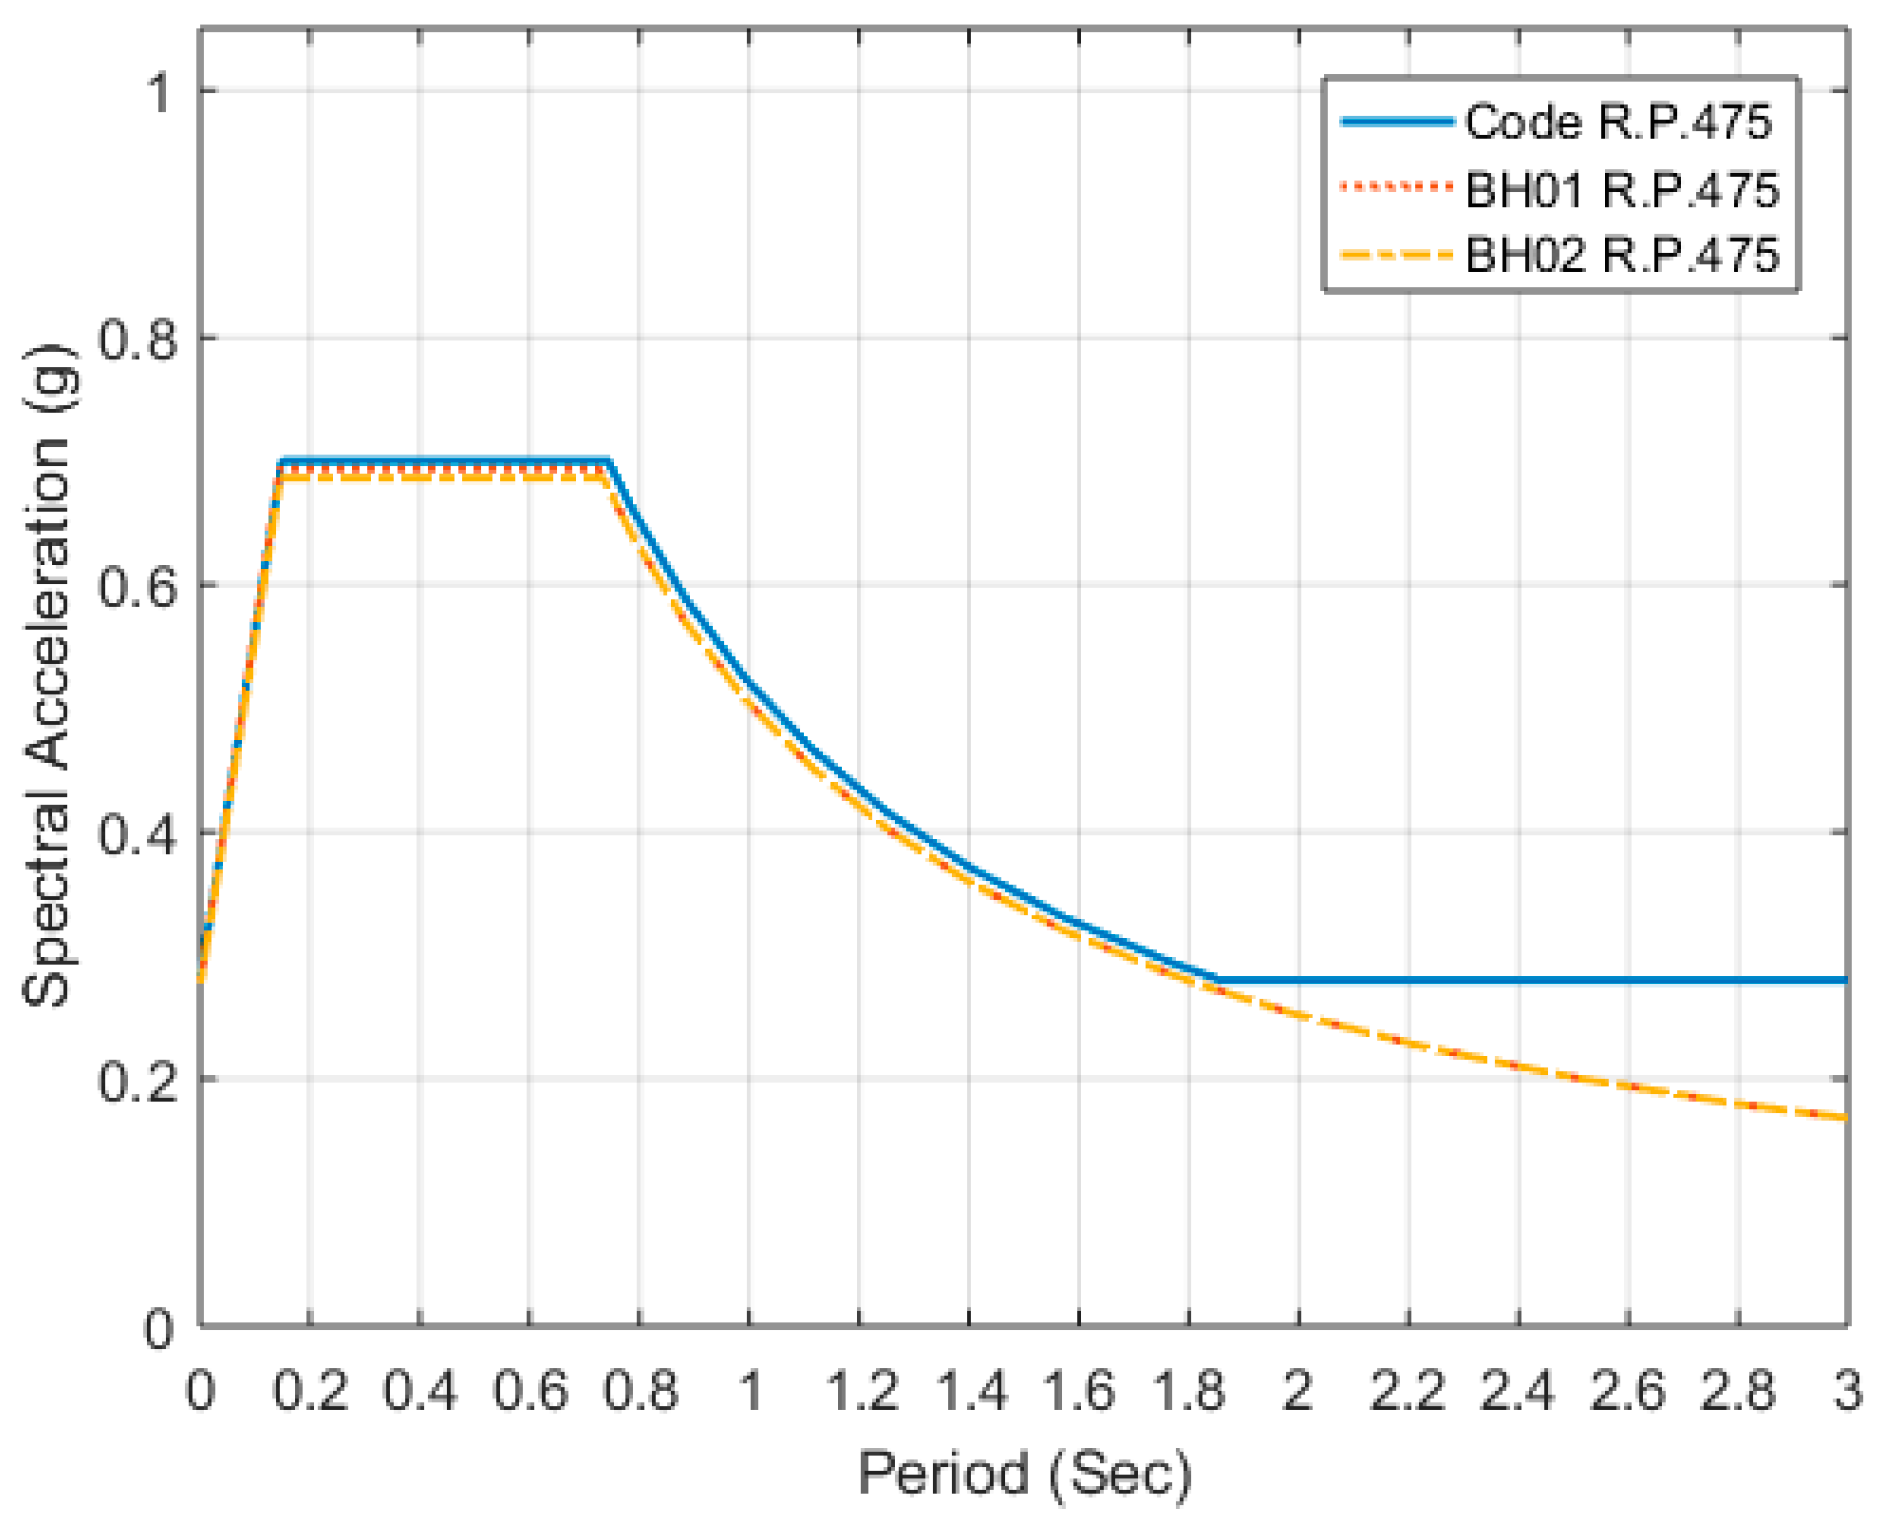
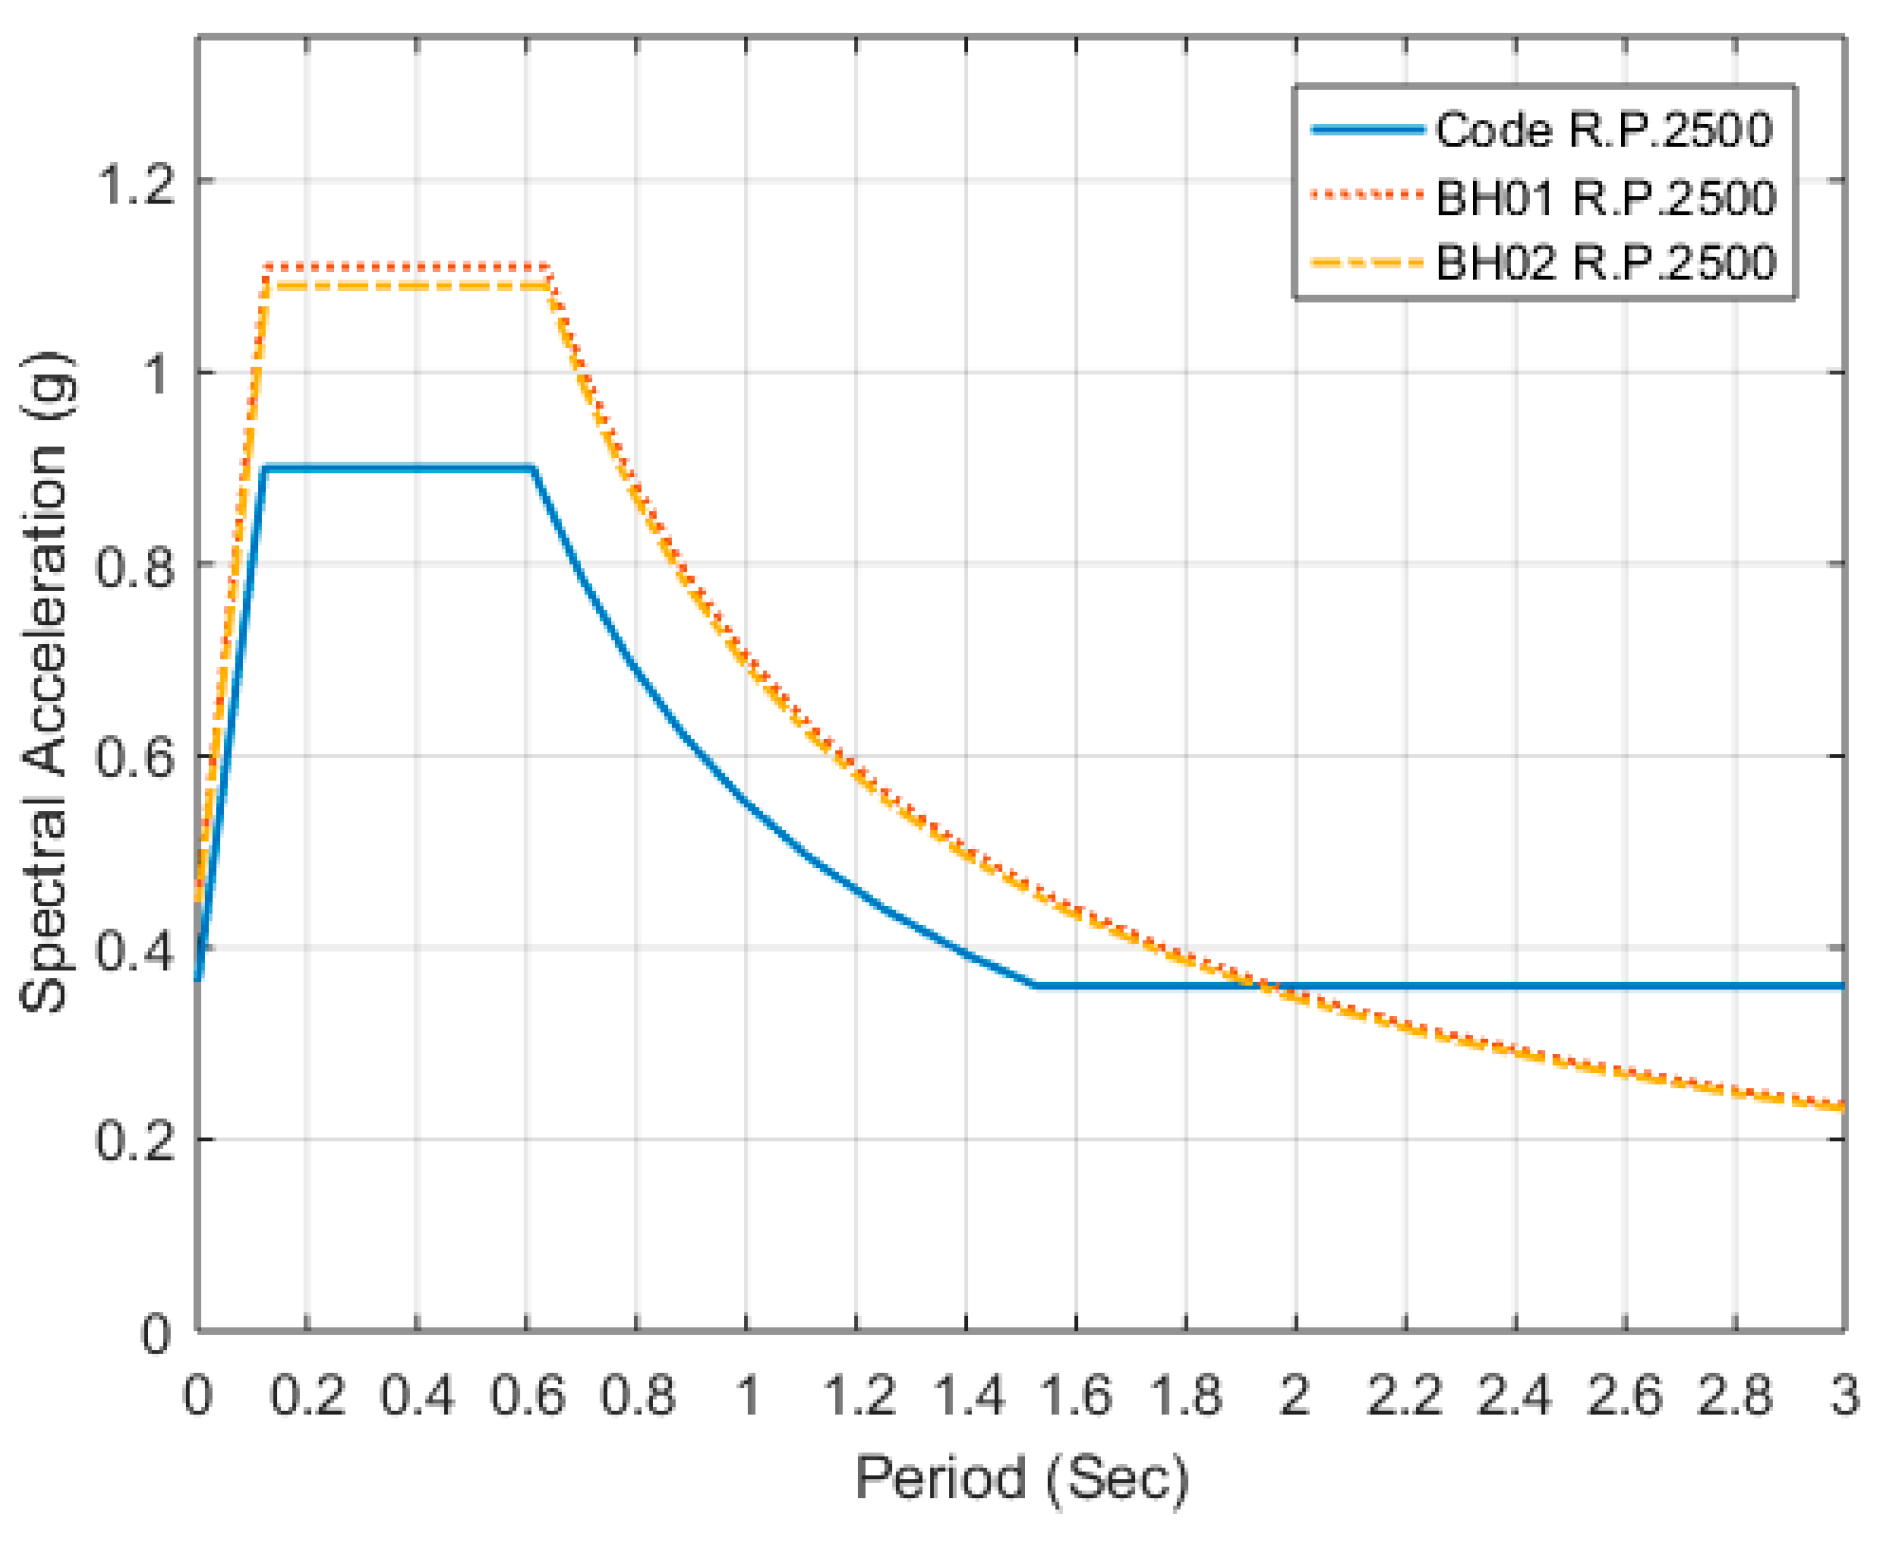
SaS. The design earthquake acceleration response spectra SaD and the maximum considered earthquake acceleration response spectra SaM using the PSHA results of median values and values corrected to a 1.5 standard deviations are depicted in Figure 7 and Figure 8, respectively. Since earthquake data from hard site station are used in the seismic hazard analysis, it is important to note that these response spectra do not yet take the worksite soil conditions into consideration. Based on the seismic design response spectra at the rock sites, the associated spectrum compatible ground motions can be generated as the input excitation for the site response analysis for a wind farm with investigated geological data.

4. Initial Seismic Force Assessment Analysis

This study uses static analysis methods from Taiwan’s Seismic Design Specifications and Commentary of Buildings [9] to carry out initial seismic force assessment analysis on hypothetical NREL OC3 reference turbines [11,12] situated in Taiwan’s Chang-Bin offshore wind farm. Basic information on NREL OC3 reference turbines is shown in Table 7. The supporting structure is divided into the monopile and the tower. The mudline is assumed to be at an elevation of 0 m. The top of the monopile structure is located at an elevation of 30 m. The diameter of the monopile is 6 m, and its wall thickness is 0.06 m. Above 30 m is the tower. The tower is a linearly changing tube structure. It has a diameter of 6 m at the base, and tube thickness of 0.027 m. At the top, the tower has a diameter of 3.87 m and a tube thickness of 0.019 m.

4.1. Specified Earthquake Response Spectrum

Figure 9 shows a flow chart reorganized from Taiwan’s Seismic Design Specifications and Commentary of Buildings [9] (also referred to as the Code) for deriving the horizontal acceleration response spectrum. The Code gives the zone-specific design and maximum considered horizontal spectral acceleration coefficients at oscillator periods of 0.3 s (SS) and 1.0 s (S1) with structural damping ratio of 5%. Administrative units, such as villages, towns, and cities, are used as the units for dividing seismic zones in the Code. The seismic zone closest to the Chang-Bin offshore wind farm is Fangyuan Township in Changhua County. In this seismic zone, the zone-specific short-period design horizontal spectral acceleration coefficient S S D , the one-second-period design horizontal spectral acceleration coefficient S 1 D , the short-period maximum considered horizontal spectral acceleration coefficient S S M , and the one-second-period maximum considered horizontal spectral acceleration coefficient S 1 M , are S S D = 0.7 , S 1 D = 0.4 , S S M = 0.9 and S 1 M = 0.5 , respectively. Table 8 compares seismic coefficients from the Code with coefficients from the seismic hazard analysis. It is evident that the design horizontal spectral acceleration coefficients from the 1.5 standard deviation seismic hazard analysis are very similar to those given in the Code. However, the maximum considered horizontal spectral acceleration coefficients from the seismic hazard analysis are larger than those given in the Code. The 1.5 standard deviation seismic hazard analysis results are used for the following comparisons.
The zone-specific horizontal spectral acceleration coefficients from the Code are based on the assumption that attenuation relationships for rock are used. If the site soil conditions are different from this assumption, the site amplification factors from the seismic site class are necessary to be applied for correction. The seismic site class is determined by the average shear wave velocity in the soil within 30 m of the mudline (VS30) at the site, as shown in Table 9. The site amplification factors are determined by the site class and the horizontal spectral acceleration coefficients of the seismic zone as shown in Table 10 and Table 11. According to the soil profile and soil conditions at the Chang-Bin offshore wind farm (Table 1 and Table 2), the average shear wave velocity within 30 m of the mudline (VS30) is in the range 183.2~195.2 m/s. According to the Code, it is a Class II (normal ground) site. The site amplification factors for short-period oscillators in class II sites is F a = 1.0 ( S S D = 0.7 and S S M = 0.9 ), and the site amplification factors for one-second-period oscillators is F v = 1.0 ( S 1 D = 0.4 ) and 1.1 ( S 1 M = 0.5 ).
There is no Class I active fault within 15 km of the Chang-Bin offshore wind farm, therefore, the fault correction factors NA and NV do not need to be applied. Using Equations (5) and (6), the Chang-Bin offshore wind farm short-period and one-second-period spectral acceleration coefficients can be calculated. The short-period spectral acceleration coefficients are S DS = 0.7 and S MS = 0.9 , and the one-second-period spectral acceleration coefficients are S D 1 = 0.52 and S M 1 = 0.55 .
S DS = S S D F a N A ;   S MS = S S M F a N A ;   N A 1.0 ,
S D 1 = S 1 D F v N V ;   S M 1 = S 1 M F v N V ;   N V 1.0 ,
Using the seismic force coefficients described above and Equation (4), the Code-specified design horizontal acceleration response spectrum S aD ( T ) and the maximum considered horizontal acceleration response spectrum S aM ( T ) can be obtained. However, according to the Code, the values of these two response spectra cannot be lower than 0.4 S DS and 0.4 S MS , respectively. If the bedrock acceleration response spectra derived from the seismic hazard analysis are also corrected using the corresponding class II site amplification factors from Table 8 and Table 9, the corrected response spectra can be compared with the Code response spectra, as shown in Figure 10 and Figure 11. The design horizontal acceleration response spectra for BH01 derived from the seismic hazard analysis under three different seismic site classes are depicted in Figure 12. It is clear that soil conditions at the site have significant effects on the acceleration response spectra. This underscores the importance of obtaining representative soil profile and soil conditions at the site.

4.2. Code Static Analysis Method

The total seismic force applied to a structure in the Code static analysis method is calculated in terms of a base shear, and this calculated base shear can then be distributed over the height of the structure. To use the Code’s static analysis method, the site’s design and maximum considered horizontal acceleration response spectrum coefficients S aD and S aM needed to be obtained first using the natural period of the structure. After that, the minimum design seismic force V, the low-intensity earthquake design seismic force V*, and the maximum considered earthquake design seismic force VM can be calculated using the formulas provided in the Code. Finally, the largest value of V, V*, and VM is chosen as the design base shear of the structure.

4.2.1. Structural Period

The natural period of an offshore wind turbine can be calculated by considering the Code’s recommended empirical formulas for steel structures or other buildings as shown in Equations (7) and (8):
T = 0.085 h n 3 / 4 ,
T = 0.050 h n 3 / 4 ,
where h n (m) is the height of the structure. The Code explains that the natural period of a structure can also be calculated using other proper structural analysis methods. However, the natural period T obtained should not be larger than 1.4 times the value of the natural period as calculated with the empirical formula. Prowell and Veers [23] collected wind turbine data. Assuming an exponential relationship between the turbine’s natural period and its height, the result of fitting the data is Equation (9):
T = 0.015 h n 1.183 best   fit   T = 0.022 h n 1.05 lower   bound
Figure 13 is a comparison of Equations (7) and (9). It can be seen that the formula in the Code will underestimate the wind turbine’s natural period. The difference becomes more obvious as turbine height increases. The vertical distance between the mudline and the center of gravity of the NREL OC3 wind turbine nacelle h n is approximately 110 m. Using Equation (7), the calculated natural period is approximately 2.89 s.

4.2.2. Minimum Design Seismic Force

Minimum design seismic force V is calculated using Equation (10):
V = S aD I 1.4 α y F u W ,
In order to reflect the decreased seismic force requirements resulting from the increased damping ratio due to the structure soil interaction, the Code recommends that the S aD / F u term in Equation (10) be corrected using Equation (11). After correction, the term is called ( S aD / F u ) m :
( S aD / F u ) m = { S aD / F u ; S aD / F u 0.3 0.52 S aD / F u + 0.144 ; 0.3 < S aD / F u < 0.8 0.7 S aD / F u ; S aD / F u 0.8 ,
Thus, the minimum design seismic force V is:
V = I 1.4 α y ( S aD F u ) m W ,
where S aD is the site’s design horizontal acceleration response spectrum coefficient; I is the important factor; W is the overall static load of the structure; α y is the initial yield seismic force magnification multiplier; and F u is the structure seismic force reduction factor.
The value of the initial yield seismic force magnifier α y is determined by the design method and the load combination. For steel structures using the load and resistance factor design method, α y = 1.0 . The structure seismic force reduction factor F u is related to the structure’s ductility capacity R and the structure’s natural period T. The F u value of brittle structures is close to 1. According to the Code, the structure seismic force reduction factor for structures with long periods is as shown in Equation (13):
F u = 1 + ( R 1 ) 1.5 ,
In this case, the ductility capacity of water tank R = 1.2 is used for reference, and the structure system seismic force reduction factor F u = 1.1333 can be obtained.
The Code assigns different important factors I to structures based on their applications and occupancy categories. If a structure must maintain functionality after a seismic disaster in order to serve in public rescue functions, its important factor is I = 1.5 . The important factor is I = 1.25 for public buildings, and I = 1.0 for other general buildings. Currently, the onshore wind turbines in Taiwan are typically designed with I = 1.5 . However, the classification of offshore wind turbines is still up for discussion. In this case study, an important factor of I = 1.5 is used.

4.2.3. Design Seismic Force

In order to prevent structures with high ductility from yielding in low intensity earthquakes, the minimum design seismic force in Equation (12) should not be lower than the low-intensity earthquake design seismic force V*:
V * = I F u 4.2 α y ( S aD F u ) m W ,
Since the structure of offshore wind turbines is different from typical buildings—they have fewer degree of static indeterminacy, and lower ductility capacity R—the design seismic force will not be controlled by the low-intensity earthquake design seismic force. Moreover, in order to avoid structures collapse during a maximum considered design earthquake event, the minimum design seismic force in Equation (12) should not be lower than the maximum considered earthquake design seismic force VM:
V M = I 1.4 α y ( S aM F uM ) m W ,
where S aM is the site’s maximum considered horizontal acceleration response spectrum coefficient; and F uM is the structure seismic force reduction factor slightly different from F u . For long-period structures, F uM = R . Thus, in this case, F uM = 1.2 . In addition, the value of S aM / F uM from Equation (15) is corrected using Equation (11) to obtain ( S aM / F uM ) m .
Table 12 is the comparison of the minimum design seismic force V, the low-intensity earthquake design seismic force V*, and the maximum considered earthquake design seismic force VM calculated from the horizontal acceleration response spectrum coefficients obtained from Figure 10 and Figure 11 using Equations (12)–(15). The largest of the three values is the design seismic force. From Table 10, it can be seen that if the Code static analysis method is used, the design seismic force is always controlled by the maximum considered earthquake design seismic force. Table 5 shows that the total static load W of an NREL OC3 reference turbine is approximately 873 t. Thus, the calculated design horizontal seismic forces are 280.58 t, 189.88 t, and 186.91 t, respectively.

4.3. Discussions

The analysis above shows that, when using the static analysis method from Taiwan’s Seismic Design Specifications and Commentary of Buildings [9] to determine the design seismic force requirement for an offshore wind turbine, it is necessary to first determine its natural period T, ductility capacity R, and important factor I. However, whether or not the values and equations provided and recommended by the Code are suitable for use in the offshore wind turbine design seismic force calculation is still a question that requires further analysis and discussion. The Code’s empirical natural period formulas clearly underestimates the natural period of offshore wind turbines as it serves to give a conservative value to carry out the simplified static analysis method.
When determining the design seismic forces for structures, it usually considers: (1) the seismic risk within the useful life of the structure; (2) the value and construction cost of the structure; and (3) the losses associated with destruction of the structure, such as environmental impact, personal injury, economic losses, etc. Safety is the first consideration when designing earthquake-resistant onshore structures, and it is hoped that this objective can be achieved at a reasonable cost. Therefore, Taiwan’s Seismic Design Specifications and Commentary of Buildings [9] requires that structures stay within their elastic limits during low-intensity earthquakes; the plastic deformation is allowable during the design earthquake, but the ductility requirement should not exceed the ductility capacity; the specified ductility capacity can be reached during the maximum considered earthquake, but the structure should not collapse. The design earthquake uses a 475-year return period with a 50-year exceedance probability of approximately 10%. The maximum considered earthquake uses a 2500-year return period with a 50-year exceedance probability of approximately 2%.
However, offshore wind turbines are not public buildings by nature, nor are they normally used by personnel for daily work. The design objective of the supporting structure is to maintain the normal operation of the offshore wind turbine. Generally speaking, the basic requirement of the supporting structure is that the permanent tilt of the foundation shall not exceed 0.5° within the 20-year useful life of the offshore wind turbine. In addition, the risks of supporting structure failure, such as environmental, personnel, and economic losses are also less than those associated with onshore structures. Therefore, the seismic design of the offshore wind turbine structure is usually optimized to financial considerations. There is probably room to discuss whether or not it is necessary to follow the seismic design requirements of Taiwan’s onshore structures, in which the 475- and 2500-year return period earthquakes are chosen to determine the earthquake response spectra. When the Code static analysis method is used, the seismic design of the monopile supporting structures is all controlled by the 2500-year return period maximum considered earthquake.
In addition, offshore wind turbines are long-period structures. If the recommendations of Taiwan’s Seismic Design Specifications and Commentary of Buildings [9] are followed, their design and maximum considered horizontal acceleration response spectra should not be less than 0.4 S DS and 0.4 S MS . Figure 10 and Figure 11 clearly show that the acceleration coefficients of long-period structures are always limited by this condition and fall on the flat section of the response spectra. Assuming an offshore wind turbine’s natural period is 3 s, compared to the response spectra proposed in this study, the Code overestimates the acceleration coefficients by at least 30%. This may cause the design of offshore wind turbine supporting structures to be too conservative.
The soil condition at offshore wind farm is also very important to consider in the seismic design of offshore wind turbine. The effects of soil–structure interaction not only increase the natural period, but also increase the damping of the offshore wind turbine. In other words, the effects of soil–structure interaction lower the seismic force of the offshore wind turbine. In addition, the soil condition can also affect the soil’s non-linear amplification effect. The Code handles this with a rough site amplification factor based on the site class and the horizontal spectral acceleration coefficients of the worksite. If there is sufficient soil data, a site response analysis can be carried out to obtain the seismic forces of the ground surface (or seabed surface) and the underlying layers at the worksite for a more precise seismic analysis.

5. Conclusions

In this paper, the relevant seismic and geological data related to the Chang-Bin offshore wind farm in Taiwan Strait are collected, and the probabilistic seismic hazard analyses are carried out to obtain seismic hazard curves. The seismic response spectrum for Chang-Bin offshore wind farm in Taiwan Strait is proposed using uniform hazard concepts. The results of seismic hazard analyses show that the earthquake load shall be considered in the design of supporting structures of offshore wind turbines in Chang-Bin offshore wind farm, and the current Code may underestimate the maximum considered horizontal spectral acceleration coefficients. In addition, as Taiwan lacks design specifications for offshore engineering, currently the Code is the only available reference when carrying out seismic analyses of offshore wind turbines, in which the performance requirements are for onshore structures, and the 475- and 2500-year return periods earthquakes are considered. To explain the limitations of using current Code analysis methods in offshore wind farm seismic force considerations, this study performed an initial seismic force assessment using the Code’s static analysis method on a hypothetical NREL OC3 wind turbine located at Chang-Bin offshore wind farm in Taiwan Strait. Preliminary analysis indicates that applying the Code to offshore wind turbine supporting structures may cause their design to be overly conservative.
As coastal and marine geological data in Taiwan is incomplete, current seismic response spectra are constructed using the Taiwan’s Seismic Design Specifications and Commentary of Buildings [9]. The soil conditions and the seismic activities at the offshore wind farm are not reasonably considered in the design of offshore wind turbine. For future development of offshore wind farm in Taiwan, seismic hazard analyses at the offshore wind turbine sites are recommended. Based on the results of seismic hazard analyses, the site-specific seismic response spectra can be constructed, and the design seismic forces for offshore wind turbines can be determined more reasonably. In addition, because offshore wind turbines are not land-based structures designed to house people, and the risks of environmental, personnel, and economic losses associated with their failures are also relatively low. Therefore, it is questionable whether the same seismic performance requirements for Taiwan’s land-based structures should be applied in the design of offshore wind turbines. There may be some room for discussion here. It is recommended that designers of offshore wind turbine supporting structures choose design earthquake based on the functionality of the offshore wind turbines to prevent offshore wind turbine supporting structures from being designed too conservatively.

Acknowledgments

This research was supported by the Ministry of Science and Technology of Taiwan, MOST 105-3113-E-006-011-CC2.

Author Contributions

Yu-Shu Kuo and Yu-Kai Wang jointly conceived the study. Juin-Fu Chai and Yu-Wen Chang carried out the PSHA analysis. Yu-Shu Kuo and Yu-Kai Wang collected and analyzed data with the help of Ti-Ying Huang. Yu-Kai Wang wrote the main paper. Yu-Shu Kuo supervised the study and edited the manuscript.

Conflicts of Interest

The authors declare no conflict of interest.

References

  1. Umar, A.B.; Ishihara, T. Seismic Load Evaluation of Wind Turbine Support Structures Considering Low Structural Damping and Soil Structure Interaction; European Wind Energy Association: Copenhagen, Denmark, 2012. [Google Scholar]
  2. Asareh, M.A.; Schonberg, W.; Volz, J. Fragility analysis of a 5-MW NREL wind turbine considering aero-elastic and seismic interaction using finite element method. Finite Elem. Anal. Des. 2016, 120, 57–67. [Google Scholar] [CrossRef]
  3. Germany’s Federal Maritime and Hydrographic Agency. Design of Offshore Wind Turbines; Federal Maritime and Hydrographic Agency: Rostock, Germany, 2008. [Google Scholar]
  4. Det Norske Veritas AS. Design of Offshore Wind Turbine Structures; DNV-OS-J101; Det Norske Veritas AS: Høvik, Norway, 2014. [Google Scholar]
  5. GL Renewables Certification. Guideline for the Certification of Offshore Wind Turbines; GL Renewables Certification: Hamburg, Germany, 2012. [Google Scholar]
  6. International Electrotechnical Commission. Wind Turbines—Part 1: Design Requirements; IEC 61400-1; International Electrotechnical Commission: Geneva, Switzerland, 2005. [Google Scholar]
  7. International Electrotechnical Commission. Wind Turbines—Part 3: Design Requirements for Offshore Wind Turbines; IEC 61400-3; International Electrotechnical Commission: Geneva, Switzerland, 2009. [Google Scholar]
  8. American Society of Civil Engineers/American Wind Energy Association. Recommended Practice for Compliance of Large Land-Based Wind Turbine Support Structures; American Wind Energy Association: Washington, DC, USA, 2011. [Google Scholar]
  9. Construction and Planning Agency. Seismic Design Specifications and Commentary of Buildings; Construction and Planning Agency: Taipei, Taiwan, 2011.
  10. International Standard Organization. Petroluem and Natural Gas Industries, Specific Requirements for Offshore Structures: Part 2: Seismic Procedures and Criteria; ISO 19901-2; International Standard Organization: Geneve, Switzerland, 2004. [Google Scholar]
  11. American Petroleum Institute. Seismic Design Procedures and Criteria for Offshore Structures; API RP 2EQ; American Petroleum Institute: Washington, DC, USA, 2014. [Google Scholar]
  12. Reiter, L. Earthquake Hazard Analysis: Issues and Insights; John Wiley & Sons, Ltd.: Hoboken, NJ, USA, 1991; Volume 20, p. 254. [Google Scholar]
  13. Jonkman, J.; Butterfield, S.; Musial, W.; Scott, G. Definition of A 5-MW Reference Wind Turbine for Offshore System Development; National Renewable Energy Laboratory: Golden, CO, USA, 2009.
  14. Jonkman, J.; Musial, W. Offshore Code Comparison Collaboration (OC3) for IEA Wind Task 23 Offshore Wind Technology and Deployment; National Renewable Energy Laboratory: Golden, CO, USA, 2010.
  15. Taiwan Power Company. Feasibility Study for the First Phase of Offshore Wind Project; Taiwan Power Company: Taipei, Taiwan, 2015. [Google Scholar]
  16. Kao, C.C. A Planning of Offshore Meteorological Mast (i); Taiwan Ocean Research Institute: Kaohsiung, Taiwan, 2010. [Google Scholar]
  17. Wen, G.L.; Lin, Z.H.; Huang, B.S.; Zheng, S.N. Seismic Assessment in Wuqiu Area (Phase One); Chinese Geophysical Society: Beijing, China, 1999. [Google Scholar]
  18. Zhu, J.F.; Xu, X.W.; Huang, Z.L.; Wu, J.C.; Zhang, X.K. Active Faults Exploration and Seismic Hazard Assessment in Fuzhou City; Science Press: Beijing, China, 2005. [Google Scholar]
  19. Cornell, C.A. Engineering seismic risk analysis. Bull. Seismol. Soc. Am. 1968, 58, 1583–1606. [Google Scholar]
  20. Gutenberg, B.; Richter, C.F. Seismicity of the Earth and Associated Phenomena; Princeton University Press: Princeton, NJ, USA, 1954. [Google Scholar]
  21. Campbell, K.W. Near-source attenuation of peak horizontal acceleration. Bull. Seismol. Soc. Am. 1981, 71, 2039–2070. [Google Scholar]
  22. Jean, W.Y.; Chang, Y.W.; Wen, K.L.; Loh, C.H. Early estimation of seismic hazard for strong earthquakes in taiwan. Nat. Hazards 2006, 37, 39–53. [Google Scholar] [CrossRef]
  23. Prowell, I.; Veers, P. Assessment of Wind Turbine Seismic Risk: Existing Literature and Simple Study of Tower Moment Demand; Sandia National Laboratories: Carlsbad, NM, USA, 2009.
Figure 1. Taiwan’s Chang-Bin offshore wind farm and drill sites.
Energies 09 01036 g001
Figure 2. Epicenter distribution from the Taiwan Strait earthquake database.
Energies 09 01036 g002
Figure 3. (a) Shallow and (b) deep earthquake zonation map used for PSHA.
Energies 09 01036 g003
Figure 4. The hard site attenuation models.
Energies 09 01036 g004
Figure 5. PSHA analysis results (median values).
Energies 09 01036 g005
Figure 6. PSHA analysis results (corrected to 1.5 standard deviations).
Energies 09 01036 g006
Figure 7. Taiwan Chang-Bin offshore wind farm: (a) BH01; and (b) BH02 design earthquake and maximum considered earthquake acceleration response spectra (median).
Energies 09 01036 g007
Figure 8. Taiwan Chang-Bin offshore wind farm: (a) BH01; and (b) BH02 design earthquake and maximum considered earthquake acceleration response spectra (corrected to 1.5 standard deviations).
Energies 09 01036 g008
Figure 9. Process flowchart for deriving the horizontal acceleration response spectrum, from Taiwan’s Seismic Design Specifications and Commentary of Buildings [9].
Energies 09 01036 g009
Figure 10. Comparison of spectral acceleration for design basis earthquake.
Energies 09 01036 g010
Figure 11. Comparison of spectral acceleration for maximum considered earthquake.
Energies 09 01036 g011
Figure 12. Site class influence on BH01 response spectra.
Energies 09 01036 g012
Figure 13. Comparison of the first natural period from different equations.
Energies 09 01036 g013
Table 1. BH-01 (Taiwan Ocean Research Institute) simplified soil layers, adapted from Kao [16].
LayerDepth Z (m) (Elevation)Soil TypeAverage SPT-Nγ (kN/m3)φ
10.00~10.80SP-SM 178.529.5
210.80~26.10SM 2289.532.0
326.10~47.20SM329.632.3
447.20~71.50SM429.533.0
571.50~73.80CL 3288.531.0
673.80~80.00SM441.0533.0
1 Poorly graded sand with silt; 2 Silty sand; 3 Low plasticity clay.
Table 2. BH-02 (Taiwan Ocean Research Institute) simplified soil layers, adapted from Kao [16].
LayerDepth Z (m) (Elevation)Soil TypeAverage SPT-Nγ (kN/m3)φ
10.00~7.80SM-SP 189.329.5
27.80~19.30SM 2139.631.1
323.00~33.30SM279.232.0
433.30~48.60CL 3229.331.5
548.60~57.40SM439.333.0
657.40~60.50CL238.531.5
760.50~71.20SM428.733.0
871.20~75.40CL279.731.5
975.40~80.00SM469.133.0
1 Poorly graded sand with silt; 2 Silty sand; 3 Low plasticity clay.
Table 3. G-R magnitude–recurrence relationship parameters and upper magnitude for each source zone.
Source ZoneG-R Magnitude–Recurrence Relationship ParametersUpper Magnitude mu
abN (m = 4.5)mu,r 1mu,c 2
DD014.0590.8302.1137.307.37
DD024.7370.9263.7057.207.33
DD034.5410.9302.2747.007.08
DD044.6900.9632.2687.107.21
DD053.3200.8000.5236.997.20
DS011.4210.4720.1987.507.56
DS024.8130.9593.1387.207.35
DS035.2480.9658.0037.107.46
DS044.2780.9181.3997.107.10
DS055.2410.9866.3507.507.51
DS064.7770.9104.8176.907.17
DS073.6440.7931.1926.907.10
DS083.7690.7711.9907.107.28
DS094.0090.8571.4166.906.96
DS104.1620.8382.4597.307.45
DS115.1631.0134.0367.007.11
DS122.8380.6940.5217.007.09
DS133.7360.8380.9226.606.75
DS141.4160.5170.1237.507.55
DS152.8050.9960.0215.506.50
1 Upper magnitude from record; 2 Upper magnitude calculated using cumulative energy method.
Table 4. Constant coefficients for the attenuation models and standard deviations of the natural logarithm of ground motion parameters.
Y r b 1 b 2 b 3 b 4 b 5 σ l n   E r r
PGA0.00281.73312.06390.09990.77190.7815
SaS (T = 0.3 s)0.00791.72532.04890.11990.78500.7201
Sa1 (T = 1.0 s)0.00271.77312.04190.11540.77140.7018
Table 5. Taiwan Chang-Bin offshore wind farm’s bedrock spectral acceleration coefficients at oscillator periods of 0.3 s and 1.0 s for 475 years and 2500 years return period earthquake (median).
WorksiteEN475 Year2500 Year
S S D S 1 D S S M S 1 M
BH01175,290.12,656,259.60.500.290.750.44
BH02172,724.62,652,211.90.490.280.740.44
Table 6. Taiwan Chang-Bin offshore wind farm’s bedrock spectral acceleration coefficients at oscillator periods of 0.3 s and 1.0 s for 475 years and 2500 years return period earthquake (corrected to 1.5 standard deviations).
WorksiteEN475 Year2500 Year
S S D S 1 D S S M S 1 M
BH01175,290.12,656,259.60.680.371.110.64
BH02172,724.62,652,211.90.660.371.090.63
Table 7. Gross properties for the NREL 5 MW baseline wind turbine [11,12].
ItemsProperties
Rating5 MW
Rotor orientation, configurationUpwind, 3 blades
ControlVariable speed, collective pitch
DrivetrainHigh speed, multiple-stage gearbox
Rotor, hub diameter126 m, 3 m
Hub height90 m 1
Cut-in, rated, cut-out wind speed3 m/s, 11.4 m/s, 25 m/s
Cut-in, rated rotor speed6.9 rpm, 12.1 rpm
Rated tip speed80 m/s
Overhang, shaft tilt, precone5 m, 5°, 2.5°
Rotor mass110,000 kg
Nacelle mass240,000 kg
Combined tower and monopile mass522,617 kg
Coordinate location of overall center of mass(−0.2 m, 0.0 m, 64.0 m 1)
1st tower fore-aft natural period3.09 s
1st tower side-to-side natural period3.21 s
1 Calculated from the mean sea level.
Table 8. Seismic parameters comparison for Taiwan Chang-Bin offshore wind farm.
Taiwan Chang-Bin Offshore Wind Farm S S D S 1 D S S M S 1 M
Seismic Design Specifications and Commentary of Buildings Changhua County, Fangyuan Township0.70.40.90.5
BH01 (TORI) (Median)0.50.290.750.44
BH02 (TORI) (Median)0.490.280.740.44
BH01 (TORI) (1.5 standard deviations)0.680.371.110.64
BH02 (TORI) (1.5 standard deviations)0.660.371.090.63
Table 9. Seismic site class [9].
Site ClassAverage Shear Wave Velocity in the Soil within 30 m below the Surface
Class I (hard ground)VS30 ≥ 270 m/s
Class II (normal ground)180 m/s ≤ VS30 < 270 m/s
Class III (soft ground)VS30 < 180 m/s
Table 10. Site amplification factor Fa [9].
Site ClassSeismic Zone Short-Period Horizontal Spectral Acceleration Coefficient S S ( S S D or S S M ) 1
S S 0.5 S S = 0.6 S S = 0.7 S S = 0.8 S S 0.9
Class I site1.01.01.01.01.0
Class II site1.11.11.01.01.0
Class III site1.21.21.11.01.0
1 Use straight line interpolation for intermediate values of S S .
Table 11. Site amplification factor Fv [9].
Site ClassSeismic Zone One-Second-Period Horizontal Spectral Acceleration Coefficient S 1 ( S 1 D or S 1 M ) 1
S 1 0.30 S 1 = 0.35 S 1 = 0.40 S 1 = 0.45 S 1 0.50
Class I site1.01.01.01.01.0
Class II site1.51.41.31.21.1
Class III site1.81.71.61.51.4
1 Use straight line interpolation for intermediate values of S 1 .
Table 12. Design seismic force comparison.
Hypothetical NREL OC3 at Taiwan Chang-Bin Offshore Wind Farm S a D S a M VV*VM
Figure 10Figure 11Equation (12)Equation (14)Equation (15)
Seismic Design Specifications and Commentary of Buildings response spectrum0.280.360.2647 W0.1000 W0.3214 W
BH01 response spectrum0.17410.24360.1646 W0.0622 W0.2175 W
BH02 response spectrum0.17410.23980.1646 W0.0622 W0.2141 W

