
Membrane Permeability Rates of Vanadium Ions and Their Effects on Temperature Variation in Vanadium Redox Batteries


Abstract
:1. Introduction
2. Results and Discussion
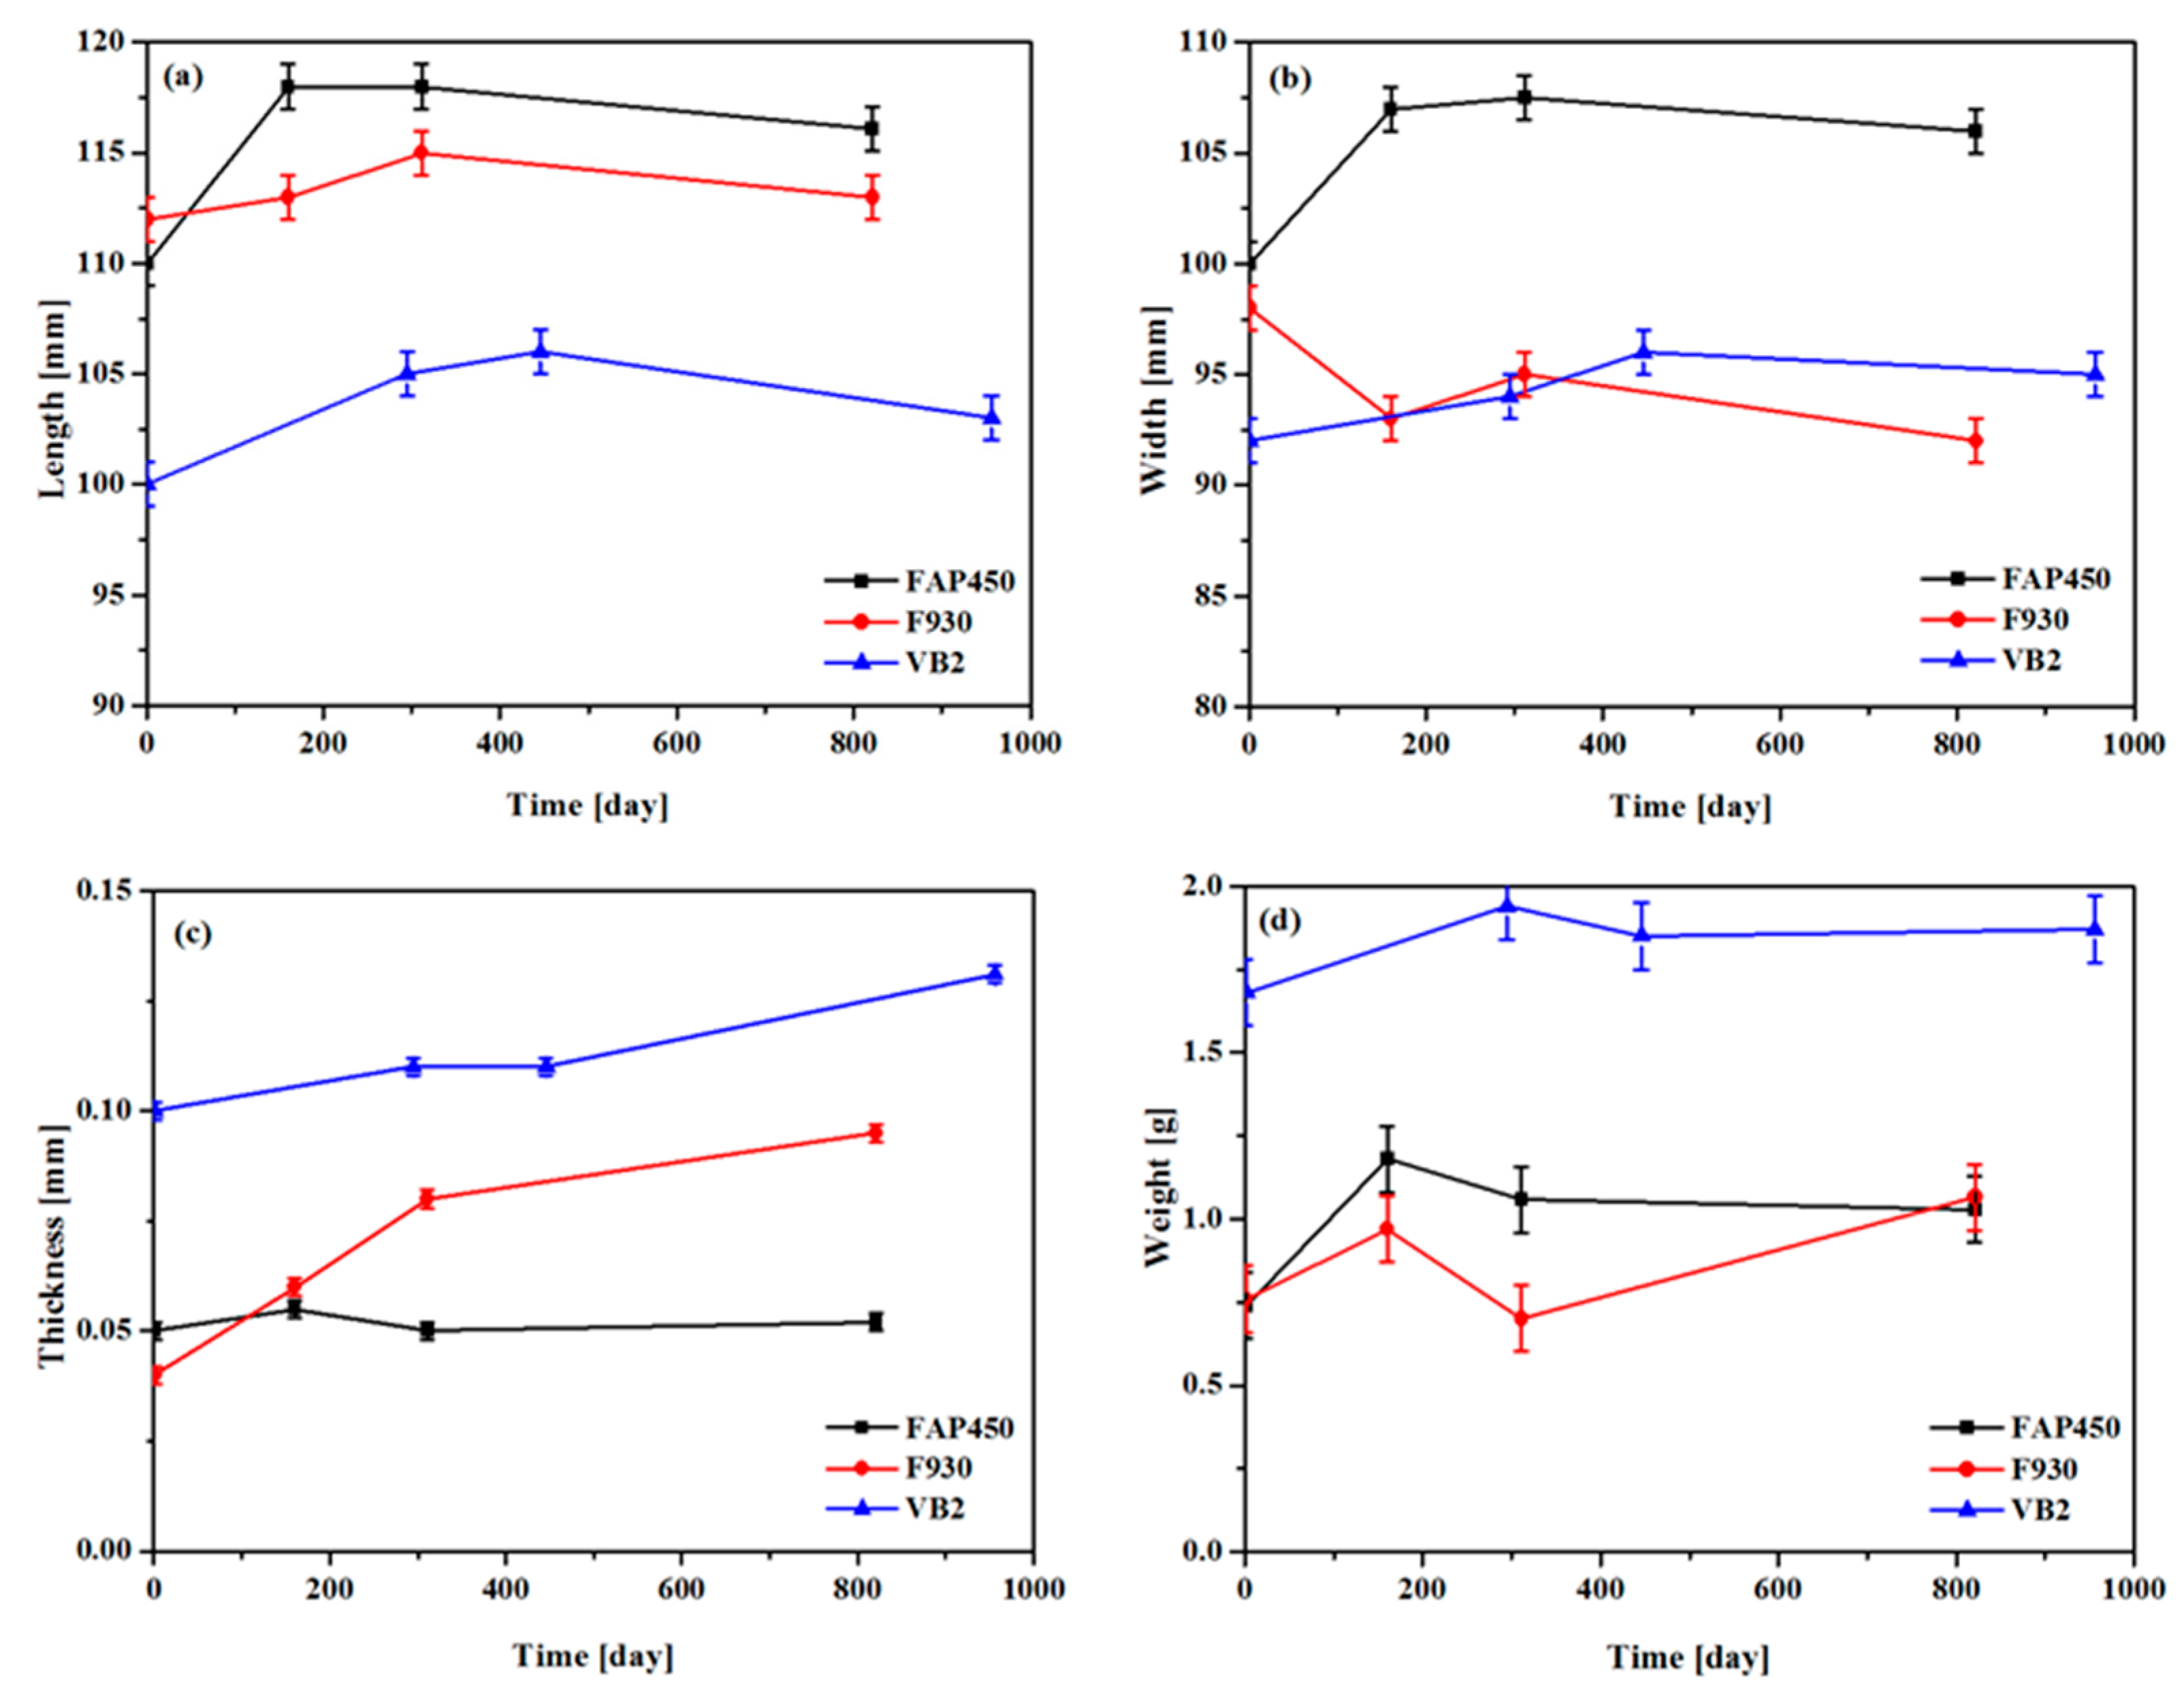
2.1. Stability of Membranes in VO2+ Solution
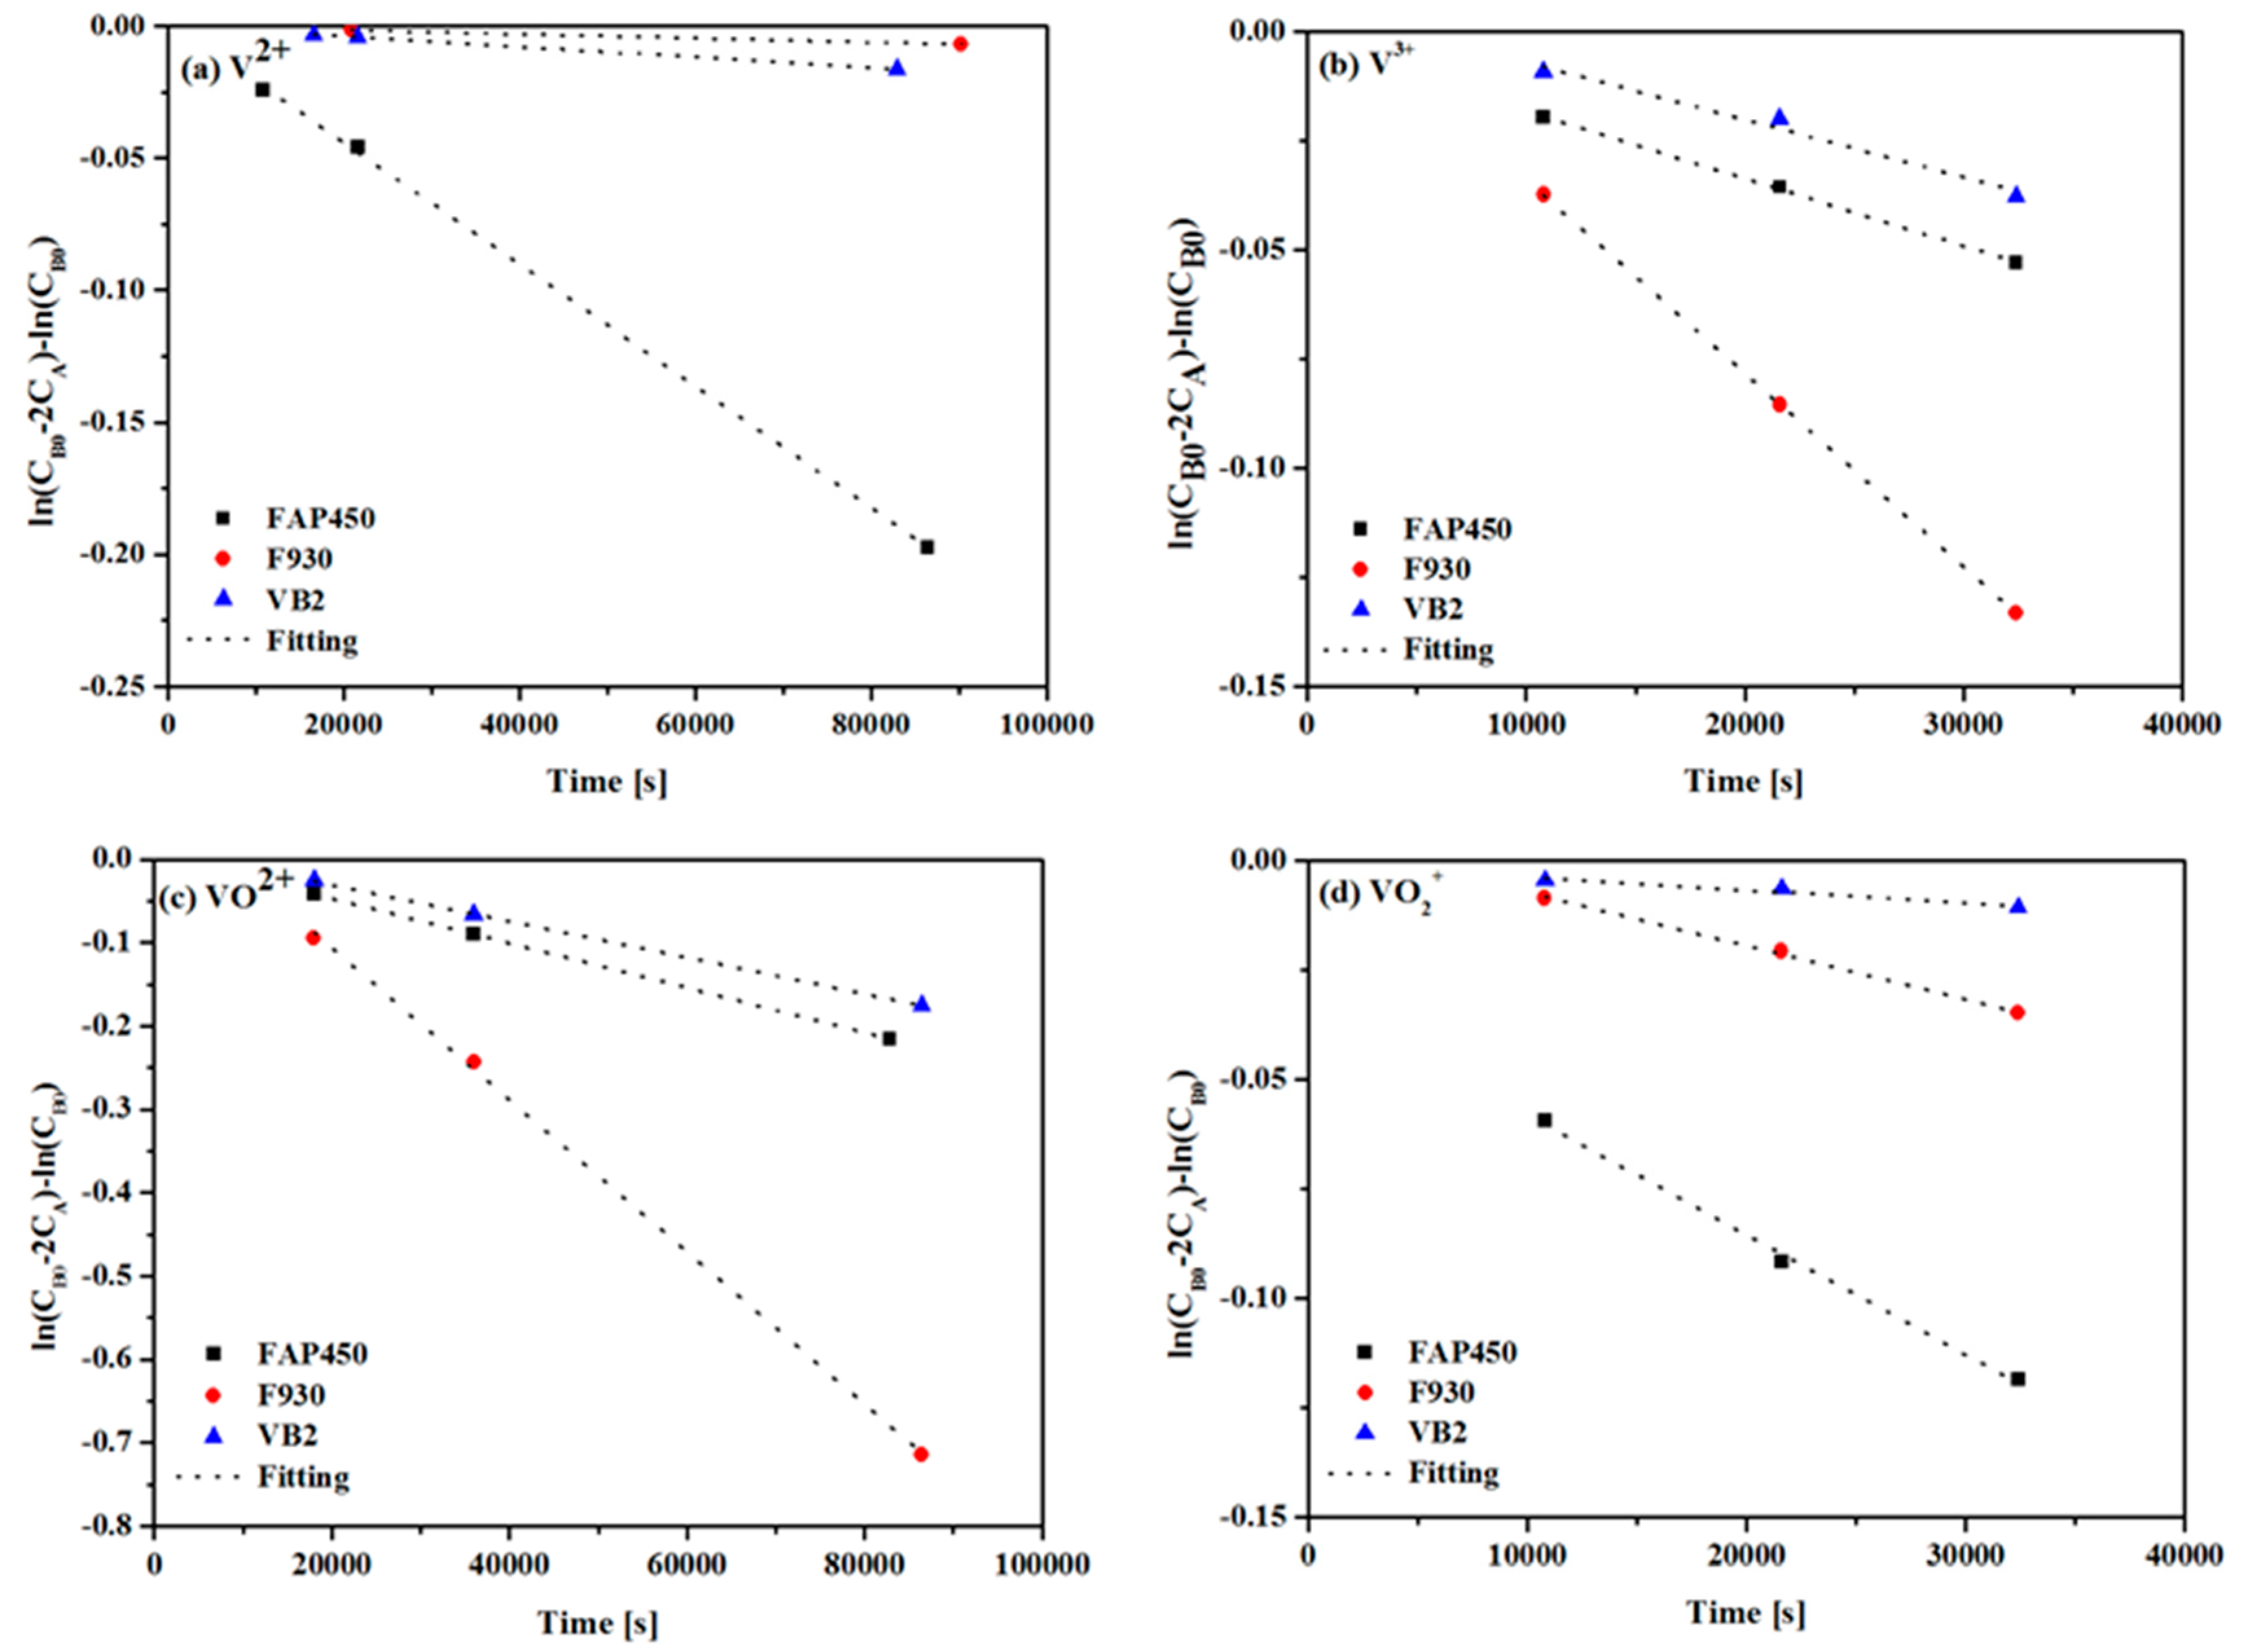
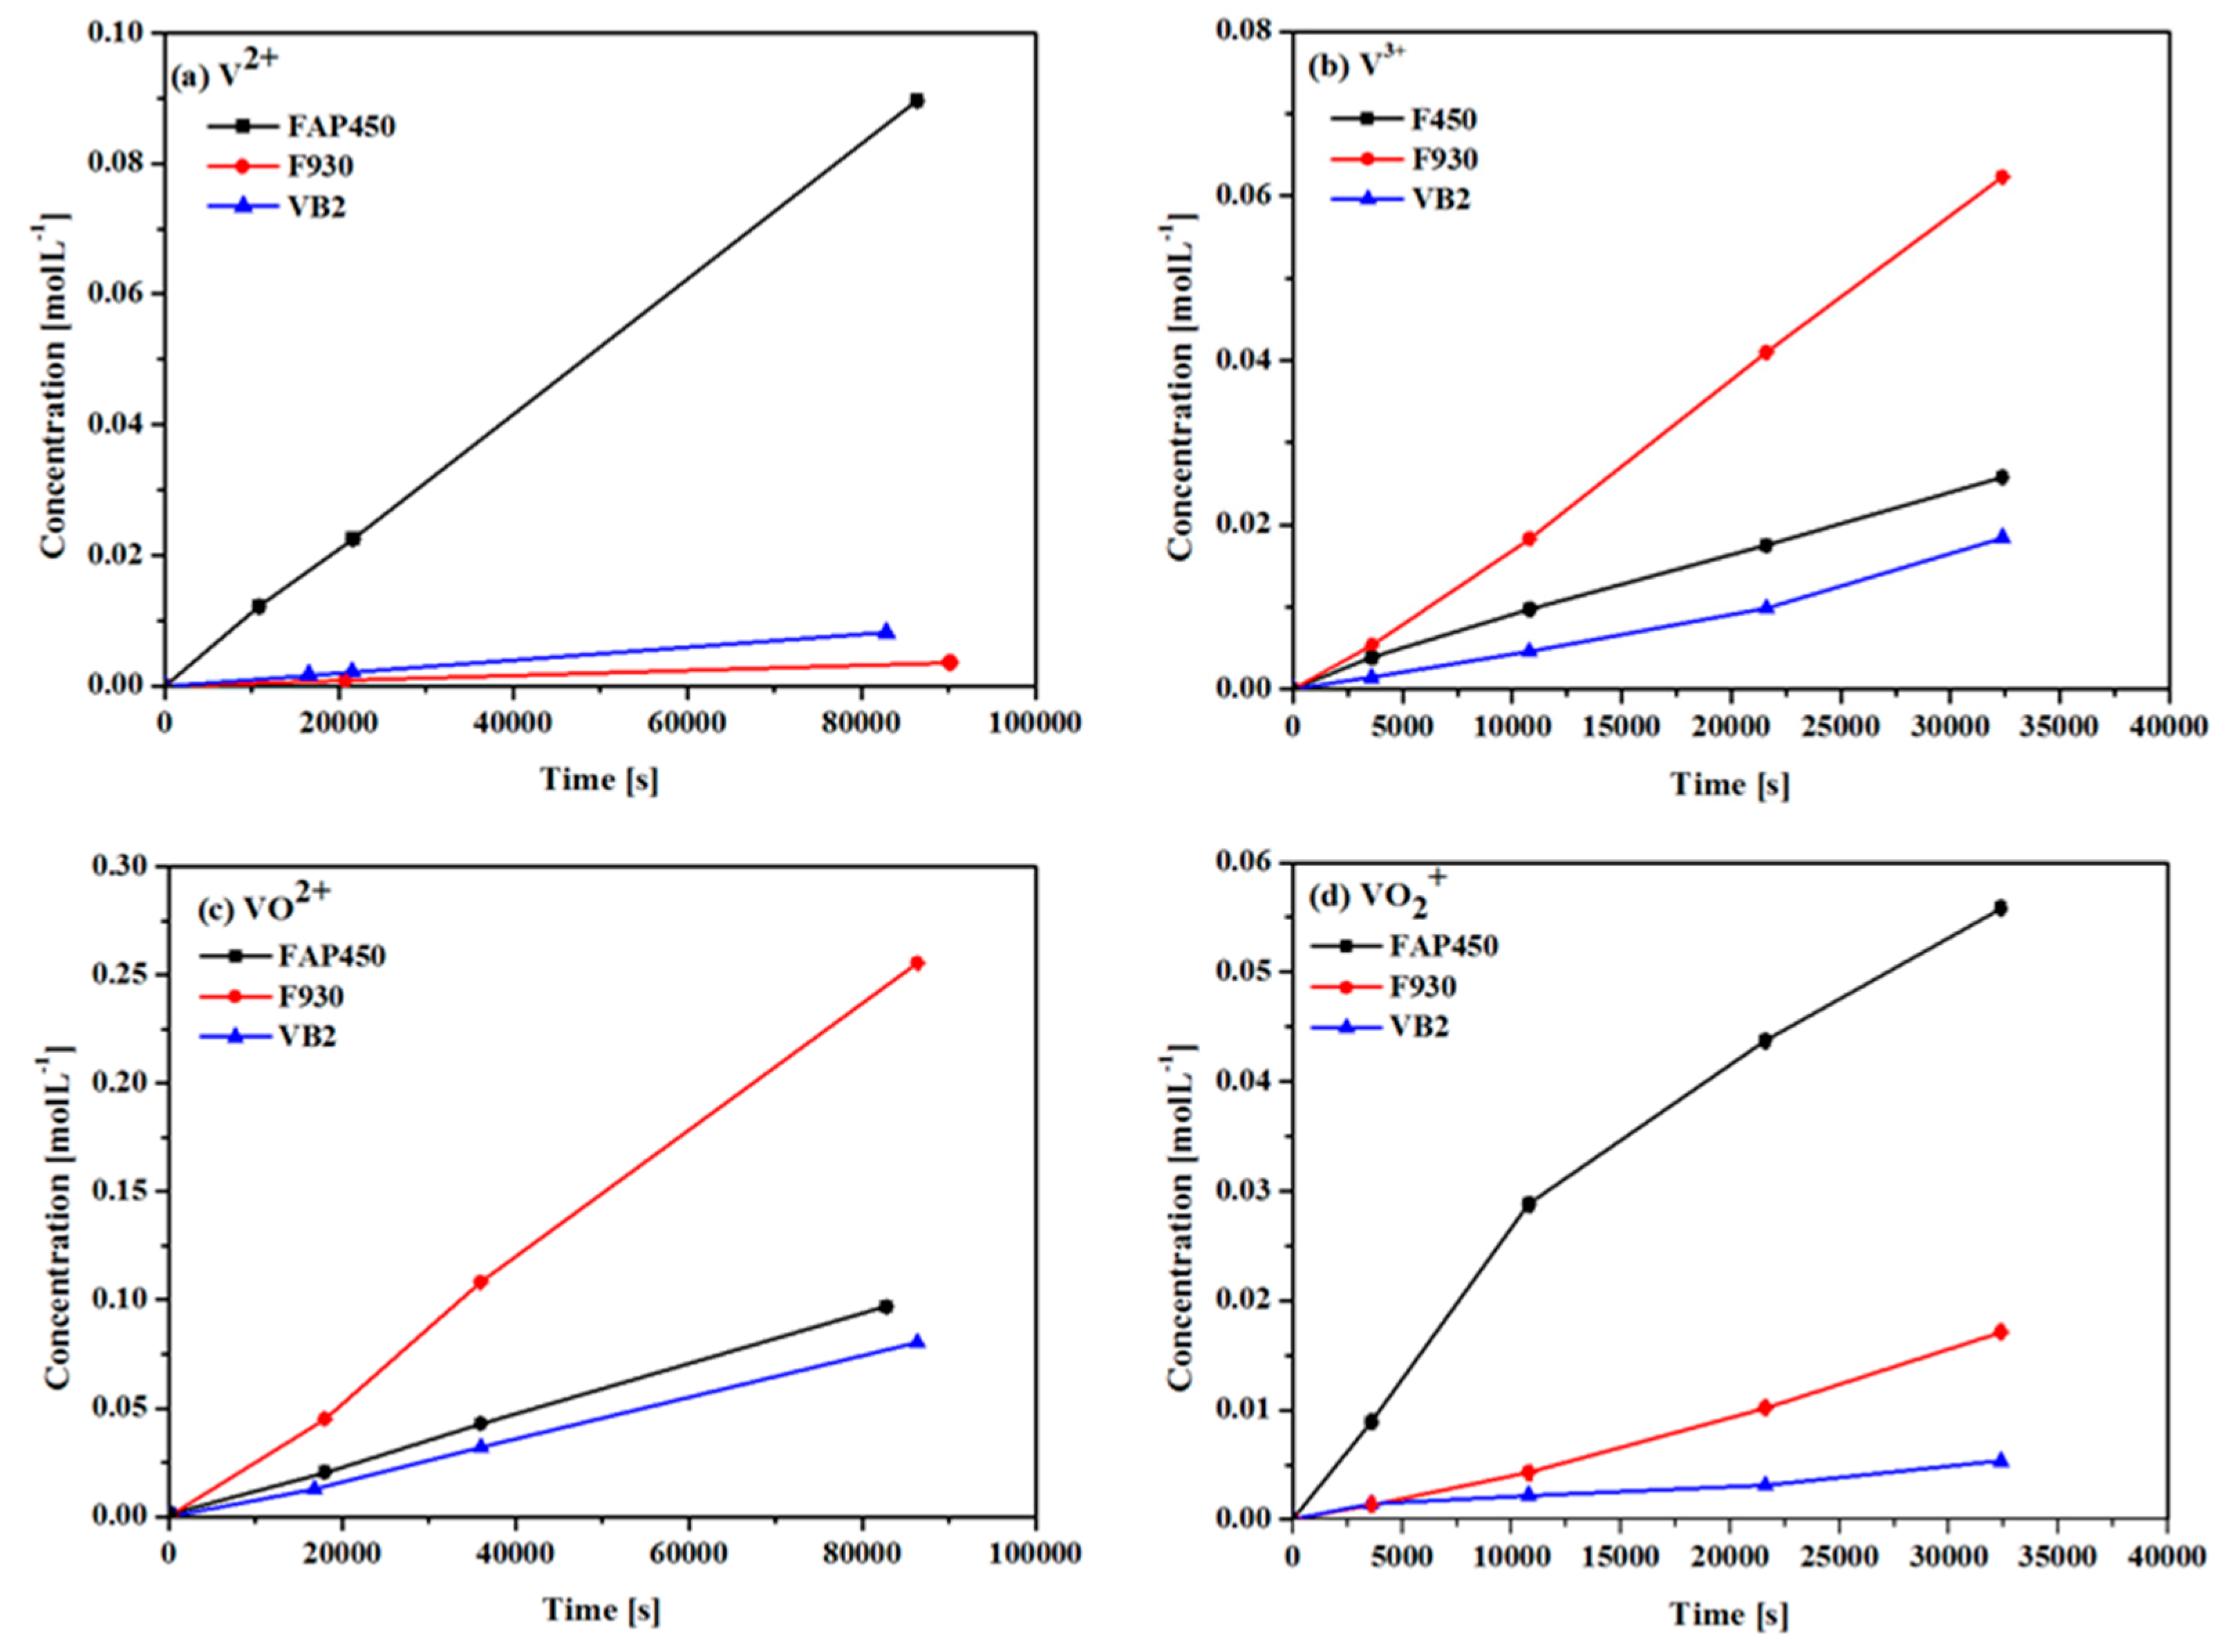
2.2. Determination of Permeability Rate of Vanadium Ions
- V2+ ion: 1 M VSO4 + 1.6 M H2SO4 ‖ 1 M MgSO4 + 1.6 M H2SO4;
- V3+ ion: 0.5 M V2(SO4)3 + 1.1 M H2SO4 ‖ 0.5 M Fe2(SO4)3 + 1.1M H2SO4;
- VO2+ ion: 1 M VOSO4 + 1.6 M H2SO4 ‖ 1 M MgSO4 + 1.6 M H2SO4;
- VO2+ ion: 0.5 M (VO2)2SO4 + 2.1 M H2SO4 ‖ 0.5 M K2SO4 + 2.1 M H2SO4.
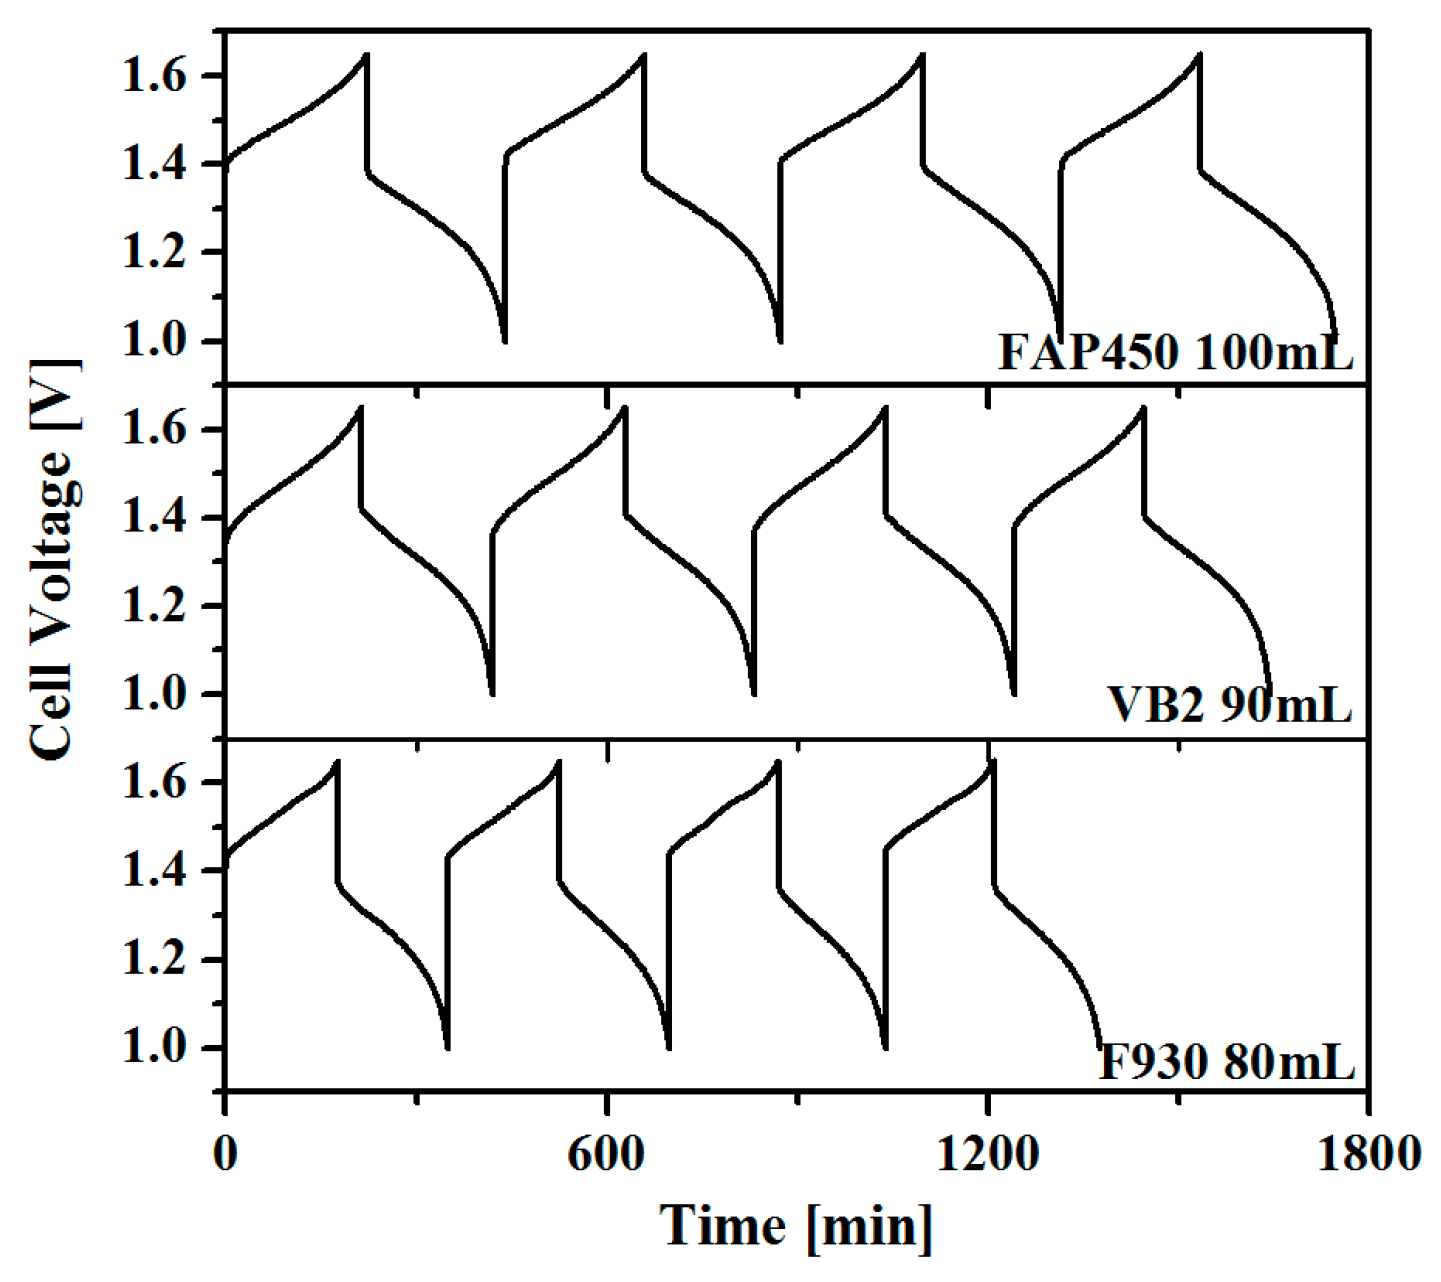
2.3. Cycling Test
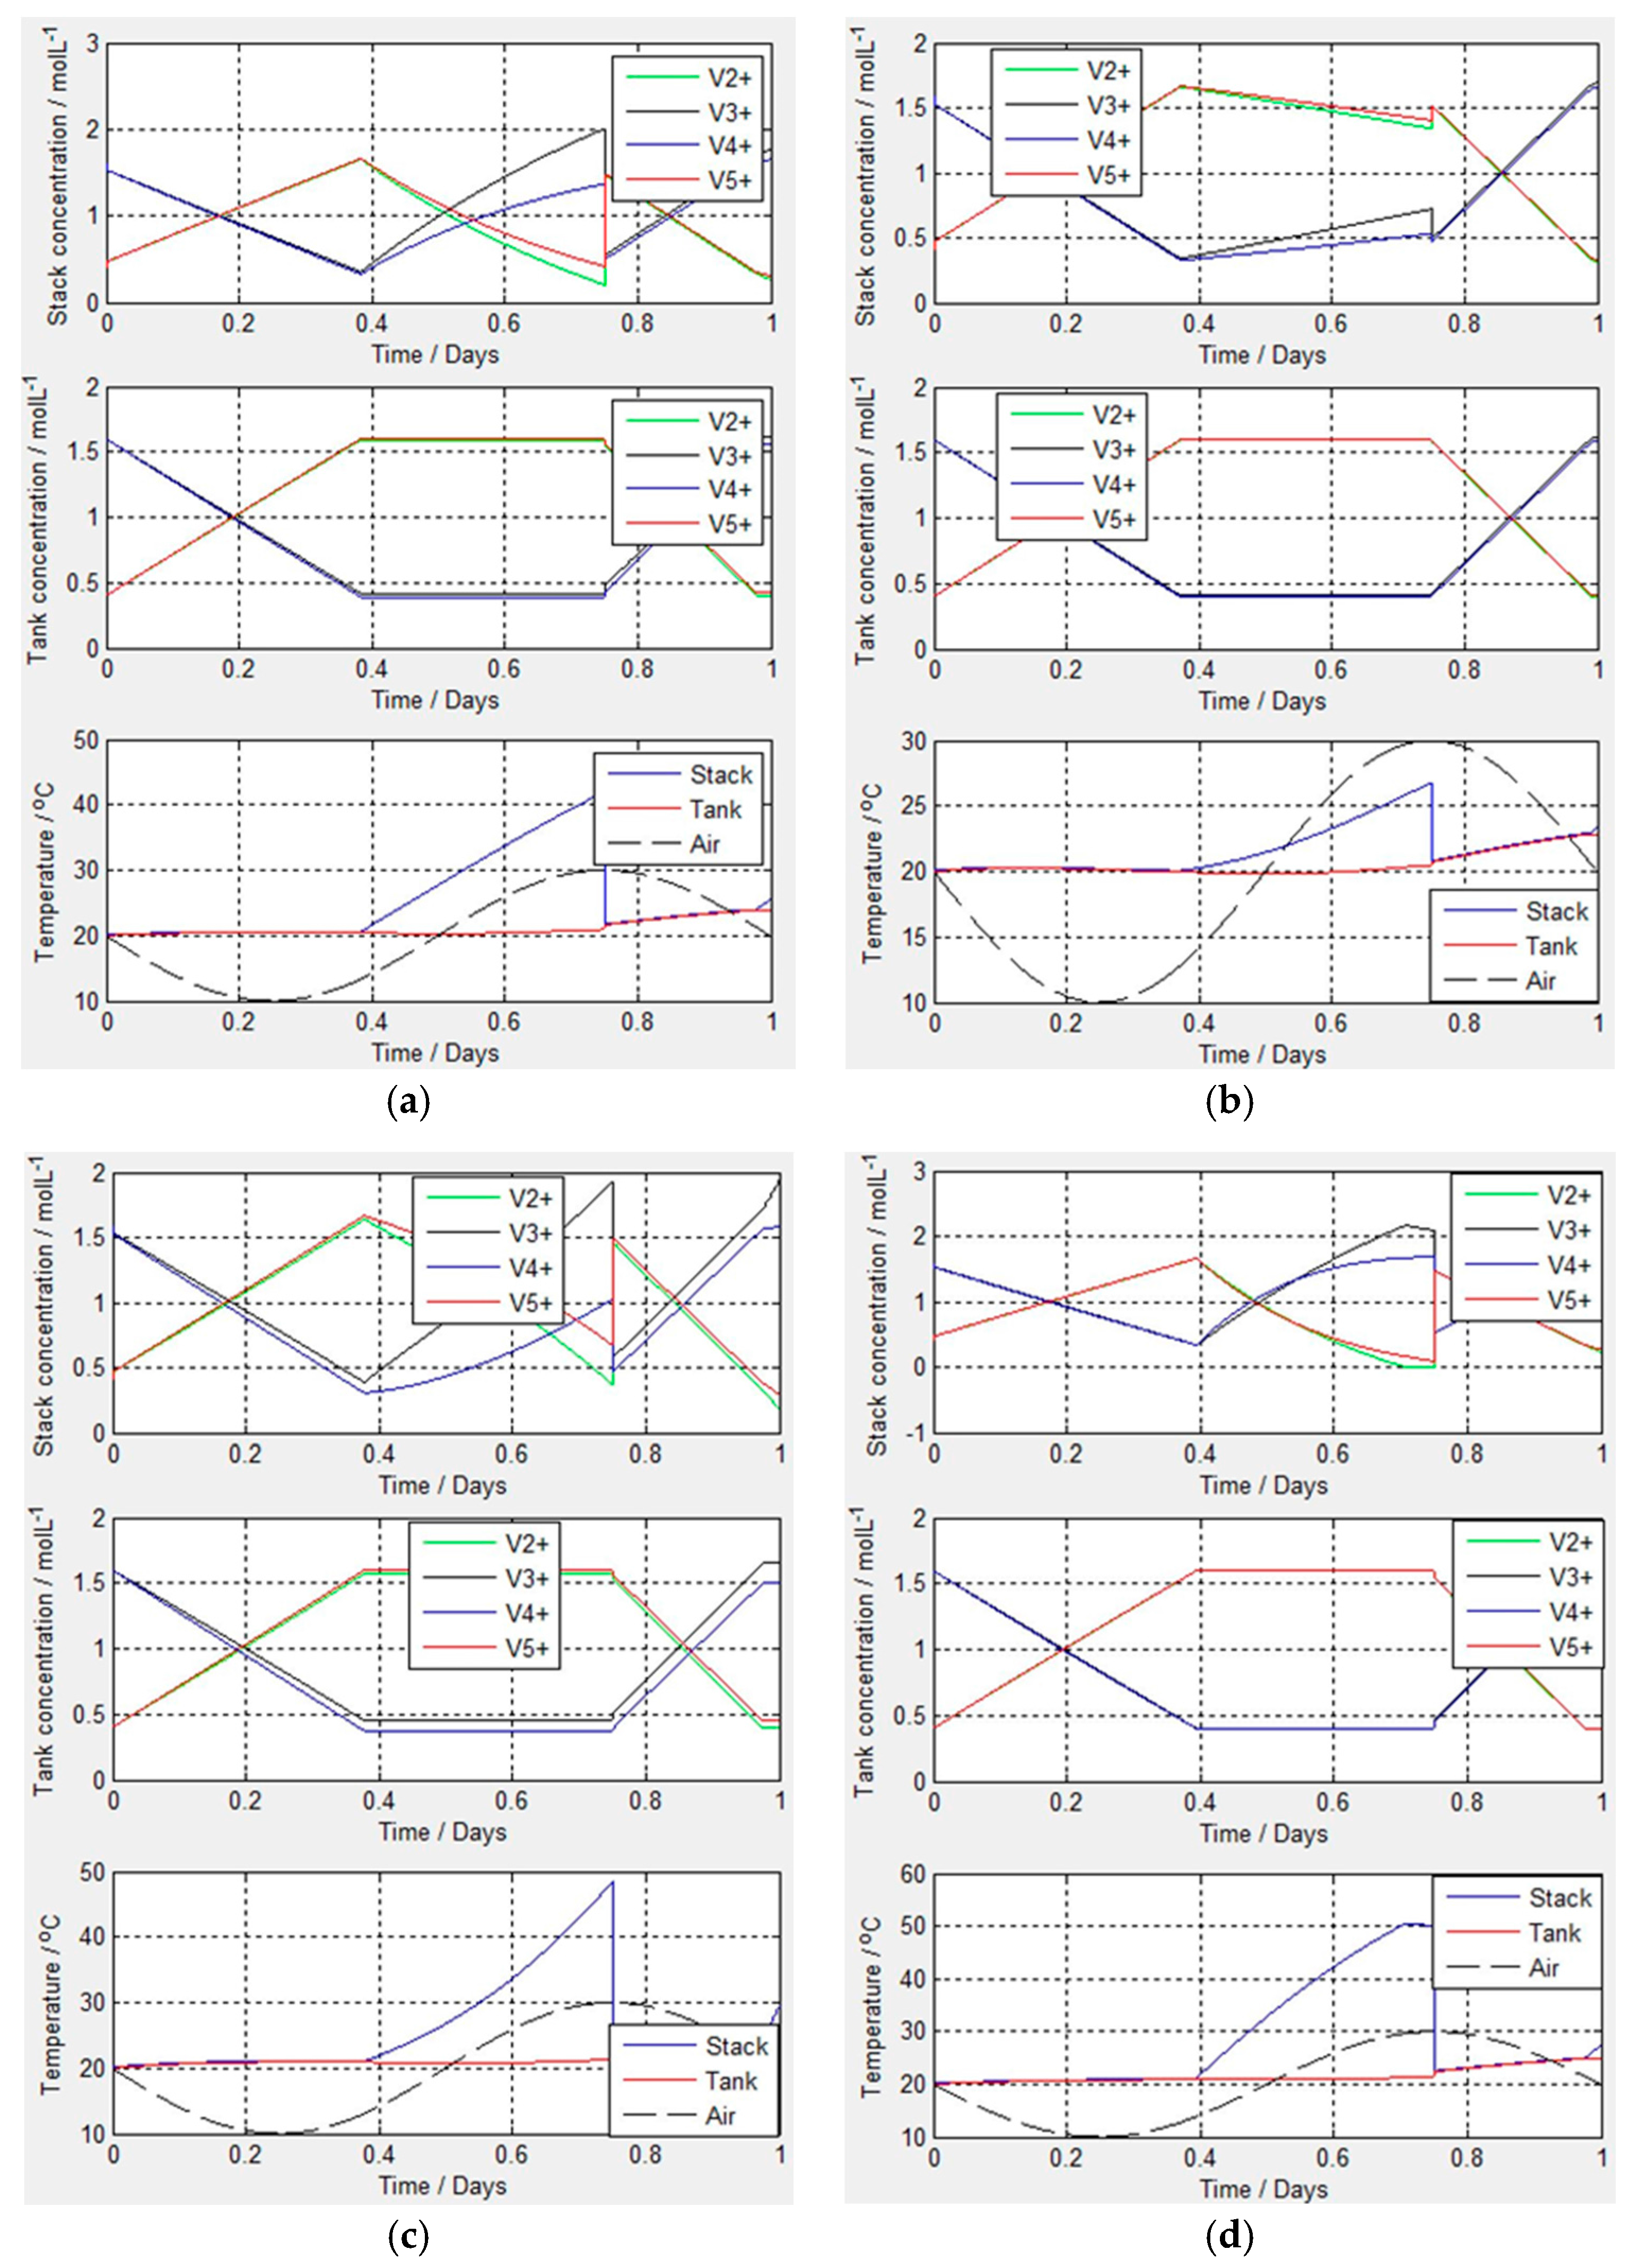
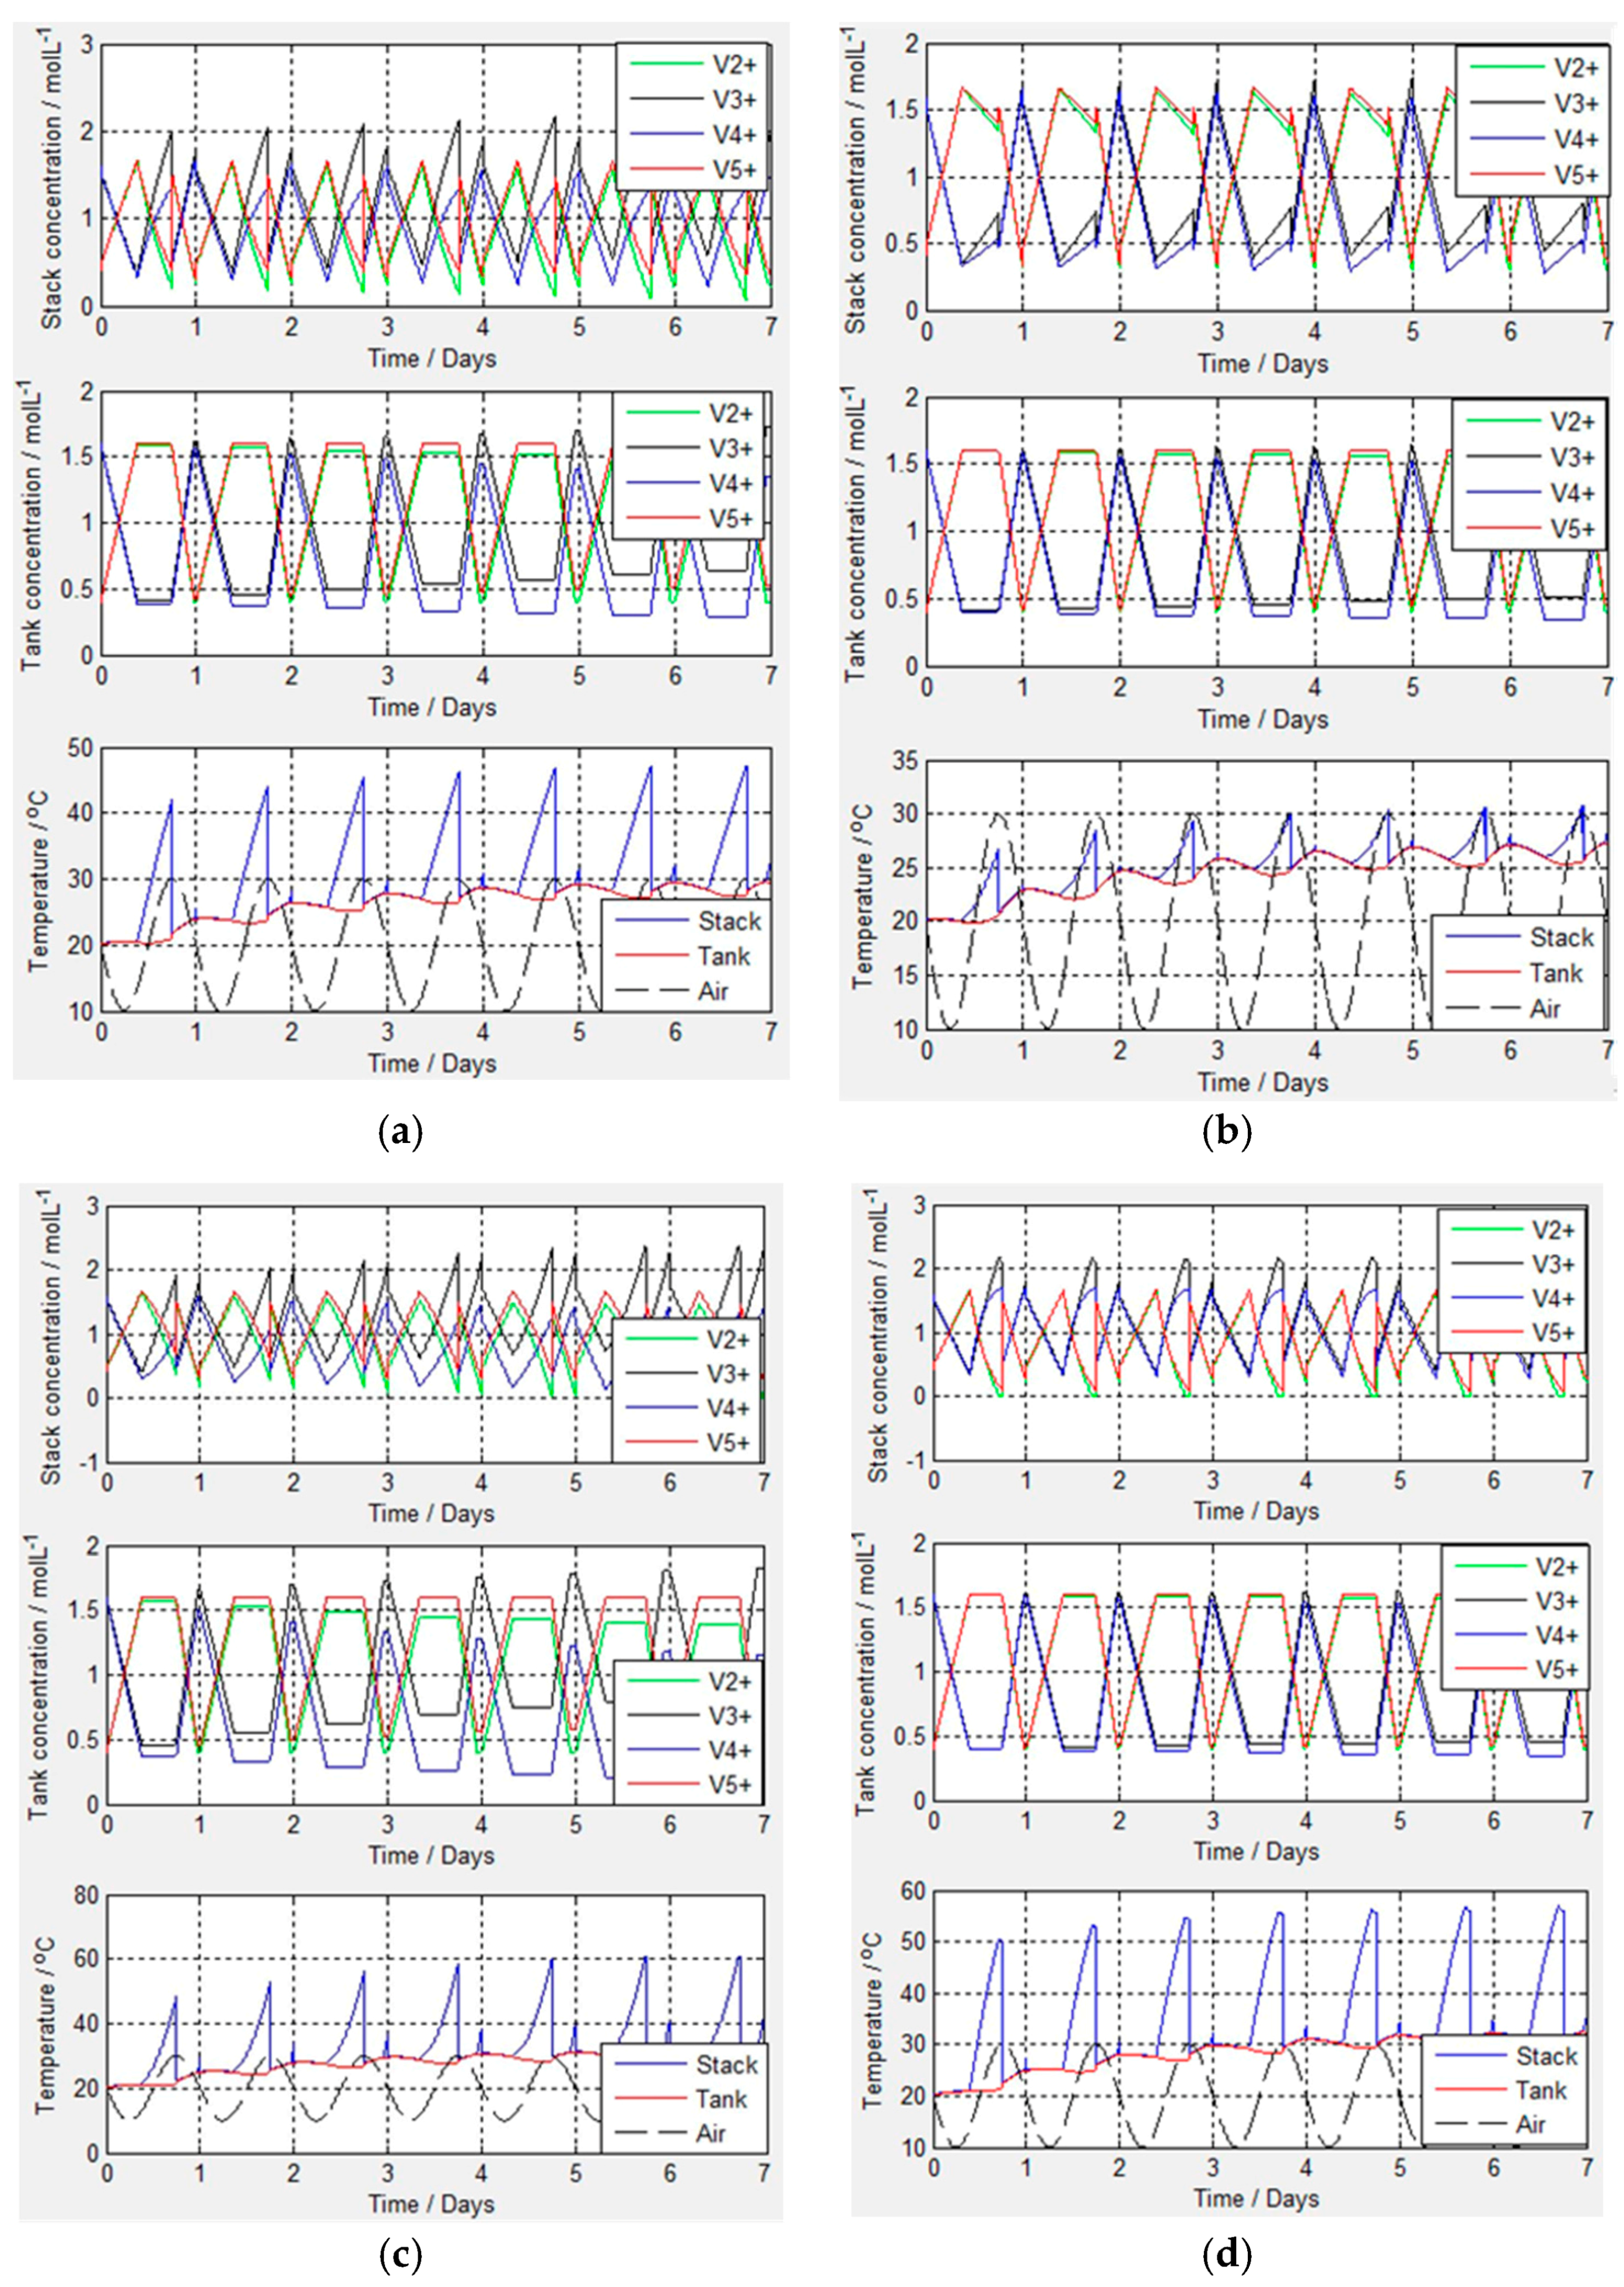
2.4. Thermal Simulation
3. Materials and Methods
3.1. Single Cell Setup
3.2. Electrolyte Preparation
3.3. Stability Test
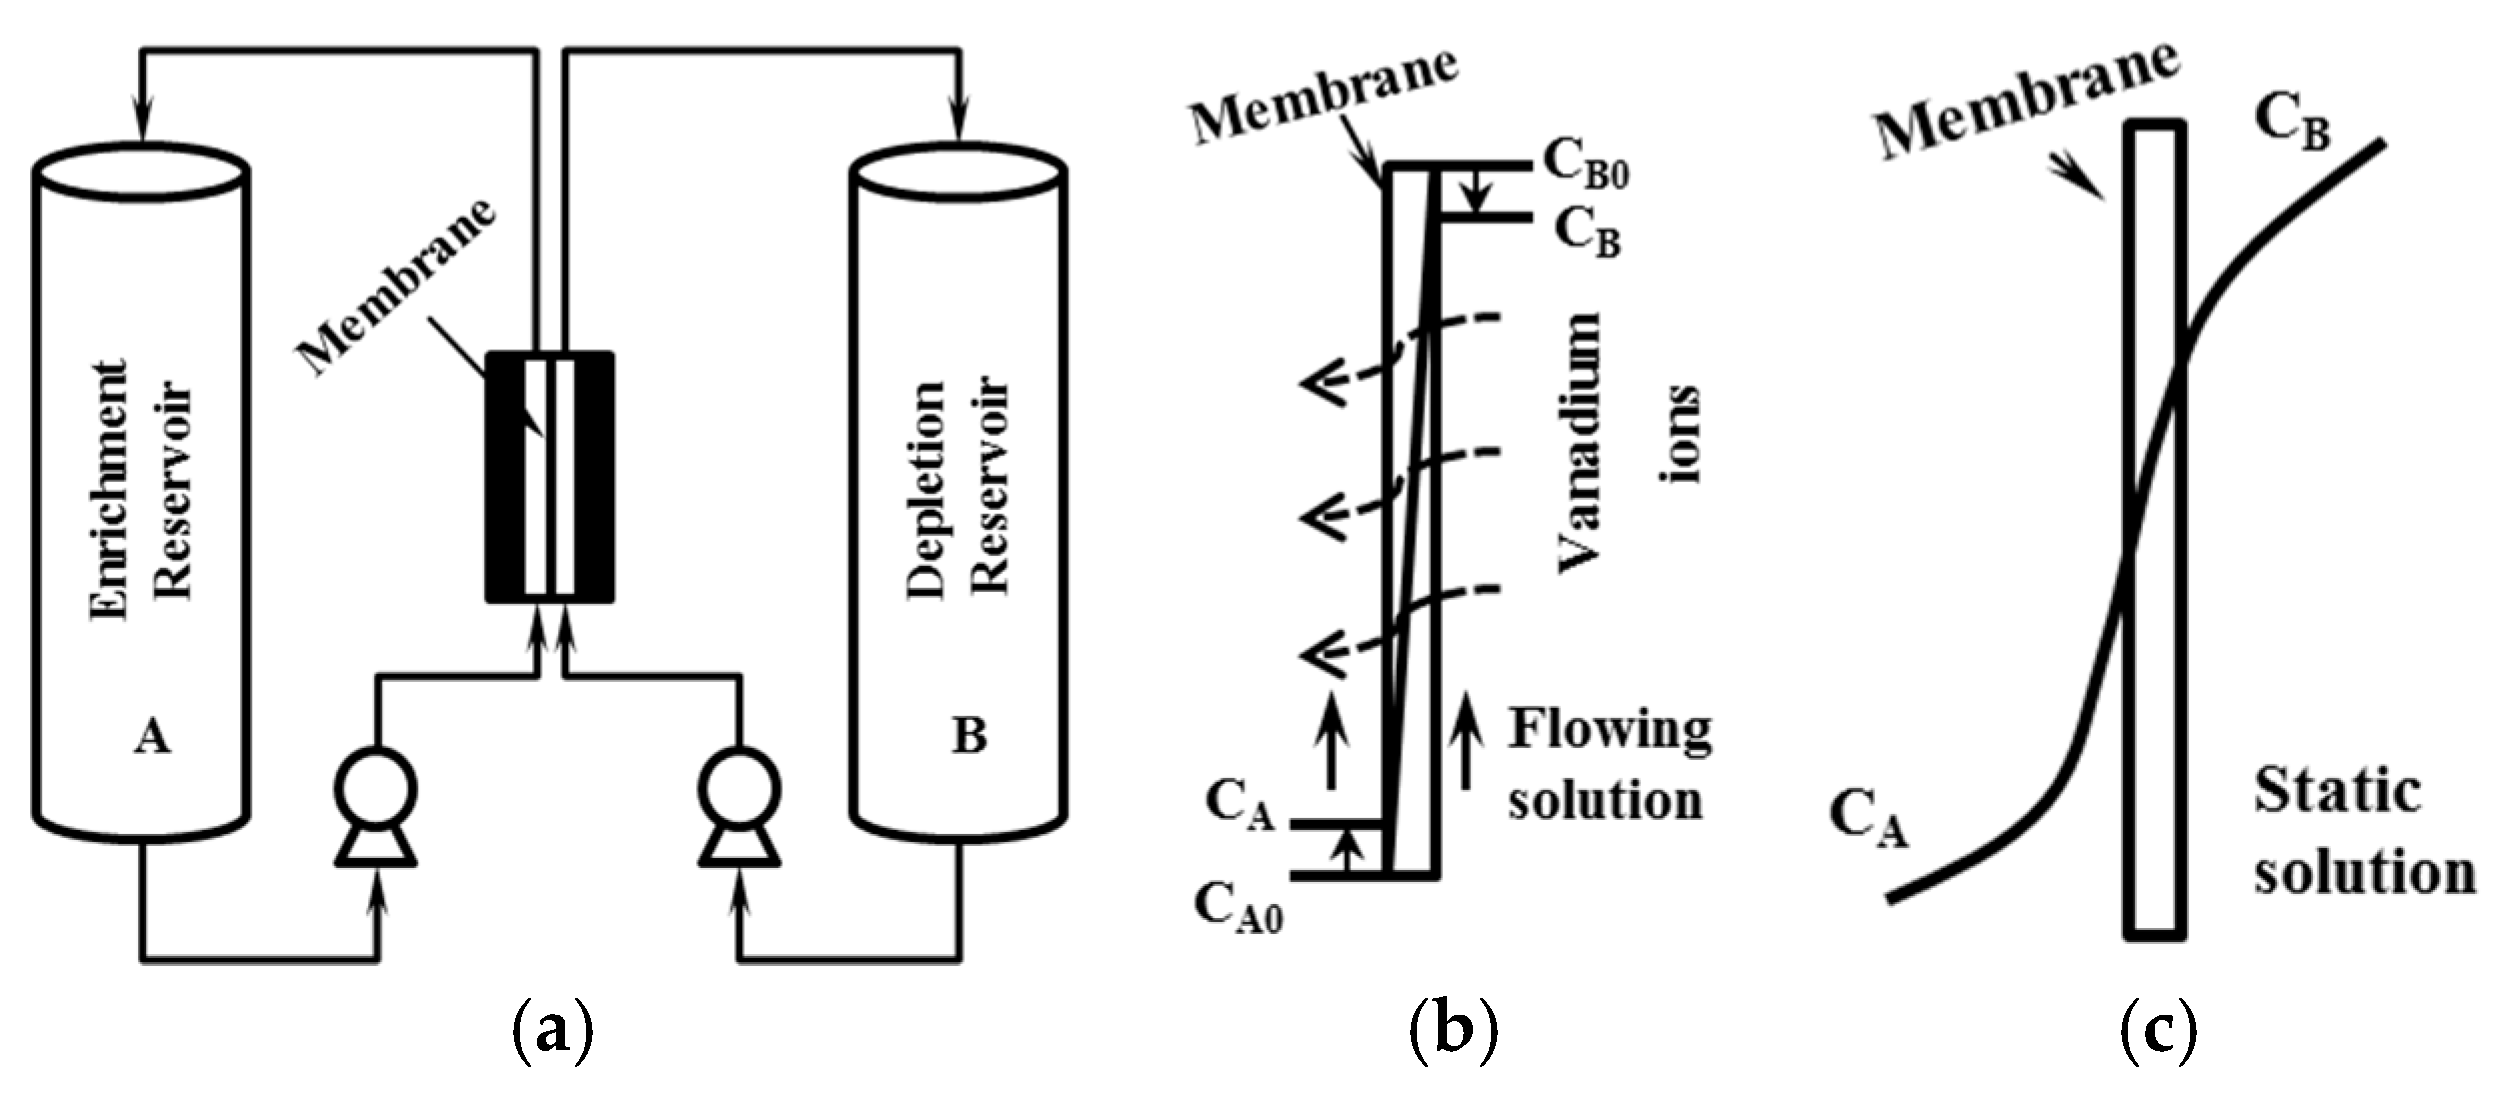
3.4. Diffusion Test
3.5. Cycling Test
3.6. Model Development
4. Conclusions
Acknowledgments
Author Contributions
Conflicts of Interest
References
- Tang, A.; Bao, J.; Skyllas-Kazacos, M. Thermal modelling of battery configuration and self-discharge reactions in vanadium redox flow battery. J. Power Sources 2012, 216, 489–501. [Google Scholar] [CrossRef]
- Tang, A.; Ting, S.; Bao, J.; Skyllas-Kazacos, M. Thermal modelling and simulation of the all-vanadium redox flow battery. J. Power Sources 2012, 203, 165–176. [Google Scholar] [CrossRef]
- Mohammadi, T.; Skyllas-Kazacos, M. Preparation of sulfonated composite membrane for vanadium redox flow battery applications. J. Membr. Sci. 1995, 107, 35–45. [Google Scholar] [CrossRef]
- Xi, J.; Wu, Z.; Teng, X.; Zhao, Y.; Chen, L.; Qiu, X. Self-assembled polyelectrolyte multilayer modified Nafion membrane with suppressed vanadium ion crossover for vanadium redox flow batteries. J. Mater. Chem. 2008, 18, 1232–1238. [Google Scholar] [CrossRef]
- Teng, X.; Zhao, Y.; Xi, J.; Wu, Z.; Qiu, X.; Chen, L. Nafion/organically modified silicate hybrids membrane for vanadium redox flow battery. J. Power Sources 2009, 189, 1240–1246. [Google Scholar] [CrossRef]
- Chen, D.; Wang, S.; Xiao, M.; Meng, Y. Preparation and properties of sulfonated poly(fluorenyl ether ketone) membrane for vanadium redox flow battery application. J. Power Sources 2010, 195, 2089–2095. [Google Scholar] [CrossRef]
- Mai, Z.; Zhang, H.; Zhang, H.; Xu, W.; Wei, W.; Na, H.; Li, X. Anion-conductive membranes with ultralow vanadium permeability and excellent performance in vanadium flow batteries. ChemSusChem 2013, 6, 328–335. [Google Scholar] [CrossRef] [PubMed]
- Luo, Q.; Zhang, H.; Chen, J.; Qian, P.; Zhai, Y. Modification of Nafion membrane using interfacial polymerization for vanadium redox flow battery applications. J. Membr. Sci. 2008, 311, 98–103. [Google Scholar] [CrossRef]
- Luo, Q.; Zhang, H.; Chen, J.; You, D.; Sun, C.; Zhang, Y. Preparation and characterization of Nafion/SPEEK layered composite membrane and its application in vanadium redox flow battery. J. Membr. Sci. 2008, 325, 553–558. [Google Scholar] [CrossRef]
- Wang, Y.; Wang, S.; Xiao, M.; Han, D.; Hickner, M.A.; Meng, Y. Layer-by-layer self-assembly of PDDA/PSS-SPFEK composite membrane with low vanadium permeability for vanadium redox flow battery. RSC Adv. 2013, 3, 15467–15474. [Google Scholar] [CrossRef]
- Jia, C.; Liu, J.; Yan, C. A significantly improved membrane for vanadium redox flow battery. J. Power Sources 2010, 195, 4380–4383. [Google Scholar] [CrossRef]
- Grossmith, F.; Llewellyn, P.; Fane, A.G.; Skyllas-Kazacos, M. Evalution of membranes for all-vanadium redox cell. In Stationary Energy Storage, Load Levelling, and Remote Applications; Publisher: Honolulu, HI, USA, 1988; pp. 363–374. [Google Scholar]
- Wiedemann, E.; Heintz, A.; Lichtenthaler, R.N. Transport properties of vanadium ions in cation exchange membranes: Determination of diffusion coefficients using a dialysis cell. J. Membr. Sci. 1998, 141, 215–221. [Google Scholar] [CrossRef]
- Sun, C.; Chen, J.; Zhang, H.; Han, X.; Luo, Q. Investigations on transfer of water and vanadium ions across Nafion membrane in an operating vanadium redox flow battery. J. Power Sources 2010, 195, 890–897. [Google Scholar] [CrossRef]
- Leung, P.K.; Xu, Q.; Zhao, T.S.; Zeng, L.; Zhang, C. Preparation of silica nanocomposite anion-exchange membranes with low vanadium-ion crossover for vanadium redox flow batteries. Electrochim. Acta 2013, 105, 584–592. [Google Scholar] [CrossRef]
- Tanaka, Y. Fundamental Properties of Ion Exchange Membranes, 2nd ed.; Elsevier Science: Amsterdam, The Netherlands, 2015. [Google Scholar]
- Fick, A. Ueber Diffusion. Ann. Phys. 1855, 170, 59–86. [Google Scholar] [CrossRef]
- Arrhenius, S. Über die Dissociationswärme und den Einflusß der Temperatur auf den Dissociationsgrad der Elektrolyte; Wilhelm Engelmann: Leipzig, Germany, 1989. (In German) [Google Scholar]
- Luo, X.; Lu, Z.; Xi, J.; Wu, Z.; Zhu, W.; Chen, L.; Qiu, X. Influences of permeation of vanadium ions through PVDF-g-PSSA membranes on performances of vanadium redox flow batteries. J. Phys. Chem. B 2005, 109, 20310–20314. [Google Scholar] [CrossRef] [PubMed]
- Qiu, J.; Zhao, L.; Zhai, M.; Ni, J.; Zhou, H.; Peng, J.; Li, J.; Wei, G. Pre-irradiation grafting of styrene and maleic anhydride onto PVDF membrane and subsequent sulfonation for application in vanadium redox batteries. J. Power Sources 2008, 177, 617–623. [Google Scholar] [CrossRef]
- Xi, J.; Wu, Z.; Qiu, X.; Chen, L. Nafion/SiO2 hybrid membrane for vanadium redox flow battery. J. Power Sources 2007, 166, 531–536. [Google Scholar] [CrossRef]
- Heintz, A.; Wiedemann, E.; Ziegler, J. Ion exchange diffusion in electromembranes and its description using the Maxwell-Stefan formalism. J. Membr. Sci. 1997, 137, 121–132. [Google Scholar] [CrossRef]
- Chen, J.; Wang, B.; Yang, J. Adsorption and Diffusion of VO2+ and VO2+ across Cation Membrane for All-Vanadium Redox Flow Battery. Solvent Extr. Ion Exch. 2009, 27, 312–327. [Google Scholar] [CrossRef]
- Wiedemann, E.; Heintz, A.; Lichtenthaler, R.N. Sorption isotherms of vanadium with H3O+ ions in cation exchange membranes. J. Membr. Sci. 1998, 141, 207–213. [Google Scholar] [CrossRef]
- Vijayakumar, M.; Bhuvaneswari, M.S.; Nachimuthu, P.; Schwenzer, B.; Kim, S.; Yang, Z.; Liu, J.; Graff, G.L.; Thevuthasan, S.; Hu, J. Spectroscopic investigations of the fouling process on Nafion membranes in vanadium redox flow batteries. J. Membr. Sci. 2011, 366, 325–334. [Google Scholar] [CrossRef]
- Cui, S.; Paddison, S.J. A molecular dynamics study of the effects of V2+ and V3+ on the local structure of hydrated Nafion. J. Phys. Chem. C 2015, 119, 12848–12855. [Google Scholar] [CrossRef]
- Mohammadi, T.; Skyllas-Kazacos, M. Evaluation of the chemical stability of some membranes in vanadium solution. J. Appl. Electrochem. 1997, 27, 153–160. [Google Scholar] [CrossRef]
- Gildemeister; (Würzburg, Germany). Private communication, 2014.
- Qiu, J.; Li, M.; Ni, J.; Zhai, M.; Peng, J.; Xu, L.; Zhou, H.; Li, J.; Wei, G. Preparation of ETFE-based anion exchange membrane to reduce permeability of vanadium ions in vanadium redox battery. J. Membr. Sci. 2007, 297, 174–180. [Google Scholar] [CrossRef]
- Lin, C.-H.; Yang, M.-C.; Wei, H.-J. Amino-silica modified Nafion membrane for vanadium redox flow battery. J. Power Sources 2015, 282, 562–571. [Google Scholar] [CrossRef]
- Donnan, F.G. Die genaue thermodynamik der membranegleichgewichte. Z. Phys. Chem. A 1934, 168, 369–380. (In German) [Google Scholar]
- Sepehr, F.; Paddison, S.J. Effect of sulfuric and triflic acids on the hydration of vanadium cations: An ab initio study. J. Phys. Chem. A 2015, 119, 5749–5761. [Google Scholar] [CrossRef] [PubMed]
- Strehlow, H.; Wendt, H. Fast ionic reactions in solution. IV. The formation of the vanadyl sulfate complex in aqueous solution. Inorg. Chem. 1963, 2, 6–10. [Google Scholar] [CrossRef]
- Yamamoto, H. Mobility of counter ion in ion exchange membrane. Bull. Soc. Sea Water Sci. Japan 1968, 22, 323–326. [Google Scholar]
- Morgan, R.A.; Sloan, W.H. Extrusion Finishing of Perfluorinated Copolymers. U.S. Patent 4,626,587A, 2 December 2012. [Google Scholar]
- Smith, R.A.; Withers, M.S. Coextruded Multilayer Cation Exchange Membranes. U.S. Patent 4, 437,952A, 20 March 1984. [Google Scholar]
- Curtin, D.E.; Lousenberg, R.D.; Henry, T.J.; Tangeman, P.C.; Tisack, M.E. Advanced materials for improved PEMFC performance and life. J. Power Sources 2004, 131, 41–48. [Google Scholar] [CrossRef]


| Membrane | L | k(V2+) | k(V3+) | k(VO2+) | k(VO2+) |
| FAP450 1 | 50 | 1.61 × 10⁻¹⁰ | 1.08 × 10⁻¹⁰ | 1.98 × 10⁻¹⁰ | 1.92 × 10⁻¹⁰ |
| F930 1 | 30 | 3.24 × 10⁻¹² | 1.86 × 10⁻¹⁰ | 3.83 × 10⁻¹⁰ | 5.11 × 10⁻¹¹ |
| VB2 1 | 100 | 2.76 × 10⁻¹¹ | 1.84 × 10⁻¹⁰ | 3.05 × 10⁻¹⁰ | 4.03 × 10⁻¹¹ |
| Nafion 115 2 | 127 | 8.76 × 10⁻¹⁰ | 3.22 × 10⁻¹⁰ | 6.82 × 10⁻¹⁰ | 5.89 × 10⁻¹⁰ |
| Membrane | k/L(V2+) | k/L(V3+) | k/L(VO2+) | k/L(VO2+) | |
| FAP450 1 | 3.23 × 10⁻⁷ | 2.16 × 10⁻⁷ | 3.96 × 10⁻⁷ | 3.83 × 10⁻⁷ | |
| F930 1 | 1.08 × 10⁻⁸ | 6.20 × 10⁻⁷ | 1.28 × 10⁻⁶ | 1.70 × 10⁻⁷ | |
| VB2 1 | 2.76 × 10⁻⁸ | 1.84 × 10⁻⁷ | 3.05 × 10⁻⁷ | 4.03 × 10⁻⁸ | |
| Nafion 115 2 | 6.9 × 10⁻⁷ | 2.54 × 10⁻⁷ | 5.37 × 10⁻⁷ | 4.64 × 10⁻⁷ | |
| Membrane | C | V | A | L | CE 1 | VE 1 | EE 1 |
|---|---|---|---|---|---|---|---|
| mol·L−1 | mL | cm2 | µm | % | % | % | |
| FAP450 | 1.6 | 100 | 25 | 50 | 96.2 | 82.9 | 79.8 |
| VB2 | 1.6 | 90 | 25 | 100 | 97.0 | 85.0 | 82.5 |
| F930 | 1.6 | 80 | 25 | 30 | 97.7 | 81.7 | 79.8 |
| Parameter | Value | Unit |
|---|---|---|
| Number of cells per stack | 40 | - |
| Vanadium concentration | 2.0 | mol·L−1 |
| Capacity | 40 | kWh |
| Cell resistivity for charge resistance | 2.0 | Ω·cm2 |
| Cell resistivity for discharge resistance | 2.1 | Ω·cm2 |
| Minimum air temperature | 10 | °C |
| Maximum air temperature | 30 | °C |
| Discharging period in 24 h format | From 14:00 to 20:00 | hour |
| Charge current | 50 | A |
| Discharge current | 75 | A |
| Lower SOC | 20 | % |
| Upper SOC | 80 | % |
| Flow factor for charging | 6 | - |
| Flow factor for dischrging | 6 | - |
| Tank shape | Cylindrical | - |
| Tank material | Polypropylene | - |
| Tank height | 1 | m |
| Tank wall thickness | 1 | cm |
| Thickness of half-cell cavity | 0.3 | cm |
| Length of half-cell cavity (parallel to the flow) | 30 | cm |
| Width of half-cell cavity (vertical to the flow) | 50 | cm |
| Flow frame edge width (cm) | 5.0 | cm |
| End plate material | Steel + Polypropylene | - |
| End plate thickness | 1 + 1 | cm |
© 2016 by the authors; licensee MDPI, Basel, Switzerland. This article is an open access article distributed under the terms and conditions of the Creative Commons Attribution (CC-BY) license (http://creativecommons.org/licenses/by/4.0/).
Share and Cite
Cao, L.; Kronander, A.; Tang, A.; Wang, D.-W.; Skyllas-Kazacos, M. Membrane Permeability Rates of Vanadium Ions and Their Effects on Temperature Variation in Vanadium Redox Batteries. Energies 2016, 9, 1058. https://doi.org/10.3390/en9121058
Cao L, Kronander A, Tang A, Wang D-W, Skyllas-Kazacos M. Membrane Permeability Rates of Vanadium Ions and Their Effects on Temperature Variation in Vanadium Redox Batteries. Energies. 2016; 9(12):1058. https://doi.org/10.3390/en9121058
Chicago/Turabian StyleCao, Liuyue, Anders Kronander, Ao Tang, Da-Wei Wang, and Maria Skyllas-Kazacos. 2016. "Membrane Permeability Rates of Vanadium Ions and Their Effects on Temperature Variation in Vanadium Redox Batteries" Energies 9, no. 12: 1058. https://doi.org/10.3390/en9121058