Article

Classification of Gene Expression Data Using Multiobjective Differential Evolution

School of Computer Science and Information Technology, Northeast Normal University, Changchun 130117, China
*
Author to whom correspondence should be addressed.
Energies 2016, 9(12), 1061; https://doi.org/10.3390/en9121061
Submission received: 6 September 2016 / Revised: 16 October 2016 / Accepted: 3 November 2016 / Published: 15 December 2016

Abstract

:
Gene expression data are usually redundant, and only a subset of them presents distinct profiles for different classes of samples. Thus, selecting high discriminative genes from gene expression data has become increasingly interesting in bioinformatics. In this paper, a multiobjective binary differential evolution method (MOBDE) is proposed to select a small subset of informative genes relevant to the classification. In the proposed method, firstly, the Fisher-Markov selector is used to choose top features of gene expression data. Secondly, to make differential evolution suitable for the binary problem, a novel binary mutation method is proposed to balance the exploration and exploitation ability. Thirdly, the multiobjective binary differential evolution is proposed by integrating the summation of normalized objectives and diversity selection into the binary differential evolution algorithm. Finally, the MOBDE algorithm is used for feature selection, and support vector machine (SVM) is used as the classifier with the leave-one-out cross-validation method (LOOCV). In order to show the effectiveness and efficiency of the algorithm, the proposed method is tested on ten gene expression datasets. Experimental results demonstrate that the proposed method is very effective.

1. Introduction

Gene expression data are characterized by thousands of and even tens of thousands of measured genes on only a few tissue samples, which gives rise to difficulties for many classifiers [1,2]. Therefore, feature selection in the computational intelligence field [3,4] plays an important role in gene array-based cancer classification, because gene selection can help to remove the irrelevant and redundant features and choose a small subset of features to carry out the classification task in an optimal way. In general, feature selection can be categorized into wrappers and filters according to whether or not it is done independently of the learning algorithm [3,4]. By using the filter and wrapper techniques, many feature selection methods [5,6,7,8] have been proposed to optimize the efficiency of the search and selection process. For example, a novel correlation-based memetic framework (MA-C), which is a combination of genetic algorithm (GA) and local search (LS) using correlation-based filter ranking, was proposed [9]. The local filter method used here fine-tunes the population of GA solutions by adding or deleting features based on the symmetrical uncertainty (SU) measure. In order to take into account the experimental conditions and the time points simultaneously, Gutiérrez-Avilés D. et al. [10] presented the TriGen algorithm, a genetic algorithm that finds triclusters of gene expression. From the results, TriGen has proven to be capable of extracting groups of genes. In [11], Xue B. et al. propose three new initialization strategies and three new personal best and global best updating mechanisms in particle swarm optimization to develop novel feature selection approaches with the goals of maximizing the classification performance, minimizing the number of features and reducing the computational time. The superior performance of this algorithm is due mainly to both the proposed initialization strategy, which aims to take advantage of both the forward selection and backward selection to decrease the number of features and the computational time, and the new updating mechanism, which can overcome the limitations of traditional updating mechanisms by taking the number of features into account, which reduces the number of features and the computational time. Based on the above analysis, the main purpose of the feature selection method is to maximize the model performance and to minimize the number of genes selected at the same time. That is to say, feature selection has two different objectives, including maximizing the classification performance and minimizing the number of genes selected. In some cases, these two objectives conflict. Based on the above situation, the feature selection may be more suitable to be designed for a multiobjective problem rather than a single-objective problem.
Recently, many multiobjective optimization approaches based on different evolutionary algorithms have been reported to solve feature selection [12,13]. For example, a hybrid multiobjective optimization method based on particle swarm optimization was proposed [5] to find a small set of non-redundant disease-related genes. Two objectives, including sensitivity and specificity, are simultaneously evaluated by the artificial neural network (ANN) classifier. Based on the real-life datasets of various types of cancers, the performance of multiobjective particle swarm optimization can perform better compared with sequential feature selection (SFS), the t-test and rank-sum. Xue B. et al. [14] proposed other multiobjective particle swarm optimizations, which are multiobjective binary particle swarm optimization (PSO) using the idea of non-dominated sorting (NSBPSO) and multiobjective binary PSO using the ideas of crowding, mutation and dominance (CMDBPSO). The proposed algorithms are examined and compared with a single-objective method on eight benchmark datasets. Experimental results show that the proposed multiobjective algorithms can evolve a set of solutions that use a smaller number of features and achieve better classification performance than using all features. Different from particle swarm optimization, the multiobjective genetic algorithm [15] was proposed to select the optimum subset and then the classification of gene expression data. Support vector machine with the radial basis function (RBF) kernel is used to measure the accuracy of the classification. This approach was tried on two benchmark gene expression datasets. It obtained encouraging results on those datasets as compared with an approach that used a single-objective strategy in a genetic algorithm. In [16], a different optimization algorithm based on an artificial immune system was used to solve feature selection in classification problems aiming at minimizing both the classification error and the cardinality of the subset of features. The algorithm is able to perform a multimodal search maintaining population diversity and controlling automatically the population size according to the problem. The experimental results show that parsimonious subsets of features and the classifiers produced a significant improvement in the accuracy. Another multiobjective artificial immune algorithm [17] was used to optimize the kernel and penalize the parameters of support vector machine (SVM). In the training stage of SVM, multiple solutions are found by using a multiobjective artificial immune algorithm, and then, these parameters are evaluated in the test stage. The proposed algorithm is applied to fault diagnosis of induction motors and anomaly detection problems, and successful results are obtained. Rubio-Escudero C. et al. [18] used EMO-CC (evolutionary multiobjective conceptual clustering) to obtain such gene product information, which retrieves meaningful substructures from network databases. The experiment results show that expectation maximization algorithm performs better than other algorithms for the analysis of microarray data. Romero-Zaliz R. et al. [19] proposed a multiobjective methodology to combine state-of-the-art algorithms into an aggregation scheme in order to obtain the optimal methods’ aggregations. The results obtained by the multiobjective algorithm show a major improvement in sensitivity when our methodology is compared to the performance of individual methods for gene finding and gene expression problems. Based on the above discussion, many different multiobjective evolutionary algorithms have been used to handle the feature selection problem. However, these algorithms still have some drawbacks, such as low optimization efficiency, easily falling into local optima and premature convergence. Moreover, this field of study is still in its early days; a large number of future research works is necessary in order to develop a multiobjective algorithm for feature selection.
Recently, the differential evolution algorithm was proposed as a powerful evolutionary algorithm [20,21,22,23], which has good global search and local search capabilities, and it can quickly search out all solutions from the solution space. Several variations of differential evolution (DE) have also been proposed to enhance the performance of the standard DE [24,25,26,27,28,29,30,31]. The algorithm was considered as an intelligent optimization method for heuristic random search in a continuous space. The algorithm consists of three different operators, including mutation, cross-over and selection operators. By these operators, the differential evolution algorithm can generate new individuals by combining the target vector and the trial vector. However, it should be noted that most of these algorithms work in continuous space rather than in discrete space. Therefore, in this paper, we propose a novel multiobjective binary differential evolution algorithm (MOBDE) to solve the binary problem in terms of the feature selection problem.
This paper uses a novel multiobjective differential evolution algorithm for the feature selection problem, and support vector machine (SVM) is used as the classifier with leave-one-out cross-validation (LOOCV). The Fisher-Markov selector is used to choose a fixed number of the top gene expression data features, and then, a multiobjective binary differential evolution algorithm based on the summation of normalized objectives and diversity selection is adopted to select the most important gene subsets. Finally, a classifier SVM is trained based on the gene subset and then used to predict the test sample. Numerical results of ten gene expression data are reported and compared with other algorithms. As is shown, the solutions obtained by the proposed approach are all superior to those best solutions obtained by other algorithms in the literature.

2. Computational Methods

In this part, we shall introduce a hybrid multiobjective binary differential evolution and support vector machine method (MOBDE) for feature selection. The flowchart of the proposed method is shown in Figure 1. As can be seen in this figure, there are mainly three important components, i.e., the Fisher-Markov selector component, the multiobjective binary differential evolution component and the support vector machine component.
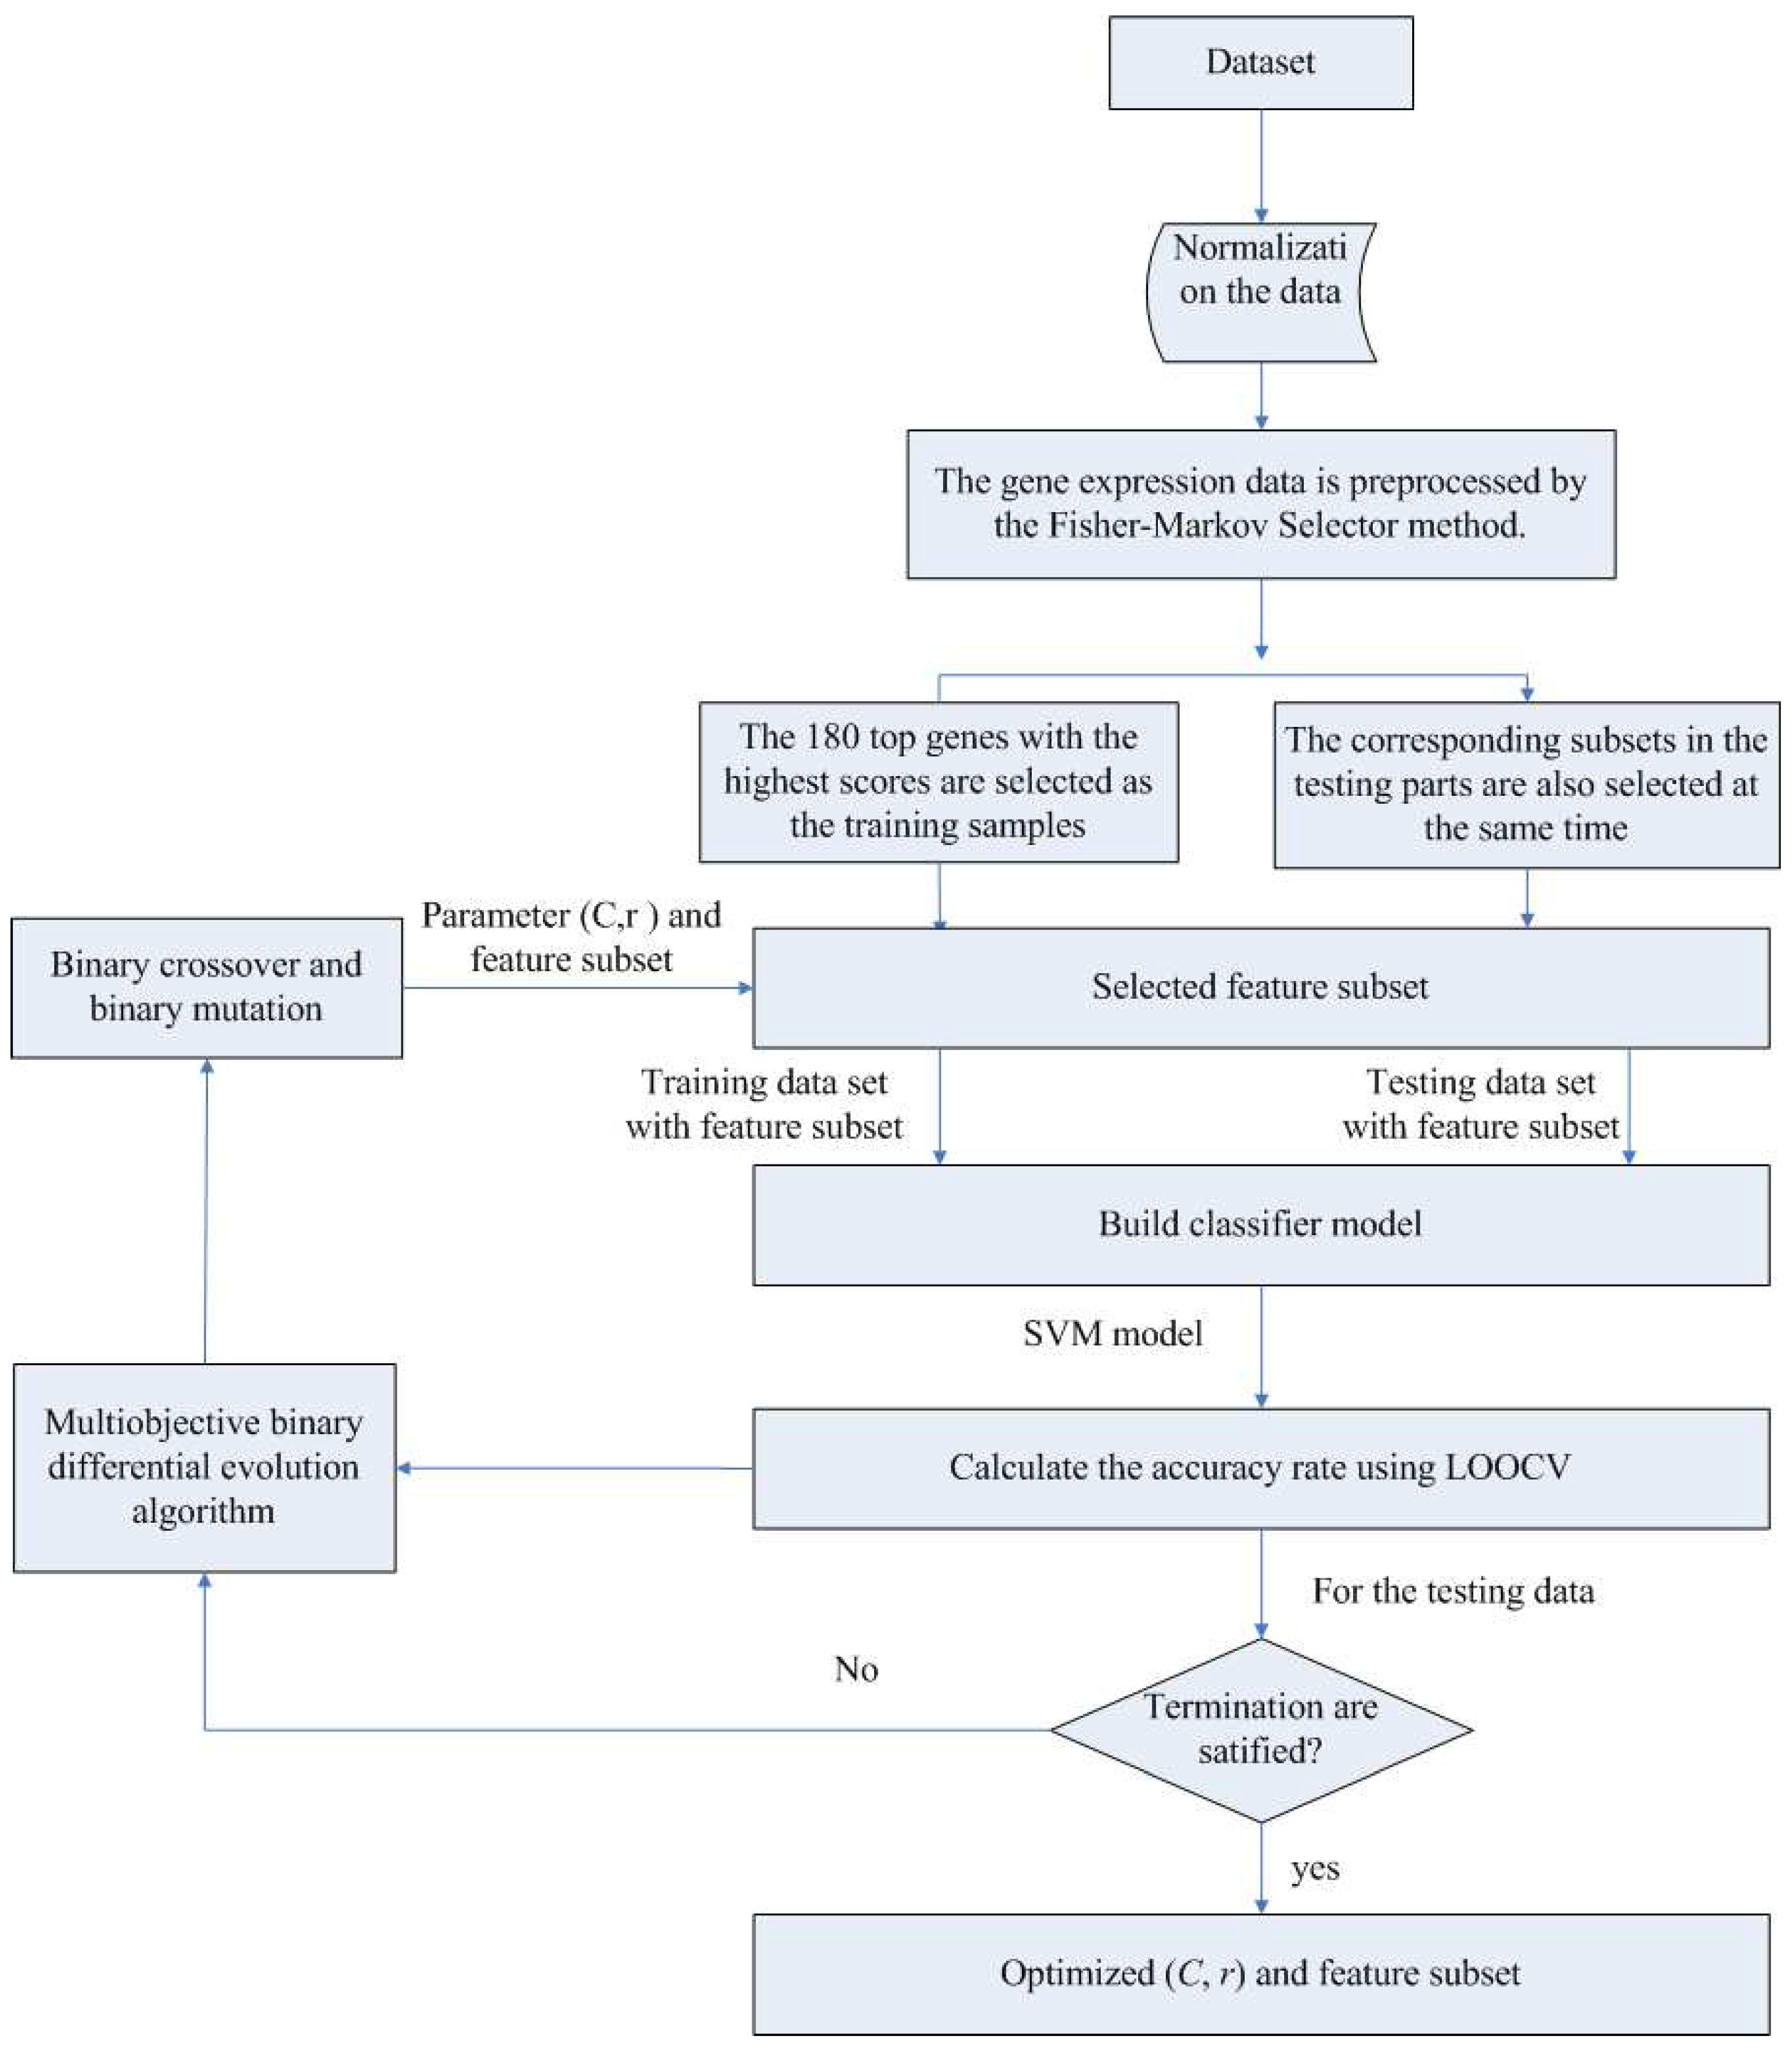
In the first component, the Fisher-Markov selector method is used to select 180 top genes with the highest scores. These selected genes will then be utilized for the second component, multiobjective binary differential evolution component. In this component, at first, a randomly-generated initial solution will be represented by a binary (0/1) string. Then, a novel binary mutation method is proposed to balance the exploration and exploitation ability during the search process. After that, the multiobjective binary differential evolution is proposed by integrating the summation of normalized objectives and diversity selection into the algorithm.
By using MOBDE, the parameters of the support vector machine (SVM) in the third component and the features subset are dynamically optimized. Specifically, for feature selection, each gene is represented as a bit of binary encoded individual, where one denotes a gene selected and zero denotes a non-selected gene. For SVM, two important parameters of RBF kernels, i.e., c and γ, are taken into account. In this sense, the length of each individual is equal to D + 2, where D is the number of genes in the initial microarray dataset. Table 1 shows the solution representation of the algorithm.
From the above solution representation, P c is the parameter C of the SVM, and P γ denotes the parameter γ of SVM. In this paper, we use the evolutionary algorithm to optimize the parameters of SVM and the feature subset in each individual; the multiobjective function can be defined as below:
f 1 = S V M a c c u r y ; f 2 = D R D ; f = [ f 1 ; f 2 ] ;
where S V M a c c u r a c y denotes the classification accuracy of SVM and R denotes the number of selected genes. Finally, The fitness values of each individual will be assessed by the accuracy of LOOCV.

2.1. Fisher-Markov Selector

In the field of machine learning, selecting suitable features is very important for classification. The Fisher-Markov selector is proposed by Cheng et al. [32] to identify the more useful features in describing essential differences among the possible groups. The authors present a way to represent essential discriminating characteristics together with sparsity as an optimization problem. In this paper, we use this method, and the detailed description can be seen in [32].

2.2. Multiobjective Differential Evolution Component

In this part, we shall introduce the proposed multiobjective binary differential evolution algorithm in detail.
As we know, differential evolution (DE) is a fairly novel population-based search heuristic, which is simple to implement and requires little parameter tuning compared with other search heuristics in continuous space.
The process of DE can be summarized into three major steps: mutation, cross-over and selection. In the mutation operator, the process of generating the mutation vectors V i , G = { V 1 , i , G , V 2 , i , G , , V D , i , G } is performed by target vector X i , G = { X 1 , i , G , X 2 , i , G , , X D , i , G } in the current population, where D denotes the dimension of the individual, i denotes the i-th of individual and G denotes the current iteration of the algorithm. In the DE algorithm, “DE/rand/1/bin” is the most common mutation strategies, as below:
V i , G = X r 1 , G + F · ( X r 2 , G X r 3 , G ) ;
where r 1 , r 2 , r 3 [ 1 , , N P ] , r 1 r 2 r 3 i and F is the mutation factor of the differential evolution. N P is the size of the population.
In the cross-over operation, a recombination of the candidate solution V i , G and the parent X i , G produces an offspring solution U i , G = [ U 1 , i , G , U 2 , i , G , , U D , i , G ] . Usually, the binomial cross-over is accepted, which is defined as follows:
U j , i , G = V j , i , G ( rand j [ 0 , 1 ] C R ) o r ( j = j rand ) X j , i , G otherwise
where j [ 1 , , D ] ; rand j [ 0 , 1 ] is a random number between zero and one; j rand [ 1 , , D ] is a randomly chosen index. C R is the cross-over rate.
A greedy selection is used to choose the next population ( i . e . , G = G + 1 ) between the parent population and the offspring population. The selection operation is described as follows:
X i , G + 1 = U i , G f ( U i , G ) f ( X i , G ) X i , G otherwise
As we know, the original differential evolution algorithm is a continuous optimization algorithm, but the feature selection problem is a classic binary optimization problem. Therefore, the original continuous encoding scheme of DE cannot be used directly for gene selection problems. In order to make DE suitable to solve the gene selection problem, a binary differential evolution (BDE) algorithm is proposed first. In the proposed method, the initial population is represented as a vector in which each bit is a binary value of zero or one, where one denotes this gene is selected and zero denotes a non-selected gene. The objective function values are calculated, and then, new binary populations are transported into the mutation operators. The binary cross-over operations are used to generate the trail solution. Finally, greedy selection method is used to choose the better results for the next generation.
During the reconstruction of the mutation operation, the key idea is to use some appropriate operators in place of the arithmetic operators. In [33], He and Han used the XOR, AND and OR operations instead of the subtraction, multiplication and addition operations in the formula, which can be described as follows:
V j , i , G + 1 = X j , r 1 , G F ( X j , r 2 , G X j , r 3 , G )
where ⊕ denotes the XOR operations, ⊗ represents the AND operation and ⊙ denotes the OR operation. Note that in Formula (5), the use of OR operation will make the probability of a result be true. The probability of the binary “1” will be three times higher than the probability to be false (binary “0”). In other words, the binary “1” would be easily accumulated with the binary string V j , i , G + 1 of the trial solution after the OR operation. This would decrease the diversity of the algorithm. Accordingly, in [34], another novel mutation operation is proposed by considering the distance of the X r 1 , G and X r 2 , G for each dimension:
V j , i , G + 1 = 1 , i f ( r a n d < F ) ( X j , r 1 , G X j , r 2 , G ) ; 0 , o t h e r w i s e ;
Compared with Formula (5), the new mutation strategy can enhance the diversity of the algorithm because it does not use the OR operation. However, in this formula, the value of the previous generation will be discarded. Therefore, it cannot inherit the advantage of the original individual from the previous population.
Therefore, in this paper, we propose a new mutation strategy, which can both increase the diversity of the algorithm and take advantage of the original population, as described in the following:
( X j , r 1 , G X j , r 2 , G ) , i f ( r a n d < F ) ( X j , r 1 , G = X j , r 2 , G ) ; ( X j , r 1 , G X j , r 3 , G ) , i f ( r a n d < F ) ( X j , r 1 , G X j , r 2 , G ) ; X j , r 1 , G , o t h e r w i s e ;
As can be seen in this formula, first, it does not use the OR operation, so this operation will not harm the diversity of the algorithm. Second, the values of the previous generation, e.g., X j , r 1 , G , X j , r 2 , G , X j , r 3 , G , will be kept with a probability. In this way, the algorithm can inherit the advantage of the original individual from the previous population. Following the binary mutation strategy, a binary cross-over operator is used to build a trial solution U j , i , G + 1 by combining the mutation vector and the target vector. The concept of the binary cross-over mechanism of BDE is similar to that of the original DE, though there is a difference in terms of the component data type. In BDE, the binary data is selected from the mutation vector if a random number is smaller than the cross-over rate; otherwise, the original solution is chosen to generate the trail solution. After the binary mutation and cross-over operator, the better solutions between the trial solution and the target solution will be retained to the next generation.
Based on the binary differential evolution algorithm, we will propose our multiobjective binary differential evolution algorithm (MOBDE). Specifically, in our method, two fitness objectives are taken into account for optimization. One is the accuracy of the classification, and the other is the number of selected genes. In order to tackle the feature selection problem, a non-dominated sorting process is often used to find the Pareto front. However, the non-dominated sorting process is always complex and time consuming. In order to solve this problem, Qu and Suganthan [35] used the summation of the normalized objective and diversity selection, and in this paper, we use a very similar method based on the summation of the normalized objective and diversity selection for the feature selection problem. For the summation of the normalized objective, first, we need to find the maximum and minimum value for every objective and calculate the different range of every objective; then, we need to sum all normalized objective values to obtain a single value. In this way, the multiobjective problem can be regarded as a single-objective optimization problem. However, this kind of transformation may cause the problem of lacking the diversity of the population. Therefore, the diversity selection method is used to maintain the diversity of the algorithm.
The preferential set and backup set are generated from the current population, and three rules are used to select the sets in the next process:
  • The preferential set can be selected in the next process firstly.
  • The backup set will be chosen based on the summation of the normalized objective and diversity selection if the preferential set is not sufficient for the solution.
  • While the individuals in the store exceed the maximum size, the required number of solutions will be randomly chosen from the preferential set.
Based on the above discussion, we can show the framework of our multiobjective binary differential evolution algorithm as follows in Algorithm 1.
Algorithm 1 Algorithm description of the MOBDE algorithm
  • Set the generation counter G = 0 ; and randomly initialize a population of N P individuals X i .
  • Initialize the parameters F, C R .
  • Evaluate the fitness for each individual in P.
  • Return the non-dominated solutions A r 0 from the individual P.
  • while stopping criteria is not satisfied do
  •     for i = 1 to N P do
  •         select randomly r 1 r 2 r 3 i
  •         for j = 1 to D do
  •            if r a n d < C R | | j r a n d = j then
  •                if r a n d < F & X r 1 , j , G = X r 2 , j , G then
  •                     U i , j = ( X r 1 , j , G , X r 2 , j , G )
  •                else if r a n d < F & X r 1 , j , G X r 2 , j , G then
  •                     U i , j = ( X r 1 , j , G , X r 3 , j , G )
  •                else
  •                     U i , j = X r 1 , j , G
  •                end if
  •            else
  •                 U i , j = X i , j , G
  •            end if
  •         end for
  •     end for
  •     Calculate the objective function for the new population
  •     Select the better individual based on the summation of normalized objectives and diversified selection
  •     Update the archive A r G + 1 based on the new individual
  • end while

2.3. Support Vector Machines

In our system, the support vector machine with the leave-one-out cross-validation serves as the evaluator of the multiobjective binary differential evolution algorithm. Let x i R d , i = 1 , 2 , , n , and y i 1 , + 1 , i = 1 , 2 , , n , be a set of training samples and the corresponding labels, respectively. Vapnik and Cortes [36] defined the SVM method as follows:
m i n 1 2 ω 2 + C · i = 1 N ξ i ; s . t . y i ( ω · q i + b ) 1 ξ i , i = 1 , 2 , , n .
where ω is a normal vector to the hyperplane and b is a constant, such that b ω represents the Euclidean distance between the hyperplane and the original feature space. The ξ i is the slack variables to control the training errors, and C is a penalty parameter of SVM. In this paper, the radial basis function (RBF) is used in SVM to obtain the optimal solution for classification. Considering two samples q i = [ q i , 1 , q i , 2 , , q i , d ] T , q j = [ q j , 1 , q j , 2 , , q j , d ] T , i j and i , j are the different samples, the RBF function is calculated by using K ( q i , q j ) = e x p ( γ q i q j 2 ) , where γ > 0 is the width of the Gaussian. K ( q i , q j ) is the kernel function.
For the RBF kernel function, C and γ are the very important parameters, and the performance of SVM depends on the choice of kernel function in terms of the parameters C and γ. If the value of C is large, the accuracy value of the training will perform better, but the test rate will perform worse. Meanwhile, if the value of C is small, the accuracy rate will be unsatisfactory, though the test accuracy rate may be high. Sometimes, the parameter γ has a more effective effect on the test phase than the parameter C. In order to optimize the feature selection and parameter simultaneously, in the modified MOBDE, each individual is encoded to a string of binary bits associated with the number of genes, and the parameters C and γ of the SVM will be dynamically optimized by a real code differential evolution in Equations (3) and (4). Specifically, the constrained ranges of the value of C and γ are [ 5 , 15] and [ 15 , 5] respectively. In our method, the classification accuracy of the prediction models and the number of selected genes derived from all datasets will be measured by the LOOCV procedure discussed in Section 2.

2.4. Computational Complexity of the Multiobjective Binary Differential Evolution with Support Vector Machine

In this part, we will analyze the time complexity of the multiobjective binary differential evolution with support vector machine model. In the beginning of the algorithm, the Fisher-Markov selector is used to choose the suitable feature. Cheng Q. et al. [32] shows that the complexity of the Fisher-Markov selector is O ( n 2 ) , where n is the size of the dataset. Then, for each iteration of MOBDE, the SVM needs to be called. Tsang et al. [37] shows that the data subroutines of standard SVM are O ( n 3 ) , where the summation of the normalized objective values method is O ( M · N P ) , where N P denotes the population size and M is the number of objectives. Therefore, for each iteration, the runtime complexity is O ( M · N P · n 3 + n 2 ) . Suppose the total number of iterations is I; the time complexity of the algorithm is then O ( I · M · N P · n 3 + n 2 ) . In this paper, M is two. Therefore, the time complexity is O ( 2 · I · N P · n 3 + n 2 ) , i.e., O ( I · N P · n 3 )

2.5. Why Use Each Finding in the Algorithm and the Strong Impact of the Finding

Firstly, the first problem is why we use the Fisher-Markov selector. The reason is that the Fisher-Markov selector selects the more suitable features to describe essential differences among the possible groups. This method uses the Markov random field optimization techniques to solve the formulated objective functions for simultaneous feature selection. The method is fast; in particular, it can be linear in the number of features and quadratic in the number of observations. The algorithm has been used to solve the high-dimensional microarray gene expression datasets better. Therefore, in this paper, we firstly use the Fisher-Markov selector to select the feature.
Secondly, the second problem is why we use the multiobjective binary differential evolution to solve this problem. As we know, the original differential evolution algorithm is a continuous optimization algorithm, but the feature selection problem is a classic binary optimization problem. Therefore, the original continuous encoding scheme of DE cannot be used directly for gene selection problems. In order to make DE applicable to the gene selection problem, a binary differential evolution (BDE) algorithm is proposed first. As shown in Section 2.2, previous work may either decrease the diversity of the algorithm or the new individual cannot inherit the advantage of the original individual from the previous population. Therefore, in this paper, we propose a new mutation strategy, which can both increase the diversity of the algorithm and take advantage of the original population.

3. Experimental Setup

To demonstrate the effectiveness of the MOBDE algorithm, the experiments are performed on 10 benchmark datasets. All of these characteristics of gene expression datasets are listed in Table 2. The gene expression datasets consist of 10 well-known datasets. These datasets have been widely used by researchers as a primary source of feature selection datasets. The library for support vector machines (LIBSVM) is proposed by Chang and Lin [38]. The datasets are classified by LIBSVM based on LOOCV. We compared our method with some binary differential evolution algorithms: binary DE [33], binary differential evolution (BDE) [34], binary differential evolution with artificial immune system (BDEAIS) [39], binary particle swarm optimization (BPSO) [40], binary genetic algorithm (BGA) [41] and binary estimation distribution algorithm (BEDA) [42]. In this paper, we replace these methods with our binary method and then compare our method to show the effective of the algorithm. That is to say, all of these methods use the same multiobjective framework. Meanwhile, we compare our algorithm with the nondominated sorting genetic algorithm II (NSGAII) in order to show the difference of the summation of the normalized objective and diversified selection with the non-domination sorting process. As the same time, we also compare our method with some optimization methods, including SVM + grid search, improved binary particle swarm optimization (IBPSO), hybrid binary particle swarm optimization and tabu search (HPSOTS), PSO/GA [5,6,7,8] and some different versions of support vector machines. The parameters are as follows.
For all algorithms, the population size is 50; the maximum number of iterations is 100. For the different version of binary DE algorithms [33,34,39], the value of the F is 0.5, and the value of C R is 0.7. For the genetic algorithm, the cross-over rate is 0.7, and the mutation rate is 0.5. For the binary PSO, the values of c1 and c2 are both 2. For the binary estimation of the distribution algorithm, the probability of selection is 0.3. The parameters were selected (after some preliminary experiments) so as to result in roughly the best results generated by the algorithms used for comparison. However, with different strategies used by each algorithm, it is very difficult to ensure the best suitable parameters as reflected in the experiments.

3.1. Discussions and Analysis

As is discussed in the previous section, LOOCV is used in our algorithm. As the training set and test set are changing under the LOOCV strategy, the genes selected and the test accuracy are different each time. Table 3 and Table 4 show the test accuracy and the number of genes selected in 10 runs on the ten datasets. As we can observe in Table 3, the results of the proposed methods are almost consistent on all datasets. Moreover, MOBDE can obtain 100% LOOCV accuracy with less than 10 selected genes for the Leukemia1, Leukemia2, small, round blue cell tumors (SRBCT) and diffuse large B-cell lymphomas (DLBCL) datasets. For another dataset, Brain_Tumor2, from the Table 3, we can find that MOBDE obtains 100% accuracy with smaller selected genes. For the average accuracy, the MOBDE algorithm can obtain 99% accuracy. Meanwhile, the average number of selected genes is 7.5. For the gene expression data 11_Tumors, the MOBDE algorithm can provide 97.19% accuracy with less than 40 selected genes. It is noted that the MOBDE can obtain more than 98% accuracy four times. For the dataset Lung Cancer in Table 4, MOBDE can provide 100% LOOCV accuracy two times. The average accuracy rate of MOBDE can provide 99.12 with less than 30 selected genes. Meanwhile, the MOBDE can obtain the average selected genes of 15.5. For the dataset Prostate_Tumor, the MOBDE algorithm can provide 98.63% average LOOCV accuracy with 10.9 selected genes. For the dataset Brain_Tumor1, the MOBDE algorithm can also provide more than 97% classification accuracy. Among them, for Lung Cancer and Prostate Tumor, the algorithm can also find 100% classification accuracies for two and one times, respectively. From the point of view of the accuracy average in each independent run, the LOOCV accuracy and the number of selected genes obtained by MOBDE are shown in Figure 2 and Figure 3.
From the results in Table 5, we can find that the average percentage of genes selected is 0.0016. For the Leukemia1, Leukemia2, SRBCT and DLBCL datasets, our algorithm provides 100% LOOCV accuracy, even though the percentage of genes selected for these datasets is reduce to 0.0011, 0.0005, 0.0023 and 0.0010 of the total available, respectively. Therefore, it can demonstrate that not all features are necessary for achieving better classification accuracy. Figure 4 shows the percentage of genes selected.
In order to analyze each part of our algorithm, four different experiments are designed. The first one is to show the effectiveness of the Fisher-Markov selector. The second and third experiments are to show the effectiveness of the novel binary differential evolution algorithm compared with other meta-heuristic algorithms. The fourth experiment is to show the effectiveness of the MOBDE compared with the grid-search SVM without feature selection method. For the first experiment, we compare MOBDE with the Fisher-Markov selector and MOBDE without the Fisher-Markov selector. The results of the MOBDE with the Fisher-Markov selector and MOBDE without the Fisher-Markov selector are summarized in Table 6. The results represented in Table 6 show that both MOBDE with the Fisher-Markov selector and MOBDE without the Fisher-Markov selector provide 100% classification accuracy for Leukemia2 and DLBCL. MOBDE with the Fisher-Markov selector provides less genes selected for all datasets. For the 9_Tumors, Brain_Tumors1 and Brain_Tumors2 datasets, MOBDE can not only provide better classification accuracy, but also a lower number of genes selected. However, for 11_Tumors, Lung_cancer and Prostate_Tumor, MOBDE with the Fisher-Markov selector cannot obtain better classification accuracy than the latter, which demonstrates that the Fisher-Markov selector is not suitable for solving different problems. Overall, the Fisher-Markov selector is very effective in feature selection for the bioinformatics dataset.
For the second experiment, we compare our algorithm with three different versions of binary differential evolution: binary DE, BDE and BDEAIS. We replace our binary differential evolution in MOBDE by using the binary DE, BDE and BDEAIS [33,34,39]. That is to say, all of these methods use the same multiobjective framework to conduct a fair comparison. Therefore, the purpose of this experiment is to show the effectiveness of the new mutation strategy. Table 7 shows the results obtained by different binary differential evolution algorithms in terms of the mean and standard deviation (S. D.) of the classification accuracy and the number of genes selected. As can be seen in Table 7, for Leukemia2, SRBCT and DLBCL, all algorithms can obtain 100% LOOCV accuracy. However, MOBDE can obtain fewer genes selected. For the 11_Tumors dataset, the BDE can provide the best solution of 97.24% with the number of the genes selected being 48.4. The MOBDE can provide a similar accuracy of 97.19% and a lower number of genes selected of 27.5. For Leukemia1, three out of four algorithms can find the best accuracy with 100% LOOCV. For the rest of the datasets, the best classification and a lesser number of genes selected are provided by the MOBDE. Therefore, we can draw the conclusion that the MOBDE can obtain a better performance compared with other binary differential evolution algorithms.
In order to show the effectiveness of the binary differential evolution, we also compare our algorithm with other well-known metaheuristics, such as the genetic algorithm [40], particle swarm optimization [41] and the estimation of distribution algorithm [42]. In order to conduct a fair comparison, we replace our binary differential evolution in MOBDE by using these metaheuristics. All of these methods use the same multiobjective framework. Table 8 shows the results obtained by binary differential evolution, the genetic algorithm, particle swarm optimization and the estimation of distribution algorithm in terms of the mean and standard deviation (S. D.) of the classification accuracy and the number of genes selected. We can observe in this table that MOBDE clearly outperforms other algorithms in all of the datasets. Therefore, we can conclude that our proposed algorithm shows an efficient and better performance in comparison with these algorithms. In addition, we also list the time of these algorithms in Table 9.
In the test experiment, we compare our proposed method MOBDE with the grid-search SVM without feature selection method. The results are listed in Table 10. From the table, better results between the two algorithms are shown in shaded cells. It is easy to see that both the classification accuracy and the number of selected genes of MOBDE are superior to grid search SVM. This also demonstrates the effectiveness of MOBDE.

3.2. Compared with Some Single-Objective Algorithms

In order to demonstrate the effectiveness of the proposed method, we also compared our work with some single-objective algorithms. It is worth mentioning that in the previous research, many single-objective algorithms only focused on the accuracy rate of the classification. Therefore, in this paper, we also use the accuracy rate as the compared criteria. Table 11 and Table 12 show the results obtained by the MOBDE with other single-objective algorithms including IBPSO1 [8], IBPSO2 [6] and hybrid binary particle swarm optimization and tabu search (HPSOTS). As can be seen in Table 11 and Table 12, we can find that the MOBDE algorithm can provide a higher LOOCV classification accuracy on all datasets compared with the other PSO algorithms [6,7,8] and the other SVM-based algorithms [43,44], except Leukemia1 data. For the Leukemia1 data, the algorithm MOBDE, IBPSO1 [8] and IBPSO2 [6] can all obtain a 100% accuracy rate, while IBPSO1 [8] can obtain a lesser number of genes compared with MOBDE. Based on the above analysis, we can conclude that when only considering the accuracy of classification, the MOBDE algorithm can also perform better than the other algorithms.

3.3. Compared with A Multiobjective Algorithm

In this section, we compare our algorithm with a well-known multiobjective optimization algorithm (NSGAII) [9]. The NSGAII algorithm is based on the non-dominated sorting and crowding distance method. Generally speaking, as is shown in Table 13, for all gene datasets, the MOBDE algorithm can provide better accuracy and smaller selected genes for most datasets compared with NSGAII. In Table 13, we also show the computation time comparison of these two algorithms. As can be seen in this table, in all instances, the computational time of our algorithm is less than that of NSGAII. The reason is that our algorithm is still efficient, and the time complexity is O ( I N T 3 ) , as discussed in Section 2. As for NSGAII, we can simply analyze its time complexity here. In NGSAII, for each iteration, the non-dominated sorting is O ( M ( 2 N ) 2 ) , and the crowding-distance assignment is O ( M ( 2 N ) l o g ( 2 N ) ) , where N is the population size and M is the number of objectives; the data subroutines of standard SVM are O ( T 3 ) ; so the overall complexity of the iteration is O ( 4 M N 2 T 3 ) . Given the I iteration, the total time complexity of NSGAII is O ( 4 I M N 2 T 3 ) , i.e., O ( I N 2 T 3 ) . Obviously, our algorithm is more efficient than NSGAII based on the above analysis. There may be two reasons that our algorithm performs better than NSGAII with fewer selected genes. The first reason is that the new binary mutation strategy used in MOBDE tends to enhance the diversity of the population and share the previous good individuals with the next generation. The second reason is that there may be only very few genes that are necessary for achieving the better classification accuracy, and our method seems more efficient for selecting such genes.

3.4. The Paired Wilcoxon’s Signed Rank Test of Our Algorithm with Other Algorithms

In this part, the paired Wilcoxon’s signed rank test is adopted to compare MOBDE with other algorithms to verify whether the experiment results of MOBDE are better than other algorithms [45]. The Wilcoxon’s signed-rank test is a non-parametric statistical hypothesis test, which can be used as an alternative to the paired t-test when the results cannot be assumed to be normally distributed. In the paired Wilcoxon’s signed rank test, the null hypothesis represents that there is no significant improvement compared with other feature selection algorithms, and the alternative hypothesis represents that our algorithm is significantly different compared with other feature selection methods. As an example, we can compare our algorithm MOBDE with the well-known algorithm NSGAII. The null hypothesis and alternative hypothesis can be described respectively as follows: H 0 : φ M O B D E = φ N S G A I I and H 1 : φ M O B D E > φ N S G A I I , where φ M O B D E and φ N S G A I I denote the average accuracy and the number of features selected of MOBDE and NSGAII on all datasets, respectively. As can be seen in Table 14, we can find that the p-values obtained by the paired Wilcoxon’s signed rank test between MOBDE and other algorithms are all less than the standard significance level 5%. Therefore, we can draw the conclusion that our algorithm MOBDE significantly outperforms the other algorithms.

3.5. Independent Dataset

In order to check the effectiveness of the final model, an independent test set is needed to test the final model. We set aside approximately 20%–30% of the data for testing the final models by predicting the apoptosis protein locations. Firstly, the raw data constructed by Chen and Li [46] contained 317 apoptosis proteins. According to their subcellular locations, proteins were classified into six groups: 112 cytoplasmic proteins, 34 mitochondrial proteins, 52 nuclear proteins, 17 secreted proteins, 55 membrane proteins and 47 endoplasmic reticulum proteins. In addition, the 98 apoptosis proteins sourced form the paper [47] containing 43 cytoplasmic proteins, 30 plasma membrane-bound proteins, 13 mitochondrial proteins and 12 other proteins are used to test the algorithm. The following step should be used to prepare high quality datasets. We compared our method with other methods, such as PSORT [48] and GASVM [47]. For the leave-one-out cross-validation, each protein is singled out from the benchmark dataset as the test protein, and the remaining proteins would serve as the training dataset to train the predict model. Therefore, we used the leave-one-out cross-validation to evaluate the proposed method.
The support vector machine is used to measure the accuracy of the leave-one-out cross-validation on the feature subset produced by MOBDE. The datasets based on 317 apoptosis proteins are partitioned into one testing sample and D-1 training sample. Each individual will take turns being the testing dataset. The other D-1 individuals serve as the training dataset for determining the model prediction parameter. The swarm intelligence algorithm is used for selecting a near-optimal subset of informative features that is most relevant for the classification. The overall accuracy is 92.43%. The accuracy of the our method for cytoplasm proteins is 97.32%, for mitochondrial proteins is 88.24%, for nuclear proteins is 94.23%, for secreted proteins is 76.47%, for membrane proteins is 87.27% and for endoplasmic reticulum proteins is 93.62%. Then, we use the proposed method to predict the independent dataset including 98 proteins. The results are shown in Table 15. From Table 15, the accuracy is 95.92%. The accuracy of our method for cytoplasm proteins is 97.67%, for mitochondrial proteins is 100%, for membrane proteins is 92.31% and for other proteins is 83.33%. From the compared results, the feature selection method can reduce the data dimensionality and find out an optimal amount of features that result in the better performance of the predict model. We hope that the promising results using the new feature selection method can improve the performance of protein subcellular location prediction.

4. Conclusions

The objective of this study is to provide a multiobjective optimization method for feature selection. Our proposed method called MOBDE embraces the strength of the binary differential evolution for classification method and find the smaller subsets. In the first stage, we use the Fisher-Markov selector method to rank the scores of the features and select the 180 top features as the input of the binary differential evolution. Then, a novel binary differential evolution is proposed to select the feature subset. Following that, we propose a multiobjective differential evolution method for the feature selection based on the summation of the normalized objective and diversity selection on ten gene expression datasets. According to the experiments, the following can be concluded.
  • The proposed method can find useful informative features in terms of classification accuracies
  • By using this feature selection method, there is no need to set the number of selected features since the proposed algorithm can automatically select the most useful features in terms of classification accuracies.
  • To show the effectiveness of the Fisher-Markov selector, the experiment of MOBDE with the Fisher-Markov selector and MOBDE without the Fisher-Markov selector is designed. The experimental results show that the Fisher-Markov selector is very effective in feature selection for the bioinformatics dataset.
  • To show the effectiveness of the proposed differential evolution, we compare our algorithm with three different versions of binary differential evolution: binary DE, BDE and BDEAIS. It is better than these different binary differential evolution algorithms in terms of classification accuracy and the number of selected features. Meanwhile, our algorithm also provides better solutions than other binary evolutionary algorithm, including BGA, BPSO and BEDA.
  • Compared with some single objective algorithms, our algorithm outperforms the best algorithm so far on these problems.
The proposed MOBDE algorithm is not only suitable for feature selection and classification in gene expression data, but also for other application domains, such as electricity load forecasting, face recognition and vehicle detection or any other high dimensional data classification.

Acknowledgments

The authors would like to thank the anonymous reviewers for their helpful comments. This research is supported by the National Natural Science Foundation of China under Grant No. 61603087 and also funded by the Natural Science Foundation of Jilin Province under Grant No. 20160101253JC.

Author Contributions

Shijing Ma and Xiangtao Li designed the algorithm and experiments. Shijing Ma performed the experiments. Yunhe Wang analyzed the experimental results. Shijing Ma and Xiangtao Li wrote the algorithm and the experimental sections of the paper. Xiangtao Li organized the structure of the paper. All authors have read and approved the final manuscript.

Conflicts of Interest

The authors declare no conflict of interest.

References

  1. Li, X.; Yin, M. Multiobjective binary biogeography based optimization for feature selection using gene expression data. IEEE Trans. Nanobiosci. 2013, 12, 343–353. [Google Scholar] [CrossRef]
  2. Liu, B.; Tian, M.; Zhang, C.; Li, X. Discrete Biogeography Based Optimization for Feature Selection in Molecular Signatures. Mol. Inform. 2015, 34, 197–215. [Google Scholar] [CrossRef] [PubMed]
  3. Mitra, S.; Kundu, P.P.; Pedrycz, W. Feature selection using structural similarity. Inform. Sci. 2012, 198, 48–61. [Google Scholar] [CrossRef]
  4. Xue, B.; Zhang, M.J.; Browne, W.N. Particle Swarm Optimization for Feature Selection in Classification: A Multi-Objective Approach. IEEE Trans. Cybern. 2013, 43, 1656–1671. [Google Scholar] [CrossRef] [PubMed]
  5. Mukhopadhyay, A.; Mandal, M. A Hybrid Multiobjective Particle Swarm Optimization Approach for Non-redundant Gene Marker Selection. In Proceedings of the International Conference on Bio-Inspired Computing: Theories and Applications, Huangshan, China, 12–14 July 2013; pp. 205–216.
  6. Chuang, L.Y.; Chang, H.W.; Tu, C.J.; Yang, C.H. Improved binary PSO for feature selection using gene expression data. Comput. Biol. Chem. 2008, 32, 29–38. [Google Scholar] [CrossRef] [PubMed]
  7. Li, S.; Wu, X.; Tan, M. Gene selection using hybrid particle swarm optimization and genetic algorithm. Soft Comput. 2008, 12, 1039–1048. [Google Scholar] [CrossRef]
  8. Mohamad, M.S.; Omatu, S.; Deris, S.; Yoshioka, M. A modified binary particle swarm optimization for selecting the small subset of informative genes from gene expression data. IEEE Trans. Inf. Technol. Biomed. 2011, 15, 813–822. [Google Scholar] [CrossRef] [PubMed] [Green Version]
  9. Kannan, S.S.; Ramaraj, N. A novel hybrid feature selection via Symmetrical Uncertainty ranking based local memetic search algorithm. Knowl.-Based Syst. 2010, 23, 580–585. [Google Scholar] [CrossRef]
  10. Gutiérrez-Avilés, D.; Rubio-Escudero, C.; Martínez-Álvarez, F.; Riquelme, J.C. TriGen: A genetic algorithm to mine triclusters in temporal gene expression data. Neurocomputing 2014, 132, 42–53. [Google Scholar] [CrossRef]
  11. Xue, B.; Zhang, M.; Browne, W.N. Particle swarm optimisation for feature selection in classification: Novel initialization and updating mechanisms. Appl. Soft Comput. 2014, 18, 261–276. [Google Scholar] [CrossRef]
  12. Huang, B.; Buckley, B.; Kechadi, T.M. Multi-objective feature selection by using NSGA-II for customer churn prediction in telecommunications. Expert Syst. Appl. 2010, 37, 3638–3646. [Google Scholar] [CrossRef]
  13. Zhou, A.; Qu, B.Y.; Li, H.; Zhao, S.Z.; Suganthan, P.N.; Zhang, Q. Multiobjective evolutionary algorithms: A survey of the state of the art. Swarm Evolut. Comput. 2011, 1, 32–49. [Google Scholar] [CrossRef]
  14. Xue, B.; Cervante, L.; Shang, L.; Browne, W.N.; Zhang, M. A multiobjective particle swarm optimisation for filter-based feature selection in classification problems. Connect. Sci. 2012, 24, 91–116. [Google Scholar] [CrossRef]
  15. Mohamad, M.S.; Omatu, S.; Deris, S.; Misman, M.F.; Yoshioka, M. A multiobjective strategy in genetic algorithms for gene selection of gene expression data. Artif. Life Robot. 2009, 13, 410–413. [Google Scholar] [CrossRef]
  16. Castro, P.A.; Von Zuben, F.J. Multi-objective feature selection using a Bayesian artificial immune system. Int. J. Intell. Comput. Cybern. 2010, 3, 235–256. [Google Scholar] [CrossRef]
  17. Aydin, I.; Karakose, M.; Akin, E. A multiobjective artificial immune algorithm for parameter optimization in support vector machine. Appl. Soft Comput. 2011, 11, 120–129. [Google Scholar] [CrossRef]
  18. Rubio-Escudero, C.; Martínez-Álvarez, F.; Romero-Zaliz, R.; Zwir, I. Classification of gene expression profiles: Comparison of K-means and expectation maximization algorithms. In Proceedings of the IEEE Eighth International Conference on Hybrid Intelligent Systems (HIS’08), Barcelona, Spain, 10–12 September 2008; pp. 831–836.
  19. Romero-Zaliz, R.; Rubio-Escudero, C.; Zwir, I.; del Val, C. Optimization of multi-classifiers for computational biology: Application to gene finding and expression. Theor. Chem. Acc. 2010, 125, 599–611. [Google Scholar] [CrossRef]
  20. Storn, R.; Price, K. Differential evolution-a simple and efficient heuristic for global optimization over continuous spaces. J. Glob. Optim. 1997, 11, 341–359. [Google Scholar] [CrossRef]
  21. Das, S.; Suganthan, P.N. Differential evolution: A survey of the state-of-the-art. IEEE Trans. Evolut. Comput. 2011, 15, 4–31. [Google Scholar] [CrossRef]
  22. Wang, Y.; Li, H.X.; Yen, G.G.; Song, W. MOMMOP: Multiobjective optimization for locating multiple optimal solutions of multimodal optimization problems. IEEE Trans. Cybern. 2015, 45, 830–843. [Google Scholar] [CrossRef] [PubMed]
  23. Wang, Y.; Li, H.X.; Huang, T.; Li, L. Differential evolution based on covariance matrix learning and bimodal distribution parameter setting. Appl. Soft Comput. 2014, 18, 232–247. [Google Scholar] [CrossRef]
  24. Wang, Y.; Cai, Z.; Zhang, Q. Enhancing the search ability of differential evolution through orthogonal cross-over. Inf. Sci. 2012, 185, 153–177. [Google Scholar] [CrossRef]
  25. Liu, H.; Cai, Z.; Wang, Y. Hybridizing particle swarm optimization with differential evolution for constrained numerical and engineering optimization. Appl. Soft Comput. 2010, 10, 629–640. [Google Scholar] [CrossRef]
  26. Zheng, Y.J.; Xu, X.L.; Ling, H.F.; Chen, S.Y. A hybrid fireworks optimization method with differential evolution operators. Neurocomputing 2015, 148, 75–82. [Google Scholar] [CrossRef]
  27. Guo, S.M.; Yang, C.C. Enhancing differential evolution utilizing eigenvector-based cross-over operator. IEEE Trans. Evolut. Comput. 2015, 19, 31–49. [Google Scholar]
  28. Wang, Y.; Liu, Z.Z.; Li, J.; Li, H.X.; Yen, G.G. Utilizing cumulative population distribution information in differential evolution. Appl. Soft Comput. 2016, 48, 329–346. [Google Scholar] [CrossRef]
  29. Li, X.; Yin, M. Modified differential evolution with self-adaptive parameters method. J. Comb. Optim. 2016, 31, 546–576. [Google Scholar] [CrossRef]
  30. Wang, Y.; Cai, Z.; Zhang, Q. Differential evolution with composite trial vector generation strategies and control parameters. IEEE Trans. Evolut. Comput. 2011, 15, 55–66. [Google Scholar] [CrossRef]
  31. Zhang, J.; Sanderson, A.C. JADE: Adaptive differential evolution with optional external archive. IEEE Trans. Evolut. Comput. 2009, 13, 945–958. [Google Scholar] [CrossRef]
  32. Cheng, Q.; Zhou, H.; Cheng, J. The Fisher-Markov selector: Fast selecting maximally separable feature subset for multiclass classification with applications to high-dimensional data. IEEE Trans. Pattern Anal. Mach. Intell. 2011, 33, 1217–1233. [Google Scholar] [CrossRef] [PubMed]
  33. He, X.; Han, L. A novel binary differential evolution algorithm based on artificial immune system. In Proceedings of the 2007 IEEE Congress on Evolutionary Computation, Singapore, 25–28 September 2007; pp. 2267–2272.
  34. Gong, T.; Tuson, A.L. Differential evolution for binary encoding. In Soft Computing in Industrial Applications; Springer: Berlin/Heidelberg, Germany, 2007; pp. 251–262. [Google Scholar]
  35. Qu, B.Y.; Suganthan, P.N. Multi-objective evolutionary algorithms based on the summation of normalized objectives and diversified selection. Inf. Sci. 2010, 180, 3170–3181. [Google Scholar] [CrossRef]
  36. Cortes, C.; Vapnik, V. Support-Vector Networks. Mach. Learn. 1995, 20, 273–297. [Google Scholar] [CrossRef]
  37. Tsang, I.W.; Kwok, J.T.; Cheung, P.M. Core vector machines: Fast SVM training on very large data sets. J. Mach. Learn. Res. 2005, 6, 363–392. [Google Scholar]
  38. Chang, C.C.; Lin, C.J. LIBSVM—A Library for Support Vector Machines. ACM Trans. Intell. Syst. Technol. 2011, 2, 27. [Google Scholar] [CrossRef]
  39. Kanlikilicer, A.E.; Keles, A.; Uyar, A.S. Experimental analysis of binary differential evolution in dynamic environments. In Proceedings of the 9th Annual Conference Companion on Genetic and Evolutionary Computation, London, UK, 07–11 July 2007; pp. 2509–2514.
  40. Lin, S.W.; Ying, K.C.; Chen, S.C.; Lee, Z.J. Particle swarm optimization for parameter determination and feature selection of support vector machines. Expert Syst. Appl. 2008, 35, 1817–1824. [Google Scholar] [CrossRef]
  41. Oreski, S.; Oreski, G. Genetic algorithm-based heuristic for feature selection in credit risk assessment. Expert Syst. Appl. 2014, 41, 2052–2064. [Google Scholar] [CrossRef]
  42. Saeys, Y.; Degroeve, S.; Aeyels, D.; Van de Peer, Y.; Rouzé, P. Fast feature selection using a simple estimation of distribution algorithm: A case study on splice site prediction. Bioinformatics 2003, 19, 179–188. [Google Scholar] [CrossRef]
  43. Niijima, S.; Kuhara, S. Recursive gene selection based on maximum margin criterion: A comparison with SVM-RFE. BMC Bioinform. 2006, 7, 543–561. [Google Scholar] [CrossRef] [PubMed] [Green Version]
  44. Mundra, P.A.; Rajapakse, J.C. SVM-RFE with MRMR filter for gene selection. IEEE Trans. Nanobiosci. 2010, 9, 31–37. [Google Scholar] [CrossRef] [PubMed]
  45. Chiclana, F.; GarcíA, J.T.; del Moral, M.J.; Herrera-Viedma, E. A statistical comparative study of different similarity measures of consensus in group decision making. Inf. Sci. 2013, 221, 110–123. [Google Scholar] [CrossRef] [Green Version]
  46. Chen, Y.L.; Li, Q.Z. Prediction of the subcellular location of apoptosis proteins. J. Theor. Biol. 2007, 245, 775–783. [Google Scholar] [CrossRef] [PubMed]
  47. Kandaswamy, K.K.; Pugalenthi, G.; Moller, S.; Hartmann, E.; Kalies, K.U.; Suganthan, P.N.; Martinetz, T. Prediction of apoptosis protein locations with genetic algorithms and support vector machines through a new mode of pseudo amino acid composition. Protein Pept. Lett. 2010, 17, 1473–1479. [Google Scholar] [CrossRef]
  48. Horton, P.; Park, K.J.; Obayashi, T.; Fujita, N.; Harada, H.; Adams-Collier, C.J.; Nakai, K. WoLF PSORT: Protein localization predictor. Nucleic Acids Res. 2007, 35, 585–587. [Google Scholar] [CrossRef] [PubMed]
Figure 1. The framework of the multiobjective binary differential evolution method (MOBDE) with support vector machine (SVM).
Energies 09 01061 g001
Figure 2. The accuracy obtained by MOBDE in each independent run.
Energies 09 01061 g002
Figure 3. The number of selected gene obtained by MOBDE in each independent run.
Energies 09 01061 g003
Figure 4. The percentage of genes selected.
Energies 09 01061 g004
Table 1. The solution representation.
1234D + 2
P c P r F 1 F 2 F D
Table 2. Format of gene expression classification data.
Dataset NumberDataset NameNumber of SamplesNumber of ClassesNumber of GenesDescription
111_Tumors609572611 various human tumor types
29_Tumors1741112,5339 various human tumor types
3Brain_Tumors190559205 human brain tumor types
4Brain_Tumors250410,3674 malignant glioma types
5Leukemia17235327Acute myelogenous leukemia (AML), acute lymphoblastic leukemia (ALL) B-cell and ALL T-cell
6Leukemia272311,225AML, ALL and mixed-lineage leukemia (MLL)
7Lung_cancer203512,6004 lung cancer types and normal tissues
8SRBCT8342308Small, round blue cell tumors (SRBCT) of childhood
9Prostate_Tumor102210,509Prostate tumor and normal tissues
10DLBCL7725469Diffuse large B-cell lymphomas (DLBCL) and follicular lymphomas
Table 3. Experimental results for each run using multiobjective binary differential evolution (MOBDE) on 11_Tumors, 9_Tumors, Brain_Tumors1, Brain_Tumors2 and Leukemia1.
Run11_Tumors9_TumorsBrain_Tumors1Brain_Tumors2Leukemia1
AccSelected GenesAccSelected GenesAccSelected GenesAccSelected GenesAccSelected Genes
197.133493.332098.891510061006
294.832396.672598.891410091005
394.833191.671797.781110061004
497.713191.672098.89710051005
598.282286.671796.671110071006
698.284093.331796.671296101008
796.552491.671798.891110091006
898.282393.331495.56109691008
998.852693.333896.67129881006
1097.1321952297.781210061005
Average97.1927.592.6720.797.6711.5997.51005.9
±S.D.±1.42±6.24±2.62±6.83±1.22±2.17±1.7±1.720±1.29
Results for 10 runs are listed in this table. The best subset is shown in shaded cells. In this work, the accuracy is more important than the number of selected genes. Therefore, a solution with the best accuracy can be chosen from the final Pareto front. “Acc” denotes the accuracy of the classifications, and “Selected genes” represents the number of selected genes. The bolding denotes the best solutions.
Table 4. Experimental results for each run using MOBDE on Leukemia2, Lung_cancer, SRBCT, Prostate_Tumor and DLBCL.
RunLeukemia2Lung_CancerSRBCTProstate_TumorDLBCL
AccSelected GenesAccSelected GenesAccSelected GenesAccSelected GenesAccSelected Genes
1100598.5212100898.0461007
2100810027100699.0281008
3100498.0315100699.02221004
4100898.52151004100101004
5100799.5116100599.0281005
6100710014100597.06141003
7100599.0210100698.04111006
8100599.0214100499.02131008
9100599.0215100599.02101004
10100699.5117100598.0471007
Average100699.1215.51005.498.6310.91005.6
±S.D.±0±1.41±0.65±4.5±0±1.17±0.83±4.65±0±1.83
Results for 10 runs are listed in this table. The best subset is shown in shaded cells. In this work, the accuracy is more important than the number of selected genes. Therefore, a solution with the best accuracy can be chosen from the final Pareto front. “Acc” denotes the accuracy of the classifications, and “Selected genes” represents the number of selected genes. The bolding denotes the best solutions.
Table 5. The genes, selected genes and percentage of gene selected percentage.
Dataset NameGenesGenes SelectedPercentage of Genes Selected
11_Tumors572627.50.0048
9_Tumors12,53320.70.0017
Brain_Tumors1592011.50.0019
Brain_Tumors210,3677.50.0007
Leukemia153275.90.0011
Leukemia211,22560.0005
Lung_cancer12,60015.50.0012
SRBCT23085.40.0023
Prostate_Tumor10,50910.90.001
DLBCL54695.60.001
Average--0.0016
Table 6. Comparative experimental results of the binary differential evolution algorithm with and without the Fisher-Markov selector.
Dataset NameEvaluationThis Work (MOBDE)MOBDE without the Fisher-Markov Selector
11_TumorsAcc (%)97.1998.28
Genes27.5236.67
9_TumorsAcc (%)92.6791.67
Genes20.7151.33
Brain_Tumors1Acc (%)97.6797.04
Genes11.5110
Brain_Tumors2Acc (%)9998
Genes7.571.67
Leukemia1Acc (%)100100
Genes5.975
Leukemia2Acc (%)100100
Genes662.67
Lung_cancerAcc (%)99.1299.26
Genes15.5123.5
SRBCTAcc (%)100100
Genes5.4109.67
Prostate_TumorAcc (%)98.6399.35
Genes10.9126.33
DLBCLAcc (%)100100
Genes5.625.33
The bolding denotes the best solutions.
Table 7. Comparative experimental results of different binary differential evolution algorithms.
Dataset NameMethodThis Work (MOBDE)Binary DE [34]BDE [39]BDEAIS [33]
EvaluationAverageS.D.AverageS.D.AverageS.D.AverageS.D.
11_TumorsAcc (%)97.191.4293.970.4197.240.6395.290.48
Genes27.56.24508.4948.44.77113.47.67
9_TumorsAcc (%)92.672.62821.3991.67085.332.17
Genes20.76.83176.8544.89.9110711.34
Brain_Tumors1Acc (%)97.671.2295.110.61960.6195.560
Genes11.52.171711.2556.86.5397.48.17
Brain_Tumors2Acc (%)991.796.41.67962.4588.81.09
Genes7.51.7211.67.8938.29.93866.67
Leukemia1Acc (%)10001000100098.330.62
Genes5.91.2910.23.1145.88.4178.85.07
Leukemia2Acc (%)1000100010001000
Genes61.4111.4642.21.9277.22.49
Lung_cancerAcc (%)99.120.6598.030.3598.230.2798.030.7
Genes15.54.5188.1551.87.8949.533.23
SRBCTAcc (%)1000100010001000
Genes5.41.1711.24.3840.65.6474.81.64
Prostate_TumorAcc (%)98.630.8398.04098.430.5498.240.44
Genes10.94.6515.410.9549.813.231039
DLBCLAcc (%)1000100010001000
Genes5.61.838.81.7944.43.139218.25
The bolding denotes the best solutions.
Table 8. Comparative experimental results of the binary differential evolution algorithm with the binary genetic algorithm, binary particle swarm optimization and the binary estimation of binary estimation of distribution algorithm.
Dataset NameMethodThis Work (MOBDE)BGA [40]BPSO [41]BEDA [42]
EvaluationAverageS.D.AverageS.D.AverageS.D.AverageS.D.
11_TumorsAcc (%)97.191.4297.131.5294.440.3393.30.88
Genes27.56.2462.6721.2288.6711.3758.6714.74
9_TumorsAcc (%)92.672.6286.671.1880.671.9832.98
Genes20.76.8335.25.4587.410.2131.44.45
Brain_Tumors1Acc (%)97.671.22961.6994.44096.220.99
Genes11.52.173413.6489.25.5228.75
Brain_Tumors2Acc (%)991.793.64.34881.4195.24.38
Genes7.51.7225.614.8880.69.5312.24.6
Leukemia1Acc (%)100098.331.1698.330.621000
Genes5.91.2943.210.6265.48.0811.83.9
Leukemia2Acc (%)1000100010001000
Genes61.4144.83.4262.21.489.61.82
Lung_cancerAcc (%)99.120.6598.360.2897.290.3598.850.28
Genes15.54.531.339.248321.2131.6710.5
SRBCTAcc (%)1000100010001000
Genes5.41.17472.4557.43.361512.46.11
Prostate_TumorAcc (%)98.630.8397.651.1297.250.4497.840.44
Genes10.94.6538.45.0874.83.721.62.97
DLBCLAcc (%)100099.740.5810001000
Genes5.61.8335.25.17654.3615.47.47
The bolding denotes the best solutions.
Table 9. Comparative experimental times of the differential evolution algorithm with different multiobjective optimization algorithms.
Dataset NameMOBDEBGABPSOBEDA
11_Tumors7945.65922.0512,306.019082.42
9_Tumors781.43626.17731.607977.61
Brain_Tumors11191.581113.361552.91455.6
Brain_Tumors2332.75273.235305.69291.67
Leukemia1495.13614.4734.03524.458
Leukemia2416.58521.814549.01410.484
Lung_cancer4695.816191.6513,413.085092.3
SRBCT770.321321.441001.7877.149
Prostate_Tumor1037.561151.621254.921293.71
DLBCL364.5441.242668.58384.981
The bolding denotes the best solutions.
Table 10. Comparative experimental results of the binary differential evolution algorithm with grid search support vector machine (SVM).
Dataset NameEvaluationThis Work (MOBDE)SVM
11_TumorsAcc (%)97.1989.08
Genes27.512533
9_TumorsAcc (%)92.6751.67
Genes20.75726
Brain_Tumors1Acc (%)97.6790
Genes11.55920
Brain_Tumors2Acc (%)9990
Genes7.510367
Leukemia1Acc (%)10097.22
Genes5.95327
Leukemia2Acc (%)10094.44
Genes611225
Lung_cancerAcc (%)99.1295.07
Genes15.512600
SRBCTAcc (%)10098.8
Genes5.42308
Prostate_TumorAcc (%)98.6393.14
Genes10.910509
DLBCLAcc (%)10096.1
Genes5.65469
The bolding denotes the best solutions.
Table 11. Comparative experimental results of the binary differential evolution algorithm with some single-objective methods.
Dataset NameEvaluationThis Work (MOBDE)IBPSO1 [8]IBPSO2 [6]PSOTS [5]
11_TumorsAcc (%)97.1995.0693.1
Genes27.5240.92948
9_TumorsAcc (%)92.6775.578.33
Genes20.7240.61280
Brain_Tumors1Acc (%)97.6792.5694.44
Genes11.511.2754
Brain_Tumors2Acc (%)999294
Genes7.59.11197
Leukemia1Acc (%)10010010098.61
Genes5.93.510347
Leukemia2Acc (%)100100100
Genes66.71292
Lung_cancerAcc (%)99.1295.8696.55
Genes15.514.91897
SRBCTAcc (%)100100100
Genes5.417.5431
Prostate_TumorAcc (%)98.6397.9492.16
Genes10.913.61294
DLBCLAcc (%)100100100
Genes5.661042
The bolding denotes the best solutions.
Table 12. Comparative experimental results of the binary differential evolution algorithm with MOBDE with The maximum margin criterion and support vector machine-based recursive feature elimination (MMC + SVM-RFE), support vector machine-based recursive feature elimination (SVM-RFE) and minimum-redundancy maximum-relevancy (MRMR).
Dataset NameEvaluationThis Work (MOBDE)MMC + SVM-RFE [43]SVM-RFE with MRMR [44]
11_TumorsAcc (%)97.19--
Genes27.5
9_TumorsAcc (%)92.67--
Genes20.7
Brain_Tumors1Acc (%)97.6767.8-
Genes11.5100
Brain_Tumors2Acc (%)99--
Genes7.5
Leukemia1Acc (%)10099.798.35
Genes5.910037
Leukemia2Acc (%)10096-
Genes6100
Lung_cancerAcc (%)99.12--
Genes15.5
SRBCTAcc (%)10098.7-
Genes5.4100
Prostate_TumorAcc (%)98.6392.198.29
Genes10.93010
DLBCLAcc (%)100--
Genes5.6
The bolding denotes the best solutions.
Table 13. Comparative experimental results of the binary differential evolution algorithm with a different multiobjective optimization algorithm.
DatasetEvaluationThis Work (MOBDE)Time of MOBDE (s)NSGA-IITime of NSGAII (s)
11_TumorsAcc (%)97.197945.692.8215015.56
Genes27.5105
9_TumorsAcc (%)92.67781.4380.331109.81
Genes20.766.2
Brain_Tumors1Acc (%)97.671191.58941264.95
Genes11.537
Brain_Tumors2Acc (%)99332.7590357.86
Genes7.515.6
Leukemia1Acc (%)100495.1399.17545.7
Genes5.912.6
Leukemia2Acc (%)100416.58100430.43
Genes625.2
Lung_cancerAcc (%)99.124695.8197.215278.53
Genes15.555.67
SRBCTAcc (%)100770.32100808.87
Genes5.423
Prostate_TumorAcc (%)98.631037.5696.471426.49
Genes10.918.8
DLBCLAcc (%)100364.599.74394.74
Genes5.611.2
The bolding denotes the best solutions.
Table 14. The Wilcoxon’s signed rank test of our algorithm with other algorithms on accuracy and the number of features selected.
AccuracyThe Number of Feature Selected
Paired Wilcoxon’s Signed Rank Testp-ValuePair Wilcoxon’s Signed Rank Testp-Value
Binary DE [34]0.01802Binary DE [34]0.004883
BDE [39]0.02959BDE [39]0.0009766
BDEAIS [33]0.01125BDEAIS [33]0.002945
BGA [40]0.007074BGA [40]0.0009766
BPSO [41]0.01125BPSO [41]0.0009766
EDA [42]0.01802EDA [42]0.0009766
Grid search SVM0.0009766Grid search SVM0.0009766
IBPSO [8]0.01802IBPSO [8]0.04199
IBPSO [6]0.01802IBPSO [6]0.0009766
NSGAII0.007133NSGAII0.0009766
Table 15. Prediction results with different models on the 317 apoptosis proteins dataset and 98 independent proteins dataset.
ModelClass
317 ProteinCytoMitoMembNuclSecrEndoOverall Accuracy (%)
Training Dataset
PSORT51.7841.1705082.350.0237.55
GASVM89.2891.1792.7286.5388.2391.4889.91
This paper97.3288.2487.2794.2376.4793.6292.43
98 ProteinsCytoMitoMembOtherOverall Accuracy (%)
Independent Dataset
PSORT58.1330.7602528.47
GASVM90.792.3186.6791.790.34
This paper97.6710092.3183.3395.92

