
Sustainable Energy Transitions in China: Renewable Options and Impacts on the Electricity System


Abstract
:1. Introduction
1.1. Literature Reviews
1.2. Scope and Structure of This Study
2. Electricity System and Policy of China
2.1. Potential of RES for Electricity Production
2.1.1. Hydropower
2.1.2. Wind Power
2.1.3. Solar Power
2.1.4. Other Renewable Sources
2.2. Electricity Demand and Supply
2.3. Energy Policy for the Future Electricity System
2.3.1. Protection of the Environment
2.3.2. Increasing Energy Security
2.3.3. Improving Energy Efficiency
3. Methodology
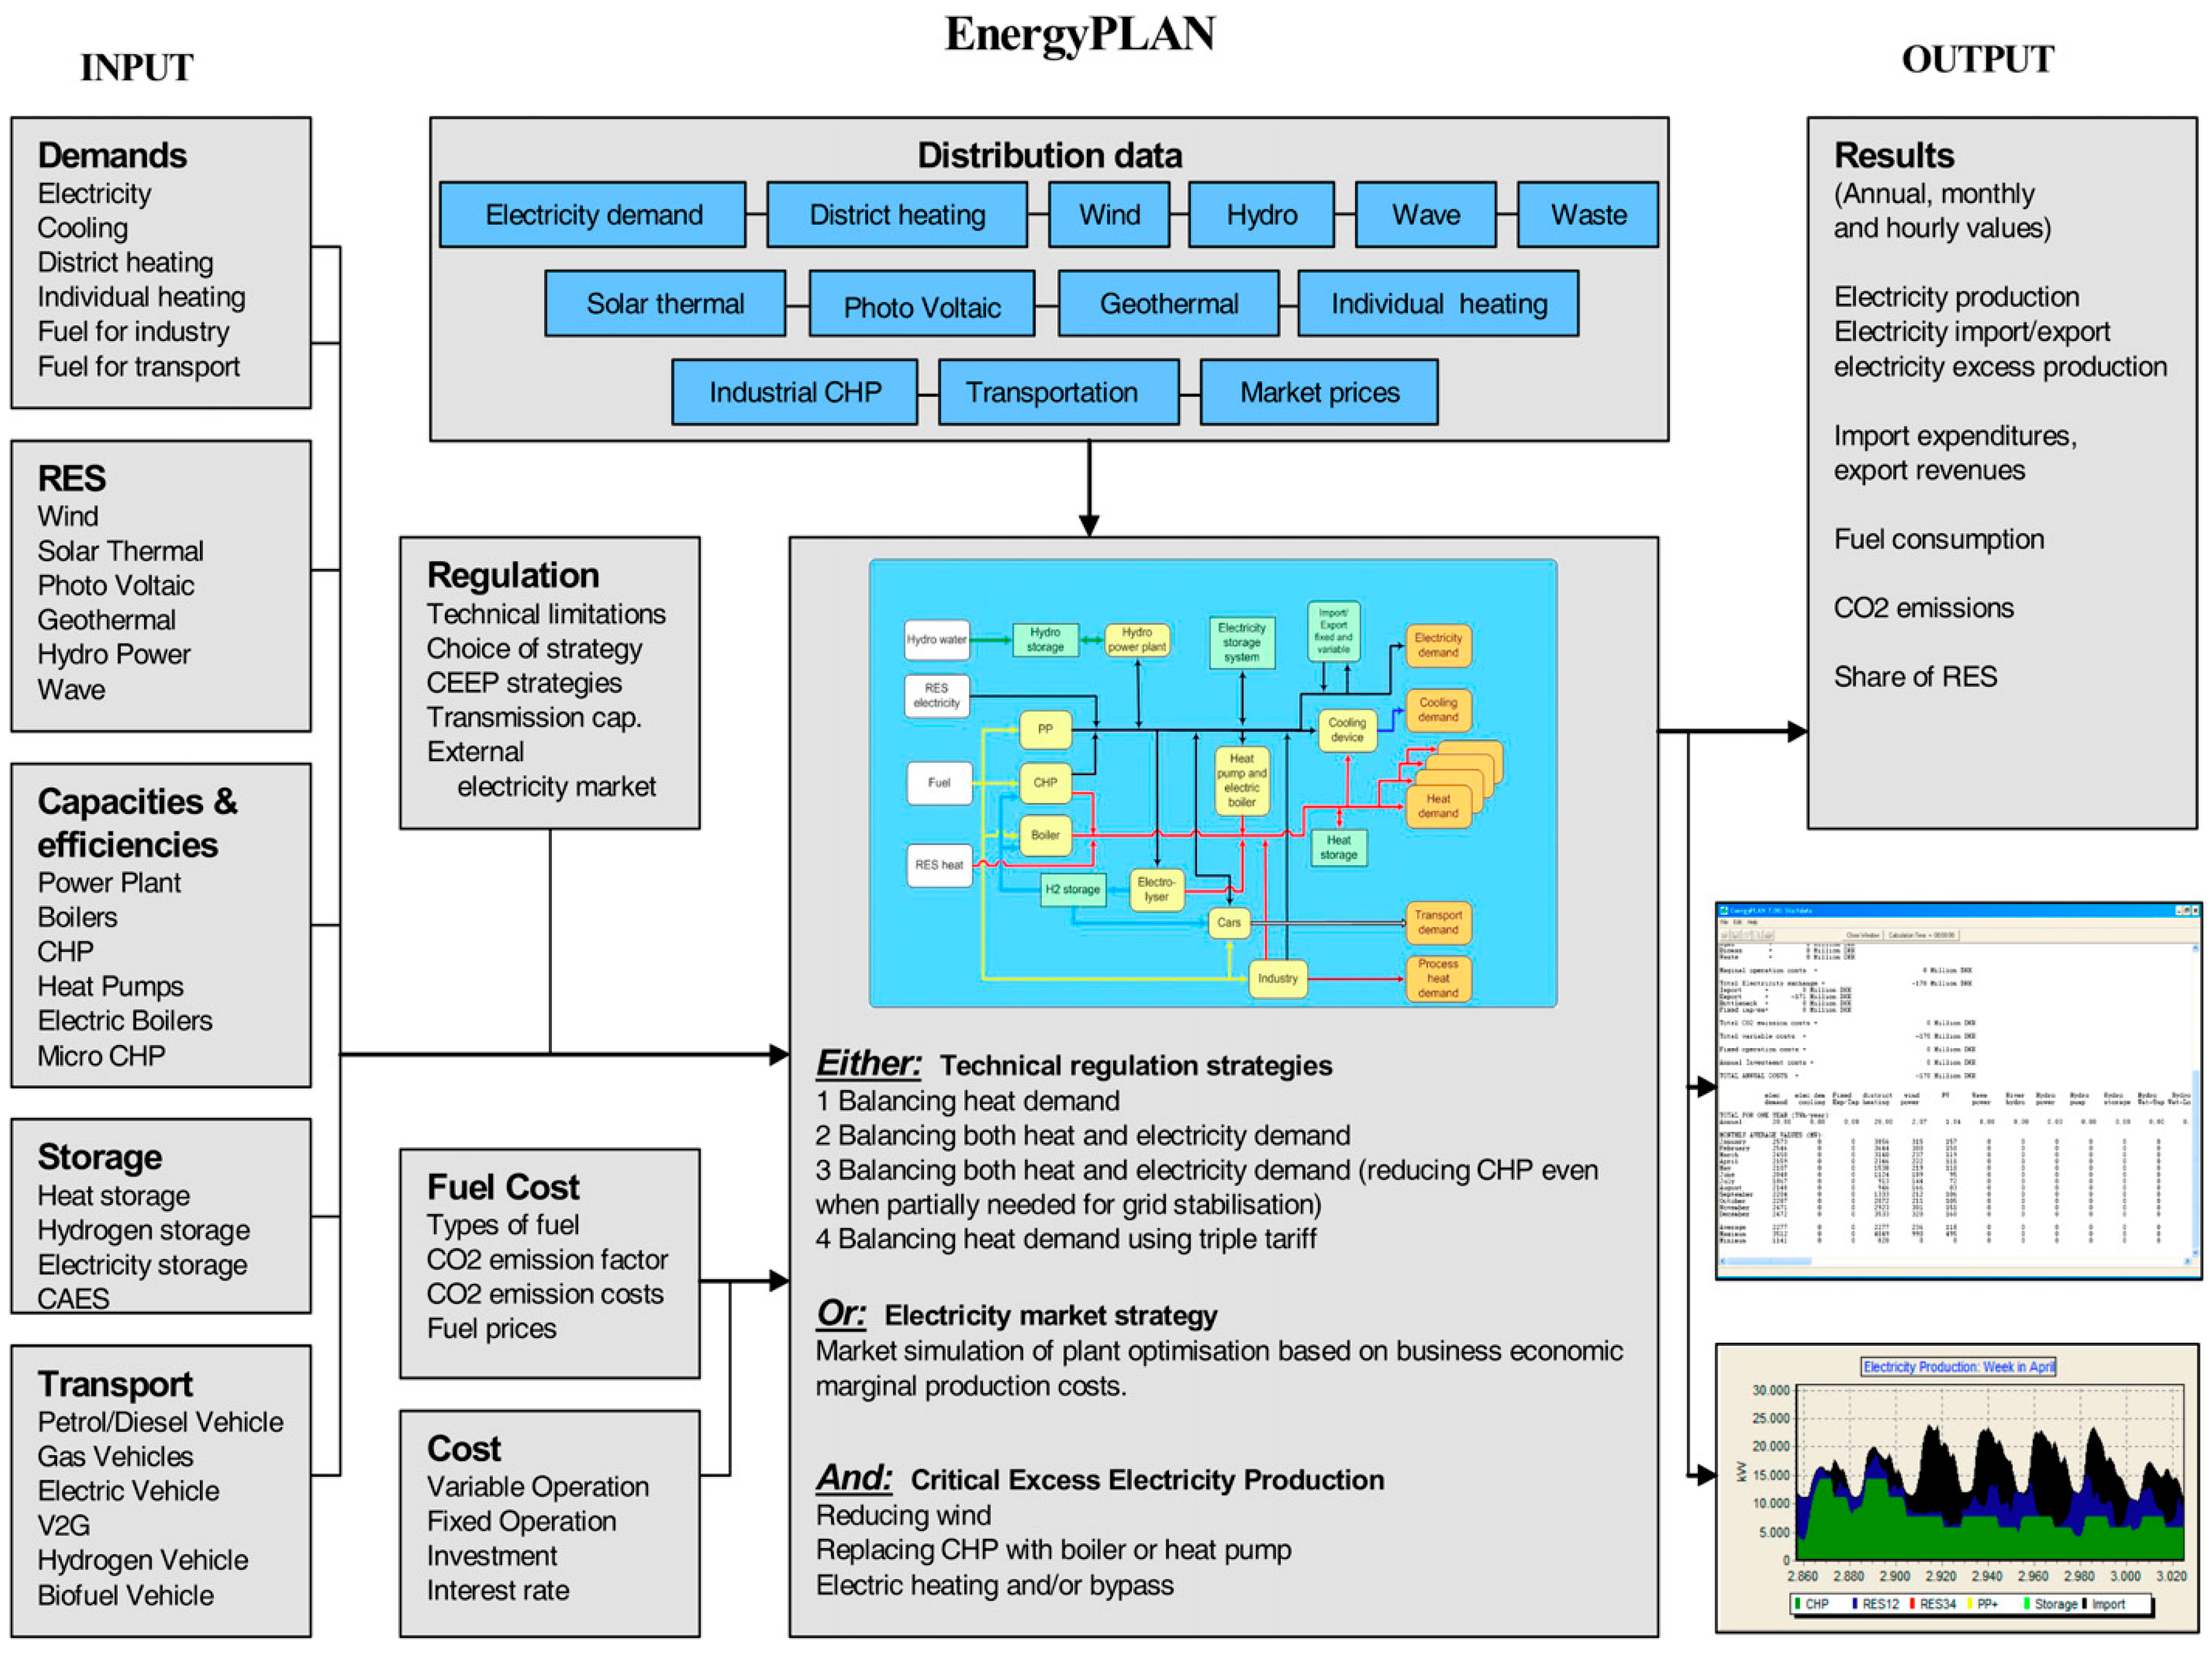
3.1. EnergyPLAN
3.2. Multi-Criteria Evaluation
4. RE Scenarios and Assumptions
4.1. BAU Scenario
4.2. Alternative Scenarios for an RE-40 System
4.2.1. High Hydropower Scenario
4.2.2. High Wind Power Scenario
4.2.3. High Solar PV Scenario
4.2.4. Balanced Mix Scenario
5. Scenario Evaluation and Comparison
5.1. Scenario Evaluation
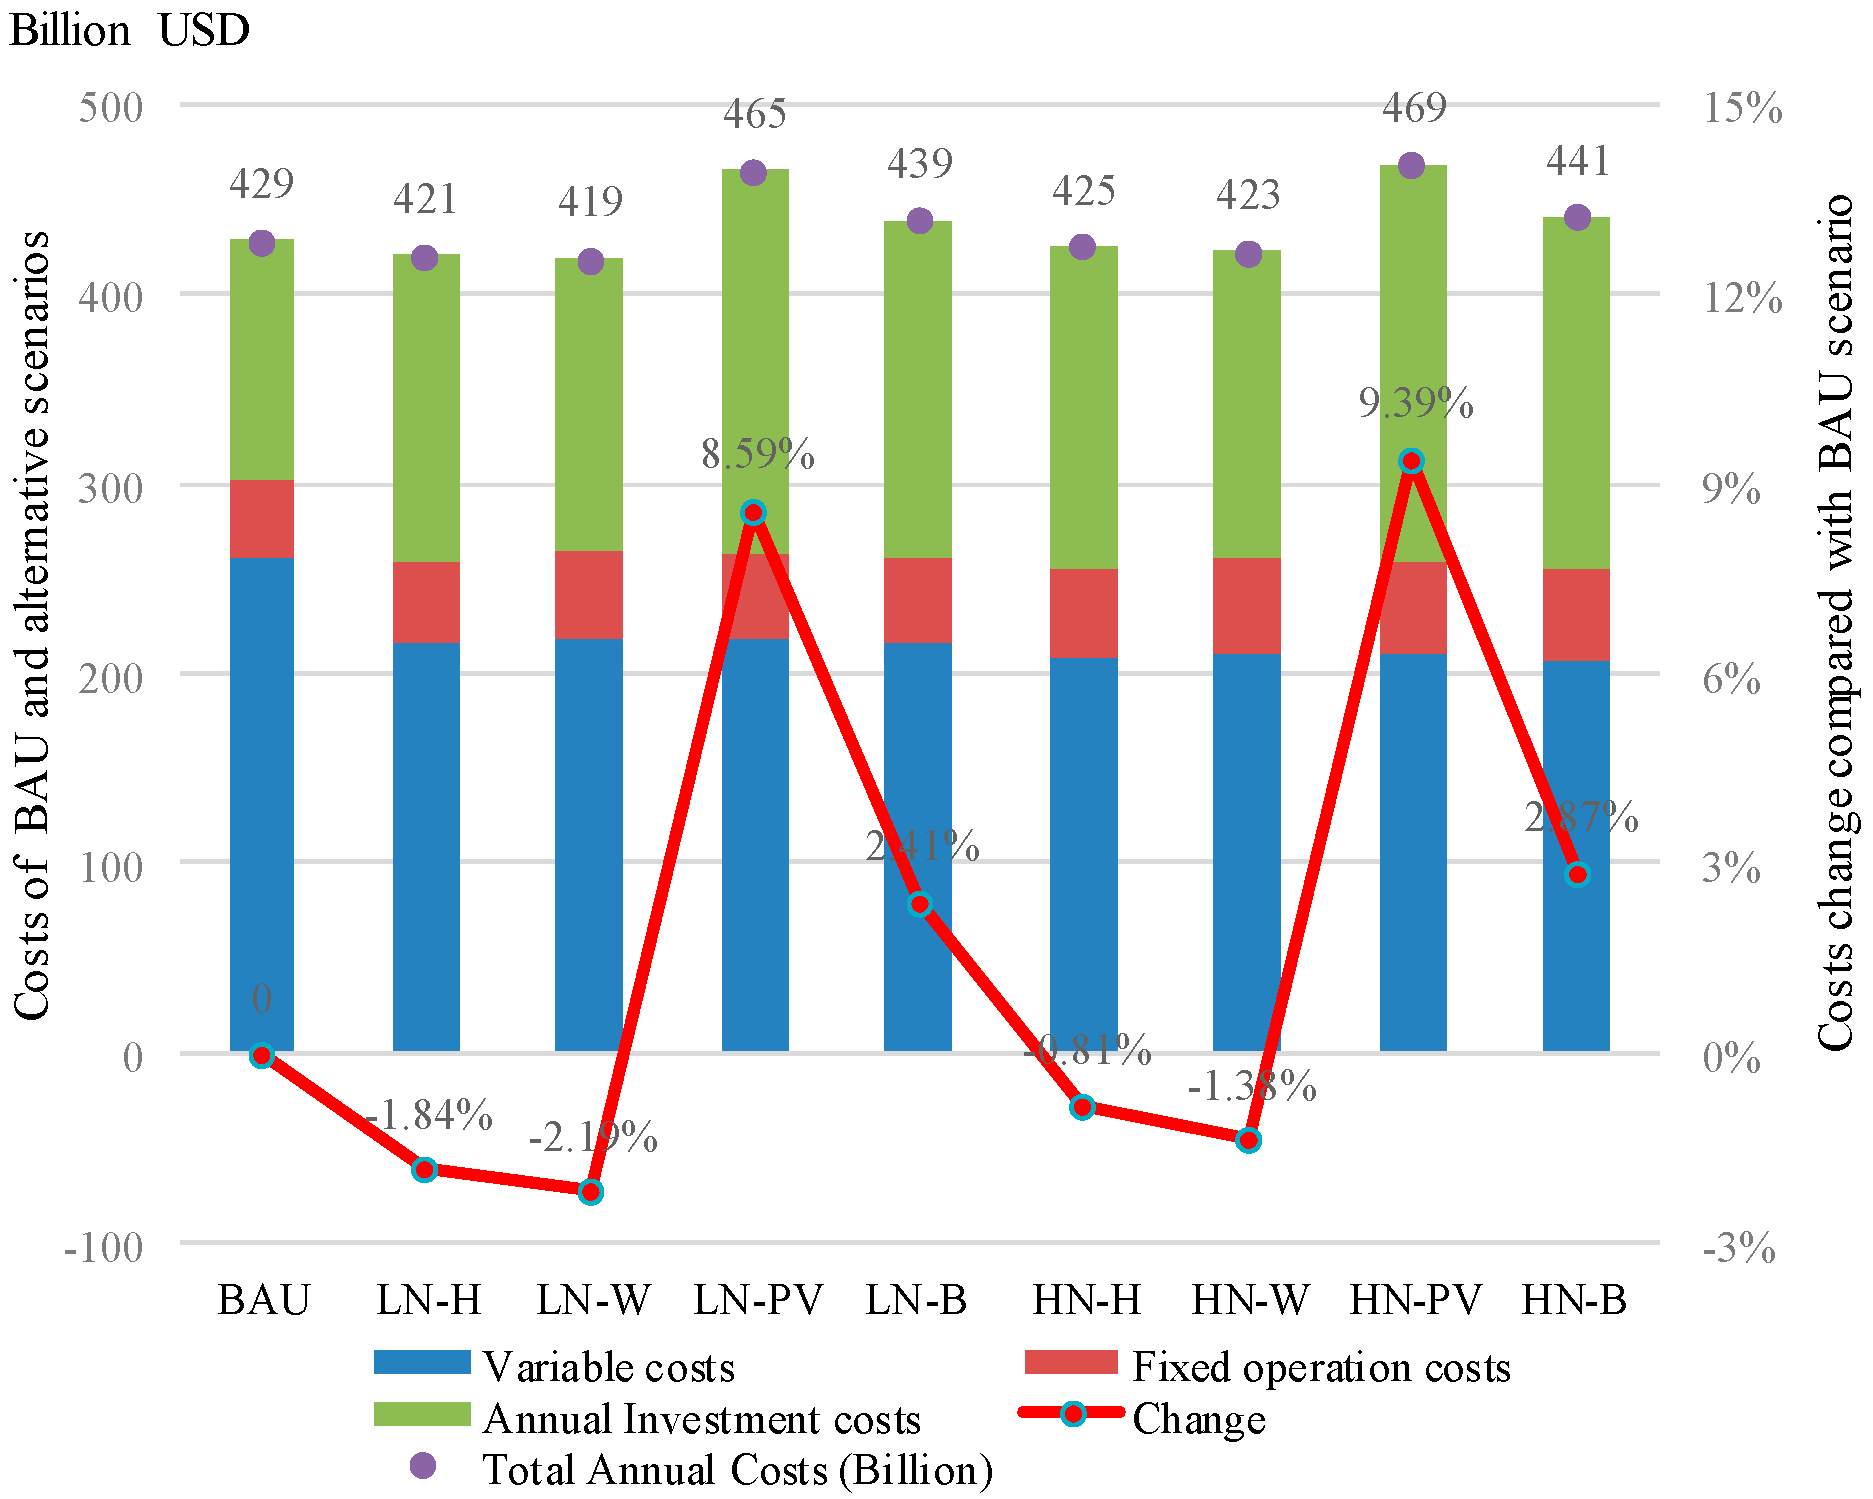
5.1.1. Total Costs
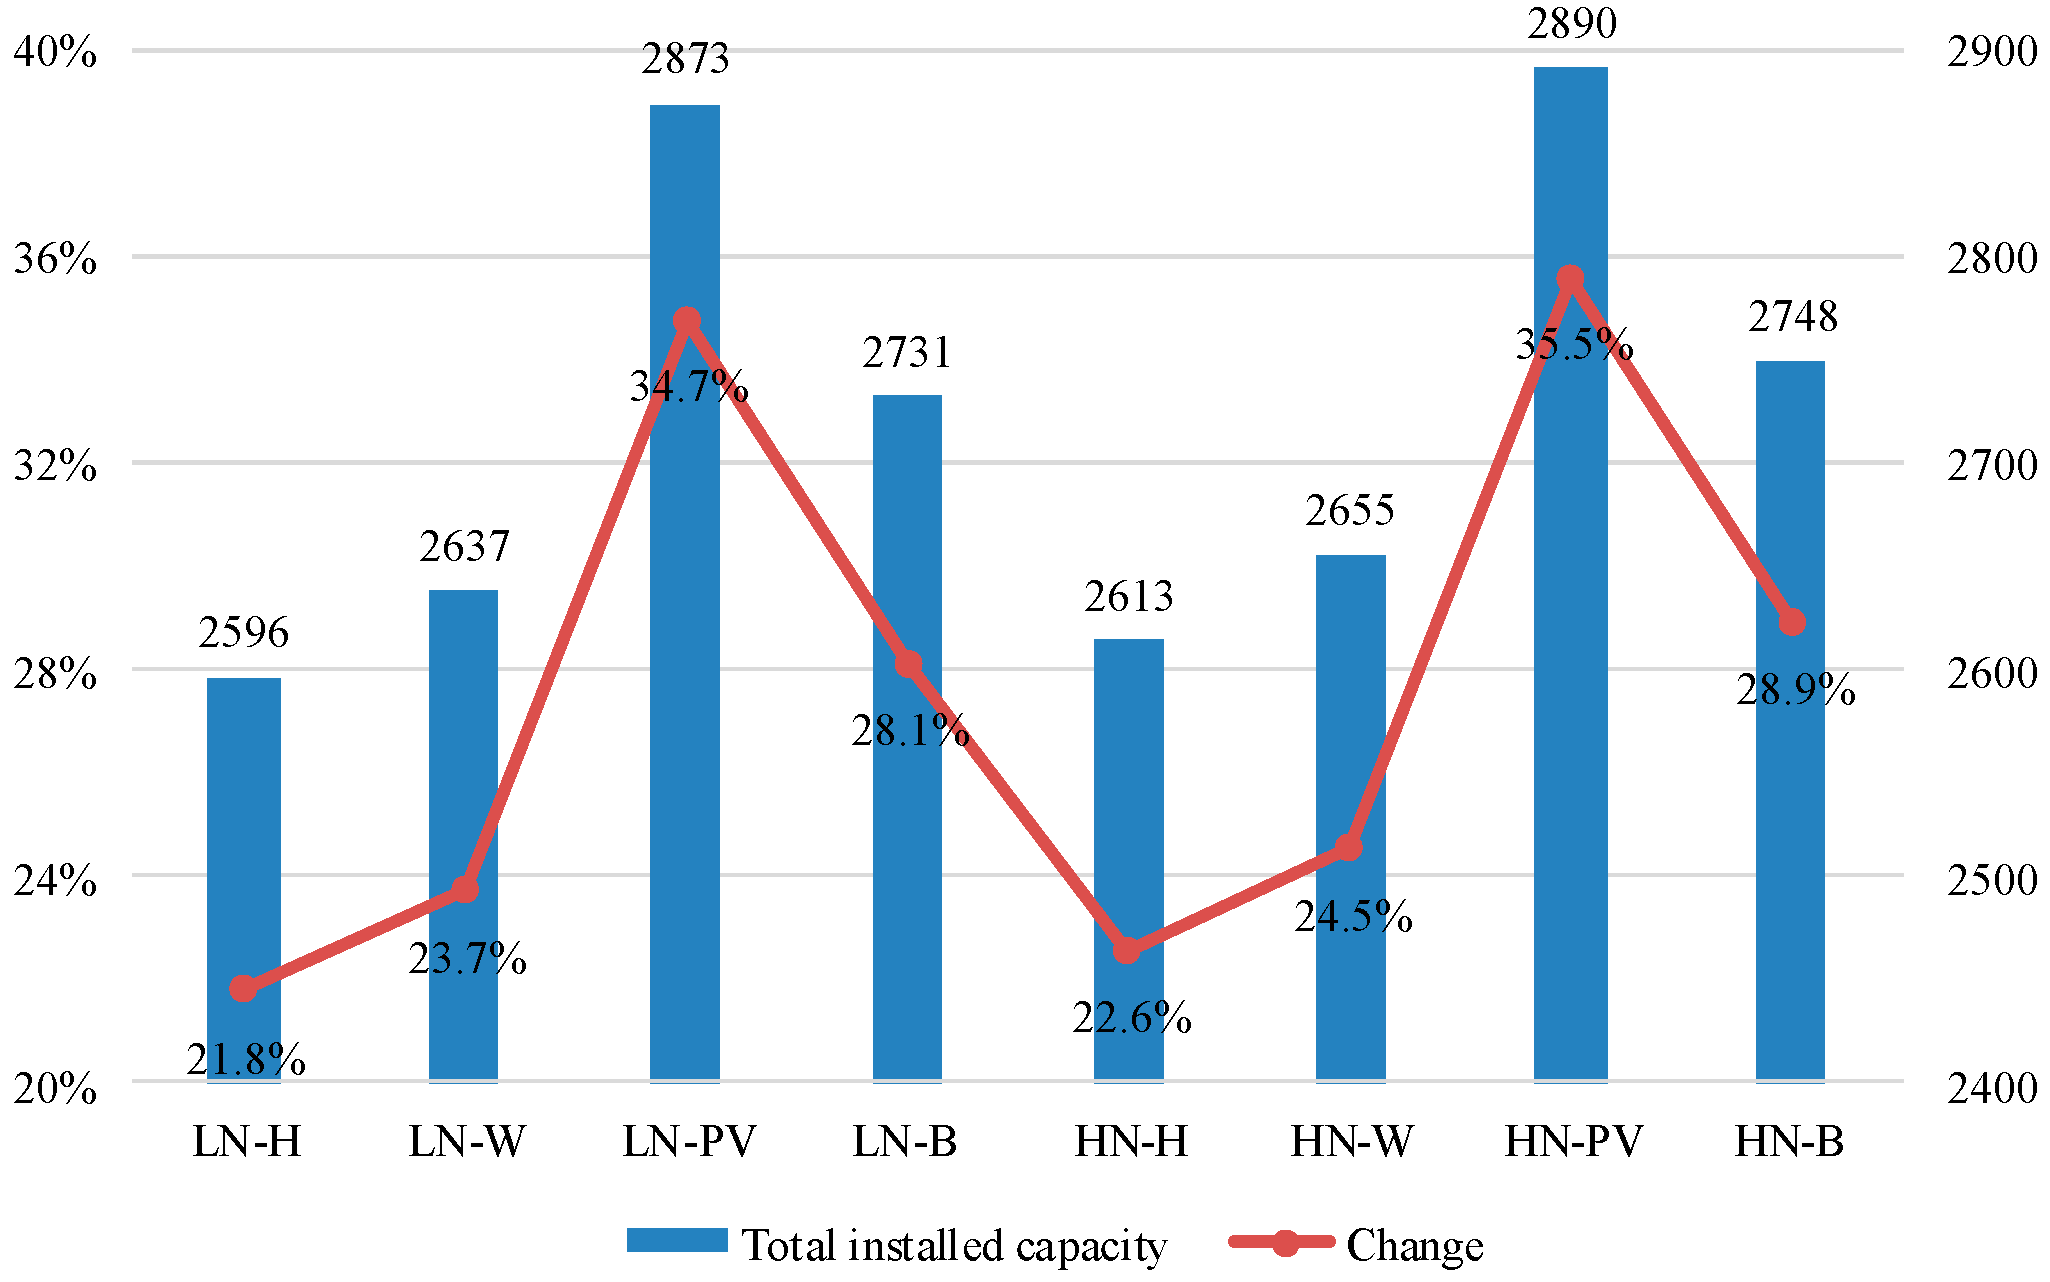
5.1.2. Total Installed Capacity
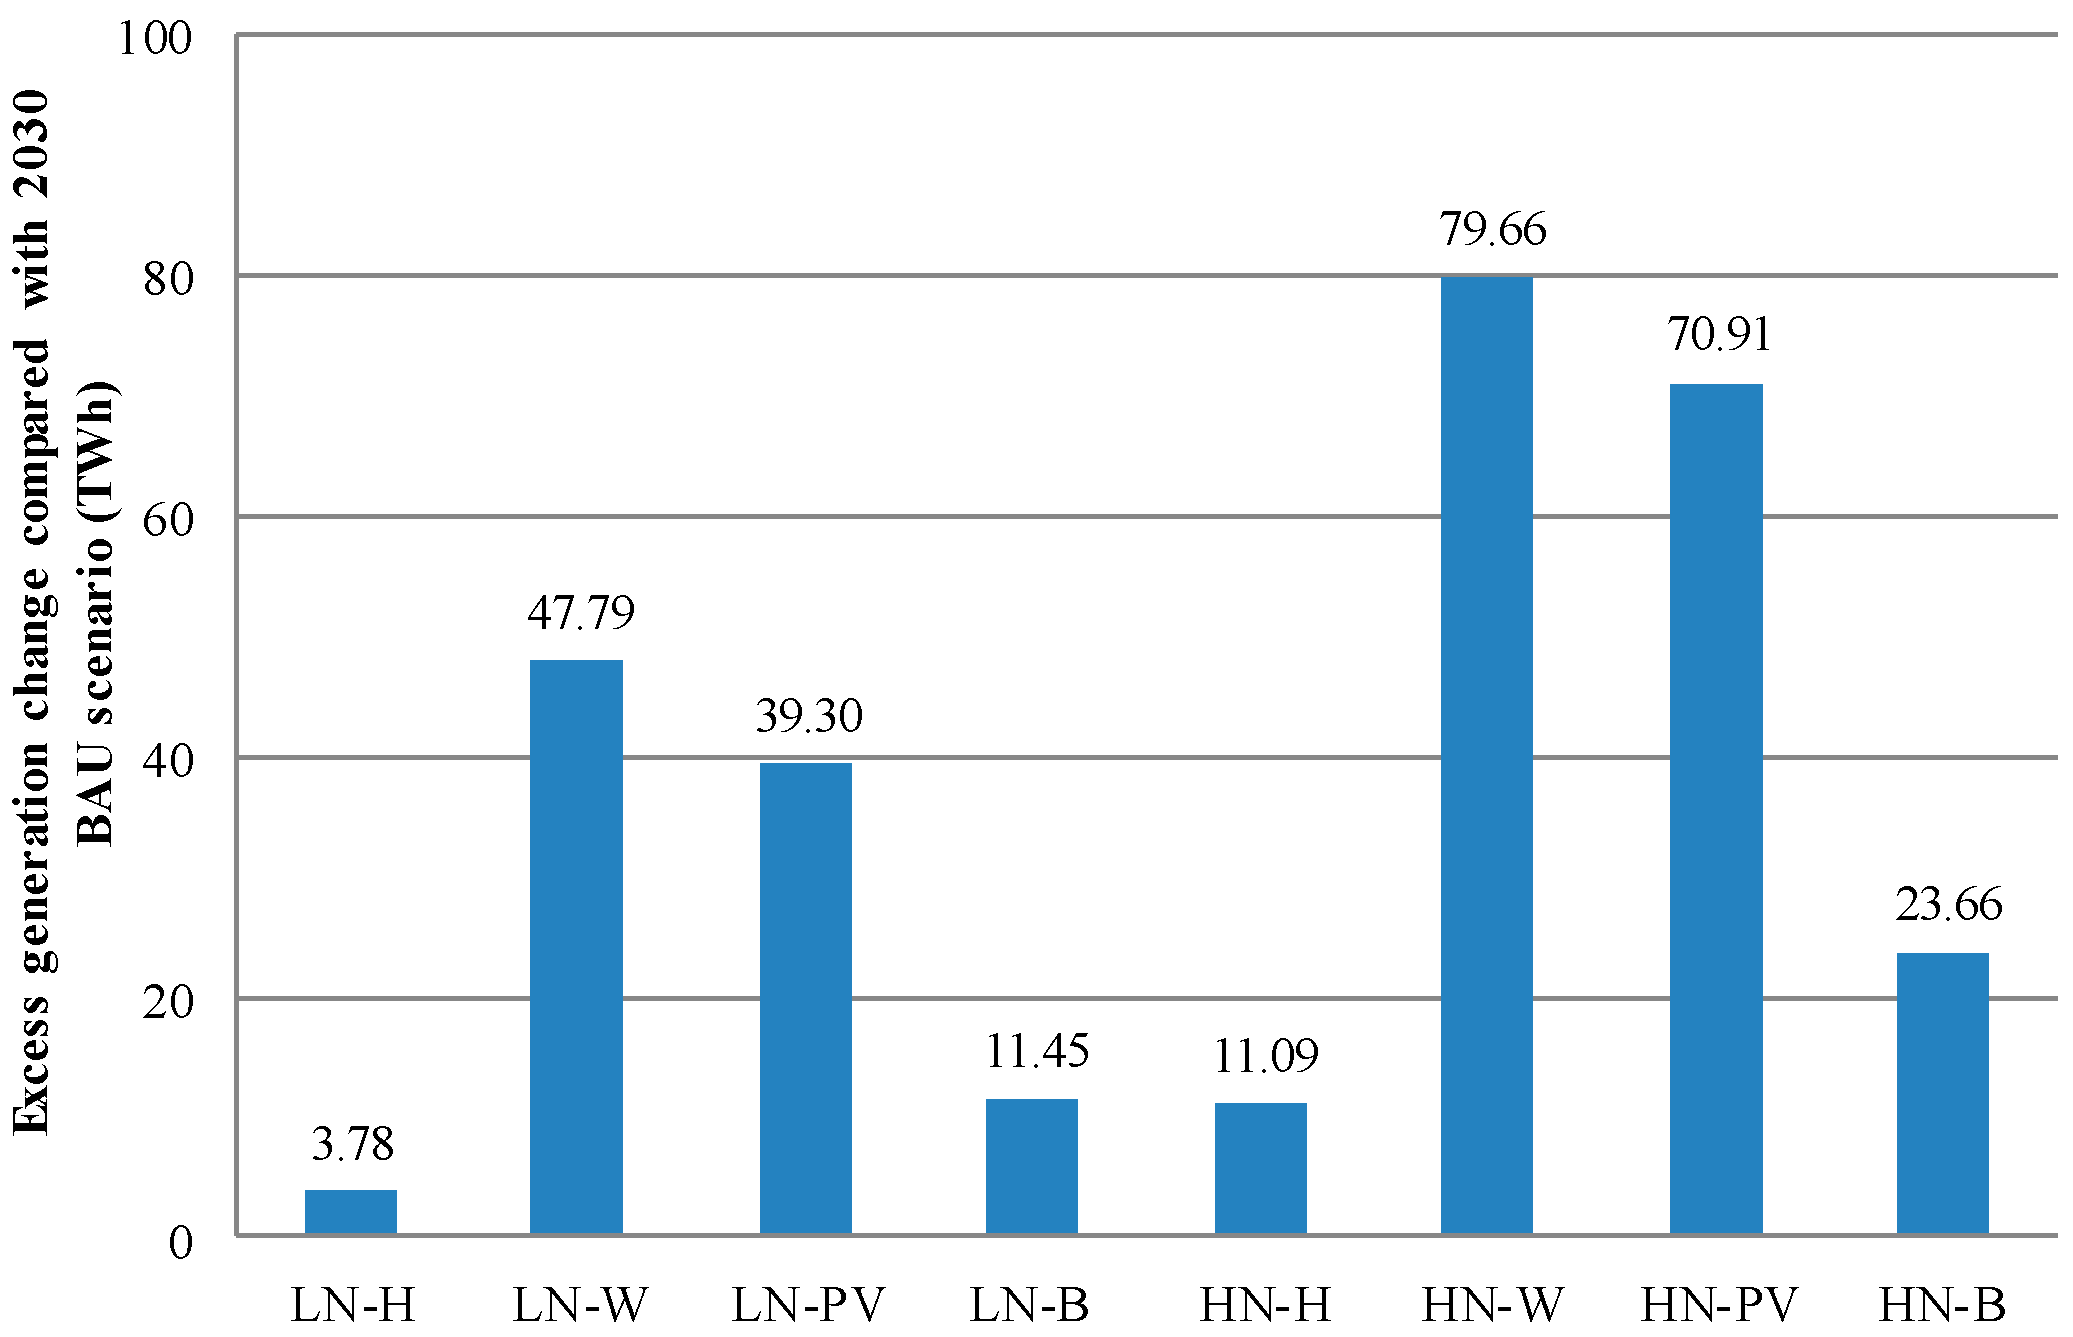
5.1.3. Excess Generation
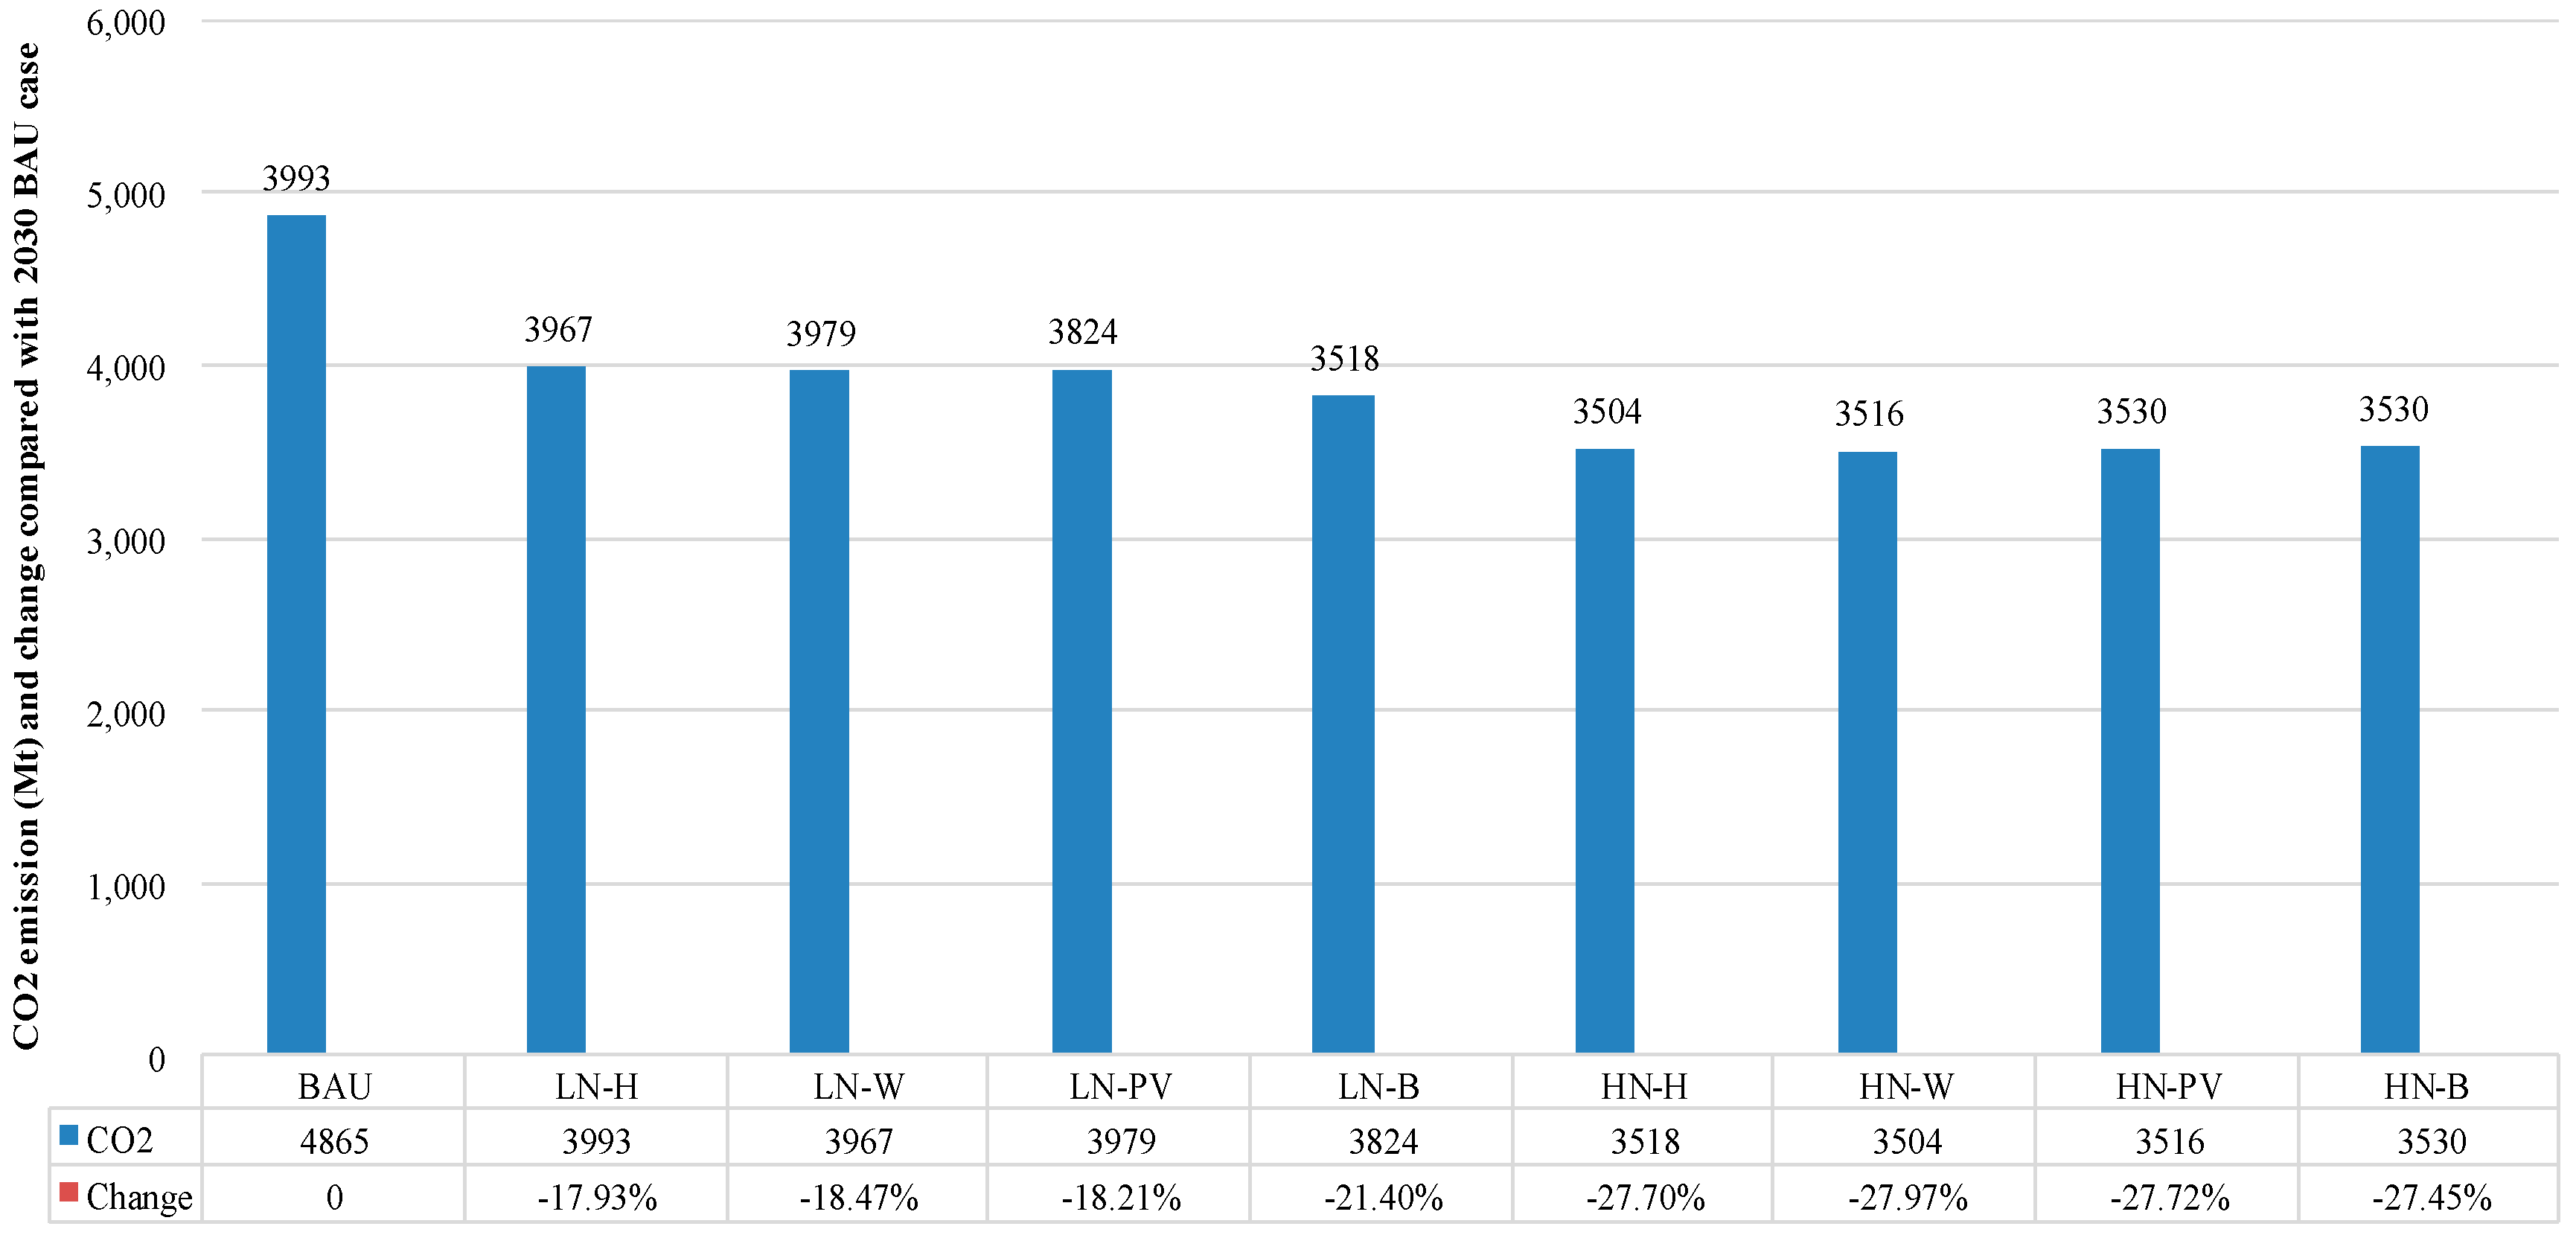
5.1.4. CO2 Emissions
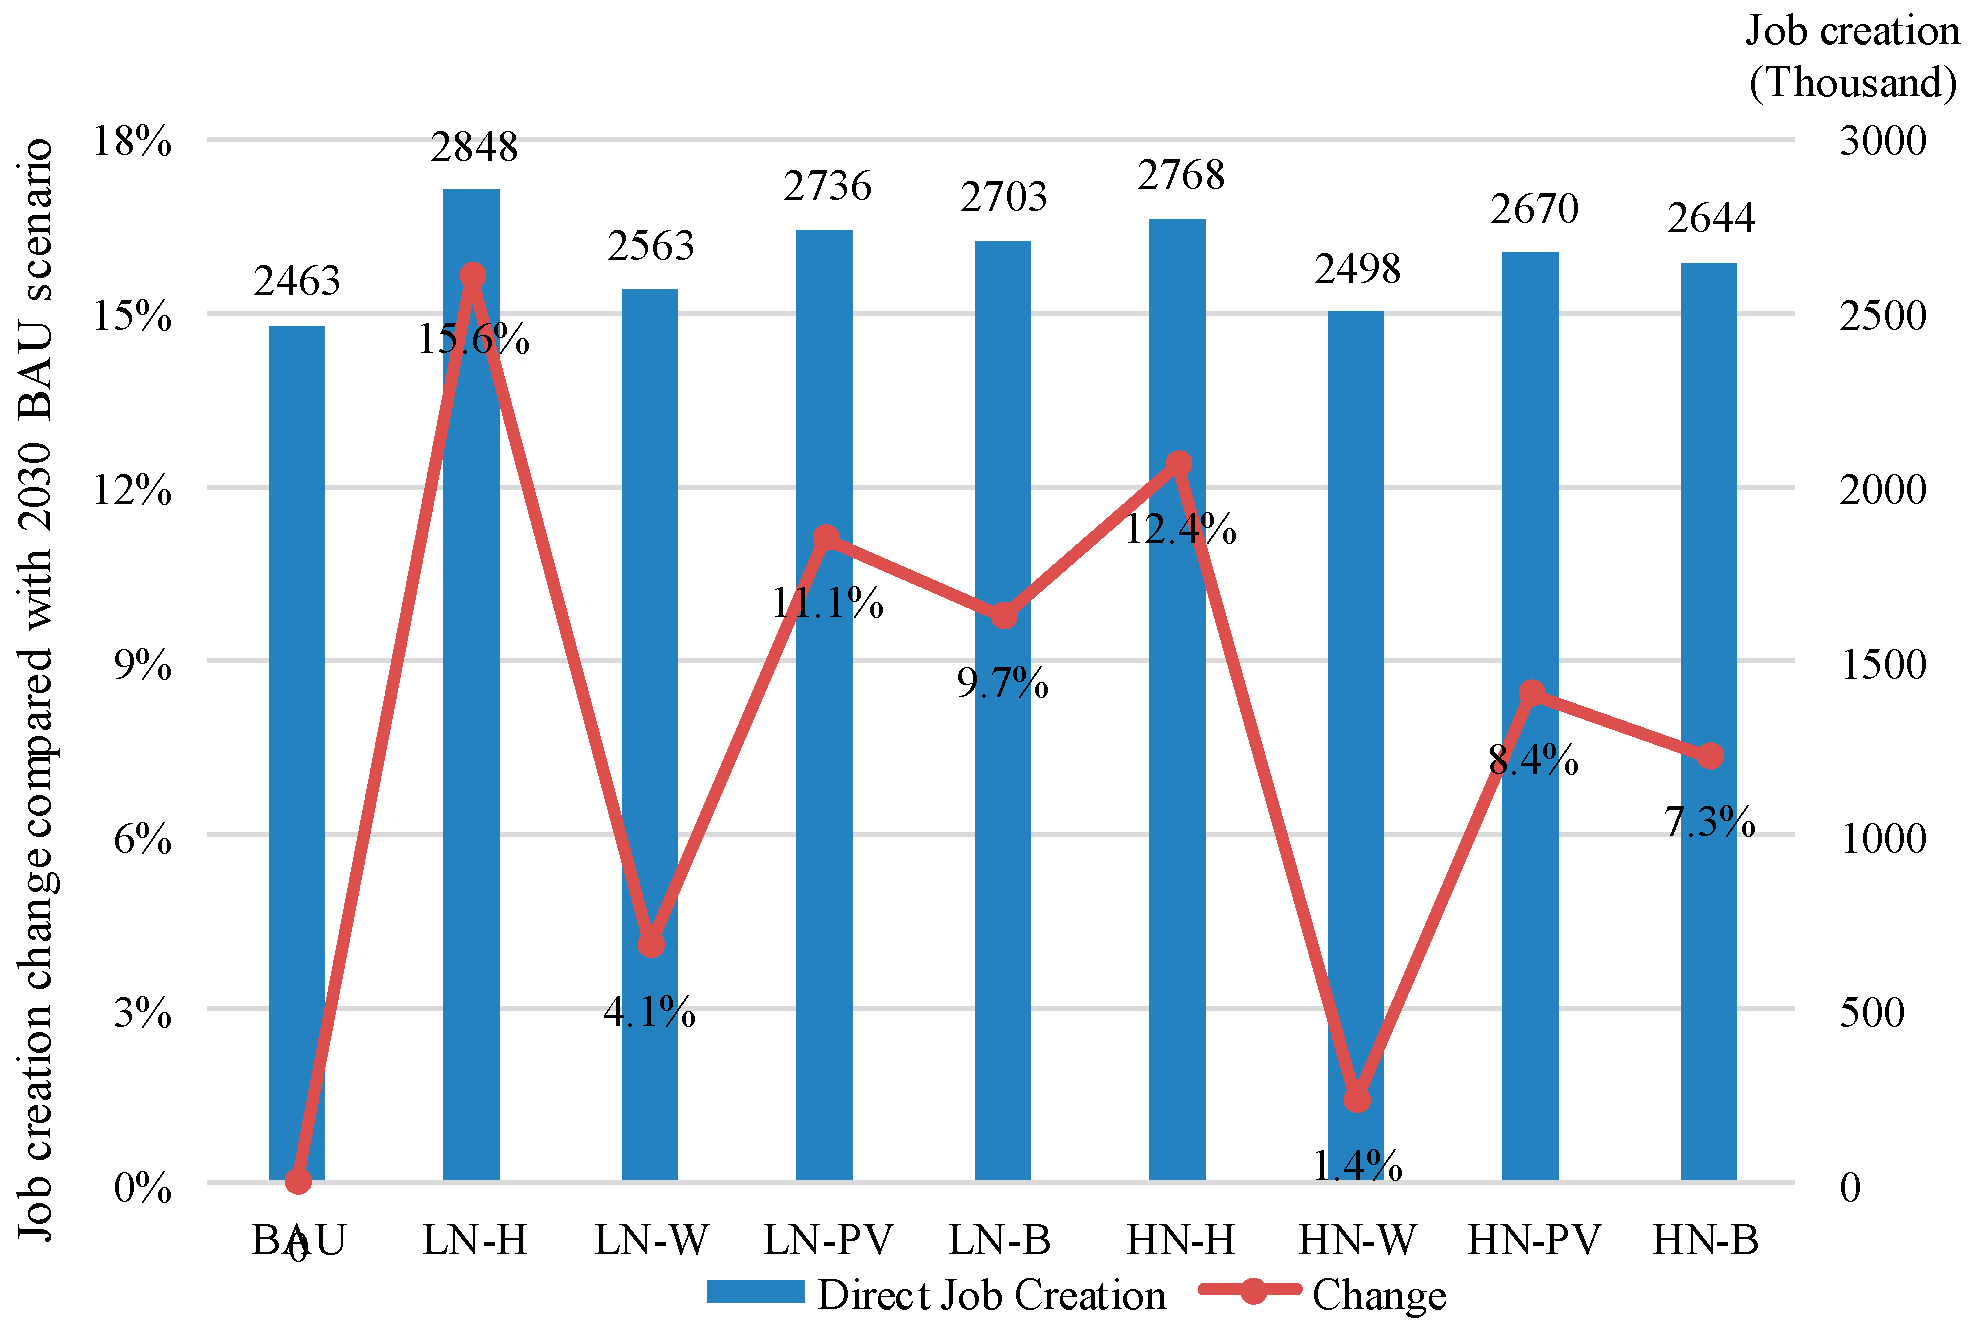
5.1.5. Direct Job Creation
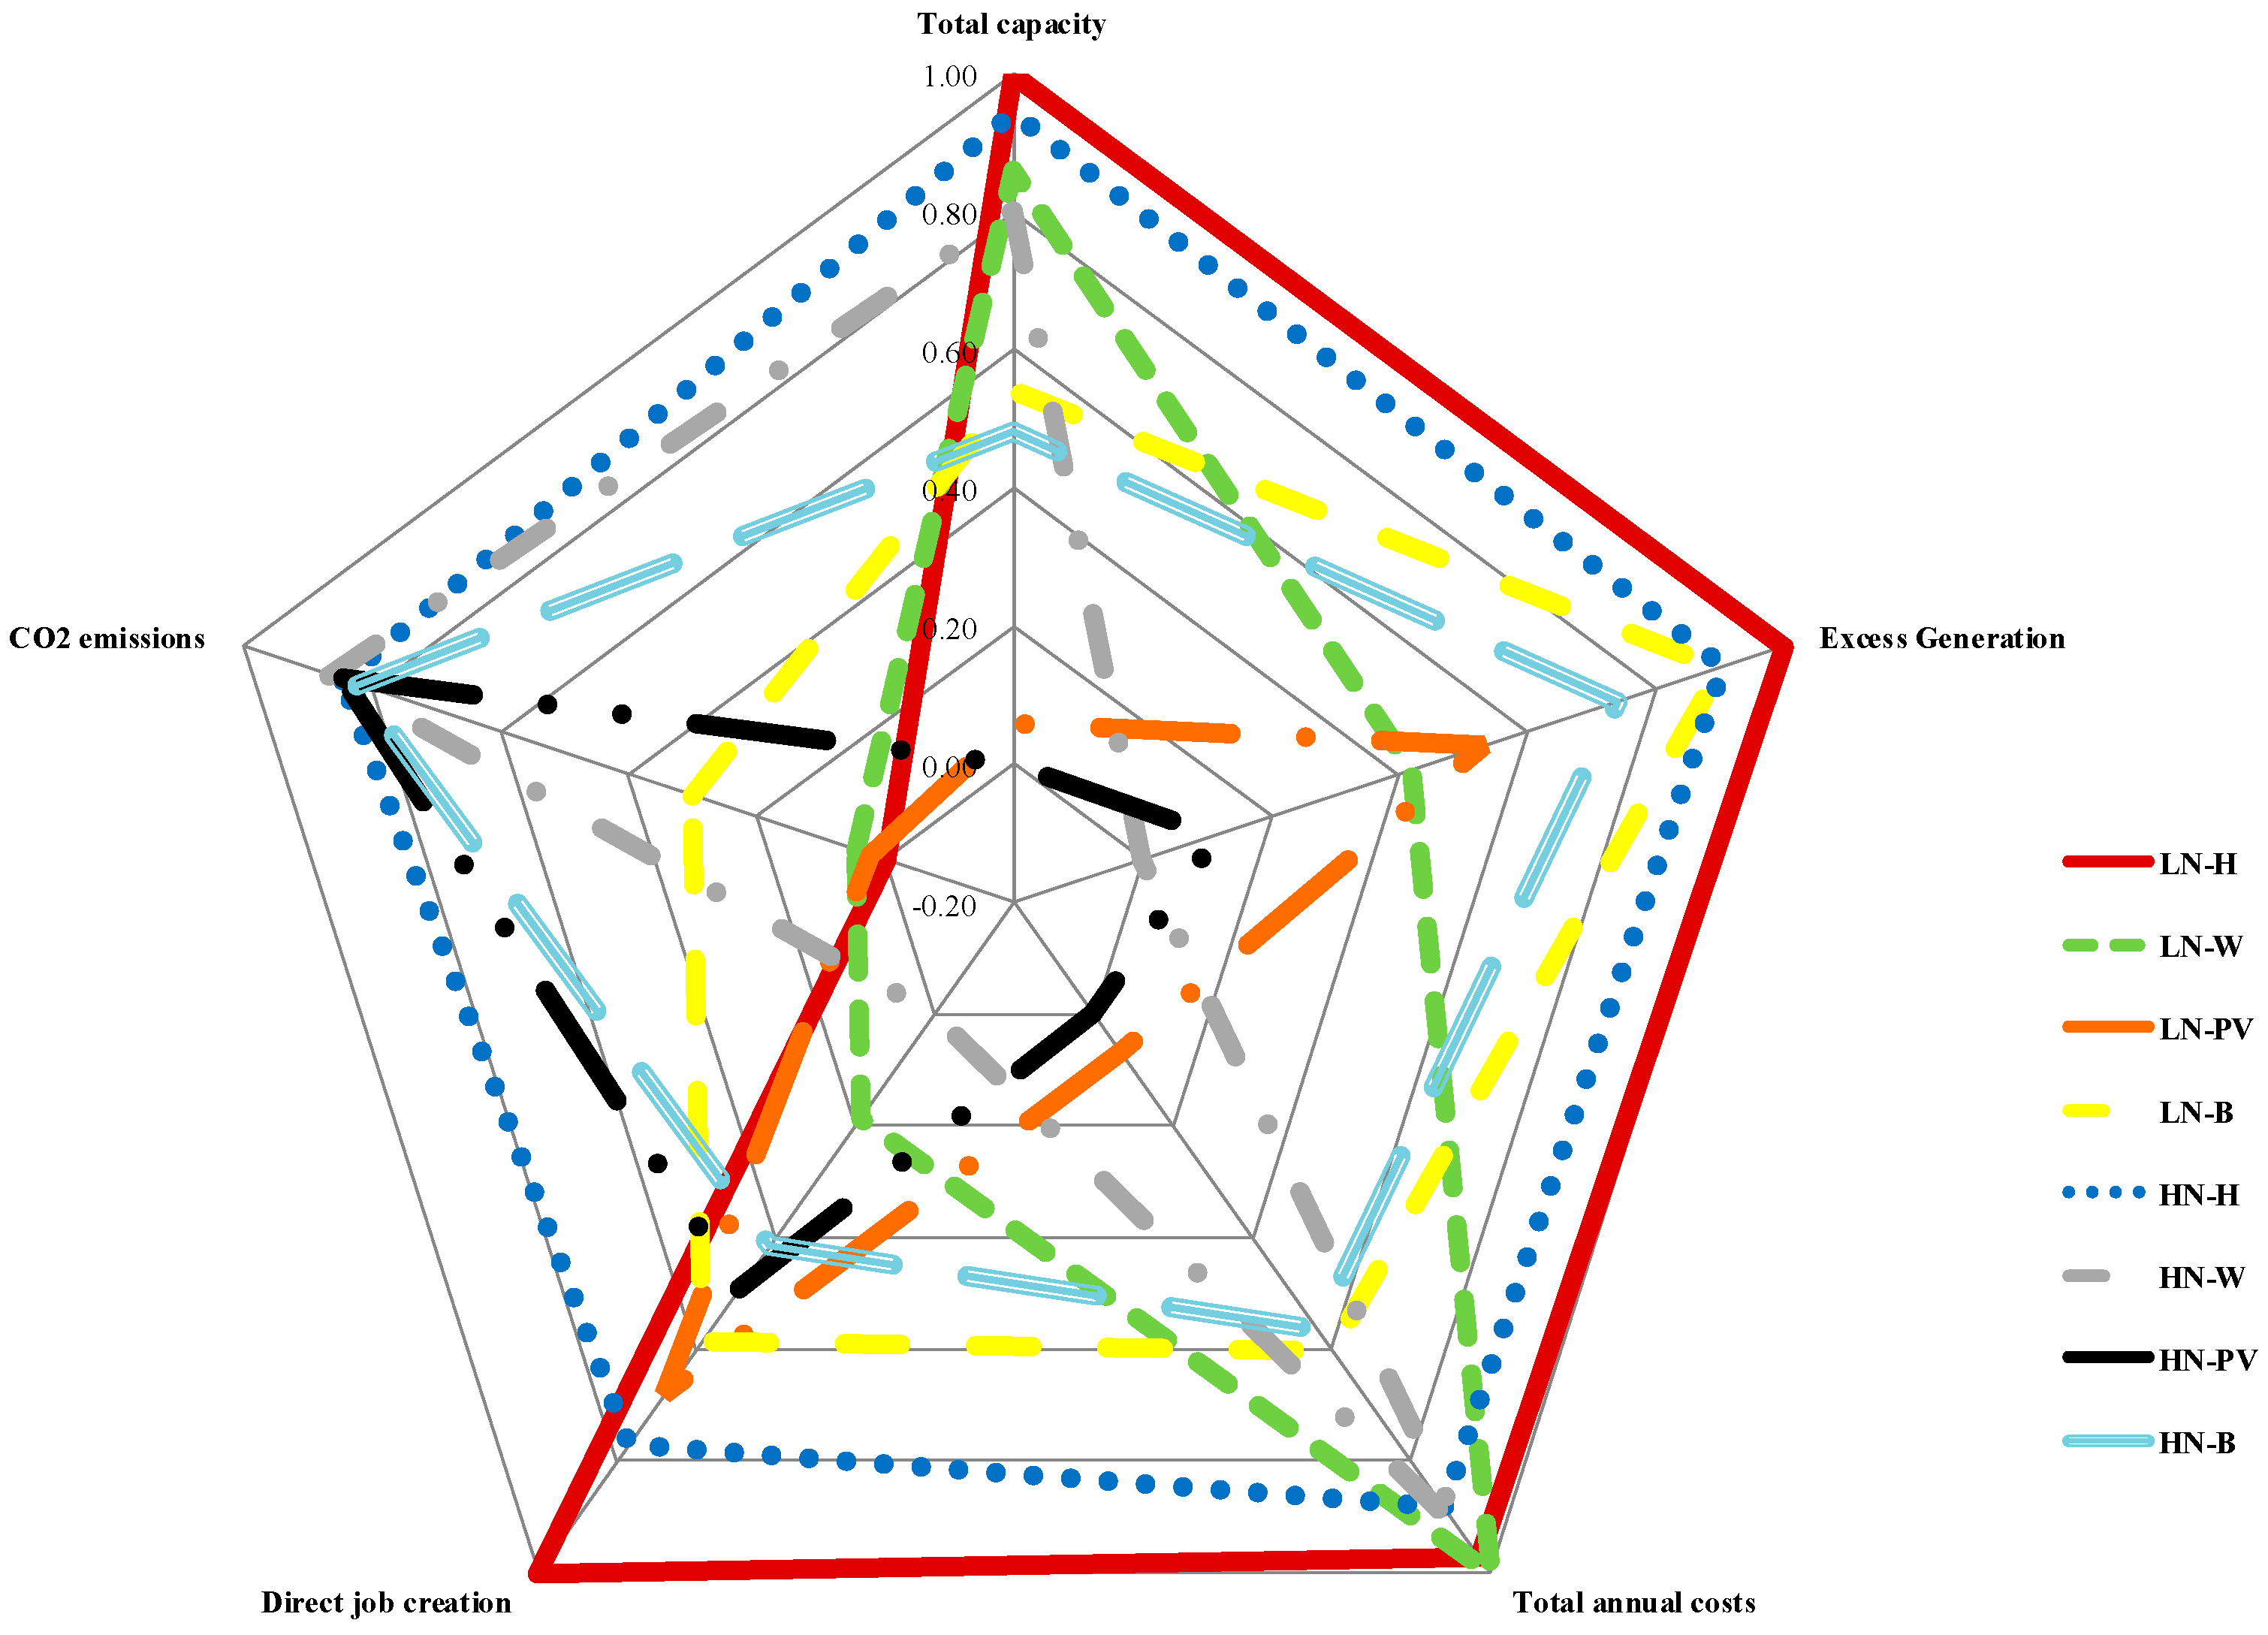
5.2. Sustainability Comparison of RE-40 Scenarios
6. Conclusions and Policy Implications
- (1)
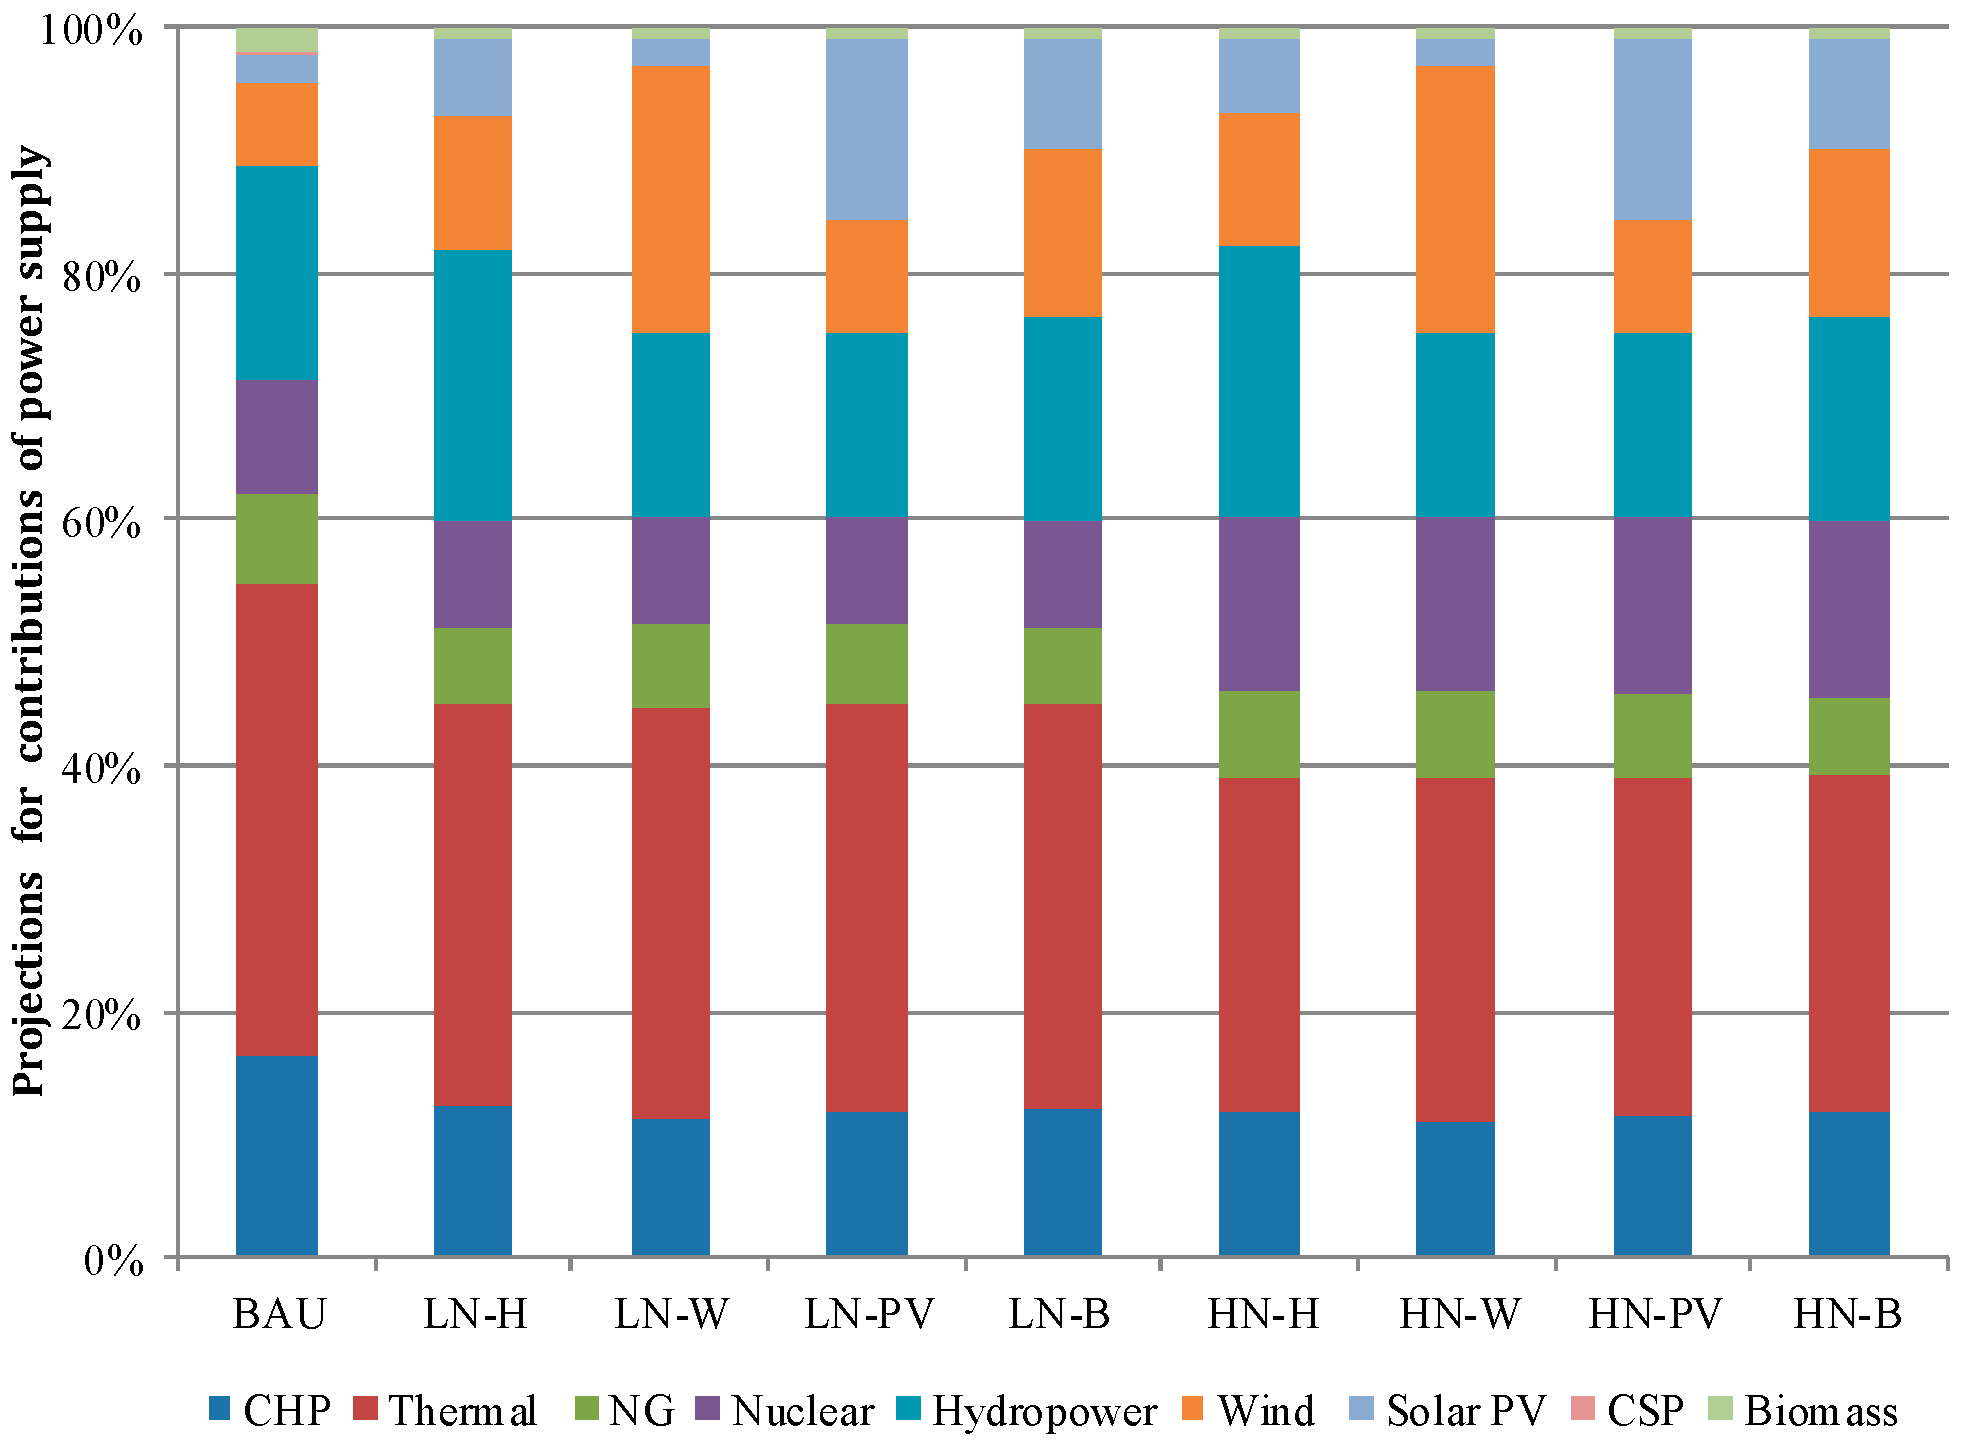
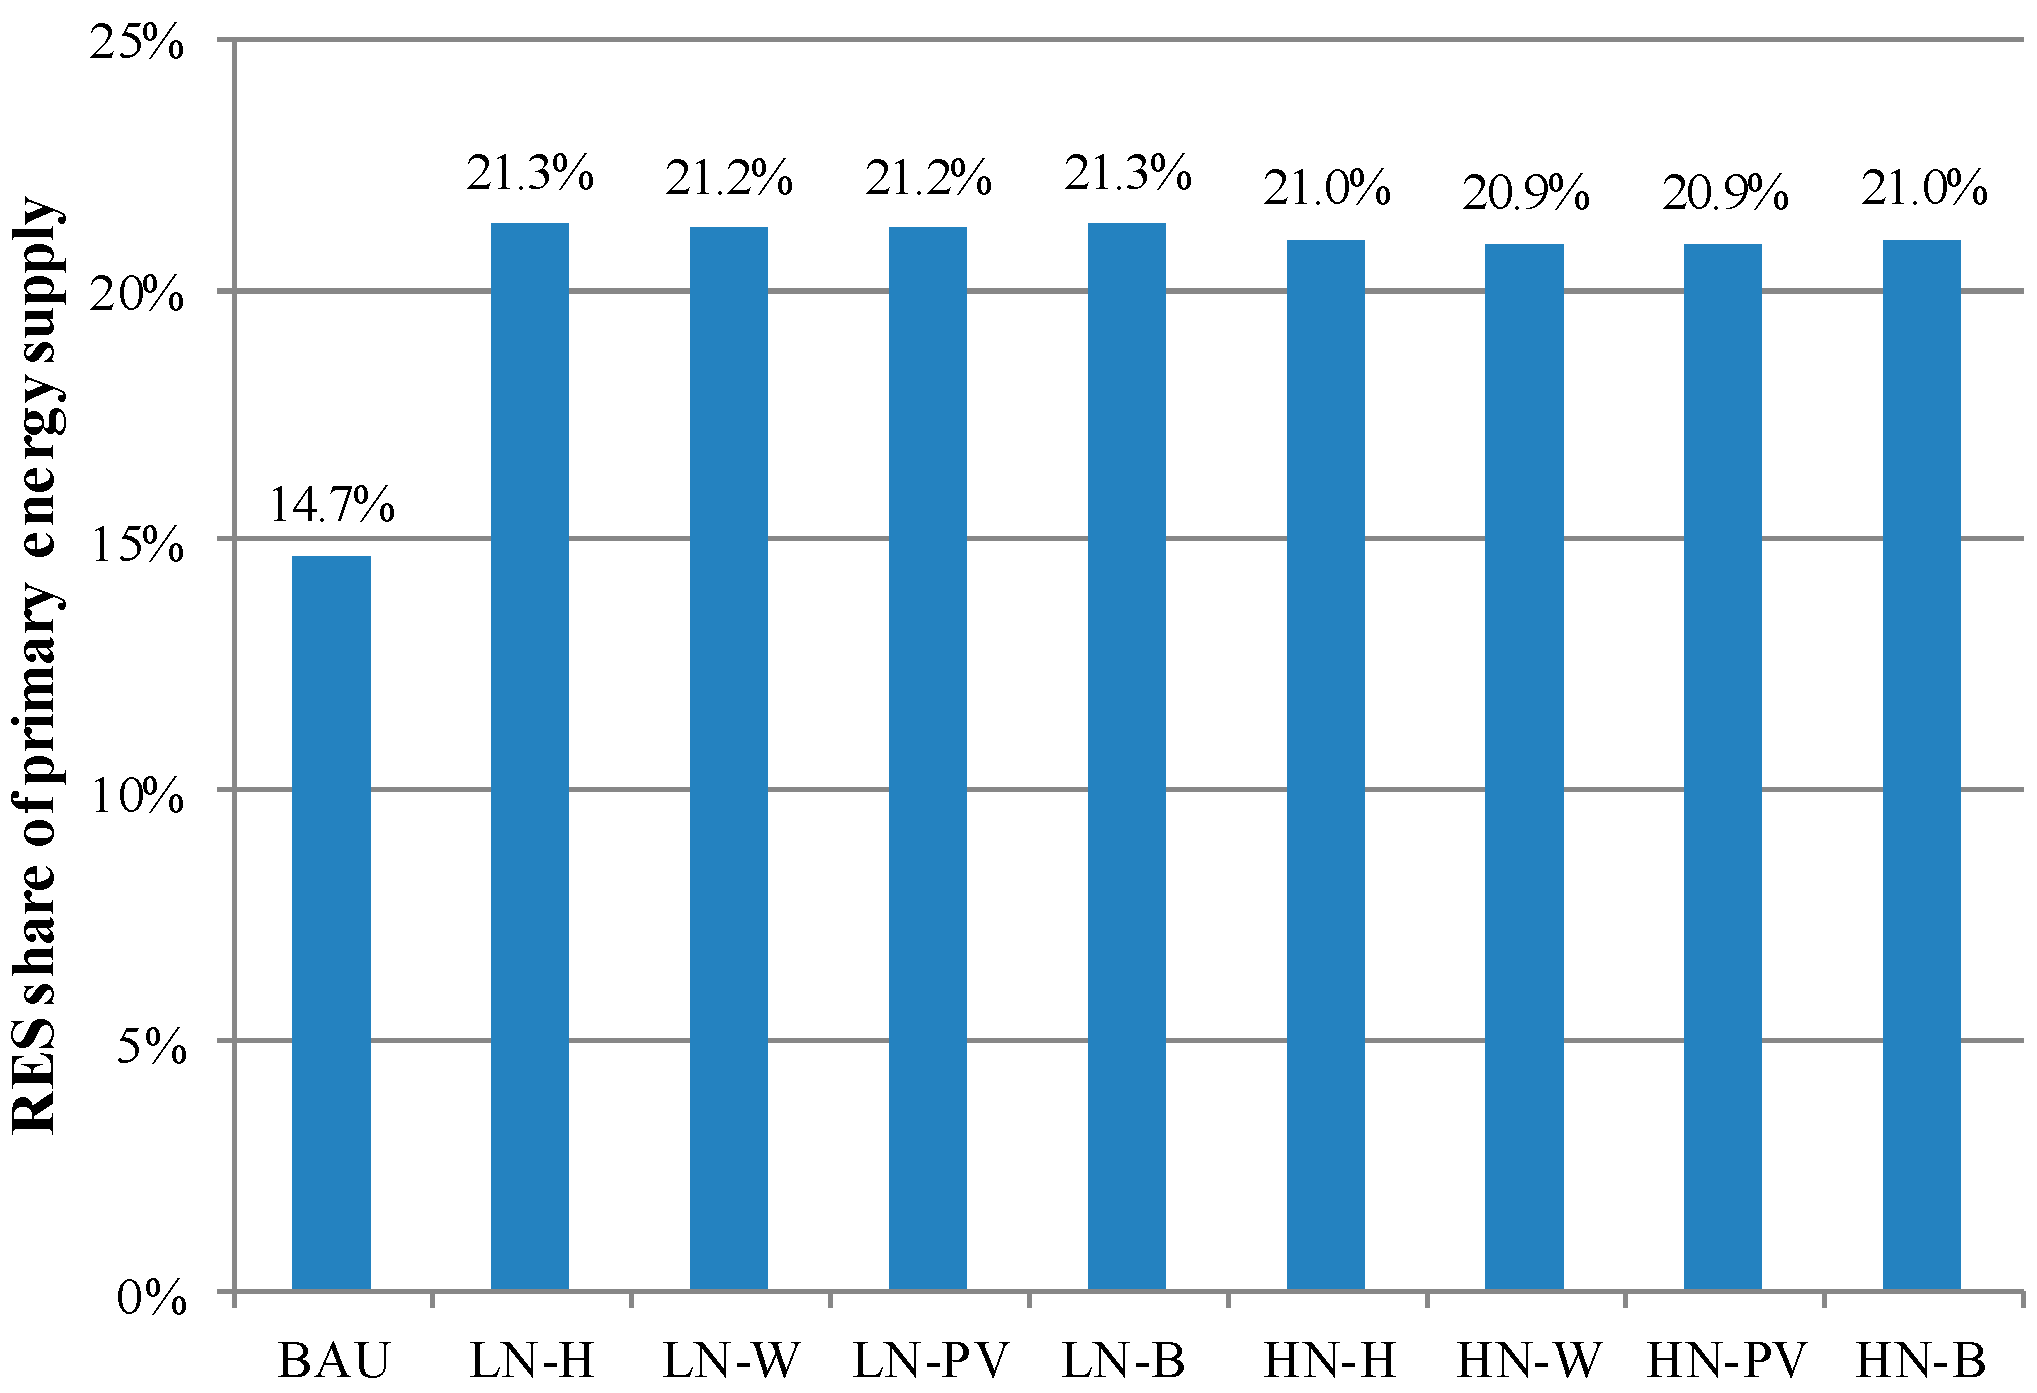
- All eight alternative scenarios can achieve the goal of 20% share of non-fossil energy in primary energy system and 40%–50% share of non-fossil energy in electricity power.
- (2)
- Low nuclear-hydro power scenario is the most sustainable scenario if it can be achieved. Taking the CO2 emission reduction into consideration, HN-H scenario would be better.
- (3)
- Analysis of LN-B scenario showed it to be comparatively sustainable energy system compared with other scenarios except for LN-H and scenario HN-H scenarios.
- (4)
- The LN-W scenario requires the lowest electricity system costs. However, it would result in only a 1.4% job increase compared to the BAU case and would produce the most excess generation, which would be a complication with the rising share of renewable energy in total generation.
- (5)
- Neither of the PV scenarios are that sustainable compared to the other scenarios. They show the highest costs (HN-PV), highest required total capacity, and second highest excess generation.
Acknowledgments
Author Contributions
Conflicts of Interest
Appendix A
References
- Wang, B.; Ke, R.; Yuan, X.; Wei, Y. China’s Regional Assessment of Renewable Energy Vulnerability to Climate Change. Renew. Sustain. Energy Rev. 2014, 40, 185–195. [Google Scholar] [CrossRef]
- Hua, Y.; Oliphant, M.; Hu, E. Development of Renewable Energy in Australia and China: A Comparison of Policies and Status. Renew. Energy 2016, 85, 1044–1051. [Google Scholar] [CrossRef]
- Lewis, J.; Fridley, D.; Price, L.; Lu, H.; Romankiewicz, J. Understanding China’s Non-Fossil Energy Targets. Science 2015, 350, 1034–1036. [Google Scholar] [CrossRef] [PubMed]
- Finkenrath, M.; Smith, J.; Volk, D. CCS Retrofit: Analysis of the Globally Installed Coal-Fired Power Plant Fleet; Organization for Economic Co-operation and Development (OECD) Publishing: Paris, France, 2012. [Google Scholar]
- Wang, X.; Du, L. Study on Carbon Capture and Storage (CCS) Investment Decision-Making Based on Real Options for China’s Coal-Fired Power Plants. J. Clean. Prod. 2016, 112, 4123–4131. [Google Scholar] [CrossRef]
- Teng, F.; Gu, A.; Yang, X.; Wang, X. Pathways to Deep Decarbonization in China; Sustainable Development Solutions Network (SDSN) and Institute for Sustainable Development and International Relations (IDDRI): Paris, France, 2015. [Google Scholar]
- Ronald, G.P.; John, M.R. 2014 Energy and Climate Outlook; Massachusetts Institute of Technology’s Joint Program on the Science and Policy of Global Change: Cambridge, MA, USA, 2014. [Google Scholar]
- Ronald, G.P.; John, M.R. 2015 Energy and Climate Outlook; Massachusetts Institute of Technology’s Joint Program on the Science and Policy of Global Change; Massachusetts Institute of Technology: Cambridge, MA, USA, 2015. [Google Scholar]
- Fatih, B. World Energy Outlook 2015; Organisation for Economic Co-Operation and Development (OECD): Paris, France, 2015. [Google Scholar]
- Fatih, B. World Energy Outlook 2014; Organisation for Economic Co-Operation and Development (OECD): Paris, France, 2014. [Google Scholar]
- Selin, R. The Outlook for Energy: A View to 2040. In Proceedings of the 2013 South East Asia Petroleum Exploration Society (SEAPEX) Conference, Singapore, 8–11 April 2013.
- Brundtland, G.; Khalid, M.; Agnelli, S.; Al-Athel, S.; Chidzero, B.; Fadika, L.; Singh, M. Our Common Future; International Institute for Environment and Development: London, UK, 1987. [Google Scholar]
- Klein, S.; Whalley, S. Comparing The Sustainability of U.S. Electricity Options through Multi-Criteria Decision Analysis. Energy Policy 2015, 79, 127–149. [Google Scholar] [CrossRef]
- Foxon, T. Transition Pathways for a UK Low Carbon Electricity Future. Energy Policy 2013, 52, 10–24. [Google Scholar] [CrossRef]
- Park, N.; Yun, S.; Jeon, E. An Analysis of Long-Term Scenarios for the Transition to Renewable Energy in the Korean Electricity Sector. Energy Policy 2013, 52, 288–296. [Google Scholar] [CrossRef]
- Krakowski, V.; Assoumou, E.; Mazauric, V.; Maïzi, N. Feasible Path toward 40%–100% Renewable Energy Shares for Power Supply in France by 2050: A Prospective Analysis. Appl. Energy 2016, 171, 501–522. [Google Scholar] [CrossRef] [Green Version]
- Trutnevyte, E. Does Cost Optimization Approximate the Real-World Energy Transition? Energy 2016, 106, 182–193. [Google Scholar] [CrossRef]
- Sithole, H.; Cockerill, T.; Hughes, K.; Ingham, D.; Ma, L.; Porter, R.; Pourkashanian, M. Developing an Optimal Electricity Generation Mix for the UK 2050 Future. Energy 2016, 100, 363–373. [Google Scholar] [CrossRef]
- Purwanto, W.W.; Pratama, Y.W.; Nugroho, Y.S.; Warjito; Hertono, G.F.; Hartono, D.; Deendarlianto; Tezuka, T. Multi-Objective Optimization Model for Sustainable Indonesian Electricity System: Analysis of Economic, Environment, and Adequacy of Energy Sources. Renew. Energy 2015, 81, 308–318. [Google Scholar] [CrossRef]
- Riesz, J.; Vithayasrichareon, P.; MacGill, I. Assessing “Gas Transition” Pathways to Low Carbon Electricity—An Australian Case Study. Appl. Energy 2015, 154, 794–804. [Google Scholar] [CrossRef]
- Yuan, J.; Xu, Y.; Hu, Z. Delivering Power System Transition in China. Energy Policy 2012, 50, 751–772. [Google Scholar] [CrossRef]
- Li, Z.; Jia, X.; Foo, D.; Tan, R. Minimizing Carbon Footprint Using Pinch Analysis: The Case of Regional Renewable Electricity Planning in China. Appl. Energy 2016. [Google Scholar] [CrossRef]
- Knaut, A.; Tode, C.; Lindenberger, D.; Malischek, R.; Paulus, S.; Wagner, J. The Reference Forecast of the German Energy Transition—An Outlook on Electricity Markets. Energy Policy 2016, 92, 477–491. [Google Scholar] [CrossRef]
- Organization for Economic Co-operation and Development. Key World Energy Statistics 2014; International Energy Agency (IEA): Paris, France, 2015. [Google Scholar]
- Yang, M.; Patiño-Echeverri, D.; Yang, F. Wind Power Generation in China: Understanding the Mismatch between Capacity and Generation. Renew. Energy 2012, 41, 145–151. [Google Scholar] [CrossRef]
- IEA Wind. 2014 Annual Report; Executive Committee of the Implementing Agreement for Co-operation in the Research and Deployment of Wind Energy Systems of the International Energy Agency: Paris, France, 2015. [Google Scholar]
- Van der Hoeven, M. World Energy Outlook 2013; International Energy Agency (IEA): Paris, France, 2013. [Google Scholar]
- Liu, W.; Lund, H.; Mathiesen, B.; Zhang, X. Potential of Renewable Energy Systems in China. Appl. Energy 2011, 88, 518–525. [Google Scholar] [CrossRef]
- Zhang, S.; Andrews-Speed, P.; Zhao, X.; He, Y. Interactions between Renewable Energy Policy and Renewable Energy Industrial Policy: A Critical Analysis of China’s Policy Approach to Renewable Energies. Energy Policy 2013, 62, 342–353. [Google Scholar] [CrossRef]
- British Petroleum (BP). BP Statistical Review of World Energy 2015; British Petroleum Company: London, UK, 2015. [Google Scholar]
- Zhang, X.; Ruoshui, W.; Molin, H.; Martinot, E. A Study of the Role Played by Renewable Energies in China’s Sustainable Energy Supply. Energy 2010, 35, 4392–4399. [Google Scholar] [CrossRef]
- Li, X. Decarbonizing China’s Power System with Wind Power: The Past and the Future; The Oxford Institute for Energy Studies: Oxford, UK, 2015. [Google Scholar]
- International Energy Agency (IEA); Energy Research Institute (ERI). China Wind Energy Development Roadmap 2050; OECD/International Energy Agency: Paris, France, 2011. [Google Scholar]
- Martinot, E. Renewables 2015 Global Status Report; Renewable Energy Policy Network for the 21st Century (REN21): Paris, France, 2015. [Google Scholar]
- Zhang, N.; Lior, N.; Jin, H. The Energy Situation and Its Sustainable Development Strategy in China. Energy 2011, 36, 3639–3649. [Google Scholar] [CrossRef]
- Lu, X.; McElroy, M.; Kiviluoma, J. Global Potential for Wind-Generated Electricity. Proc. Natl. Acad. Sci. USA 2009, 106, 10933–10938. [Google Scholar] [CrossRef] [PubMed] [Green Version]
- Sun, S.; Liu, F.; Xue, S.; Zeng, M.; Zeng, F. Review on Wind Power Development in China: Current Situation and Improvement Strategies to Realize Future Development. Renew. Sustain. Energy Rev. 2015, 45, 589–599. [Google Scholar] [CrossRef]
- Xia, C.; Song, Z. Wind Energy in China: Current Scenario and Future Perspectives. Renew. Sustain. Energy Rev. 2009, 13, 1966–1974. [Google Scholar]
- Ling, Y.; Cai, X. Exploitation and Utilization of the Wind Power and Its Perspective in China. Renew. Sustain. Energy Rev. 2012, 16, 2111–2117. [Google Scholar] [CrossRef]
- Liao, C.; Jochem, E.; Zhang, Y.; Farid, N. Wind Power Development and Policies in China. Renew. Sustain. Energy Rev. 2010, 35, 1879–1886. [Google Scholar] [CrossRef]
- International Renewable Energy Agency (IRENA). Renewable Energy Prospects: China; International Renewable Energy Agency: Abu Dhabi, UAE, 2014. [Google Scholar]
- Li, J.; Cai, F.; Qiao, L.; Wang, J.; Gao, H.; Tang, W.; Peng, P.; Geng, D.; Li, X.; Li, Q. 2014 China Wind Power Review and Outlook; Global Wind Energy Council: Brussels, Belgium, 2014. [Google Scholar]
- Liu, W.; Lund, H.; Mathiesen, B.V. The Potential of Renewable Energy Systems in China; Aalborg University: Aalborg, Denmark, 2009. [Google Scholar]
- Li, J.; Ma, L. Background Paper: Chinese Renewable Status Report; Renewable Energy Policy Network for the 21st Century (REN21): Paris, France, 2009. [Google Scholar]
- Energy Research Institute. Renewable Energy Roadmap for China in 2030; Energy Research Institute National Development and Reform Commission: Beijing, China, 2011. [Google Scholar]
- Da, Z.; Xiliang, Z.; Jiankun, H.; Qimin, C. Offshore Wind Energy Development in China: Current Status and Future Perspective. Renew. Sustain. Energy Rev. 2011, 15, 4673–4684. [Google Scholar] [CrossRef]
- Chen, J. Development of Offshore Wind Power in China. Renew. Sustain. Energy Rev. 2011, 15, 5013–5020. [Google Scholar] [CrossRef]
- He, G.; Kammen, D. Where, When and How Much Solar Is Available? A Provincial-Scale Solar Resource Assessment for China. Renew. Energy 2016, 85, 74–82. [Google Scholar] [CrossRef]
- Ummel, K. Concentrating Solar Power in China and India: A Spatial Analysis of Technical Potential and the Cost of Deployment; Working Paper; Center for Global Development: Washington, DC, USA, 2010. [Google Scholar]
- Zhao, X.; Wang, J.; Liu, X.; Liu, P. China’s Wind, Biomass and Solar Power Generation: What the Situation Tells Us? Renew. Sustain. Energy Rev. 2012, 16, 6173–6182. [Google Scholar]
- Huang, S. Geothermal Energy in China. Nat. Clim. Chang. 2012, 2, 557–560. [Google Scholar] [CrossRef]
- Wang, S.; Yuan, P.; Li, D.; Jiao, Y. An Overview of Ocean Renewable Energy in China. Renew. Sustain. Energy Rev. 2011, 15, 91–111. [Google Scholar] [CrossRef]
- Lin, J.; He, G.; Yuan, A. Economic Rebalancing and Electricity Demand in China. Electr. J. 2016, 29, 48–54. [Google Scholar] [CrossRef]
- Wang, Z.; Zhang, J.; Pan, L.; Yang, F.; Shi, L. Estimate of China’s Energy Carbon Emissions Peak and Analysis On Electric Power Carbon Emissions. Adv. Clim. Chang. Res. 2014, 5, 181–188. [Google Scholar] [CrossRef]
- Hu, Z.; Tan, X.; Xu, Z. An Exploration into China’s Economic Development and Electricity Demand by the Year 2050; Elsevier: London, UK, 2013. [Google Scholar]
- Fridley, D.; Zheng, N.; Zhou, N.; Ke, J.; Hasanbeigi, A.; Morrow, B.; Price, L. China Energy and Emissions Paths to 2030; China Energy Group, Energy Analysis Department Environmental Energy Technologies Division Lawrence Berkeley National Laboratory: Berkeley, CA, USA, 2012. [Google Scholar]
- Yuan, J.; Na, C.; Lei, Q.; Xiong, M.; Guo, J.; Hu, Z. Coal use for power generation in China. Resour. Conserv. Recycl. 2016. [Google Scholar] [CrossRef]
- Campbell, R.J. China and the United States—A Comparison of Green Energy Programs and Policies; Congressional Research Service: Washington, DC, USA, 2010. [Google Scholar]
- China’s Energy Policy 2012. Available online: http://www.china.org.cn/government/whitepaper/node_7170375.htm (accessed on 24 October 2012).
- Yuan, X.; Ma, R.; Zuo, J.; Mu, R. Towards a Sustainable Society: The Status and Future of Energy Performance Contracting in China. J. Clean. Prod. 2016, 112, 1608–1618. [Google Scholar] [CrossRef]
- Wang, L.; Patel, P.; Yu, S.; Liu, B.; McLeod, J.; Clarke, L.; Chen, W. Win–Win Strategies to Promote Air Pollutant Control Policies and Non-Fossil Energy Target Regulation in China. Appl. Energy 2016, 163, 244–253. [Google Scholar] [CrossRef]
- Brødsgaard, K.E. China’s 13th Five-Year Plan: A Draft Proposal. J. Asian Stud. 2016, 33, 97–105. [Google Scholar]
- Hoeven, M.V.D. CO2 Emissions from Fuel Combustion IEA Statistics Highlights; International Energy Agency (IEA): Paris, France, 2015. [Google Scholar]
- Chalvatzis, K.; Rubel, K. Electricity Portfolio Innovation for Energy Security: The Case of Carbon Constrained China. Technol. Forecast. Soc. Chang. 2015, 100, 267–276. [Google Scholar] [CrossRef] [Green Version]
- Zhang, Z.; Jin, X.; Yang, Q.; Zhang, Y. An Empirical Study on the Institutional Factors of Energy Conservation and Emissions Reduction: Evidence from Listed Companies in China. Energy Policy 2013, 57, 36–42. [Google Scholar] [CrossRef]
- Li, C.; Tang, S.; Cao, Y.; Xu, Y.; Li, Y.; Li, J.; Zhang, R. A New Stepwise Power Tariff Model and Its Application for Residential Consumers in Regulated Electricity Markets. IEEE Trans. Power Syst. 2013, 28, 300–308. [Google Scholar] [CrossRef]
- Wang, C.; Yang, Y.; Zhang, J. China’s Sectoral Strategies in Energy Conservation and Carbon Mitigation. Clim. Policy 2015, 15, S60–S80. [Google Scholar] [CrossRef]
- Cornot-Gandolphe, S. China’s Coal Market: Can Beijing Tame ‘King Coal’? The Oxford Institute for Energy Studies: Oxford, UK, 2014. [Google Scholar]
- Kannan, R. The Development and Application of a Temporal MARKAL Energy System Model Using Flexible Time Slicing. Appl. Energy 2011, 88, 2261–2272. [Google Scholar] [CrossRef]
- Connolly, D.; Lund, H.; Mathiesen, B.; Leahy, M. A Review of Computer Tools for Analysing the Integration of Renewable Energy into Various Energy Systems. Appl. Energy 2010, 87, 1059–1082. [Google Scholar] [CrossRef]
- Lund, H.; Münster, E. Modelling of Energy Systems with a High Percentage of CHP and Wind Power. Renew. Energy 2003, 28, 2179–2193. [Google Scholar] [CrossRef]
- Al-Mansour, F.; Merse, S.; Tomsic, M. Comparison of Energy Efficiency Strategies in the Industrial Sector of Slovenia. Energy 2003, 28, 421–440. [Google Scholar] [CrossRef]
- Fowler, P.; Krajačić, G.; Lončar, D.; Duić, N. Modeling the Energy Potential of Biomass—H2RES. Int. J. Hydrog. Energy 2009, 34, 7027–7040. [Google Scholar] [CrossRef]
- Lehmann, H.; Kruska, M.; Ichiro, D.; Ohbayashi, M.; Takase, K.; Tetsunari, I. Energy Rich Japan: Full Report; Institute for Sustainable Solutions and Innovations: Aachen, Germany, 2003. [Google Scholar]
- Østergaard, P. Reviewing Energyplan Simulations and Performance Indicator Applications in Energyplan Simulations. Appl. Energy 2015, 154, 921–933. [Google Scholar] [CrossRef]
- Mahbub, M.; Cozzini, M.; Østergaard, P.; Alberti, F. Combining Multi-Objective Evolutionary Algorithms and Descriptive Analytical Modelling in Energy Scenario Design. Appl. Energy 2016, 164, 140–151. [Google Scholar] [CrossRef]
- Cho, S.; Kim, J. Feasibility and Impact Analysis of a Renewable Energy Source (RES)-Based Energy System in Korea. Energy 2015, 85, 317–328. [Google Scholar] [CrossRef]
- Batas Bjelić, I.; Rajaković, N. Simulation-Based Optimization of Sustainable National Energy Systems. Energy 2015, 91, 1087–1098. [Google Scholar] [CrossRef]
- Pohekar, S.; Ramachandran, M. Application of Multi-Criteria Decision Making to Sustainable Energy Planning—A Review. Renew. Sustain. Energy Rev. 2004, 8, 365–381. [Google Scholar] [CrossRef]
- Wang, J.; Jing, Y.; Zhang, C.; Zhao, J. Review on Multi-Criteria Decision Analysis Aid in Sustainable Energy Decision-Making. Renew. Sustain. Energy Rev. 2009, 13, 2263–2278. [Google Scholar] [CrossRef]
- Hong, S.; Bradshaw, C.; Brook, B. Evaluating Options for Sustainable Energy Mixes in South Korea Using Scenario Analysis. Energy 2013, 52, 237–244. [Google Scholar] [CrossRef]
- Vidal-Amaro, J.; Østergaard, P.; Sheinbaum-Pardo, C. Optimal Energy Mix for Transitioning from Fossil Fuels to Renewable Energy Sources—The Case of the Mexican Electricity System. Appl. Energy 2015, 150, 80–96. [Google Scholar] [CrossRef]
- Tafarte, P.; Das, S.; Eichhorn, M.; Thrän, D. Small Adaptations, Big Impacts: Options for an Optimized Mix of Variable Renewable Energy Sources. Energy 2014, 72, 80–92. [Google Scholar] [CrossRef]
- Rutovitz, J.; Harris, S. Calculating Global Energy Sector Jobs: 2012 Methodology; Institute for Sustainable Futures, University of Technology: Sydney, Australia, 2012. [Google Scholar]
- Maxim, A. Sustainability Assessment of Electricity Generation Technologies Using Weighted Multi-Criteria Decision Analysis. Energy Policy 2014, 65, 284–297. [Google Scholar] [CrossRef]
- Cai, W.; Wang, C.; Chen, J.; Wang, S. Green Economy and Green Jobs: Myth or Reality? The Case of China’s Power Generation Sector. Energy 2011, 36, 5994–6003. [Google Scholar] [CrossRef]
- Xiong, W.; Wang, Y.; Mathiesen, B.; Lund, H.; Zhang, X. Heat Roadmap China: New Heat Strategy to Reduce Energy Consumption towards 2030. Energy 2015, 81, 274–285. [Google Scholar] [CrossRef]
- Zhu, Z.; Zhang, D.; Mischke, P.; Zhang, X. Electricity Generation Costs of Concentrated Solar Power Technologies in China Based on Operational Plants. Energy 2015, 89, 65–74. [Google Scholar] [CrossRef] [Green Version]
- Chatterton, R.; Rietz, A.D. Renewables Targets That Bite? Comparing Renewable Energy Targets with BNEF’s New Energy Outlook; Bloomberg New Energy Finance: New York, NY, USA, 2015. [Google Scholar]
- World Nuclear Association. Nuclear Power in China. 2016. Available online: http://www.world-nuclear.org/information-library/country-profiles/countries-a-f/china-nuclear-power.aspx (accessed on 5 January 2016).
- Luukkanen, J.; Panula-Ontto, J.; Vehmas, J.; Liyong, L.; Kaivo-oja, J.; Häyhä, L.; Auffermann, B. Structural change in Chinese economy: Impacts on energy use and CO2 emissions in the period 2013–2030. Technol. Forecast. Soc. Chang. 2015, 94, 303–317. [Google Scholar] [CrossRef]
- China National Renewable Energy Centre (CNREC). China Wind, Solar and Bioenergy Roadmap 2050 Short Version; CNREC: Beijing, China, 2014. [Google Scholar]
- Sun, C.; Ouyang, X. Price and Expenditure Elasticities of Residential Energy Demand During Urbanization: An Empirical Analysis Based on the Household-Level Survey Data in China. Energy Policy 2016, 88, 56–63. [Google Scholar] [CrossRef]
- Qvist, S.; Brook, B. Potential for Worldwide Displacement of Fossil-Fuel Electricity by Nuclear Energy in Three Decades Based on Extrapolation of Regional Deployment Data. PLoS ONE 2015, 10. [Google Scholar] [CrossRef] [PubMed]
- Tang, X.; McLellan, B.; Snowden, S.; Zhang, B.; Höök, M. Dilemmas for China: Energy, Economy and Environment. Sustainability 2015, 7, 5508–5520. [Google Scholar] [CrossRef] [Green Version]
- Tang, X.; Snowden, S.; McLellan, B.; Höök, M. Clean Coal Use in China: Challenges and Policy Implications. Energy Policy 2015, 87, 517–523. [Google Scholar] [CrossRef]
- Connolly, D.; Lund, H.; Mathiesen, B.; Leahy, M. Modelling the existing Irish energy-system to identify future energy costs and the maximum wind penetration feasible. Energy 2010, 35, 2164–2173. [Google Scholar] [CrossRef]


| Measurement Agency (Year) | Available Areas (Thousand km2) | Height (m) | Technical Exploitable Resources (GW) | References |
|---|---|---|---|---|
| Onshore | ||||
| The 2nd Survey on National Wind Power Resources (1990s) | 10 | 253 | [31,36,37,38] | |
| China Meteorological Administration (2007) | 200 | 10 | 297 | [38,39] |
| China Meteorological Administration (2007) | 540 | 50 | 2680 | [38] |
| United Nations Environment Programme (2004) | 284 | 50 | 1420 | [40] |
| China Meteorological Administration (2009) | 50 | 2380 | [32,41] | |
| China Meteorological Administration (2011) | 50 | 2000 | [42] | |
| 70 | 2600 | [42] | ||
| 100 | 3400 | [32] | ||
| National Climate Centre (2006) | 10 | 2548 | [28] | |
| China Meteorology Research Institute (2009) | 10 | 1000 | [43] | |
| China National Renewable Energy Centre (2012) | >50 | 1300–2600 | [41] | |
| Chinese Academy of Engineering (2009) | 300–1400 | [44] | ||
| China Academy of Engineering (2008) | 700–1200 1 | [45] | ||
| US National Renewable Energy Laboratory (2003) | 50 | 1400 | [46] | |
| Average onshore | 10 | 1024.5 | ||
| 50 | 1976 | |||
| Offshore | ||||
| China Meteorological Administration (1990s) | 10 | 750 | [38,47] | |
| United Nations Environment Programme (2004) | 122 | 50 | 600 | [31] |
| Chinese Academy of Sciences (2006) | 10 | 2000 | [38] | |
| China Meteorological Administration (2007) | 37 | 50 | 180 | [38] |
| National Climate Centre (2009) | 50 | 758 | [38] | |
| Energy Research Institute (2007) | 30 | 150 | [38] | |
| China Meteorological Administration (2009) | 50 | 200 | [38] | |
| Chinese Academy of Meteorological Science (2003) | 10 | 3200 | [40] | |
| US National Renewable Energy Laboratory (2003) | 600 | [46] | ||
| China National Renewable Energy Centre (2012) | 5–25 | 200 | [41] | |
| Average offshore | 10 | 1983 | ||
| 50 | 434.5 | |||
| References | Capacity (GW) | Generation (TWh/y) | Assumed Capacity Factor | Description |
|---|---|---|---|---|
| [28] | n.a 1 | 6480 + 1296 | n.a 1 | Unclear |
| [42] | 2200 + 500 | n.a 1 | 17% for Utility-scale projects, and about 15% for rooftop solar | Technical capacity, 2200 GW for utility and 500 for rooftop |
| [43] | n.a 1 | 1300–6500 | n.a 1 | Unclear |
| [45] | 2200 | n.a 1 | n.a 1 | Economic capacity |
| [49] | 6486 2 | 51,133 | 90% | Technical potential |
| 9064 2 | 71,461 | 90% | Technical potential | |
| 9114 2 | 71,858 | 90% | Technical potential | |
| [48] | 4700–39,300 | 6900–70,100 | 10.94%–23.79% | Stationary solar theoretical potential |
| 200 | Distributed solar theoretical potential |
| Study | 2020 | 2030 | 2050 |
|---|---|---|---|
| [9] | 6254 | 8123 | n.a 1 |
| [54] | 8600 | 11,900 | n.a 1 |
| [55] | n.a 1 | 9900 | 14,300 |
| [42] | n.a 1 | 9543 | n.a 1 |
| [56] | n.a 1 | n.a 1 | 9100 |
| [57] | 6975 | 9483 | n.a 1 |
| Average | 7276 | 9790 | 11,700 |
| Prod. Type | Investment (Million RMB Per MW) | Life Time (Years) | Operation and Management (% of Investment) |
|---|---|---|---|
| Small CHP units | 4 | 35 | 4 |
| Large CHP units | 4.2 | 30 | 4 |
| Large power plants | 4 | 40 | 3 |
| Nuclear | 13 | 60 | 3 |
| Wind | 4 | 20 | 2 |
| PV | 7.5 | 20 | 0.5 |
| Hydro power | 5 | 50 | 0.5 |
| CSP solar power | 31.62 | 25 | 1 |
| Alternative Scenarios | Description | Assumed Installed Capacity (GW) | |||
|---|---|---|---|---|---|
| Nuclear | Hydro | Wind | Solar PV | ||
| LN-H | Low nuclear-high Hydro | 120 | 585 | 400 | 331 |
| HN-W | Low nuclear-high Wind | 120 | 400 | 800 | 112 |
| LN-PV | Low nuclear-high PV | 120 | 400 | 341 | 800 |
| LN-B | Low nuclear-Balanced mix | 120 | 440 | 500 | 480 |
| HN-H | High nuclear-high Hydro | 200 | 585 | 400 | 331 |
| HN-W | High nuclear-high Wind | 200 | 400 | 800 | 112 |
| HN-PV | High nuclear-high PV | 200 | 400 | 341 | 800 |
| HN-B | High nuclear-Balanced mix | 200 | 440 | 500 | 480 |
© 2016 by the authors; licensee MDPI, Basel, Switzerland. This article is an open access article distributed under the terms and conditions of the Creative Commons Attribution (CC-BY) license (http://creativecommons.org/licenses/by/4.0/).
Share and Cite
Sun, X.; Zhang, B.; Tang, X.; McLellan, B.C.; Höök, M. Sustainable Energy Transitions in China: Renewable Options and Impacts on the Electricity System. Energies 2016, 9, 980. https://doi.org/10.3390/en9120980
Sun X, Zhang B, Tang X, McLellan BC, Höök M. Sustainable Energy Transitions in China: Renewable Options and Impacts on the Electricity System. Energies. 2016; 9(12):980. https://doi.org/10.3390/en9120980
Chicago/Turabian StyleSun, Xiaoyang, Baosheng Zhang, Xu Tang, Benjamin C. McLellan, and Mikael Höök. 2016. "Sustainable Energy Transitions in China: Renewable Options and Impacts on the Electricity System" Energies 9, no. 12: 980. https://doi.org/10.3390/en9120980