Article

Optimization of Key Parameters of Energy Management Strategy for Hybrid Electric Vehicle Using DIRECT Algorithm

1
School of Automotive Studies, Tongji University, Shanghai 201804, China
2
SAIC Motor Commercial Vehicle Technical Center, Shanghai 200438, China
*
Author to whom correspondence should be addressed.
Energies 2016, 9(12), 997; https://doi.org/10.3390/en9120997
Submission received: 22 August 2016 / Revised: 16 November 2016 / Accepted: 22 November 2016 / Published: 26 November 2016

Abstract

:
The rule-based logic threshold control strategy has been frequently used in energy management strategies for hybrid electric vehicles (HEVs) owing to its convenience in adjusting parameters, real-time performance, stability, and robustness. However, the logic threshold control parameters cannot usually ensure the best vehicle performance at different driving cycles and conditions. For this reason, the optimization of key parameters is important to improve the fuel economy, dynamic performance, and drivability. In principle, this is a multiparameter nonlinear optimization problem. The logic threshold energy management strategy for an all-wheel-drive HEV is comprehensively analyzed and developed in this study. Seven key parameters to be optimized are extracted. The optimization model of key parameters is proposed from the perspective of fuel economy. The global optimization method, DIRECT algorithm, which has good real-time performance, low computational burden, rapid convergence, is selected to optimize the extracted key parameters globally. The results show that with the optimized parameters, the engine operates more at the high efficiency range resulting into a fuel savings of 7% compared with non-optimized parameters. The proposed method can provide guidance for calibrating the parameters of the vehicle energy management strategy from the perspective of fuel economy.

1. Introduction

The main factors affecting the fuel consumption and emission performance of a hybrid electric vehicle (HEV) include the performance parameters of various powertrain components and vehicle control strategy parameters. Optimizing the parameters of the powertrain and control strategy will not only result in a reasonable match for the powertrain, but also reduce the vehicle fuel consumption and emissions.
At this stage, the energy management strategy based on logic threshold is mainly used in HEVs [1,2]. The focus is to predetermine a number of threshold parameters that make the engine and battery work in the high efficiency area. The battery charging and discharging efficiency are also considered in order to properly distribute the driver’s required torque to the engine and motor, thereby attaining a good vehicle fuel economy and emission performance.
In vehicle tests, the predefined parameter values of the logic threshold control strategy are usually obtained by trial and error based on engineering experience. This method requires considerable debugging time to acquire satisfactory results both in simulation and vehicle transfer hub test for the defined typical driving cycle. In addition, this method cannot ensure optimal global parameters. Therefore, it is necessary to adopt an optimization method that can automatically search the globally optimized threshold parameters for the energy management strategy.
The optimization of key parameters for logic threshold energy management strategies is a mathematical nonlinear problem with many variable constraints. The genetic algorithm was applied in optimizing various governing parameters of hybrid electric vehicles (HEVs) and the fuel economy was improved significantly [3,4,5,6]. The multi-objective genetic algorithm was adopted to optimize the control parameters of the HEV for improving the fuel economy and emission performance [7,8]. Li et al. utilized a modified non-dominated sorting genetic algorithm-II to effectively optimize the logic threshold control strategy parameters of the HEV to minimize the equivalent fuel consumption [9]. Li et al. applied a hybrid genetic algorithm (HGA), which combines an enhanced genetic algorithm with simulated annealing, in optimizing the powertrain and control parameters of plug-in hybrid electric bus simultaneously. Simulation results show that HGA has a better convergence speed and global searching ability [10]. The particle swarm optimization (PSO) algorithm was applied to search the optimal value of the power system and control parameters of HEV to improve the fuel economy [11,12,13]. In order to achieve a better fuel economy and emission performance, Deng et al. presented an optimization method for logic threshold control strategy parameters of a parallel HEV using the simulated annealing particle swarm optimization [14]. Wang et al. utilized evolutionary algorithm in conjunction with an instantaneous optimal energy management strategy to optimize the propulsion system parameters as well as the energy control parameters for plug-in HEV [15]. Zhang et al. used differential evolution algorithm to globally optimize the plug-in HEV control parameters [16]. Long et al. optimized the key component and control parameters by using the bees algorithm [17]. Chris et al. showed that the DIvided RECTangle (DIRECT) algorithm has a better optimal effect compared with the genetic algorithm, simulated annealing, PSO and other algorithms by test, because it can cover the global space for parameter optimization without missing any optimization value [18].
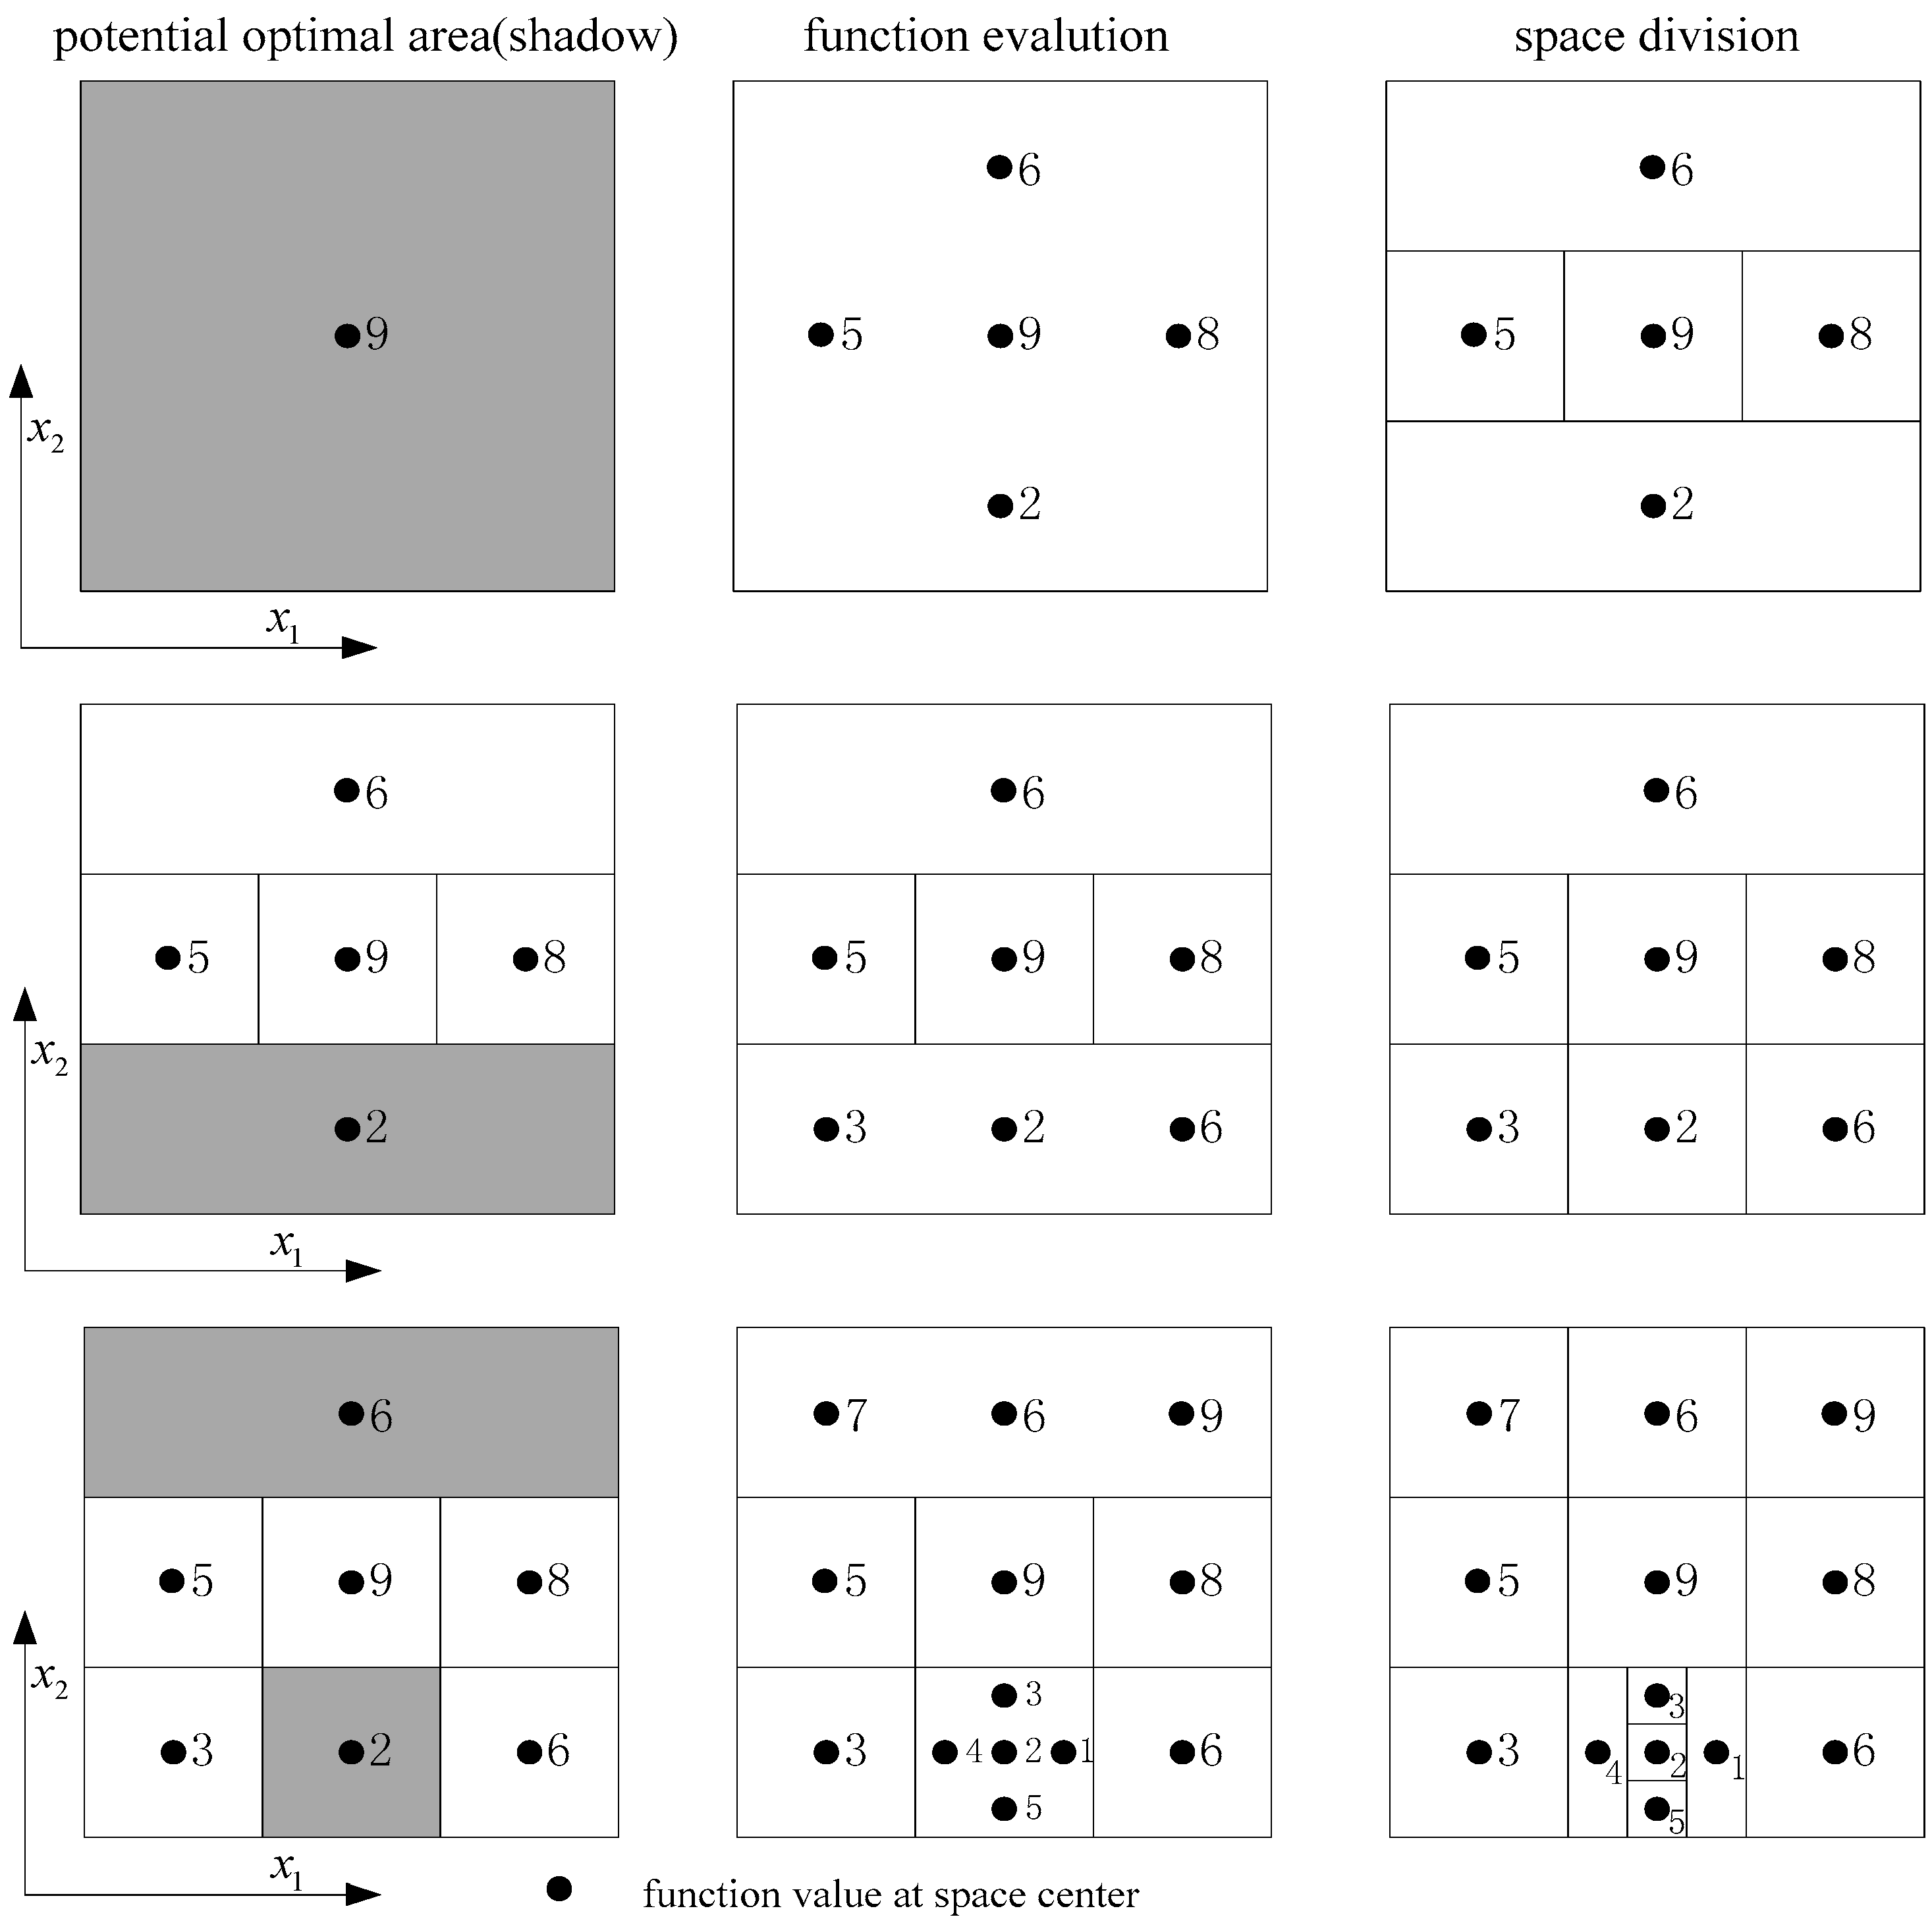
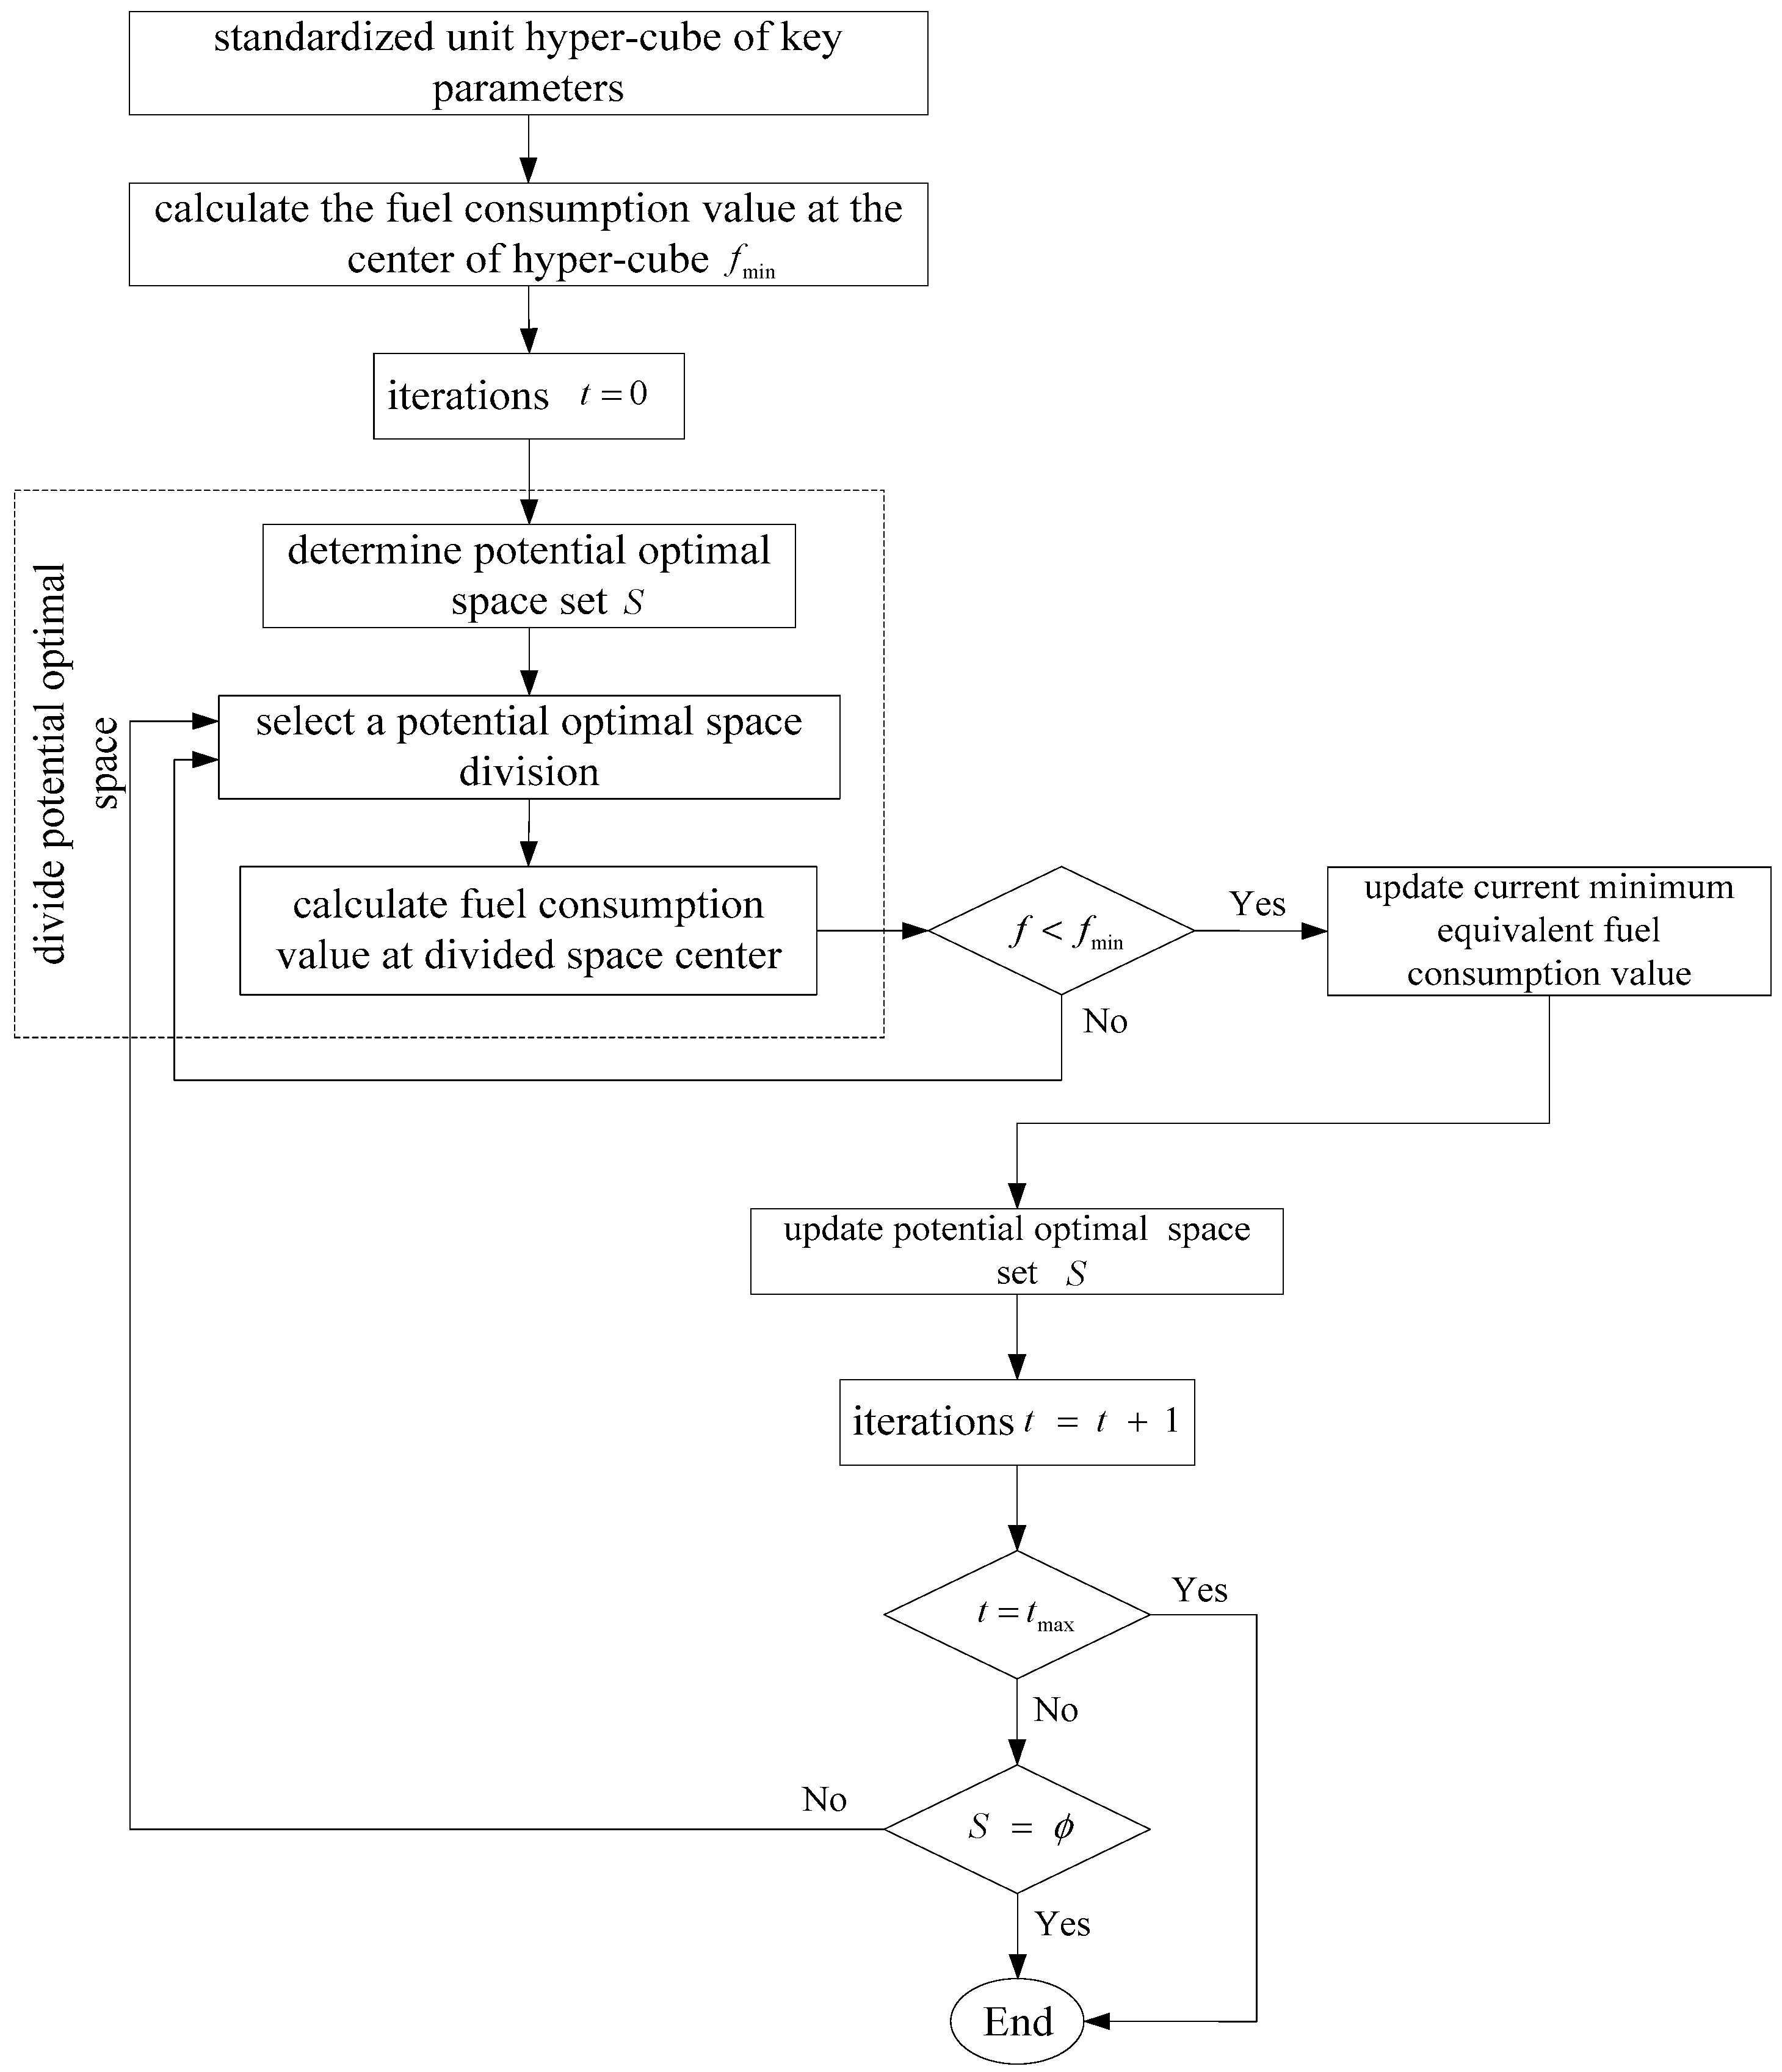
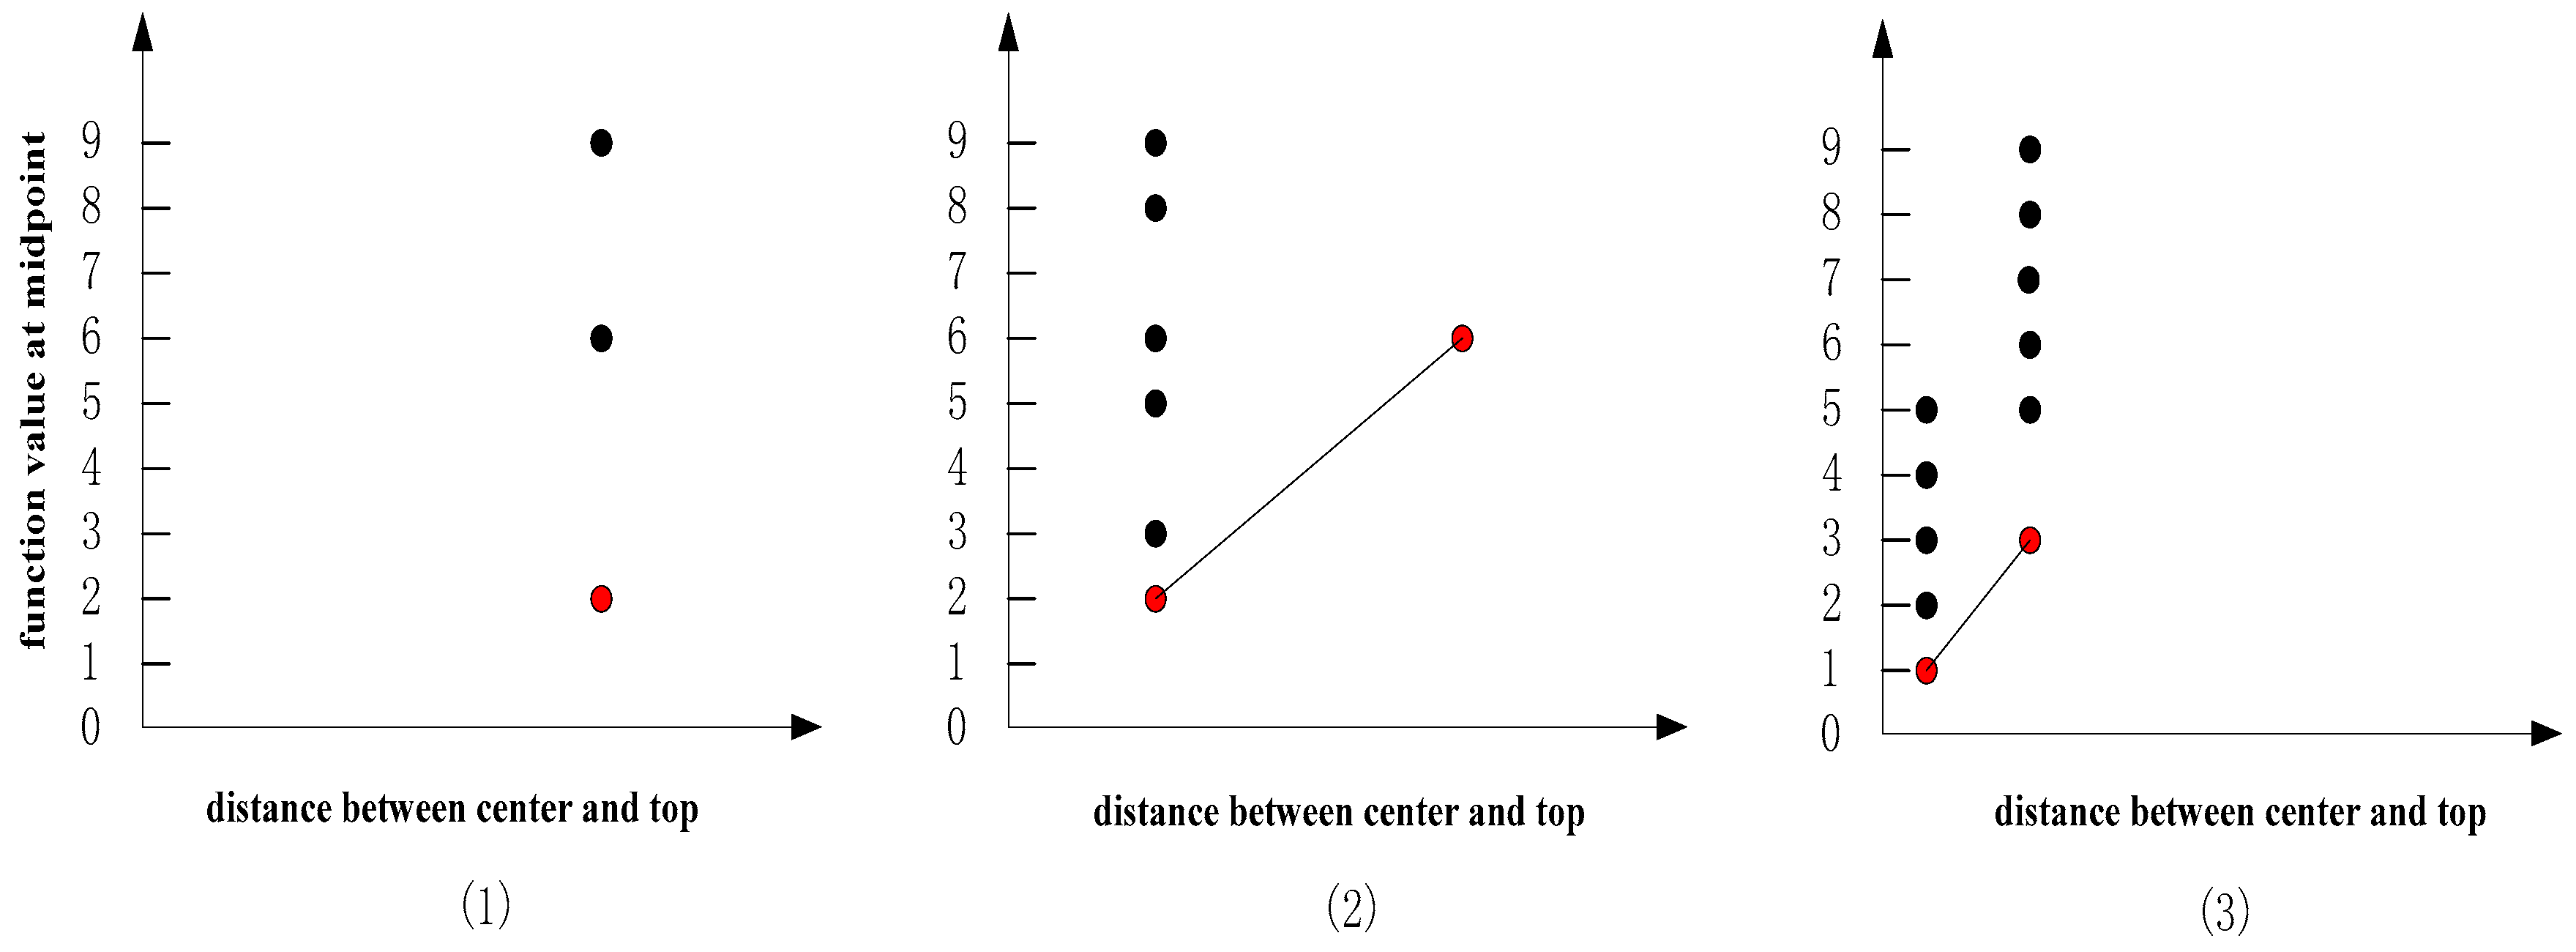
The DIRECT algorithm [19] does not require a clear expression of the objective function equation as well as derivative information, but decides on the next searching area based on the estimated value of the function at the sampling points of each iteration and the division of a hyper-rectangle. Thus, it is ideal for simulation of the black-box function optimization [20]. However, it requires a large number of samples in the region to ensure the final global optimum. Besides, the number of estimated function is relatively larger than that of the gradient-based optimization method. In practical engineering optimization, the meta-model optimization is often very complex and the simulation time is relatively long [21]. Instead of the complex meta-model, an approximate model built by the sampling points of each DIRECT algorithm iteration is utilized, thereby reducing the number of simulations, improving the convergence speed, shortening the optimization time, and saving computing resources.
As mentioned above, the advantage of DIRECT algorithm is to obtain the global optimization result compared with other optimization algorithm. Besides, it also has low computational burden, rapid convergence. So it is meaningful to utilize the DIRECT algorithm to acquire the global optimized value of the parameters of HEV energy management strategy. However, a few works have been found to optimize the control strategy parameters of hybrid electric vehicle utilizing the DIRECT algorithm. Rousseau et al. and He et al. established a power component parameter optimization model for a HEV to minimize the fuel consumption. The constraints are the dynamic design specifications and variables, namely the engine power, battery power, battery capacity, battery bus voltage, etc. The DIRECT algorithm is utilized to optimize these parameters. Whereas, the logic threshold control strategy parameters have not been analyzed and optimized [22,23]. Panday et al. utilized DIRECT algorithm to optimize partial parameters of HEV control strategy, such as state of charge in the battery, engine idle speed, engine on duration and power demand [24].
The general comparison of different algorithms is presented in Table 1. The research works which optimize the parameters of HEV energy management strategy utilizing GA, PSO, etc. may lead to local optimization. The DIRECT algorithm based optimization method can ensure the global optimized parameters of HEV energy management strategy. However, the literatures which optimized hybrid electric vehicle parameters based on DIRECT algorithm merely optimized the parameters of powertrain configuration or partial parameters of control strategy to improve energy efficiency. Few research works have comprehensively analyzed and optimized the influencing parameters of logic threshold control strategy for HEV, especially for all-wheel-drive HEV. The logic threshold control strategy of all-wheel-drive HEV is more complicated, for the all-wheel-drive HEV has more freedom of power sources. And the optimization of the logic threshold control strategy parameters for all-wheel-drive HEV comprehensively is more challenging and more meaningful to improve the fuel economy.
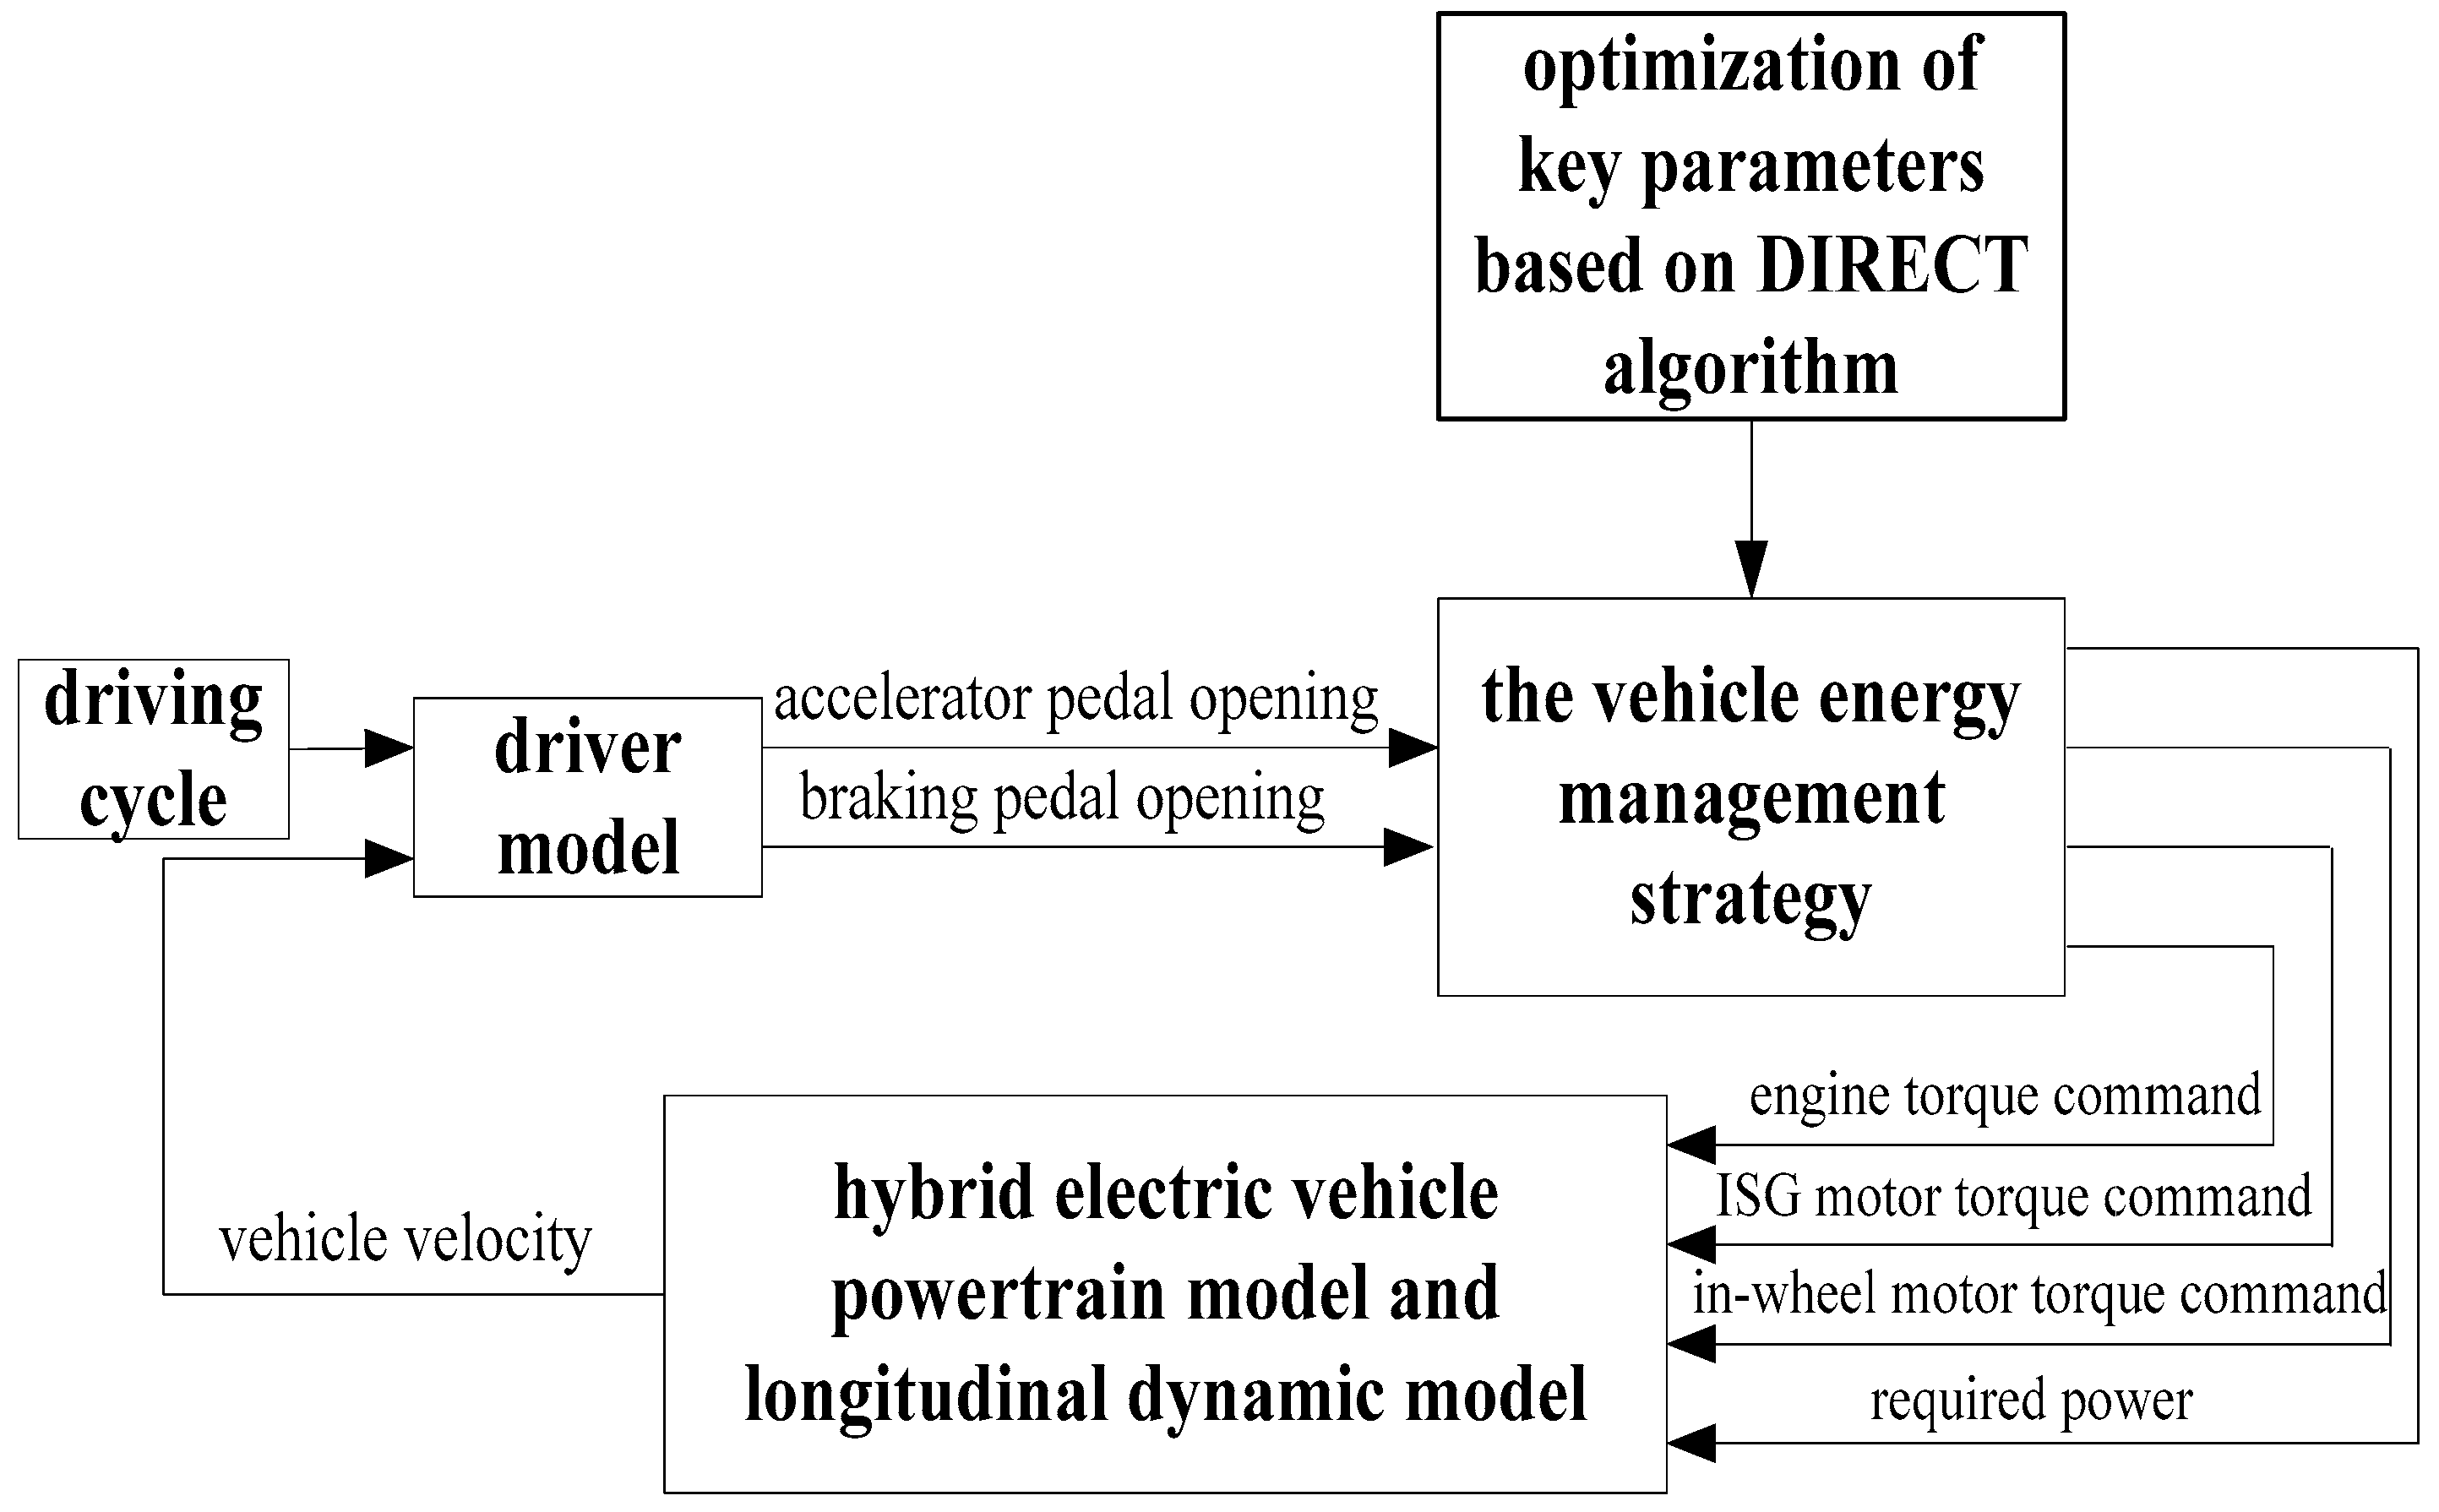
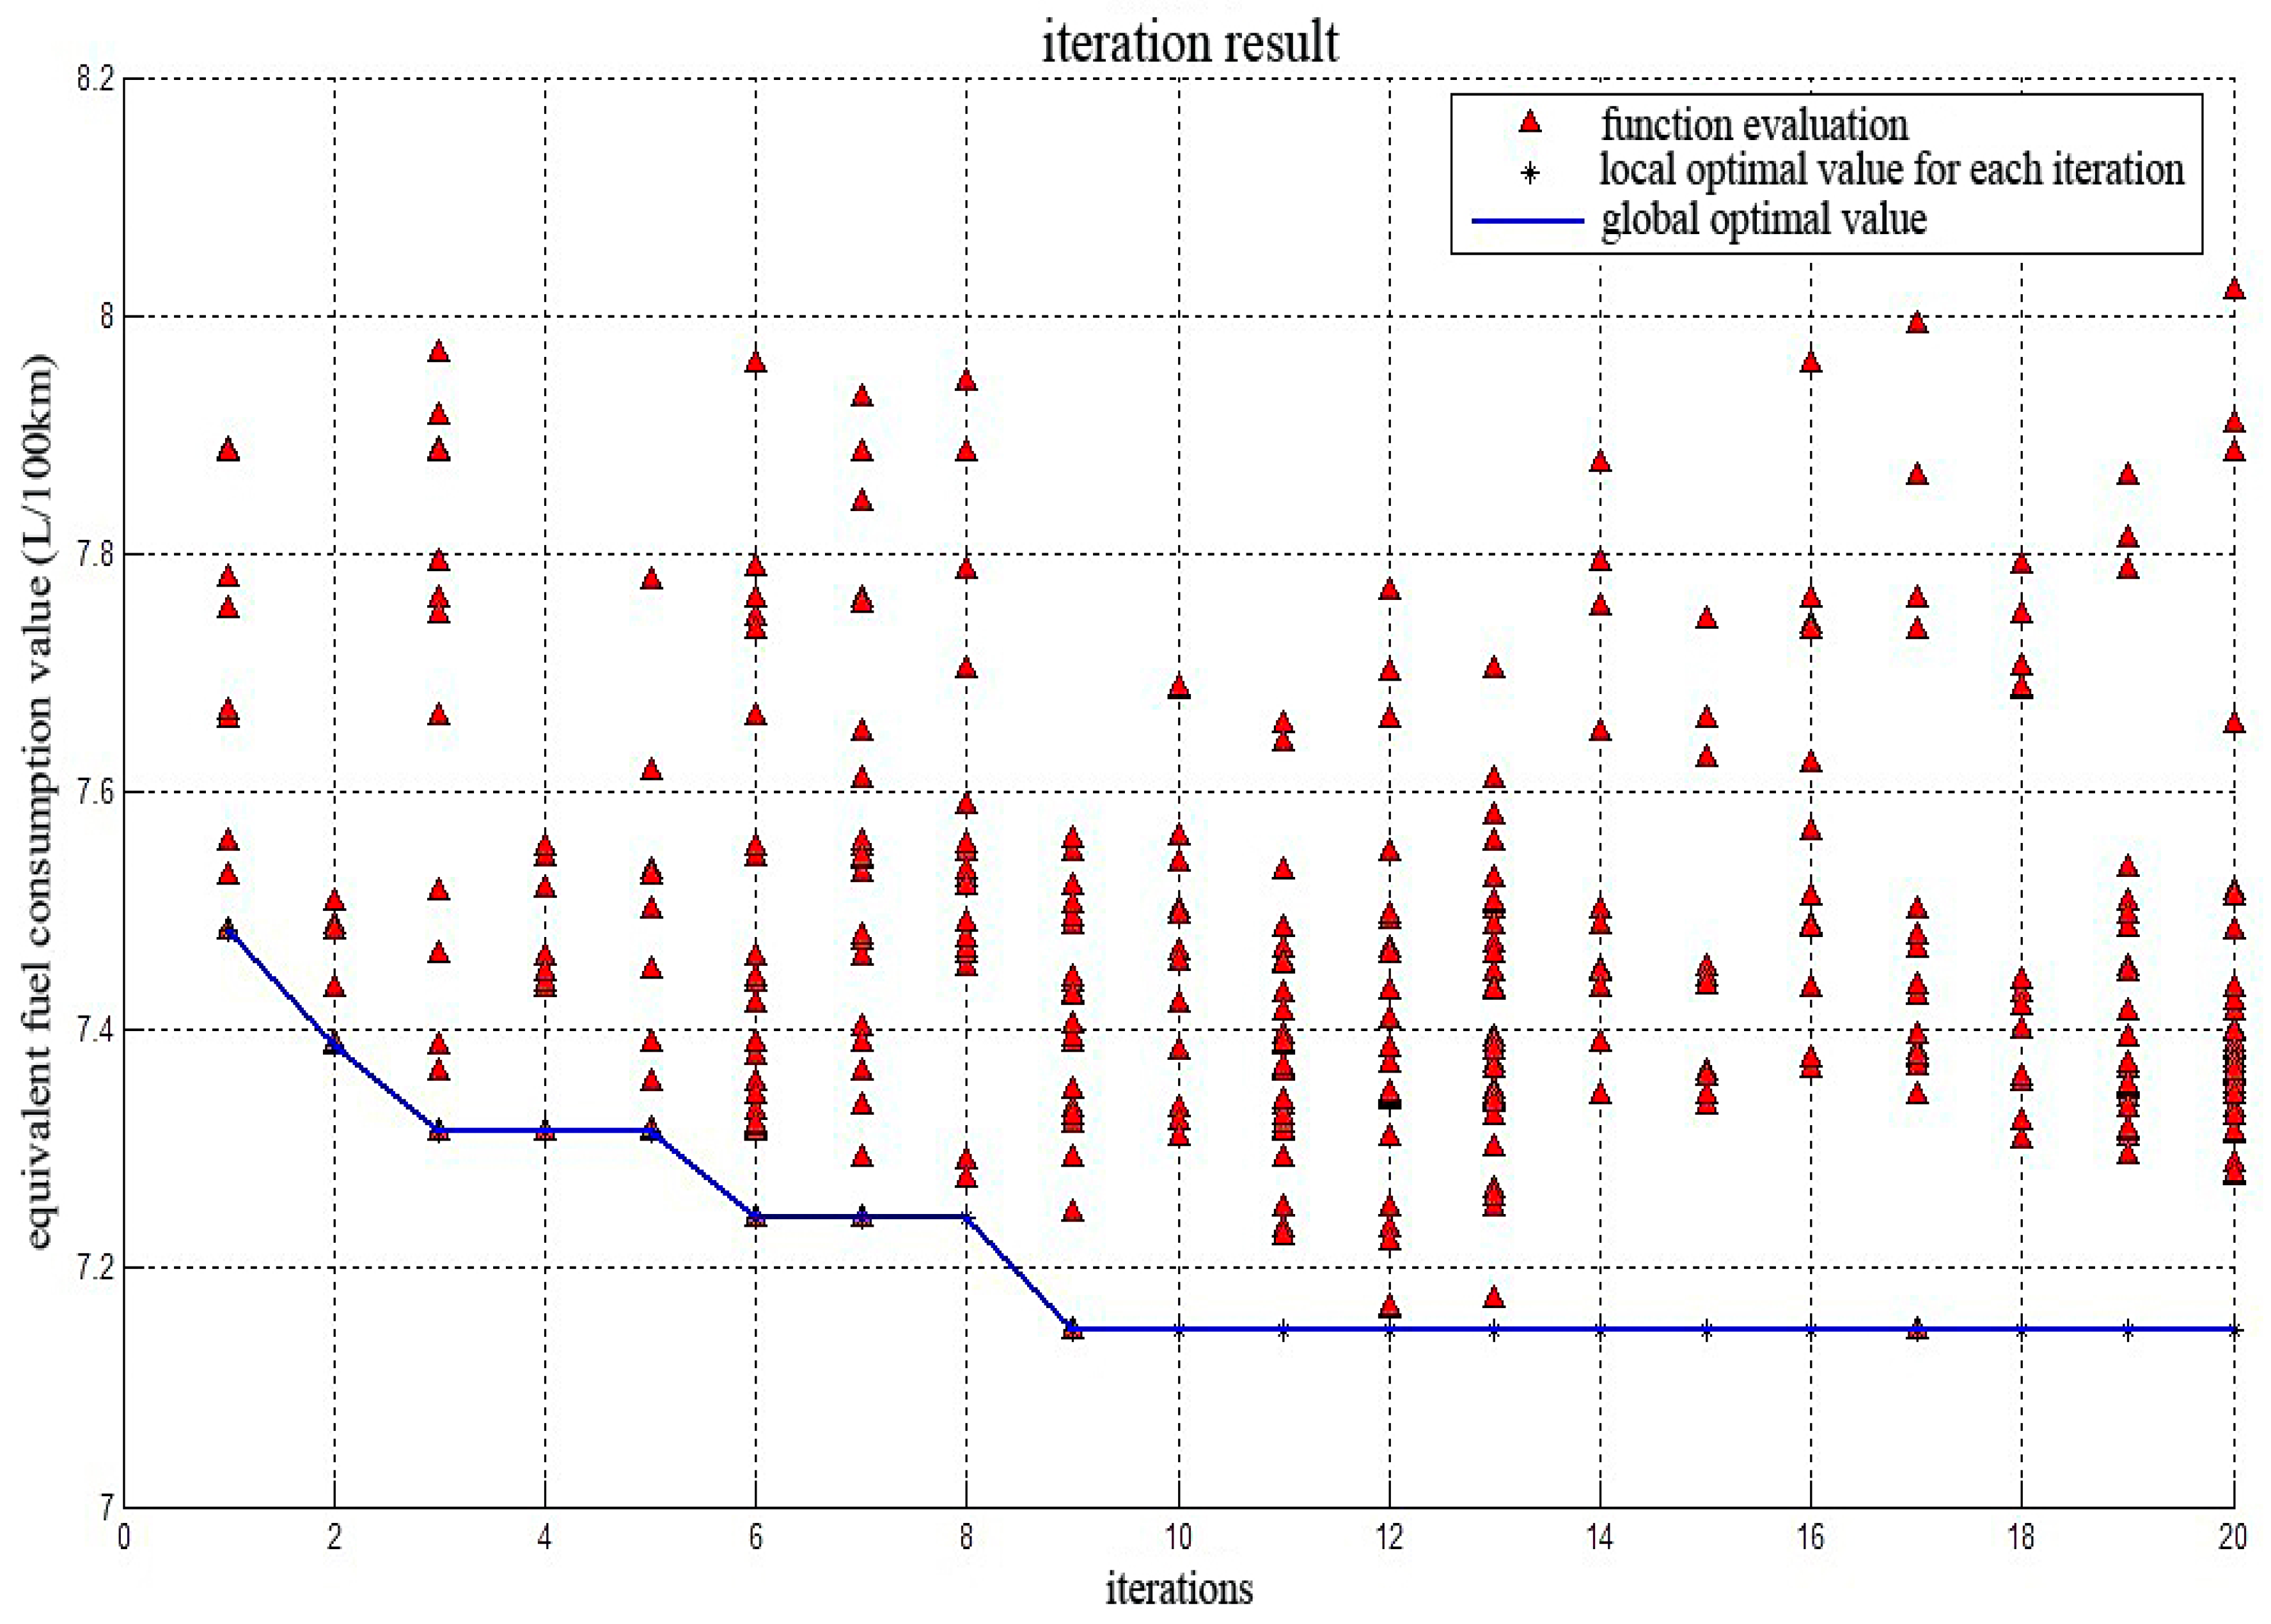
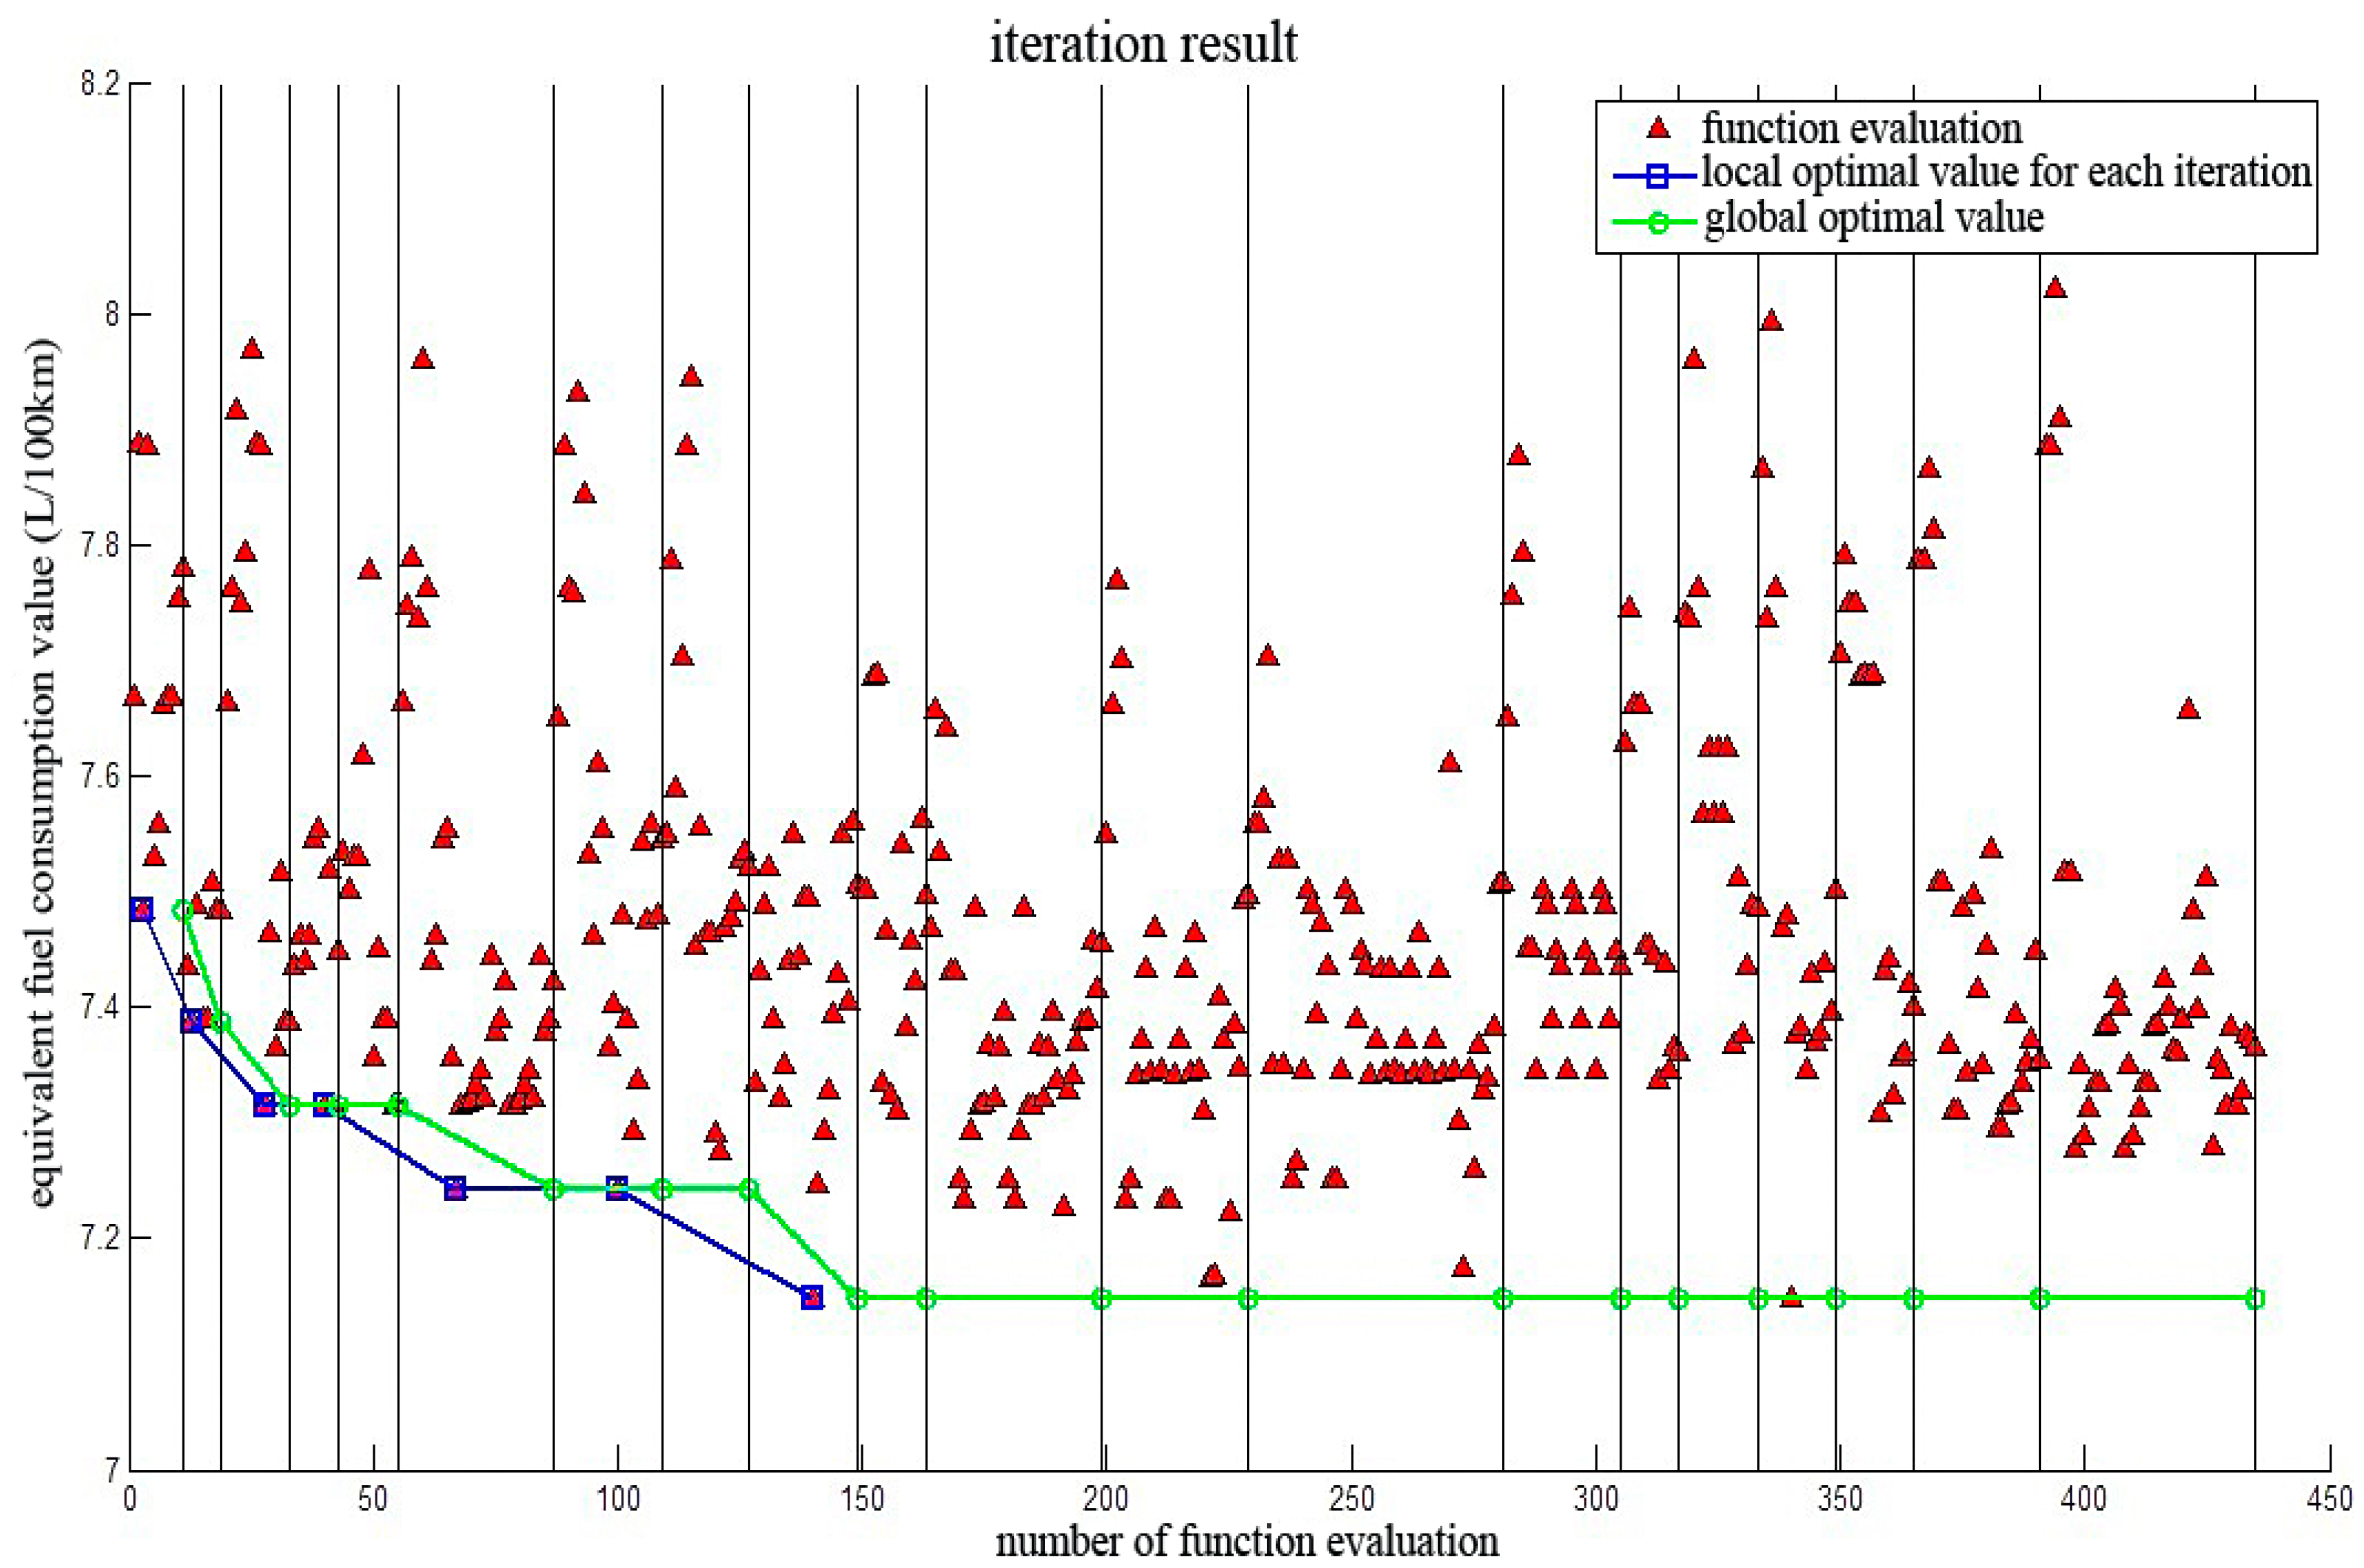
In this paper, the logic threshold parameters of the all-wheel-drive HEV energy management strategy are comprehensively analyzed, and the seven energy efficiency influencing parameters to be optimized are extracted. Then, the minimized equivalent fuel consumption per 100 km is set as the target, and the DIRECT algorithm is implemented to optimize the proposed parameters globally. Finally, the effectiveness of the algorithm to solve the problem is analyzed by simulation.

2. HEV Powertrain Model

The research object in this study is an all-wheel-drive full HEV, and its powertrain structure is shown in Figure 1 [25]. Its front axle adopts the driving structure including the engine, integrated starter and generator (ISG) motor, and automated mechanical transmission (AMT) gearbox. Its rear axle is driven by two in-wheel motors. The ISG motor shares the same axle with the engine; therefore, it can function as a cranking motor to start the engine quickly. Besides, the output torque of the in-wheel motor can be directly transmitted to the wheel and is capable of driving the vehicle alone at low speed. At the same time, the ISG and in-wheel motors can be used both as driving motors for the vehicle and function as generators to regenerate the excess kinetic energy.
Figure 1 shows that the key parts of the HEV powertrain include the engine, ISG motor, AMT gearbox, in-wheel motor, and power battery. The main technical parameters of these components are shown in Table 2, Table 3, Table 4, Table 5, Table 6 and Table 7. In consideration of the complexity for acquiring the model parameters and control accuracy, the static model with dynamic correction for main power components is adopted.

2.1. Engine Model

Since the engine output torque in steady-state condition is a function of its speed and throttle opening, the numerical model of the engine can be established by polynomial fitting based on the engine test data. Considering that the throttle opening changes quickly under the condition of starting or speed-changing, a dynamic process is needed for the engine to be steady. For this reason, a first-order inertia link is used to amend the engine torque representing its dynamic property [26].
T e = 1 τ e s + 1 f ( ω e , α ) ,
where T e is the engine output torque; ω e is the engine speed; α is the throttle opening; τ e is the time constant of the engine torque response; f is a function of the engine torque characteristic.
The data regarding the external characteristic, fuel consumption, and emissions are acquired from the existing engine test. Then, the working characteristic of the engine is obtained by a lookup table or fitting. The current maximum torque and fuel consumption rate of the engine can be acquired by a lookup table according to the current engine speed and torque in the Simulink model. Figure 2 shows the engine fuel consumption rate curve and external characteristic curve used in the model.

2.2. Motor Model

Both the ISG and in-wheel motors are permanent magnet synchronous motors. The motor model is established according to the data of motor efficiency. The dynamic correction is done via a first-order inertia link [26].
T m = { 1 τ m s + 1 min ( T m r , T d i s max ( ω e ) ) T m r > 0 1 τ m s + 1 max ( T m r , T c h max ( ω e ) ) T m r < 0 ,
where T m is the output torque of the motor; T m r is the required torque of the motor; τ m is the time constant of the motor; T d i s max ( ω e ) is the maximum output torque of the motor at the speed ω e when discharging; T c h max ( ω e ) is the minimum output torque of the motor at the speed ω e when charging.
The motor power can be calculated based on the following equation:
P m = I m U m = { T m ω e 9550 η m , T m 0 T m ω e η m 9550 , T m < 0 ,
where I m is the motor current; U m is the bus voltage; η m refers to the motor efficiency; P m is the motor power.
The working efficiency and external characteristic curves of the ISG and in-wheel motors, which are shown below in Figure 3 and Figure 4, respectively, are obtained from the experiment.

2.3. Powertrain Model

The powertrain components in this research include the clutch, AMT gearbox, and main reducer. The powertrain model diagram is shown in Figure 5. The combination and separation of the clutch is determined by the transmission control unit. The vehicle management system controls the clutch state only in the starting process. The transmission and reducer output the powertrain speed and torque according to the throttle percentage, current gear, state of clutch, output torque of clutch, and vehicle velocity.
Considering the practical needs of the control strategy when modeling, we simplify the clutch model using 0 and 1 to represent the complete separation and combination of the clutch. The function of the AMT gearbox and main reducer is to slow down the speed and increase the torque. In particular, when the AMT gearbox is running, the gear changes with shifting control strategy, which directly influences the dynamic performance, fuel economy, and comfort in the vehicle. Therefore, it is necessary to introduce a gear shifting control strategy in the model. Figure 6 shows the gear shift curve calculation module and gear shift control module in the Simulink/Stateflow. The gear ratio is determined by the engine throttle position and vehicle velocity, which can be attained by the lookup table based on the current gear.

2.4. Battery Model

The battery functions as an auxiliary power supply for HEVs to provide energy for the motor as well as recycle the excess kinetic energy when braking. The recovery of braking energy is important for improving the vehicle efficiency and saving energy. Although the chemical reaction inside the battery is relatively complex, only the external characteristic of the battery is used in the model. The commonly used battery models include the equivalent circuit model and neural network model. The equivalent circuit model can accurately reflect the battery characteristics using the circuit components such as resistors, capacitors, and voltage to simulate the dynamic performance of the battery. The equivalent circuit models mainly used are the Rint, Thevenin, and PNGV models [27]. The Rint model, which is shown in Figure 7, is selected in this study [28].
In the diagram, R d i s and R c h g are the internal resistance of the battery when charging and discharging, and V o c is the open circuit voltage of the battery. R d i s , R c h g , and V o c are functions of the battery state of charge (SOC) and temperature T. When the battery power demand is known, the terminal voltage of the battery, V o , and current, I o , can be calculated based on the mathematical models described below.
P c m d = V o I o ,
V o = V o c R int I o ,
By combining Equations (4) and (5), Equation (6) can be obtained.
I o = V o c 2 R int ( V o c 2 R int ) 2 P c m d R int ,
Here, R int is the internal resistance of the battery when charging or discharging; and P c m d is the battery demand power when charging or discharging.
The current battery SOC value can be calculated by the ampere hour algorithm [26] method with the specific formula shown as follows:
S O C ( t ) = S O C s t a r t 0 t I o d t Q max ,
where S O C s t a r t is the initial battery SOC value, and Q max is the maximum battery capacity.
The working state and related parameters of the battery are related to the temperature, so the change of the internal battery temperature should be considered. The specific calculation formula is presented as follows:
m c p d T ( t ) d t = R int I o 2 ( t ) h c A [ T ( t ) T a ] ,
where A is the total heat dissipation area of the battery, c p is the specific heat capacity of the battery, h c is the heat transfer coefficient of the battery cooling system, and T a refers to the ambient temperature.
Based on the above equations, the battery model is established in Simulink. The input and output signals, as well as the calculation module of battery model, are shown in Figure 8. The battery model mainly includes the current, internal resistance, terminal voltage, output power, SOC, and temperature calculation modules. The main characteristic parameters of the battery are shown in Table 8.

2.5. Longitudinal Dynamics Model of Vehicle

This research focuses on the fuel economy of the HEV, thus only the longitudinal dynamics is considered in the vehicle model, regardless of the vertical vibration and handling stability. According to the vehicle kinematics equation [29], we have:
F t = m g f cos α + C D A 21.15 u 2 + m g sin α + δ m u ,
where F t is the driving force, m is the total mass of the vehicle, f is the rolling resistance coefficient, α is the slope angle, A is the vehicle frontal area, C D is the air drag coefficient, u is the vehicle speed, and δ refers to the correction coefficient of rotating mass.

2.6. Driver Model

The function of the driver model is to simulate the real driver’s controllability. And the driver model diagram is shown in Figure 9. The driver controls the accelerator or the braking pedal opening based on the difference between the real velocity and driving cycle velocity. The proportional–integral (PI) controller is selected for the driver model [30].
The driver model can be described as follows:
α = k p ( v t a r g e t v ) + k i ( v t a r g e t v ) d t ,
where α is the pedal opening, with positive and negative values representing the accelerator pedal opening and brake pedal opening, respectively; v t a r g e t is the target velocity; v is the current actual speed; k p and k i refer to the proportional and integral coefficients of the PI controller, respectively.

3. Parameters to Be Optimized for HEV Logic Threshold Energy Management Strategy

3.1. Hybrid Electric Vehicle Energy Management Strategy

The all-wheel drive full-HEV has two power sources—the engine and power battery. According to the steady-state efficiency map diagram, the working efficiency differs at different working sections. Based on the power battery charging and discharging resistance characteristics, its internal resistance under various charged states is different, thus the working efficiency is also different. The energy management strategy based on the logic threshold aims to make the engine operate in the high efficiency range and keep the battery SOC within a specific range [1]. The working area of the engine is shown in Figure 10. The engine is set to work within the area between the upper limit and lower limit. The working area of motor is presented in Figure 11. The motor works when the battery SOC is between 0.3 and 0.8. When the SOC is high, the motor provides driving torque. On the contrary, the motor works as a generator. The parsing of the driver’s intention and torque distribution are the main focus of the energy management strategy.

3.1.1. Parsing of Driver’s Intention

In the process of driving, the driver shows his or her acceleration or deceleration demand by manipulating the accelerator pedal or braking pedal. Therefore, to parse the driver’s demand, it is necessary to transfer the pedal signal into vehicle demand torques, which can be divided into driving demand torque and braking demand torque. In order to identify the demand torque, the pedal signal is normalized, and is expressed as α , within (−1, 1). The positive value represents the accelerator pedal opening while the negative value is for the braking pedal opening. In order to maintain the driver’s reaction when operating the pedal and obtain the same dynamic properties as the prototype, we consider the engine external characteristic curve as the driver’s maximum demand torque curve for HEVs.
Therefore, when the driver controls the accelerator pedal, the demand driving torque can be represented as
T c m d = α T e max ,
where T c m d is the demand driving torque, α is the accelerator pedal opening, and T e max is the engine maximum torque.
When the driver controls the braking pedal, the demand braking torque can be represented as
T c m d = α ( T M a x G e n + T M a x M e c h B r a k e ) ,
where T c m d is the demand braking torque, α is the braking pedal opening, T M a x G e n is the maximum regenerative braking torque, and T M a x M e c h B r a k e refers to the highest mechanical braking torque.
For the all-wheel drive full-HEV, the energy management strategy distributes the driver’s demand braking torque to the engine, ISG motor, in-wheel motor, and mechanical braking system.
The demand driving torque is as follows:
T c m d = T e + T I S G + T h u b m o t o r / i o i g ,
The demand braking torque is presented as follows:
T c m d = T I S G G e n i o i g + T h u b m o t o r G e n + T M e c h B r a k e ,
where T e , T I S G , and T h u b m o t o r are the driving torques provided by the engine, ISG motor, and in-wheel motor, respectively; T I S G G e n , T h u b m o t o r G e n , and T M e c h B r a k e refer to the braking torques provided by ISG motor, in-wheel motor, and mechanical braking system, respectively; i o and i g are the gear ratios of the main reducer and AMT gearbox, respectively.

3.1.2. Torque Distribution Strategy for Different Driving Modes

When the vehicle is running, the engine working points can be controlled to stay in the high efficiency area, and the battery can be controlled to work in the range within the low internal resistance by adjusting the output torques of the ISG and in-wheel motors. Many driving modes can be obtained by various combinations of the engine, ISG motor, and in-wheel motor.
(1) Pure electric driving mode
When starting, if the vehicle is at low load condition and the battery capacity is sufficient, the vehicle is driven only by the in-wheel motor, in order to avoid the engine from working in the low efficiency area. When the maximum speed of pure electric driving is exceeded, the vehicle switches into pure engine driving mode.
(2) Pure engine driving mode
When the vehicle works at medium load condition, the demand torque is provided by the engine only if it can work in the area of high efficiency. If the demand torque is greater than the maximum torque at the high efficiency area or the battery needs charging, the ISG motor or in-wheel motor starts to work, and the vehicle switches into hybrid driving mode.
(3) Hybrid driving mode
When the vehicle is at high load conditions such as climbing or accelerating, and the engine output maximum torque cannot meet the demand torque, the ISG and in-wheel motors provide power, if the battery capacity is sufficient. Then, the vehicle switches into hybrid driving mode. The hybrid driving mode can be subdivided into engine driving + ISG motor charging mode, engine driving + in-wheel motor driving mode, and engine driving + ISG motor driving + in-wheel motor driving mode.
The judgment condition and control logic for the different driving modes mentioned above can be displayed in Figure 12.
In the diagram, T c m d is the driver demand torque; A s s i s t I S G M o t o r is the power-assisting mark of ISG motor; A s s i s t A l l M o t o r is the power-assisting mark of all motors; v is the vehicle velocity; v M a x E l e c is the maximum speed of pure electric driving; S O C l o w and S O C h i g h refer to the lower and upper limit of the battery working S O C , respectively; E n g l o w and E n g h i g h refer to the lower and upper limit of the engine working area, respectively.

3.1.3. Torque Distribution Strategy in Braking Mode

For HEVs, there are two sets of braking system: the conventional mechanical braking system, and motor regenerative braking system. When braking, the mechanical braking system should coordinate with the motors to provide the demanded braking torque for braking safety, recover the excess kinetic energy, and improve the vehicle efficiency as well. The braking control strategy, which is shown in Figure 13, is formulated based on the battery SOC and the braking pedal opening.

3.2. Key Parameters of HEV Logic Threshold Energy Management Strategy

According to the optimal working area division of the engine and motor, the driver’s intention parsing, and the torque distribution strategy in different working modes, the energy management strategy based on a logic threshold is established in the MATLAB/Simulink. After studying the energy control strategy, the influencing parameters, which are presented in Table 9, can be obtained. These parameters, which have a direct effect on the vehicle performance especially the fuel economy, are the focus of the control strategy.

4. Validation and Analysis of the Simulation Model of HEV and Energy Management Strategy

In order to verify the accuracy of the HEV simulation model and validity of the energy management strategy, a comparative analysis between the output data of the components from offline simulation and the real drum bench experiment was performed. It was ensured that the parameters of the offline simulation model were consistent with those of the real vehicle. In addition, the control strategy and parameters threshold were the same for both the simulation and real vehicle. The tests are carried out in the new European driving cycle (NEDC). The comparison between the offline simulation and drum test results during the driving cycle of NEDC are shown in Figure 14 and Figure 15. As observed, there is a small difference between the output results of components from the simulation and bench test. The transient characteristic has not been accurately reflected in modeling, which contributed to the difference. However, the difference is within the acceptable range.
This study focused on the HEV fuel economy. Table 10 shows the equivalent fuel consumption per 100 km and SOC values of the offline simulation and drum bench test. Comparing the values of the simulation and bench test, the error of the equivalent fuel consumption is 4.5%, which is within the generally allowed range of 5%. It is necessary to verify the accuracy of the vehicle simulation model and the effectiveness of the energy management strategy, which can provide assurance of the key parameters optimization for the HEV energy management strategy based on offline simulation.

5. Optimization of HEV Control Parameters Using DIRECT Algorithm Based on Fuel Economy

5.1. Implementation of DIRECT Algorithm

The DIRECT algorithm is a deterministic global optimization algorithm proposed by Jones et al. in 1993 [19]. It is especially suitable for optimizing a multivariable function with specific variables and space [31]. Take the optimization problem with three-dimensional space as an example; it supposes that c is the center point of the hypercube and calculates the value of a function f(x) at point c ± δ e i with δ equal to 1/3 of the hypercube length; e i is a unit vector. The parameter, w i is defined as follows:
w i = min ( f ( c + δ e i ) , f ( c δ e i ) ) ,
It splits the hypercube in the order of w i . First, it cuts the hypercube in the direction perpendicular to the minimum value of w i . Second, it cuts the hypercube in the direction perpendicular to weak minimal value of w i . Then, it repeats the above steps until the hypercube is cut in all directions. Figure 16 shows an example of the hypercube division.
It is supposed that ω 1 = min ( 5 , 8 ) = 5 , and ω 2 = min ( 6 , 2 ) = 2 . First, the hypercube is cut in the direction perpendicular to x 2 . Then, the hypercube is cut in the direction perpendicular to x 1 . The method of cutting the longest side of the hypercube can ensure decreasing the length of the longest side. In DIRECT algorithm, the side length of the hypercube is at most two values after each division. The hypercube, with a function value at the center point equal to 2 in Figure 16, is the potential optimal hyper-rectangle after two divisions.
Based on the above result, Figure 17 can be obtained by setting the function value at the center point as y-axis, and the distance between the center point and vertex as x-axis. In the figure, (1)–(3) are the potential optimal hyper-rectangle from the first to third iteration, respectively. In the first iteration, there is only one list of selectable points. The hypercube, with a function value at the center point equal to 2, is the potential optimal hyper-rectangle. We need to divide the cube further. Similarly, in the second iteration, we can get two hyper-cubes with the smallest value, to be divided in the third iteration. The process continues until it satisfies the stopping condition.
For multidimensional space optimization problems, the DIRECT algorithm takes similar steps to select the best potential optimal hyper-rectangle.

5.2. Optimization of Key Parameters for Logic Threshold Energy Management Strategy Using DIRECT Algorithm Based on Fuel Economy

Based on the discussions in the third section, the key parameters of the logic threshold energy management strategy for the HEV are presented in Table 3. In this research, the purpose of the energy management strategy is to achieve the best fuel economy for a given driving cycle. Therefore, the target function is
F C = min f ( x ) ,
where f ( x ) is the equivalent fuel consumption per 100 km, which includes the engine fuel consumption and equivalent fuel consumption of the electric energy from the power battery. The unit is L / 100 km . The calculation for f ( x ) is shown as below.
f ( x ) = 100 k 1 U I d t q ρ v d t + 100 k 2 f r ( T e , ω e ) T e ω e 9550 d t ρ v d t n e ,
where ρ is the gasoline density in g / L ; f r ( T e , ω e ) is the current engine fuel consumption rate, which is a lookup function of the engine torque and speed, with the unit g / kWh ; T e and ω e are the current engine torque and speed, with the units N m and rpm , respectively; k 1 and k 2 are the gasoline–electric conversion constant coefficients; U and I are the present battery voltage and current, with the units V and A , respectively; q refers to the gasoline calorific value in J / kg ; v is the current speed in km / h .
The engine torque and speed, battery voltage and current, and average speed are related to the seven parameters to be optimized as shown in Table 3.
Therefore, the optimization of key parameters for the HEV energy management strategy is converted to the optimization of seven dimensional parameters. The DIRECT algorithm is selected to solve this problem. The process is shown in Figure 18. First, we normalized n-dimensional space into n-dimensional unit hyper-cube and calculate the equivalent fuel consumption per 100 km at the center point as the initial minimum fuel consumption. The hyper-cube is the potential optimal hyper-rectangle when iteration starts. Then, we choose a potential optimal hyper-rectangle and divide it. Afterwards, we calculate the equivalent fuel consumption per 100 km at the center point of each rectangle. After that, we compare it with the minimal value collected in the last iteration. If this value is smaller than the previous minimum fuel consumption, we update and store the minimum fuel consumption. In addition, we update the potential optimal hyper-rectangle. The optimization of DIRECT algorithm will stop until the defined maximum number of iterations or the potential optimal hyper-rectangle is empty.

5.3. Optimization Result and Analysis

Figure 19 shows the optimization model for the HEV energy management key parameters, which includes the previously established HEV closed-loop simulation model, target to minimize the fuel consumption per 100 km, and code of the DIRECT algorithm. The optimization model is established in MATLAB/Simulink. Besides, the constraint of vehicle’s dynamic performance should also be taken into account. The 0 to 60 time for the all-wheel drive full-HEV studied should not be more than 10 s. The driving cycle of NEDC is selected, and the initial SOC is set to 55%. The key parameters of the DIRECT algorithm are set as shown in Table 11.
x 1 , x 2 , x 3 , x 4 , x 5 , x 6 , x 7 are the parameters that need to be optimized. The meaning of these parameters are described in Table 3. The initial value, range, and optimized value of these parameters are shown in Table 12.
Changes to the parameters to be optimized have a big impact on the fuel economy. In the optimization process of DIRECT algorithm, the equivalent fuel consumption per 100 km for different iteration function evaluations is shown in Figure 20 and Figure 21, respectively.
As can be observed from the beginning, the equivalent fuel consumption per 100 km decreases rapidly with the increase of iterations and function evaluations in the driving cycle of NEDC. Then, it stabilizes after 9 iterations or 150 function evaluations. This stabilized value is the minimum equivalent fuel consumption per 100 km. The corresponding parameters are the globally optimized results using the DIRECT algorithm, which meet the minimum equivalent fuel consumption. It shows that the proposed optimization method using the DIRECT algorithm has good convergence and effectiveness to optimize the key parameters of energy management strategy from the perspective of fuel economy.
The simulation of the all-wheel-drive HEV is implemented in the driving cycle of NEDC, utilizing the optimized logic threshold control strategy parameters. The simulation results are shown in Figure 22. As can be seen, frequently gear change is avoided. And in the driving condition, the in-wheel motors output more torques than engine and ISG motor. During the braking cycle, both in-wheel motors and ISG motor work as generators to charge the battery. And the battery SOC changes from the initial value 0.55 to the terminal value 0.7. The instantaneous fuel consumption is controlled within low range in most of the time.
In the driving cycle of NEDC, the equivalent fuel consumption per 100 km decreases from 7.691 L/100 km using the initial parameters to 7.148 L/100 km utilizing the optimized parameters. Therefore, the equivalent fuel consumption using the optimized results decreases by 7.06% compared to the previous fuel consumption. Figure 23 shows the engine operating points before and after optimization.
As shown in Figure 23, the engine operating points scattering in the area with low torque (0–60 N·m) and high fuel consumption have decreased. Furthermore, the engine operating points scattering in the zone with low speed (1000–1500 rpm) and high fuel consumption have also decreased. Hence, the energy management strategy using the optimized parameters makes the engine operate more in the area with high torque and low fuel consumption.
By comparing the equivalent fuel consumption per 100 km and the distribution of engine operating points before and after optimization, it can be concluded that the DIRECT algorithm can be applied to optimize the key parameters of the energy management strategy for the HEV with a positive effect. The optimized results obtained by the offline simulation can provide a reference for debugging the real vehicle.

6. Conclusions

(1)
In this study, the closed-loop simulation model of the all-wheel–drive HEV powertrain is built in Matlab/Simulink with the power component model established based on the experimental test. The logic threshold energy management strategy is comprehensively analyzed and formulated. On this basis, the seven key parameters that influence the fuel economy of the HEV, which need to be optimized, are extracted. The accuracy of the simulation model and validity of the proposed logic threshold energy management strategy are verified by comparing the simulation test and real drum bench experiment.
(2)
The optimization model of the key parameters based on the fuel economy is proposed. The implementation of the DIRECT algorithm is analyzed. Then, it is applied to solve this nonlinear multiparameter optimization problem with the objective of minimizing the equivalent fuel consumption.
(3)
The optimization result shows that the logic threshold energy management strategy using the optimized parameters reduces the equivalent fuel consumption per 100 km by 7% and makes engine operate more in the high efficiency area. The simulation result validates the effectiveness of the DIRECT algorithm in solving the multiparameter energy consumption optimization problem. It will play a guiding role in calibrating the control strategy parameters for a real vehicle. Next, we will verify the optimization method of the key parameters for the HEV energy management strategy based on logical threshold by testing a real vehicle.

Acknowledgments

This work was financially supported by China Automobile Industry Innovation and Development joint fund (Project No. U1564208), National Natural Science Foundation of China (Project No. 51275355) and National Key Scientific Instrument and Equipment Development Project (No. 2012YQ15025603).

Author Contributions

Peihong Shen and Xiaowen Zhan built the simulation model of HEV. Jingxian Hao and Zhuoping Yu formulated the rule-based logic threshold control strategy and analyzed its key parameters. Zhiguo Zhao established the optimization model of key parameters using DIRECT algorithm. All authors carried out data analysis. Jingxian Hao wrote the paper.

Conflicts of Interest

The authors declare no conflict of interest.

References

  1. Peng, J.; Fan, H.; He, H.; Pan, D. A Rule-Based Energy Management Strategy for a Plug-in Hybrid School Bus Based on a Controller Area Network Bus. Energies 2015, 8, 5122–5142. [Google Scholar] [CrossRef]
  2. Wirasingha, S.; Emadi, A. Classification and Review of Control Strategies for Plug-in Hybrid Electric Vehicles. IEEE Trans. Veh. Technol. 2011, 60, 907–914. [Google Scholar] [CrossRef]
  3. Panday, A.; Bansal, H.O. Energy Management Strategy for Hybrid Electric Vehicles Using Genetic Algorithm. J. Renew. Sustain. Energy 2016, 8, 741–746. [Google Scholar] [CrossRef]
  4. Jun, W.; Wang, Q.; Wang, P.; Han, B. The Optimization of Control Parameters for Hybrid Electric Vehicles Based on Genetic Algorithm. In Proceedings of the SAE World Congress, Detroit, MI, USA, 8–10 April 2014.
  5. Varesi, K.; Radan, A. A Novel GA Based Technique for Optimizing Both the Design and Control Parameters in Parallel Passenger Hybrid Cars. Int. Rev. Electr. Eng. 2011, 63, 1279–1286. [Google Scholar]
  6. Montazeri-Gh, M.; Poursamad, A.; Ghalichi, B. Application of Genetic Algorithm for Optimization of Control Strategy in Parallel Hybrid Electric Vehicles. J. Frankl. Inst. 2006, 343, 420–435. [Google Scholar] [CrossRef]
  7. Fang, L.; Qin, S.; Xu, G.; Li, T.; Zhu, K. Simultaneous Optimization for Hybrid Electric Vehicle Parameters Based on Multi-Objective Genetic Algorithms. Energies 2011, 4, 532–544. [Google Scholar] [CrossRef]
  8. Huang, B.; Wang, Z.C.; Xu, Y.S. Multi-Objective Genetic Algorithm for Hybrid Electric Vehicle Parameter Optimization. In Proceedings of the IEEE/RSJ International Conference on Intelligent Robots & Systems, Beijing, China, 9–15 October 2006.
  9. Li, Y.; Lu, X.; Kar, N. Rule-Based Control Strategy with Novel Parameters Optimization Using NSGA-II for Power-Split PHEV Operation Cost Minimization. IEEE Trans. Veh. Technol. 2014, 63, 3051–3061. [Google Scholar] [CrossRef]
  10. Li, L.; Zhang, Y.H.; Chao, Y.G.; Jiao, X.H.; Zhang, L.P.; Song, J. Hybrid Genetic Algorithm-based Optimization of Powertrain and Control Parameters of Plug-in Hybrid Electric Bus. J. Frankl. Inst. 2014, 352, 776–801. [Google Scholar] [CrossRef]
  11. Chen, Z.; Xiong, R.; Wang, K.; Jiao, B. Optimal Energy Management Strategy of a Plug-in Hybrid Electric Vehicle Based on a Particle Swarm Optimization Algorithm. Energies 2015, 8, 3661–3678. [Google Scholar] [CrossRef]
  12. Xiong, R.; He, H.W.; Sun, F.C. Methodology for Optimal Sizing of Hybrid Power System Using Particle Swarm Optimization and Dynamic Programming. Energy Procedia 2015, 75, 1895–1900. [Google Scholar] [CrossRef]
  13. Wu, J.; Zhang, C.H.; Cui, N.X. PSO Algorithm-based Parameter Optimization for HEV Powertrain and Its Control Strategy. Int. J. Automot. Technol. 2008, 91, 53–59. [Google Scholar] [CrossRef]
  14. Deng, Y.W.; Chen, K.L. Simulated Annealing Particle Swarm Algorithm Based Parameters Optimization for Hybrid Electric Vehicles. Aut. Eng. 2012, 34, 580–584. [Google Scholar]
  15. Wang, Q.; Frank, A.A. Plug-in HEV with CVT: Configuration, Control, and Its Concurrent Multi-objective Optimization by Evolutionary Algorithm. Int. J. Automot. Technol. 2014, 15, 103–115. [Google Scholar] [CrossRef]
  16. Zhang, L.P.; Lin, C.; Niu, X. Optimization of Control Strategy for Plug-in Hybrid Electric Vehicle Based on Differential Evolution Algorithm. In Proceedings of the Asia-Pacific Power and Energy Engineering Conference, Wuhan, China, 28–31 May 2009.
  17. Long, V.T.; Nhan, N.V. Bees-algorithm-based Optimization of Component Size and Control Strategy Parameters for Parallel Hybrid Electric Vehicles. Int. J. Automot. Technol. 2012, 13, 1177–1183. [Google Scholar] [CrossRef]
  18. Chris, M.; Abul, M.; David, G. Hybrid Electric Vehicles: Principles and Applications with Practical Perspectives; John Wiley & Sons: Hoboken, NJ, USA, 2011. [Google Scholar]
  19. Jones, D.R.; Perttunen, C.D.; Stuckman, B.E. Lipschitz Optimization without Lipschitz Constant. J. Optim. Theory Appl. 1993, 79, 157–181. [Google Scholar] [CrossRef]
  20. Finkel, D.E.; Kelley, C.T. Convergence Analysis of the DIRECT Algorithm; North Carolina State University Center for Research in Scientific Computation Technology: Raleigh, NC, USA, 2010. [Google Scholar]
  21. Gu, L.A. Comparison of Polynomial Based Regression Models in Vehicle Safety Analysis. In Proceedings of the 2001 ASME Design Engineering Technical Conferences, Pittsburgh, PA, USA, 9–12 September 2001.
  22. Rousseau, A.; Pagerit, S.; Gao, D. Plug-in Hybrid Electric Vehicle Control Strategy Parameter Optimization. JAEV 2007, 6, 1125–1133. [Google Scholar] [CrossRef]
  23. He, H.W.; Huang, X.G.; Zhang, Y.M.; Zhang, X.W. DIRECT Algorithm Based Parameters Optimization Research for Hybrid Electric Vehicles. Aut. Eng. 2011, 1, 35–41. [Google Scholar]
  24. Panday, A.; Bansal, H.O. Fuel Efficiency Optimization of Input-split Hybrid Electric Vehicle Using DIRECT Algorithm. In Proceedings of the IEEE International Conference on Industrial and Information System, Gwalior, India, 15–17 December 2014.
  25. Zhao, Z.G.; Chen, H.J.; Yang, J.; Wu, X.W.; Yu, Z.P. Estimation of the Vehicle Speed in the Driving Mode for a Hybrid Electric Car Based on an Unscented Kalman Filter. Proc. Inst. Mech. Eng. Part D J. Automob. Eng. 2014, 229, 437–456. [Google Scholar] [CrossRef]
  26. Zhao, Z.G.; He, N.; Zhu, Y.; Yu, Z.P. Mode Transition Switch Control for Four-wheel Drive Hybrid Electric Vehicle. J. Mech. Eng. 2011, 47, 100–109. [Google Scholar]
  27. Chen, Q.S.; Lin, C.T. Review for Battery Performance Model Research of Electric Vehicles. Aut. Technol. 2005, 1, 1–5. [Google Scholar]
  28. Johnson, V.H. Battery Performance Models in ADVISOR. J. Power Sources 2002, 110, 321–329. [Google Scholar] [CrossRef]
  29. Yu, Z.S.; Xia, Q.S. Theories of Automotive; China Machine Press: Beijing, China, 2000. (In Chinese) [Google Scholar]
  30. Shen, P.H.; Sun, Z.C.; Zeng, Y.J.; Wang, X.J.; Dai, H.F. Study on Power Ratio Between the Front Motor and Rear Motor of Distributed Drive Electric Vehicle Based on Energy Efficiency Optimization. In Proceedings of the 2016 SAE World Congress and Exhibition, Detroit, MI, USA, 4–6 April 2016.
  31. Steven, E. Multifidelity Global Design Optimization including Parallelization Potential; University of Florid: Gainesville, FL, USA, 2002. [Google Scholar]
Figure 1. Powertrain structure of hybrid electric vehicle (HEV).
Energies 09 00997 g001
Figure 2. Engine fuel consumption rate curve and external characteristic curve.
Energies 09 00997 g002
Figure 3. Working efficiency curve and external characteristic curve of integrated starter generator (ISG) motor.
Energies 09 00997 g003
Figure 4. Working efficiency curve and external characteristic curve of in-wheel motor.
Energies 09 00997 g004
Figure 5. The powertrain model diagram.
Energies 09 00997 g005
Figure 6. Gear shift model of the automated mechanical transmission (AMT) gearbox.
Energies 09 00997 g006
Figure 7. Battery equivalent circuit of the Rint model.
Energies 09 00997 g007
Figure 8. The battery model diagram.
Energies 09 00997 g008
Figure 9. Driver model diagram.
Energies 09 00997 g009
Figure 10. Engine working area division.
Energies 09 00997 g010
Figure 11. Working area division for nickel-metal hydride battery pack.
Energies 09 00997 g011
Figure 12. Control logic flow for various driving modes.
Energies 09 00997 g012
Figure 13. Control logic flow diagram of braking mode.
Energies 09 00997 g013
Figure 14. Driving cycle tracking and engine speed comparison of offline simulation and drum bench test in NEDC.
Energies 09 00997 g014
Figure 15. Output torques of components from offline simulation and drum bench test in NEDC.
Energies 09 00997 g015aEnergies 09 00997 g015b
Figure 16. Division and selection of potential optimal hyper-rectangle in DIRECT algorithm.
Energies 09 00997 g016
Figure 17. The potential optimal hyper-rectangle of each iteration.
Energies 09 00997 g017
Figure 18. Optimization procedure of key parameters for HEV energy management using DIRECT algorithm.
Energies 09 00997 g018
Figure 19. Optimization model for the HEV energy management key parameters.
Energies 09 00997 g019
Figure 20. Equivalent fuel consumption of different iterations using DIRECT algorithm.
Energies 09 00997 g020
Figure 21. Equivalent fuel consumption per 100 km with different function evaluations using DIRECT algorithm.
Energies 09 00997 g021
Figure 22. Simulation results of all-wheel drive HEV model utilizing the optimized parameters.
Energies 09 00997 g022
Figure 23. Engine working points distribution before and after optimization.
Energies 09 00997 g023
Table 1. General comparison of different algorithms.
AlgorithmConvergenceComputation BurdenGlobal Optimization
Genetic algorithmgoodgeneralbad
Hybrid genetic algorithmgoodgeneralgeneral
Particle swarm optimizationgoodgoodbad
Simulated annealingbadgoodgeneral
Bees algorithmgoodbadgeneral
DIRECT algorithmgoodgeneralgood
Table 2. Vehicle parameters of four-wheel drive HEV.
Vehicle Curb MassTire RadiusFrontal AreaCorrection Coefficient of Rotating MassCoefficient of Air ResistanceCoefficient of Rolling Resistance
1650 kg0.308 m2.095 m21.050.2930.0137
Table 3. Engine parameters of four-wheel drive HEV.
Engine CapacityPeak TorquePeak PowerMaximum Rotational Speed
1.8 L250 N·m150 kW6500 rpm
Table 4. ISG motor parameters of four-wheel drive HEV.
Rated PowerPeak TorquePeak PowerMaximum Rotational Speed
10 kW72 N·m15 kW6500 rpm
Table 5. In-wheel motor parameters of four-wheel drive HEV.
Rated PowerPeak TorquePeak PowerMaximum Rotational Speed
6 kW200 N·m16 kW2000 rpm
Table 6. Gear ratio of AMT gearbox.
Gear1st2nd3rd4th5th6th
Gear Ratio of AMT gearbox3.6152.0421.2570.9090.9020.0137
Table 7. Transmission parameters of four-wheel drive HEV.
Gear Ratio of Main ReducerReverse Gear RatioTransmission Efficiency
3.8944.2930.92
Table 8. Main characteristic parameters of the battery.
Characteristic ParameterValueCharacteristic ParameterValue
Capacity8 AhTotal heat dissipation area1.6 m2
Voltage312 VSpecific heat capacity800 J/(kg·K)
Mass70 kgHeat transfer coefficient24 W/(m2·K)
Table 9. Key parameters of logic threshold energy management strategy.
NameDefinitionParameterSimplified Version
Maximum torque coefficient of the engine high-efficiency areaThe ratio of the maximum torque and engine peak torque for the engine high-efficiency area E n g h i g h x 1
Minimum torque coefficient of the engine high-efficiency areaThe ratio of the minimum torque and engine peak torque for the engine high-efficiency area E n g l o w x 2
Power battery SOC upper limitThe upper limit of the working SOC for power battery S O C h i g h x 3
Power battery SOC lower limitThe lower limit of the working SOC for power battery S O C l o w x 4
Throttle opening threshold for ISG motor assistingThe minimum throttle opening when the ISG motor assists A s s i s t I S G M o t o r x 5
Throttle opening threshold for all motors assistingThe minimum throttle opening when all motors assist A s s i s t A l l M o t o r x 6
Maximum speed in pure electric driving modeThe maximum speed in pure electric driving mode v M a x E l e c x 7
Table 10. Comparison of results from offline simulation and drum bench test.
ParameterOffline ResultDrum Bench Test ResultError
SOC0.7~0.520.7~0.56
Equivalent fuel consumption7.69 L/100 km7.36 L/100 km4.5%
Table 11. Key parameters of DIRECT algorithm.
Key ParametersValue
Maximum number of iterations20
Maximum number of function calculation1000
Maximum division time per side of hyper-rectangle 100
Global/local weighting coefficient0.0001
Relative error0.01%
Table 12. Optimized result of key parameters based on DIRECT algorithm.
ParametersInitial ValueLower LimitUpper LimitOptimized Value
x 1 0.40.20.60.3889
x 2 0.30.10.50.3556
x 3 70507053.333
x 4 40305047.963
x 5 20152522.222
x 6 50406050.667
x 7 15102018.333

