Article

Wind Turbines’ End-of-Life: Quantification and Characterisation of Future Waste Materials on a National Level

1
Energi Funktion Komfort Skandinavien AB, Smedjegatan 6, SE-131 54 Nacka, Sweden
2
Faculty of Engineering and Sustainable Development, Department of Building, Energy and Environmental Engineering, University of Gävle, Kungsbäcksvägen 47, SE-801 76 Gävle, Sweden
*
Author to whom correspondence should be addressed.
Energies 2016, 9(12), 999; https://doi.org/10.3390/en9120999
Submission received: 29 September 2016 / Revised: 14 November 2016 / Accepted: 15 November 2016 / Published: 26 November 2016
(This article belongs to the Special Issue Energy and Waste Management)

Abstract

:
Globally, wind power is growing fast and in Sweden alone more than 3000 turbines have been installed since the mid-1990s. Although the number of decommissioned turbines so far is few, the high installation rate suggests that a similarly high decommissioning rate can be expected at some point in the future. If the waste material from these turbines is not handled sustainably the whole concept of wind power as a clean energy alternative is challenged. This study presents a generally applicable method and quantification based on statistics of the waste amounts from wind turbines in Sweden. The expected annual mean growth is 12% until 2026, followed by a mean increase of 41% until 2034. By then, annual waste amounts are estimated to 240,000 tonnes steel and iron (16% of currently recycled materials), 2300 tonnes aluminium (4%), 3300 tonnes copper (5%), 340 tonnes electronics (<1%) and 28,000 tonnes blade materials (barely recycled today). Three studied scenarios suggest that a well-functioning market for re-use may postpone the effects of these waste amounts until improved recycling systems are in place.

1. Introduction

1.1. Background

During the last decades increased awareness of environmental issues linked to the use of fossil fuels has been a driver in the development of renewable energy resources with lower environmental impact such as hydro, solar, and wind power. Nevertheless, all types of energy supply evaluations need to take the whole life cycle and linked environmental impacts into account to be comparable. If renewable energy resources are to remain sustainable alternatives, it is important that the materials and components involved be optimally managed from production and installation, through operation until decommissioning, and finally removal.
Wind power is one of the fastest growing energy sources in the world [1] and the market in Sweden is certainly following that trend, as more than 3000 turbines are installed and the annual electricity generation from wind power plants has increased from 0.9 TWh in 2004 to 11.5 TWh in 2014 [2,3].
The lifespan of a wind turbine is commonly assumed to be 20 years [4]. The expansion of wind power in Sweden and many other countries started some 25 years ago, which implies that wind turbines are currently being decommissioned and that the number will increase vastly. Thus, it is important to know what waste amounts to expect of each specific material to ensure sufficient recycling capacity.
Exactly how decommissioned wind turbines will be managed in the future is unclear. For parts that are worn out or weakened in strength, material recycling or energy recovery will probably be the most likely option. However, some parts could possibly be re-used directly or, after possible refurbishment, indirectly in other turbines or for other purposes. The mean recyclability of a modern wind turbine’s mass (excluding the foundations) has been estimated to 80% [5]. Studies of waste management of wind turbines are scarce, but apparently the turbine blades, which are made of composite materials, pose a challenge for waste management [6].
A literature search (ScienceDirect®, http://www.sciencedirect.com/) was conducted using ‘wind turbine’ as the main search term in combination with one or more of the following: end of life, life cycle assessment (LCA), materials, recycling. The search results were mostly related to design, optimization, and construction of wind turbines [7,8,9,10], health effects [11,12,13], economical aspects (price/cost) [14,15], or how wind power fits into current and future energy systems [16,17,18].
Several LCAs of wind turbines that include end-of-life issues have been conducted [5,19,20,21,22,23,24,25,26,27,28,29,30,31,32,33,34,35] and cover various regions, (e.g., China, Spain, and Mexico). Notably, waste management is often considered through assumptions disregarding the possibilities for recycling. Waste materials are often specified and subject to a mix of recycling, landfill disposal, and incineration. These studies cover a wide range of turbines from 300 W to 3 MW and the life expectancy is often set at 20 years, if mentioned at all. Common to all studies is the fact that they refer to a single turbine or plant, or a wind farm. No study was found which addresses annual waste amounts or waste management capacity for current or future situations on a national level. This problem of addressing the increasing volumes and extended time scales for emerging energy technologies with product-oriented LCA methodology has previously been explored [36,37,38].
A review of different LCAs of wind turbines concludes that end-of-life is rarely assessed in detail and that future waste management practices for rotor blades are largely unknown [39]. Additionally, ‘assessments using the avoided burden method are often lacking in transparency and may be inconsistent’. This calls for more research on the end-of-life stage and estimations of future amounts specified in material types is vital to accurately assess credible waste management of wind turbines.
A recent paper deals with issues related to extended service life, i.e., longer life time [40]. Pros and cons of different degrees of re-use, such as retrofitting, repowering, and rebuilding are discussed, but quantitative data and calculations are lacking. One of the most relevant studies on end of service life for wind turbines has both a qualitative and a quantitative approach [41] and discusses different challenges, remanufacturing, recycling, reverse supply chain issues, and also economic challenges associated with remanufacturing and recycling of wind turbines. One of the key findings is that logistics are often neglected, irrespective of remanufacturing, repowering, or recycling. Therefore, calculating the amounts of waste will, in combination with information on locations and treatment capacities provide crucial information for assessments.

1.2. Problem

The waste generated from aging wind turbines has to be managed in a sustainable way if wind energy is to remain as an energy source with relatively modest environmental impact. The market has expanded rapidly and there is a risk of a fast increase in waste material from decommissioned turbines, which will prove difficult to handle unless the industry is prepared.
There seem to be few end-of-life studies on wind turbines focusing on waste amounts from the wind power industry, neither as total amounts, nor characterised with regard to types of materials. Previous studies on LCA investigate single turbines or wind farms but use simplifications for end-of-life. Furthermore, studies on a national level are lacking.

1.3. Aims and Objective

The aims of this study are:
(1)
To develop and describe a generally applicable method for quantification of future waste amounts from wind turbines on a national level.
(2)
To apply the method to Sweden as a case and present and discuss the resulting amounts of waste material that will be generated from wind turbines in Sweden during the coming decades.
This will illustrate the method’s applicability as well as pinpoint important issues related to decommissioning of wind turbines. The objective is to highlight the importance of wind turbine waste flows. Knowledge regarding the amounts of waste generated from Swedish wind power will hopefully be used in planning for future waste management. This could avoid disposal of material that can be re-used, recycled or energy recovered since the proper system can be introduced in time. By extension this should prevent unnecessary energy losses and environmental impact from wind power.

1.4. Significance

With the proposed method this study completes other qualitative arguments used to assess waste and recycling potentials for wind turbines. The present study is not tied to a specific manufacturers or sites; instead the total wind turbine waste amount for a country is calculated, including current recycling capacity which makes the study unique. This is novel as no similar study seems to been performed previously, at least not in a scientific paper. The long-lasting gain of the study is that the method for waste amount estimations can be adapted and applied in various countries world-wide. This will in turn provide information on waste amounts, material types, and when these amounts are to be expected as well as constitute a basis to life cycle inventory as part of LCA of wind turbine waste management.

1.5. System Boundaries

This study excludes grid connections, transformers, and similar infrastructures because it is assumed that they are often re-used for new turbines or for other projects. Turbines with less than 50 kW capacity, as well as turbines designed with a three bladed horizontal axis, are not included as data are not available in the Swedish database used [42]. Some materials are left out as they are used in minor amounts, or present only in specific models by certain manufacturers.
The mass and design of the tower foundation is dependent on the surrounding environment, and no such information is available in any of the examined databases. It is also unclear how much of it, if any, that has to be removed from the site after decommissioning since it is often largely hidden underground. Therefore, the foundation mass, and material included within it, has been completely excluded from the estimation results. So far, offshore wind power constitutes a minor fraction of the total installed power in Sweden. Even if offshore wind power is expected to grow in the future, the total share will still be limited. The uncertainty about how much of the structure under the sea surface that has to be removed applies also here and has thus been omitted. The relatively new technology of permanent magnet generators has not been taken into account as it is difficult to predict how the market for these will develop.

2. Materials and Methods

The material generated from decommissioned turbines is found through analysing the material in currently installed turbines and estimating when these will reach end-of-life. A prognosis of future development is also made to estimate the amount of components that will need replacement each year and the corresponding amount of waste material this generates. Both these amounts are then combined into an estimate of the total amount of annual waste from installed wind turbines. A graphic representation of the workflow is shown in Figure 1.
For the results in this study, VindStat’s annual report [43], presenting installation date and other relevant data for most installed turbines in Sweden, has been used as the base for the calculations. Information on material composition in different types and sizes of wind turbines has been extracted from various LCAs [44,45,46,47,48,49,50,51], and by using the available parameters in the data base [42] each turbine has been assigned a specific amount of steel, iron, copper, aluminium, blade material and electronics. Precise data for each installed wind power plant is not available in the data bases used, hence some information has to be extrapolated and factored to enable projections
A life time of 20 years was assumed, based on prior research [4,52] and a comparison with empirical data for the material of each turbine. To calculate the amount of waste material from replacing faulty components, empirical data for replacement rates in further developed markets [53,54] has been combined with a prognosis over future development of installed wind capacity in Sweden based on a method described in prior research [55].

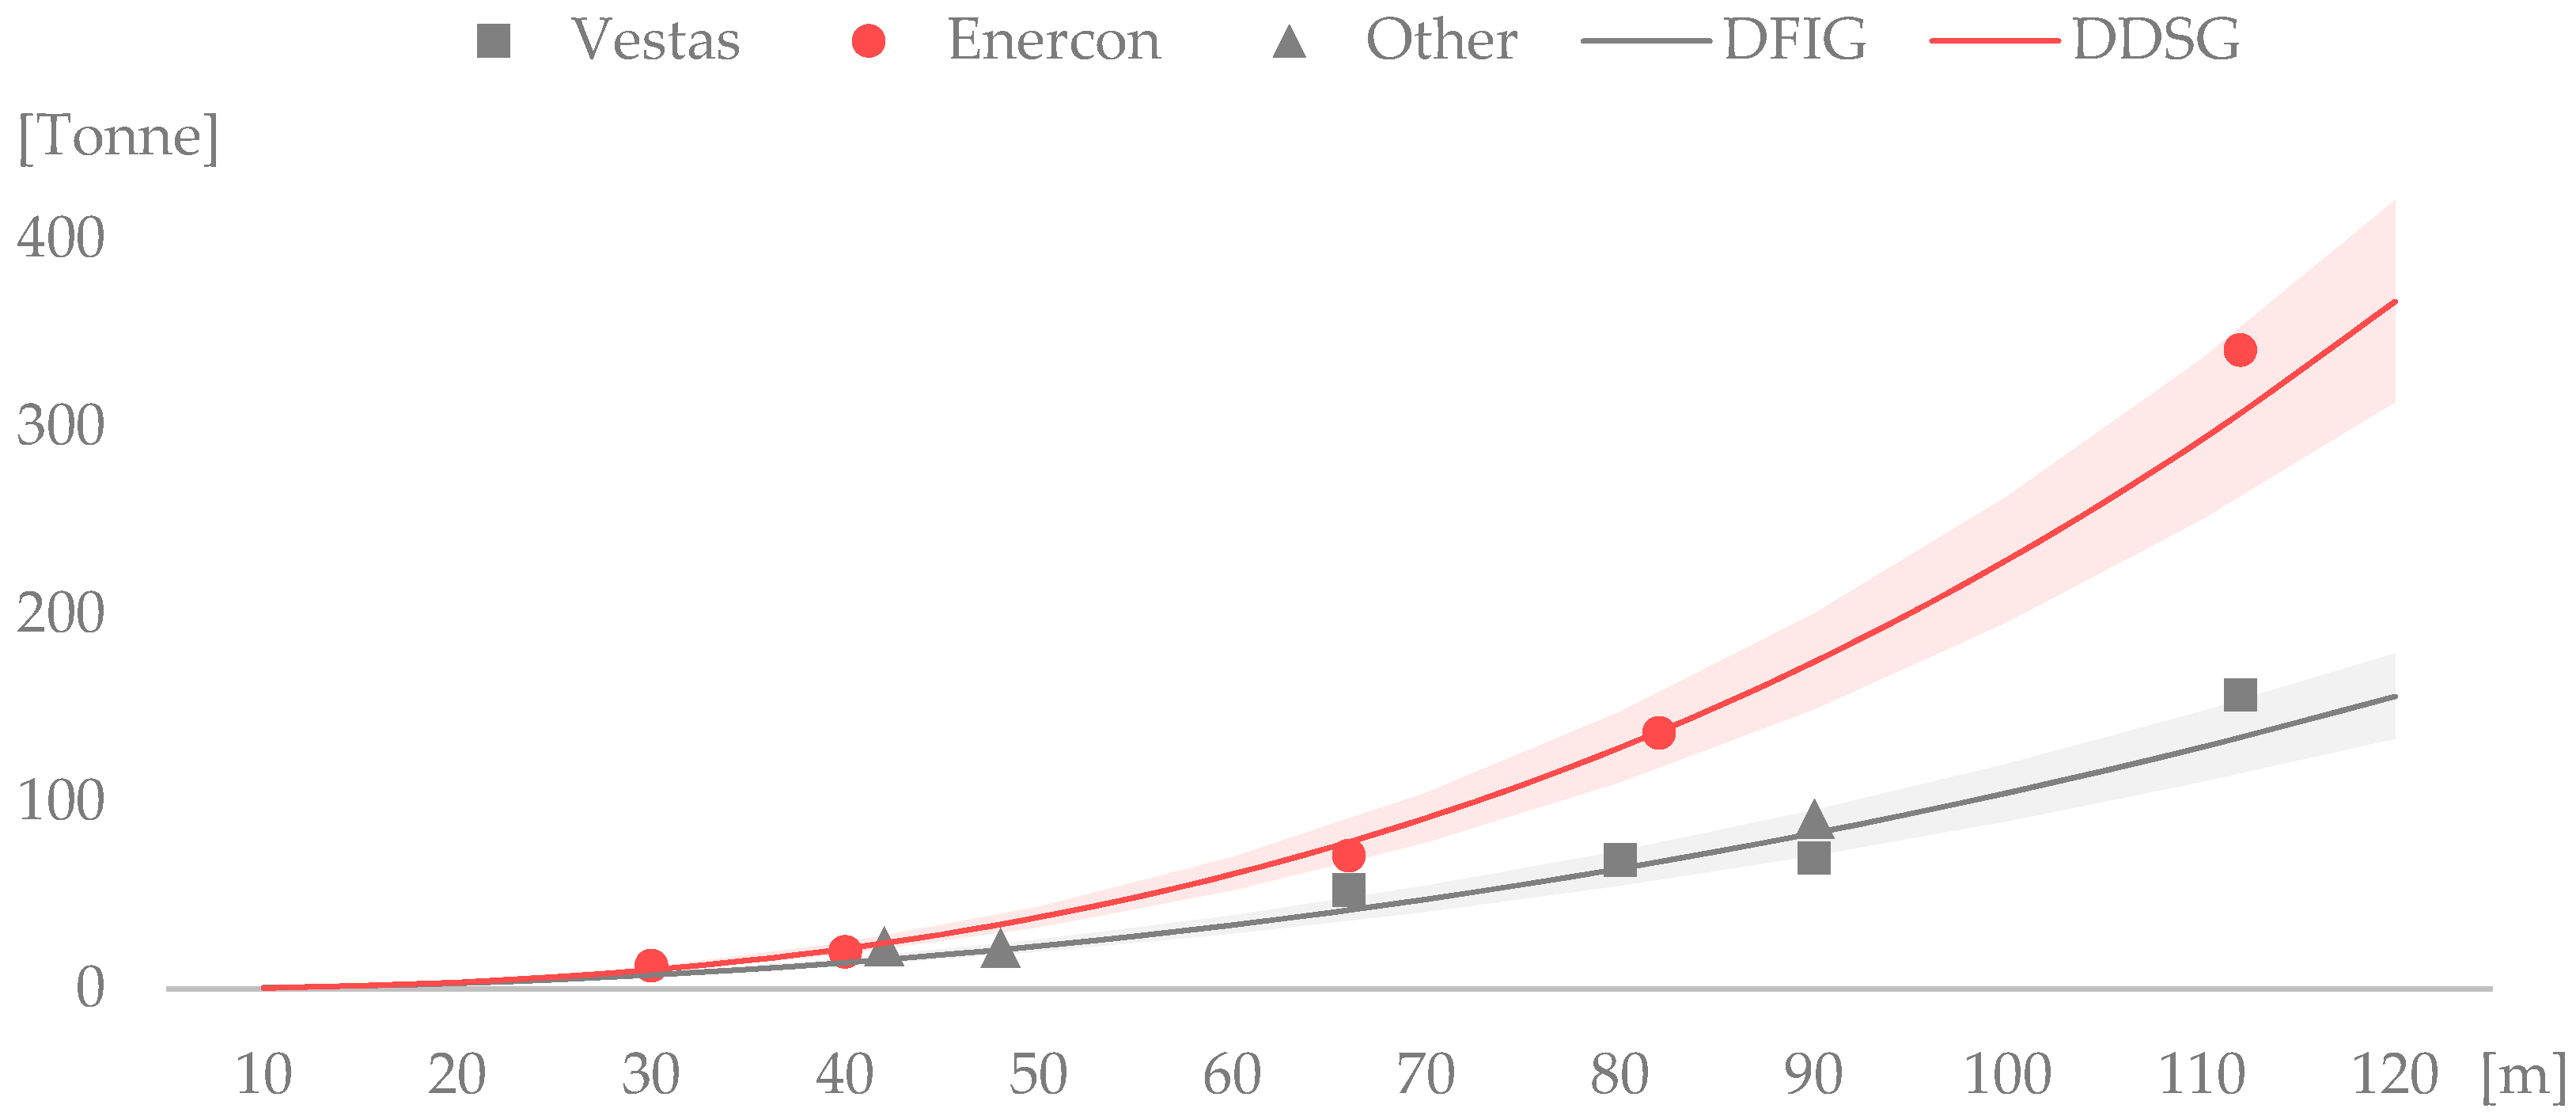
2.1. Material in Decommissioned Turbines

The specific mass and material specification of many turbine models is available online, either straight from the manufacturer or in published LCAs. If the turbine manufacturer and model is known then the most accurate material masses can then be acquired directly from these sources. In the Swedish wind turbine database, for example, specific material masses are available for more than half of the turbines presented. See Appendix A for a list of models with assigned masses [44,45,46,47,48,49]. For other turbines, either lacking properties in the data base or accessible material specification, the mass has to be estimated. The method presented below can be used as long as there is a database of installed turbines where at least rotor diameter and installation date is known.

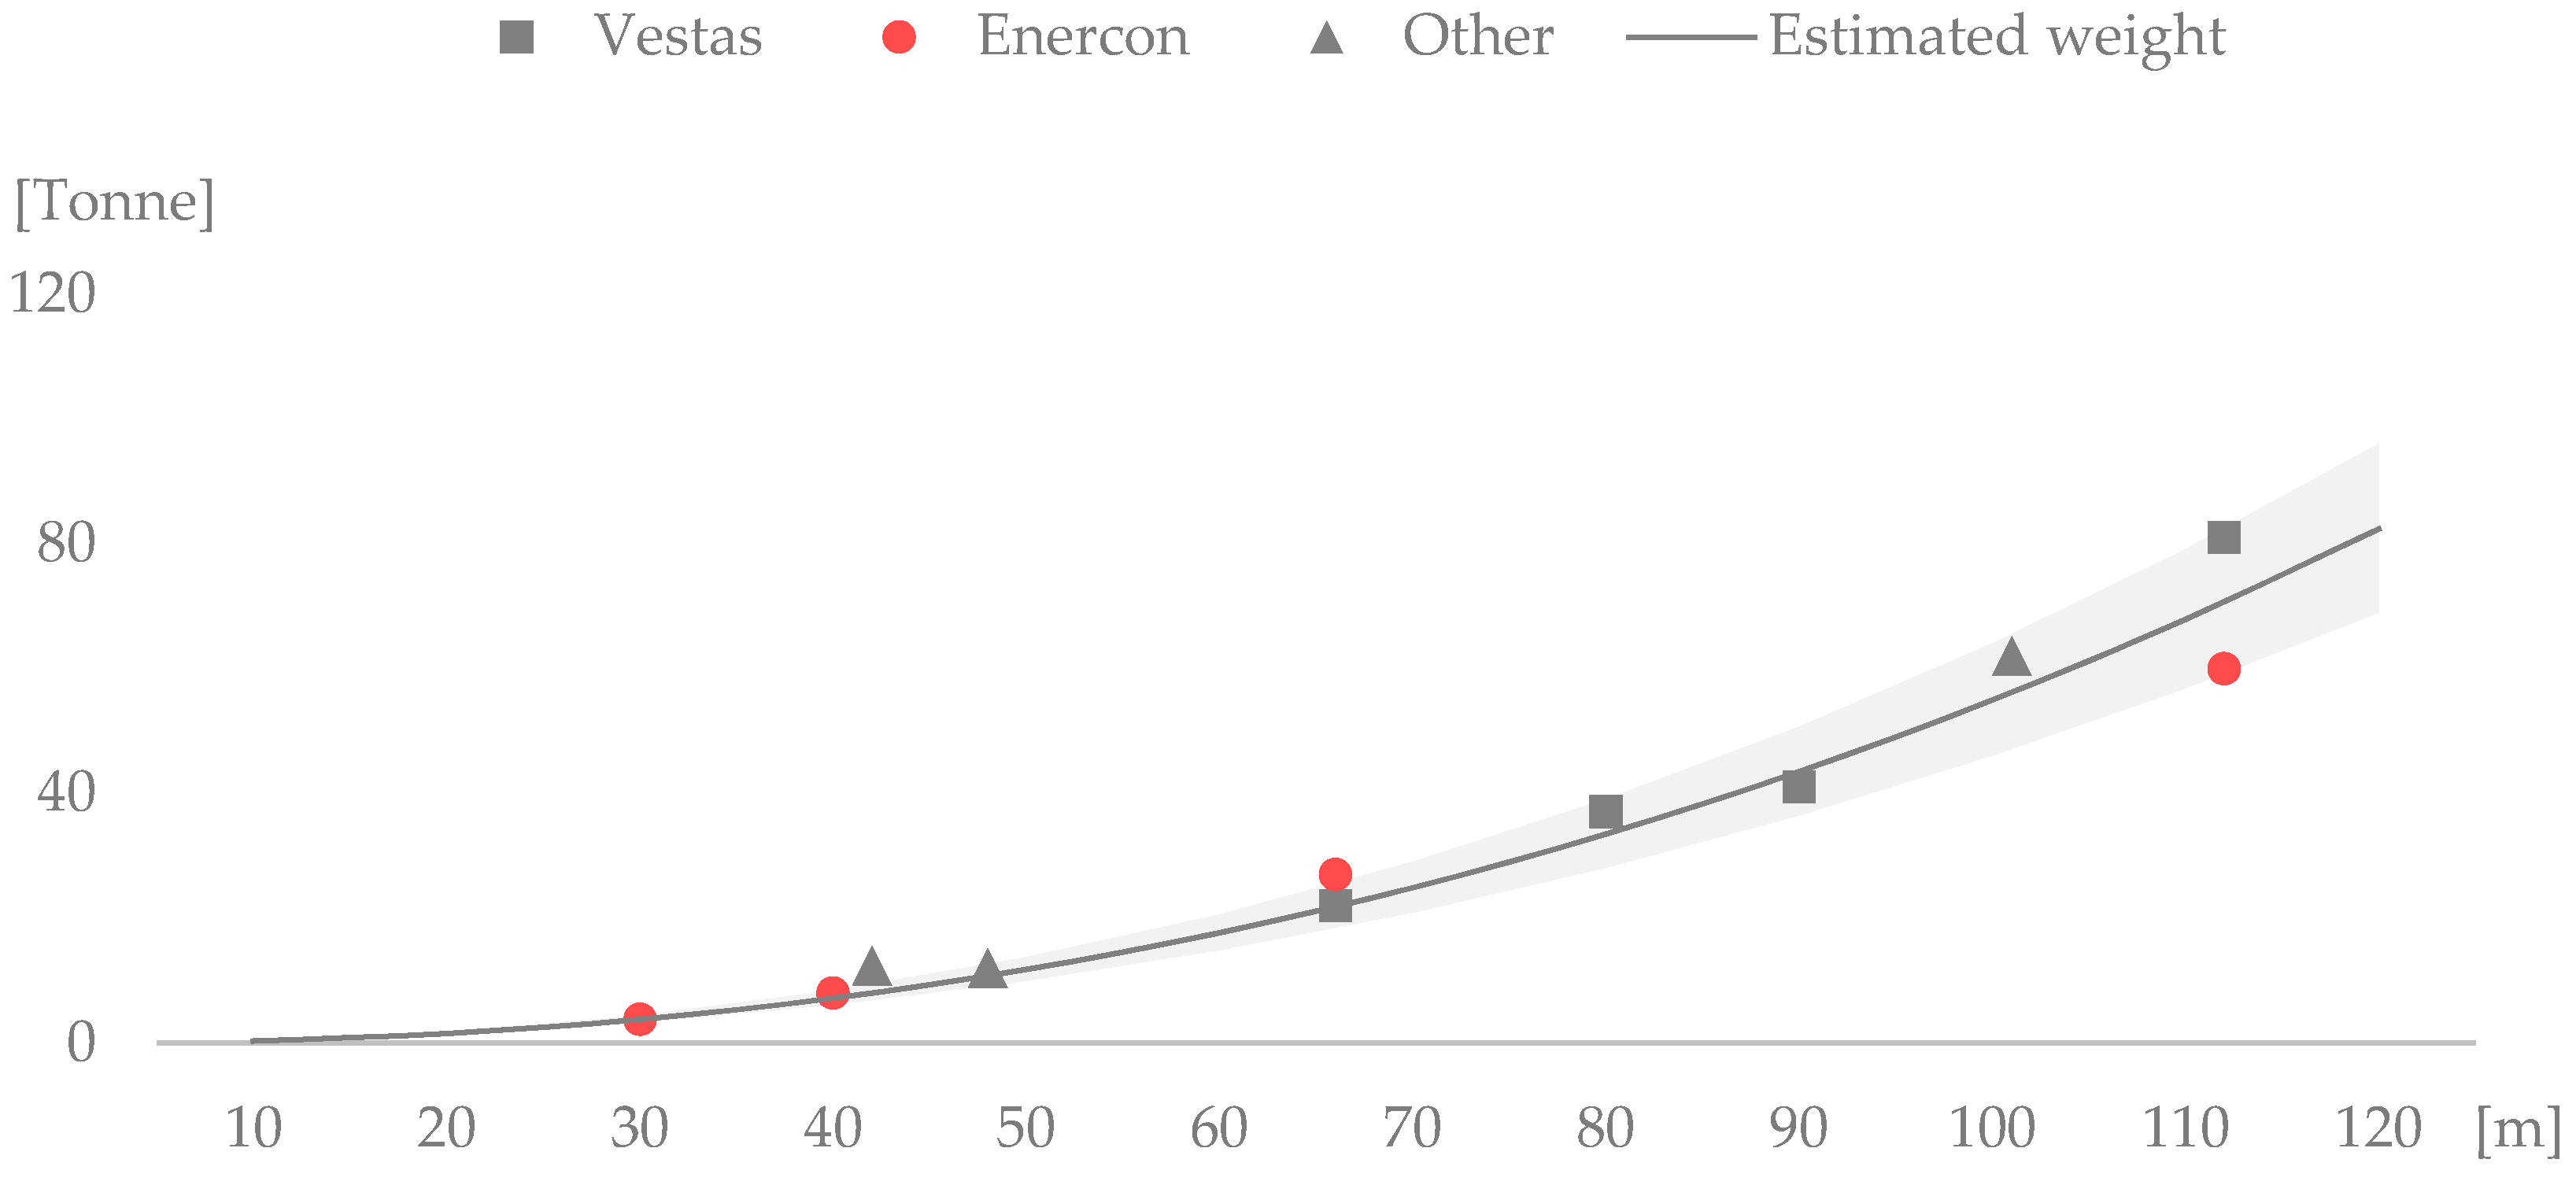
2.1.1. Estimating the Mass of Installed Turbines

Excluding the foundation, a wind turbine can roughly be divided into three main parts: The tower (the structure building height to the wind turbine), nacelle (the machine housing and its casing), and the rotor (the rotor blades and rotor hub). The material specification for these three parts is vastly different [44,45,46,47,48,49,50,51], and their mass is therefore estimated separately.
An empirical study published in Environmental Science and Technology [56] analyses 12 different turbines and presents a logarithmic function for estimating the mass of wind turbine parts based on the turbines rotor diameter. The following equation is presented:
log y = log a + b log x
where:
  • y = Calculated mass of turbine part (kg)
  • x = Rotor diameter (m)
  • log a = Intercept value
  • b = Scaling factor
Presented along with the equation is a set of values for a and b that can be used to calculate the mass of the nacelle, tower or rotor. Solving for y and redefining variables results in the following equation:
m p a r t = 10 a · d b
where:
  • mpart = Calculated mass of turbine part (kg)
  • d = Rotor diameter (m)
  • a = Intercept value
  • b = Scaling factor
The intercept values and scaling factors used to produce mass estimations for each turbine part is presented in Table 1. The two main types of generator designs, direct drive synchronous generator (DDSG) and doubly-fed induction generator (DFIG) have significantly different construction [57]. As a result, both the nacelle mass and material content vary largely between the two. To account for this in the calculations, the separate values in the table was found through analysing a set of turbines of known design, mass, and material specification [44,45,46,47,48,58,59,60] and using the least squares method [61] to fit Equation (2) to this data. A graphic representation of this process is found in Appendix B, along with a description on how the growth patterns of DFIG and DDSG turbines were separated.

2.1.2. Material Specification in Wind Turbine Parts

As the mass of each turbine part has been calculated, the material specification for each part is converted into separate materials. LCAs and similar documentation of eight turbines [44,45,46,47,48,49] (four of each generator design) have been examined to find the mean material specification for each part. The findings are shown in Appendix C. The average mass of a specific material in an unknown wind turbine is then calculated using the following equation:
m m , t = x m , r o t o r · m r o t o r + x m , t o w e r · m t o w e r + x m , n a c e l l e · m n a c e l l e
where:
  • mm,t = Calculated total amount of a specific material in a wind turbine (kg)
  • xm,part = Average fraction of a specific material in a turbine part (Appendix C)
  • mpart = Calculated mass of the specific turbine part (kg)
The total amount of a specific material in all installed turbines for a certain year is then summarized:
m m , i n s , t o t , y e a r = i = 1 n m m , t 1 + m m , t 2 + m m , t 3 +   +   m m , t n

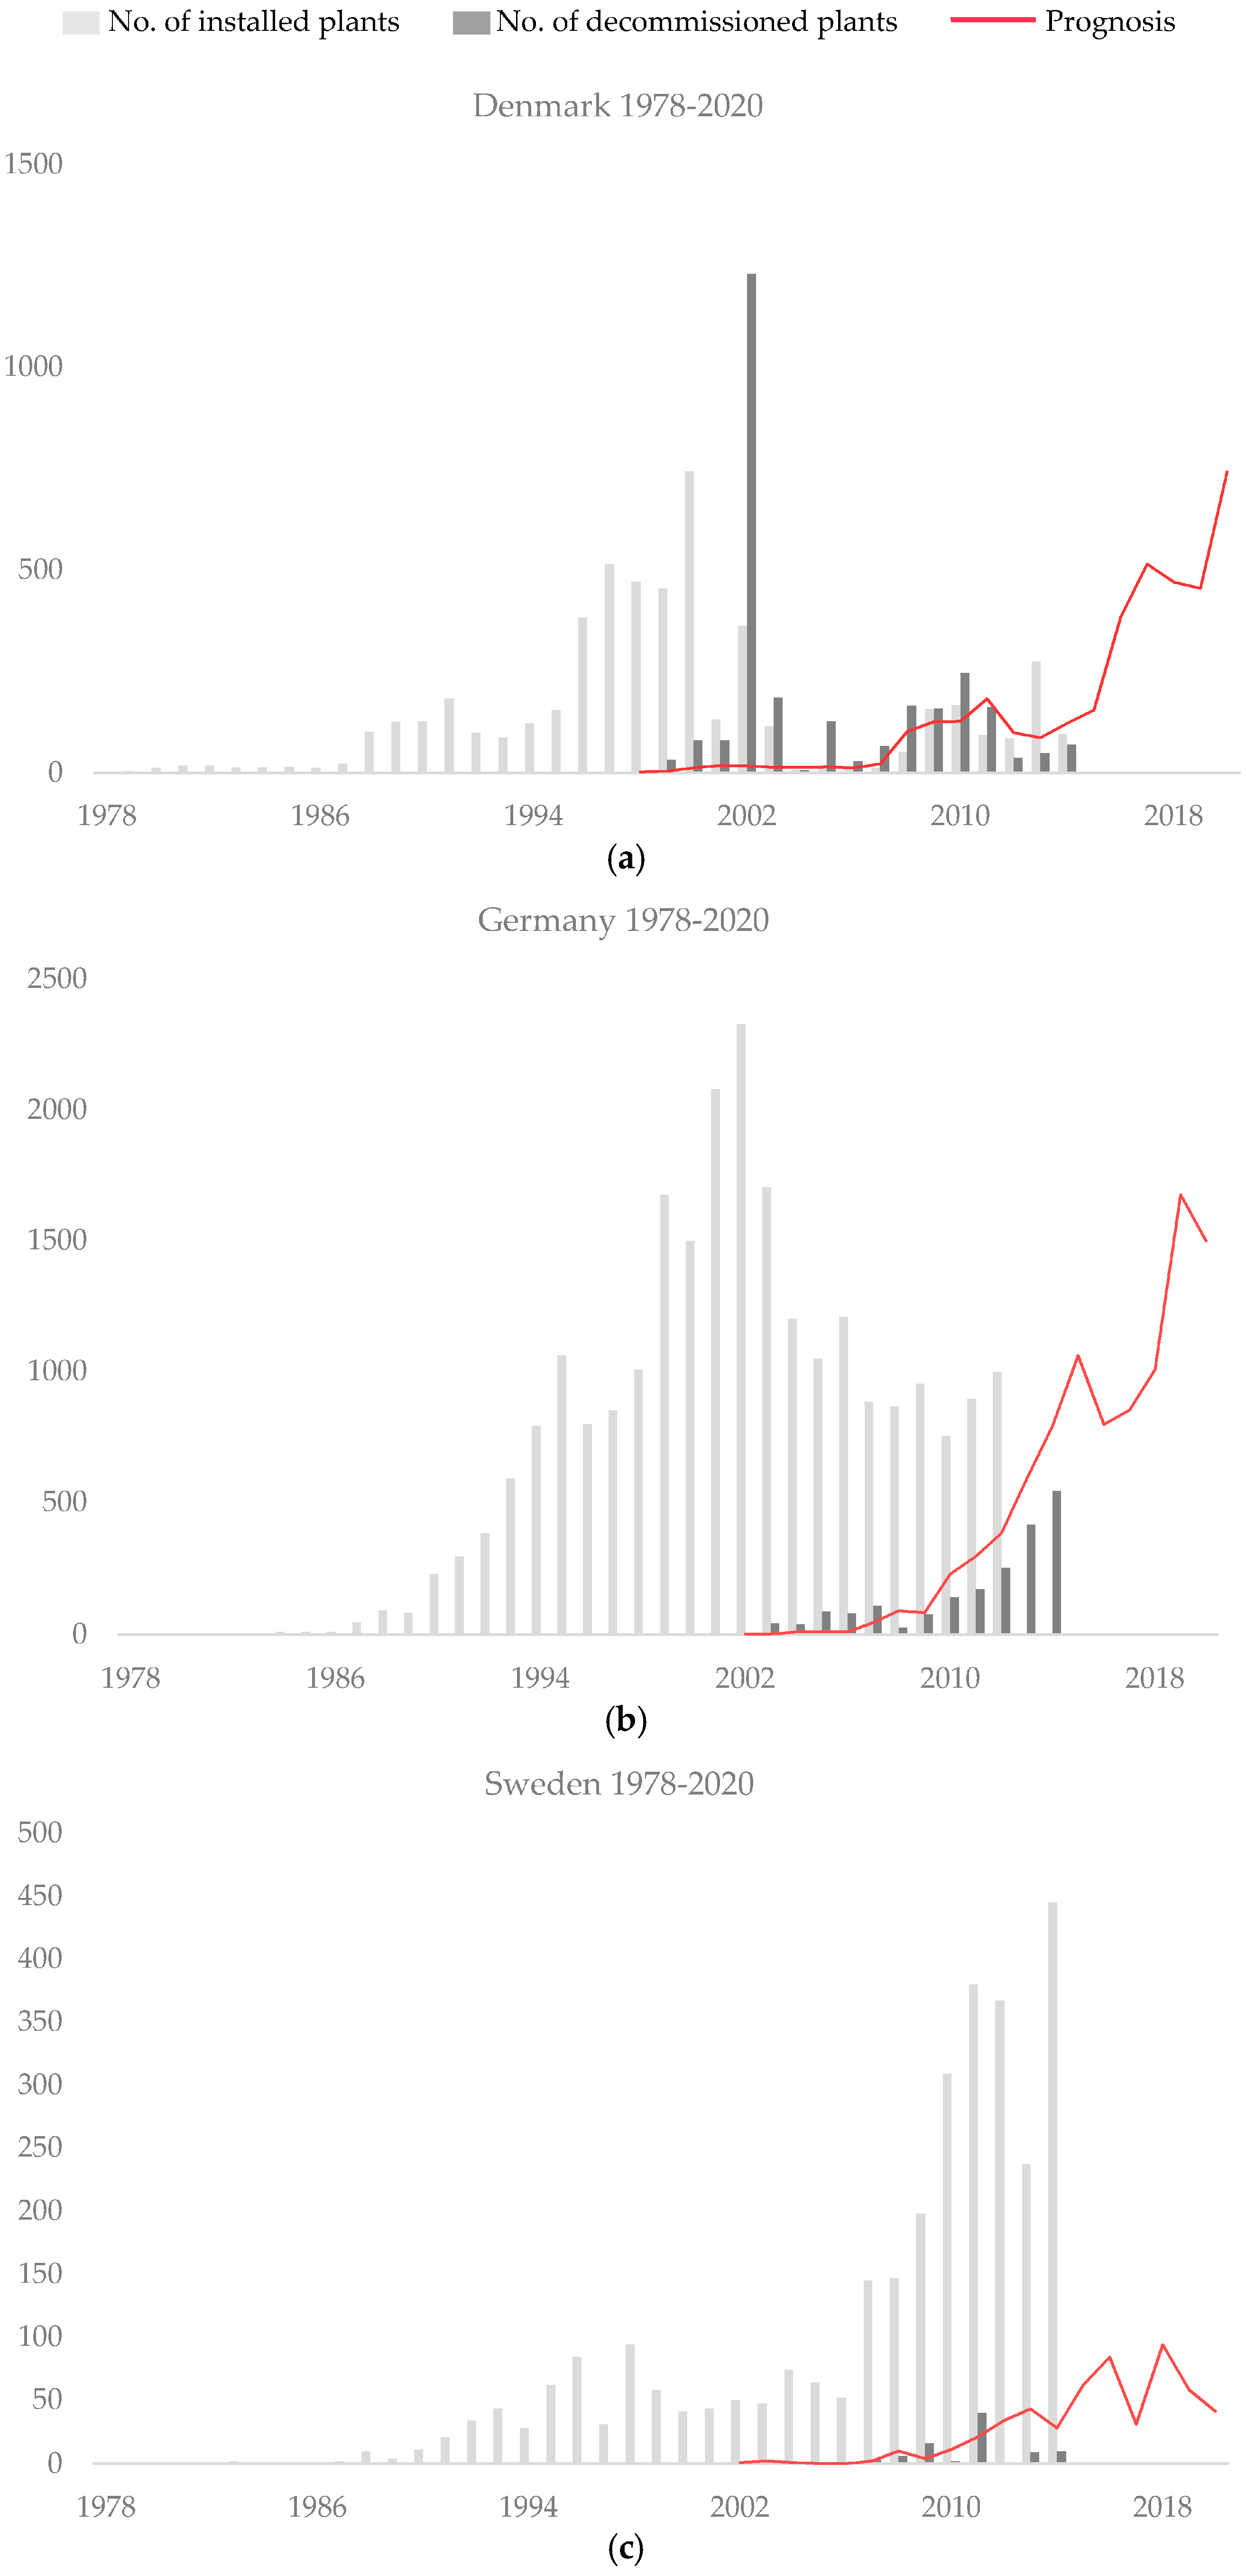
2.1.3. Turbine Life Time

A wind turbine is exposed to two forms of aging: loss of performance as a result of physical wear and tear, and relative aging compared to the newest technology on the market. Sooner or later every plant will either be taken down since it is no longer worth repairing, or simply be replaced with newer more efficient technology. Staffell and Green [52] have studied the performance of aging wind power plants and found that the trend of decline is consistent for different turbine generations, meaning newer turbines age in a similar rate as old ones. The average time between commission and decommission is therefore assumed to be the same, regardless of when the plant was installed.
Dolan and Heath [4] reviewed available LCAs and compiled a table of methods and assumptions used. A life time of 20 years is by far the most common used for all types of wind power plants. As the wind power technology is still relatively young, few countries have markets that have been well developed for more than 20 years, and hence there is not yet much empirical data on turbine life time. A comparison between actual and expected decommissionings in early adopting countries is presented in Appendix D, which indicates that it is at least an acceptable generalisation.

2.2. Material in Replaced Components

A common issue with wind power plants using a geared generator design is failure of the gear box. A report published by Elforsk [62] concludes that the average lifetime is 8–10 years, meaning the gear box typically has to be replaced or extensively repaired at least once during the plants’ lifetime. The rotor blades have to endure strong forces and harsh conditions and therefore needs to be regularly serviced. If there are cracks or damages, the blade has to be repaired or replaced to prevent decreasing efficiency or in worst case catastrophic accidents [63]. The third main component that has a relatively high risk to fail is the generator. It contains both moving parts and electrical components that can malfunction for many various reasons, for example continuous wear and tear or faulty wiring [64].

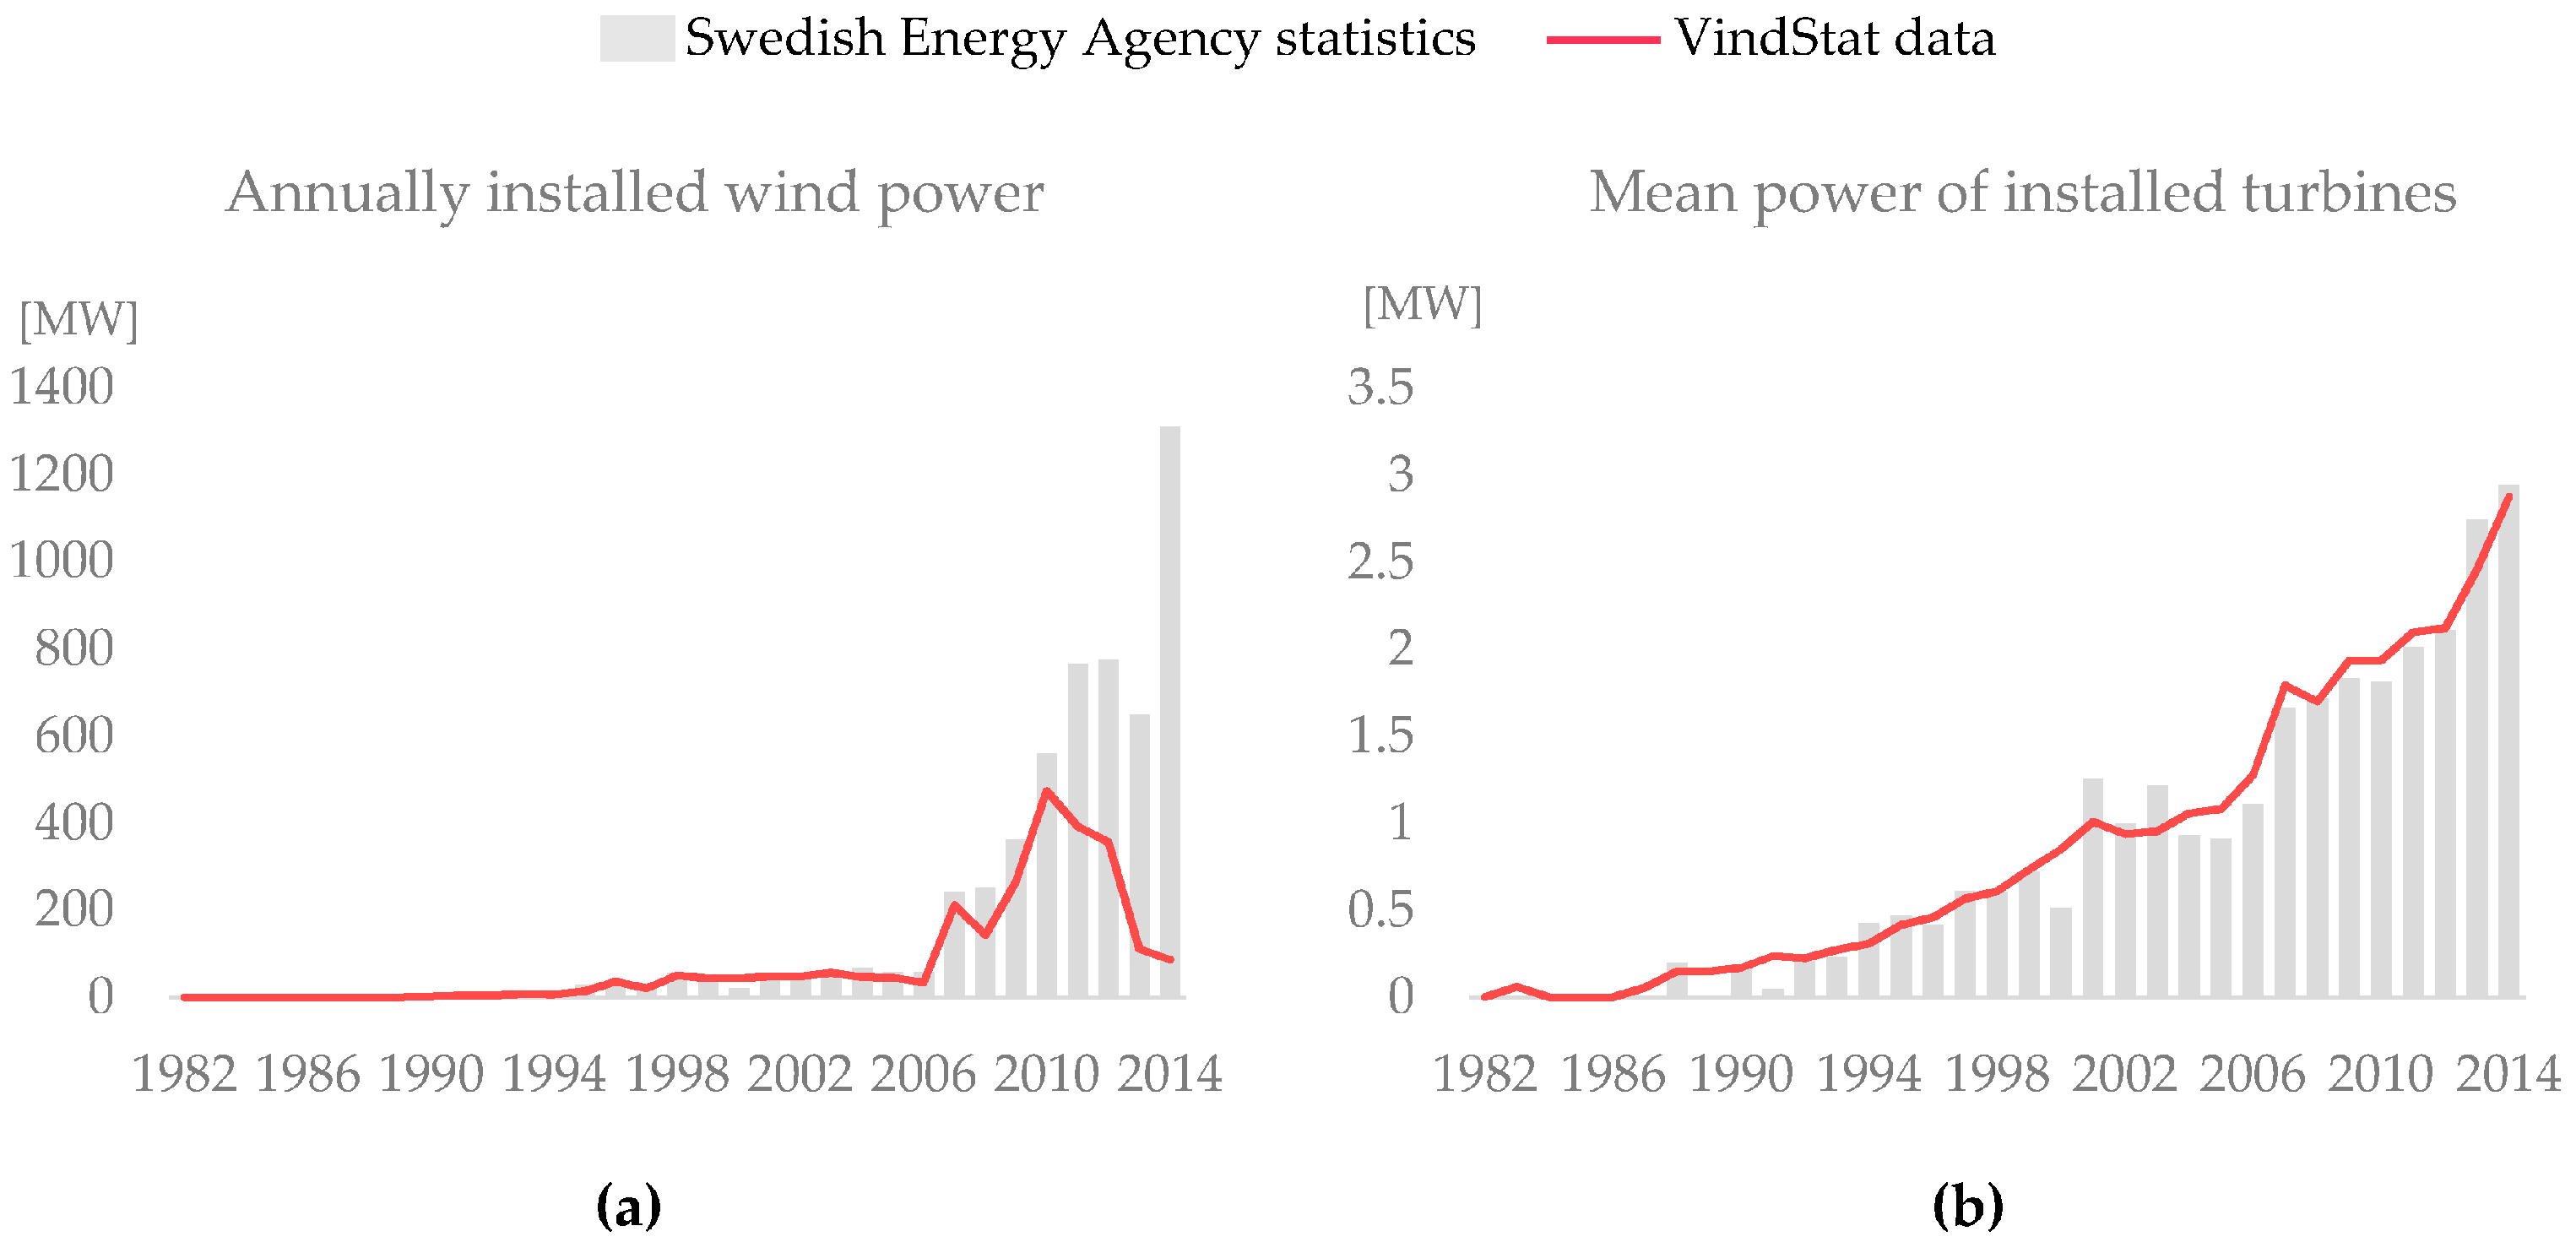
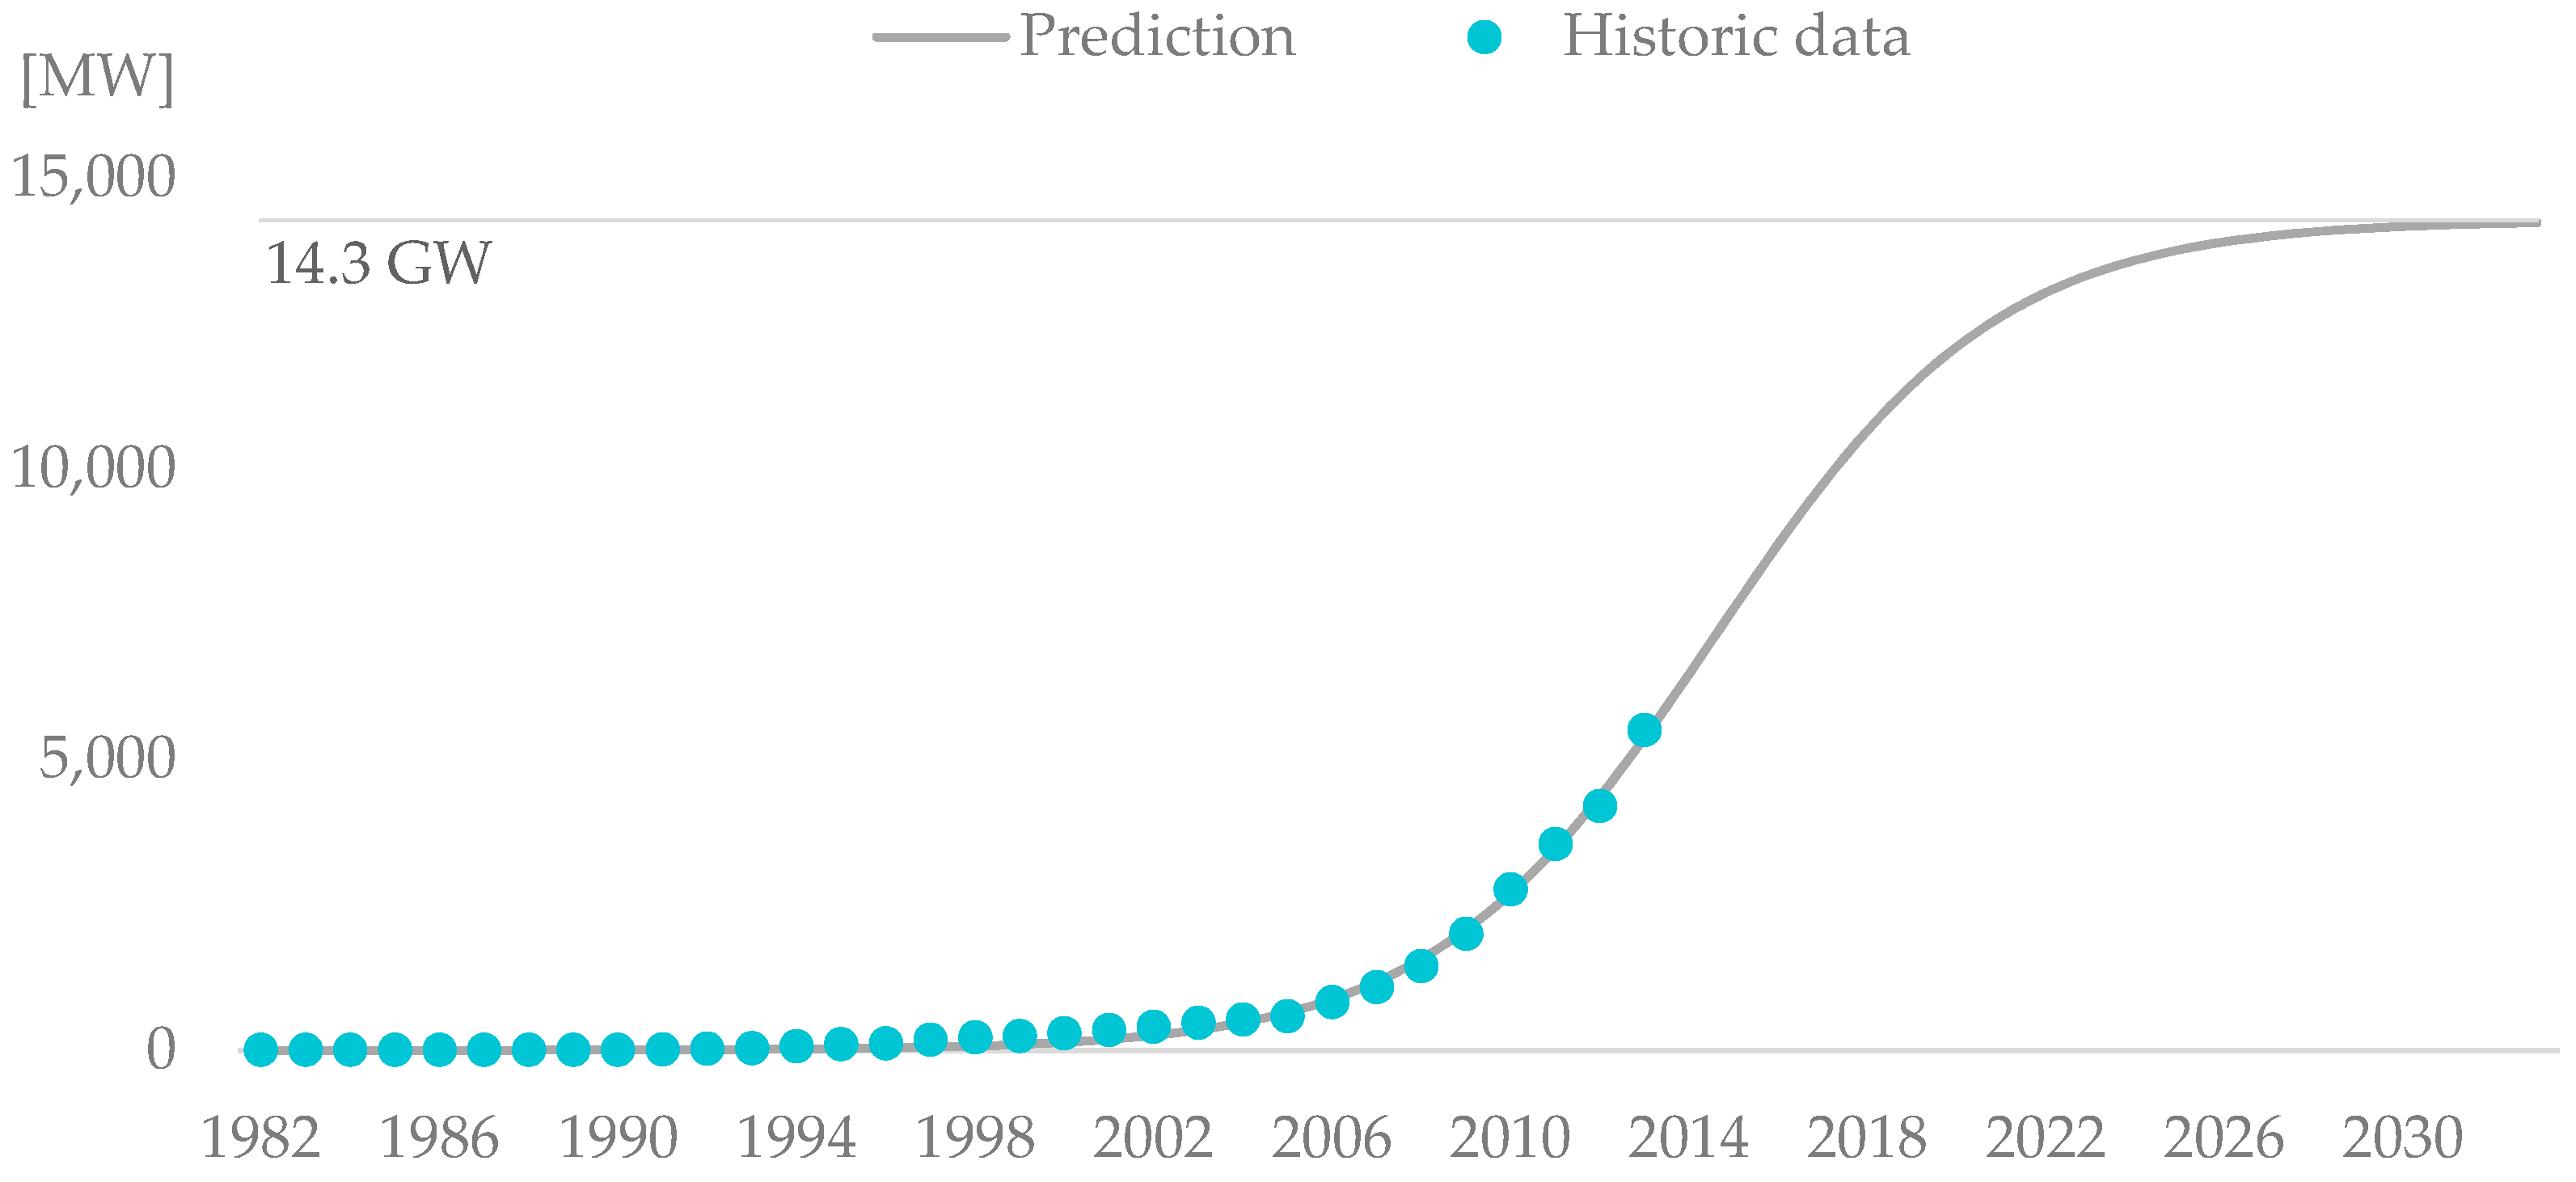
2.2.1. Wind Power Development

To be able to quantify the amount of replaced components, a prognosis over the future wind power development is required. A study at Uppsala University [55] proposes an equation for a logistic growth curve for wind power capacity that fit historical growth patterns for similar energy technologies:
P ( t ) = A 1 + e k ( t t 0 )
where:
  • P = Installed capacity
  • A = The capacity at which the market is saturated
  • k = Steepness factor for the growth curve
  • t0 = The year when growth rate reaches its maximum
Assuming the market saturation and the year with the highest market growth rate can be reasonably predicted, the output can be used as a base point for calculating the total mass of all installed rotors and nacelles.

2.2.2. Mass of Installed Parts

The generator and gear box are part of the nacelle and the rotor blades are part of the rotor. If the rotor and nacelle mass is known, the mass of these components can be calculated as a fraction of each part.
The power output from a wind turbine is dependent on the size of the swept area, which by extension means that the installed power is proportional to the rotor diameter. Considering that Equation (2) can be used to calculate the mass of a single turbine part based on the turbines rotor diameter, a similar proportionality should then exist between total installed power and total weight.
Rotor- and nacelle weight for Swedish turbines [43] in 1992–2010 have been calculated through the equations above, after which least squares method has been applied on Equation (2) (where d has been replaced with P) to find the following relationship between weight and power:
m r o t o r , y e a r . t o t = 60.4 · P 0.88
m n a c e l l e , y e a r . t o t = 92.5 · P 0.83
where:
  • mrotor,year,tot = Calculated total mass of all installed rotors in a specific year (kg)
  • mnacelle,year,tot = Calculated total mass of all installed nacelles in a specific year (kg)
  • P = Installed power a specific year (W)
Combining Equations (5) with (6) and (7) then produces an estimate of total nacelle- and rotor mass in operation each year.

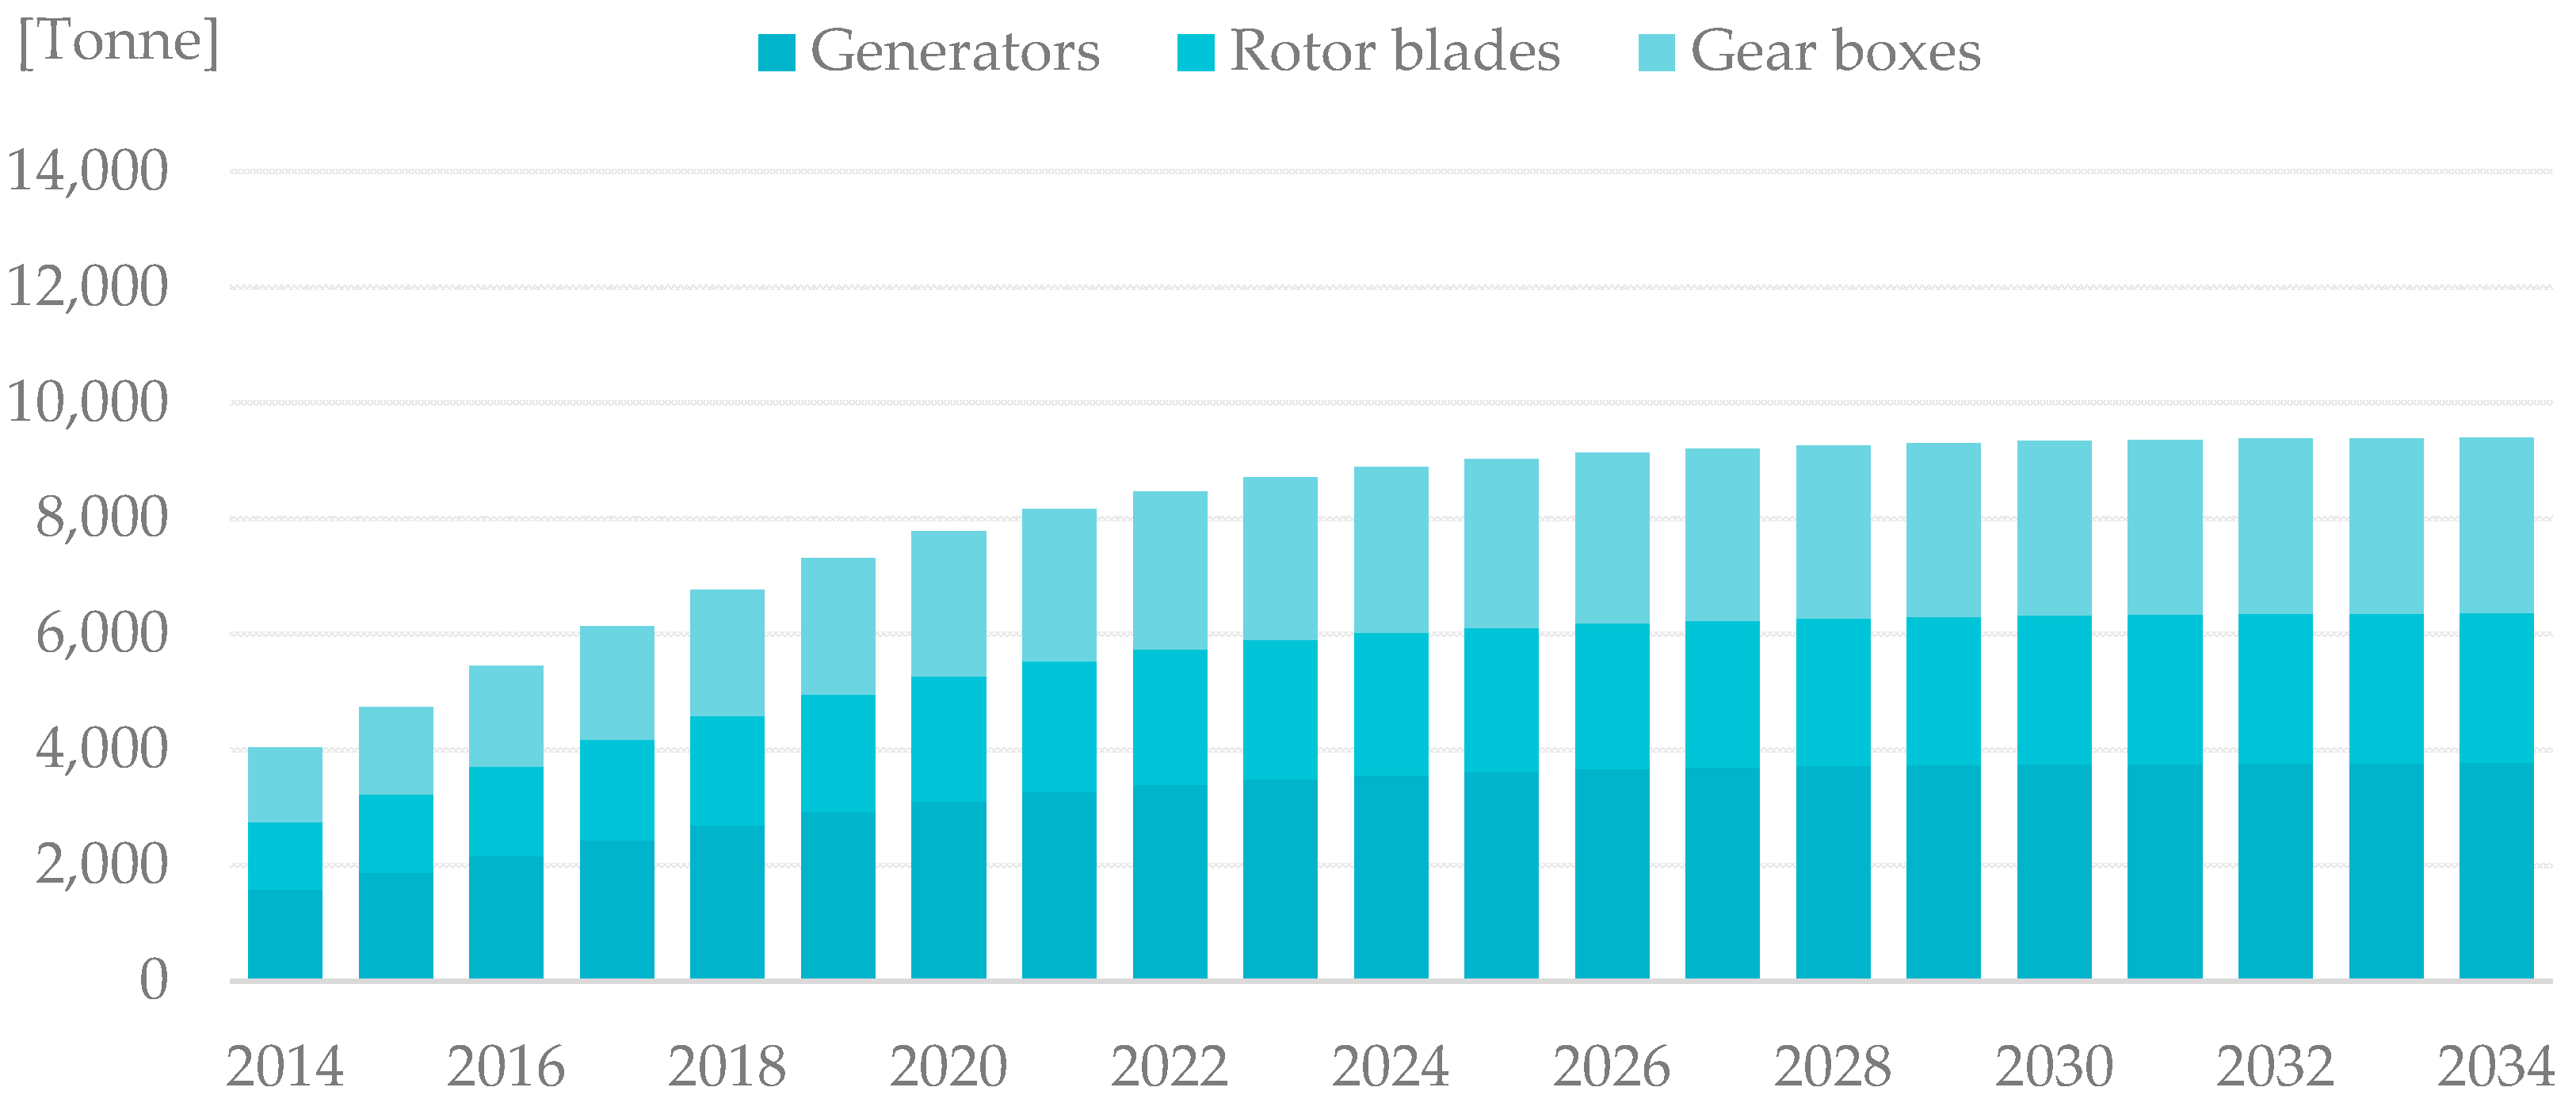
2.2.3. Components’ Mass, Material Specification and Replacement Rate

The mean percentage of the nacelle mass deriving from the generator and the gear box as well as the percentage of the rotor mass deriving from rotor blades has been calculated through quantitative analysis of LCAs. Furthermore, these LCAs can be used to find the mean material content in the components. The result of examining three different LCAs [47,50,51] is shown in Appendix E. In Appendix E empirical data on replacement rates for these components is presented. Assuming that these rates are similar for the coming generations of turbines, the material generated annually from replaced components can be calculated through the following equation:
m m , p a r t , y e a r , r c = r c · x c · m p a r t , y e a r , t o t · x m , c
where:
  • mm,part,year,rc = Total mass of material generated from replaced components a specific year (kg)
  • mpart,year,tot = Calculated total mass of installed nacelles/rotors in a specific year (kg)
  • rc = Components replacement rate (Appendix E)
  • xc = Components mass fraction of nacelle or rotor (Appendix E)
  • xm,c = Material fraction of component mass (Appendix E)
By adding the material generated from replacement of each component, the annual total mass of a specific material generated from replacing components can be calculated:
m m , r c , t o t , y e a r = m m , g e n e r a t o r , t o t , y e a r + m m , g e a r b o x , t o t , y e a r + m m , r o t o r b l a d e , t o t , y e a r
where:
  • mm,rc,tot,year = Total amount of a specific material in replaced components (kg)
  • mm,generator,tot,year = The amount of a specific material in replaced generators (kg)
  • mm,gearbox,tot,year = The amount of a specific material in replaced gear boxes (kg)
  • mm,rotorblade,tot,year = The amount of a specific material in replaced rotor blades (kg)

2.3. Material Generated from Wind Turbines

The total amount of waste material for a specific year is then calculated by adding the waste from decommissioned turbines and replaced components:
m m , t o t , y e a r = m m , i n s , t o t , y e a r + m m , r c , t o t , y e a r
where:
  • mm,tot,year = Calculated amount of waste of a specific material from wind turbines (kg)
  • mm,ins,tot,year = Total amount of material in installed turbines 20 years earlier (kg)
  • mm,rc,tot,year = Total amount of material in replaced components (kg)

3. Results

The general method described above has been applied to the Swedish case, using the most relevant data published. First the total mass of installed turbines is presented, referring to the second red box from top in Figure 1. Next, prognoses of the Swedish wind power development (top blue box in Figure 1) and mass of replaced components (blue box 3 from top) are presented. Then the amount of waste material released in the future (black box in Figure 1) is displayed both in total numbers and specified in material categories. Finally results for applying three different scenarios for re-use of old wind turbines are presented.

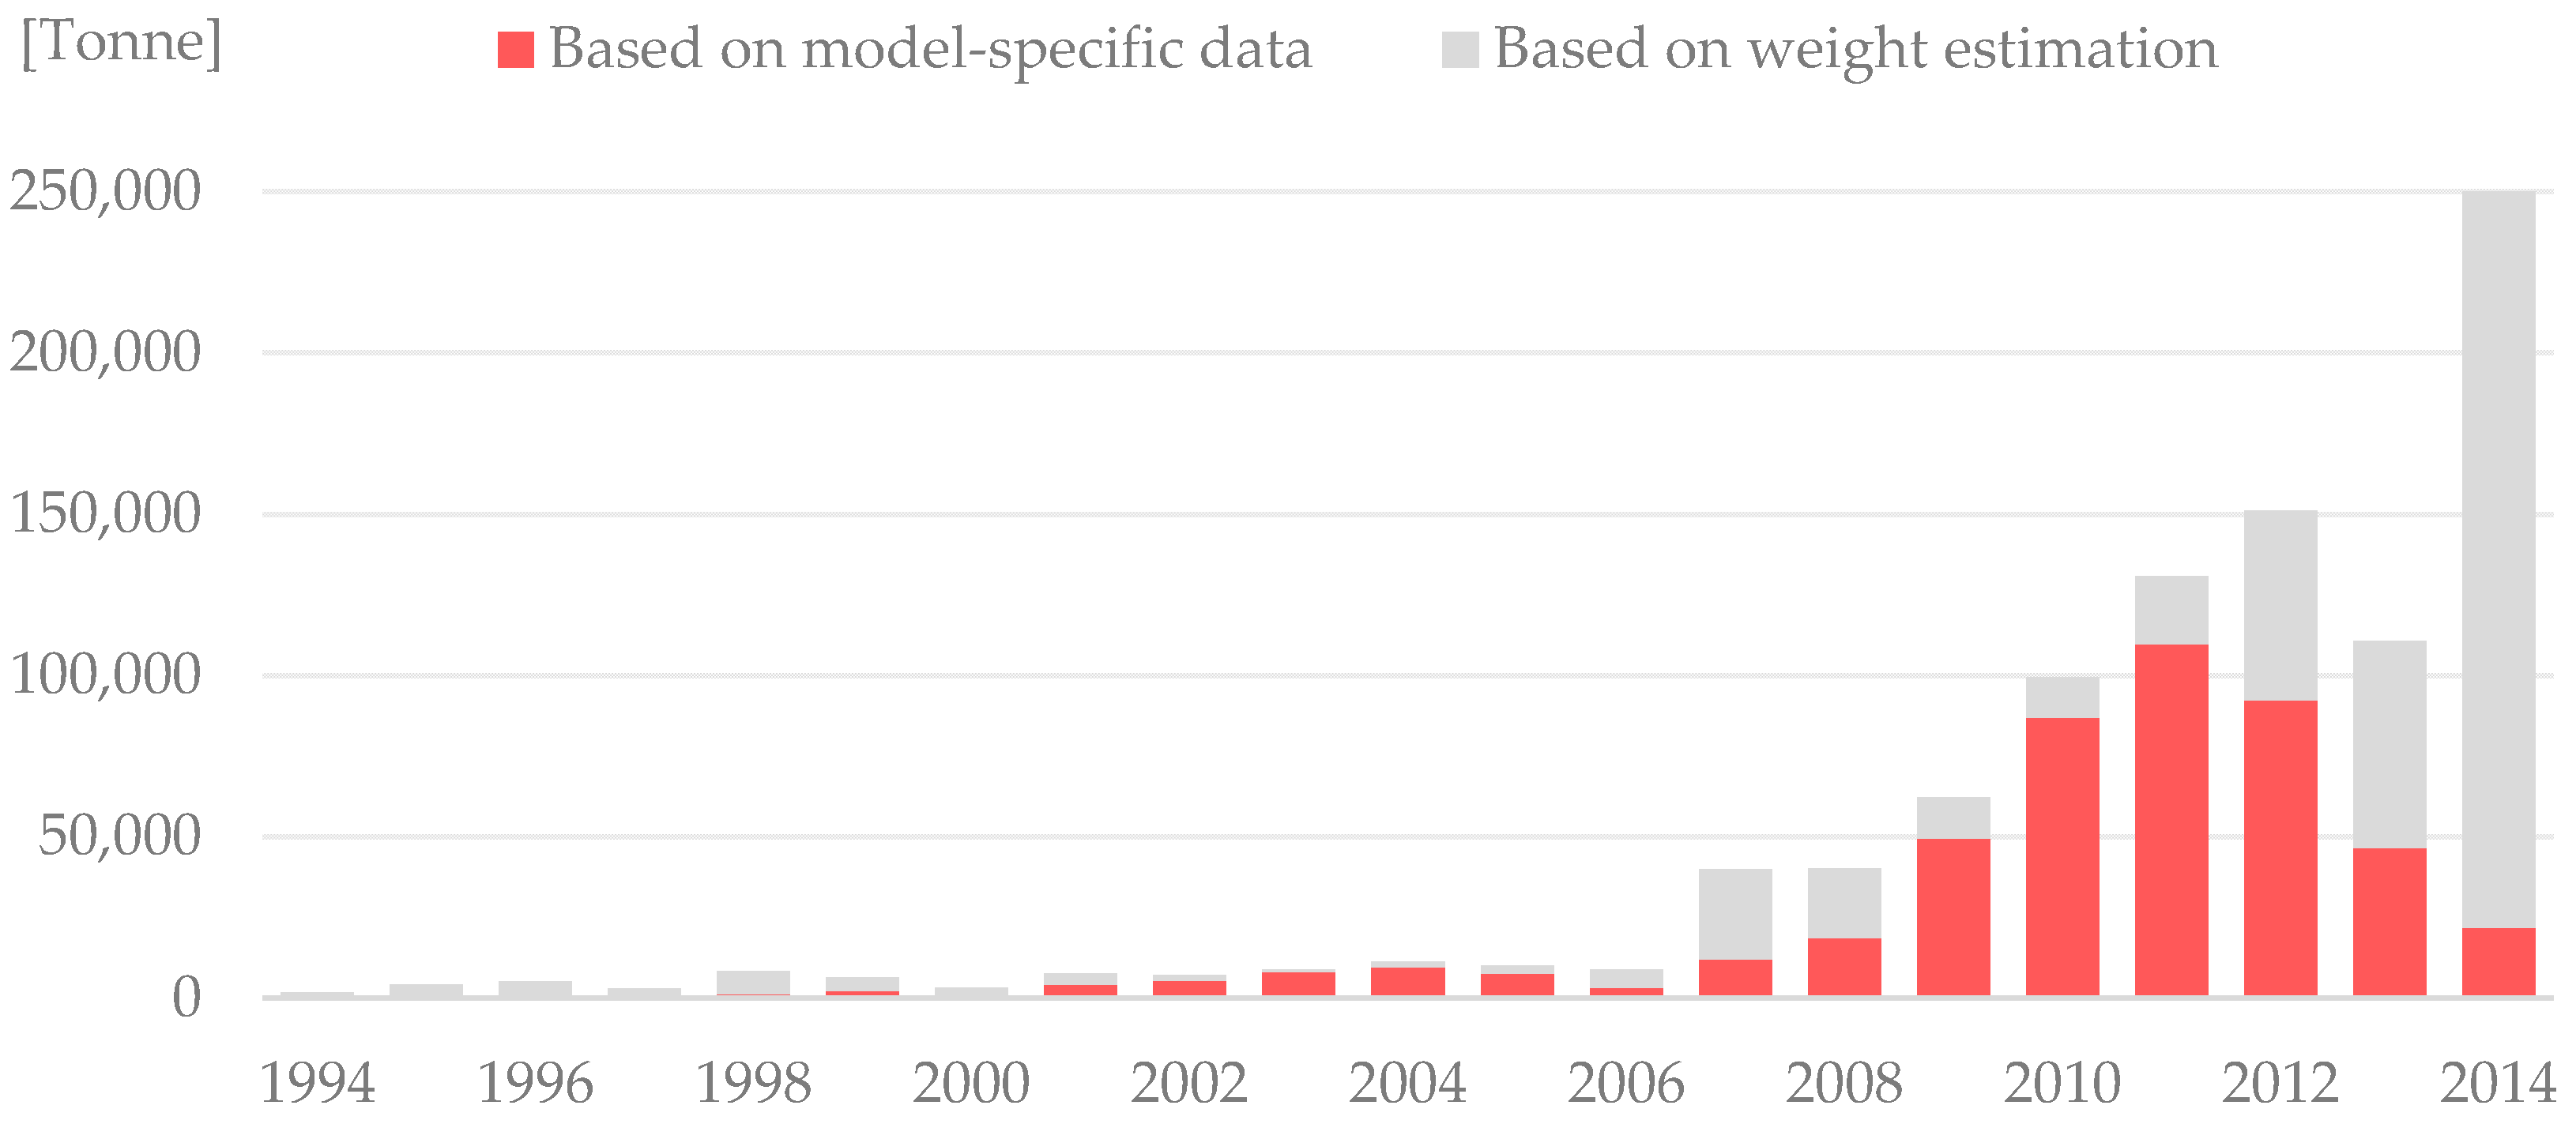
3.1. Calculated Mass of Installed Turbines

Based on the data presented in VindStat’s annual report [43], each turbine has been assigned a specific mass. For about half the turbines model-specific data has been found (see list of turbines in Appendix A), and the other half is assigned a mass through Equation (2). These masses are then allocated to the year they are installed. Not all installed wind turbines in Sweden are listed in VindStat’s data base. The method used to fill these data gaps is shown in Appendix F. The result, total mass of installed turbines each year, can be seen in Figure 2.
From 2006 the installation rate has been rapid. The massive increase comes from large numbers of turbines installed in combination with the fact that new turbines are larger than previous models. The sudden drop in 2013 suggests that more plants, or at least with higher mass, were decommissioned than installed this year.

3.2. Prognosis of the Swedish Wind Power Development

How much wind power can be used in the Swedish energy system is a debated issue [65], however it is likely that at some point the system will become saturated. A study from Royal Institute of Technology (KTH), Stockholm, Sweden [66] shows that 30 TWh wind power should not have dramatic effects on the need for regulating power, and this is also the national goal for 2020 [67]. This converts into roughly 14.3 GW of installed capacity, which is assumed to be the saturation capacity in Sweden (see conversion method in Appendix G). The prognosis seen in Figure 3 has been generated by applying Equation (5) and fitting the variables to existing development.

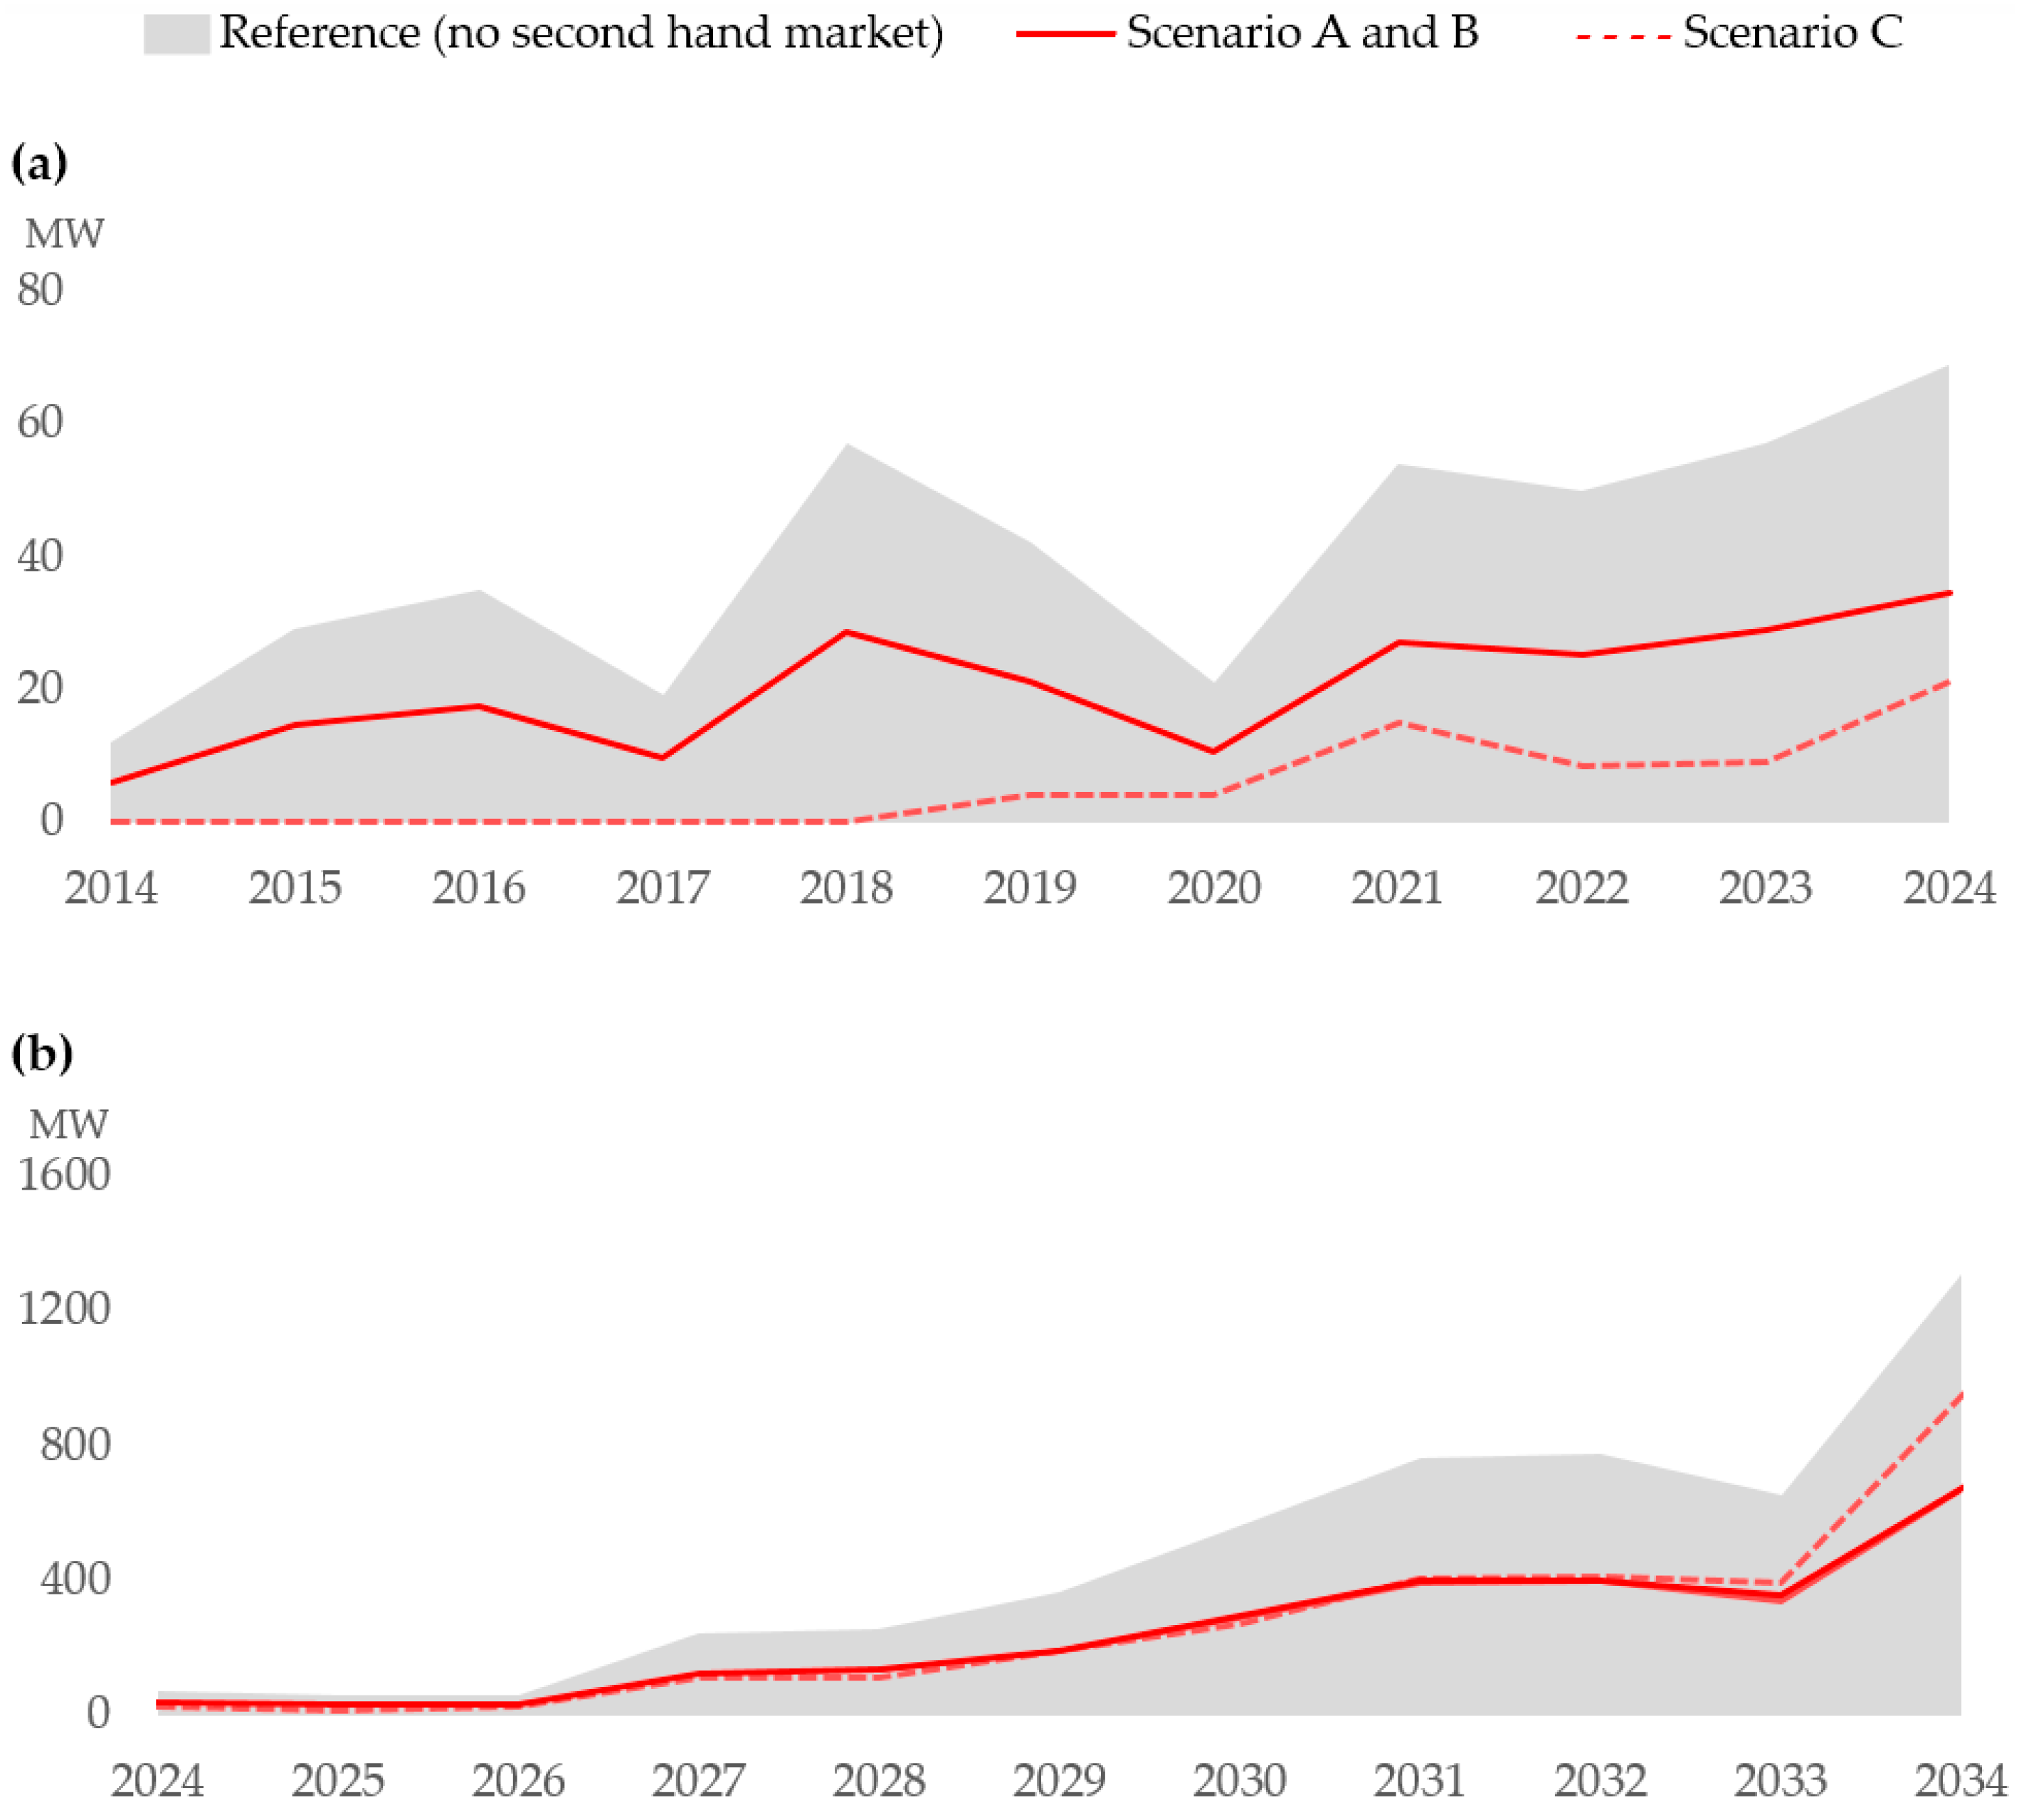
3.3. Mass of Replaced Components

Using the prognosis above as a baseline and combining it with Equations (6) and (7), the mass of all installed nacelles and rotors in Sweden each year have been calculated in line with Equation (8). These masses have then been converted into the mass of generators, rotors and gear boxes using the data presented in Appendix E. Combining this with the mean replacement rates of these components (Appendix E), gives an estimate of the total amount of material generated from replaced components each year, as shown in Figure 4.
From Figure 4 it can be observed that the amount of replaced parts will more than double in the future, compared to 2014, reaching a saturated value in 2028. The differentiation between generators, rotor blades and gear boxes is assumed to be constant.

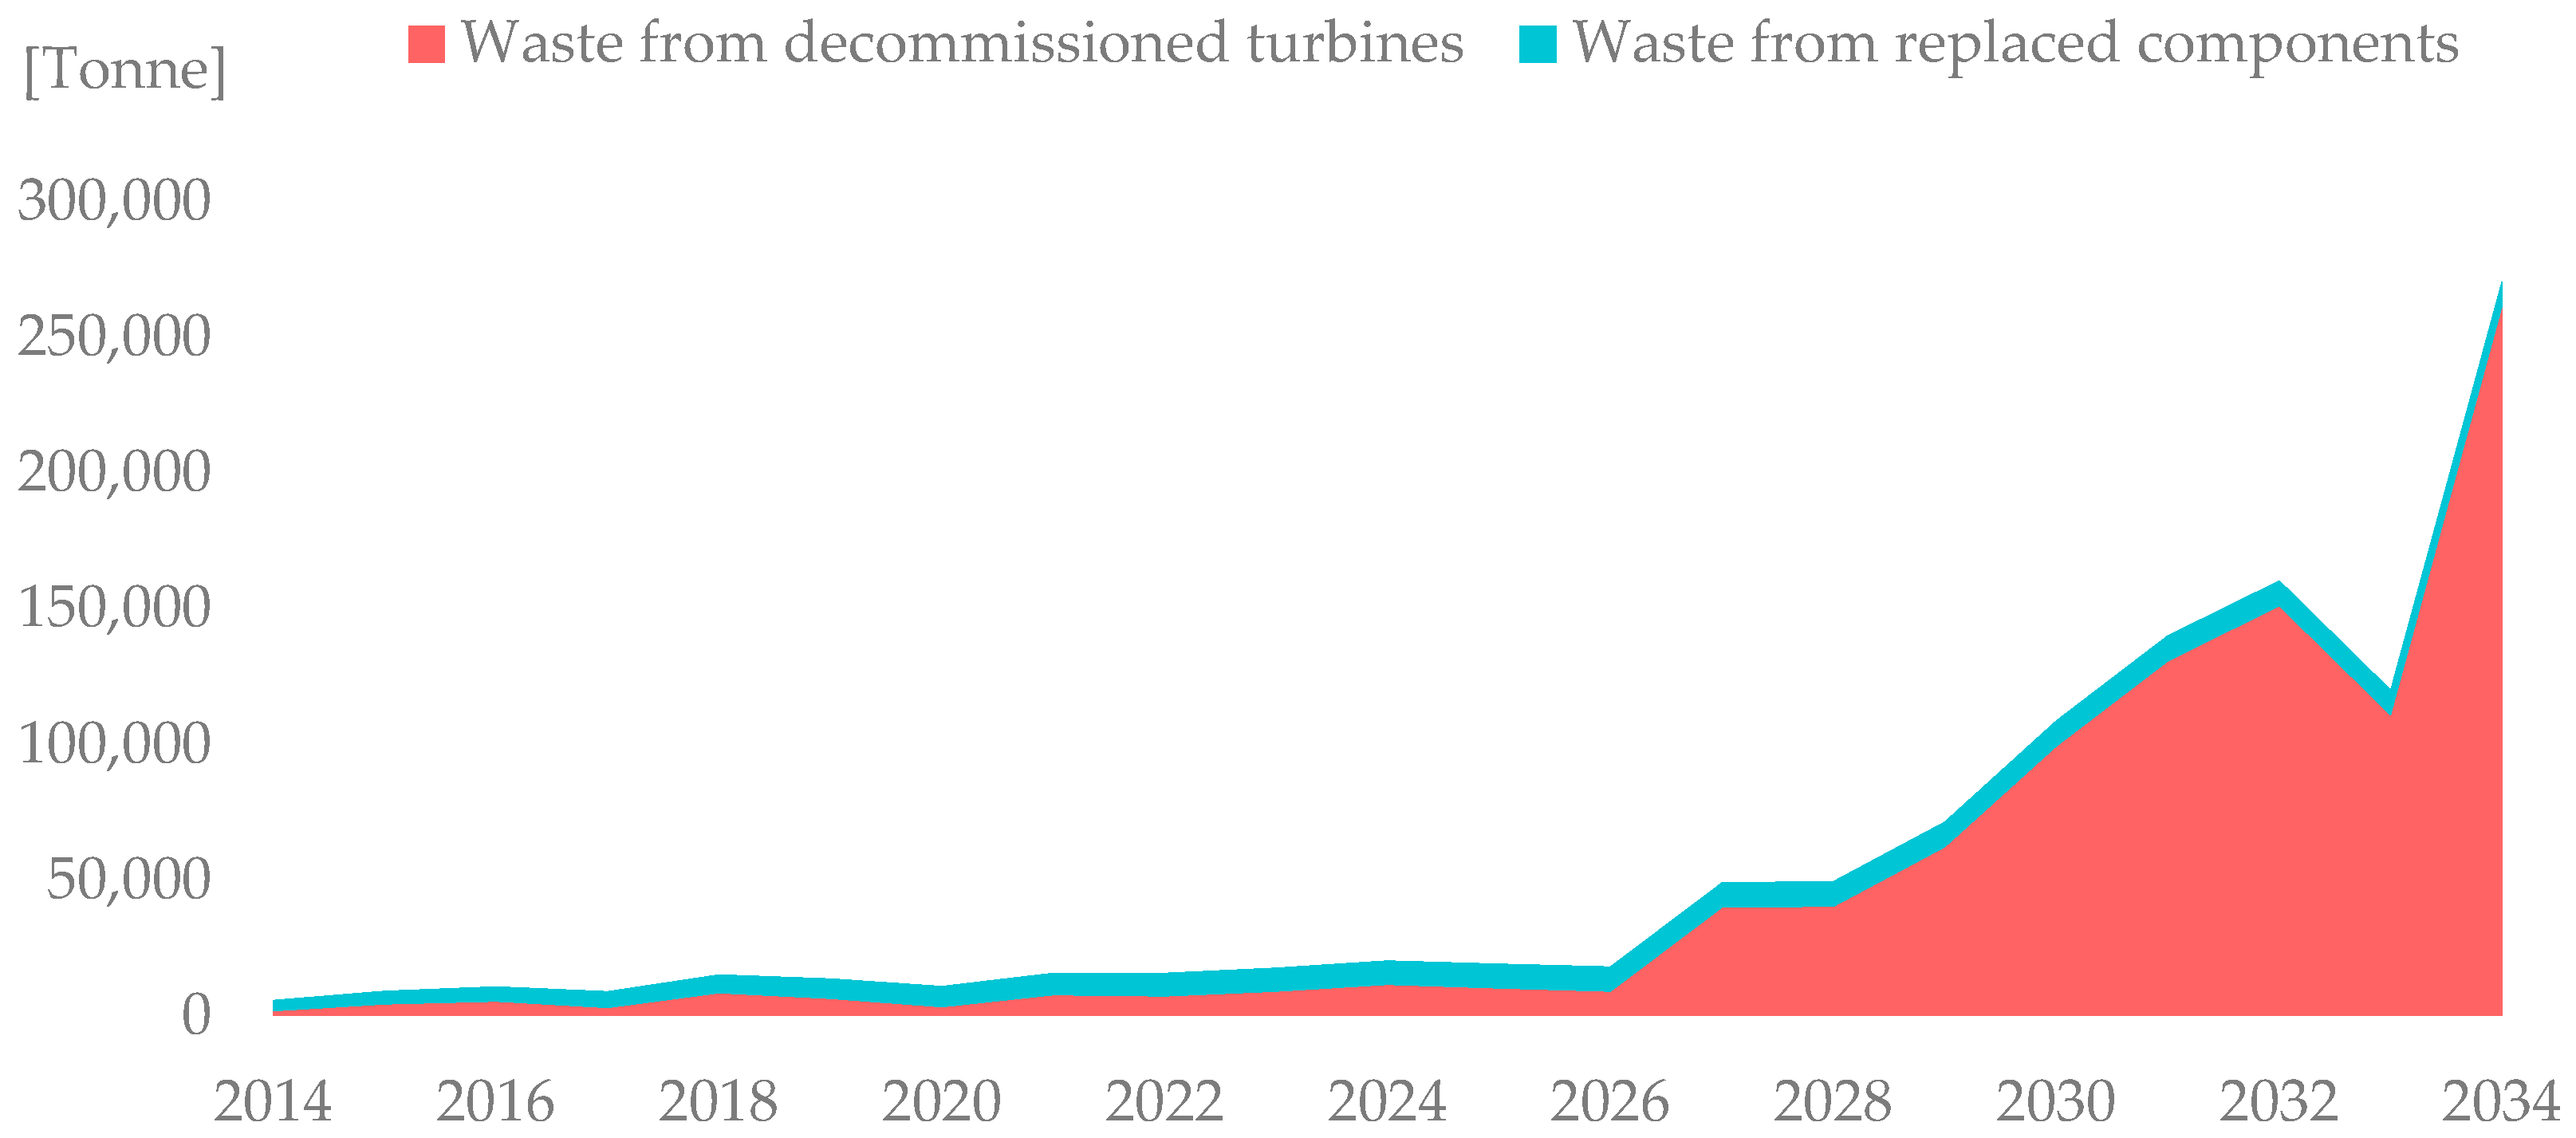
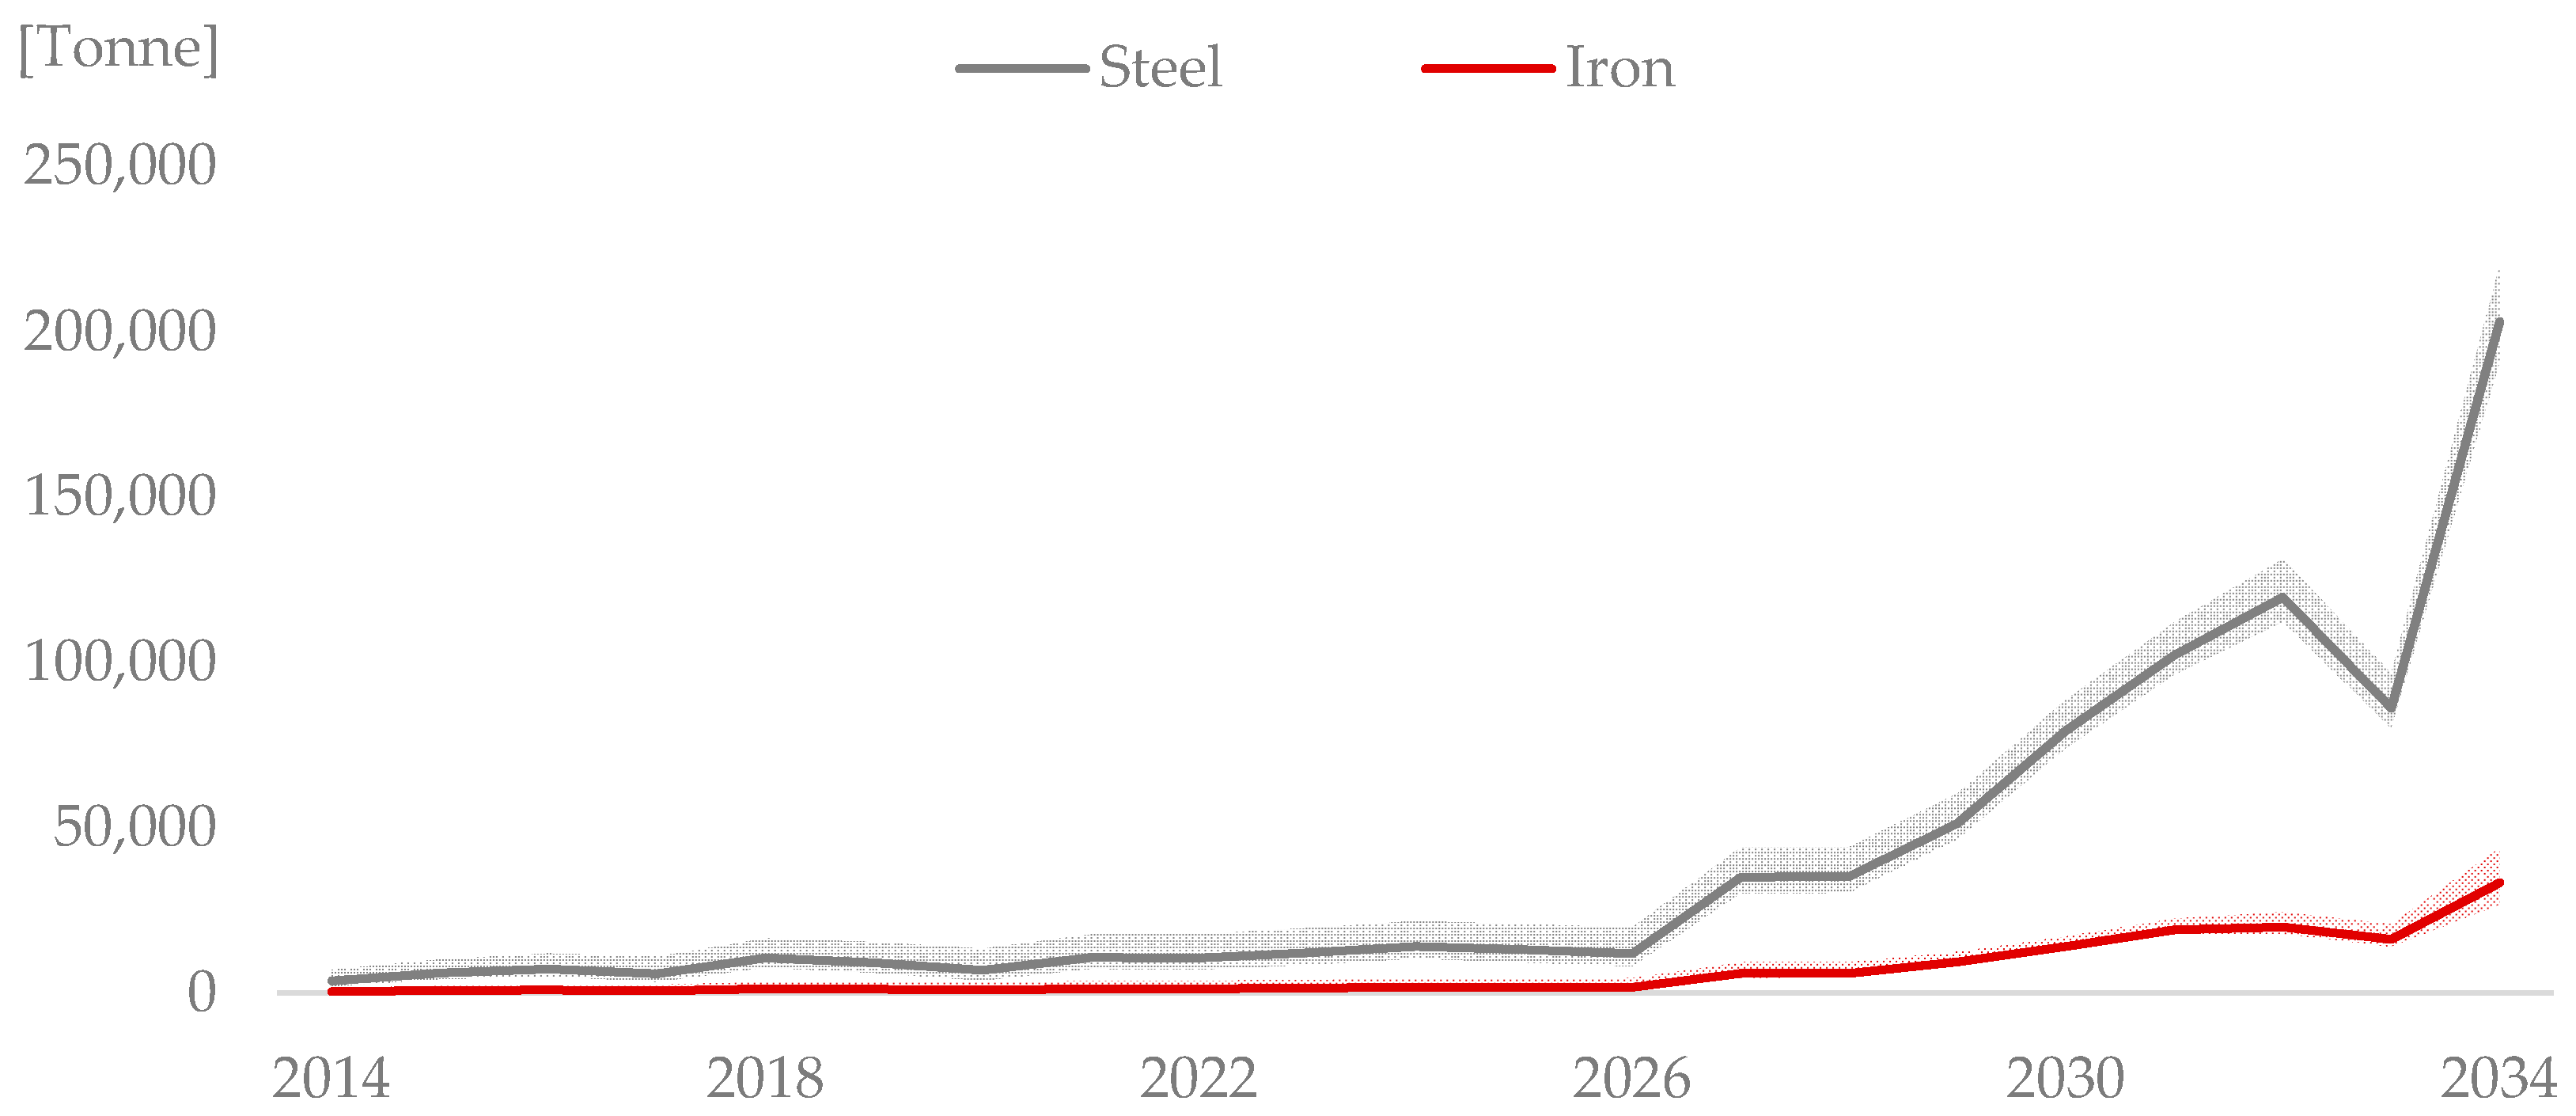
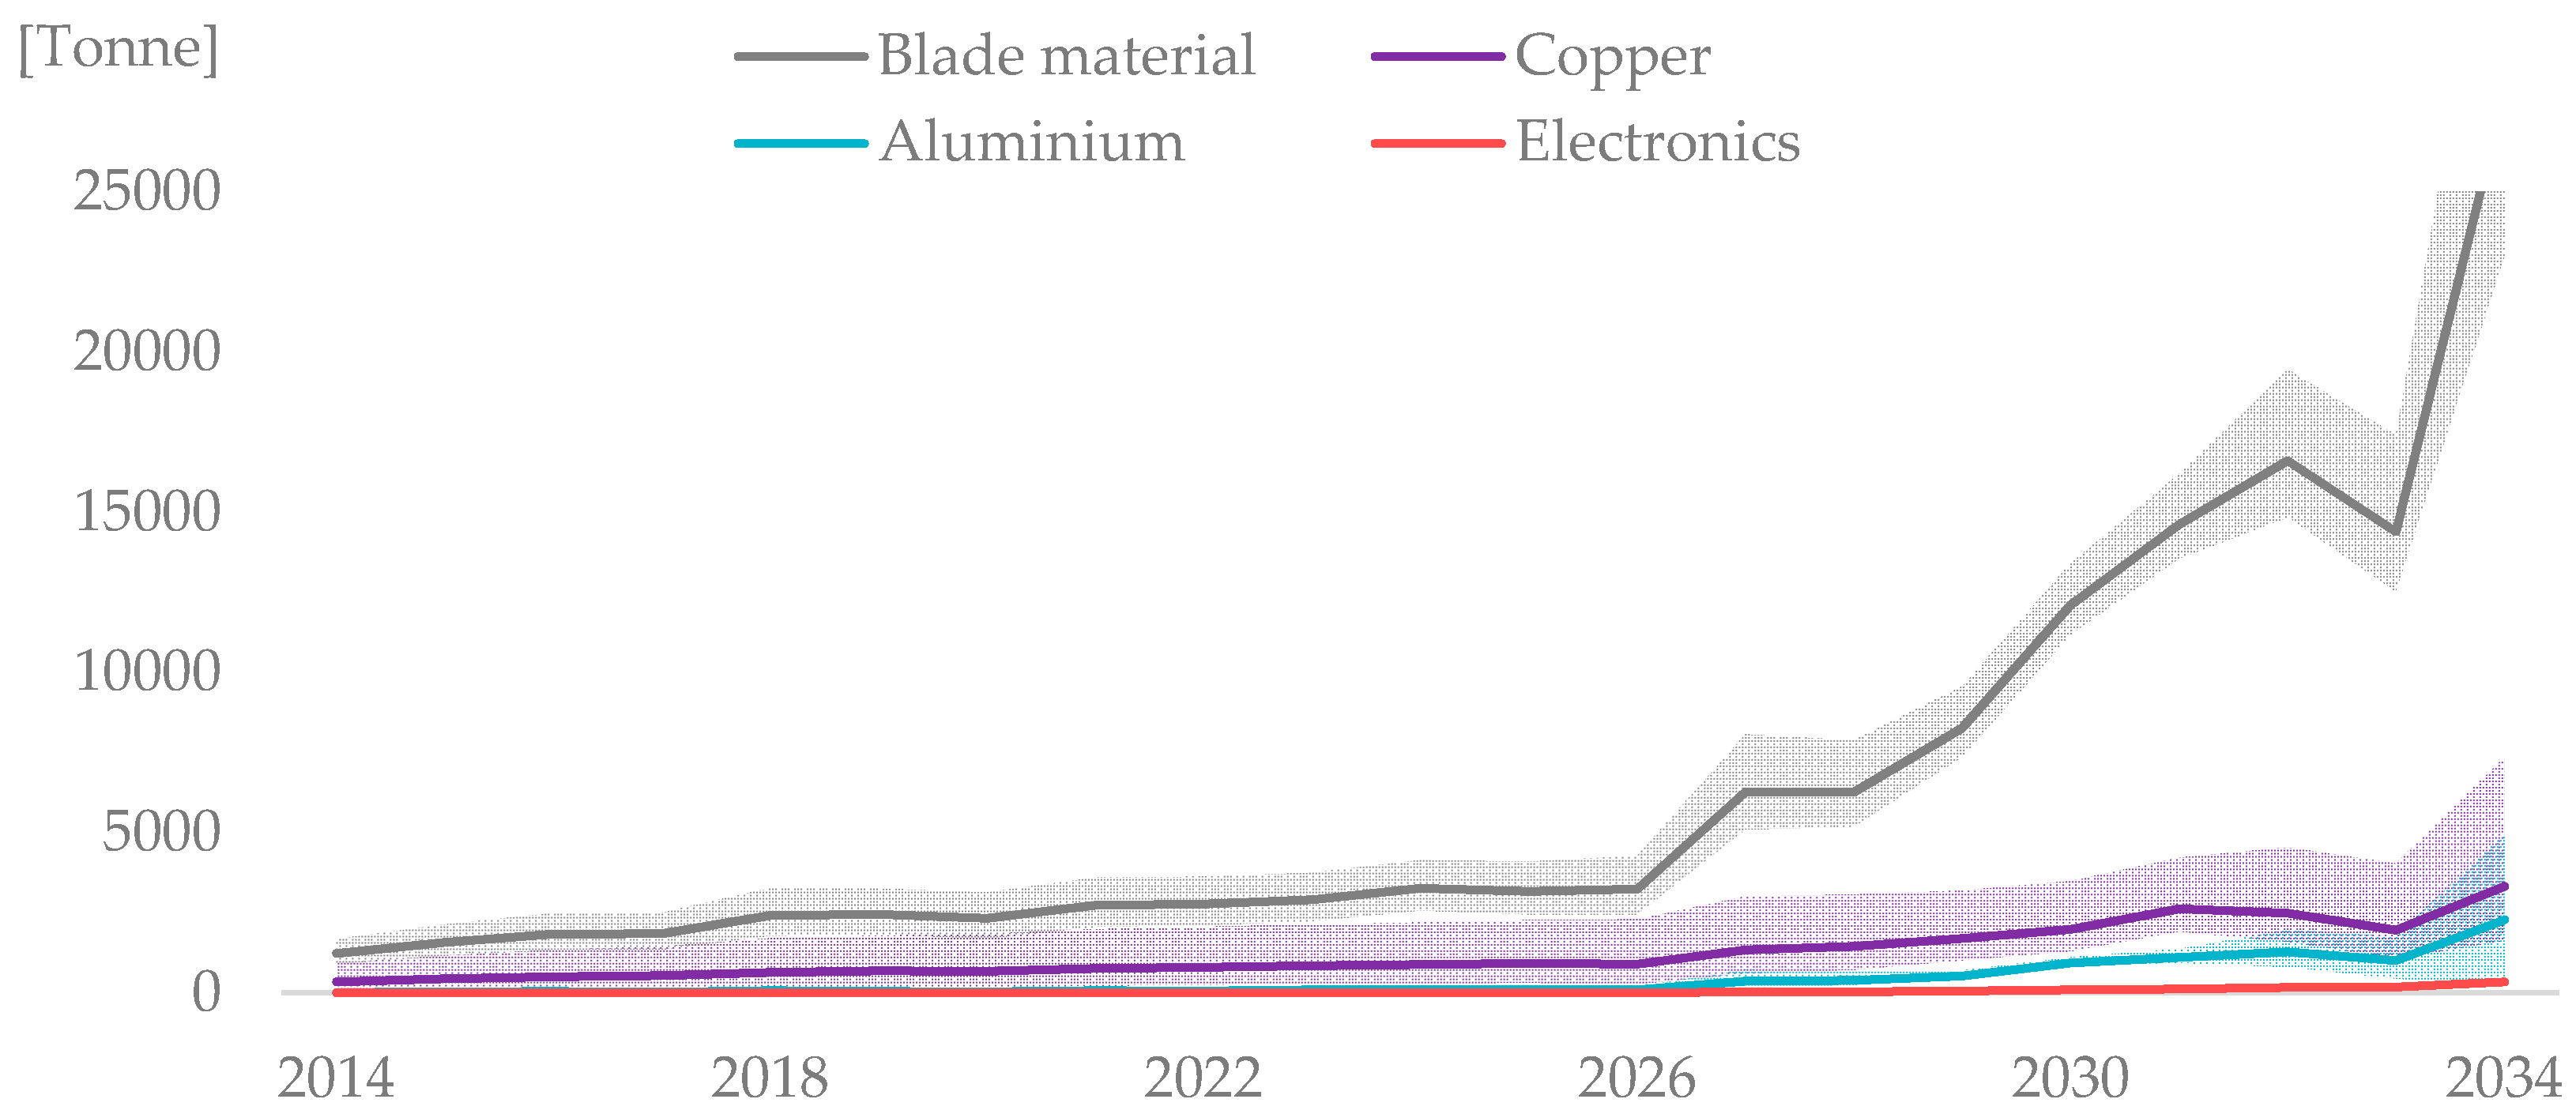
3.4. Total Amount of Waste Material

The total amount of waste from decommissioned turbines and replaced components is calculated through Equation (10) and shown in Figure 5.
Total amount of generated waste is estimated to increase almost linearly, with an average of 12% per year between 2014 and 2026, and then increase more rapidly at an average of 41% per year between 2026 and 2034. The trend has similarities with Figure 2 albeit with a 20 year delay (the sudden drop in 2013 in Figure 2 is reflected as a similar drop in 2033 above). As the market is supposed to become saturated in 2034 (Figure 3) waste amounts will continue to increase from 2034 to 2054. However, calculated amounts in a long term future are associated with high uncertainties while the figures have been set to display trends until 2034.

3.5. Estimated Waste Material Separated into Categories

Metals are categorised into steel, iron, copper and aluminium since these are the ones most commonly present. Steel corresponds to all forms of alloys, while iron refers to “pure” iron. All plastics and composite materials are summed up as blade material (although it is not only found in rotor blades). The reasoning behind this is that these materials are often either presented as glass reinforced plastics (GRP) [44] or separated as polymers, resins and fibres [45] in the given data, either way making it difficult to separate plastics and composites. Furthermore, these materials are often integrated with each other and it is therefore assumed they have to be treated by the same company. The final category is electronics which includes cables and electronic equipment found in the nacelle.
The material specifications shown in Appendix C and Appendix E have been used to separate the anonymous masses of components and turbines into the masses of material of each category. The estimated annual waste amount from the Swedish wind power industry for each material category is presented in Figure 6 and Figure 7.
The amount of blade material in wind power waste is expected to surpass the currently recycled amounts at the only available industrial scale recycling facility in 2026–2027. Currently, the only industrial scale recycling of blade material is performed by Zagons Logistik in Melbeck, Germany. They use the mechanical recycling approach and produce a material that works well as a filler in cement production. This material is then sent off to the Holcims cement plant Lägerdorf for further processing into a fully functional product. In 2012 the company reprocessed about 400–500 tonnes of material per month, i.e., 5000–6000 tonnes per year [60]. Further comparisons with waste treatment capacities in 2014 made for all categories are presented in Table 2.
Steel and iron waste from wind turbines is estimated to reach about 10%–20% of the current recycled amounts in Sweden within two decades. Aluminium and copper are not as prominently used, and will, based on these estimations, only reach around 4%–5% of the current recycled amounts, and the amount of electronics waste will likely reach less than 1% of the total recycled amount. Blade material is mostly made out of composite materials which are rarely recycled today, and the annually waste amounts produced are likely to quickly surpass the currently reprocessed amounts.

3.6. Re-Use Scenarios

The waste estimations presented above do not take into consideration the possible re-use of parts or turbines. Current data regarding the second hand market for these items in Sweden is poor. Three different scenarios have been selected to examine how generated waste amounts may differ from the estimated amounts.
(1) Scenario A
50% of all decommissioned turbines and their parts are sold for second hand use in Sweden. They have 15 years renewed lifetime and are fully decommissioned 35 years after installation.
(2) Scenario B
50% of all decommissioned turbines are sold for second hand use abroad. They are never seen as fully decommissioned as the waste material is generated outside Sweden.
(3) Scenario C
All small turbines (<1 MW), 50% of all medium sized (larger than 1 MW and smaller than 3 MW) turbines and 75% of all large turbines (>3 MW) are sold for second hand use. The re-used turbines are never seen as decommissioned in Sweden in this scenario, as they are assumed to be sent abroad.
The results from the three scenarios are shown in Figure 8 below. The grey area shows the total estimated decommissioned capacity each year without any re-use of turbines, i.e., the value used for mass estimations, while the red lines represent the different scenarios and shows the decommissioned capacity each year with second hand markets in place.
Both scenarios A and B would result in almost precisely 50% amount of waste produced in the next 20 years compared to the reference scenario (Figure 8a, year 2024), but after 35 years (year 2049, outside graph) the A and B scenarios would be slightly different. The small difference is related to the final decommissioning of second hand equipment used in Sweden. Scenario C would result in considerably lower waste amounts than predicted amounts in 2014–2024 (Figure 8a), but get closer to 75% of predicted amounts in the decade after (Figure 8b, year 2034) as increasingly large turbines are decommissioned in Sweden.

4. Discussion

Construction of a general method for quantification and characterisation of waste from decommissioned wind power plants applicable worldwide is a complicated task, mainly due to varying data availability. This study illustrates a method adapted to Swedish data bases, thereby also representing Swedish conditions. It shows that it is possible to make projections even if data are scarce. The method should be categorized as explorative being one of the first scientifically published. One of the advantages is that it builds on a national database, meaning that the results can be updated just as the database. Another advantage is that it is transparent in the sense that it can be replicated by others and adapted to available data. A big disadvantage is however the uncertainty, see Section 4.4. Several assumptions and simplifications have been made which have to be further scrutinized and dealt with more properly.

4.1. Future Waste Amounts in Sweden

The sudden increase in estimated annual waste material growth seen from 2026 and onward is due to the accelerated installation of turbines in Sweden around 2006. As shown when comparing the assumed average life time of 20 years with empiric data in Figure D1 (Appendix D) the predicted decommissions could likely be offset several years in either direction. Since the material is not immediately hazardous, short term storing should not be a large problem. This along with the fact that some decommissioning most likely can be postponed if necessary, the specific material amount each year is probably less interesting than the overall growth pattern and approximate the total amounts. These seem to be relatively on point, at least when comparing to the small data samples available.
Even though generated steel and iron scrap is estimated to reach large magnitudes relative to the current total recycling values, these materials are perhaps not the most problematic ones. This is because the recycling industry for the metals found in wind turbines is well developed and it can adapt to the expected gradual increase in annual waste amounts. Electronic waste could be slightly more critical as quantities of toxic material may be present, however the annual amount of electronic waste is estimated to be very low compared to the annual recycled amount also in 20 years. Further studies on the possible issues with toxic material from electronic components in wind turbines are encouraged as this is not covered in this study.

4.2. Recycling Capacity

The amount of blade material waste generated annually is estimated to surpass the yearly reprocessed amounts around 2028. Even if the needed capacity were in place (completely disregarding their own need to process waste), the location (Melbeck) is more than 500 km from most Swedish wind farms. Capacity building is therefore of utmost importance, either by expanding existing facilities or by locating new recycling facilities at an optimum distance from current and future locations for wind power plants. Another option is the introduction of producer responsibility, meaning that the plants are rented from the manufacturers who will take total or partial responsibility for design, construction, assembly, maintenance and take-back. Such a development could have a positive effect on life lengths, design for disassembly and such. However, while developing “recycling-ready” wind power plants, methods for disassembly of current power plants have to be improved to reduce recycling costs. Long series of turbine models prepares the ground for more automatization and more accurate methods for diagnosis of tear and wear could possibly mean that recycling to some extent would be characterised as re-use. Detecting components which contain hazardous substances is of course also vital and should hopefully also work as incentive to reduce the use of such materials. Such a development is necessary in order to move the wind power industry in a more sustainable direction towards a circular economy.

4.3. Climbing the Waste Hierarchy—from Recycling to Re-Use by Second Hand Markets

A well-functioning second hand market for components, parts and whole turbines could be one solution to decrease waste amounts without changing the installed capacity of wind power. Early decommissioned small turbines have so far been sold mainly to domestic customers, and the amount of waste generated from these is therefore delayed as long as the turbines are kept in operation. Re-use scenarios A and B show that reusing turbines is a way to reduce or postpone waste amounts in the coming decades, even if they are re-used in Sweden with lower life time than new turbines. If sold abroad, final decommissioning and waste treatment is expected to take place outside Sweden, which has been neglected in this study.
As Swedish electricity certificates are given only for the first 15 years of operation, and will not be renewed when the turbine is moved for second hand use [34], they may be a hindrance for a second hand market to develop, especially when it comes to larger turbines. Re-used turbines could be seen as a riskier investment to begin with, and the loss of electricity certificates may push investors towards new turbines.
Another aspect difficult to predict is how the market would react to large amounts of turbines that would be decommissioned simultaneously. It could potentially drop the prices in a way that there is higher scrap value in the material than in the reusable components. The future development of second hand markets is one of the biggest factors of uncertainty in this study, and further studies on this subject is encouraged.
The longer each turbine (as well as its parts and components) is in operation, the lower the amounts of waste in the near future. As most of the turbines that will be decommissioned during the two coming decades are already installed, using other materials and more durable components is not a solution to the short term problems. Having a second hand market as a “buffer”, extending turbine lifetime and keeping a lot of the material in use for another lifecycle, is however one way to postpone some of the generated waste until improved waste management is in place.

4.4. Uncertainties

The estimated amount of material from replaced components is more unreliable than estimations based on installed turbines, mainly due to the uncertainty of future wind power development. It is impossible to exactly predict what capacity will be reached before the market is saturated, and the rate of installations may be different from the suggested development. The forecast made is based on previous development rates in Germany and USA in combination with national production goals proposed by the government. Low electricity prices, public opposition and other factors may of course lead to a slower development rate than what is suggested. Furthermore, the number of replaced parts in the Swedish market, and for newer turbines, might not be within the same interval as the historic data, and the material in the components will likely change in future turbines.
Precise data for each installed wind power plant is not available in the data bases used, and hence some information has to be extrapolated and factored to enable projections. Copper is mainly found in the generator [23], a component that is expected to be replaced in some turbines, and therefore the annual amount of waste copper is largely based on replaced components leading to very uncertain predictions. This is also reflected in the resulting chart, as the range between minimum and maximum values is wide. Another uncertain parameter in the calculations relates to calculation of steel mass which is based on a small sample size. Similar simplifications will likely be required in other regions, which may influence the accuracy of the results.

4.5. Future Studies

The issue with rare earth metals found in new models using permanent magnets, which are hazardous to produce and complicated to recycle [24] has not been addressed in this study since the technology is relatively new and the future development hard to predict. However, it would be good to have in future studies. A proper investigation of the waste amounts of these materials is recommended to make sure it can be properly managed.
Another important material to study further is concrete. It has been completely left out of this study, but is found in very large amounts in the turbine foundation. A method to calculate the foundation mass based on location or an empirical study is needed to estimate the concrete amounts, as well as research on how often the material is left on location instead of removed.
If no adequate method of fully recycling composite waste in rotor blades is developed in the more distant future, another way to reduce the waste would be to use another material with better recyclability. As an example, there are ongoing development projects within the steel industry with materials that potentially could be more easily recycled than composites [70]. However, further research is encouraged to be able to assess the applicability in the wind power industry.
Further studies regarding the possible impact of increasing use of new innovations, such as using wood as material for the towers [71,72,73] are welcomed. Replacing metals (which have a high environmental impact when produced) with renewable materials such as wood (which can be re-used, recycled and energy recover from it) would not only impact the waste from wind power, but also the environmental impact from production and end-of-life activities.

5. Conclusions

A more or less generally applicable calculation method for estimation of future waste amounts from wind turbines on a national level has been developed and described. Waste materials that will be generated from decommissioned wind turbines in Sweden during the coming decades have been quantified by using this method and the results have been discussed in relation to several aspects.
The materials commonly present in wind turbines, and by extension in any generated waste, are steel, iron, aluminium, copper, electronic components and blade material such as glass or carbon reinforced plastics and polyvinyl chloride (PVC). The annual waste amounts from wind power in Sweden by 2034 is estimated to reach 240,000 tonnes steel and iron (16% of currently recycled amounts), 3300 tonnes copper (5%), 2300 tonnes aluminium (4%), and 340 tonnes electronics (<1%). Blade material waste generated annually is estimated to be 28,000 tonnes in 2034, more than four times the currently reprocessed amounts at the only full scale reprocessing industry for these materials available today. The amount of annual waste for all material is estimated to increase at around 12% per year until around 2026, and then more than three faster during the decade after that due to a quick acceleration in installed turbines around 2006.
The study shows that significant waste amounts will arise in the future. Planning of future waste management concerns: (1) building the treatment capacity (results show current treatment capacity to be insufficient) and (2) development of dismantling methods where valuable material resources can be recirculated and hazardous waste can be reduced or avoided.
As all major types of metal present in wind turbines are already recycled on a large scale, they are assumed to be less problematic than the most commonly used blade materials for which no industrial scale recycling alternative is currently available. Development of such an industry is important to be able to handle these materials in a sustainable way. Furthermore, switching to a more easily recyclable material could be part of a long term solution.
All waste estimations are based on the assumption that no turbines or parts are re-used after decommissioning, which is unlikely. Three scenarios explored show that a well-functioning second hand market could be an efficient way to reduce the amount of wind power waste in the short term, although more extensive research on market mechanisms as well as environmental impact is needed. Extending the service life length of different parts is also crucial. To reduce future waste problems from wind power and make it into an even more clean energy alternative, a waste management perspective has to be considered already in the development phase of new wind turbines, including the selection of materials.

Acknowledgments

We gratefully acknowledge the University of Gävle for the funding of this study.

Author Contributions

Niklas Andersen performed the original research where Ola Eriksson and Karl Hillman provided guidance and valuable comments. The paper was initiated by Ola Eriksson and mainly written by Niklas Andersen and Ola Eriksson. Karl Hillman and Marita Wallhagen contributed in writing up the paper. All authors participated in the peer-review process.

Conflicts of Interest

The authors declare no conflict of interest.

Appendix A. Material Specification of Specific Models

LCAs for some of the most common wind turbines used in Sweden has been analysed to extract the data presented in Table A1.
Table A1. Material amount for specific turbines common in Sweden collected from various life cycle assessments (LCAs) [44,45,46,47,48,49].
ModelHeightSteelIron 1Al. 2CopperBM 3El. 4
mTonneTonneTonneTonneTonneTonne
Enercon
E4044599.30.22.71.70.0
E445572100.22.87.00.0
E6698247210.29.3180.1
E70100359466.910230.1
E82107246731.311290.2
E1121206421000.944680.6
Vestas
V525076111.21.28.00.1
V6667168262.93.0190.3
V8078236211.72.8250.3
V8278186293.12.9300.3
V9080204404.21.7370.4
V11284245663.44.9491.0
Notes: 1 Iron or cast iron; 2 Aluminium; 3 Blade material—A combination of plastics glass reinforced plastics (GRP), carbon reinforced plastics (CRP) and core materials; 4 Electronics and cables.

Appendix B. Turbine Parts’ Mass vs. Rotor Diameter

Figure B1 and Figure B2 show graphic representations of the equation presented in the study [56] along with the standard error also presented. Also plotted in the charts is the mass from turbines observed during research [44,45,46,47,48,58,59,60]. The plotted turbines vary between charts as not all data are available for each turbine.
To better fit the growth of DDSG nacelles, separate intercept- and scaling factors have been generated by fitting the curve to nacelle masses of known turbines.
Figure B1. Rotor mass vs. rotor diameter. The grey line represents the output from Equation (2), and the grey and red markers show actual rotor masses gathered from LCA’s.
Energies 09 00999 g009
Figure B2. Nacelle mass vs. rotor diameter. The grey line represents the output from Equation (2) (using the values in the mentioned study), and the grey and red markers show actual nacelle masses gathered from LCA’s. The red line shows the output from Equation (2) when using the least square method to fit the variables to turbines of DDSG design.
Energies 09 00999 g010

Appendix C. Material Specification for Generic Turbines

Eight turbines [44,45,46,47,48,49], four with DFIG design and four with DDSG design, have been examined to find the typical fractions of steel, iron, aluminium, copper, blade material and electronics for each defined part. The resulting values are shown in Table C1.
Table C1. Material specification per turbine part shown as mean percentage [44,45,46,47,48,49]. Smallest to largest percentages found are shown in parenthesis.
DFIGRotorTowerNacelle
Steel7% (0–14)98% (96–100)49% (41–54)
Iron27% (13–41)-40% (36–47)
Aluminium-1% (0–2)1% (0–3)
Copper-0% (0–1)4% (2–8)
Blade material66% (58–87)1% (0–2)6% (5–8)
Electronics--0.6% (-)
DDSGRotorTowerNacelle
Steel5% (0–10)98% (95–100)48% (39–56)
Iron--40% (30–53)
Aluminium-0% (0–2)1% (-)
Copper-0% (0–1)10% (7–13)
Blade material94% (89–100)1% (0–2)2% (0–5)
Electronics--0.13% (0.1–0.17)

Appendix D. Prognosis of Decommissioned Turbines

The installed and decommissioned number of plants in Denmark, Germany and Sweden can be seen in Figure D1 [68,74,75,76,77,78,79], along with a prognosis assuming that every plant is decommissioned 20 years after its installation date. i.e., the estimated number of decommissioned plants in 2014 is the same as the number of installed plants in 1994. Apart from the peak in 2002, a result of a repowering programme running between 2001 and 2003 [80], the actual fallout follows the predicted trend relatively well in Denmark. In Germany the number of decommissioning is growing in the expected pattern, even though the development is one or two years later than the prognosis. The data for Sweden so far is scarce, and attempting to find a pattern from such a small sample could be misleading. The initial substantial decommissioning projects do however appear at the estimated time (around 20 years after market development starts) and magnitude.
Figure D1. Actual installed and decommissioned wind turbines compared to expected number of decommissioning’s assuming an average of 20 years’ life time in: (a) Denmark; (b) Germany; and (c) Sweden [70,74,75,76,77,78,79]. Note the difference in magnitude between charts, not allowing for comparison between countries.
Energies 09 00999 g011
Apart from the peak in 2002, a result of a repowering programme running between 2001 and 2003 [80], the real scenario follows the predicted trend relatively well in Denmark. In Germany, the number of decommissioning is growing in the expected pattern, even though the development is one or two years later than the prognosis. The data for Sweden so far is scarce, and attempting to find a pattern from such a small sample could be misleading. The first larger decommissioning projects do however appear at the estimated time (around 20 years after market development starts) and magnitude.

Appendix E. Component Properties

The percentage of the nacelle mass deriving from the generator and the gear box as well as the percentage of the rotor mass deriving from rotor blades have been estimated by using the values presented in three different LCA’s [47,50,51] and assuming the percentages are representative for all turbines. Material fractions in these different components have also been taken from these studies, and both are presented in Table E1.
Two empirical studies on different databases from Germany [53] and USA [54] each present mean replacement rate for gear boxes, generators and rotor blades which can be used as a frame of reference for what fraction of all these installed components that has to be replaced each year. They are both presented in Table E2 along with the mean between the two.
Table E1. Mean material specification for commonly replaced components; Generator, gear box and rotor blades, as well as each component’s mass percentage of main part. [47,50,51] Smallest to largest percentages found are shown in parenthesis.
Wind Power Plant PartsPercent
Generator
Percentage of nacelle mass30% (16–44)
 Steel79% (68–90)
 Copper21% (10–32)
Gear box
Percentage of nacelle mass22% (14–31)
 Steel75% (50–100)
 Iron25% (0–50)
Rotor blades
Percentage of rotor mass71% (58–84)
 Blade material95% (91–100)
 Steel3% (0–9)
 Aluminium0.3% (0–1)
Table E2. Mean component replacement per year and wind turbine, based on empirical data from Germany and USA [53,54]. The means between these markets are also shown.
MarketGear boxGeneratorRotor Blades
USA 2001–20095.0%3.5%2.0%
Germany 1989–20061.2%2.2%2.4%
Mean3.1%2.9%2.2%

Appendix F. Scaling up VindStat Data

Not all of the installed wind turbines in Sweden are included in VindStat since registry on the data base is not mandatory. A comparison between the actual installed power (according to the Swedish Energy Agency and the Swedish Wind Energy Association [2,3]) and the installed power registered in VindStat [42] (see Figure F1) shows that there is a significant gap between the two. There seems to be a delay of a few years before owners report their plants, which results in this gap growing larger for more recent years. As can be seen in Figure F1b, however, the mean power of each installed wind turbine is very similar for both data bases, indicating that the turbines that are present in VindStat is a decent representation of the average types of turbines installed that year.
Figure F1. VindStat data base compared to actual installed power: (a) The annually installed wind power in Sweden in 1982–2014; and (b) The mean power per installed turbine in 1982–2014. The VindStat data base is compared to the complete data presented by the Swedish Energy Agency and the Swedish Wind Energy Association [2,3].
Energies 09 00999 g012
To cover the gaps in available data, the difference between all turbines and the ones available in VindStat have been used to scale up the calculated waste amounts according to the according to the following equation:
m m , i n s , t o t , y e a r = m m , i n s , t o t , y e a r , V S x c o v e r a g e
where:
  • mm,ins,tot,year = The total mass of a specific material in installed turbines a specific year (kg)
  • mm,ins,tot,year,VS = The total mass of a specific material in turbines present in VindStat (kg)
  • xcoverage = VindStat coverage of installed power compared to other statistics (%)
The data for the ten first available years (1982–1992) is very inconsistent and derives from few data points, and the compensation will therefore only be applied from 1992 and onwards.

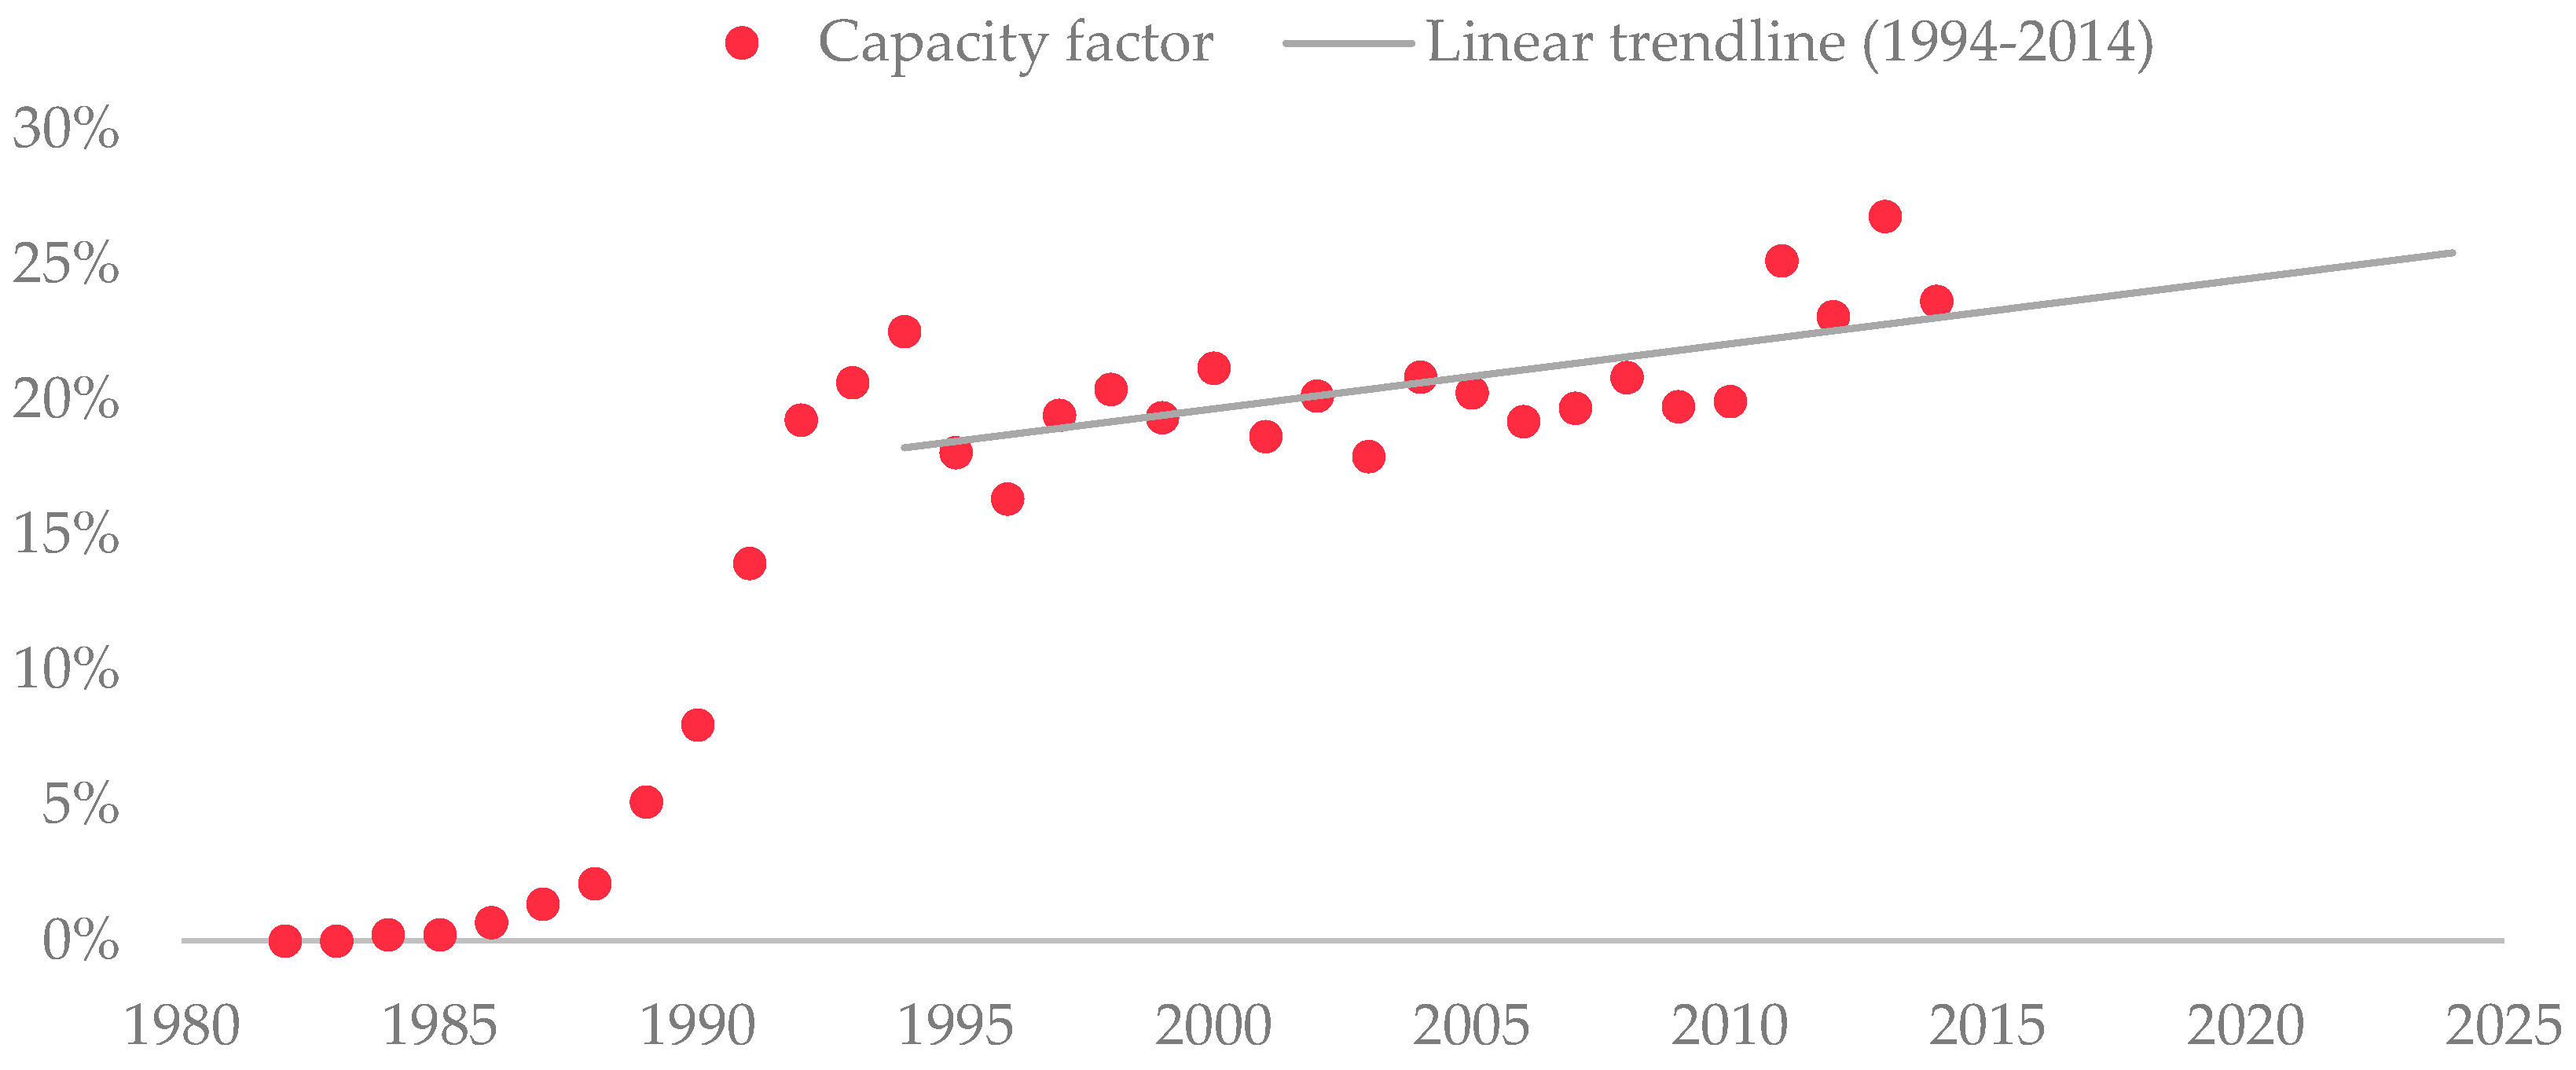
Appendix G. Converting Generated Energy to Installed Power

To convert an amount of generated wind power energy into installed power, the capacity factor (CF) at which this electricity is generated has to be known. The CF describes the actual output as part of maximum possible output over a period of time [81] (a year in this case), and is calculated according to this equation:
C F = E 365 × 24 × P
where:
  • E = Generated energy in a year (Wh)
  • P = Total installed power that year (W)
CF in the entire Swedish wind power sector has been calculated according to Equation (G1) for 1982–2014 [2,3], and the result is presented in Figure G1.
In Figure G1, a trend line has been added based on data over the latest 20 years (as the technology seems to have stabilized somewhat in this period), which is described by this equation:
y = 0.0024 x 4.61
where:
  • y = Capacity factor (%)
  • x = Year
This gives a capacity factor around 24% in 2020. Combining this with Equation (G1) converts the goal of 30 TWh into installed capacity at around 14.3 GW.
Figure G1. Capacity factor in Sweden 1982–2014 [2,3]. The amount of generated electricity from wind power per year divided with the maximum possible output if all turbines run at full power for the entire year. The trend line is based on data in 1994–2014.
Energies 09 00999 g013

References

  1. Global Wind Energy Council. Global Wind Statistics. Available online: www.gwec.net/wp-content/.../vip/GWEC-PRstats-2015_LR.pdf (accessed on 25 August 2016).
  2. Energimyndigheten. Vindkraftstatistik 2014—Tabeller. February 2015. Available online: https://www.energimyndigheten.se/Global/Press/Pressmeddelanden/Vindkraftstatistik%202014.pdf (accessed on 7 July 2015).
  3. Svensk Vindenergi. Vindkraftstatistik och prognos: Kvartal 4 2014. 13 February 2015. Available online: http://www.vindkraftsbranschen.se/wp-content/uploads/2015/02/Statistik-vindkraft-kvartal-4-2014-20150213.pdf (accessed on 7 July 2015).
  4. Dolan, S.L.; Heath, G.A. Life cycle greenhouse gas emissions of utility-scale wind power. J. Ind. Ecol. 2012, 16, S136–S154. [Google Scholar] [CrossRef]
  5. Guezuraga, B.; Zauner, R.; Pölz, W. Life cycle assessment of two different 2 MW class wind turbines. Renew. Energy 2012, 37, 37–44. [Google Scholar] [CrossRef]
  6. Cherrington, R.; Goodship, V.; Meredith, J.; Wood, B.M.; Coles, S.R.; Vuillaume, A.; Feito-Boirac, A.; Spee, F.; Kirwan, K. Producer responsibility: Defining the incentive for recycling composite wind turbine blades in Europe. Energy Policy 2012, 47, 13–21. [Google Scholar] [CrossRef]
  7. Hossein Giahi, M.; Jafarian Dehkordi, A. Investigating the influence of dimensional scaling on aerodynamic characteristics of wind turbine using CFD simulation. Renew. Energy 2016, 97, 162–168. [Google Scholar] [CrossRef]
  8. Ashuri, T.; Zaaijer, M.B.; Martins, J.R.R.A.; Zhang, J. Multidisciplinary design optimization of large wind turbines—Technical, economic, and design challenges. Energy Convers. Manag. 2016, 123, 56–70. [Google Scholar] [CrossRef]
  9. Ahmadi-Baloutaki, M.; Carriveau, R.; Ting, D.S.K. A wind tunnel study on the aerodynamic interaction of vertical axis wind turbines in array configurations. Renew. Energy 2016, 96, 904–913. [Google Scholar] [CrossRef]
  10. Shaheen, M.; Abdallah, S. Development of efficient vertical axis wind turbine clustered farms. Renew. Sustain. Energy Rev. 2016, 63, 237–244. [Google Scholar] [CrossRef]
  11. Jalali, L.; Bigelow, P.; McColl, S.; Majowicz, S.; Gohari, M.; Waterhouse, R. Changes in quality of life and perceptions of general health before and after operation of wind turbines. Environ. Pollut. 2016, in press. [Google Scholar] [CrossRef] [PubMed]
  12. Blanes-Vidal, V.; Schwartz, J. Wind turbines and idiopathic symptoms: The confounding effect of concurrent environmental exposures. Neurotoxicol. Teratol. 2016, 55, 50–57. [Google Scholar] [CrossRef] [PubMed]
  13. Jalali, L.; Nezhad-Ahmadi, M.-R.; Gohari, M.; Bigelow, P.; McColl, S. The impact of psychological factors on self-reported sleep disturbance among people living in the vicinity of wind turbines. Environ. Res. 2016, 148, 401–410. [Google Scholar] [CrossRef] [PubMed]
  14. Effiom, S.O.; Nwankwojike, B.N.; Abam, F.I. Economic cost evaluation on the viability of offshore wind turbine farms in Nigeria. Energy Rep. 2016, 2, 48–53. [Google Scholar] [CrossRef]
  15. Sarker, B.R.; Ibn Faiz, T. Minimizing maintenance cost for offshore wind turbines following multi-level opportunistic preventive strategy. Renew. Energy 2016, 85, 104–113. [Google Scholar] [CrossRef]
  16. Verdejo, H.; Escudero, W.; Kliemann, W.; Awerkin, A.; Becker, C.; Vargas, L. Impact of wind power generation on a large scale power system using stochastic linear stability. Appl. Math. Model. 2016, 40, 7977–7987. [Google Scholar] [CrossRef]
  17. Vasilj, J.; Sarajcev, P.; Jakus, D. Estimating future balancing power requirements in wind–PV power system. Renew. Energy 2016, 99, 369–378. [Google Scholar] [CrossRef]
  18. Da Rosa, W.M.; Rossoni, P.; Teixeira, J.C.; Belati, E.A. Insertion of wind generators in electrical power systems aimed at active losses reduction using sensitivity analysis. Int. J. Electr. Power Energy Syst. 2016, 80, 306–311. [Google Scholar] [CrossRef]
  19. Shazib Uddin, M.; Kumar, S. Energy, emissions and environmental impact analysis of wind turbine using life cycle assessment technique. J. Clean. Prod. 2014, 69, 153–164. [Google Scholar] [CrossRef]
  20. Ji, S.; Chen, B. LCA-based carbon footprint of a typical wind farm in china. Energy Procedia 2016, 88, 250–256. [Google Scholar] [CrossRef]
  21. Zhong, Z.W.; Song, B.; Loh, P.E. LCAs of a polycrystalline photovoltaic module and a wind turbine. Renew. Energy 2011, 36, 2227–2237. [Google Scholar] [CrossRef]
  22. Vargas, A.V.; Zenón, E.; Oswald, U.; Islas, J.M.; Güereca, L.P.; Manzini, F.L. Life cycle assessment: A case study of two wind turbines used in Mexico. Appl. Ther. Eng. 2015, 75, 1210–1216. [Google Scholar] [CrossRef]
  23. Wang, Y.; Sun, T. Life cycle assessment of CO2 emissions from wind power plants: Methodology and case studies. Renew. Energy 2012, 43, 30–36. [Google Scholar] [CrossRef]
  24. Bonou, A.; Laurent, A.; Olsen, S.I. Life cycle assessment of onshore and offshore wind energy-from theory to application. Appl. Energy 2016, 180, 327–337. [Google Scholar] [CrossRef]
  25. Demir, N.; Taşkın, A. Life cycle assessment of wind turbines in Pınarbaşı-Kayseri. J. Clean. Prod. 2013, 54, 253–263. [Google Scholar] [CrossRef]
  26. Ozoemena, M.; Hasan, R.; Cheung, W.M. Analysis of technology improvement opportunities for a 1.5 MW wind turbine using a hybrid stochastic approach in life cycle assessment. Renew. Energy 2016, 93, 369–382. [Google Scholar] [CrossRef]
  27. Martínez, E.; Jiménez, E.; Blanco, J.; Sanz, F. LCA sensitivity analysis of a multi-megawatt wind turbine. Appl. Energy 2010, 87, 2293–2303. [Google Scholar] [CrossRef]
  28. Ardente, F.; Beccali, M.; Cellura, M.; Brano, V.L. Energy performances and life cycle assessment of an Italian wind farm. Renew. Sustain. Energy Rev. 2008, 12, 200–217. [Google Scholar] [CrossRef]
  29. Crawford, R.H. Life cycle energy and greenhouse emissions analysis of wind turbines and the effect of size on energy yield. Renew. Sustain. Energy Rev. 2009, 13, 2653–2660. [Google Scholar] [CrossRef]
  30. Oebels, K.B.; Pacca, S. Life cycle assessment of an onshore wind farm located at the northeastern coast of Brazil. Renew. Energy 2013, 53, 60–70. [Google Scholar] [CrossRef]
  31. Tremeac, B.; Meunier, F. Life cycle analysis of 4.5 MW and 250 W wind turbines. Renew. Sustain. Energy Rev. 2009, 13, 2104–2110. [Google Scholar] [CrossRef]
  32. Kabir, M.R.; Rooke, B.; Dassanayake, G.D.M.; Fleck, B.A. Comparative life cycle energy, emission, and economic analysis of 100 kW nameplate wind power generation. Renew. Energy 2012, 37, 133–141. [Google Scholar] [CrossRef]
  33. Lenzen, M.; Munksgaard, J. Energy and CO2 life-cycle analyses of wind turbines-review and applications. Renew. Energy 2002, 26, 339–362. [Google Scholar] [CrossRef]
  34. Schleisner, L. Life cycle assessment of a wind farm and related externalities. Renew. Energy 2000, 20, 279–288. [Google Scholar] [CrossRef]
  35. Weinzettel, J.; Reenaas, M.; Solli, C.; Hertwich, E.G. Life cycle assessment of a floating offshore wind turbine. Renew. Energy 2009, 34, 742–747. [Google Scholar] [CrossRef]
  36. Hillman, K.M.; Sandén, B.A. Time and scale in Life Cycle Assessment: The case of fuel choice in the transport sector. Int. J. Altern. Propuls. 2008, 2, 1–12. [Google Scholar] [CrossRef]
  37. Hillman, K. Environmental Assessment and Strategic Technology Choice: The Case of Renewable Transport Fuels. Ph.D. Thesis, Chalmers University of Technology, Göteborg, Sweden, 2008. [Google Scholar]
  38. Kushnir, D. Environmental Assessment of Emerging Technologies: The Case of Nanomaterials for Energy Systems. Licentiate Thesis, Chalmers University of Technology, Gothenburg, Sweden, 2010. Available online: http://publications.lib.chalmers.se/publication/121684 (accessed on 28 September 2016). [Google Scholar]
  39. Arvesen, A.; Hertwich, E.G. Assessing the life cycle environmental impacts of wind power: A review of present knowledge and research needs. Renew. Sustain. Energy Rev. 2012, 16, 5994–6006. [Google Scholar] [CrossRef] [Green Version]
  40. Kolios, A.; Martínez-Luengo, M. The end of the line for today’s wind turbines. Renew. Energy Focus 2016, 17, 109–111. [Google Scholar] [CrossRef]
  41. Ortegon, K.; Nies, L.F.; Sutherland, J.W. Preparing for end of service life of wind turbines. J. Clean. Prod. 2013, 39, 191–199. [Google Scholar] [CrossRef]
  42. VindStat. Available online: http://www.vindstat.nu/stat/index.htm (accessed on 29 September 2016).
  43. VindStat. Driftuppföljning av Vindkraftverk: Årsrapport 2014; Energimyndigheten: Stockholm, Sweden, 2014. (In Swedish) [Google Scholar]
  44. Zimmermann, T.; Gößling-Reisemann, S. Influence of site specific parameters on environmental performance of wind energy converters. Energy Procedia 2012, 20, 402–413. [Google Scholar] [CrossRef]
  45. Garrett, P.; Ronde, K. Life Cycle Assessment of Electricity Production from a V90-2.0 MW Gridstreamer Wind Plant; Vestas Wind Systems A/S: Randers, Denmark, 2011. [Google Scholar]
  46. Eymann, L.; Stucki, M.; Fürholz, A.; König, A. Ökobilanzierung von Schweizer Windenergie; Bundesamt für Energie BFE: Bern, Switzerland, 2015. [Google Scholar]
  47. Gueder, M. Energetische Bewertung von Windkraftanlagen; Fachhochschule Würzburg-Schweinfurt: Schweinfurt, Germany, 2004. (In German) [Google Scholar]
  48. Vestas. Life Cycle Assessment of Electricity Produced from Onshore Sited Wind Power Plants Based on Vestas V82-1.65 MW turbines; Vestas Wind Systems A/S: Randers, Denmark, 2006. [Google Scholar]
  49. D’Souza, N.; Gbegbaje-Das, E.; Shonfield, P. Life Cycle Assessment of Electricity Production from a V112 Turbine Wind Plant; PE North West Europe ApS: Copenhagen, Denmark, 2011. [Google Scholar]
  50. Martinez, E.; Sanz, F.; Pellegrini, S.; Jimenez, E.; Blanco, J. Life cycle assessment of a multi-megawatt wind turbine. Renew. Energy 2009, 34, 667–673. [Google Scholar] [CrossRef]
  51. Ghenai, C. Life Cycle Analysis of Wind Turbine; InTech: Melbourne, FL, USA, 2012. [Google Scholar]
  52. Staffell, I.; Richard, G. How does wind farm performance decline with age? Renew. Energy 2014, 66, 775–786. [Google Scholar] [CrossRef]
  53. Echavirria, E.; Hahn, B.; van Bussel, G.J.W.; Tomiyama, T. Reliability of wind turbine technology through time. J. Sol. Energy Eng. 2008, 130, 031005. [Google Scholar] [CrossRef]
  54. Sheng, S. Report on Wind Turbine Subsystem Reliability—A Survey of Various Databases; National Renewable Energy Laboratory (NREL): Golden, CO, USA, 2013. [Google Scholar]
  55. Davidsson, S.; Grandell, L.; Wachtmeister, H.; Höök, M. Growth curves and sustained commissioning modelling of energy: Investigating resource constraints for wind energy. Energy Policy 2014, 73, 767–776. [Google Scholar] [CrossRef]
  56. Caduff, M.; Huijbregts, M.; Althaus, H.-J.; Koehler, A.; Hellweg, S. Wind power electricity: The bigger the turbine, the greener the electricity? Environ. Sci. Technol. 2012, 46, 4725–4733. [Google Scholar] [CrossRef] [PubMed]
  57. Polinder, H.; van der Pijl, F.F.A.; de Vilder, G.-J.; Tavner, P. Comparison of direct-drive and geared generator concepts for wind turbines. IEEE Trans. Energy Convers. 2006, 21, 725–733. [Google Scholar] [CrossRef]
  58. Wind Turbine Models. Turbines: Wind Turbine Models. Available online: http://en.wind-turbine-models.com/turbines (accessed on 28 September 2016).
  59. The Wind Power. SWT-2.3-101: The Wind Power. Available online: http://www.thewindpower.net/turbine_en_551_siemens_swt-2.3-101.php (accessed on 19 May 2015).
  60. Lindvig, K. The Installation and Servicing of Offshore Wind Farms; European Forum for Renewable Energy Sources: Brussels, Belgium, 2010. [Google Scholar]
  61. Recktenwald, G. Least Squares Fitting of Data to a Curve. In Numerical Methods with Matlab: Implementations and Applications; Department of Mechanical Engineering, Portland State University: Upper Saddle River, NJ, USA, 2007. [Google Scholar]
  62. Horste, A.; El-Thalji, I. Växellådshaverier på Landbaserade Vindkraftverk; Elforsk: Stockholm, Sewden, 2011. (In Swedish) [Google Scholar]
  63. Viberg, E.; Rasouli, A. Underhållet i en Vindkraftpark; Kungliga Tekniska Högskolan: Stockholm, Sewden, 2014. (In Swedish) [Google Scholar]
  64. Elforsk. Analys av Havererade Asynkrongeneratorer; Energimyndigheten: Stockholm, Sewden, 2002. (In Swedish) [Google Scholar]
  65. Axelsson, M.G. Tål Elnätet mer Vindkraft? Forskning Och Framsteg. Available online: http://fof.se/tidning/2012/7/tal-elnatet-mer-vindkraft (accessed on 23 June 2015). (In Swedish)
  66. Söder, L. På väg mot en Elförsörjning Baserad på Enbart Förnybar el i Sverige: En Studie om Behovet av Elkraft; Kungliga Tekniska Högskolan: Stockholm, Sweden, 2013. (In Swedish) [Google Scholar]
  67. Regeringen. Proposition 2008/09:163: En Sammanhållen Klimat- Och Energipolitik; Regeringskansliet: Stockholm, Sewden, 2009. (In Swedish) [Google Scholar]
  68. El-Kretsen, A.B. Our Operations 2015. Stockholm, Sweden. 2015. Available online: http://www.el-kretsen.se/sites/el-kretsen_se/files/insamlingsstatistik_2014.pdf (accessed on 8 November 2016).
  69. Sveriges Geologiska Undersökning. Uppdrag att Utföra en Kartläggning och Analys av Utvinnings- Och Återvinningspotential för Svenska Metall- Och Mineraltillgångar, Redovisning av Regeringsuppdrag; Sveriges Geologiska Undersökning: Uppsala, Sweden, 2014; Available online: http://resource.sgu.se/produkter/regeringsrapporter/utvinnings-och-atervinningspotential-metaller-mineral-2014.pdf (accessed on 8 November 2016). (In Swedish)
  70. Sandvik Materials Technology. Sandvik Duplex Stainless Steels; S-120-ENG. 01.2009; Sandvikens Tryckeri AB: Gävle, Sweden, 2009. [Google Scholar]
  71. Innoventum. Innoventum Offers Two Unique Wood Towers. Available online: https://www.innoventum.se/wooden-towers/ (accessed on 16 September 2016).
  72. Timbertower. Holztürme für Multimegawatt Windkraftanalgen. Available online: http://www.timbertower.de/de/ (accessed on 16 September 2016). (In German)
  73. New Atlas. Worlds-First Wooden Wind Turbine Starts Spinning in Germany. Available online: http://newatlas.com/timbertower-wooden-wind-turbine/25007/ (accessed on 16 September 2016).
  74. Arantegui, R.L. JRC Wind Status Report; European Commission: Petten, The Netherlands, 2012. [Google Scholar]
  75. Energistyrelsen. Master Data Register for Wind Turbines at End of March 2015; Energistyrelsen: Copenhagen, Denmark, 2015. [Google Scholar]
  76. Keuper, A. Wind energy use in germany—Status 31.12.1993. DEWI Mag. 1994, 25, 5–14. [Google Scholar]
  77. German Wind Energy Association. Wind Industry in Germany 2014; Bundesverband WindEnergie: Berlin, Germany, 2014. [Google Scholar]
  78. Deutsche WindGuard. Status of Land-Based Wind Energy Development in Germany; Deutsche WindGuard: Varel, Germany, 2014. [Google Scholar]
  79. Bruns, E.; Ohlhorst, D. Wind power generation in germany—A transdisciplinary view on the innovation biography. J. Transdiscipl. Environ. Stud. 2011, 10, 46–67. [Google Scholar]
  80. Lawson, J. Renewable Energy World: Repowering Gives New Life to Old Sites. Available online: http://www.renewableenergyworld.com/rea/news/article/2013/06/repowering-gives-new-life-to-old-wind-sites?cmpid=rss (accessed on 1 May 2015).
  81. Wizelius, T. Vindkraft i Teori och Praktik 2: A Upplagan; Studentlitteratur: Lund, Sweden, 2007. (In Swedish) [Google Scholar]
Figure 1. The workflow for estimating material generated from wind turbines. Materials from decommissioned turbines and material from replaced components are calculated separately and then combined into total material amounts.
Energies 09 00999 g001
Figure 2. Estimated mass of all turbines installed in Sweden between 1994 and 2014, based on collected data from LCA’s (red bars) and calculated by Equation (2) (grey bars).
Energies 09 00999 g002
Figure 3. Prognosis of wind power development in Sweden between 1982 and 2034, as calculated by Equation (5). Historic data over installed capacity between 1982 and 2014 (used to assume suitable intercept- and scaling factors) is shown as blue dots.
Energies 09 00999 g003
Figure 4. The predicted total mass of replaced generators, rotor blades and gear boxes on the Swedish wind power market between 2014 and 2034.
Energies 09 00999 g004
Figure 5. Estimated amount of waste material from Swedish wind turbines between 2014 and 2034. The combined mass of material from both replaced components (blue area) and decommissioned turbines (red area).
Energies 09 00999 g005
Figure 6. Estimated amounts of steel and iron waste generated from the Swedish wind power industry between 2014 and 2034. The solid line is the result of using the mean material specification and the area shows the range between applying the minimum and maximum values found.
Energies 09 00999 g006
Figure 7. Estimated waste amounts of blade material-, copper-, aluminium-, and electronic generated from the Swedish wind power industry between 2014 and 2034. The solid line is the result of using the mean material specification and the area shows the range between applying the minimum and maximum values found.
Energies 09 00999 g007
Figure 8. Calculated amount of total decommissioned power (grey area), and the amount of which that would turn into waste each year according to three different second hand scenarios (red lines): (a) Through 2014–2024; and (b) Through 2024–2034. As scenarios A and B are almost identical the difference between the two is presented as a red area.
Energies 09 00999 g008
Table 1. Intercept and scaling factors used in Equation (2) to calculate the mass of different turbine parts. Standard error (SE) is presented to show the precision of each calculation. DFIG: Doubly-fed induction generator; DDSG: Direct drive synchronous generator.
Turbine PartIntercept FactorScaling FactorSE
Rotor0.302.220.17
Nacelle (DFIG)0.642.190.15
Nacelle (DDSG) 10.202.58-
Notes: 1 These values are not taken from the mentioned study, but rather extrapolated based on turbines observed during research (see Appendix B).
Table 2. Estimated waste from wind power plants in 2024 and 2034 and total recycled amount of material in Sweden 2014 [68,69]. Percentages of estimated generated waste compared to total recycled amounts in 2014 are shown in parenthesis.
Materials (Tonne)Recycled Amounts in 2014Estimated Material Waste from Wind Turbines
20242034
Steel & iron1,500,00016,009(1%)236,656(16%)
Aluminum60,000116(0%)2290(4%)
Copper65,000891(1%)3333(5%)
Blade material 160003274(55%)28,060(468%)
Electronics79,00011(0.01%)343(0.4%)
Note: 1 Amounts reprocessed by Zagons Logistik are used as reference value, not the amount of blade material recycled in Sweden in 2014.

