1. Introduction
Today, more than ever, rechargeable batteries are everywhere in our day-to-day lives serving as energy storage units in all sorts of devices. By far, Li-ion Batteries (LIBs) represent the preferred battery technology for most applications owing to their superior performance [
1,
2]. For a range of applications such as electric vehicles, electric boats and electric airplanes, they still lag behind when competing with established alternatives. This brings us to the main research question that this work is dedicated to tackling: how far can we stretch the performance as well as lower the cost of current LIB-technology? Overall battery performance is a result of many factors. The combination of development choices made during material selection, cell design, pack design and charging strategy [
3] will impact the battery performance in the final use phase. Furthermore, the use phase itself will affect performance degradation. One can start to grasp the complexity of this optimization problem, mainly owing to the large number of input parameters spread over a number of blocks in the value chain (see
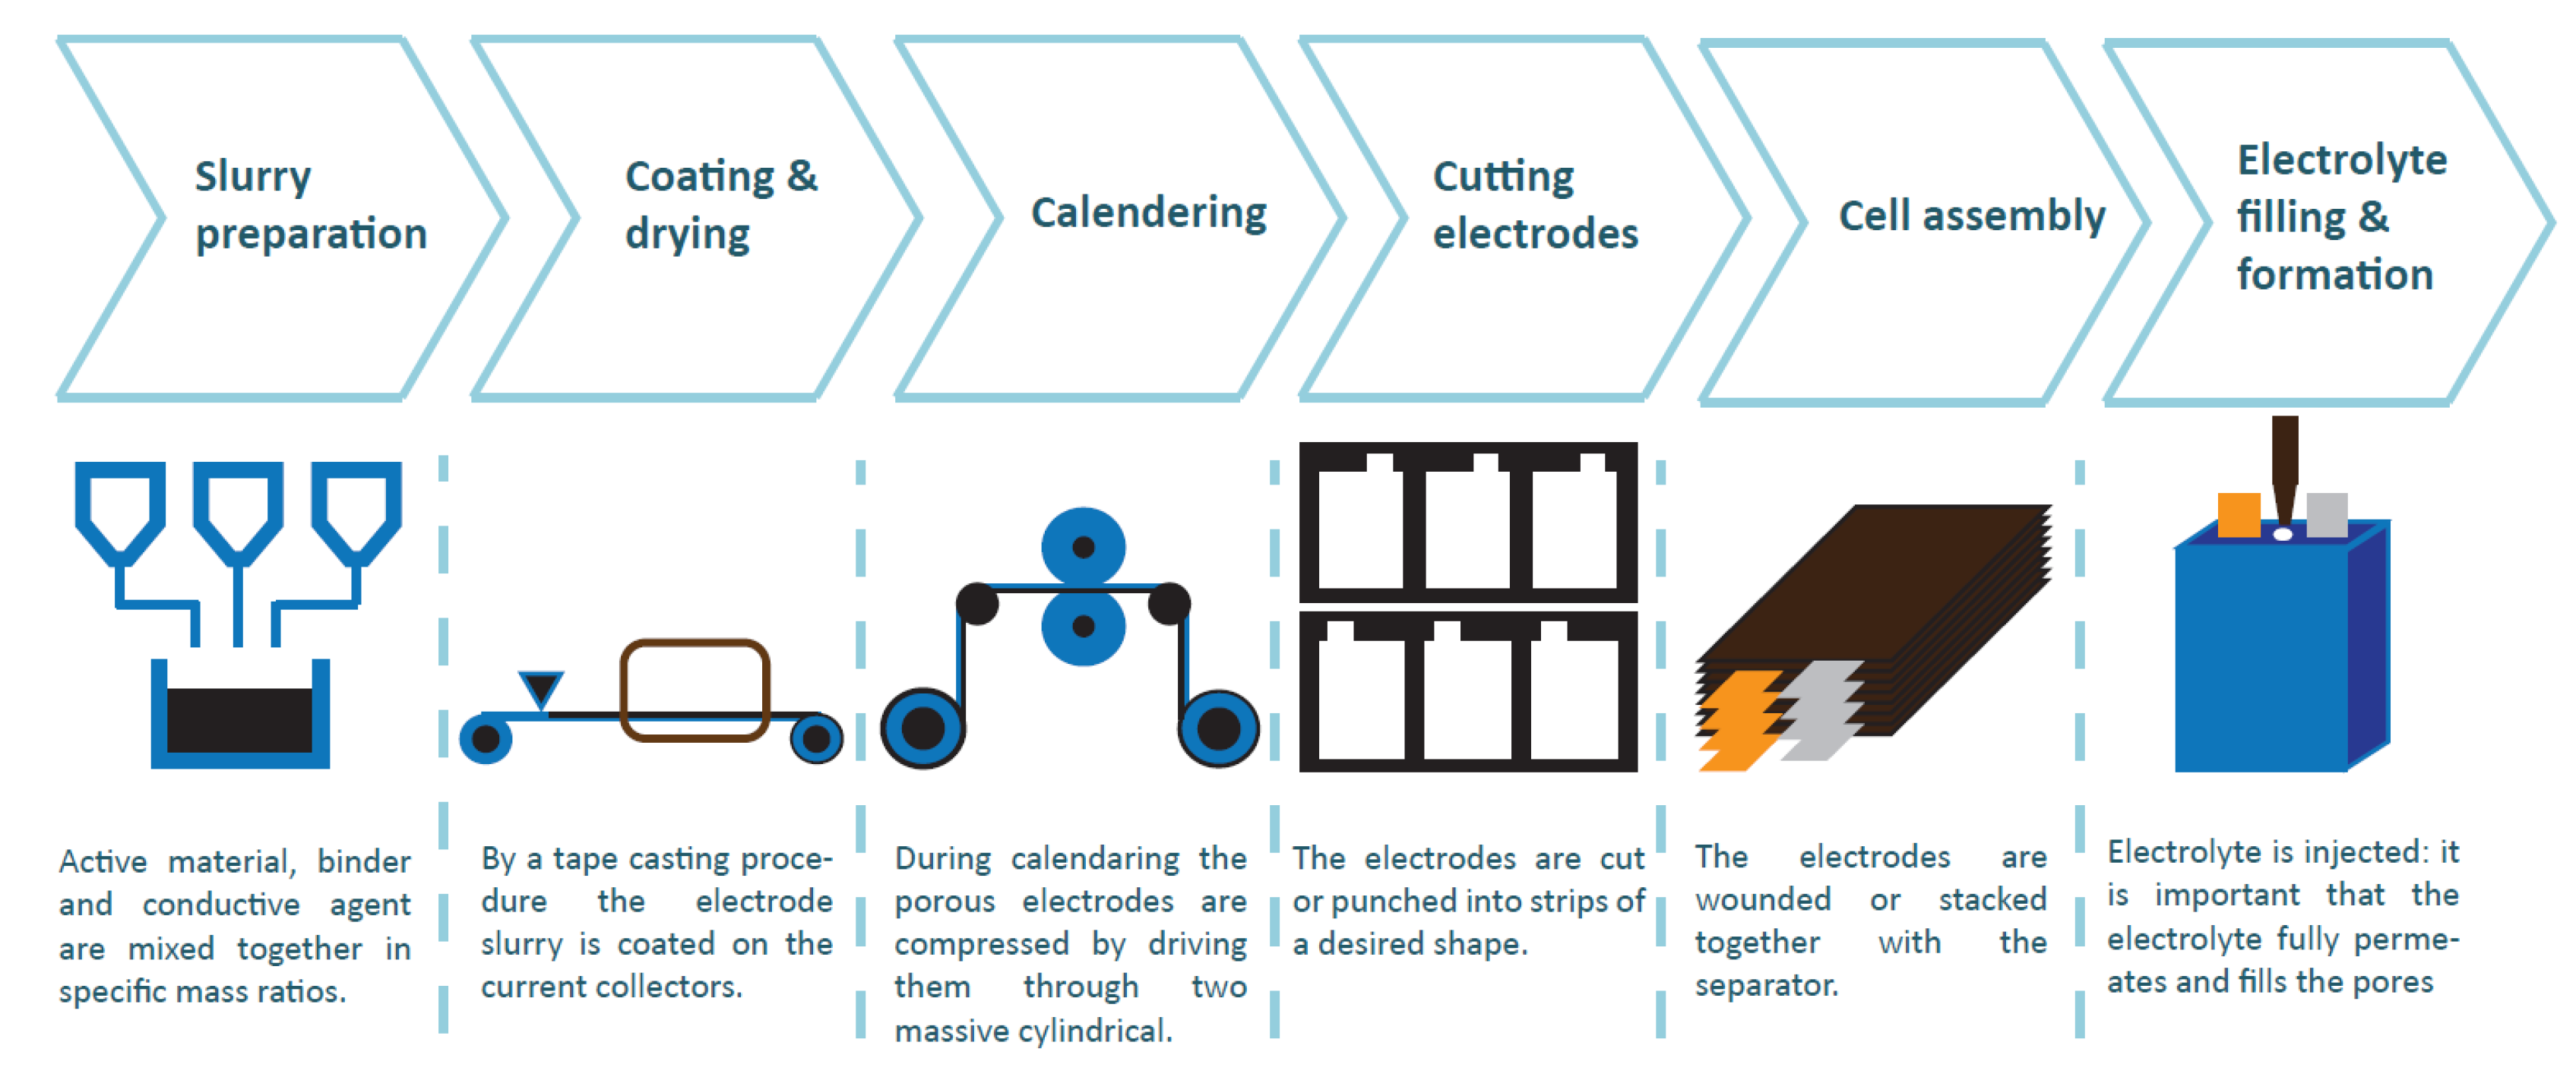
Figure 1). Not surprisingly, the battery industry relies mostly on a trial and error approach for their product development [
4]. The lack of proper software tools to aid in this cumbersome task, as is done in many other areas of engineering, is due to the non-linear, complex, electrochemical nature of LIBs. Adding to this is the difficult experimental characterization of certain macroscopic active material properties and of the electrode matrix.
A first step towards a workable simulation has been made already over two decades ago by Newman
et al. [
5,
6]. His model is a compromise between computational complexity and application relevance given that the model is able to take into account most important cell design properties at a low computational cost. Many authors have simplified or extended Newman’s model. The approach of studying the macroscopic electrochemical behavior of porous electrodes is referred to as Porous Electrode Theory (PET) [
7].
Figure 1.
Manufacturing steps of Li-ion batteries.
Figure 1.
Manufacturing steps of Li-ion batteries.
There is a great drive to keep reducing the price of LIBs at an enhanced performance. In this context, the impact of manufacturing procedures on the performance of battery modules has practically been disregarded in literature. Past research on LIBs are fundamentally centered around materials and their properties on the cell or electrode level. In practice, many manufacturing parameters are chosen based on experience rather than analysis and calculation. Recent work has shown the potential gain in tuning and further developing LIB manufacturing [
8,
9,
10,
11]. For instance, in reference [
8], the potential for a cost reduction of increasing the electrode thickness is demonstrated and, in reference [
10], the influence of calendering on wettability is investigated. Initial and lifetime performance are strongly influenced by interventions in the manufacturing process, especially the morphology of the porous electrode [
11].
In this publication, the influence of compression of the positive electrode (applied during the calendering step) on cell performance is experimentally investigated, keeping all other cell parameters constant. This step ensures an even electrode thickness and controls the electrode density. The electrode density is defined as the volumetric mass density of electrode material (mixture of active material, binder and conductive agent) in the electrode. In order to assess its impact, three different types of cells were made with different positive electrode densities. The active material in the positive electrode selected for this study was Li
Ni
Mn
Co
O
(NMC). The choice of NCM is twofold: on the one hand, successful material optimization has made it superior to its predecessor Li
CoO
in multiple aspects, making it a relevant case to investigate. On the other hand, only limited research work has been conducted on multiphysics model of positive electrodes with NCM compared to lithium iron phosphate and lithium mangenese oxide [
12]. The first paragraph explains the different steps of LIB cell manufacturing. In the second paragraph, experimental details and results are presented. The three cell types were simulated using an in-house developed PET model. These results are given in the third and fourth paragraph. The underlying finite-element solver, called MuPhyS, was also developed at our university (
http://muphys.surfgroup.be).
2. Battery Cell Manufacturing
The understanding of how the manufacturing of battery electrodes, cells, modules and packs influences battery performance is still in its infancy. Furthermore, system engineers are just starting to realize the impact of the battery management system’s charge and discharge strategies [
3]. Below, a short overview of the cell manufacuring process is given.
2.1. Slurry Preparation: Mixing
In the first step, Active Material (AM), binder (acting as a glue) and a conductive agent mixed together in specific mass ratios to make the composite electrode (CE). The effect of the mixing sequence on the morphology of the CE and the electrochemical performances was discussed by Chang
et al. [
13]. They claim that the order of mixing should be optimized as a function of the constituents’ properties, the nature of the solvent, and the viscosity of the dispersion. In order to compensate for the low AM conductivity, electron-conductive additives are generally employed to prepare CE for LIB. They can increase the available capacity, charge-discharge rate, and the cycle life performance of the cell. These electron-conductive additives are mainly conductive carbon particles, such as acetylene black, Ketjen black, super-P, carbon graphite, carbon nano-tubes
etc.; however, these additives have a large surface area, which could lead to parasitic reactions with electrolytes [
14]. The use of more fiber shaped carbons instead of more spherical Carbon Black (CB) enhances percolating properties of the electrode matrix [
15].
Positive Electrodes (PEs) consist of Lithium metal oxide mixed with CB and polyvinylidene difluoride (PVDF). PVDF is dissolved in
N-Methyl-2-pyrrolidone (NMP). Given its toxic nature, relative low vapor pressures and high boiling point, there is a great drive to ban NMP from the manufacturing process. For the Negative Electrodes (NE), it has been successfully replaced by using a carboxymethyl cellulose based binder in combination with styrene butadiene rubber. In this case, water can be used as a solvent. Today, in the majority of LIBs, carbon is used as AM for the NE [
16]. CB can also be added to the NE to improve conductive pathways and the porous structure. The conduction network is formed by the CB particles, which fill the void between AM particles and are interconnected by particle-to-particle point contacts from the current collector to the most outer AM layer. The electronic transfer at the CB/CB contact points is due to the tunneling effect phenomenon. Dominko
et al. [
17] demonstrated that a good carbon coating with a homogeneous distribution can decrease the amount of CB to 2 wt % and also increase the kinetics of the resulting electrode when compared to a conventional electrode. It presents an opportunity for cell manufacturers to tune their cell performance. Especially for badly conducting AM, the influence of binders and conductive agents can be very influential [
15].
In addition, the solvent concentration is an important factor in the process and standard formulation of CEs. For a concentration below the optimal one, the electrode dispersion exhibits a yield stress that inhibits flow and prevents homogeneous distribution of the constituents. Above the optimal concentration, settling of the low viscosity dispersion can create a concentration gradient. Thus, the solvent concentration (or solid loading) has a strong impact on the morphology and consequently on the electrochemical performance of the CE. Below and above the optimal solvent concentration, the electrochemical behavior is degraded due to poor electronic wiring of the AM [
18].
2.2. Coating and Drying
By a tape casting procedure, the electrode slurry (or paste) is coated on the current collectors: for the NE, this is copper and for the PE, this is aluminum. During this process, it is required to control the solvent concentration. Once powders are dispersed, the slurry will be spread onto the current collector using the doctor blade with a chosen thickness. The tape cast should be dried to eliminate the residual solvents. In this step, it is important to obtain a homogenous coating thickness. The amount of active material per cm of current collector determines the Maximum Available Capacity (MAC) of the electrodes. Both electrodes should be balanced out well so that the desired voltage window of both electrodes is actually used. Furthermore, one has to take into account irreversible capacity loss because of SEI formation, mostly on the graphite-based NE. Given that the cell is assembled from unlithiated carbon and fully lithiated Lithium metal oxide, a discharged state, the PE is not optimal used. After coating, the electrodes are passed through an oven to dry out the solvent: NMP for the PE and water for the NE.
2.3. Calendering
During calendering, the electrodes are compressed by driving them through two massive cylindrical rolls. By applying large pressure (300–2000 kg·cm
), the electrode thickness is reduced to a controlled value. The porosity is reduced around 40% [
19]. As a result, the adhesion of electrode materials is improved and the density is increased. The effects on battery performance are discussed in the next paragraph. After this operation the electrodes can be dried for a second time to remove all water contamination. The rest of the manufacturing process will take place in a dry room.
2.4. Cutting/Slitter/Puncher
Then the electrodes are cut or punched into strips of a desired shape. A clean cut is necessary to avoid burrs on the edges which can cause short-circuit in the cells. Note that NEs are made slightly larger than PEs to avoid lithium deposition and dendride formation on the edge of the NE. A large oversizing of the NE leads to a loss of energy density of the complete cell. Contacting tabs are fixed to the electrode.
2.5. Assembly
The electrodes are wounded or stacked together with the separator. The electrode stack or jelly roll is integrated into the housing. To evacuate gases which arise during the formation, the housing is partially sealed.
2.6. Electrolyte Injection, Formation and Wetting
Finally, electrolytes are injected. To achieve a maximal wettability, it is important that the electrolyte completely permeates and fills the pores in the separator and electrode [
10]. Un-wetted AM area will decrease the specific surface area which is reacting during battery operation and as result increase the cell impedance. Furthermore wettability is important to achieve a uniform SEI layer during the formation cycles. The calendering step will inevitably influence the wettability because it alters the porosity and particle distribution [
8]. The wetting formation-step takes up lot of time (1.5 to three weeks) and capital [
8].
To conclude, if the chemical nature of all components is fixed, one still has the ability to vary the following process parameters over a wide range:
Particle size and distribution
Relative amount of AM, binder and conductive agent in the electrode
Amount of electrode material AM per cm current collector
Thickness and density of the electrode
Salt concentration of the electrolyte
Wettability process, determining active area
which all have non-accurately known impact on life time and battery performance. In the next paragraph, the influence point three on the PE is investigated.
3. Influence of Electrode Density
In order to assess the influence of PE density three times, 10 cells with a Li
Ni
Mn
Co
O
based PE and graphite based NE were made. The Open-Circuit-Potential (OCP) of the electrodes
versus lithium metal used in the simulations can be found in reference [
20]. The first group of 10 cells had a PE density of 3.2 g/cm
, the second group 3.0 g/cm
and the third group 2.8 g/cm
. For the three types of cells, the electrode formulation of both electrodes was the same. In the rest of this paper, the three types of cells will be referred to as High Density (HD), Middle Density (MD) and Low Density (LD). Notice that the high density electrodes have the lowest volume fraction of electrolyte (also known as porosity). The 1C current rate of the cells is fixed at 600 mA or 18.5 A/m
. For the purpose of generality, from here on all capacities and current rates will be expressed per m
of PE.
An LIB can be considered as a voltage source with a non-linear time varying impedance. If one was able to calculate this impedance based on the material and design specifications of the cell, this will enable the battery designers to optimize the cell design for a given application and corresponding real-time operation. The impedance in a porous LIB electrode is a mixture of multiple physical processes [
21]:
Electric conduction at the current collector/electrode interface resulting in a resistive contact impedance. In this regard, it is important to stress the effect of deformation caused by the pressure applied during the calendering procedure. It can be seen that the pressure of the active material on the aluminum current collector deforms this interface creating a better electric contact and thus lower resistance.
Electric conduction in the matrix of the porous electrode—depending on the intrinsic conductivity of the AM, this electronic current is mostly carried by the carbon-binder domain (CBD) [
15].
Mass transfer (mostly diffusion) of lithium ions in the intercalation host [
22].
The total current passing through the electrode/electrolyte interface is the sum of a capacitive current and faradaic current.
- -
The capacitive current is due to the electric double layer, formed at the electrode/electrolyte interface. In batteries in general and LIBs specifically, this current is considered to be small relative to the total current [
23].
- -
The faradaic current is due to the charge transfer reaction accompanied with Li-intercalation.
Ionic conduction in the electrolyte.
So what can be expected of an increased (PE) electrode density? The higher pressure which is used during calendering results in a better contact between the electrode matrix and the aluminum foil, decreasing the contact resistance. HD electrodes have higher volume fraction of CBDs in the pore space resulting in better binding and conduction between the particles. These two effects should decrease the overall cell impedance, however the magnitude of the effect depends on the nature of the AM and CBDs [
15].
Higher electrode density will result in less available active surface area of the AM. The volume fraction of electrolyte (or porosity) decreases as the electrode density increases. In addition, low porosity has a deteriorating effect on electrolyte transport. In this regard, tortuosity can also be influenced badly. The extent of these effects can be investigated with advanced electrode imaging techniques such as those presented by Hutzenlaub
et al. [
24,
25]: using a combination of X-ray tomography to image the AM domain, and Focused Ion Beam Scanning Electron Microscope (FTB/SEM) images to obtain a phase distribution of AM, CBD and pore space, they are able to establish a full digital 3D image of the electrode.
To summarize, there is a mix of beneficial (electric conductivity) and deteriorating (specific surface area and electrolyte transport) effects to the cell impedance. Experimentally, we will assess the overall effect on the cell impedance in the rest of the paragraph. The extent of the overall effect can be low because individual effects compensate each other and/or because the NE is dominating the total cell impedance.
3.1. Experimental Part
After formation and preconditioning tests, the cells were subjected to a series of identical characterization tests. First, the Maximum Available Capacity (MAC) and Maximum Available Energy (MAE) between the recommended maximum and minimum voltage were measured, respectively V and V. This test regime is as follows: after a Standard Charge Regime (SCR) the cells are discharged with a C/25 constant current until . After a resting period of one hour, the cells are charged with the opposite charge profile until . From this test, respectively, two values for the MAC and MAE are obtained, one for the charge and one for the discharge regime. The SCR is defined as a constant current charge of C/2 until , then a constant voltage charge until the current reaches C/100 followed by a relaxation period of one hour. Secondly, the available discharge capacities between and at multiple current rates were determined. These are obtained by discharging the cells after an SCR with a constant current of, respectively, C/2, 1C, 2C, 3C, 4C and 5C. Thirdly, a pulse characterization test was applied to determine the Direct Current Resistance (DCR) and to calculate the power capability of the cells. The pulse characterization test starts with an SCR, after which the cells are discharged with a C/2 rate in blocks of 10% of the rated capacity. Then, alternating discharge and charge pulses of 3C were applied. The relaxation period in between pulses was 15 min.
The DCR (
) was determined by fitting the voltage response to a first order model minimizing the sum of the squares of the errors. The details of this procedure can be found in reference [
26]. During all experiments, the cells were put in a climate chamber keeping the surrounding temperature of the cells at 25 °C.
3.2. Results
As can be seen from
Table 1, the MAC of the fresh cells is as expected and within acceptable error margins, the same for the three cell types being (20.8 ± 0.1) Ah/m
for the discharge regime and (20.9 ± 0.1 Ah/m
) for the charge regime. The MAE is (77.1 ± 0.3) Wh/m
for the discharge regime and (77.5 ± 0.3) Wh/m
for the charge regime. In
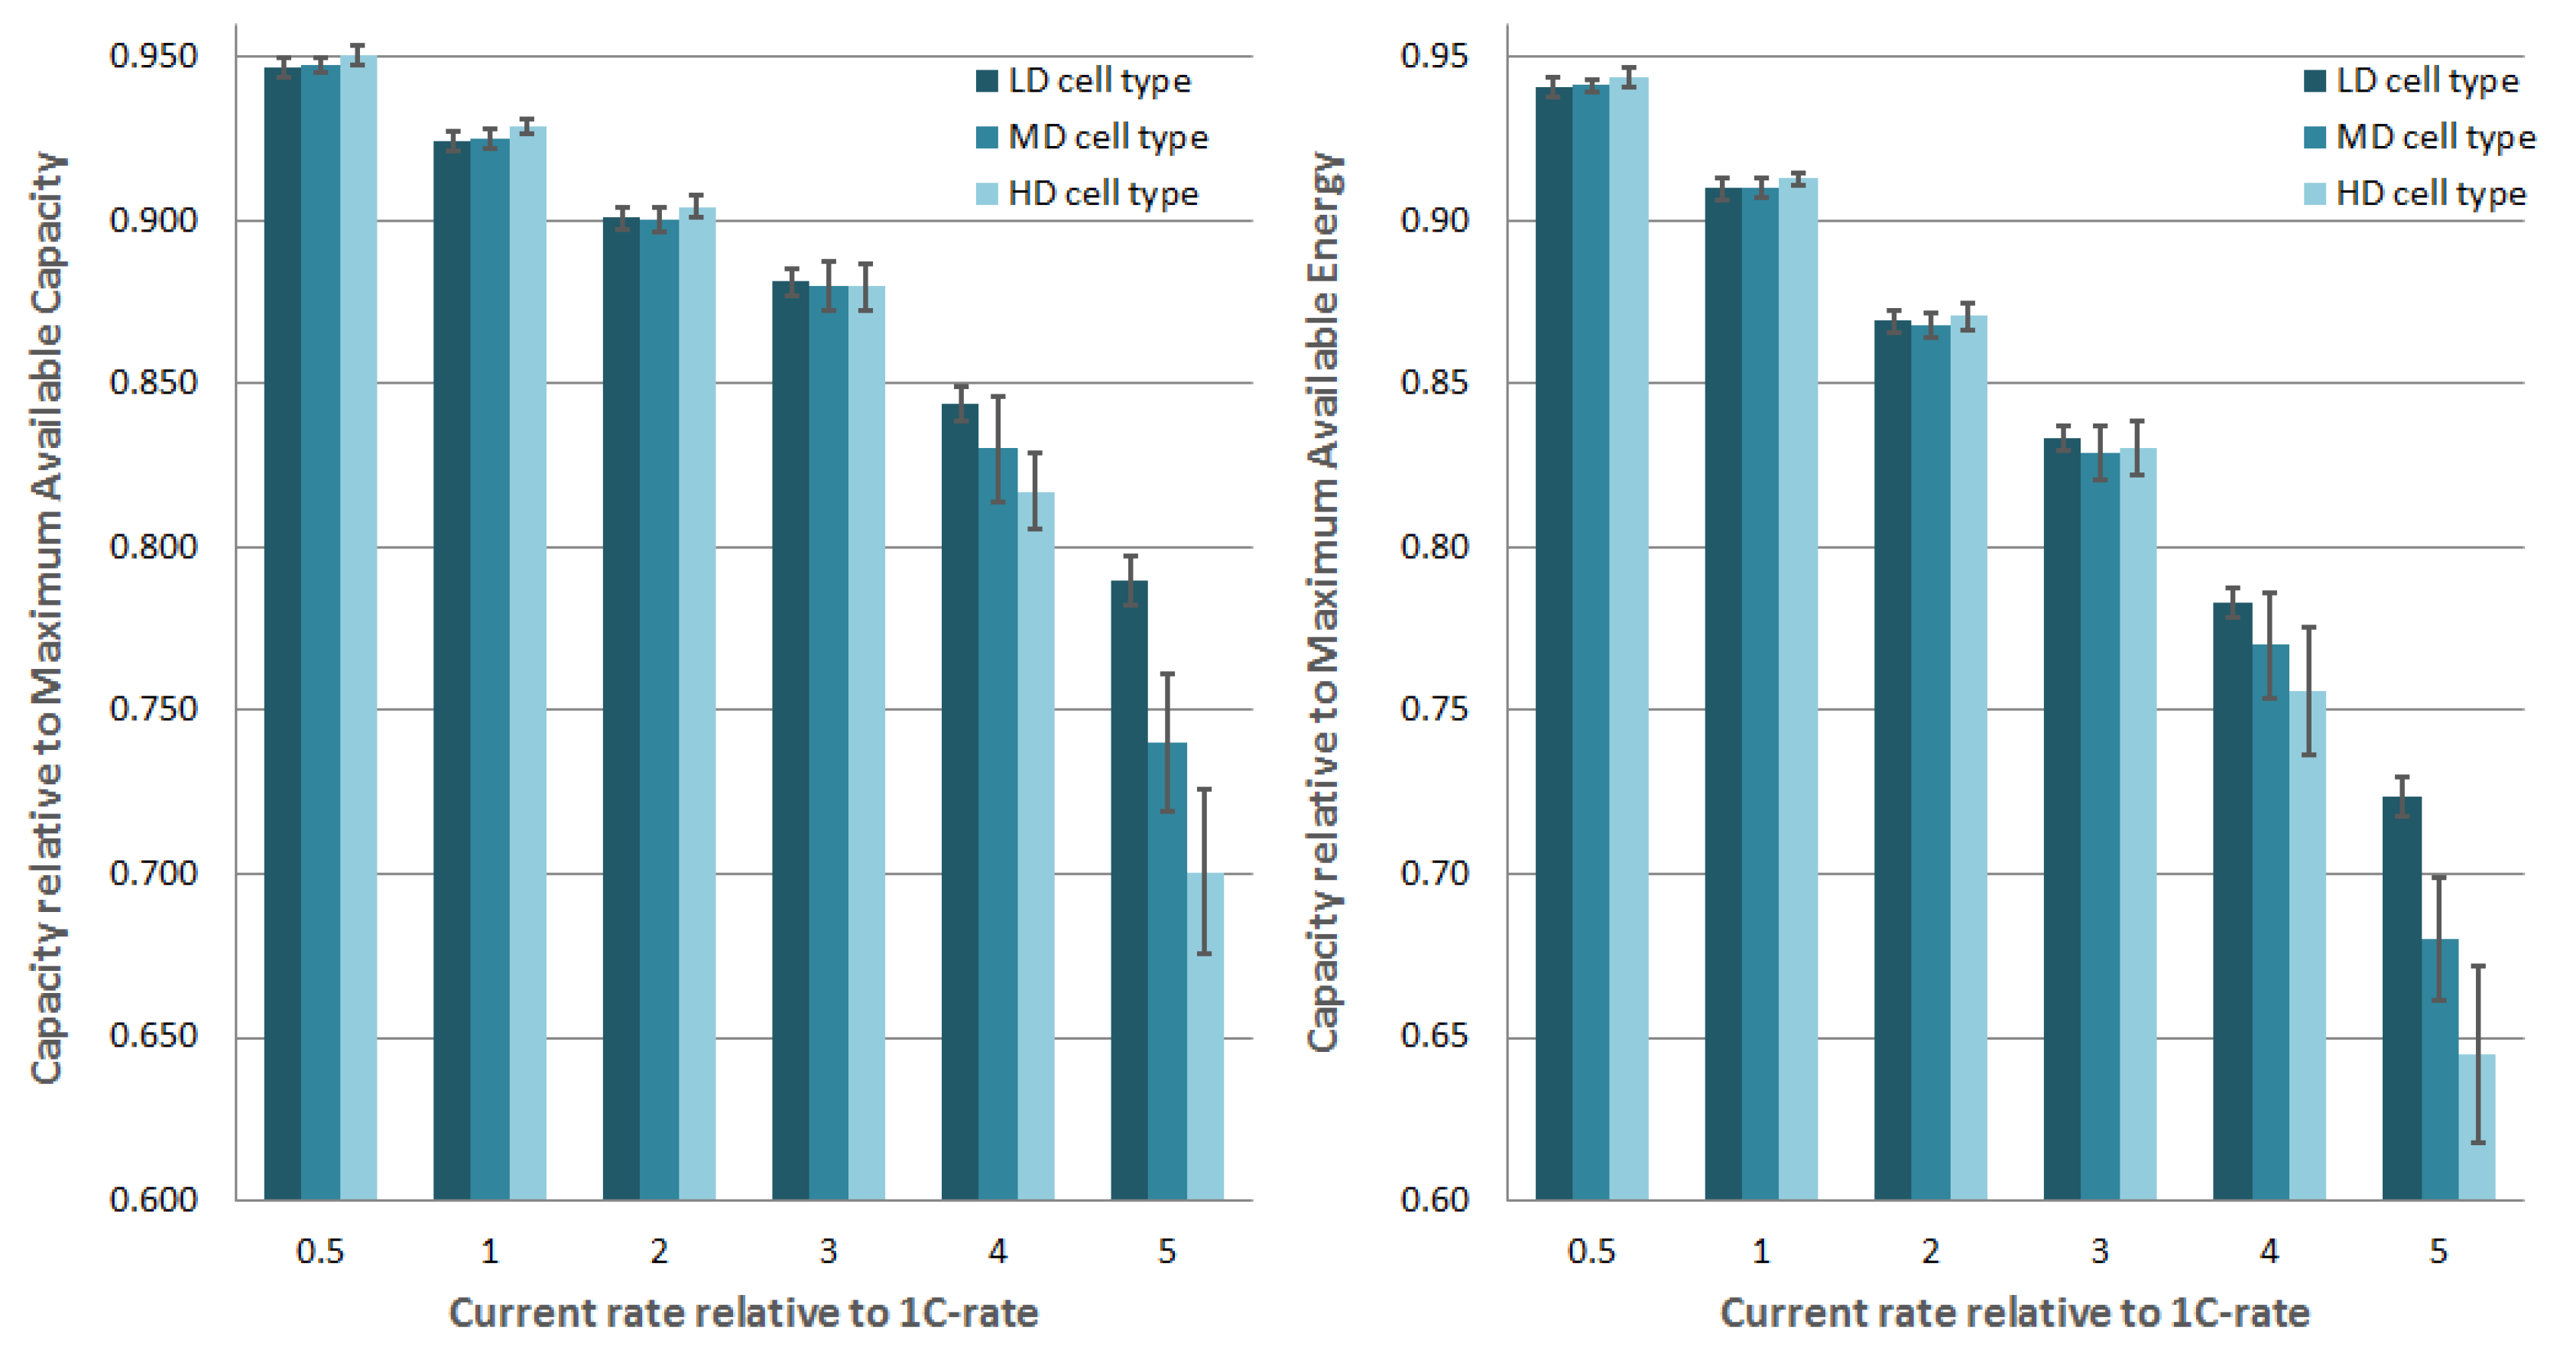
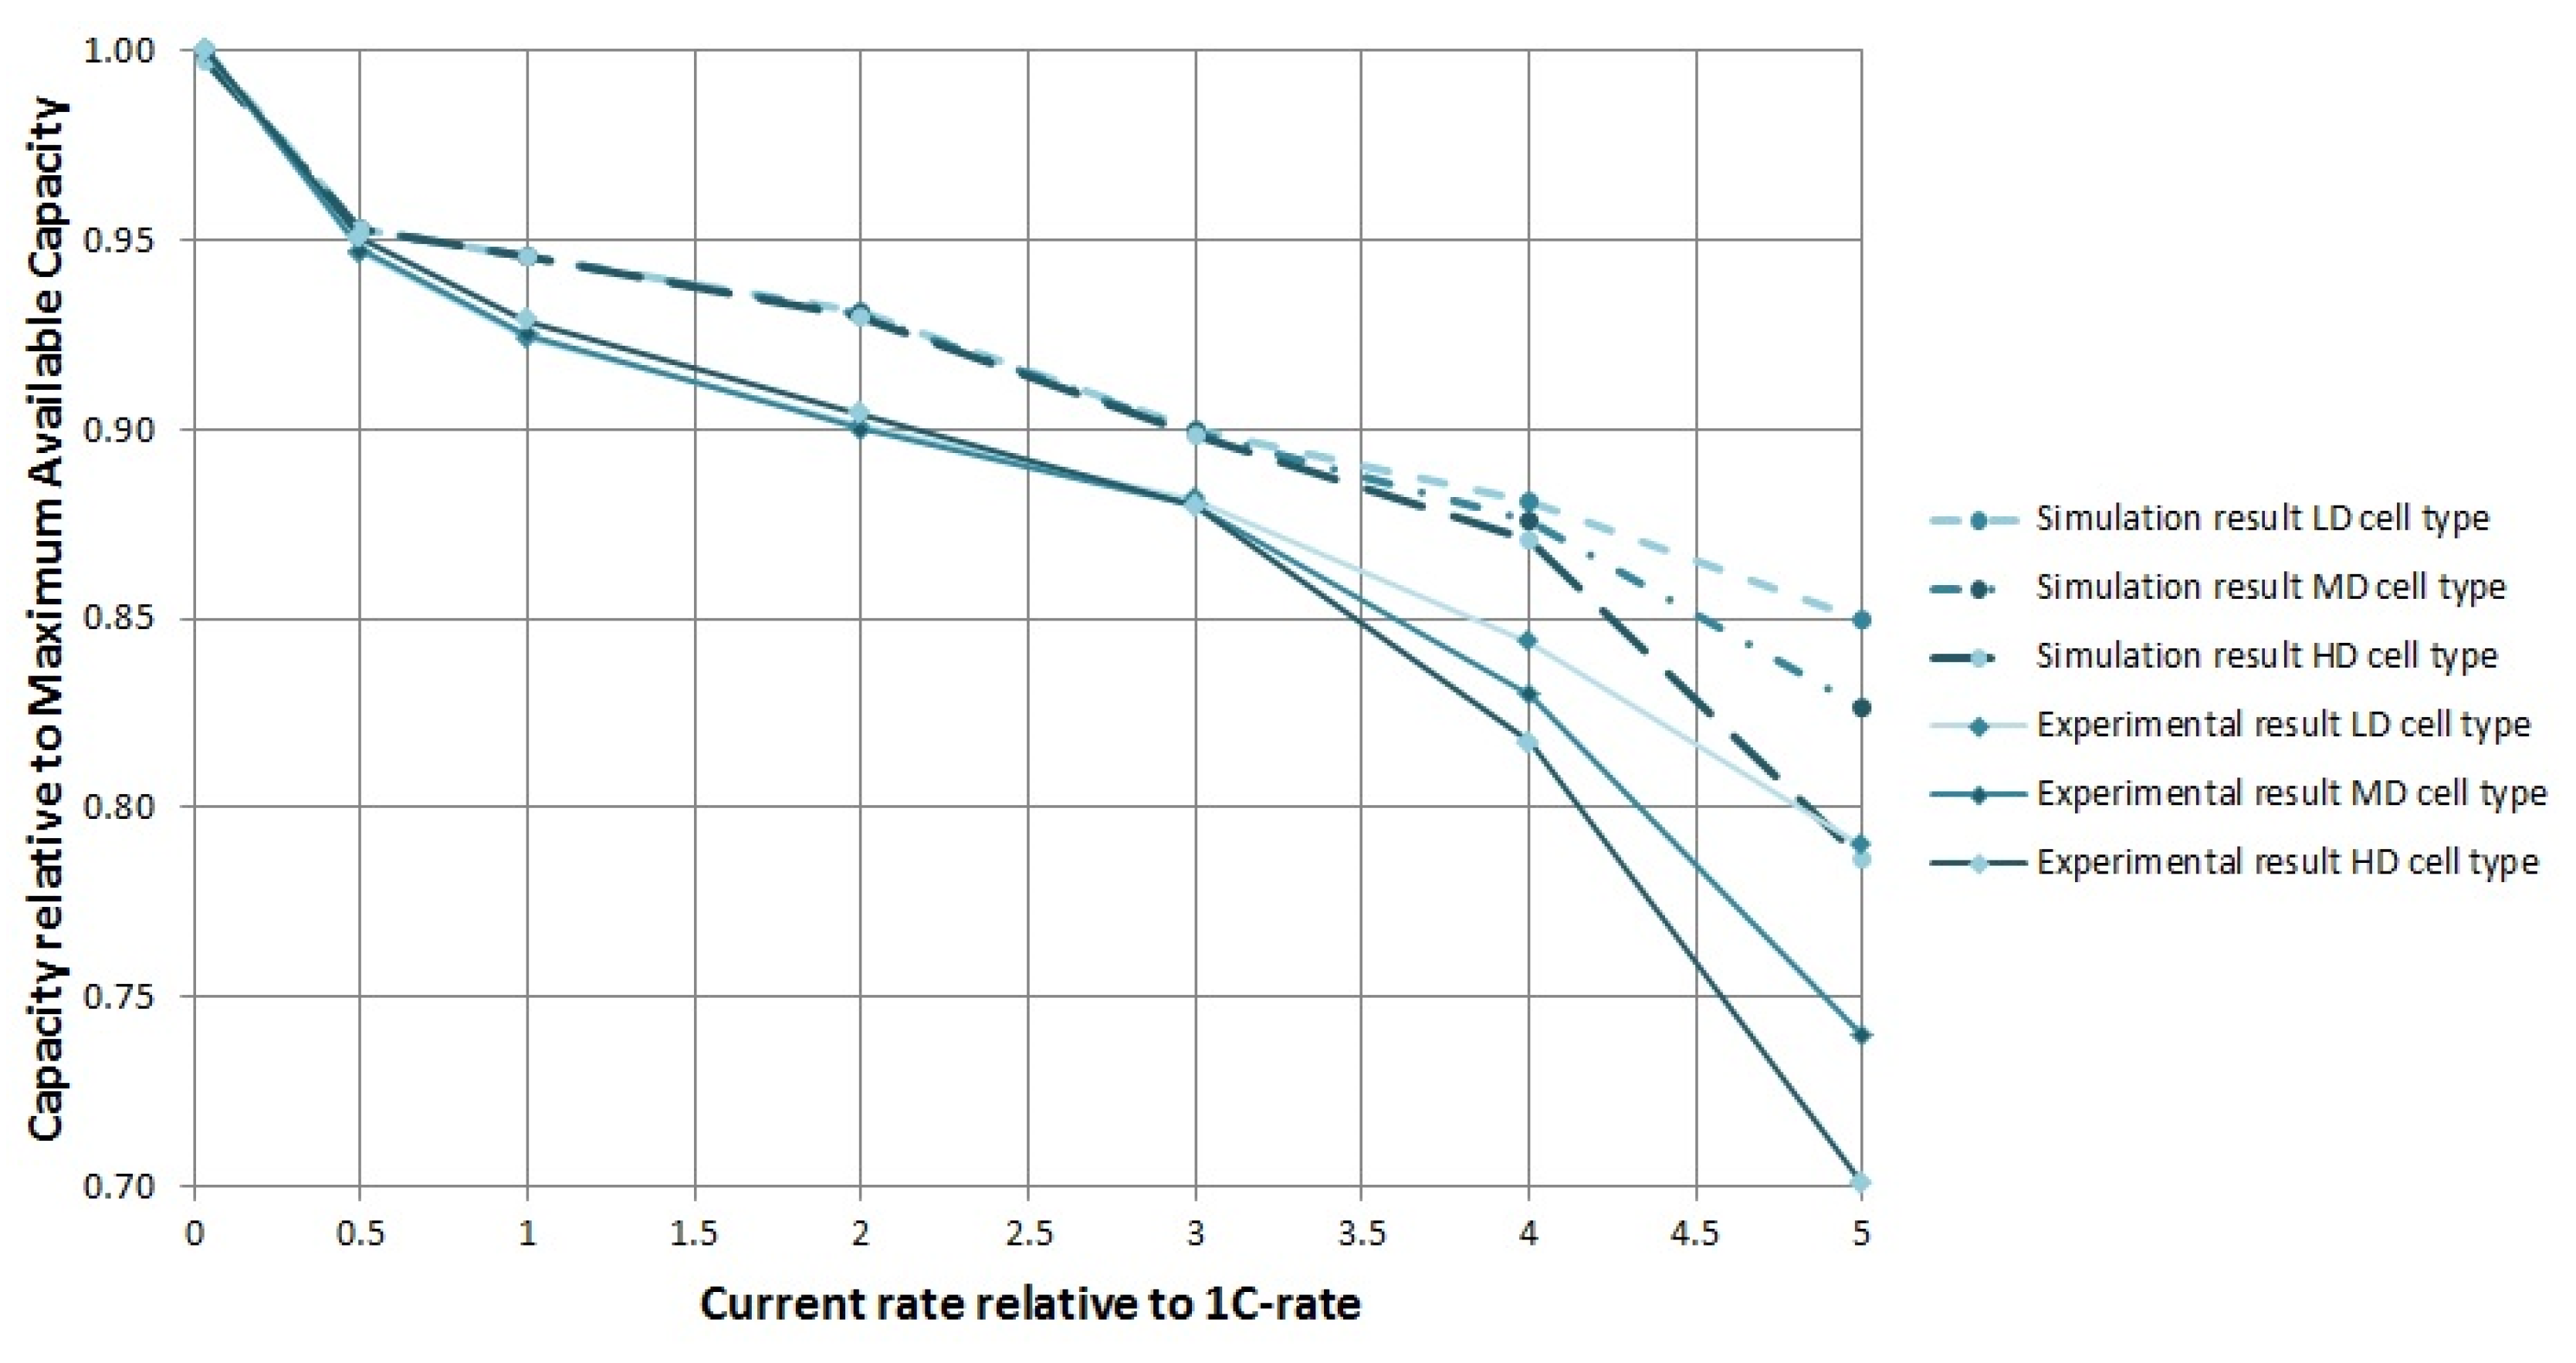
Figure 2, the discharge capacities are given relative to the MAC. As can be seen, at low current rates (0.5C and 1C) the HD cells have a slightly higher capacity of around 0.4% compared to the LD cell type. At 2C and 3C, the difference is lower and the trend is broken. At these current rates, the discharge capacities do not show a significant difference between LD, MD and HD cell types. High current rates of 4C and 5C show significant differences, respectively 2.7% and 8.9%. The difference in available energy at the different current rates is similar. Furthermore, one can note that for a 3C, 4C and 5C current rate, MD and HD cell types show and increased standard deviation, which indicates a bigger spread of measured discharge capacities in the respective groups. The interpretation of these results is further discussed in
Section 3.3.
Table 1.
Results of the measurement of the maximum available capacity (MAC) and maximum available energy (MAE) for three cell types.
Table 1.
Results of the measurement of the maximum available capacity (MAC) and maximum available energy (MAE) for three cell types.
| Measured Quantity | LD | MD | HD |
|---|
| Dis | Cha | Dis | Cha | Dis | Cha |
|---|
| Maximum Available Capacity (Ah/m) | Mean | 20.81 | 20.82 | 20.84 | 20.87 | 20.84 | 20.87 |
| St. dev. | 0.09 | 0.07 | 0.07 | 0.05 | 0.12 | 0.10 |
| Maximum Available Energy (Wh/m) | Mean | 77.23 | 77.54 | 76.92 | 77.54 | 77.28 | 77.55 |
| St. dev. | 0.32 | 0.26 | 0.25 | 0.20 | 0.42 | 0.37 |
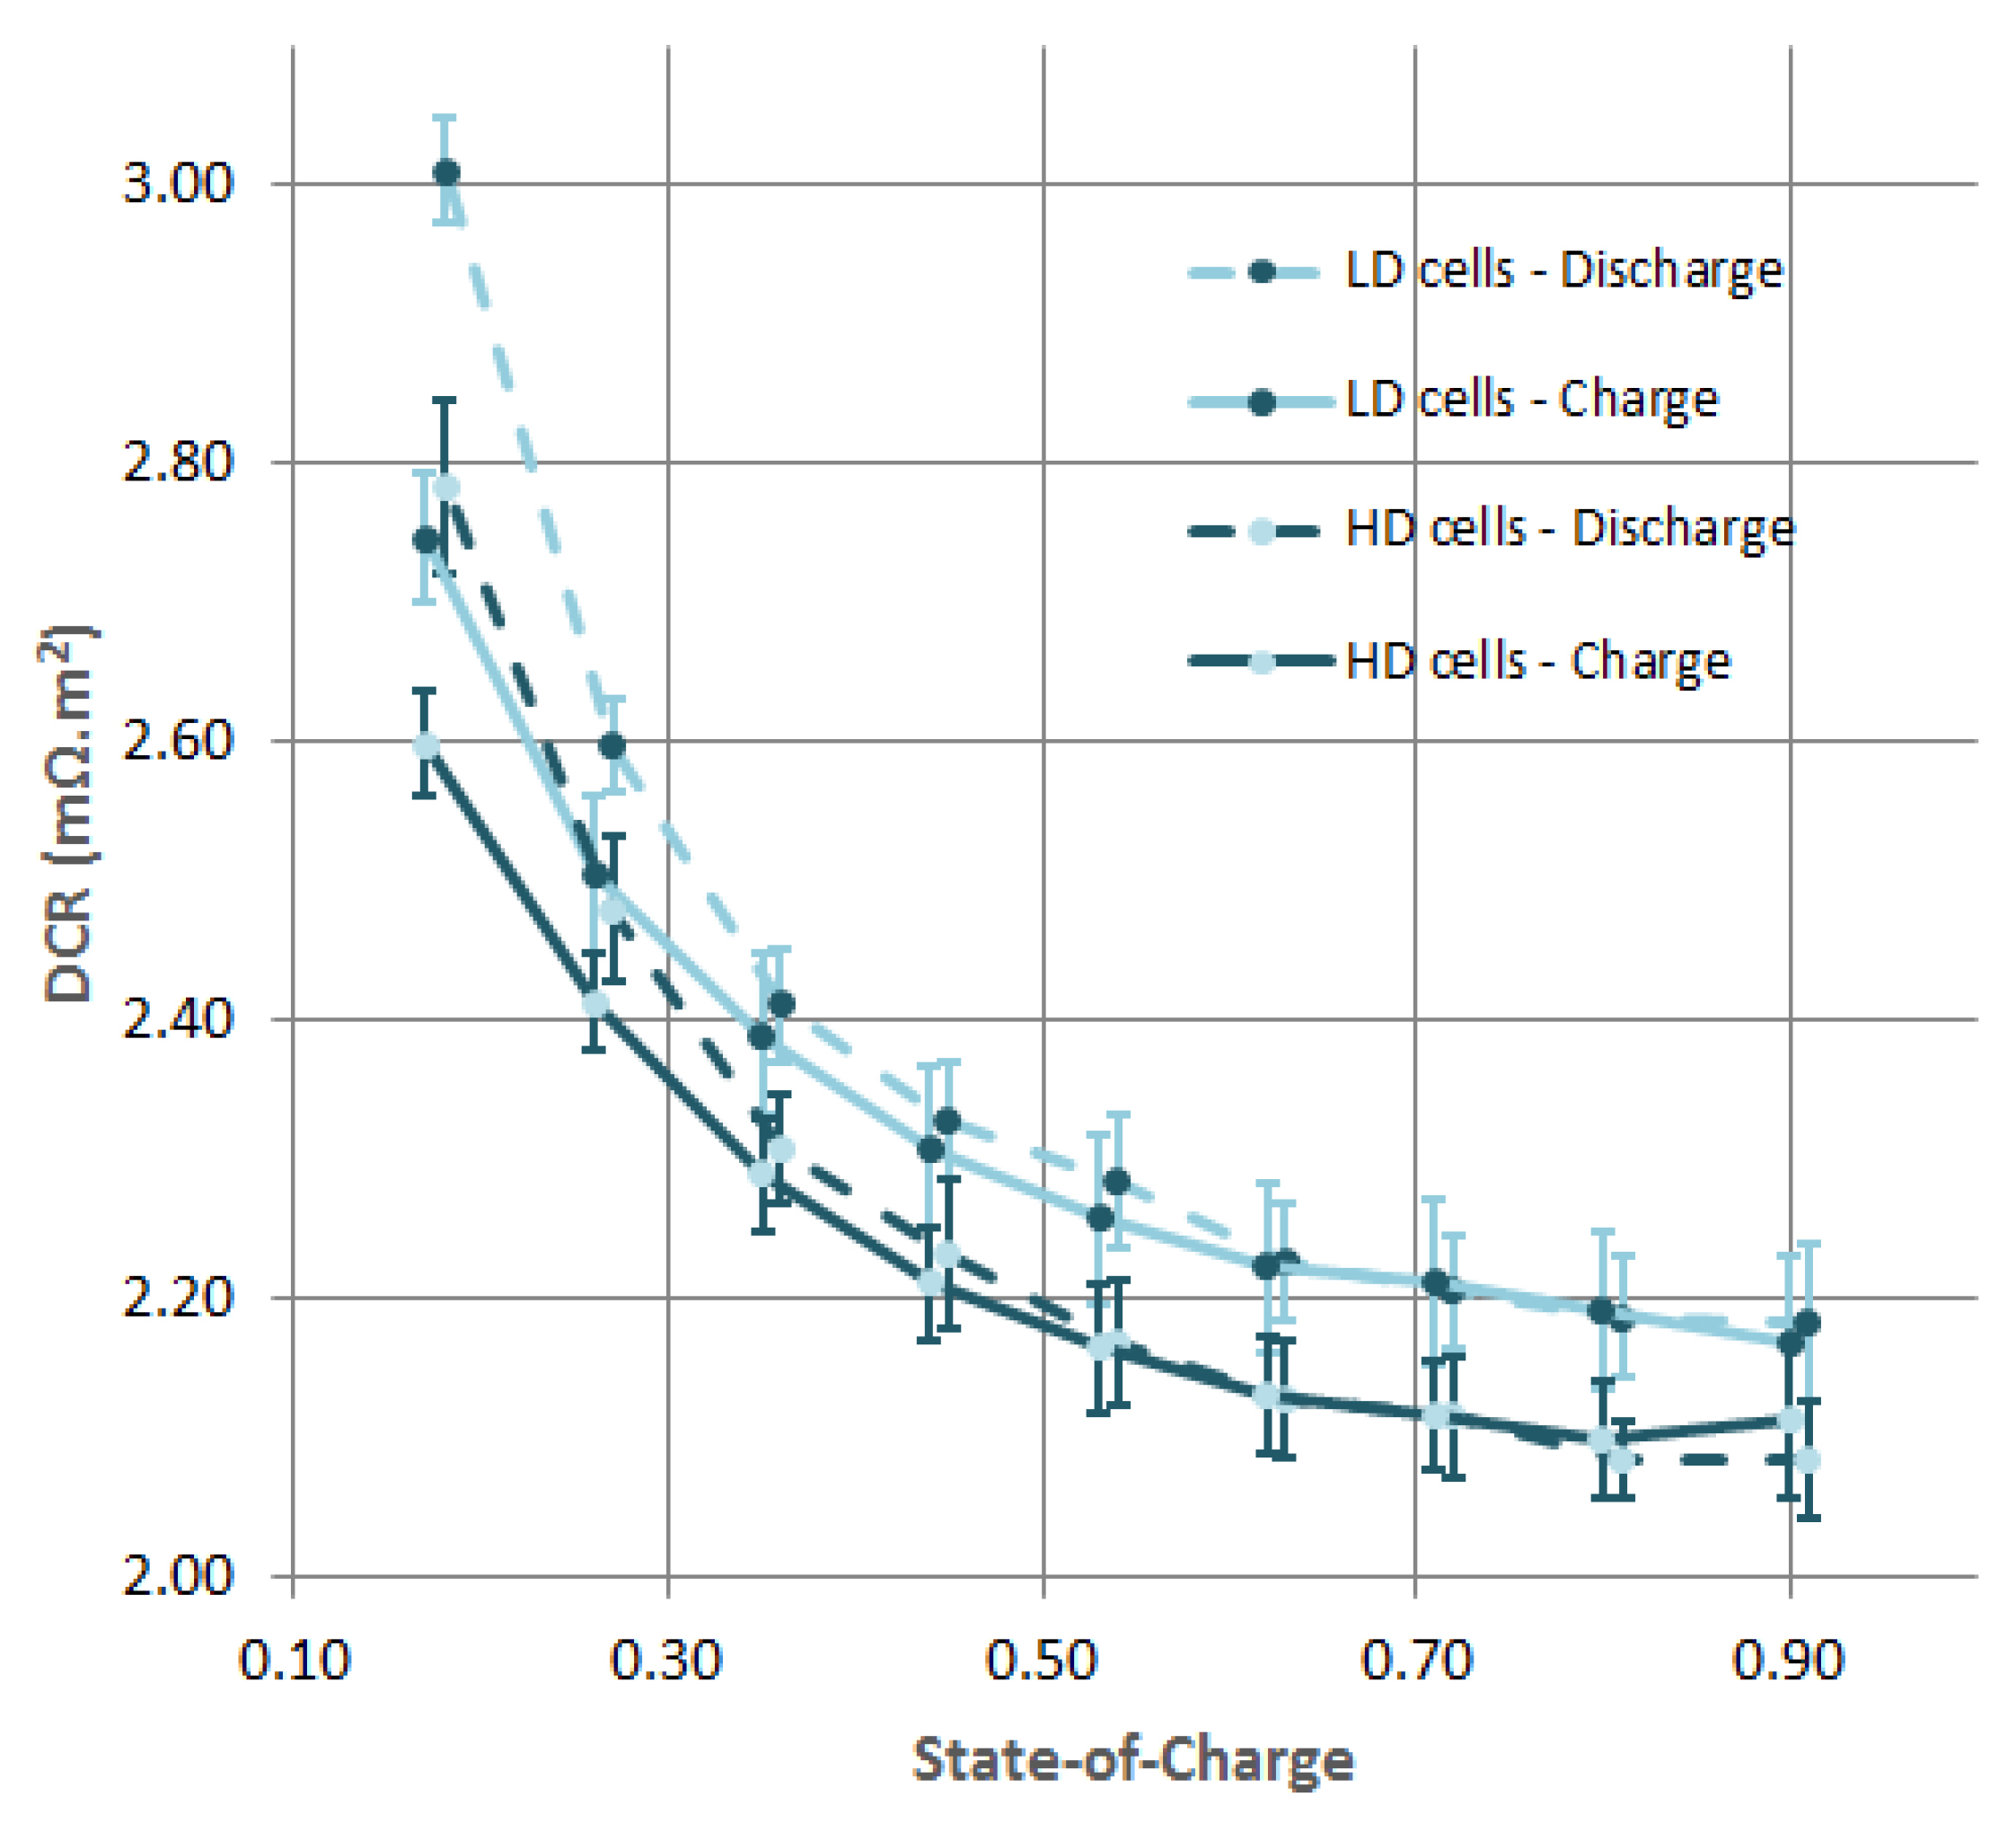
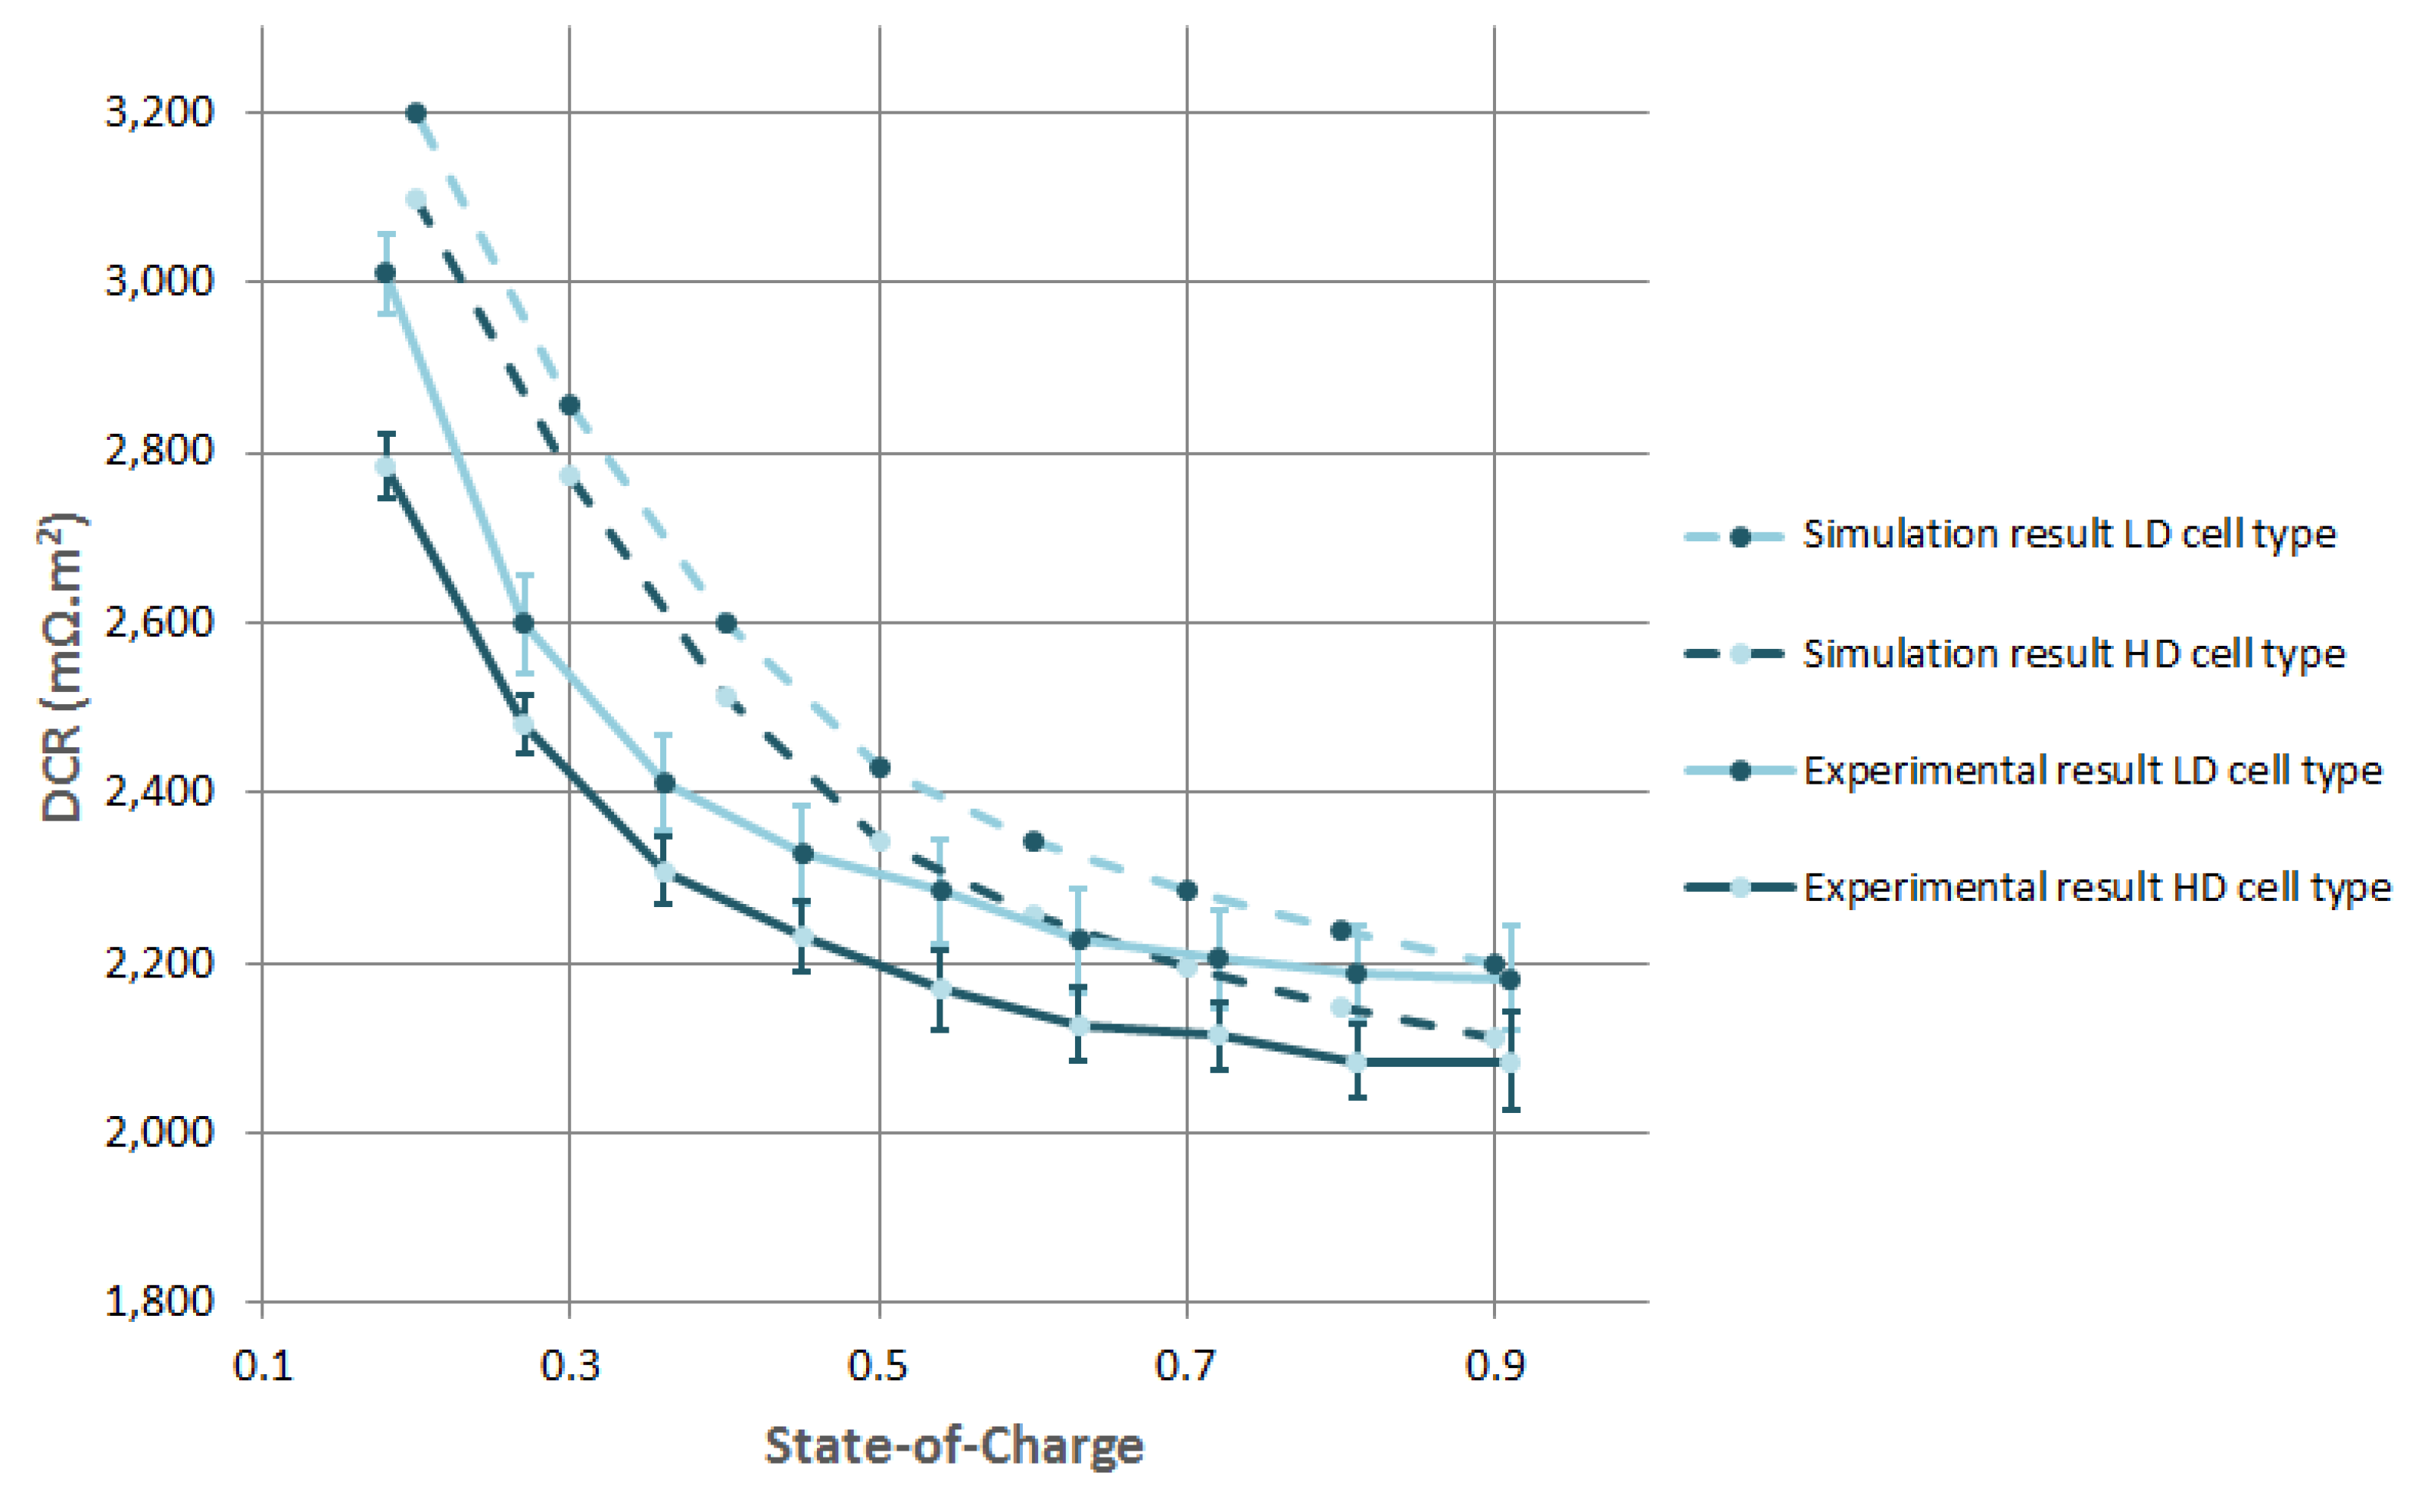
The measurements of the DCR, based on a current pulse profile, is given in
Figure 3 for charge and discharge. The average DCR of all cells was taken, and the width of the error bars equals two times the standard deviation. For reasons of clarity, only the results of the DCR for the HD and LD cell types are depicted. For all cell types, there is a decreasing trend as the SoC increases. The difference in DCR between the HD and LD cell types is quite constant over the considered SoC window. LD cell types have a larger DCR: on average, it is 0.116 mΩ·m
larger for discharge pulses and 0.097 mΩ·m
for the charge pulses. Expressed relative to the lowest value, the difference is on average
for discharge and
for charge. Except for low SoC values, charge and discharge pulses result in the same DCR. At low SoC values, discharge pulses give a higher DCR. The relatively large spread among the DCR measurements is caused by: cell to cell variations, slight temperature variations depending on the position in the climate room, systematic differences in the experimental setup and/or measurement, and variations in post-processing of the data.
Figure 2.
Influence of the positive electrode density on the discharge capacity at multiple current rates. HD stands for High Density, MD for Middle Density and LD for Low Density. The capacity is given relative to the MAC. The width of the error bars are twice the standard deviation.
Figure 2.
Influence of the positive electrode density on the discharge capacity at multiple current rates. HD stands for High Density, MD for Middle Density and LD for Low Density. The capacity is given relative to the MAC. The width of the error bars are twice the standard deviation.
Figure 3.
Influence of the positive electrode density on the Direct Current Resistance at multiple SoC levels. HD stands for High Density and LD for Low Density. The Ohmic cell resisance (or DCR) is given for 1 m of positive electrode. The width of the error bars equals two times the standard deviation.
3.3. Discussion
The LIB cells under investigation with high density positive electrodes show a lower DCR (see
Figure 3) and have a slighly higher discharge capacity at low current rates (see
Figure 2). This indicates that the resistive part of the impedance of the HD cell types is lower. As indicated above, this is attributed to a lower contact resistance and a lower electric resistance of the electrode matrix. Discharge capacities at high current rates are significantly lower for MD and HD cell types. This effect can be explained by a lower porosity and possibly a deteriorating tortuosity of electrodes which are more compacted. Given the demands of the EV industry for high energy dense and cheap LIBs, there is an incentive to make electrodes thick up to 100 μm [
11]. In light of these results, we believe that positive electrode density of Li
Ni
Mn
Co
O
based CEs will play an important role in LIB performance. The effects discussed above are expected to be larger in high energy density cells with thick electrodes.
4. Model Validation
PET for LIBs is developed by Newman
et al. and, since then, has been further improved upon by multiple research groups [
6]. In addition, aging mechanisms have been included [
27]. The PET model contains a number of physical and geometrical simplifications which are to an extent validated in literature. In the context of a changing electrode density, geometrical simplifications related to the microscopic electrode structure are examined by measuring and digitizing the 3D structure of electrodes. We would like to refer to references [
25,
28,
29] for further reading on this topic. Experimental validation of published models, however, have been rather limited. In many cases, the presented model is validated over different current ranges. Validation of the influence of the design specifications of an LIB, as mentioned in
Section 2, is hardly available. In order to establish a well working LIB model, it should ideally be validated over the whole space of input parameters and for all relevant performance parameters. This is a massive task. One of the input parameters is the PE density (directly related to the electrode thickness). The impact of this was experimentally measured, results are given in the previous paragraph. The three cell types were simulated with our in-house developed PET model presented in reference [
20]. In
Table 2, a summary of the mathematical framework is given.
Table 2.
Porous electrode theory (PET) model of Li-ion battery [
20].
Table 2.
Porous electrode theory (PET) model of Li-ion battery [20].
| Domain | Equations | Boundary Conditions |
|---|
| Electrodes | | at the electrode-electrolyte interface |
| at current collectors |
| at the electrode-electrolyte interface |
| Electrolyte | | at the electrode-electrolyte interface |
| = 0 | at the electrode/electrolyte interface |
The goal of our work is to investigate the ability of PET to predict changes in the manufacturing process towards performance parameters of the cell (DCR and energy density). The input parameters altered by higher pressure applied during calendaring are reflected by a different electric conductivity, thickness, porosity, tortuosity and specific surface area.
The model input parameters which are different from the HD cell types to the LD cells are given in
Table 1. All material related parameters, influenced by its structure are given in reference [
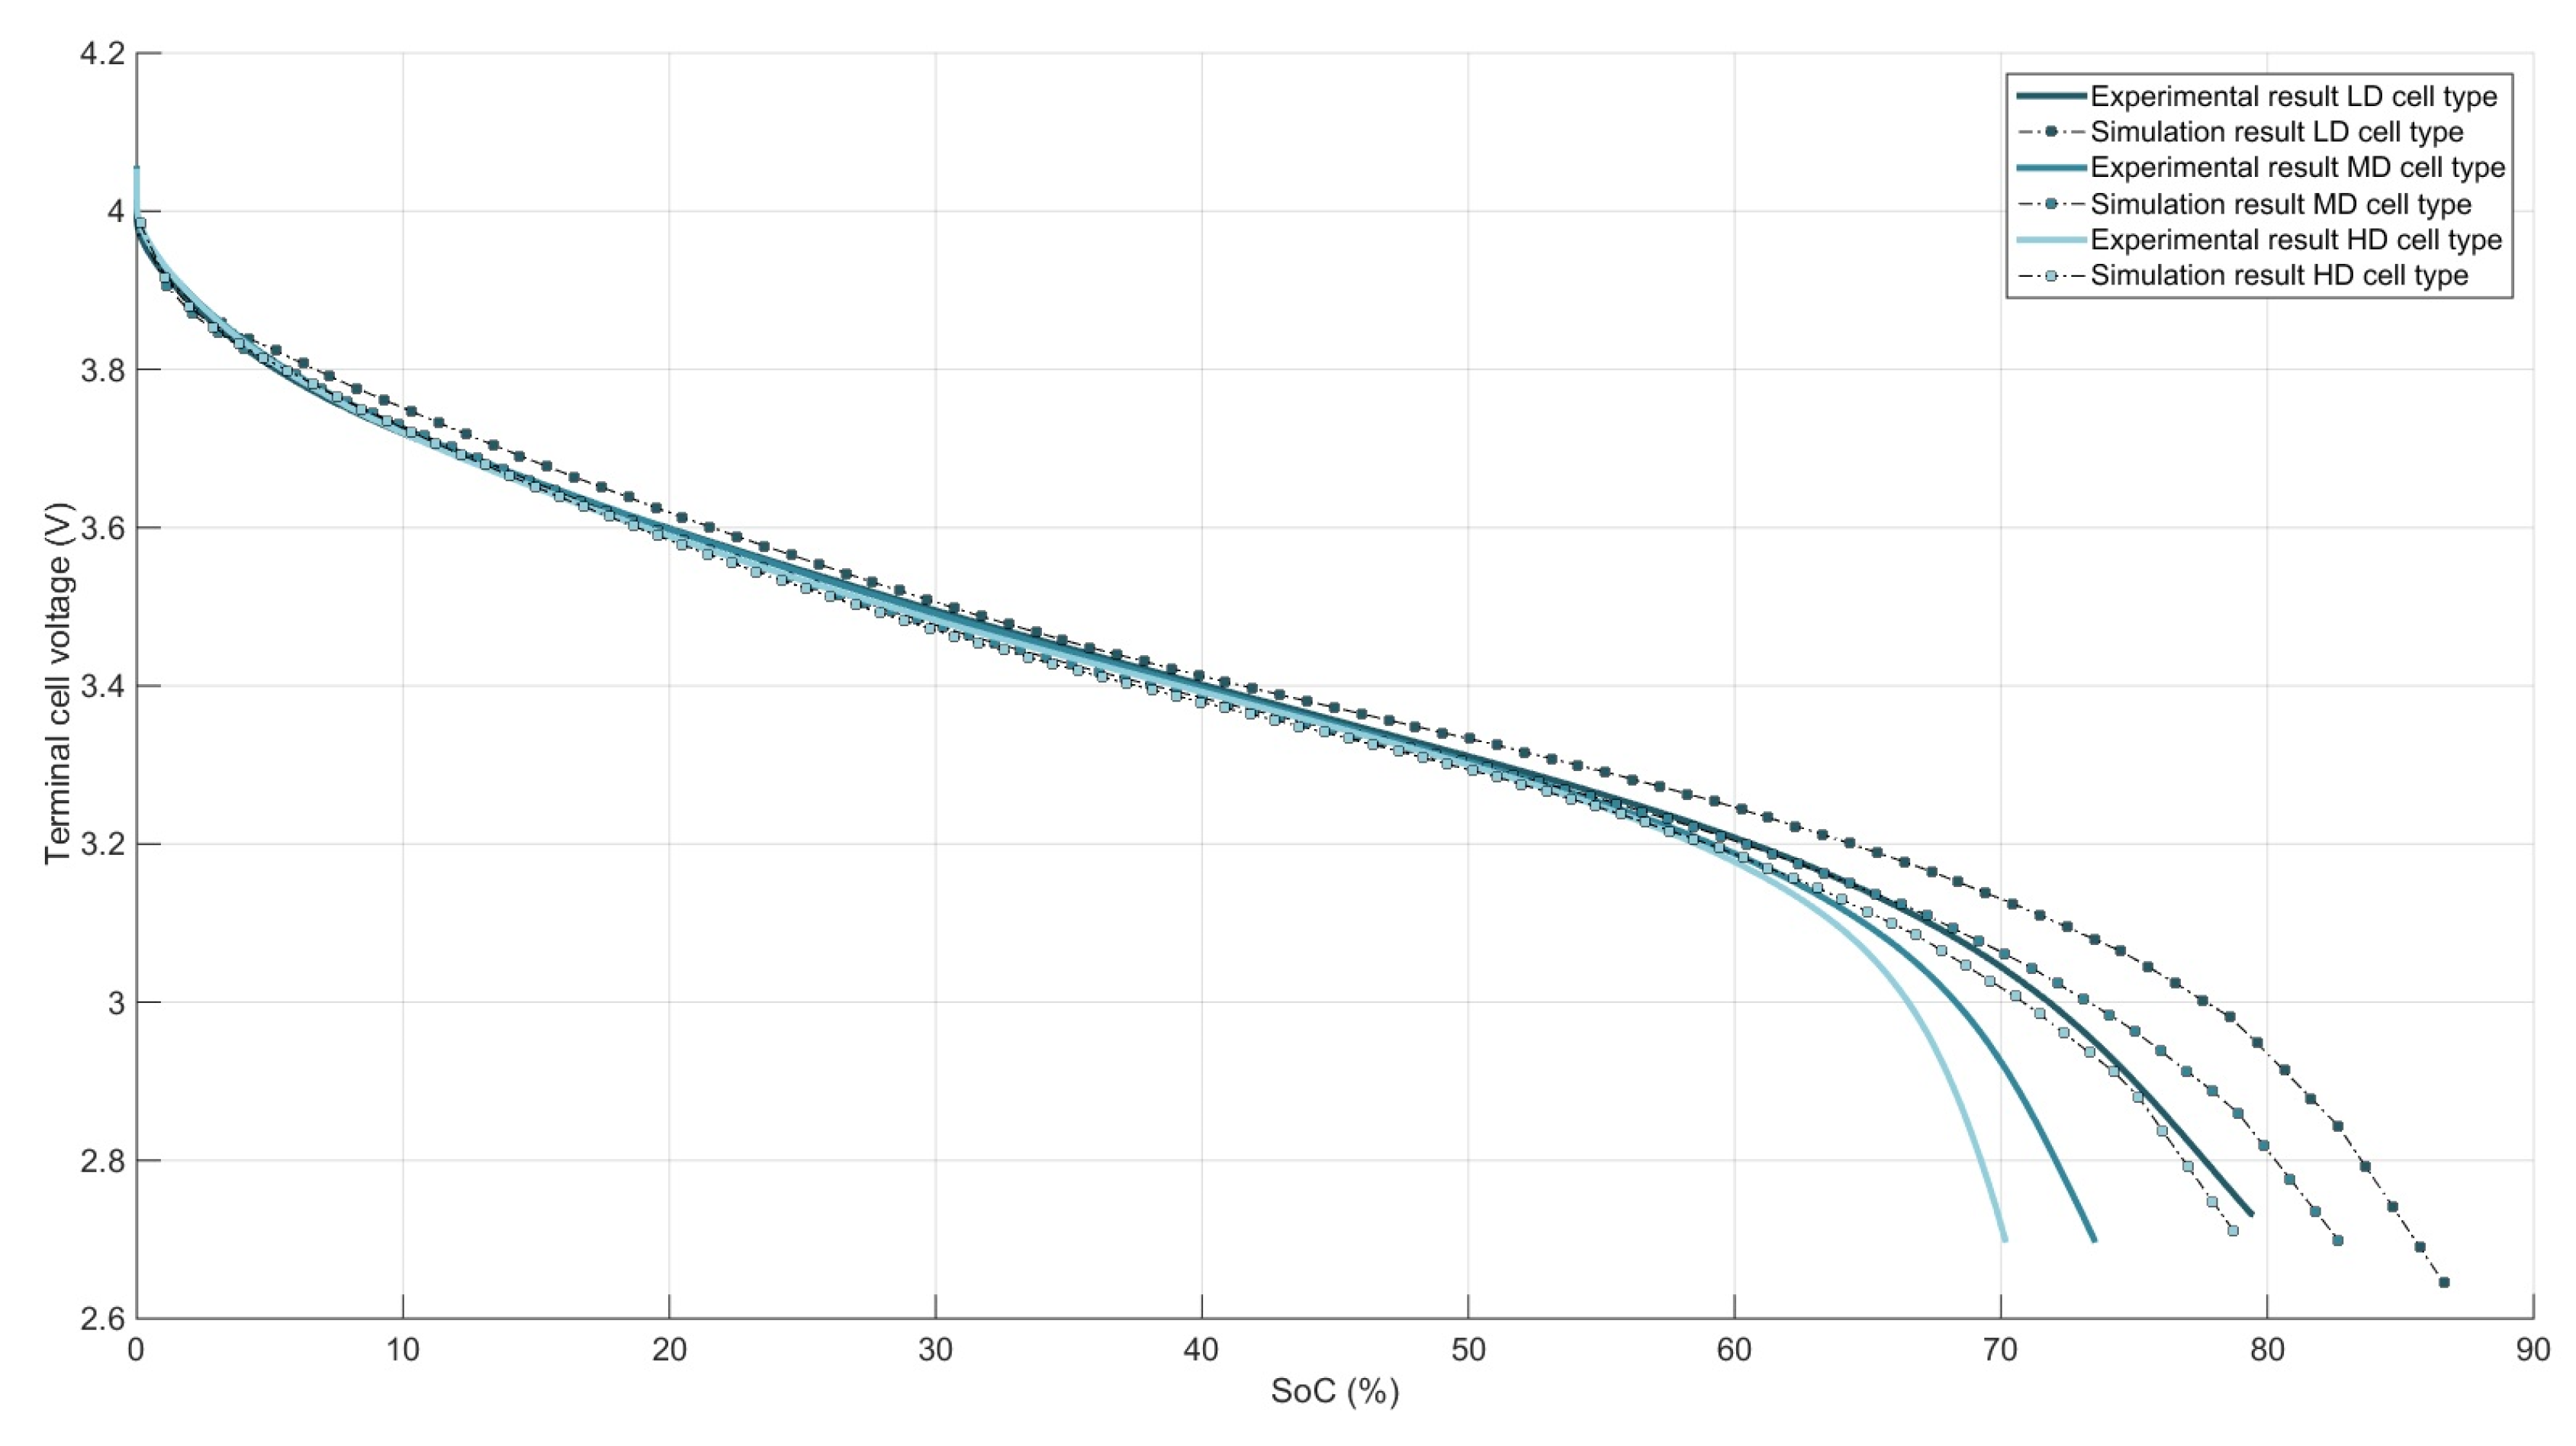
20]. As an example, three experimental and three simulated 5C constant current discharge curves are given in
Figure 4 for the HD, MD and LD cell types. The difference between HD, MD and LD cell types is almost insignificant until 60% SoC. From then on, the polarization from the cell types with a higher PE density increase significantly. As a result, HD and MD cell types reach the cut-off voltage, respectively 9% and 4% SoC on average faster the LD cell type. As for the simulated discharge curves of the three cell types, we see and overestimation of the discharge capacity from 5% to 9% SoC compared to their experimental counterparts. The prediction of the influence from LD
versus HD and MD cell types is well predicted, respectively 7% and 3% SoC. Over the whole SoC window, however, the model predicts a small difference in polarization between HD
versus LD cell types, which is not present in reality until 60% SoC.
In
Figure 5, the results of all experimental and simulated discharge curves are summarized by repeating the data from
Figure 2 and adding the predictions of simulated discharge curves. As can be seen, there is a general overestimation of the discharge capacities by the simulation. This difference is presumably caused because the simulated cells are modelled as fresh cells with no loss of AM, and LIBs are known to lose a significant amount of capacity in the first few cycles, after which they become more stable. The relative effect of a higher positive electrode density, however, is well predicted. As discussed, the effect of the higher PE density becomes apparent at current rates higher than 3C, in reality as well as in the simulation. At 4C, the effect is still underestimated by the model whereas at 5C, the difference in discharge capacity is relatively well predicted.
Figure 4.
Experimental and simulated 5C discharge curves of a three different cell types.
Figure 4.
Experimental and simulated 5C discharge curves of a three different cell types.
Figure 5.
Discharge capacity at multiple current rates relative to the MAC for three different cell designs: from low to high PE density. The three dashed curves are predictions based on simulation results, the full lines are experimental results.
Figure 5.
Discharge capacity at multiple current rates relative to the MAC for three different cell designs: from low to high PE density. The three dashed curves are predictions based on simulation results, the full lines are experimental results.
Next, the discharge pulses for the three cell types were simulated from which the DCR was extracted. These results are given in
Figure 6. As this figure illustrates, the PET model is capable of predicting the general trend of the evolution on the DCR over the considered SoC window. However, accurate prediction is difficult, especially at low SoC. The difference in DCR between the LD cell types and HD cell types is fairly well simulated and constant over the whole SoC range, being on average 0.089 mΩ·m
. As mentioned before, this difference is caused by the difference in electric conductivity of the PE electrode matrix given in
Table 3. If the electric conductivity of the PE matrix becomes higher then 1 S/m, its influence on the DCR of the cell becomes insignificant. The increasing of DCR when going from 50 to 10% SoC is, based on our model, explained by the varying exchange current density of the PE over the SoC window. The exchange current density is a function of lithiation of the AM.
Figure 6.
Experimental and simulated DCR values of two different cell types.
Figure 6.
Experimental and simulated DCR values of two different cell types.
Table 3.
Material and cell design parameters of the positive electrode which change for the different cell design.
Table 3.
Material and cell design parameters of the positive electrode which change for the different cell design.
| Parameter | Symbol (Unit) | LD | MD | HD |
|---|
| Electrode thickness | δ (μm) | 52.0 | 48.5 | 46.0 |
| Volume fraction of electrolyte | | 0.321 | 0.272 | 0.233 |
| Electric conductivity | (S/m) | 1.00 | 0.60 | 0.20 |
5. Conclusions
To continue to improve the performance of state-of-the-art LIBs, accurate battery models are required.
These models should provide us with reliable prediction in function of material parameters and battery manufacturing parameters. If done so based on an accurate scientific frame work, the results can be extrapolated over a wide range of material and manufacturing parameters, enabling battery and system designers to find the best solutions for their applications. From this work, we conclude that PET shows good promise to simulate LIBs at reasonable computational cost.
This work investigated the applicability of PET for breaking down the impacts of manufacturing processes on the dynamic performance of LIBs. The effect of one manufacturing parameter, the density of the PE, was experimentally investigated for an NMC/graphite based cell. Cells with high PE density show a slightly higher discharge capacity at low current rates. At high current rates, cells with a low PE density clearly show a better performance. We would like to stress that this effect is likely to be more pronounced at lower rates if the electrodes were made with more AM per cm of electrode (higher loading, thicker electrodes or, in other words, more energy dense cells). When observing the DCR, high density PEs are better, showing a 4% to 5% lower DCR.
The PET model was capable of predicting the relative difference of the effect PE density for the measurement of the DCR as well for measurement of the discharge capacity. To achieve an accurate validation over the whole set of experimental data still remains cumbersome.

 ,
, 


