Review

Overcoming the Fundamental Limit: Combustion of a Hydrogen-Oxygen Mixture in Micro- and Nano-Bubbles

1
MESA+ Institute for Nanotechnology, University of Twente, PO 217, Enschede 7500 AE, The Netherlands
2
Yaroslavl Branch of the Institute of Physics and Technology, RAS, Yaroslavl 150007, Russia
*
Author to whom correspondence should be addressed.
These authors contributed equally to this work.
Energies 2016, 9(2), 94; https://doi.org/10.3390/en9020094
Submission received: 29 November 2015 / Revised: 22 January 2016 / Accepted: 26 January 2016 / Published: 3 February 2016
(This article belongs to the Special Issue Micro Combustor)

Abstract

:
Combustion reactions quench in small volumes due to fast heat escape via the volume boundary. Nevertheless, the reaction between hydrogen and oxygen was observed in nano- and micro-bubbles. The bubbles containing a mixture of gases were produced in microsystems using electrochemical decomposition of water with a fast switching of voltage polarity. In this paper, we review our experimental results on the reaction in micro- and nano-bubbles and provide their physical interpretation. Experiments were performed using microsystems of different designs. The process was observed with a stroboscope and with a vibrometer. The latter was used to measure the gas concentration in the electrolyte and to monitor pressure in a reaction chamber covered with a flexible membrane. Information on the temperature was extracted from the Faraday current in the electrolyte. Since the direct observation of the combustion is complicated by the small size and short time scale of the events, special attention is paid to the signatures of the reaction. The mechanism of the reaction is not yet clear, but it is obvious that the process is surface dominated and happens without significant temperature increase.

1. Introduction

In the modern world, there is a strong interest in miniaturization of a variety of systems. Small systems are often less expensive for mass production; they can have properties exceeding those of large systems; small systems may be combined in complex devices without significant increase of volume; and they may facilitate extended or improved performance of large systems (cars, for example). To drive any microsystem, there must be an engine that has to be at least not significantly larger than the system itself. This restriction is a bottleneck for many microsystems. In the macroworld, we are using mainly internal combustion engines and electromagnetic motors that have proven their efficiency and reliability. However, in the microworld, these engines are not available. Small electromagnetic motors cannot generate forces of useful magnitude because it is not possible to scale down the coil size. Small internal combustion engines loose their efficiency due to the increase of the surface-to-volume ratio, which is responsible for fast heat loss from the reaction chamber [1,2].
Miniaturization of engines demands also shorter working cycles, but it happens to be difficult to build an engine that is both fast and strong. This problem is well recognized in the microelectromechanical community [3,4]. Existing microengines (actuators) use mostly two types of forces [3,4,5,6]: electrostatic forces and forces generated by thermal expansion. The electrostatic actuators are fast, but weak. This is due to low energy density accumulated in the electric field. On the other hand, the actuators using the thermal principle are strong, but slow. Their response time is restricted by the diffusion process. Most advanced piezoelectric actuators [7] are fast and strong, but not compatible with microtechnology, need a high voltage for actuation and have a small stroke. Actuators using electrochemical decomposition of water were also discussed in many papers [8,9,10,11,12,13,14], but they are notoriously slow. One can produce a large amount of gas in a short time, but it is impossible to get rid of this gas fast, as well. The fastest electrochemical actuator reported up to date [15] has a response time in the range of minutes.
Internal combustion engines having all three dimensions in the range of micrometers do not exist at all. The smallest size of microcombustors [16,17] is a little bit smaller than one millimeter with two other dimensions to be significantly larger. Due to severe heat losses for small-scale combustion systems, possible flame extinction requires a delicate balance between heat loss and heat generation [18,19] when designing microcombustors.
In spite of heat losses, the reaction between hydrogen and oxygen was recently observed in extremely small volumes: nanobubbles [20]. Using a special electrochemical process of water decomposition in which the polarity of the applied voltage is alternated at frequencies of the order of 100 kHz, nanobubbles containing a mixture of hydrogen and oxygen were produced. The gas production was observed with a stroboscope. It was found that with the frequency increase, the production of visible bubbles is strongly reduced, while the Faraday current changes very little. When the stoichiometric balance between H 2 and O 2 production close to a single electrode was broken, the bubbles appeared in the system again. These phenomena were explained by the reaction between gases in the nanobubbles, which are produced homogeneously due to an extremely high supersaturation near the electrodes [21].
The gas concentration in the electrolyte produced by the alternating polarity pulses was directly measured with a vibrometer. It demonstrated oscillations [20] that were in phase with the driving electrical pulses. Without the reaction between gases, this concentration would increase monotonously, and the oscillations would not be possible. Additionally, the surface of the electrodes was strongly modified on the nanoscale for such non-reactive materials as platinum or gold. This was explained by nanoexplosions close to the surface of the electrodes.
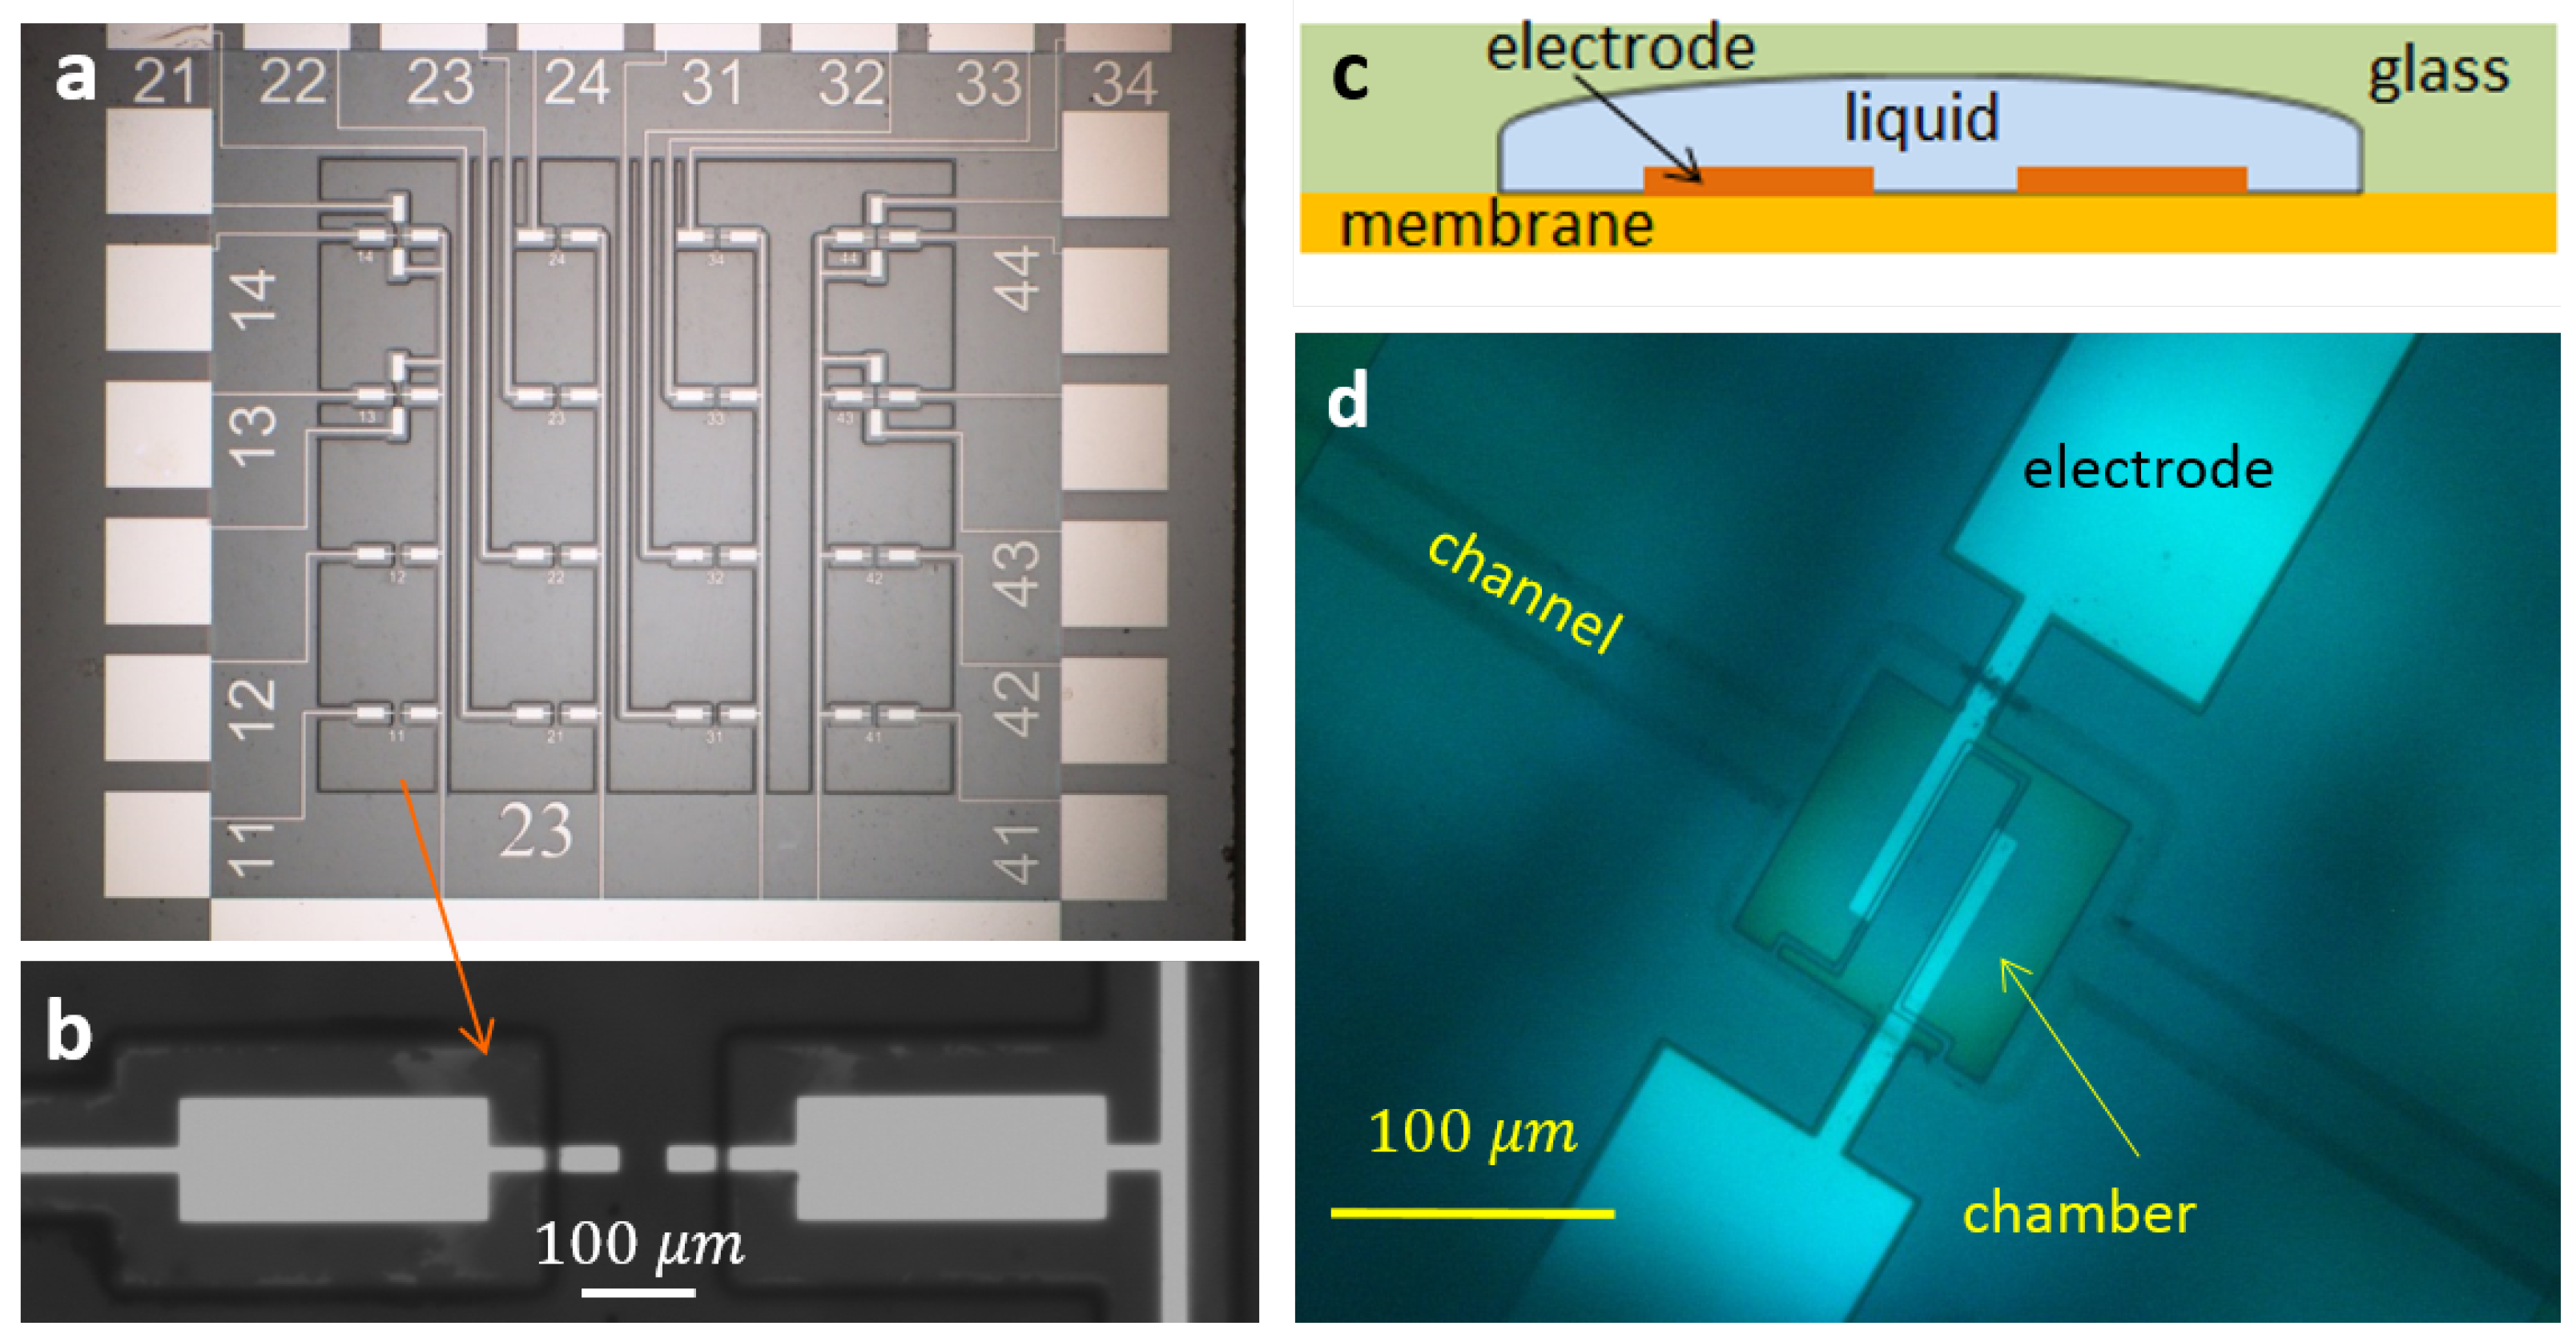
To run the process in a closed microchamber, a special microfluidic device was fabricated [22]. The chamber containing electrodes and filled with the electrolyte was covered with a transparent flexible membrane. Pressure in the chamber was estimated by measuring the deflection of the membrane with the vibrometer. On the other hand, the small thermal mass of the membrane made it possible to measure the temperature change in the chamber. This was done using the temperature dependence of the electrolyte conductivity. It was found that the amount of gas produced by the measured Faraday current has to be much larger than the volume of the chamber. The fact that this gas is not observed is a strong argument in favor of the reaction. Pressure in the chamber increases with time, but then saturates at the value of a few bars. In the steady state, all of the gas produced electrochemically is consumed in the reaction.
The combustion reaction is a highly exothermic process. Energy released in the reaction has to have a measurable thermal effect. The effect is not as large as for classical combustion due to significant heat losses via the volume boundaries, but nevertheless, it was reliably separated from the background Joule heating [22]. It was stressed also that the external temperature influences strongly the rate of pressure increase in the chamber. This effect was related to the rate of nucleation of nanobubbles.
A high concentration of gases in the electrolyte is possible due to high Laplace pressure in nanobubbles. At some conditions, the gas concentration can be large enough that the nanobubbles start to touch each other, merge and form optically visible microbubbles. This effect was observed [23] and revealed interesting features. Microbubbles appearing on very short time scales ( < 10 μ s) were directly observed in the chamber by means of stroboscopic illumination. The appearance of these bubbles was accompanied by strong pressure jumps in the chamber. It was concluded that the short-lived microbubbles are formed by coalescence of H 2 and O 2 nanobubbles, igniting the reaction in a microbubble spontaneously, thereby destroying the bubble in a short time with resulting jumps in pressure.
Not all possible methods to investigate the reaction in small volumes have been explored so far. For example, the reaction between hydrogen and oxygen is based on branching, propagation and termination of H, O, OH and HO 2 radicals [24]. Some of these radicals can survive in the solution long enough to be picked up with radical scavengers. It is difficult to see nanobubbles because they do not scatter visible light. However, they can be visualized by scattering UV light or neutrons [25]. The dynamics of short-lived microbubbles can be investigated in more detail with a high speed camera. The final purpose of the investigation is to understand the mechanism of the reaction in small volumes. It is obvious that this mechanism is different from macroscopic combustion, and it has to be surface dominated.
In this paper, we review the experimental facts that are known about the reaction in nano- and micro-scopic volumes up to date. Physical interpretation of the observations is proposed. We do not discuss any specific device, but concentrate on the basic principle that allows combustion in three-dimensional microscopic volumes. Although the paper is positioned as a review, it contains a number of figures that were not published before and includes new details in the description of the physical processes.
The paper is organized as follows. In Section 2, we describe the microchips that have been used in the experiments and explain the short-time electrochemical process. In Section 3, the signatures of the reaction in nanobubbles are presented. Observations of the reaction in microbubbles are described in Section 4. The discussion of the experimental results is presented in Section 5. Our conclusions are collected in the last section.

2. Setup and Process

Up to now, the reaction between H 2 and O 2 gases was observed in nano- and micro-scopic volumes only inside of bubbles containing a mixture of the gases. The bubbles were produced electrochemically using a special procedure described below. Two different microsystems that were in use are also described in this section.

2.1. Microchips

The main part of the setup is a microchip. A simple chip was fabricated on BF-33 Borofloat glass wafer. First, a Ti sublayer was deposited on the glass (10 nm) for better adhesion, then a 100 nm-thick metallic layer was sputtered. Different metals, such as Pt, Pd, Au or W, were used, but the main part of the experiments were made with platinum electrodes. The metals were patterned and selectively covered lithographically with insulating SU8resist. Different thicknesses of the SU8 layer of 3 and 90 μ m were used. The wafers were diced into separate chips with a size of 12 × 12 mm 2 . Each chip (see Figure 1a) contained 16 pairs of microelectrodes of different shapes and sizes with corresponding contact pads to electrically address specific electrode pairs. A drop of electrolyte was put on the chip and then covered with a thin glass plate. The gas formed above the electrode was observed with a homemade stroboscope [26].
Figure 1. (a) Simple microchip. The chip contains 16 pairs of electrodes and contact pads. SU8photoresist is used as an insulating layer. (b) Zoomed image of a pair of electrodes. (c) Schematic view of the microfluidic chip (cross-section). (d) Top view of the chamber in the microfluidic chip.
Energies 09 00094 g001
More sophisticated microfluidic chips were fabricated on Si wafer covered with a layer of silicon-rich nitride (SiRN) (thickness 530 nm) containing deposited Pt electrodes of different designs. This layer played the role of the membrane covering the reaction chamber. The membrane was made free by etching the wafer from the back side. The chamber and filling channels were isotropically etched in a Borofloat wafer. The glass and Si wafers were anodically bonded, as shown in Figure 1c. A polysilicon thermal sensor designed for four-probe measurements was fabricated underneath the electrodes (see the details in [22]). The bonded wafers were diced into separate chips of 2 × 1 cm 2 in size. The chamber had nominal dimensions of 100 × 100 × 5 μ m 3 . For the microfluidic chips, the process was observed with the stroboscope and with a vibrometer (Polytec MSA-400). In the latter case, it was possible to observe the process from the top (via glass) or from the bottom focusing the laser beam ( λ = 633 nm) with a diameter of 1 . 5 μ m on the membrane.

2.2. Short-Time Electrolysis

The bubbles were produced electrochemically, in most cases in 1 M solutions of Na 2 SO 4 in water. To observe the reaction, one has to pump a high concentration of gases into the solution. This can be done using the so-called short-time electrolysis. The idea is rather simple. A short voltage pulse of duration τ produces gas that is distributed within the diffusion layer with a thickness of l D D τ , where l D is the diffusion length and D is the diffusion coefficient of the gas in liquid. For τ 10 μ s, this length is as short as 200–300 nm, and only nanobubbles can be formed in the layer. The gas concentration (H 2 for definiteness) within the diffusion layer above the electrode can be estimated as n g j F τ / 2 e l D , where j F is the Faraday current density averaged over the area of the electrode and e is the electron charge. In the microsystems used in the experiments, the average current density was j F = 100–300 A/cm 2 . Then, the gas concentration is estimated as n g (1.5–4.5) × 10 26 m - 3 . This concentration corresponds to a relative supersaturation of hydrogen S = 320–960 with the local values up to five-times larger. This large amount of gas cannot exist long in the non-equilibrium state. The bubbles will nucleate already during the time τ, but space and time restrictions allow the formation of only nanobubbles, which nucleate nearly homogeneously above the surface. This homogeneous formation of hydrogen or oxygen was, indeed, observed [21].
Applying a negative or positive voltage pulse to the electrode (the other electrode is grounded), we produce H 2 or O 2 bubbles above this electrode. To make bubbles containing both gases, one has to produce high concentrations of H 2 and O 2 above the same electrode at the same time. This can be easily realized by switching the polarity of the voltage pulses at sufficiently high frequency. Suppose we apply a negative square pulse of a duration of 5 μ s to the electrode. Then, H 2 nanobubbles will nucleate homogeneously above this electrode. If the next square pulse is positive and also lasts for 5 μ s, half as many O 2 molecules will be produced above the same electrode. These molecules can form separate O 2 nanobubbles or, with a higher probability, can diffuse into existing H 2 nanobubbles. The latter is because the energy barrier for bubble nucleation is always finite, but there is no barrier for diffusion. In this way, we can produce some number of H 2 and O 2 nanobubbles and a larger number of bubbles containing mixtures of hydrogen and oxygen. The situation is illustrated in Figure 2.
Figure 2. Schematic view of the nanobubbles formed above the electrode. The bubbles are concentrated in the diffusion layer of thickness l D .
Energies 09 00094 g002

3. Reaction in Nanobubbles

It is a difficult task to prove the presence of the reaction in nanobubbles, because it happens in a small volume (size 100 nm) in a very short time ( 1 - 5 μ s), and the reaction product is just water. There are no direct methods with appropriate space and time resolutions. All of the evidence of the reaction happening in nanobubbles is indirect. Nevertheless, this evidence is strong enough to consider it seriously. In this section, we discuss this evidence.

3.1. Gas Production

Nanobubbles containing only H 2 or only O 2 gases are not able to react, and they are collected in the system increasing with time the total concentration of gases. According to the standard combustion theory [27,28], nanobubbles containing a mixture of gases are not able to react. The reasons are the following. First, there is no ignition mechanism that will produce initial radicals in the bubble. Second, the reaction cannot sustain itself, since the heat escapes too quickly: a characteristic time τ h for the heat escape from a small bubble of radius R is estimated as τ h R 2 / π 2 χ g , where χ g 0 . 9 × 10 - 4 m 2 /s is the heat diffusion coefficient in the stoichiometric gas mixture. It has to be noted that this time is limited by the heat diffusion in gas, because the heat conductivity of liquid is much better. Even for microbubbles with R 5 μ m, the time τ h is rather short, τ h 30 ns. Already, this simple fact means that the reaction in micro- and nano-bubbles has to be a surface-dominated process similar to a catalytic effect.

3.1.1. Gas Disappearance

The first signature of the reaction happening in the alternating polarity process is disappearance of the visible gas production [20]. Square pulses of alternating polarity at some frequency f are applied to the electrodes. At frequencies f < 20 kHz, a large amount of gas is produced, which is comparable to that produced by the single polarity pulses. At higher frequencies, this amount is drastically reduced, while the Faraday current responsible for the gas production does not change significantly. The situation is illustrated in Figure 3. In all three images, the process was driven by alternating polarity pulses at U = 8 V during t = 400 μ s, but the frequencies were different: 100, 150 and 200 kHz for Panels (a), (b) and (c), respectively. The graph under each image shows the Faraday component of the current as a function of time. For each run, the total current through the electrolyte was recorded. The total current includes the Faraday component and the reactive component responsible for the charging-discharging effects at the interface. For each half of the pulse, the Faraday current was extracted from the data [21] (see also below) and plotted as a dot.
Figure 3. (a,b,c) The stroboscopic snapshots made at t = 400 μ s for the driving pulses with U = 8 V and f = 100 , 150 , and 200 kHz, respectively. The corresponding Faraday current is plotted under each image (two points per period).
Energies 09 00094 g003
The Faraday current is responsible for the gas production. The number of gas molecules N produced during the time τ = 400 μ s is N = ( 3 / 4 e ) 0 τ d t I F ( t ) , where the factor three originates from two parts of H 2 and one part of O 2 molecules produced electrochemically. Using the current presented in Figure 3, we can estimate this number as N = 4 × 10 12 . When the process is switched off and the pressure in the chamber is relaxed back to normal, according to the equation of state, all of these molecules have to fill the volume equal to 3 . 3 V c h , where V c h = 5 × 10 4 μ m 3 is the volume of the chamber. We never observed this amount of gas in the chamber for the alternating polarity process. The pressure gets back to normal on a time scale of 100 μ s, but only a few percent of the chamber volume is filled with gas after this delay.

3.1.2. Stoichiometric Ratio

Gas disappearance is closely related to stoichiometric production of the gases above the same electrode. When the alternating polarity pulses are applied, in the vicinity of the electrode, there is 2:1 ratio between H 2 and O 2 gases and very little gas is observed. As soon as this ratio is broken, the gas reappears in the system. For example, if we apply single polarity pulses, only H 2 or only O 2 is produced above the same electrode. This gas forms easily visible bubbles above different electrodes, which live for a long time after switching off the driving pulses. The ratio 2:1 can also be broken by changing the duty cycle D of the alternating pulses. If the electrode is 50% of the time at a negative and 50% of the time at a positive potential, very little visible gas is formed. If the relation D = 0 . 5 is changed in any direction ( D > 0 . 5 or D < 0 . 5 ), the visible gas appears in the system. The situation is illustrated in Figure 4 for two microelectrodes immersed in the electrolyte.
Figure 4. Dependence of the visible gas production on the duty cycle of driving pulses D(fraction of time when the working electrode (bottom) is at negative voltage). The images were taken for the simple chip at t = 200 μ s. The pulses correspond to U = 4 . 5 V and f = 100 kHz. At D > 0 . 5 , more hydrogen is formed, and at D < 0 . 5 , more oxygen is produced.
Energies 09 00094 g004

3.1.3. Gas Concentration

Although we cannot see separate nanobubbles by optical microscopy, it is possible to measure the average concentration of gases in the liquid. The method is based on the change of the refractive index Δ n r of liquid due to the dissolved gas. If the volume fraction f v of gas is small, f v 1 , then one can find the change in the refractive index Δ n r using the Bruggeman effective medium approximation [29,30]:
Δ n r = 3 n 0 ( 1 - n 0 2 ) 2 ( 1 + 2 n 0 2 ) f v - 0 . 35 f v
where n 0 1 . 34 is the refractive index of the electrolyte at the used wavelength λ = 633 nm.
The quantity that was directly measured [20] with the vibrometer is the change of the optical path Δ d for the laser beam with time t. This is related to the change in the refractive index as:
Δ d ( t ) = 0 z 0 d z Δ n r ( z , t )
where z is the vertical coordinate and z 0 is the thickness of the liquid layer.
For the simple chip (microelectrodes immersed in the electrolyte), the signal is shown in Figure 5a. As illustrated in the cartoon above Panel (a), the signal was measured above the electrode where the gases are produced. It is negative because the gas reduces the index of refraction. The general trend is that the amount of gas in the liquid layer above the electrode increases with time as one would expect; however, the signal is not monotonous. There are prominent peaks that are in phase with the current pulses shown by the red dashed line. The presence of these peaks means that during each period, the gas concentration is reduced. It is possible to roughly estimate the amount of gas disappearing per period. The integral in Equation (2) can be estimated as Δ n r ( t ) l , where l is the thickness of the layer where the gas concentration is significant. Using also Equation (1), one gets a simple relation | Δ d | 0 . 35 f v l . One peak is responsible for the change of the optical path δ ( Δ d ) 1 nm. The distance l for one period equal to 16 . 7 μ s can be estimated as the diffusion length (H 2 for definiteness) for this time, that is l 270 nm. We find that one peak is responsible for the reduction of the gas volume fraction δ f v 0 . 01 . On the other hand, the total concentration of gases that is collected above the electrode after six periods is estimated also as f v 0 . 01 , where we took | Δ d | = 4 nm and l = 1 μ m. We can conclude that more gas disappears than is collected in the system.
The gas measured with the vibrometer cannot exist as dissolved molecules, since at these high concentrations, bubbles are formed very quickly. The timescale for bubble formation is less than 10 μ s, as experiments with single gas bubbles demonstrate [21]. However, this gas cannot be collected in microbubbles, since these would scatter the laser light and produce a significant scattering signal, which was not observed with the vibrometer. The only possibility is that the gas exists as nanobubbles with sizes smaller than λ / π , which do not scatter the light of the laser.
The described observations can be understood as follows. Water electrolysis driven by the alternating polarity pulses produces gases in accordance with Faraday’s law. Due to a very high supersaturation, bubbles nucleate homogeneously, and the number of nuclei is large. These nuclei grow to nanobubbles containing either H 2 , O 2 or a mixture of gases. The nanobubbles containing the stoichiometric mixture disappear very quickly due to the spontaneous reaction, which is responsible for the peaks in Figure 5a. The bubbles containing mainly hydrogen or oxygen are collected in an increasing layer above the electrodes, resulting in a steady increase of the optical path.
A similar effect is observed in the microfluidic system shown in Figure 1c,d. If the laser beam of the vibrometer is shining on the electrode through the chamber, we observe comparable oscillations in phase with the driving pulses, as shown in Figure 5b. These oscillations are superimposed on the deflection of the flexible membrane that gives the main contribution to the vibrometer signal. In the inset, it is easily visible that the shape of separate peaks is very similar to those in Panel (a). The magnitude of the peaks in Panel (b) is larger, which is due to a significantly larger Faraday current originating from geometric effects. If the beam would point in between the electrodes, the oscillations in Panel (a) would disappear completely, but in the case of Panel (b), weaker oscillations would persist (see below). This is because both the appearance and disappearance of the gas above the electrodes contribute to the pressure in the chamber, which moves the membrane in phase with the driving pulses.
Figure 5. (a) Simple chip. Change of the optical path due to dissolved gas as measured with the vibrometer. The current through the electrolyte is shown as a guide for the eye (dashed line). The process was driven at U = 4 . 5 V and f = 60 kHz. (b) Microfluidic chip. Deflection of the membrane with the superimposed signal due to the gas concentration. Pulses with U = 8 V and f = 100 kHz were applied. The inset shows a detailed view of the oscillations. The schematics above the panels indicate how the respective measurements were done.
Energies 09 00094 g005

3.2. Pressure in the Chamber

The simple chips are open, and pressure in the liquid is always equal to the atmospheric pressure. In the microfluidic devices, the chamber is closed, and the pressure is defined by the internal processes in the chamber. Deflection of the membrane was calibrated by applying external static pressures. The calibration curve is fitted well by the cubic polynomial Δ P = 2 . 03 Δ h + 0 . 27 Δ h 3 , where the overpressure Δ P has to be taken in bars and the deflection Δ h of the center of the membrane is in μm. In most cases, the pressure was evaluated by measuring the membrane deflection from the back side of the silicon wafer to exclude possible scattering on the microbubbles in the chamber and exclude an additional change in the optical path due to the gas dissolved in the electrolyte.
Figure 6 shows the overpressure Δ P in the chamber as a function of time for different driving pulses. As one can see from Panel (a), the pressure for a fixed frequency of f = 100 kHz increases monotonously. It increases more quickly with the increase of the voltage amplitude. This happens because the Faraday current increases with the voltage practically in the ohmic regime [22]. One can notice that small oscillations are superimposed on the monotonous pressure increase. As we already mentioned, these oscillations are related to the appearance and disappearance of the stoichiometric nanobubbles above the electrodes. When the driving pulses are switched off, the pressure is reduced very quickly. For all voltages, the characteristic time for the decrease of Δ P is 100 μ s. This fast decrease of pressure deserves a special discussion.
Figure 6. Overpressure in the chamber for different driving pulses. (a) Δ P for different amplitudes U and fixed frequency f = 100 kHz. (b) Δ P for different frequencies and fixed amplitude U = 9 V. (c) Saturation of Δ P with time for U = 10 V and f = 50 kHz.
Energies 09 00094 g006
The pressure increase Δ P is responsible for the increment of the chamber volume: Δ V 0 . 45 V c h Δ h / h , i.e., the volume increment under the clamped square membrane [31] with the maximal deflection Δ h . Here, h = 5 μ m is the chamber height. Because the liquid is incompressible and on the considered time scale the chamber is closed, Δ V is equal to the volume of gas in the chamber. This volume is only filled with nanobubbles. Otherwise, we would see this gas optically, and when the pulses are switched off, the gas has to become visible and slowly diffuse out of the chamber via the long channels (the time scale for this process is 15 min). Neither of these effects is observed. Instead, all of the gas disappears in 200–300 μ s. Again, this effect can be explained by the reaction between gases. As mentioned before, the pressure in the chamber is produced by the nanobubbles containing only H 2 or only O 2 . When the pulses are stopped, these nanobubbles merge, forming on average stoichiometric bubbles, in which the reaction is ignited spontaneously. The time scale for the pressure decrease is given by the time of merging.
When the frequency of driving pulses increases, the overpressure decreases, as one can see in Figure 6b, where all of the curves correspond to the same amplitude U = 9 V. The size of the nanobubbles, in which the reaction happens, depends on the frequency. When the frequency increases, the diffusion layer becomes thinner, and nanobubbles forming in this layer are smaller. The Laplace pressure in these bubbles will be larger, and the same number of gas molecules will take a smaller volume. This explains the smaller deflections of the membrane with frequency increase.
Figure 6c shows the pressure in the chamber for the amplitude U = 10 V and frequency f = 50 kHz. For these parameters, the pressure reaches rather high values. If the process runs longer than 400 μ s, the pressure starts to saturate, on average oscillating due to periodic combustion in nanobubbles. Note that at f = 50 kHz, the amplitude of the oscillations is easily visible.

3.3. Thermal Effects

The combustion reaction between hydrogen and oxygen is highly exothermic. The enthalpy of water formation in this reaction is Δ H = - 242 kJ/mol. If the reaction between the gases happens, the heat generated by the reaction has to increase the temperature in the system. For simple chips, the system is bulky (thick layer of electrolyte on a thick substrate), and the temperature rise is measurable, but very small [20]. For the chamber covered with a thin membrane, the effect is much larger [22], due to the small thermal mass of the membrane. The temperature in the chamber can be estimated using the thermal dependence of the current flowing through the electrolyte. In contrast with ordinary resistors, this current increases with temperature as I ( T ) = I 0 ( 1 + α Δ T ) , where I 0 is the current at temperature T 0 and Δ T = T - T 0 is the temperature rise. For a 1 M solution of Na 2 SO 4 , the thermal coefficient α was found to be equal α = 0 . 024 K - 1 [22]. This relation can be applied only to the Faraday component of the current. This component was extracted from the total current, which also contains the reactive component. Each current pulse (half of the period) was fitted by the function I ( t ) = I F + I 1 e - t / τ r , where the second term is responsible for the charging-discharging of the interface and τ r is the relaxation time. This procedure gives a good description of the current at different conditions [21,22].
Figure 7a shows the Faraday current (one point per period) for the same driving pulses as in Figure 6b. The current increases with time, demonstrating the temperature increase in the chamber. At longer times, the current saturates, so that the temperature never reaches the boiling point. The Joule heating produced by the current does not depend on the driving frequency; however, in Figure 7a, we can see a clear dependence on f. The current increases faster for higher frequencies while the pressure is larger for lower frequencies. The dependence of the current on the frequency demonstrates that besides the Joule heating, an additional effect has to be involved. This additional heating can be the heat of the reaction.
Figure 7. (a) Faraday current as a function of time (one point per period) for different frequencies (the same runs as in Figure 6b). Squares are for f = 150 kHz; triangles are for f = 110 kHz; and circles are for f = 80 kHz. The inset shows the temperature in the chamber calculated from the current. (b) Overpressure in the chamber at different external temperatures.
Energies 09 00094 g007
When the frequency increases, the diffusion layer above the electrodes becomes more and more homogeneous in the sense that the local amounts of H 2 and O 2 approach the stoichiometric ratio. This means that with increasing frequency, less bubbles containing only oxygen or only hydrogen will be produced. This will result in smaller overpressure in the chamber. On the other hand, more gas will react, generating more heat. This explains the observed tendencies presented in Figure 6b and Figure 7a.
The external temperature strongly influences the process [22], as one can see in Figure 7b. This dependence is in agreement with the classical nucleation theory [32], in which the large energy barrier for bubble nucleation is reduced at high supersaturations. Even for very high supersaturation the homogeneous nucleation is still an activation process. External temperature increases the nucleation rate, including the bubbles containing only H 2 or O 2 gases. Since more unreacted gas appears in the chamber, the pressure has to increase faster, as observed experimentally.

4. Reaction in Microbubbles

In this section, we describe a new regime of alternating polarity electrolysis, in which the reaction between hydrogen and oxygen happens in microbubbles containing a stoichiometric mixture of the gases [23]. Although these microbubbles only live around 3 μ s, it is still possible to observe them optically due to their relatively large size. A short appearance of the microbubbles is accompanied by a large pressure jump in a closed chamber.
Figure 8. Stroboscope snapshots of the short-lived bubbles. These bubbles look like they are out of focus due to motion blur. The driving amplitude is U = 8 V. (a,b) f = 100 kHz. The images were made at t = 600 μ s and t = 1200 μ s, respectively. (c,d) f = 200 kHz. The images correspond to the moments t = 1200 μ s and t = 2400 μ s, respectively.
Energies 09 00094 g008

4.1. Stroboscopic Observations

When the alternating polarity process is run in a closed chamber for sufficiently long time t > 400 μ s at high frequencies f 100 kHz, a new phenomenon can be observed. This phenomenon is the appearance of short-lived microbubbles in the chamber. A series of stroboscopic snapshots shown in Figure 8 demonstrates the phenomenon. The process was run at the amplitude U = 8 V. The driving pulses for Panels (a) and (b) correspond to a frequency of f = 100 kHz, but for (c) and (d), the frequency was f = 200 kHz. The image in Panel (a) was made at t = 600 μ s when the short-lived microbubbles are just starting to develop. In contrast with the images in Figure 3, one can see that the long-lived bubbles are shifted a little bit out of the electrodes, and there is a weak contrast in between the electrodes. At a longer delay of t = 1200 μ s, it becomes more obvious as one can see in Panel (b). The contrast in between the electrodes looks like microbubbles that are out of focus. This happens due to motion blur and means that these bubbles exist in the chamber for a shorter time than the exposure time ( 10 μ s). There must be a flow in the chamber related to these short-lived bubbles, because the long-lived bubbles (those that are in focus) are strongly pushed away from the electrodes.
Panels (c) and (d) show the images that were taken at t = 1200 μ s and t = 2400 μ s, respectively, for the driving frequency f = 200 kHz. At higher frequencies, the short-lived bubbles have a larger size, but need a longer incubation period to appear. One can see rather large displacement of long-lived microbubbles, which assumes that rather strong local flow exist in the chamber. At frequencies below 100 kHz, the short-lived bubbles do not appear at all.

4.2. Pressure Fluctuations

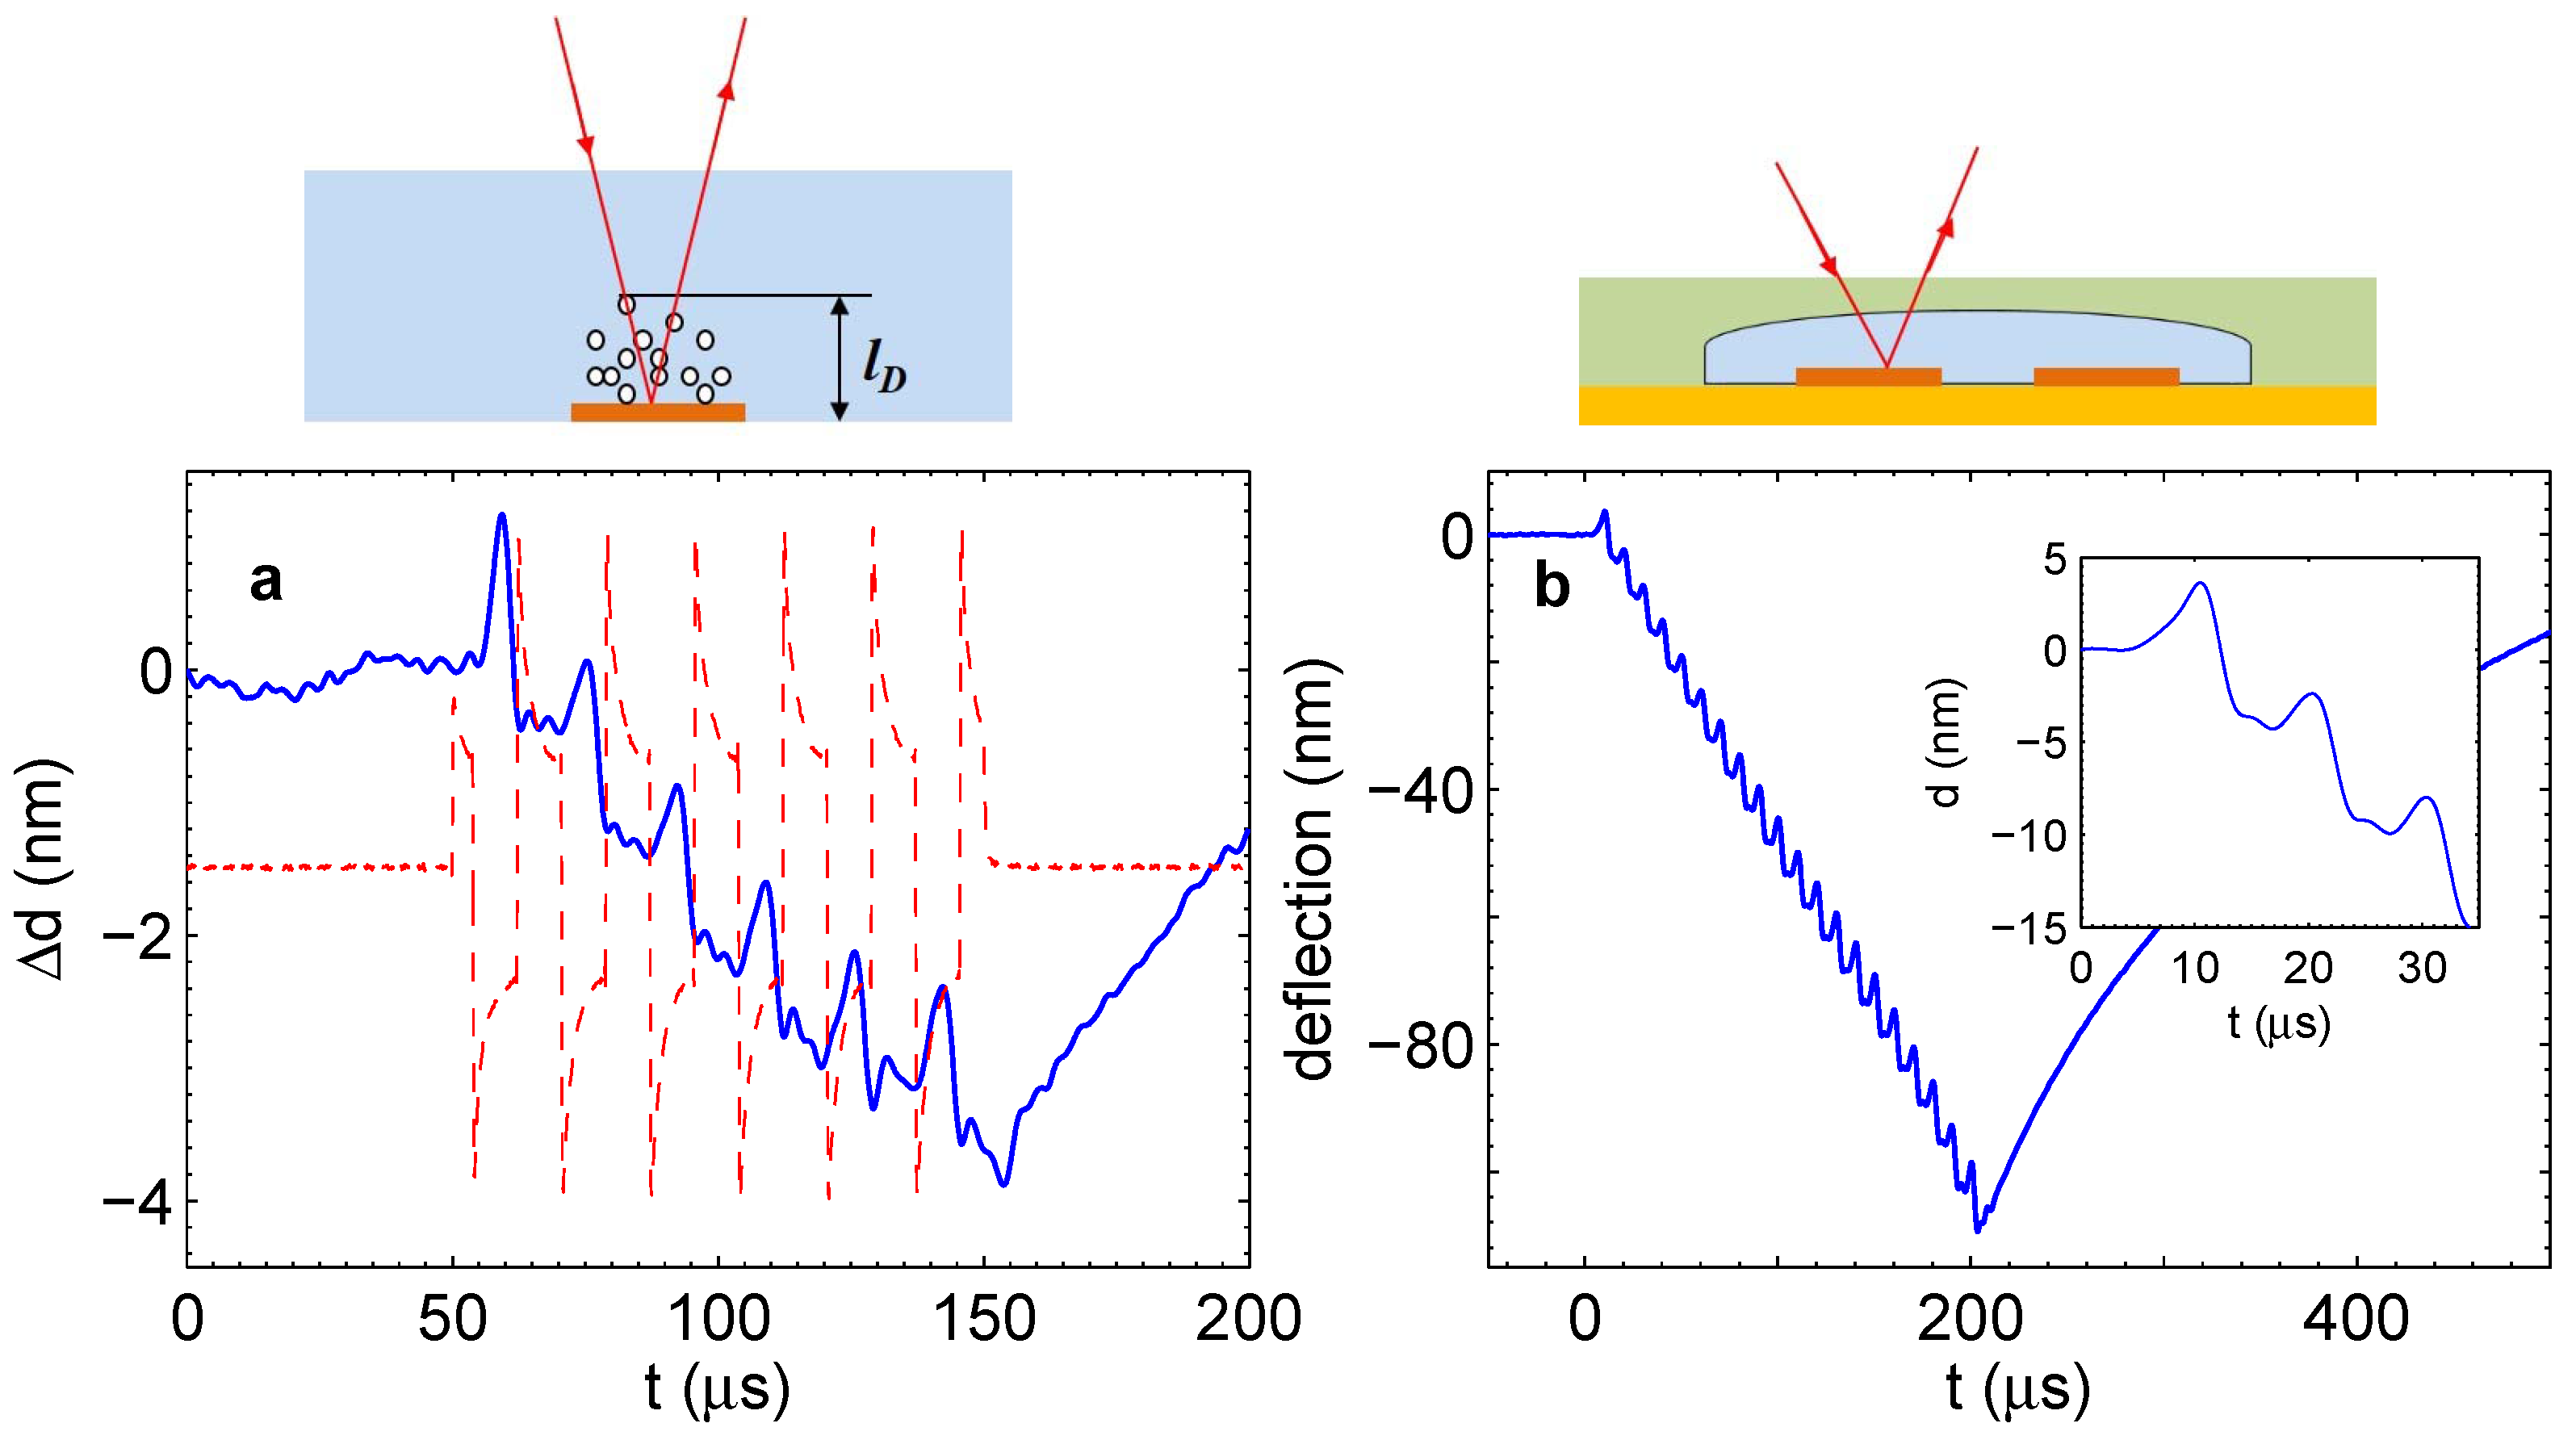
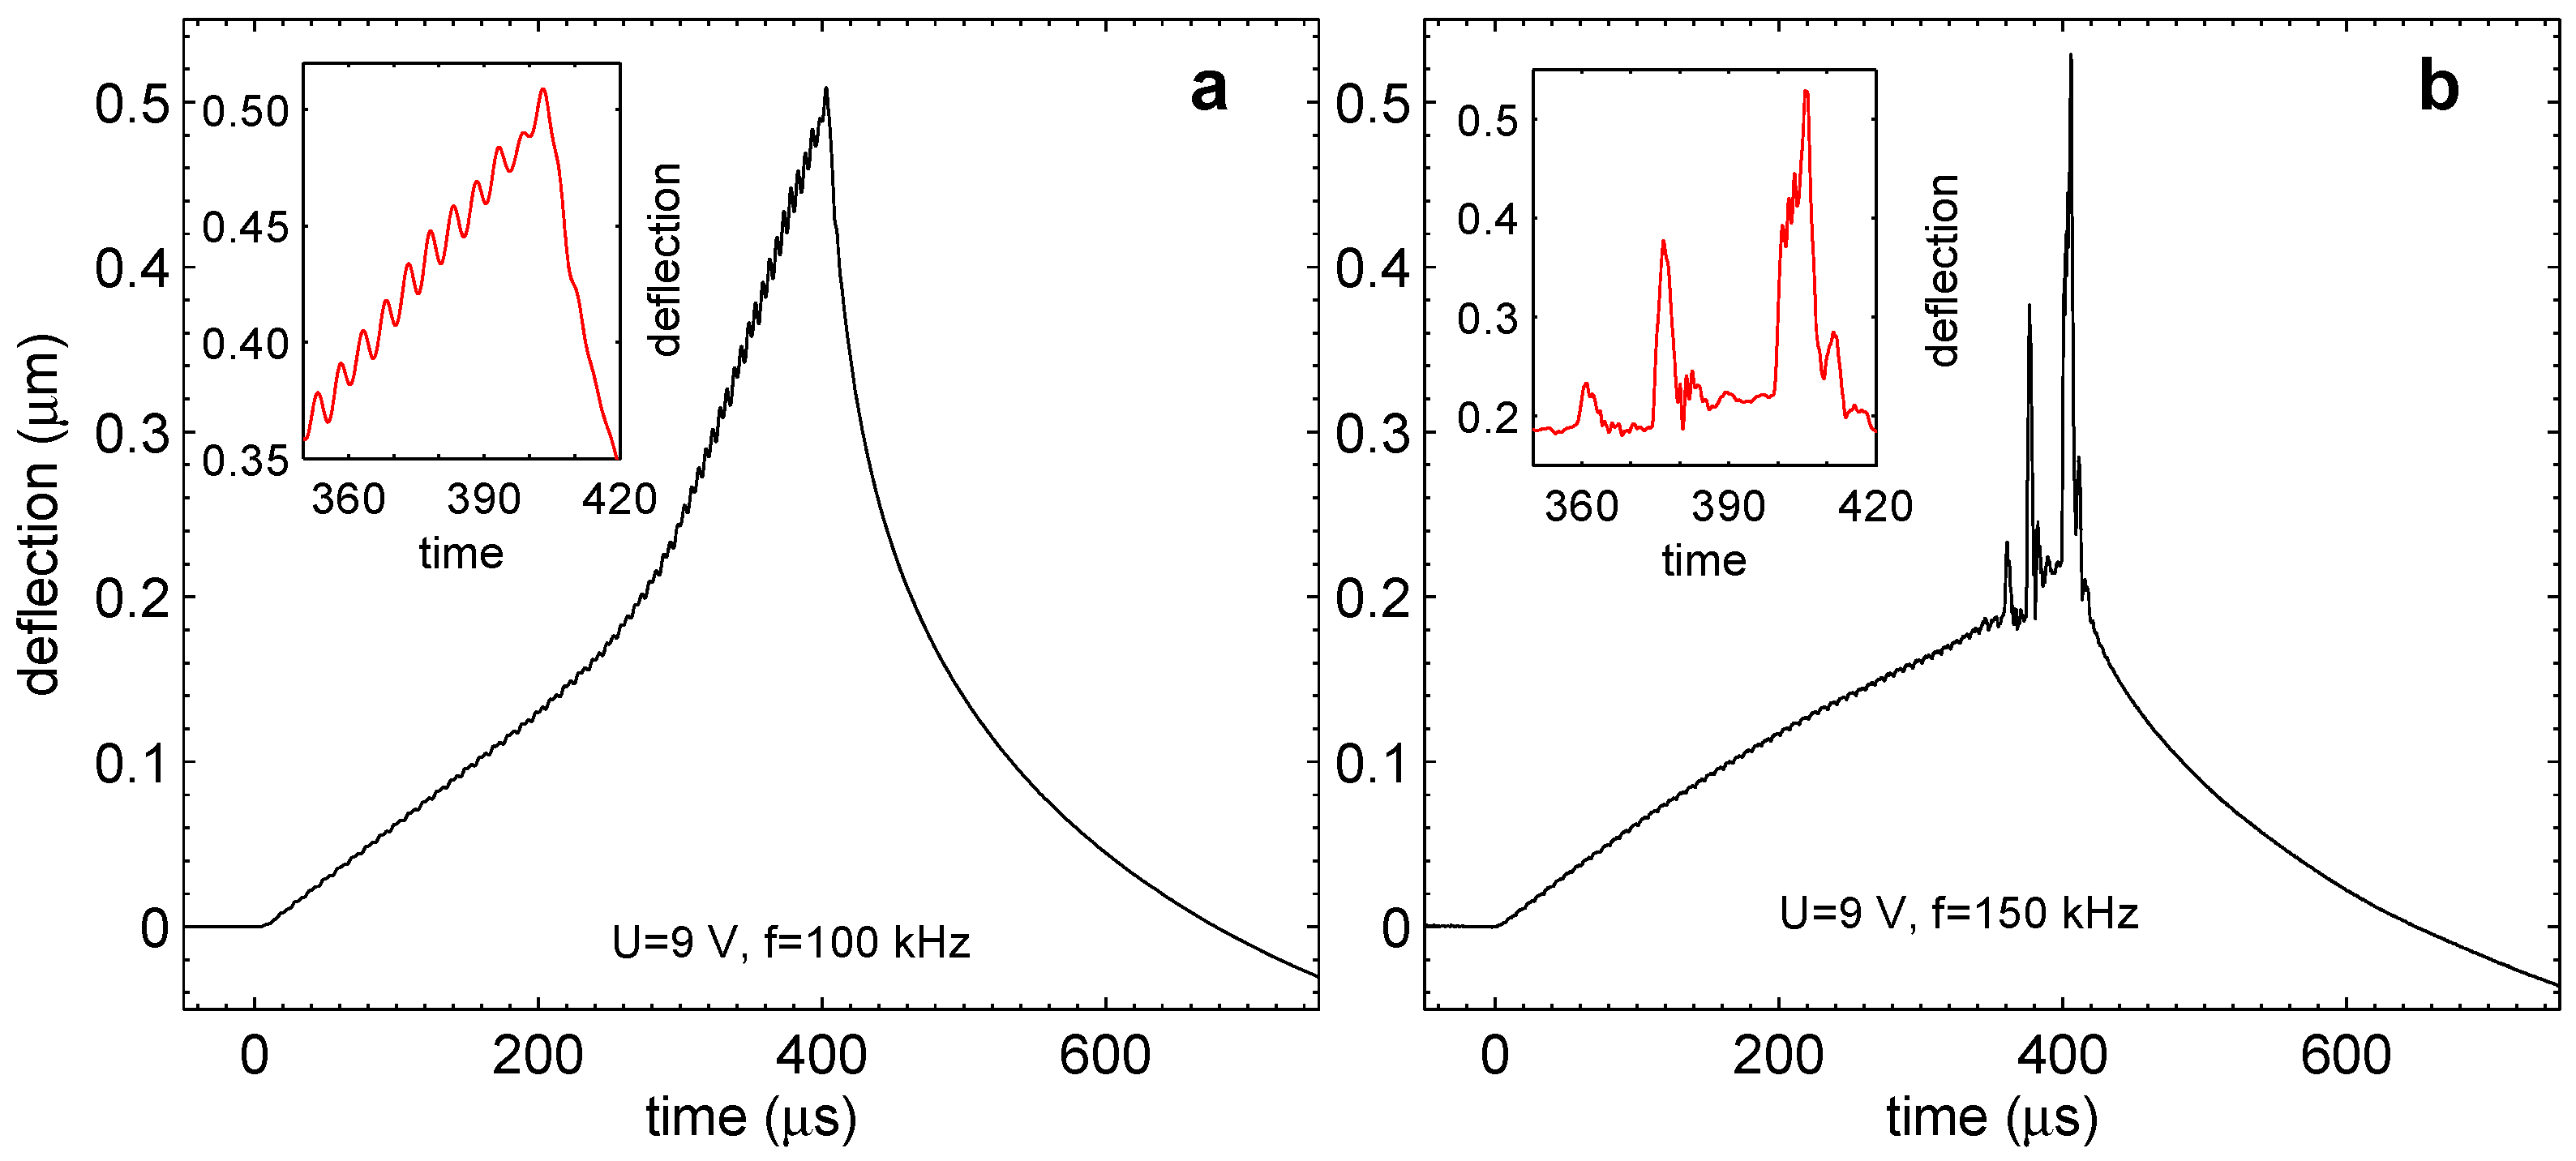
When the short-lived microbubbles are formed in the chamber, the membrane deflection also demonstrates peculiar features. This can be seen in Figure 9. Panel (a) shows the membrane deflection as measured by the vibrometer for the pulses with amplitude U = 9 V and frequency f = 100 kHz. The pulses were switched on during 400 μ s. The graph shows small oscillation of the membrane superimposed on the monotonous increase of the deflection. The situation here is similar to that shown in Figure 5b. The change of the slope happens due to the effect of internal heating. In Panel (b), the membrane response is shown for the driving frequency f = 150 kHz. One can observe qualitatively new features that appear in the response. These are high narrow peaks in the deflection. Of course, the peaks in the deflection are equivalent to the peaks in the overpressure in the chamber. These peaks appear after an incubation period of 360 μ s.
Figure 9. Transition to the regime with pressure fluctuations. (a) Deflection of the membrane for U = 9 V and f = 100 kHz. Regular oscillations easily visible in the inset correspond to the periodic termination of gas in nanobubbles. (b) Deflection of the membrane for higher frequency f = 150 kHz. The oscillations develop in irregular sharp and strong peaks. The inset shows details of the peaks.
Energies 09 00094 g009
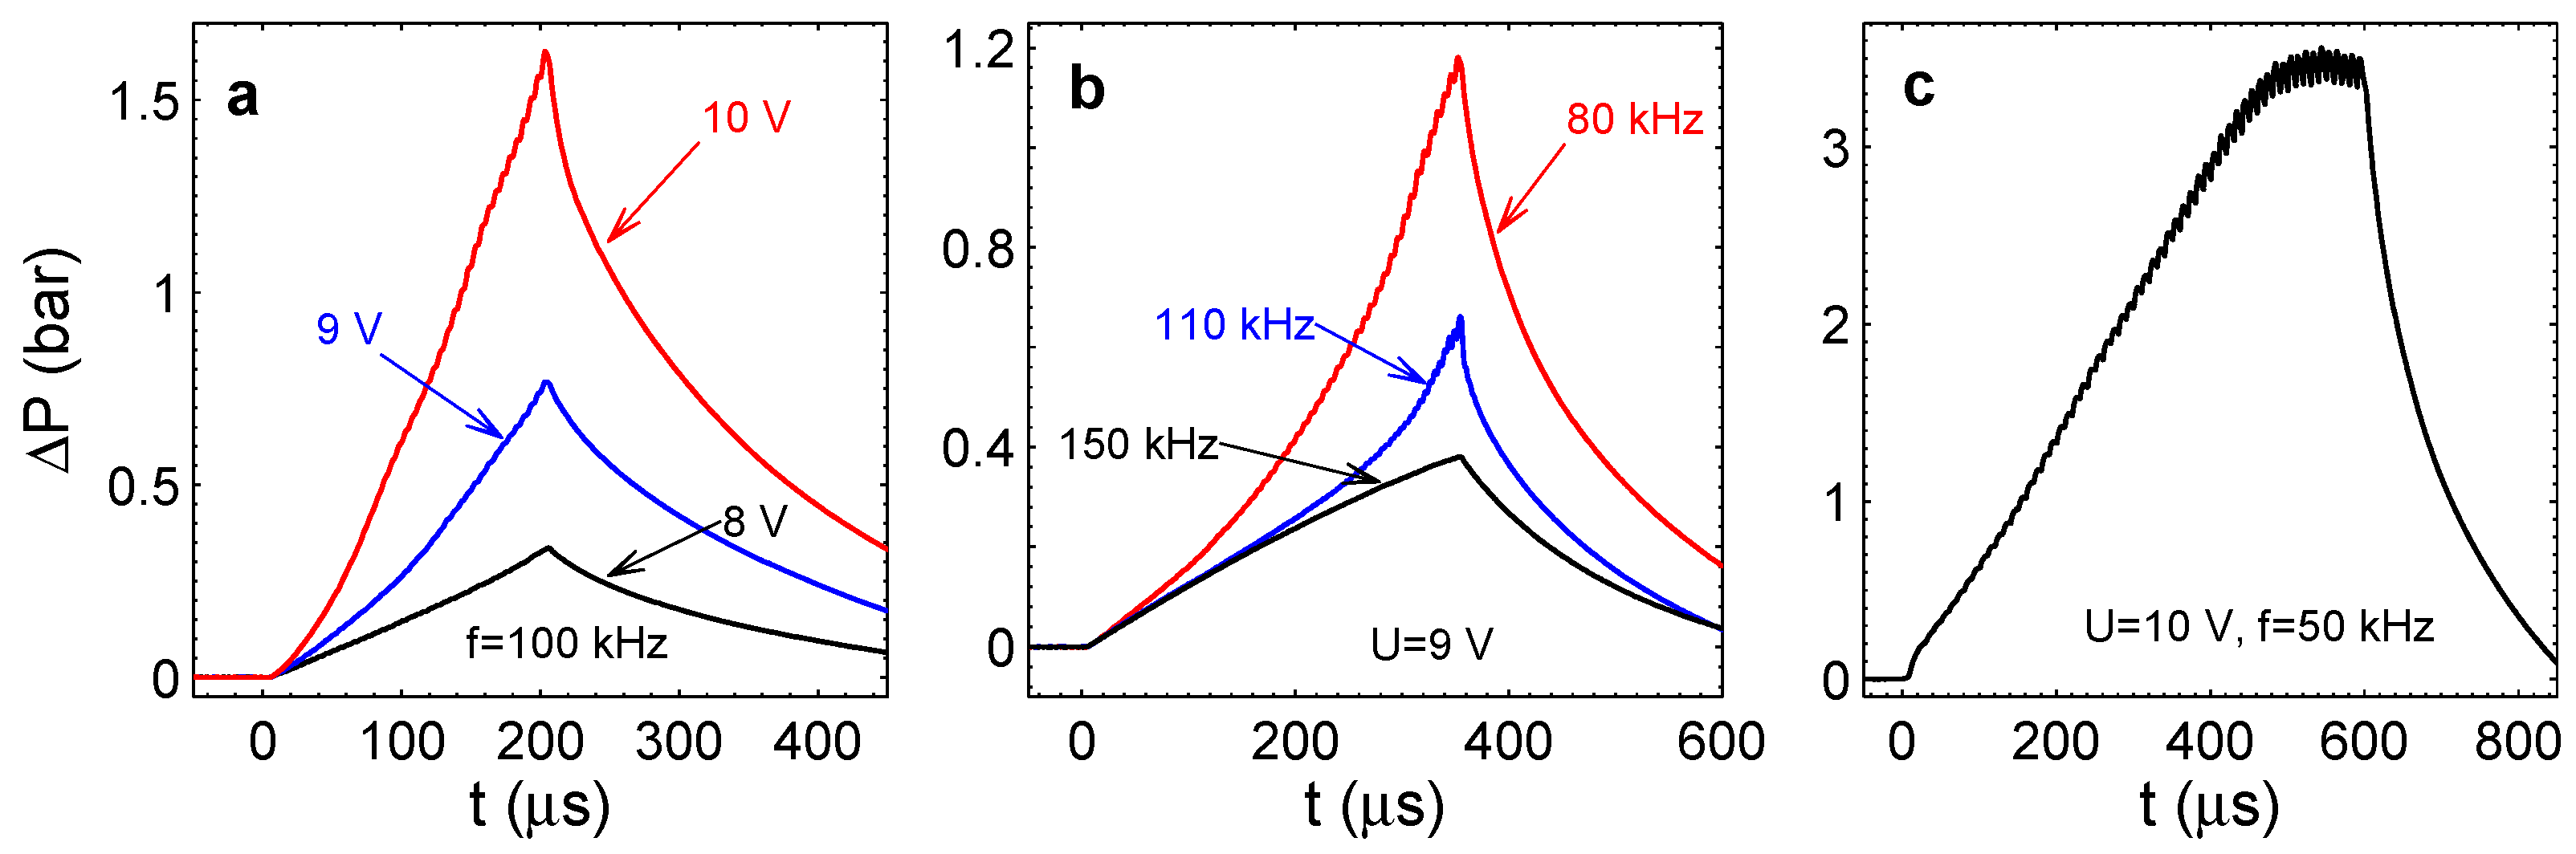
We observed the following properties of the phenomenon. The pressure in the chamber starts to fluctuate after some incubation time. This time increases with frequency and decreases with the voltage amplitude. The magnitude of the fluctuations also increases with frequency. When the frequency is below 100 kHz, the fluctuations become very small and practically disappear. On the other hand, at f = 500 kHz, they become so violent that they can cause the membrane to break. There is a clear correspondence between the short-lived microbubbles observed stroboscopically and the pressure jumps observed with the vibrometer.
If the process is run for a long time, the pressure in the chamber saturates similarly to that presented in 
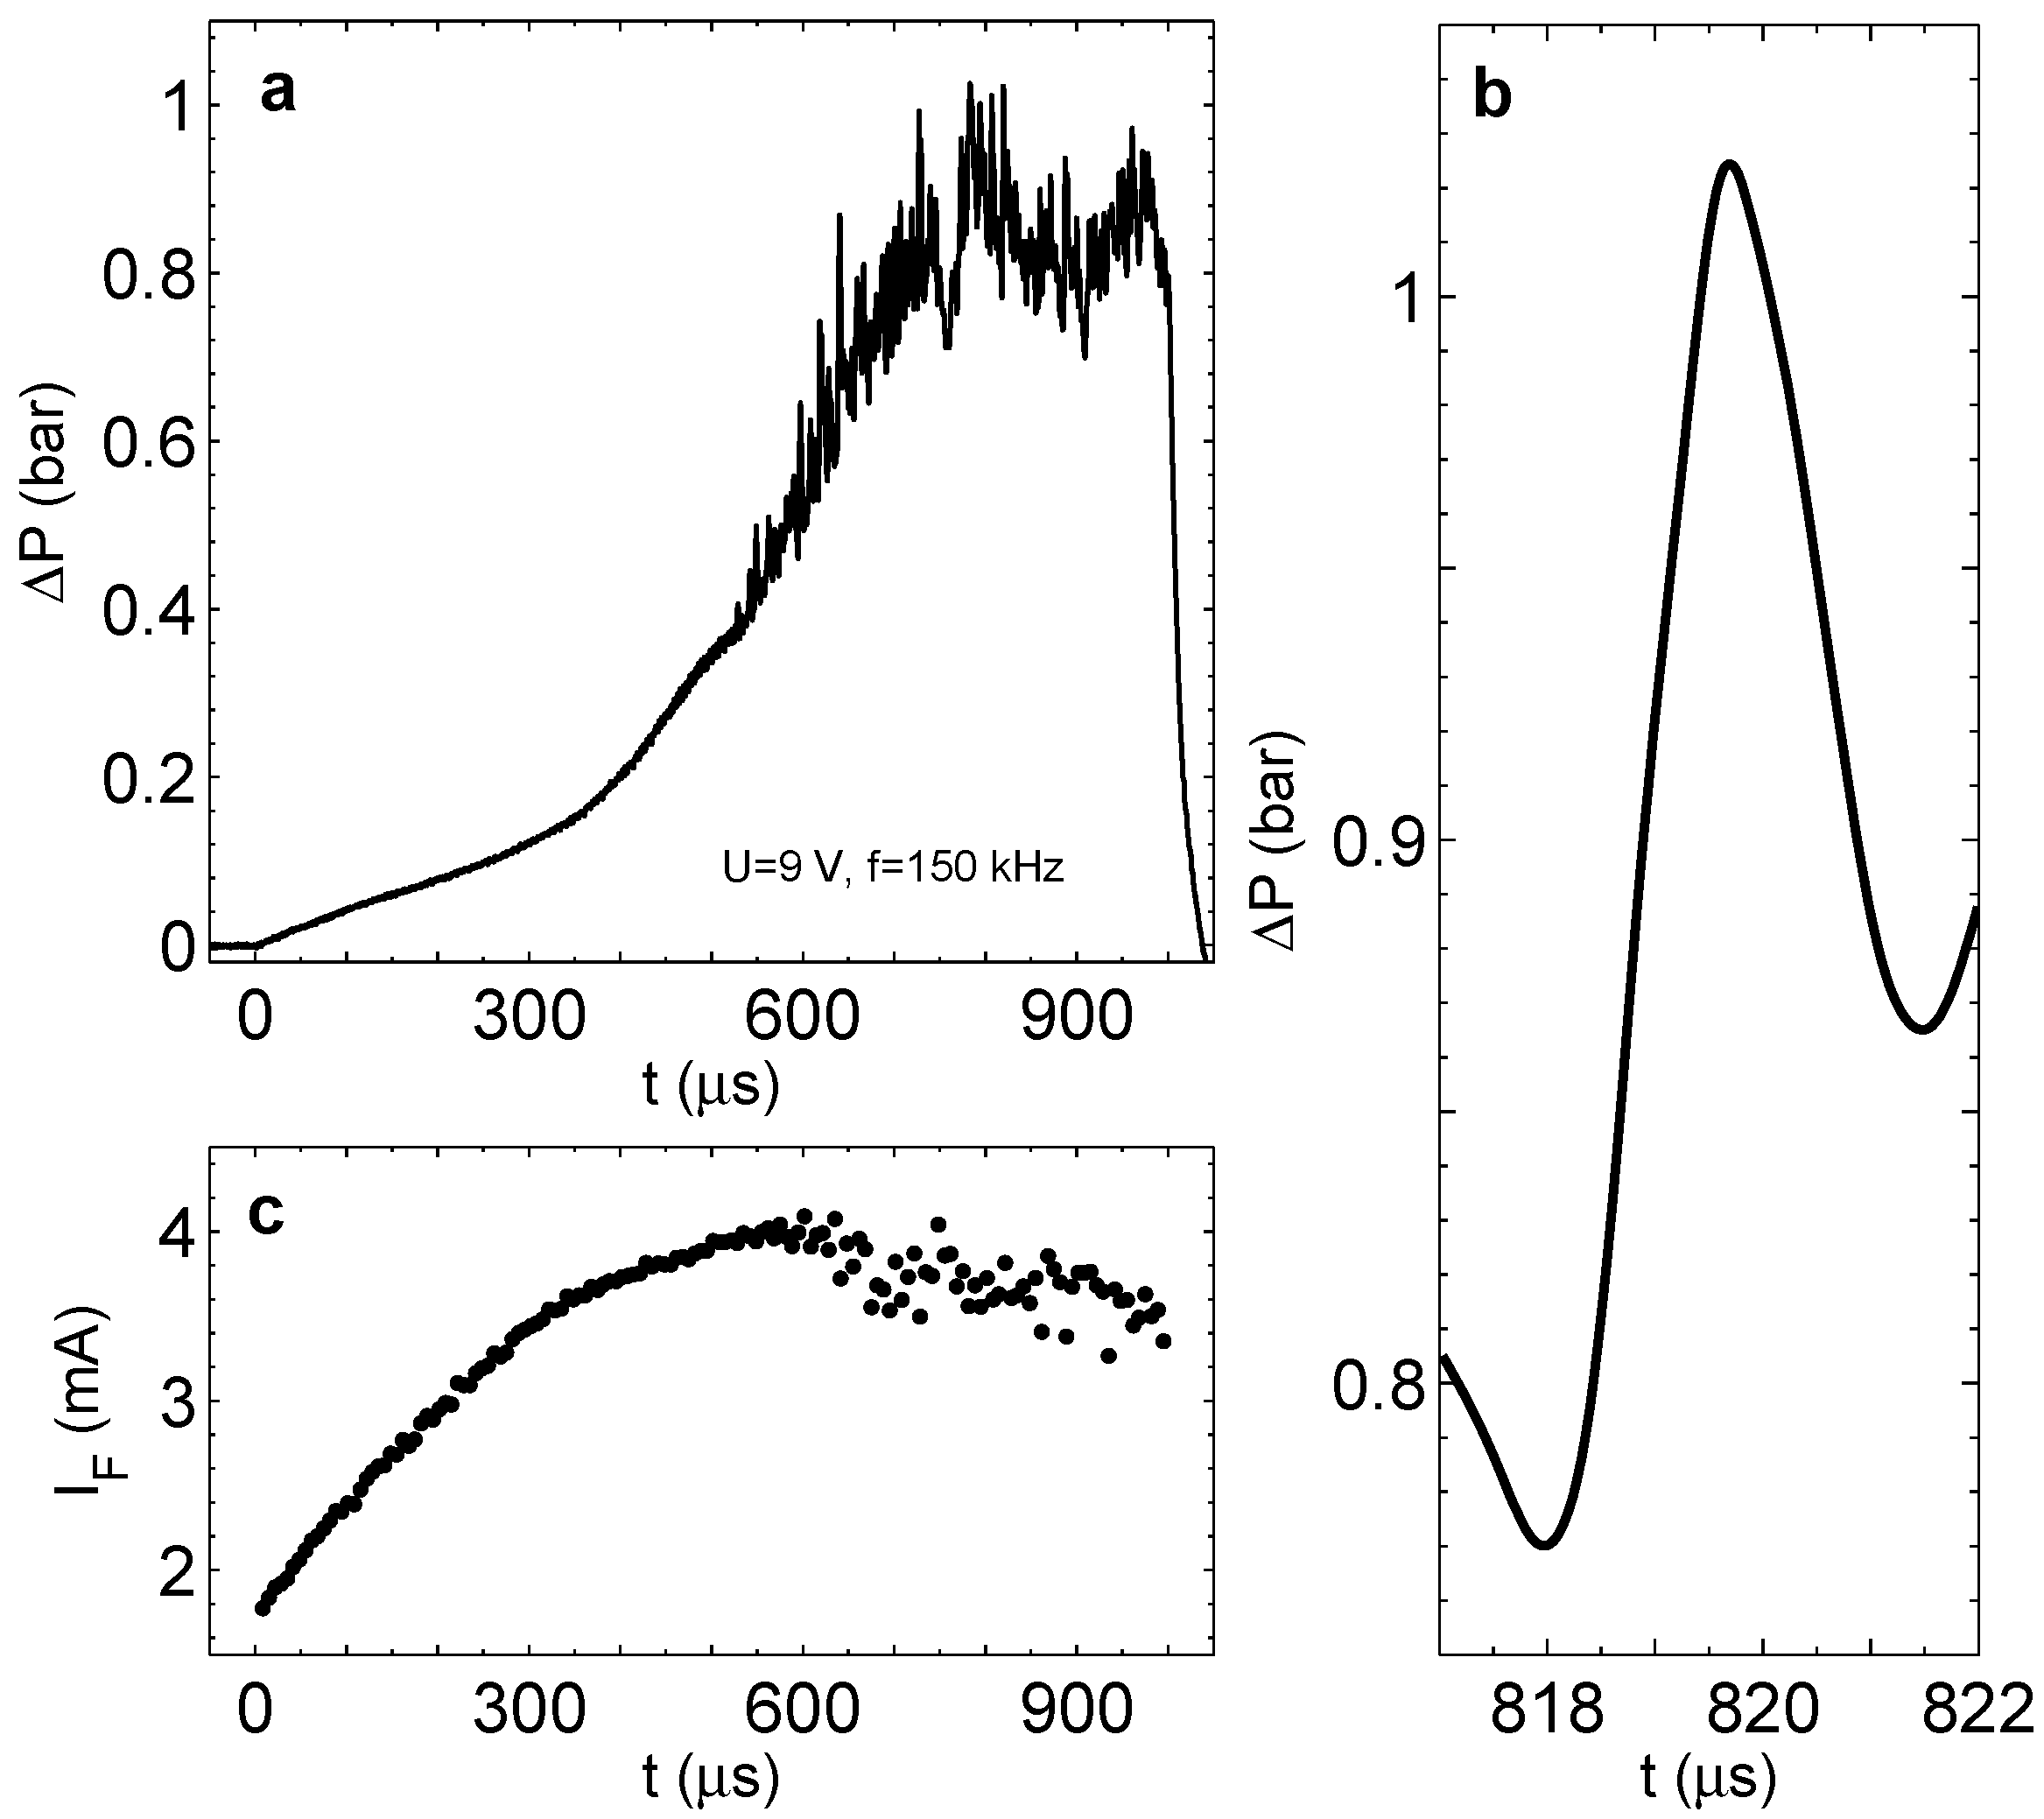
Figure 6c; however, instead of regular oscillations, we observe significant fluctuations of pressure in the steady state. It can be seen in Figure 10a, where overpressure is shown for U = 9 V and f = 150 kHz. A typical pressure jump for these driving pulses is shown in Panel (b). It has a magnitude of 0 . 2 bar and a width of around 3 μ 
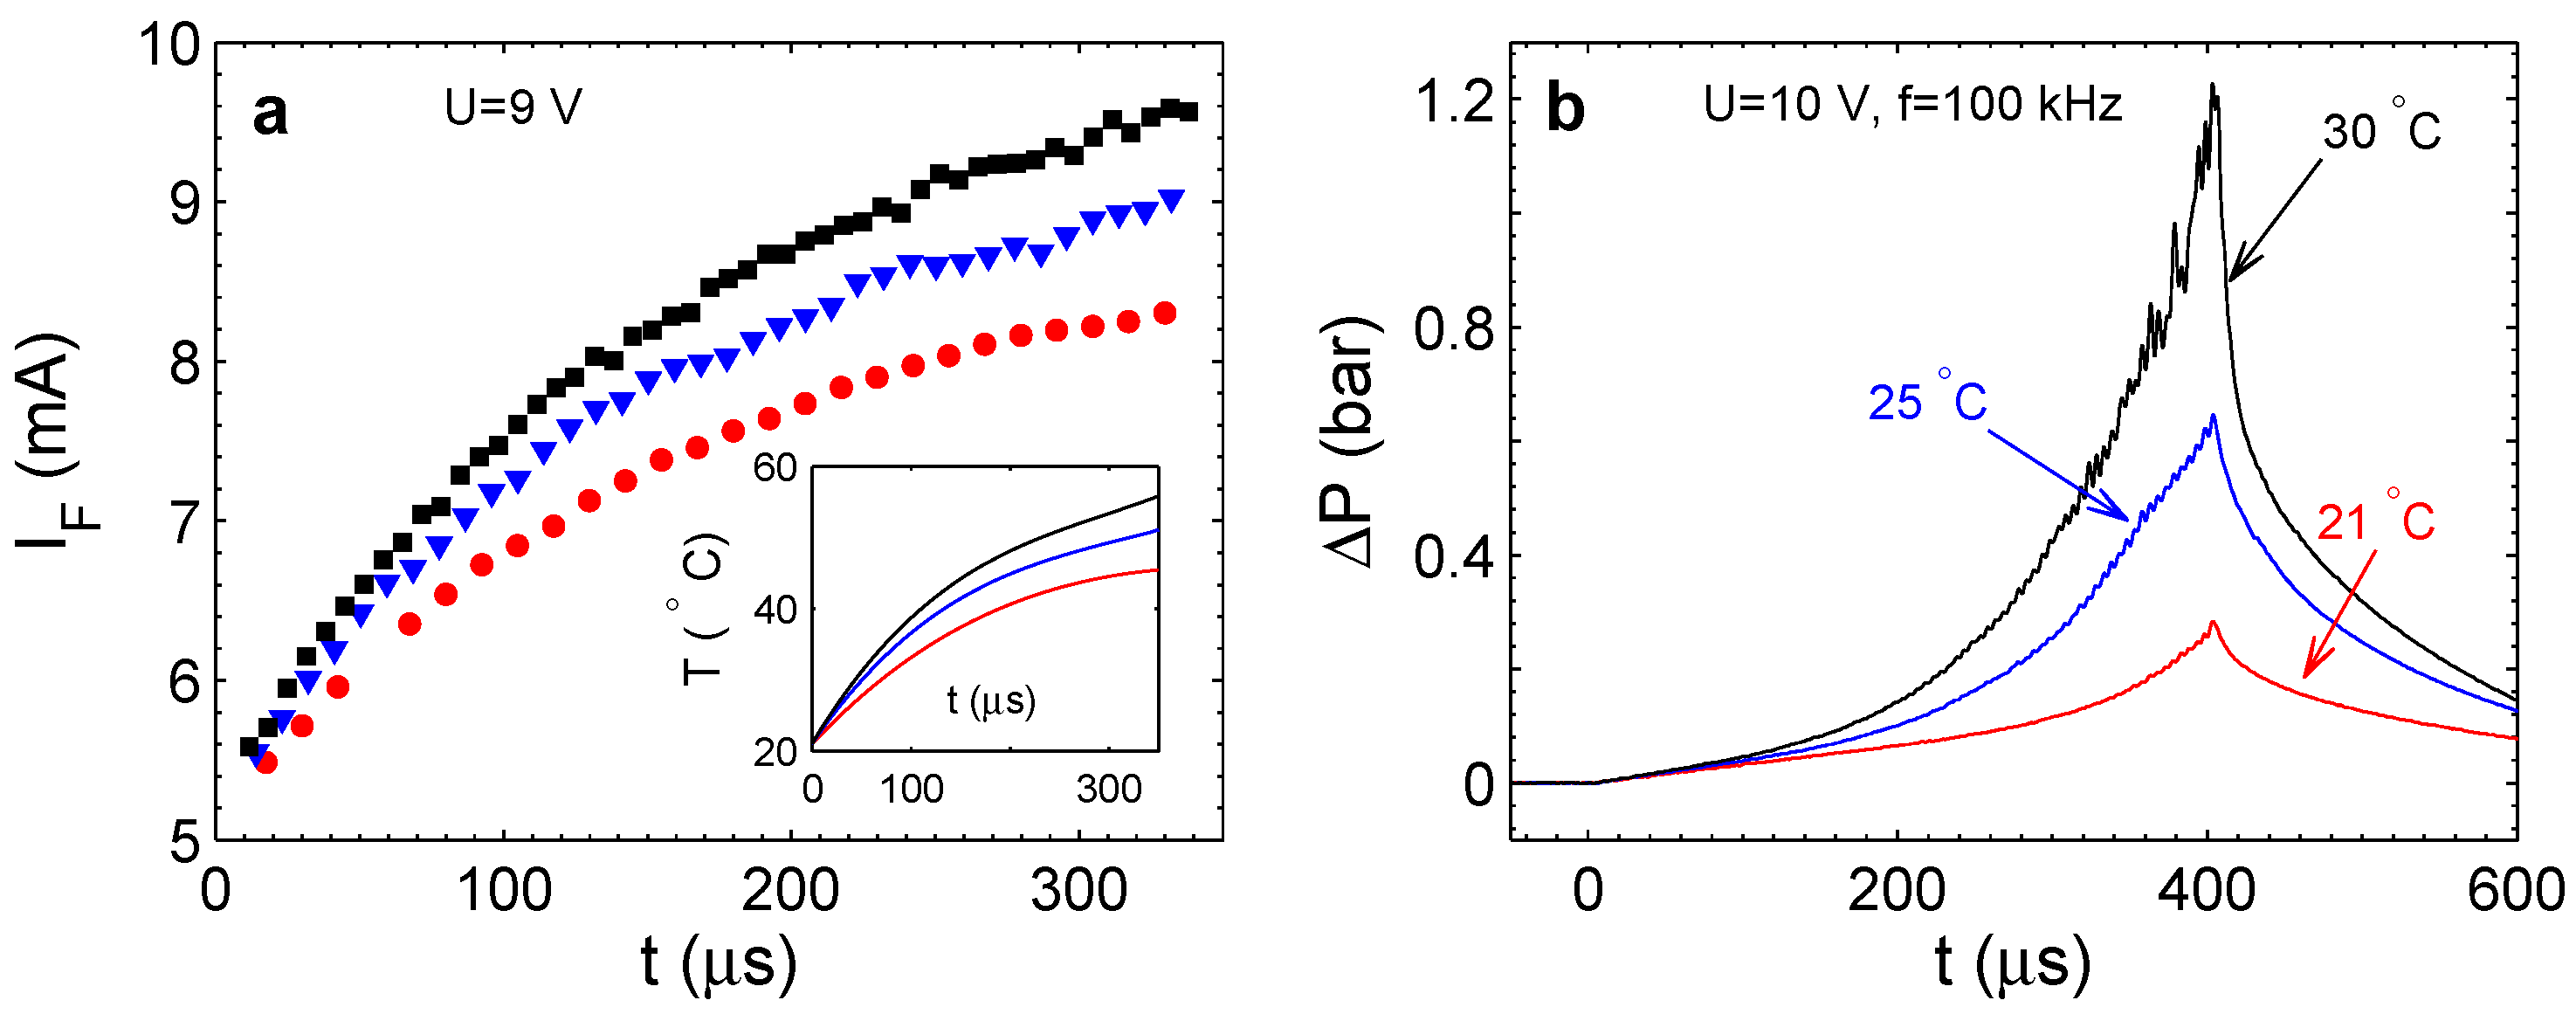
s. It is also interesting to see the behavior of the Faraday current shown in Panel (c). When the pressure starts to jump, the current does not grow anymore and develops a fluctuating component. This is in agreement with the short-lived microbubbles appearing in the chamber. These microbubbles have a size comparable to the distance between the electrodes. The appearance and disappearance of even one bubble of this size in the chamber has to influence on the current, resulting in its fluctuations. Some reduction of the current magnitude is explained by better heat transfer in the chamber due to the flickering microbubbles. We conclude that the pressure jumps and the current fluctuations are induced by the short-lived bubbles observed optically.
Figure 10. (a) Overpressure in the chamber with well-developed pressure fluctuations. The process is driven at U = 9 V and f = 150 kHz during 1000 μ s. (b) A zoomed peak from (a) represents a typical pressure jump. (c) The Faraday current corresponding to the run in (a) (one point per period).
Energies 09 00094 g010

4.3. Formation Mechanism

The described observations of the short-lived microbubbles can be explained with the following sequence of events (a detailed description is presented in [23]). When the electrolysis is driven by the alternating polarity pulses, three types of nanobubbles are formed nearby the electrode surface, as shown in Figure 2. The bubbles containing the stoichiometric mixture of the gases disappear in the spontaneous reaction contributing to the temperature increase. The nanobubbles containing hydrogen or oxygen are collected in the chamber, resulting in the observed monotonous pressure increase in the chamber. With time, the concentration of nanobubbles containing H 2 or O 2 becomes so large that the bubbles are nearly touching. This can happen only in between the electrodes, and the precise place depends on the fluctuations in the concentration of bubbles. In a place with a high concentration, the bubbles merge, forming a microbubble containing the stoichiometric mixture of gases. It is interesting to note that a similar process of fast coalescence of small vapor bubbles was observed in liquids that were superheated in a very short time [26,33,34,35].
The volume of microbubbles emerging in the chamber is much smaller than the volume of the chamber. Nevertheless, such bubbles are able to produce large pressure jumps in the whole chamber. This means that the appearance and disappearance of the short-lived microbubble is a highly energetic event. Only combustion of gases inside of the microbubble has an appropriate energy scale. The energy produced by the reaction is:
E c o m = 2 3 N b | Δ H |
where Δ H = - 242 kJ/mol is the enthalpy of water formation and N b is the number of molecules in the microbubble. The bubbles, which are observed at U = 9 V and f = 150 kHz, have this number in the range N b = (0.5–1.5) × 10 10 , so that the combustion energy is E c o m = 1.5–4 nJ.
This energy is spent on the increase of pressure in the chamber, on the evaporation of water molecules from the bubble walls, on the temperature increase in the bubble, on the increase of the elastic energy of the membrane and on the kinetic energy of the liquid. The last two channels are related to each other and are not very important [23]. Significant temperature increase in the microbubble is not possible, since the characteristic time τ h for the heat transfer to liquid is very short. For a radius of 5 μ m, this time is just τ h 30 ns, as was estimated earlier. This means that the reaction in microbubbles is also a surface-dominated process as the reaction in nanobubbles. The absence of high temperature spots in the chamber is confirmed by the observation of the process with a low-light Andor iXon +855 EMCCD camera.
This discussion shows that there are only two important channels to which the combustion energy may go. The pressure increase in the chamber (in Figure 10a, it is δ P 0 . 2 bar) corresponds to the energy E c h = δ P V c h 1 nJ. On the other hand, the reaction between H 2 and O 2 has to produce energetic molecules and radicals, which are able to vaporize water molecules from the wall. Because the heat of vaporization is rather large ( Δ H v = 41 kJ/mol), this channel is able to absorb the excessive energy produced by the combustion.

5. Discussion

We provided experimental evidence that the combustion reaction between hydrogen and oxygen can proceed in microscopic and nanoscopic volumes. The reaction is ignited spontaneously at temperatures below 100 C and at slightly elevated pressure. According to the standard combustion theory [27,28], the reaction at this low temperature should not proceed, because radicals are efficiently terminated on the surface of microbubbles and because the reaction cannot sustain itself due to the fast heat escape from the microscopic volume.
The strongest argument in favor of the reaction in micro- and nano-bubbles is the amount of gas that is produced by the Faraday current. Without the reaction, this gas would fill a few volumes of the chamber. It is easy to check that the Faraday current really produces the gases by breaking the stoichiometric ratio, for example by applying single polarity pulses or changing the duty cycle of the alternating polarity pulses. We do not know the mechanism of the reaction in a small volume, but it is clear that the bubble surface has to play a significant role. The catalytic activity of the electrodes can be excluded, since we observed similar properties of the process for very different metals. In microsystems, we used Pt, Au, W and Pd, but we tried also Cu, Al, Ta, Ti and Fe for larger systems (in the millimeter range).
We were able to record a periodic decrease in the gas concentration above the electrodes by measuring the change of the refractive index of liquid with the vibrometer. In the closed chamber, variation of the gas concentration, in phase with the driving pulses, can be observed as oscillations of pressure in the chamber. These oscillations are easily visible in all of our measurements. This periodic decrease of the gas is attributed to the combustion of gases in nanobubbles with stoichiometric gas composition.
An important signature of the combustion reaction is the heat production. This heat is difficult to observe in microsystems with a bulk substrate, because the substrate has a large thermal mass. However, the effect becomes well visible in the microchamber covered with a thin membrane. The thermal mass of the membrane is small, and liquid in the chamber can be heated up to 70 C. There are two sources of heating of the liquid: Joule heating by the current flowing through the electrolyte and heating by the reaction. The Joule heating does not depend on the frequency of driving pulses, while we observe clear dependence of the temperature on the frequency. Therefore, at least part of the heating has to be produced by the reaction.
Reaction in microbubbles containing the stoichiometric mixture of hydrogen and oxygen was observed optically using the stroboscope and vibrometer. These bubbles live just a few microseconds, and their existence is accompanied by a significant energy deposition in the chamber. These microbubbles are formed by coalescence of nanobubbles containing only hydrogen or only oxygen. It has to be noted that stoichiometric microbubbles, which were formed in a different way, live a much longer time. For example, the gas produced in a closed chamber by a single polarity pulse first is located above different electrodes (H 2 and O 2 are separated), but at a later time, the gases are mixed. The bubbles formed after mixing do not disappear in a few microseconds, but exist much longer.
It is worth commenting on the relaxation time of pressure in the chamber. When the driving pulses are switched off, the pressure drops down much faster than one could expect on the bases of gas diffusion. While there is no pressure fluctuations the pressure drops down after switching off the pulses in 100 μ s or so. This can be explained by the local coalescence of H 2 and O 2 nanobubbles followed by the reaction in the formed bubble. When the short-lived microbubbles appear in the chamber, the relaxation time for the pressure is reduced further. This can be as short as 10 μ s. This is because in this regime, the nanobubbles are packed more densely, so that the coalescence time is reduced.
High pressure in the chamber and its fast relaxation was proposed for use as a new physical principle for fast and strong actuators [22]. In this device, the pressure is produced by the alternating polarity pulses during a few hundreds of microseconds. When the pulses are switched off, the pressure is reduced six orders of magnitude more quickly than in the fastest electrochemical actuator [15].

6. Conclusions

In this paper, we collected the latest information that is known about the combustion reaction in nano- and micro-scopic volumes. According to the standard combustion theory, this reaction cannot proceed due to fast heat escape from small volumes. Nevertheless, there are many facts showing that the reaction happens. The mechanism of the reaction is still unclear, but it is obvious that the surface of the volume has to play a principal role.
The process was investigated in nanobubbles produced electrochemically. A special procedure was used to form nanobubbles with a stoichiometric mixture of gases. Although the direct observation of the reaction in nanobubbles is difficult due to short lifetimes ( 1 μ s) and small sizes ( 100 nm), a number of observed effects strongly indicated the reaction. The most important effects are the following. (i) There is an obvious disagreement between the gas production predicted on the basis of the Faraday current and a very small gas volume that is actually observed in bubbles. The missed gas reappears in the system as soon as the stoichiometric composition of gases above a specific electrode is broken. (ii) Gas concentration measured above the electrodes demonstrated oscillations in phase with the driving pulses, while without the reaction, it has to increase monotonously with time. (iii) Heat produced by the reaction was separated from the background Joule heating as a frequency-dependent effect. The temperature increase in the microchamber was at least partially due to the reaction.
The reaction was also observed in microbubbles, which were formed by the coalescence of nanobubbles containing only H 2 and only O 2 gases. It is interesting to note that the reaction in microbubbles, which were formed differently, for example, by coalescence of microbubbles, is not going or at least going much slower. Combustion in a microbubble happens for a few microseconds and is accompanied by a large pressure jump in the chamber. The short-lived microbubbles start to appear when the concentration of nanobubbles is so large that they start to merge.
Observation of the reaction in small volumes lifts the fundamental restriction on the volume of the reaction chamber where combustion can proceed. It is too early to speculate on the possible application of the effect for microcombustors because the mechanism of the reaction is still unknown. For this reason, in this paper, we did not discuss applications. Nevertheless, it is worth mentioning that the reaction between hydrogen and oxygen in nanobubbles was successfully used to fabricate fast and strong microactuators [22].

Acknowledgments

This work is supported by the Russian Science Foundation (Grant No. 15-19-20003) and by the Dutch Technology Foundation (Grant No. 13595). Vitaly Svetovoy acknowledges partial support from the Netherlands Center for Multiscale Catalytic Energy Conversion.

Author Contributions

All of the authors formulated the aim, scope and structure of the review. Alexander Postnikov and Ilia Uvarov compiled figures and contributed to the writing. Remco Sanders selected the data for the figures. Vitaly Svetovoy wrote the paper, and the writing was reviewed by Gijs Krijnen.

Conflicts of Interest

The authors declare no conflict of interest.

References

  1. Veser, G. Experimental and theoretical investigation of H2 oxidation in a high temperature catalytic microreactor. Chem. Eng. Sci. 2001, 56, 1265–1273. [Google Scholar]
  2. Fernandez-Pello, A.C. Micro-power generation using combustion: Issues and approaches. Proc. Combust. Inst. 2002, 29, 883–899. [Google Scholar] [CrossRef]
  3. Abhari, F.; Jaafar, H.; Yunus, N.A.M. A comprehensive study of micropumps technologies. Int. J. Electrochem. Sci. 2012, 7, 9765–9780. [Google Scholar]
  4. Ashraf, M.W.; Tayyaba, S.; Afzulpurkar, N. Micro electromechanical systems (MEMS) based microfluidic devices for biomedical applications. Int. J. Mol. Sci. 2011, 12, 3648–3704. [Google Scholar] [CrossRef] [PubMed]
  5. Weiss, L. Power production from phase change in MEMS and micro devices, a review. Int. J. Therm. Sci. 2011, 50, 639–647. [Google Scholar] [CrossRef]
  6. Volder, M.D.; Reynaerts, D. Pneumatic and hydraulic microactuators: A review. J. Micromech. Microeng. 2010, 20, 043001. [Google Scholar] [CrossRef]
  7. Yong, Y.K.; Moheimani, S.O.R.; Kenton, B.J.; Leang, K.K. Invited review article: High-speed flexure-guided nanopositioning: Mechanical design and control issues. Rev. Sci. Instrum. 2012, 83, 121101. [Google Scholar] [CrossRef] [PubMed]
  8. Neagu, C.R.; Gardeniers, J.G.E.; Elwenspoek, M.C.; Kelly, J.J. An electrochemical microactuator: Principle and first results. J. Microelectromechan. Syst. 1996, 5, 2–9. [Google Scholar] [CrossRef]
  9. Cameron, C.G.; Freund, M.S. Electrolytic actuators: alternative, high performance, material-based devices. Proc. Natl. Acad. Sci. USA 2002, 99, 7827–7831. [Google Scholar] [CrossRef] [PubMed]
  10. Hua, S.Z.; Suchs, F.; Yang, D.X.; Chopra, H.D. Microfluidic actuation using electrochemically generated bubbles. Anal. Chem. 2002, 74, 6392–6396. [Google Scholar] [CrossRef] [PubMed]
  11. Ateya, D.A.; Shah, A.A.; Hua, S.Z. An electrochemically actuated micropump. Rev. Sci. Instrum. 2004, 75, 915–920. [Google Scholar] [CrossRef]
  12. Meng, D.D.; Kim, C.J. Micropumping of liquid by directional growth and selective venting of gas bubbles. Lab Chip 2008, 8, 958–968. [Google Scholar] [CrossRef] [PubMed]
  13. Kjeang, E.; Djilali, N.; Sinton, D. Microfluidic fuel cells: A review. J. Power Sources 2009, 186, 353–369. [Google Scholar] [CrossRef]
  14. Li, P.Y.; Sheybani, R.; Gutierrez, C.A.; Kuo, J.T.W.; Meng, E. A parylene bellows electrochemical actuator. J. Microelectromechan. Syst. 2010, 19, 215–228. [Google Scholar] [CrossRef]
  15. Yi, Y.; Buttner, U.; Carreno, A.A.A.; Conchouso, D.; Foulds, I.G. A pulsed mode electrolytic drug delivery device. J. Micromech. Microeng. 2015, 25, 105011. [Google Scholar] [CrossRef]
  16. Maruta, K. Micro and mesoscale combustion. Proc. Combust. Inst. 2011, 33, 125–150. [Google Scholar] [CrossRef]
  17. Ju, Y.; Maruta, K. Microscale combustion: Technology development and fundamental research. Prog. Energy Combust. Sci. 2011, 37, 669–715. [Google Scholar] [CrossRef]
  18. Raimondeau, S.; Norton, D.; Vlachos, D.; Masel, R. Modeling of high-temperature microburners. Proc. Combust. Inst. 2002, 29, 901–907. [Google Scholar] [CrossRef]
  19. Fan, A.; Wan, J.; Maruta, K.; Nakamura, H.; Yao, H.; Liu, W. Flame dynamics in a heated meso-scale radial channel. Proc. Combust. Inst. 2013, 34, 3351–3359. [Google Scholar] [CrossRef]
  20. Svetovoy, V.B.; Sanders, R.G.P.; Lammerink, T.S.J.; Elwenspoek, M.C. Combustion of hydrogen-oxygen mixture in electrochemically generated nanobubbles. Phys. Rev. E 2011, 84, 035302(R). [Google Scholar] [CrossRef] [PubMed]
  21. Svetovoy, V.B.; Sanders, R.G.P.; Elwenspoek, M.C. Transient nanobubbles in short-time electrolysis. J. Phys. Cond. Matter 2013, 25, 184002. [Google Scholar] [CrossRef] [PubMed]
  22. Svetovoy, V.B.; Sanders, R.G.P.; Ma, K.; Elwenspoek, M.C. New type of microengine using internal combustion of hydrogen and oxygen. Sci. Rep. 2014, 4, 4296. [Google Scholar] [CrossRef] [PubMed]
  23. Postnikov, A.V.; Uvarov, I.V.; Prokaznikov, A.V.; Svetovoy, V.B. Observation of spontaneous combustion of hydrogen and oxygen in microbubbles. Appl. Phys. Lett. 2016. submitted. [Google Scholar]
  24. Law, C.K. Combustion Physics; Cambridge University: Cambridge, UK, 2006. [Google Scholar]
  25. Steitz, R.; Gutberlet, T.; Hauss, T.; Klosgen, B.; Krastev, R.; Schemmel, S.; Simonsen, A.C.; Findenegg, G.H. Nanobubbles and their precursor layer at the interface of water against a hydrophobic substrate. Langmuir 2003, 19, 2409–2418. [Google Scholar] [CrossRef]
  26. Van den Broek, D.M.; Elwenspoek, M. Bubble nucleation in an explosive micro-bubble actuator. J. Micromech. Microeng. 2008, 18, 064003. [Google Scholar] [CrossRef]
  27. Lewis, B.; von Elbe, G. Combustion, Flames and Explosions of Gases; Academic Press: New York, NY, USA, 1987. [Google Scholar]
  28. Williams, F.A. Combustion Theory; The Benjamin/Cummins: Prinston, NJ, USA, 1985. [Google Scholar]
  29. Bruggeman, D.A.G. Berechnung verschiedener physikalischer Konstantenvon heterogenen Substanzen. Ann. Phys. (Leipzig) 1935, 24, 636–679. [Google Scholar] [CrossRef]
  30. Aspnes, D.E. Optical properties of thin films. Thin Solid Films 1982, 89, 249–262. [Google Scholar] [CrossRef]
  31. Maier-Schneider, D.; Maibach, J.; Obermeier, E. A new analytical solution for the load-deflection of square membranes. J. Microelectromech. Syst. 1995, 4, 238–241. [Google Scholar] [CrossRef]
  32. Skripov, V.P. Metastable Liquids; John Wiley: New York, NY, USA, 1974. [Google Scholar]
  33. Yin, Z.; Prosperetti, A.; Kim, J. Bubble growth on an impulsively powered microheater. Int. J. Heat Mass Transfer 2004, 47, 1053–1067. [Google Scholar] [CrossRef]
  34. Okuyama, K.; Mori, S.; Sawa, K.; Iida, Y. Dynamics of boiling succeeding spontaneous nucleation on a rapidly heated small surface. Int. J. Heat Mass Transfer 2006, 49, 2771–2780. [Google Scholar] [CrossRef]
  35. Hasan, M.N.; Monde, M.; Mitsutake, Y. Model for boiling explosion during rapid liquid heating. Int. J. Heat Mass Transfer 2011, 54, 2844–2853. [Google Scholar] [CrossRef]

