
Assessment of the Variability of Biogas Production from Sugar Beet Silage as Affected by Movement and Loss of the Produced Alcohols and Organic Acids

Abstract
:1. Introduction
2. Materials and Methods
2.1. Ensiling Process
2.2. Sample Collection
2.3. Physicochemical Analysis
2.4. Determination of Biochemical Methane Potentials
3. Data Analysis and Calculations
3.1. Theoretical Biochemical Methane Potential
4. Results and Discussion
4.1. Characteristics of Fresh Sugar Beet Pulp and Silage Samples
4.2. Methane Yield and Organic Composition of Silage Samples
4.3. Mass and Energy Loss after Ensiling
5. Conclusions
Acknowledgments
Author Contributions
Conflicts of Interest
References
- Boie, I.; Fernandes, C.; Frías, P.; Klobasa, M. Efficient strategies for the integration of renewable energy into future energy infrastructures in Europe—An analysis based on transnational modeling and case studies for nine European regions. Energy Policy 2014, 67, 170–185. [Google Scholar] [CrossRef]
- Mayer, F.; Gerin, P.A.; Noo, A.; Foucart, G.; Flammang, J.; Lemaigre, S.; Sinnaeve, G.; Dardenne, P.; Delfosse, P. Assessment of factors influencing the biomethane yield of maize silages. Bioresour. Technol. 2013, 153, 260–268. [Google Scholar] [CrossRef] [PubMed]
- Danish Government. Danmark uden Affald, Genanvend mere, forbrænd mindre; Miljø- og Fødevareministeriet: Copenhagen, Denmark, 2013.
- Juul, N.; Meibom, P. Optimal configuration of an integrated power and transport system. Energy 2011, 36, 3523–3530. [Google Scholar] [CrossRef]
- Münster, M.; Meibom, P. Optimization of use of waste in the future energy system. Energy 2011, 36, 1612–1622. [Google Scholar] [CrossRef]
- Olesen, J.E.; Jørgensen, U.; Hermansen, J.E.; Petersen, S.O.; Eriksen, J.; Søgaard, K.; Vinther, F.P.; Elsgaard, L.; Lund, P.; Nørgaard, J.V.; et al. Effekter af Tiltag til Reduktion af Landbrugets Udledninger af Drivhusgasser (Effects of Measures to Reduce Green House Gas Emissions from Agriculture); University Aarhus: Aarhus, Denmark, 2012. [Google Scholar]
- Triolo, J.M.; Pedersen, L.; Qu, H.; Sommer, S.G. Biochemical methane potential and anaerobic biodegradability of non-herbaceous and herbaceous phytomass in biogas production. Bioresour. Technol. 2012, 125, 226–232. [Google Scholar] [CrossRef] [PubMed]
- Triolo, J.M.; Sommer, S.G.; Møller, H.B.; Weisbjerg, M.R.; Jiang, X.Y. A new algorithm to characterize biodegradability of biomass during anaerobic digestion: Influence of lignin concentration on methane production potential. Bioresour. Technol. 2011, 102, 9395–9402. [Google Scholar] [CrossRef] [PubMed]
- Holm-Nielsen, J.B.; Al Seadi, T.; Oleskowicz-Popiel, P. The future of anaerobic digestion and biogas utilization. Bioresour. Technol. 2009, 100, 5478–5484. [Google Scholar] [CrossRef] [PubMed]
- Abouelenien, F.; Namba, Y.; Kosseva, M.R.; Nishio, N.; Nakashimada, Y. Enhancement of methane production from co-digestion of chicken manure with agricultural wastes. Bioresour. Technol. 2014, 159, 80–87. [Google Scholar] [CrossRef] [PubMed]
- Gylling, M.; Jørgensen, U.; Bentsen, N.S.; Kristensen, I.T.; Dalgaard, T.; Felby, C.; Johansen, V.K. +10 mio. tons planen—Muligheder for en øget dansk produktion af bæredygtig biomasse til bioraffinaderier. Frederiksberg 2012, 32. s. ill. Avaible online: http://dca.au.dk/fileadmin/DJF/Bioraf/ti-mio-plan.pdf (accessed on 1 February 2016). [Google Scholar]
- Brooks, L.; Parravicini, V.; Svardal, K.; Kroiss, H.; Prendl, L. Biogas from sugar beet press pulp as substitute of fossil fuel in sugar beet factories. Water Sci. Technol. 2008, 58, 1497–1504. [Google Scholar] [CrossRef] [PubMed]
- Umetsu, K.; Yamazaki, S.; Kishimoto, T.; Takahashi, J.; Shibata, Y.; Zhang, C.; Misaki, T.; Hamamoto, O.; Ihara, I.; Komiyama, M. Anaerobic co-digestion of dairy manure and sugar beets. Int. Congr. Ser. 2006, 1293, 307–310. [Google Scholar] [CrossRef]
- Scherer, P.; Neumann, L.; Demirel, B.; Schmidt, O.; Unbehauen, M. Long term fermentation studies about the nutritional requirements for biogasification of fodder beet silage as mono-substrate. Biomass Bioenergy 2009, 33, 873–881. [Google Scholar] [CrossRef]
- Sommer, S. Effect of composting on nutrient loss and nitrogen availability of cattle deep litter. Eur. J. Agron. 2001, 14, 123–133. [Google Scholar] [CrossRef]
- Pakarinen, A.; Maijala, P.; Jaakkola, S.; Stoddard, F.L.; Kymäläinen, M.; Viikari, L. Evaluation of preservation methods for improving biogas production and enzymatic conversion yields of annual crops. Biotechnol. Biofuels 2011, 4, 20. [Google Scholar] [CrossRef] [PubMed]
- Herrmann, C.; Heiermann, M.; Idler, C. Effects of ensiling, silage additives and storage period on methane formation of biogas crops. Bioresour. Technol. 2011, 102, 5153–5161. [Google Scholar] [CrossRef] [PubMed]
- Bruni, E.; Jensen, A.P.; Pedersen, E.S.; Angelidaki, I. Anaerobic digestion of maize focusing on variety, harvest time and pretreatment. Appl. Energy 2010, 87, 2212–2217. [Google Scholar] [CrossRef]
- Monlau, F.; Barakat, A.; Trably, E.; Dumas, C.; Steyer, J.-P.; Carrère, H. Lignocellulosic materials into biohydrogen and biomethane: Impact of structural features and pretreatment. Crit. Rev. Environ. Sci. Technol. 2013, 43, 260–322. [Google Scholar] [CrossRef]
- Wood, B.J.B. Microbiology of Fermented Foods, 2nd ed.; Springer, Blackie Academic and Professional: London, UK, 1998. [Google Scholar]
- Weißbach, F.; Wagner, A.; Scholtissek, M.; Auerbach, H.; Herbes, C. Konservierungsverluste bei der Silierung von Zuckerrüben für die Biogasgewinnung. Landtechnik 2011, 66, 254–258. (In German) [Google Scholar]
- American Public Health Association (APHA). Standard Methods for the Examination of Water and Wastewater, 21st ed.; APHA: Washington, DC, USA, 2005. [Google Scholar]
- Weissbach, F.; Strubelt, C. Correction of dry matter content in sugar beet silages as a substrate for biogas production. Landtechnik 2008, 63, 354–356. [Google Scholar]
- VDI 4630. Fermentation of Organic Materials: Characterization of the Substrate, Sampling, Collection of Material Data, Fermentation Tests. Verein Deutscher Ingenieure, Ed.; VDI-Handbuch Energietechnik, Beuth Verlag GmbH: Berlin, Germany, 2006. [Google Scholar]
- Mshandete, A.; Björnsson, L.; Kivaisi, A.K.; Rubindamayugi, M.S.T.; Mattiasson, B. Effect of particle size on biogas yield from sisal fibre waste. Renew. Energy 2006, 31, 2385–2392. [Google Scholar] [CrossRef]
- Kryvoruchko, V.; Machmüller, A.; Bodiroza, V.; Amon, B.; Amon, T. Anaerobic digestion of by-products of sugar beet and starch potato processing. Biomass Bioenergy 2009, 33, 620–627. [Google Scholar] [CrossRef]
- Bauer, A.; Bösch, P.; Friedl, A.; Amon, T. Analysis of methane potentials of steam-exploded wheat straw and estimation of energy yields of combined ethanol and methane production. J. Biotechnol. 2009, 142, 50–55. [Google Scholar] [CrossRef] [PubMed]
- Bauer, A.; Leonhartsberger, C.; Bösch, P.; Amon, B.; Friedl, A.; Amon, T. Analysis of methane yields from energy crops and agricultural by-products and estimation of energy potential from sustainable crop rotation systems in EU-27. Clean Technol. Environ. Policy 2009, 12, 153–161. [Google Scholar] [CrossRef]
- De Paoli, F.; Bauer, A.; Leonhartsberger, C.; Amon, B.; Amon, T. Utilization of by-products from ethanol production as substrate for biogas production. Bioresour. Technol. 2011, 102, 6621–6624. [Google Scholar] [CrossRef] [PubMed]
- International Standard Organization (ISO) 11734 – water quality. Evaluation of the Ultimate Anaerobic Biodegradability of Organic Compounds in Digested Sludge Method by Measurements of the Biogas Production; British Standards Institution (BSI): London, UK, 1995. [Google Scholar]
- Pham, C.H.; Triolo, J.M.; Cu, T.T.T.; Pedersen, L.; Sommer, S.G. Validation and recommendation of methods to measure biogas production potential of animal manure. Asian Australas. J. Anim. Sci. 2013, 26, 864–873. [Google Scholar] [CrossRef] [PubMed]
- Weissbach, F. Gas production potential of fresh and ensiled sugar beets in biogas production. Landtechnik 2009, 6, 394–397. [Google Scholar]
- Møller, H.B.; Sommer, S.G.; Ahring, B.K. Methane productivity of manure, straw and solid fractions of manure. Biomass Bioenergy 2004, 26, 485–495. [Google Scholar] [CrossRef]
- Symons, G.E.; Buswell, A.M. The methane fermentation of carbohydrates. J. Am. Chem. Soc. 1933, 55, 2028–2036. [Google Scholar] [CrossRef]
- Raposo, F.; Fernandez-Cegri, V.; la Rubia, M.A.; Borja, R.; Beline, F.; Cavinato, C. Biochemical methane potential (BMP) of solid organic substrates: evaluation of anaerobic biodegradability using data from an international interlaboratory study. J. Chem. Technol. Biotechnol. 2011, 86, 1088–1098. [Google Scholar] [CrossRef]
- Moon, N.J. A short review of the role of lactobacilli in silage fermentation. Food Microbiol. 1984, 1, 333–338. [Google Scholar] [CrossRef]
- McDonald, P. Silage fermentation. Trends Biochem. Sci. 1982, 7, 164–166. [Google Scholar] [CrossRef]
- Kalyuzhnyi, S.V.; Davlyatshina, M.A. Batch anaerobic digestion of glucose and its mathematical modeling. I. Kinetic investigations. Bioresour. Technol. 1997, 59, 73–80. [Google Scholar] [CrossRef]


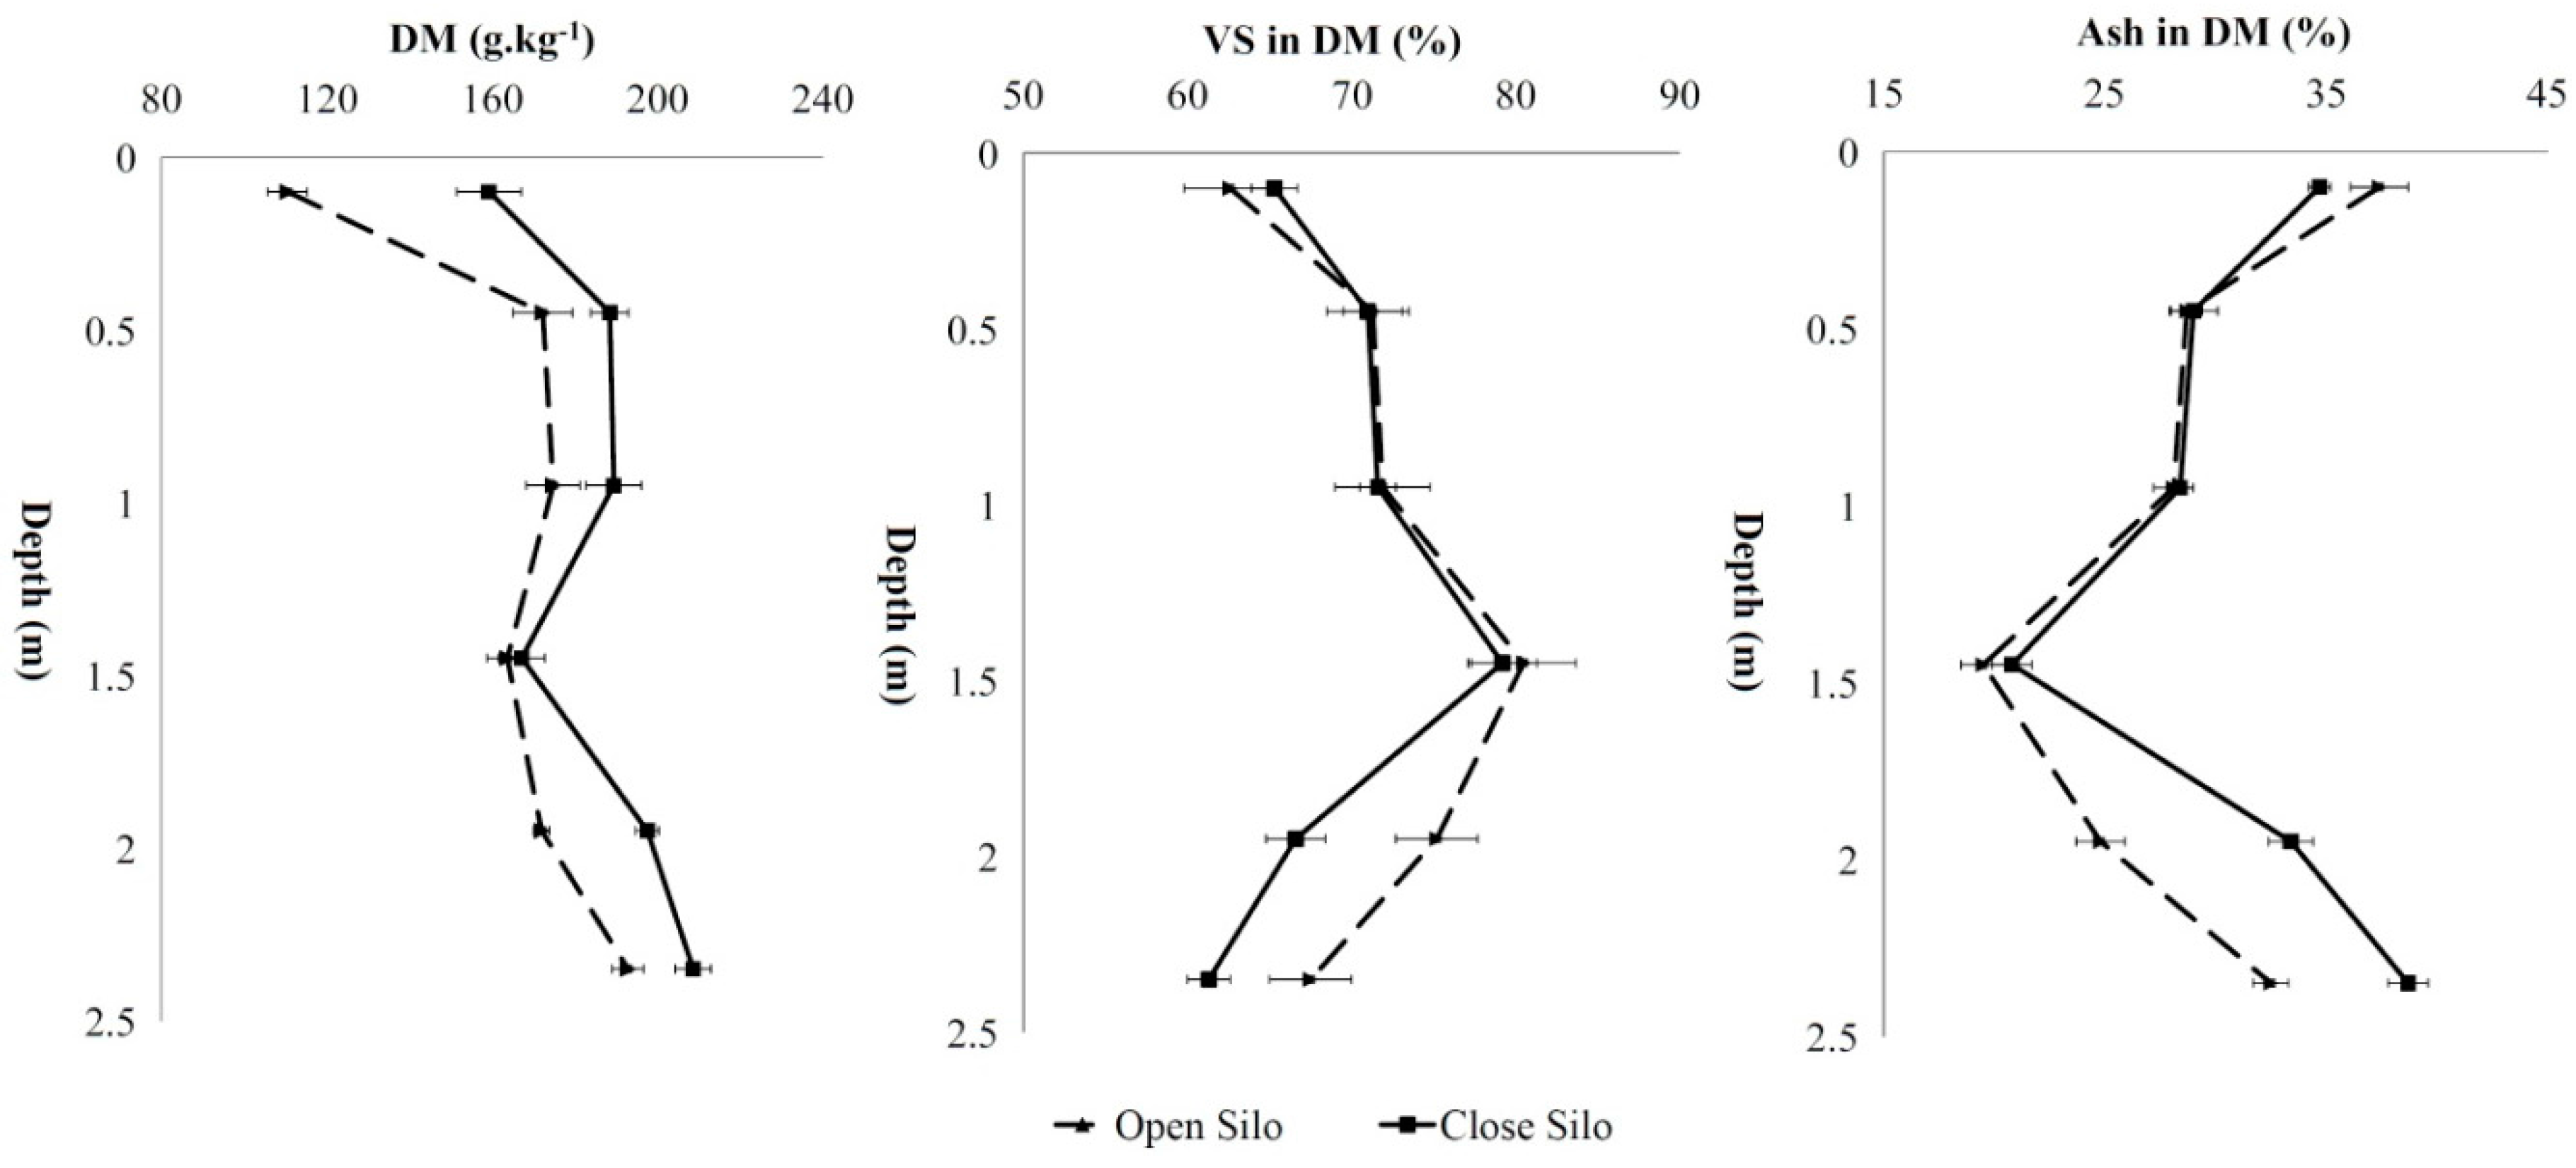
| Depth (m) | DM (g/kg) | VS (g/kg) | Crude Proteins (% VS) | Crude Lipids (% VS) | VFAs (% VS) | Ethanol (% VS) | Lactic Acid (% VS) | Carbohydrates (% VS) | BMP (Nl/kg VS) | TBMP (Nl/kg VS) | khyd (day−1) | |
|---|---|---|---|---|---|---|---|---|---|---|---|---|
| Open silo | 0.1 | 110.5 (±4.8) | 69.2 (±5.7) | 16.0 (±1.5) | 0.8 (±0.00) | 17.7 (±2.8) | 6.9 (±1.0) | 32.1 (±3.8) | 26.5 (±1.6) | 337 (±3) a | 434 | 0.189 |
| 0.45 | 172.3 (±7.2) | 122.9 (±9.3) | 7.8 (±1.1) | 0.7 (±0.05) | 6.6 (±0.9) | 14.7 (±2.8) | 25.7 (±2.3) | 44.5 (±3.4) | 383 (±2) b | 458 | 0.180 | |
| 0.95 | 174.8 (±6.5) | 125.7 (±4.6) | 8.0 (±0.7) | 0.7 (±0.04) | 5.5 (±0.6) | 15.4 (±3.2) | 25.1 (±1.7) | 45.3 (±2.8) | 402 (±12) b,c | 461 | 0.173 | |
| 1.45 | 163.7 (±4.9) | 131.7 (±2.7) | 7.9 (±1.2) | 0.6 (±0.01) | 5.0 (±0.2) | 15.0 (±2.8) | 24.2 (±1.4) | 47.3 (±3.6) | 420 (±7) c | 460 | 0.162 | |
| 1.95 | 172.0 (±1.9) | 129.3 (±6.8) | 5.9 (±0.3) | 0.6 (±0.05) | 5.1 (±0.7) | 14.4 (±2.4) | 25.4 (±0.9) | 48.6 (±1.8) | 403 (±8) b,c | 456 | 0.176 | |
| 2.35 | 192.9 (±3.8) | 130.2 (±9.7) | 6.0 (±0.4) | 0.8 (±0.1) | 4.9 (±0.1) | 13.0 (±1.6) | 24.8 (±2.3) | 50.5 (±4.1) | 388 (±8) b | 453 | 0.186 | |
| Closed silo | 0.1 | 159.3 (±7.8) | 104.1 (±2.4) | 8.2 (±0.4) | 0.7 (±0.06) | 10.1 (±0.5) | 10.6 (±0.3) | 26.8 (±0.4) | 43.6 (±2.1) | 413 (±20) a | 444 | 0.167 |
| 0.45 | 188.5 (±4.6) | 133.8 (±1.5) | 7.4 (±0.6) | 0.8 (±0.00) | 5.2 (±0.1) | 12.4 (±1.0) | 24.0 (±2.2) | 50.2 (±3.1) | 411 (±5) a | 452 | 0.173 | |
| 0.95 | 189.5 (±6.7) | 135.7 (±6.0) | 6.9 (±0.1) | 0.8 (±0.03) | 4.5 (±0.2) | 15.3 (±0.8) | 23.0 (±1.5) | 49.5 (±4.4) | 421 (±9) a,b | 461 | 0.164 | |
| 1.45 | 167.2 (±5.6) | 132.5 (±9.9) | 6.3 (±0.3) | 0.6 (±0.05) | 4.2 (±0.0) | 15.2 (±1.0) | 23.2 (±0.7) | 50.5 (±5.3) | 451 (±4) b | 460 | 0.145 | |
| 1.95 | 197.6 (±2.8) | 131.7 (±3.6) | 6.9 (±0.4) | 0.8 (±0.00) | 4.6 (±0.7) | 13.2 (±1.2) | 24.2 (±2.6) | 50.3 (±3.4) | 437 (±4) a,b | 454 | 0.163 | |
| 2.35 | 208.7 (±4.3) | 128.0 (±4.2) | 6.8 (±0.7) | 0.9 (±0.07) | 4.7 (±0.4) | 11.1 (±0.6) | 25.4 (±2.1) | 51.1 (±2.6) | 436 (±17) a,b | 447 | 0.169 | |
| Sugar beet pulp before silage | - | 194.6 (±5.9) | 153.4 (±1.8) | 5.9 (±0.3) | 0.6 (±0.04) | 0.5 (±0.2) | 0.0 (±0.0) | 0.0 (±0.0) | 93.0 (±1.1) | 342 (±5) | 422 | - |
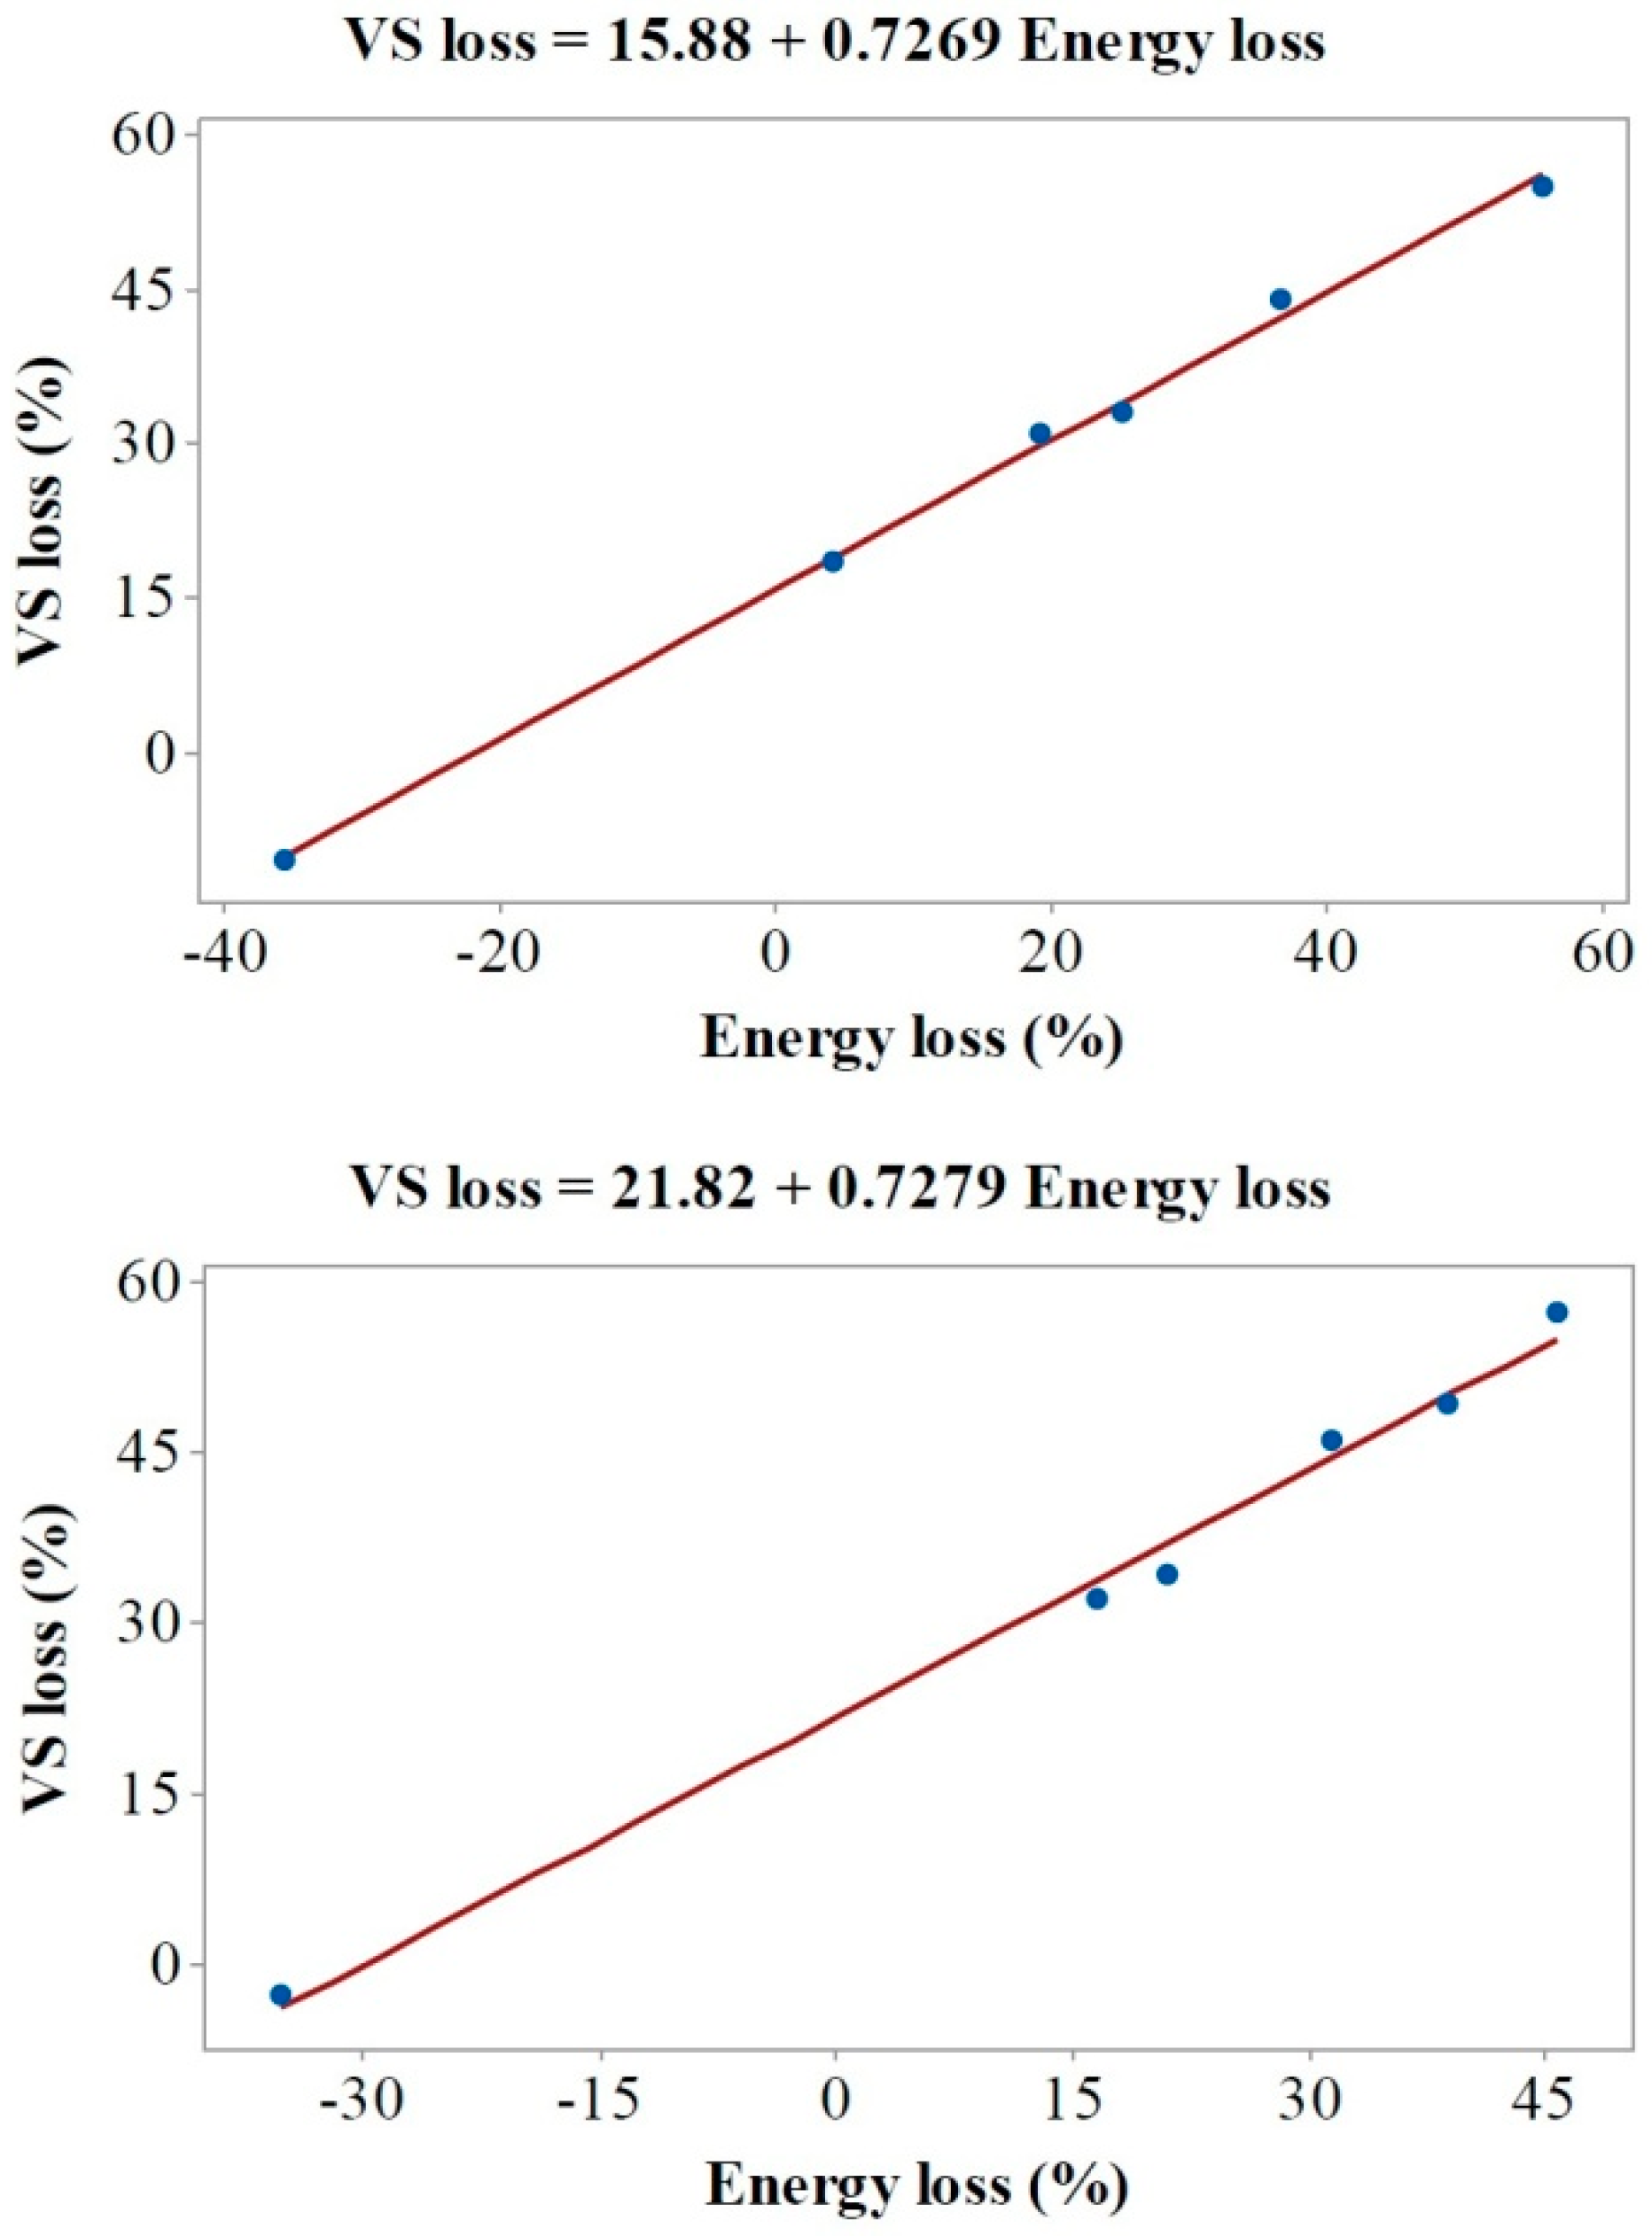
| Depth (m) | VS in DM (%) | Ash in DM (%) | BMP (Nl/kg VS) | Methane Yield (Nl/kg Sample) | VS Loss (%) | BMP (Based on Original VS) (Nl/kg VS) | Energy Loss (%) | |
|---|---|---|---|---|---|---|---|---|
| Open silo | 0.1 | 62.6 (±2.8) | 37.4 (±1.3) | 337 (±3) a | 23.3 (±0.5) | 55.0 (±1.5) | 152 (±1) | 55.7 (±1.1) |
| 0.45 | 71.3 (±1.8) | 28.7 (±0.7) | 383 (±2) b | 47.1 (±0.4) | 33.2 (±1.0) | 256 (±2) | 25.2 (±0.6) | |
| 0.95 | 71.9 (±2.9) | 28.1 (±0.9) | 402 (±12) b,c | 50.5 (±1.1) | 31.2 (±0.5) | 276 (±2) | 19.2 (±0.4) | |
| 1.45 | 80.5 (±3.2) | 19.5 (±1.0) | 420 (±7) c | 55.3 (±0.6) | −10.5 (±0.6) | 464 (±4) | −35.7 (±0.8) | |
| 1.95 | 75.2 (±2.5) | 24.8 (±1.1) | 403 (±8) b,c | 52.1 (±0.7) | 18.7 (±0.7) | 328 (±4) | 4.2 (±0.4) | |
| 2.35 | 67.5 (±2.5) | 32.5 (±0.8) | 388 (±8) b | 50.5 (±0.7) | 44.2 (±0.9) | 216 (±3) | 36.7 (±0.7) | |
| Closed silo | 0.1 | 65.3 (±1.4) | 34.7 (±0.5) | 413 (±20) a | 43.0 (±1.2) | 49.3 (±1.1) | 209 (±6) | 38.8 (±0.5) |
| 0.45 | 71.0 (±2.5) | 29.0 (±1.1) | 411 (±5) a | 55.0 (±0.4) | 34.3 (±0.7) | 270 (±1) | 21.0 (±0.1) | |
| 0.95 | 71.6 (±1.1) | 28.4 (±0.6) | 421 (±9) a,b | 57.1 (±0.8) | 32.3 (±0.9) | 285 (±3) | 16.6 (±0.7) | |
| 1.45 | 79.2 (±2.1) | 20.8 (±0.9) | 451 (±4) b | 59.8 (±0.3) | −2.6 (±0.3) | 463 (±2) | −35.2 (±0.5) | |
| 1.95 | 66.6 (±1.8) | 33.4 (±1.0) | 437 (±4) a,b | 57.6 (±0.2) | 46.3 (±0.9) | 235 (±2) | 31.4 (±0.4) | |
| 2.35 | 61.3 (±1.3) | 38.7 (±0.9) | 436 (±17) a,b | 55.8 (±1.0) | 57.4 (±1.0) | 186 (±7) | 45.7 (±0.8) | |
| Sugar beet pulp before silage | - | 78.8 (±0.8) | 21.2 (±1.0) | 342 (±5) | 52.5 (±0.3) | - | 342 | - |
© 2016 by the authors; licensee MDPI, Basel, Switzerland. This article is an open access article distributed under the terms and conditions of the Creative Commons Attribution (CC-BY) license (http://creativecommons.org/licenses/by/4.0/).
Share and Cite
Heidarzadeh Vazifehkhoran, A.; Triolo, J.M.; Larsen, S.U.; Stefanek, K.; Sommer, S.G. Assessment of the Variability of Biogas Production from Sugar Beet Silage as Affected by Movement and Loss of the Produced Alcohols and Organic Acids. Energies 2016, 9, 368. https://doi.org/10.3390/en9050368
Heidarzadeh Vazifehkhoran A, Triolo JM, Larsen SU, Stefanek K, Sommer SG. Assessment of the Variability of Biogas Production from Sugar Beet Silage as Affected by Movement and Loss of the Produced Alcohols and Organic Acids. Energies. 2016; 9(5):368. https://doi.org/10.3390/en9050368
Chicago/Turabian StyleHeidarzadeh Vazifehkhoran, Ali, Jin Mi Triolo, Søren Ugilt Larsen, Kasper Stefanek, and Sven G. Sommer. 2016. "Assessment of the Variability of Biogas Production from Sugar Beet Silage as Affected by Movement and Loss of the Produced Alcohols and Organic Acids" Energies 9, no. 5: 368. https://doi.org/10.3390/en9050368