Article

Cathode Assessment for Maximizing Current Generation in Microbial Fuel Cells Utilizing Bioethanol Effluent as Substrate

Center for BioProcess Engineering, Department of Chemical and Biochemical Engineering, Technical University of Denmark, Søltofts Plads 229, DK-2800 Kgs. Lyngby, Denmark
*
Author to whom correspondence should be addressed.
Energies 2016, 9(5), 388; https://doi.org/10.3390/en9050388
Submission received: 17 February 2016 / Revised: 26 April 2016 / Accepted: 10 May 2016 / Published: 20 May 2016
(This article belongs to the Collection Bioenergy and Biofuel)

Abstract

:
Implementation of microbial fuel cells (MFCs) for electricity production requires effective current generation from waste products via robust cathode reduction. Three cathode types using dissolved oxygen cathodes (DOCs), ferricyanide cathodes (FeCs) and air cathodes (AiCs) were therefore assessed using bioethanol effluent, containing 20.5 g/L xylose, 1.8 g/L arabinose and 2.5 g/L propionic acid. In each set-up the anode and cathode had an electrode surface area of 88 cm2, which was used for calculation of the current density. Electricity generation was evaluated by quantifying current responses to substrate loading rates and external resistance. At the lowest external resistance of 27 Ω and highest substrate loading rate of 2 g chemical oxygen demand (COD) per L·day, FeC-MFC generated highest average current density (1630 mA/m2) followed by AiC-MFC (802 mA/m2) and DOC-MFC (184 mA/m2). Electrochemical impedance spectroscopy (EIS) was used to determine the impedance of the cathodes. It was thereby confirmed that the FeC-MFC produced the highest current density with the lowest internal resistance for the cathode. However, in a setup using bioethanol effluent, the AiC-MFC was concluded to be the most sustainable option since it does not require ferricyanide. The data offer a new add-on option to the straw biorefinery by using bioethanol effluent for microbial electricity production.

Graphical Abstract

1. Introduction

A microbial fuel cell (MFC) represents a novel type of system for converting chemically bound energy in organic waste into electricity [1]. In MFCs bacteria serve as biocatalysts to oxidize organic matter in the anode chamber and subsequently transfer electrons to the anode electrode. These electrons are then transferred through an external circuit to the cathode, where the reduction reaction takes place. Typically the reduction at the cathode surface involves reduction of O2 to H2O [2]. The latest research has mainly focused on the bacterial metabolism on the anode electrode surface [3], improving anode electrode materials [4], optimizing the anode inoculum [5], speeding up the initiation through selection of substrate [6], and on improving the reactor design and configuration for maximizing conversion efficiency and output [1].
In addition to maximizing the microbial oxidation reaction in the anode chamber it is important to optimize the cathode reaction. One aspect of the cathode performance is the cathode reaction design. Potassium ferricyanide cathode, K3[Fe(CN)6], abbreviated here as FeC, is a well-studied and efficient type of cathode reaction employed in MFCs, relying on Fe3+ → Fe2+ reduction for electron consumption. However, the use of FeC presents some toxicity issues due to the cyanide. Comparison of FeC with other types of cathodes, e.g., oxygen based cathodes, can therefore provide an improved decision base for selecting better and more sustainable electrode reactions for MFC technology.
Another key issue in MFC research is to understand the biotic and abiotic factors that limit electric current output [7]. The limiting factors are generally represented by internal resistance, which is caused by activation resistance, ohmic resistance and concentration resistance [8,9]. The ohmic resistance can be estimated by electrochemical impedance spectroscopy (EIS), which provides information for estimation of the electrochemical reaction rate [7]. The detailed technique and data analysis have been introduced in several recent reports [7,10,11].
The current generation is influenced by operational parameters including external resistance and substrate loading rate. The substrate loading rate is usually expressed as chemical oxygen demand (COD) in the unit g/(L∙day). Lowering of external resistance can result in an increase in current generation. However, an increase in substrate loading rate only results in an increased current generation when the external resistance is low enough to enable current generation [12].
Substrates that have been tested in MFCs include acetate, which can be directly used by the electrogenic bacterium Geobacter sulfurreducens [13] and fermentable sugars such as xylose, which are converted by fermentative bacteria resulting in acetate formation [14]. Bioethanol effluent is a solution rich in xylose resulting from second generation bioethanol fermentation and distillation [15]. Bioethanol effluent is suitable as substrate for current generation in MFCs when the MFC is initiated using acetate [6]. However, further performance improvement can be achieved by the use of inocula from different environmental sources such as lake sediment [5]. In addition, an efficient cathode process is required before the use of MFC for current generation is feasible.
The aim of this study was to assess the performance of three different cathode configurations (dissolved oxygen cathode (DOC), FeC, and air cathode (AiC)). Moreover, the effects of substrate loading rate and external resistance were examined to optimize the electrical current generation in MFCs running on bioethanol effluent as substrate in the anode chamber. It was thereby expected to maximize power generation and to obtain an improved understanding of the significance of the cathode process for current generation.

2. Results

The FeC and DOC cathodes were evaluated in dual chamber MFCs with the cathodes designed to constitute the wall in the cathode chamber opposite to the membrane (Figure 1a), whereas the AiC cathode was examined in a single-chamber MFC reactor configuration (Figure 1b). The air electrode was constructed as a sandwich composite cathode (Figure 1c). The reactor was designed so that the anode constituted the wall on the opposite side of the membrane in all three MFC configurations (Figure 1a,b). The comparisons of cathode performance were done over seven periods; initially, Period 1 (0–10 days), the anode chambers contained minimal medium (M9) and acetate, then in subsequent cycles bioethanol effluent was added at increasing substrate loading rate. The external resistance was set to decrease versus time period. The cathode compartments tested contained a solution of 10 g/L NaCl bubbled with air for the DOC-MFC, K3Fe(CN)6 + phosphate buffer for the FeC-MFC and air for the AiC-MFC, respectively.

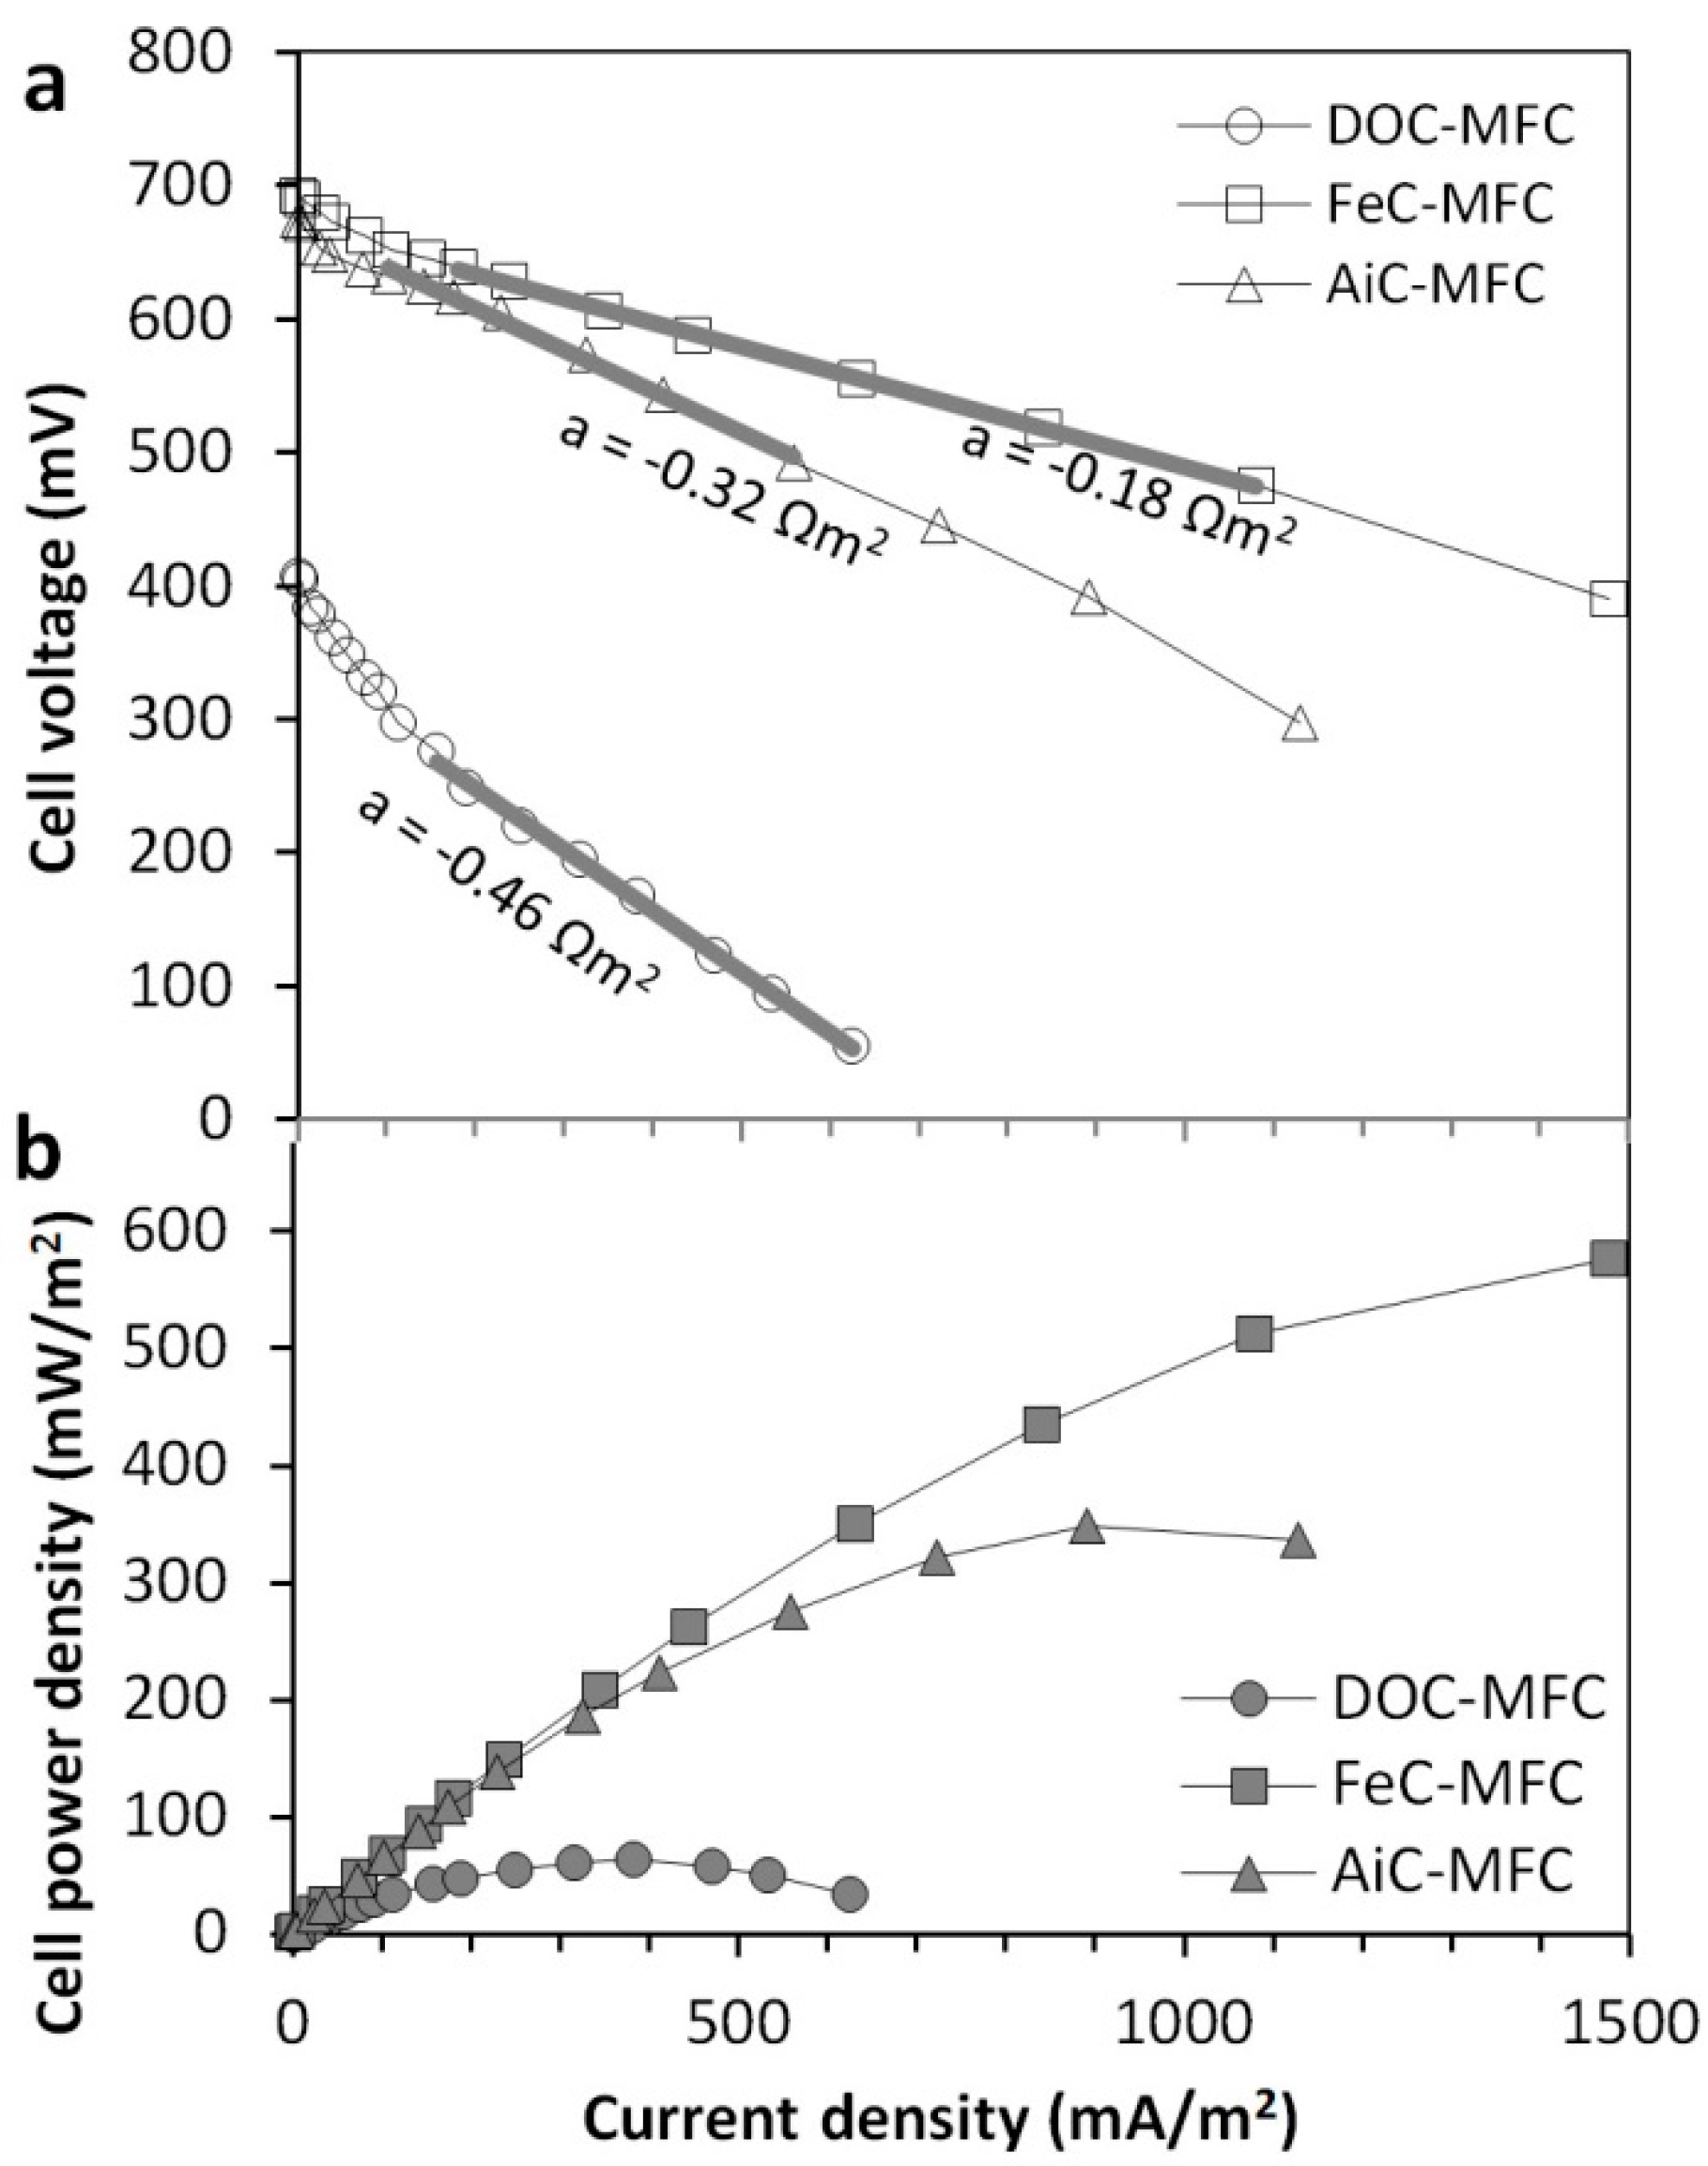
2.1. Maximum Current Generation Found from the Polarisation Curves

To assess the effect of cathode reaction on maximum current density and maximum power density, cell voltage and power were plotted versus current density obtained during the initiation phase with acetate (specifically data were taken at day 4 in Period 1; Figure 2). The open-circuit voltage was found to be 407, 692 and 674 mV for the DOC-, FeC- and AiC-MFCs, respectively, i.e., the FeC-MFC produced highest voltage at zero current (Figure 2a). The FeC-MFC also showed highest maximum current density (1480 mA/m2) and maximum power density (580 mW/m2), followed by the AiC-MFC with 1130 mA/m2 and 340 mW/m2, respectively. The DOC-MFC thus generated lowest maximum current density (630 mA/m2) and maximum power density (57 mW/m2) (Figure 2b). These results are in agreement with the finding that the FeC-MFC had the lowest internal resistance of 0.18 Ωm2 (Figure 2). The curves in Figure 2a were linear in the range 200–600 mA/m2 for DOC and AiC and in the range 200–1100 mA/m2 for FeC. The process is limited by electrolyte resistance in these ranges. The normalized internal resistance, obtained from the slopes of the cell voltage curves were 0.46, 0.32 and 0.18 Ωm2 for the MFCs with DOC, AiC and FeC cathodes, respectively.
Figure 3 shows the anode and cathode electrode potentials versus an Ag/AgCl reference electrode plotted versus current density. The gap in mV between the curves equals the cell voltage plotted in Figure 2a versus current density. This plot makes it possible to determine the performance of each electrode reaction individually while Figure 2a shows the performance of the entire MFC. The electrode which limits the performance will result in a curve with a steep slope versus current. The regression line of the curves is linear in the ohmic losses region [16], but the slope can be increased if there is a large over-potential and/or high concentration resistance.
The curves for cathode electrode potential for DOC showed a fast linear drop (slope = −0.43 Ωm2) due to the slow cathodic redox reaction rate caused by slow transport of dissolved oxygen, which limits maximum current density for the cathode. The similar slopes for FeC- and AiC-cathodes were −0.11 Ωm2 and −0.10 Ωm2, respectively, in the linear current range 200–600 mA/m2. The slope on anode potentials of the three different cathode compositions were +0.08, +0.07 and +0.22 Ωm2 for DOC, FeC and AiC, respectively.

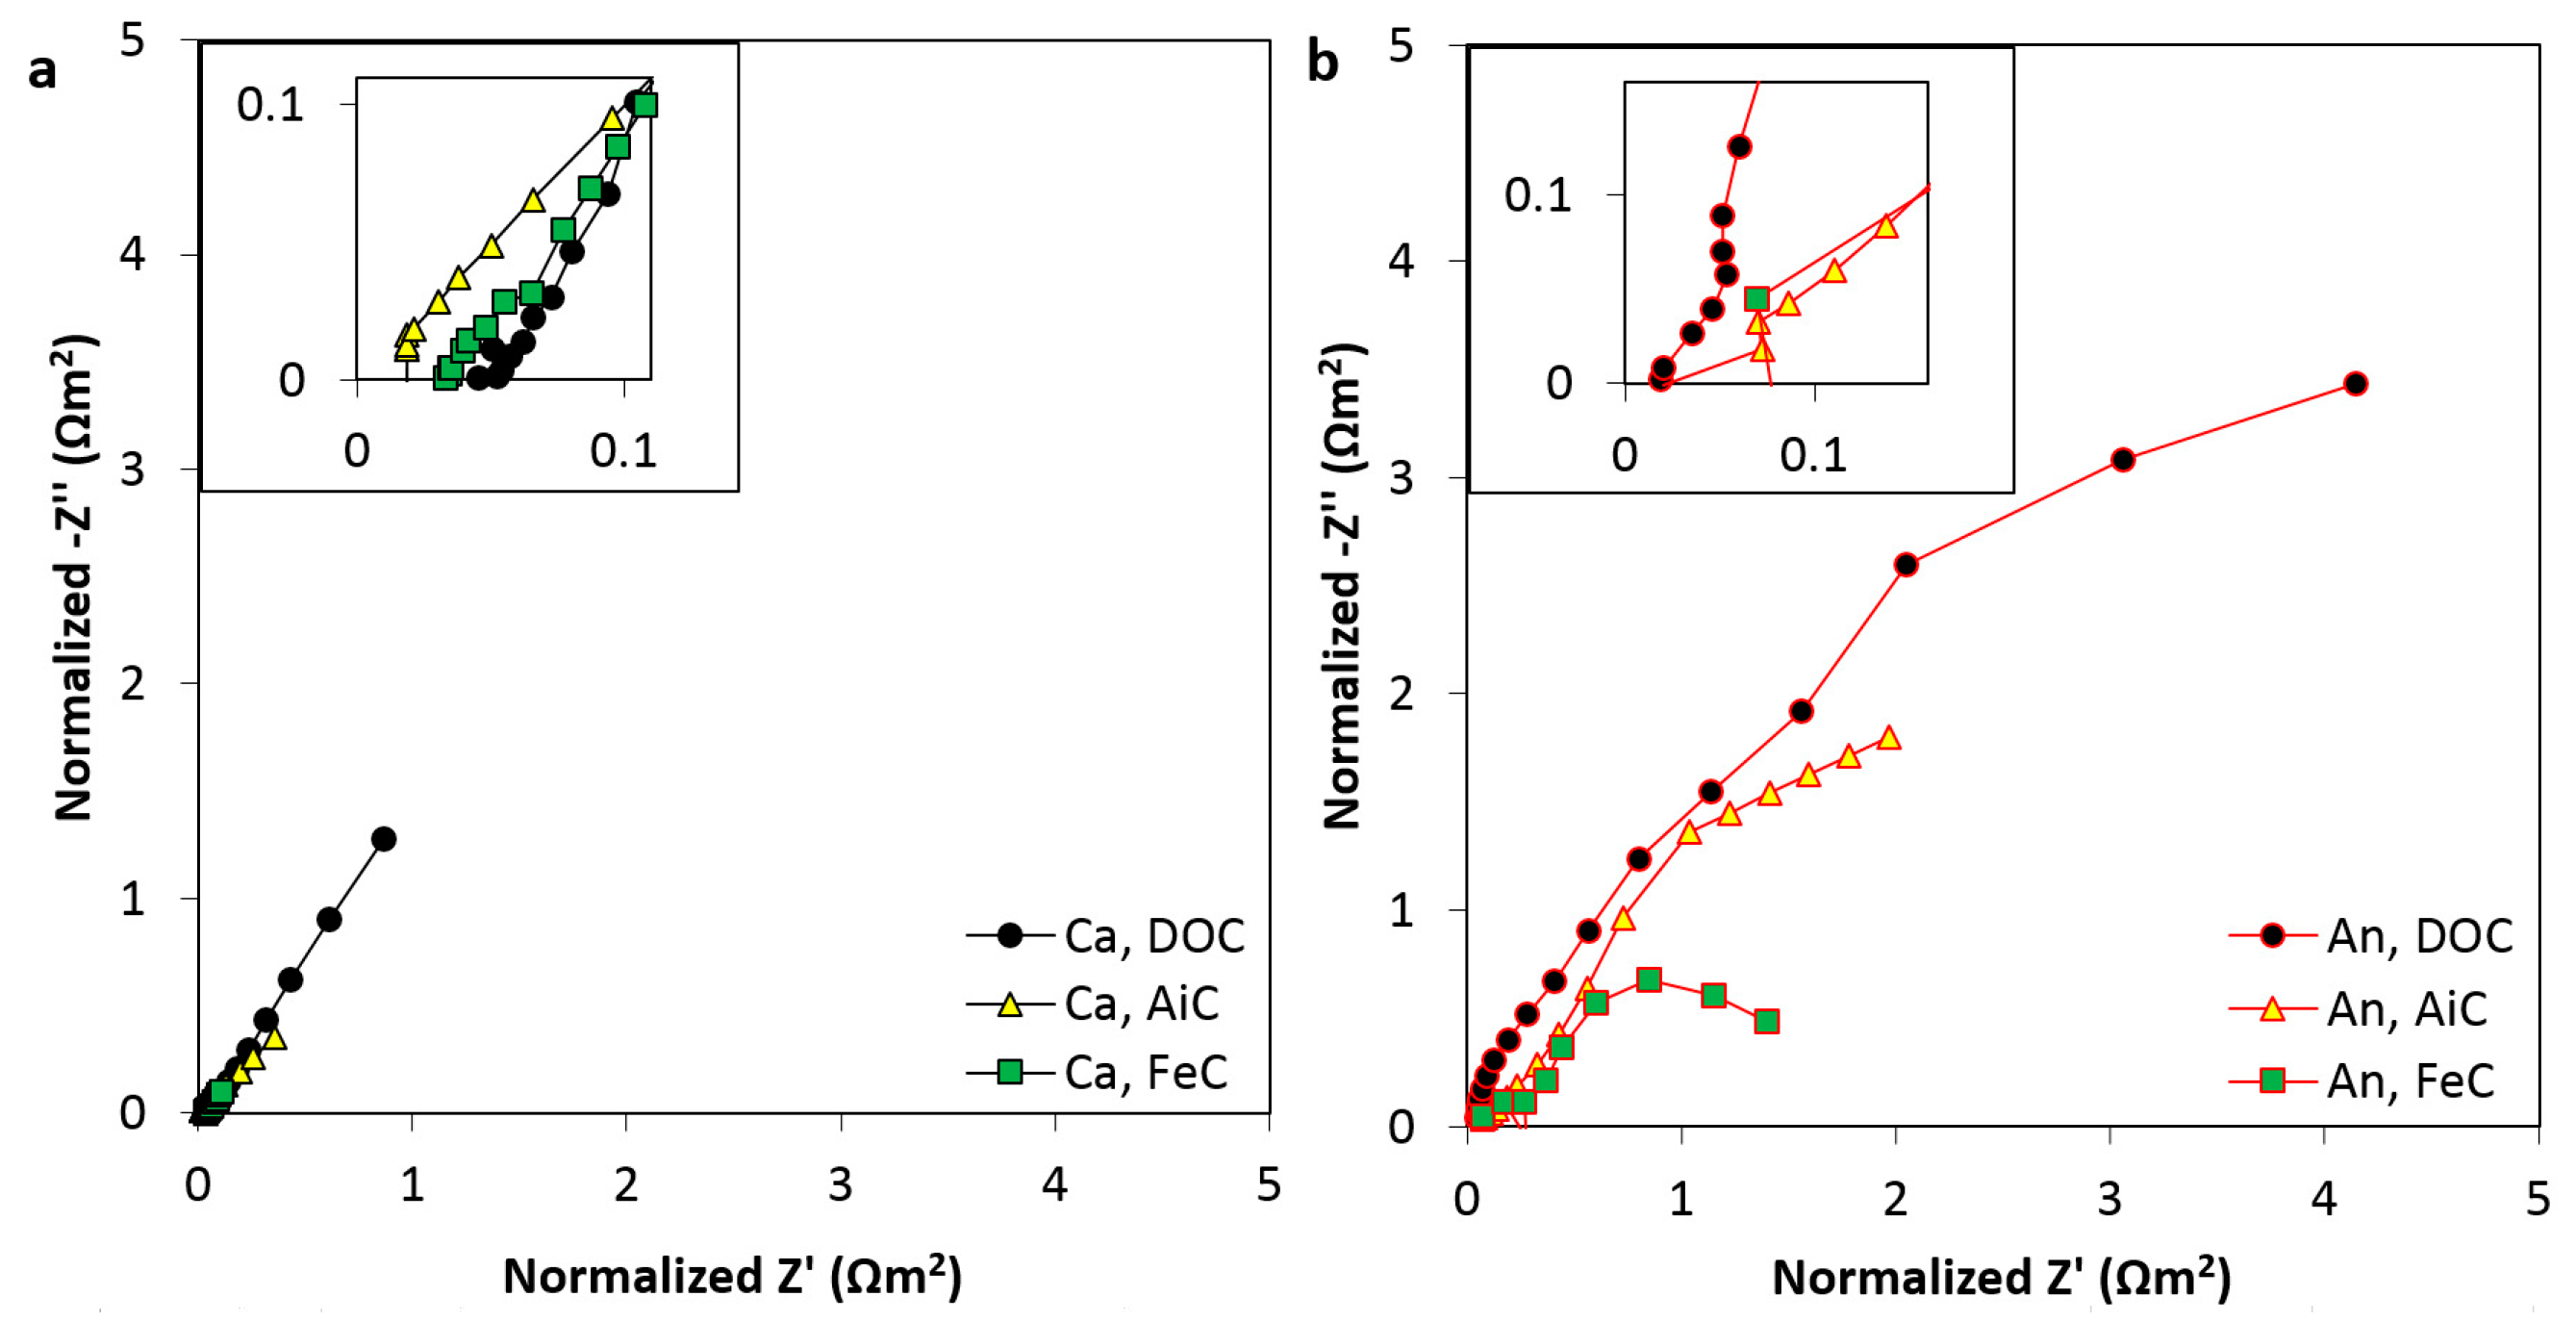
2.2. Resistance in the Anode and Cathode Electrodes

The experimentally obtained EIS data are presented in Figure 4 as Nyquist plots showing the imaginary impedance (−Z”, Ωm2) versus the real impedance (Z’, Ωm2) of the measured data. The three cathode setups were plotted for cathode and anode impedance contribution in Figure 4a,b, respectively. For all three cathodes, ohmic resistance was above zero due to resistance caused by ion migration between the electrodes through the solution. Ohmic resistance for the cathodes were 0.05, 0.04 and 0.02 Ωm2 for the DOC-, FeC- and AiC-MFCs, respectively (Figure 4a). Especially for DOC- and AiC-MFCs, these resistance values were lower (9 and 5 times, respectively) than the total internal resistance estimated by linear regression of voltage in Figure 2a and electrode potentials in Figure 3 (Table 1). The discrepancies can be explained by larger concentration resistance in these two cases at low frequencies (large Z’), and since oxygen dissolution is limiting with the DOC cathode. For all three anodes, the ohmic resistance was low due to a low electrolyte resistance. Ohmic resistance for the anode were all in the range of 0.05 ± 0.02 Ωm2, namely at 0.02, 0.07 and 0.02 Ωm2 for DOC-, FeC- and AiC-MFCs, respectively (discernable on the x-axis in Figure 4b).
These ohmic resistances were for the DOC and AiC-MFCs lower than the internal resistance estimated by linear regression in Table 1. Again, the difference may be due to larger concentration resistance found in these two cases at low frequencies (large Z’). The data corroborated that the K3Fe(CN)6 solution was much more efficient than the NaCl solution for current generation. The EIS data for the anode and cathode thus explained that the FeC-MFC gave the highest maximum current density, followed by the AiC-MFC and the DOC-MFC.

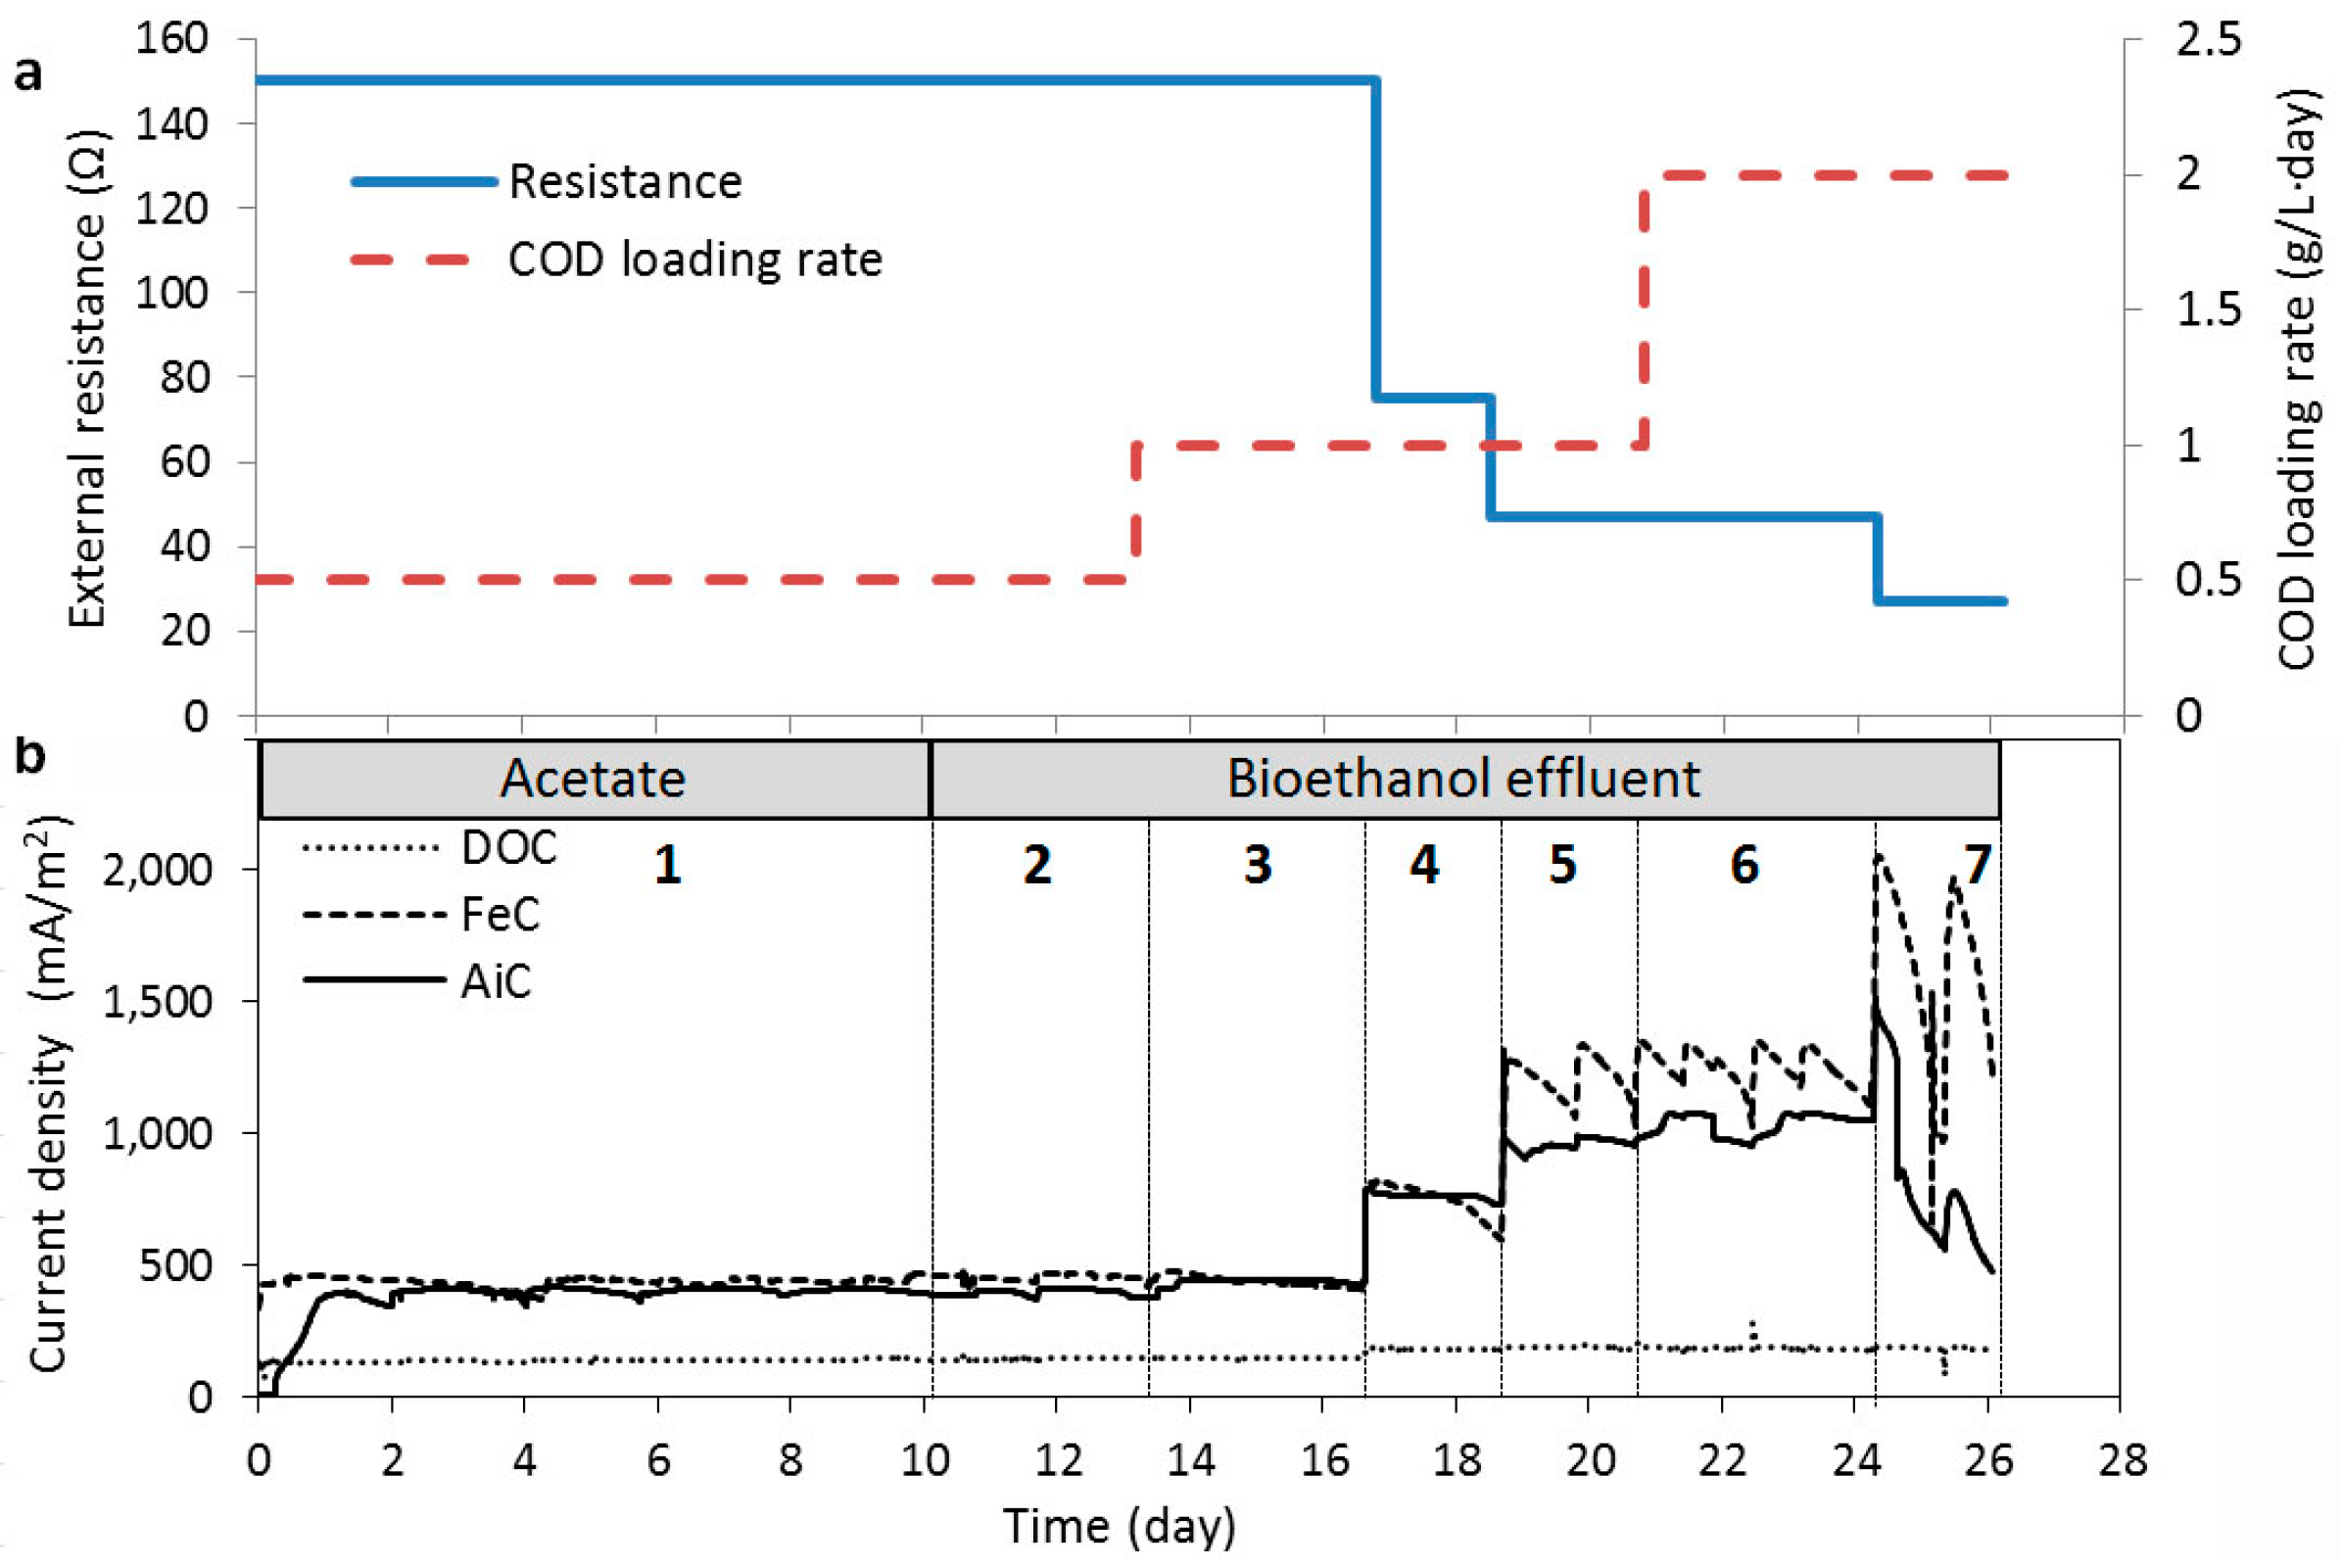
2.3. Current Generation in Relation to Substrate Loading Rate and Switching to Bioethanol Effluent

It has been found that substrate loading rate and external resistance determines the maximum charge and current, which can be generated in a MFC [5,12]. Increasing substrate loading rate at decreasing external resistance was investigated to optimize electricity generation in the MFCs as shown in Figure 5.
The thereby resulting current generation, electrode potentials and coulombic efficiency (CE) versus period number are summarized in Table 2. During the first 10 days, the MFCs were fed with acetate at an external resistance of 150 Ω (Period 1). The FeC-MFC generated highest average current density (444 mA/m2), followed by AiC-MFC (397 mA/m2) and DOC-MFC (142 mA/m2). This result agreed with the EIS results that internal resistance was lower with the FeC- and AiC-MFC than with the DOC-MFC (Table 1 and Figure 4). The lowest average current density of the DOC-MFC is partly due to the low open circuit cathode electrode potential of −0.28 V generated by reduction of dissolved oxygen compared to +0.23 V for the FeC and AiC cathodes (Figure 4). Afterwards, all the MFCs were switched to utilize bioethanol effluent containing 65 g/L COD, 20.5 g/L xylose, 1.8 g/L arabinose and 2.5 g/L propionic acid. At an external resistance of 150 Ω, the substrate loading rate was increased from 0.5 g·COD/(L∙day) to 1.0 g·COD/(L∙day) (Periods 2 and 3). Remarkably, among all the parameters only CE decreased from Periods 1 to 3. This may be due to the addition of bioethanol effluent, which can enrich the population of fermentable bacteria [6].
During the subsequent Periods 3–5 the substrate loading rate was kept at 1.0 g·COD/(L∙day). At the same time, the external resistance was decreased from 150 Ω in Period 3 to 75 Ω in Period 4 and to 47 Ω in Period 5. This decrease in external resistance resulted in a significant increase in current density and CE (Table 2). The FeC-MFC showed highest average current density (1114 mA/m2) and CE (62%), followed by AiC-MFC with 920 mA/m2 and 49%, respectively and by DOC-MFC with 186 mA/m2 and 19%, respectively (Period 5). The decrease in external resistance also decreased the cathode electrode potential in DOC-MFC from −290 mV to −390 mV and in AiC-MFC from +150 mV to +50 mV due to the increase in current density.
At an external resistance of 47 Ω, the average current density in FeC- and AiC-MFCs was increased by doubling the substrate loading rate from 1 g·COD/(L∙day) to 2 g·COD/(L∙day) (Periods 5 and 6). This indicates that an increase in substrate loading rate results in increased current when the resistance is low. However, CE decreased significantly because of consumption of excess substrate by fermentative bacteria. The decrease in external resistance from 47 Ω to 27 Ω at a substrate loading rate of 2 g·COD/(L∙day) resulted in an increase in average current density from 1279 mA/m2 to 1640 mA/m2 in FeC-MFC, while the average current density in AiC-MFCs decreased from 1043 mA/m2 to 802 mA/m2. The decreased average current density in AiC-MFC was accompanied by a significant rise of anode electrode potential, from −400 mV to −50 mV, while the FeC-MFC only showed slight rise from −390 mV to −340 mV. This indicates that the optimal external resistance for the AiC reaction was 47 Ω. However, the FeC-MFC generated by far the highest average current density (1640 mA/m2) at the lowest external resistance (27 Ω).

3. Discussion

MFCs were optimized by improvement of cathode configuration for the target of using bioethanol effluent as feedstock. The performance of the MFCs, and hence the comparison of the cathodes, were based on current density, electrode potential, and impedance measurement.

3.1. Obtainable Current for the Different Cathode Types

The data for current generation, regardless of whether the data were compared based on cell voltage, cell power, cathode potential evolution versus current density (Figure 2a,b and Figure 3, respectively) or current density production during extended MFC operation (Figure 5), unequivocally distinguished the FeC and AiC cathodes as performing better than the DOC-cathode system.
Notably the relative stability of the cathode electrode potentials of the FeC and AiC cathodes with increased current density (and vice versa), as opposed to the drop exhibited with the DOC cathode (Figure 3) indicated a better performance of the FeC- and AiC-MFC cathodes for electricity production compared to the DOC. The rapid drop, i.e., the four times higher drop of the DOC cathode potential with higher current density, is indicative of the fact that oxygen reduction occurs at a slow rate at the surface of carbon electrodes, including the Pt/C cathode material used here limiting the current production [9,17]. In contrast, the linear rise of the anode electrode potential for the AiC-MFC, +0.22 Ωm2 compared to +0.08 Ωm2 and +0.07 Ωm2 for the DOC-MFC and FeC-MFC systems (Figure 3), is possibly caused by diffusion of oxygen via the membrane into the anode compartment [18], which may hinder the MFC in reaching the full capacity for electricity generation.
The DOC-MFC was thereby limited by high ohmic losses in the cathode chamber while the AiC-MFC was most likely limited by the anodic reaction. However, during extended MFC operation at high substrate loading rate (2 g·COD/L·day) the AiC-MFC produced an average current density of more than 1000 mA/m2 (Period 6), which was almost on par with the FeC-MFC system and five times higher than the DOC-MFC (184 mA/m2) at the same resistance (Table 2 and Figure 5).
Whereas a decrease in external resistance at low-medium COD loading rate increased the current density immediately, and markedly for the FeC and AiC-MFCs, a lowering of the external resistance at high COD loading rate gave significant fluctuations in the current densities (Period 7, Figure 5). The internal resistances of the MFCs, Ωm2, were estimated both via electrical impedance spectroscopy (EIS) and via linear regression of the cell voltage data (Table 1) [16,19]. In accord with the electricity production data obtained, the comparison of the internal resistance data showed that the FeC-MFC and the AiC-MFC gave the lowest internal resistance (except for the AiC-MFC anode data, as already discussed above). Another main finding obtained by EIS was low impedance inferred by use of the AiC cathode, which clearly demonstrated that significant gains in electricity generation are achievable by optimal cathode selection.
In general, the internal resistances in the MFCs were much lower than the recently suggested threshold levels for practical application of internal resistance of 40 mΩ·m2 [20]. However, the current densities of maximum ca. 1000 mA/m2 for the AiC-MFC and approximately 1600 mA/m2 for the FeC-MFC were similar in magnitude to those reported for MFC cathode-studies in the literature [20], and lower than the suggested threshold of 25,000 mA/m2 for industrial use of MFCs [20]. The data are nevertheless conclusive regarding the ranking of the cathodes. Improved current density production may be achieved by optimization of the reactor design. The FeC was, as expected, performing best, but the electron consumption efficiency of the AiC was high enough to present a viable and less toxic cathode reaction type—also considering the input and practical operation cost, the AiC-MFC is competitive, due to the modest materials input and low maintenance requirements.

3.2. Potential for Integration of Microbial Fuel Cell in the Bioethanol Biorefinery

Bioethanol effluent was successfully utilized in the MFCs to produce electricity, which is an important add-on due to increased energy recovery from side streams from bioethanol fermentation of straw [15]. The side stream bioethanol effluent contained 65 g/L COD, 20.5 g/L xylose, 1.8 g/L arabinose, 0.8 g/L glucose, 1.1 g/L lactic acid and 2.5 g/L propionic acid, which have considerable potential for energy generation. All of these compounds can be consumed in the MFC due to the presence of mixed culture of fermenting bacteria [14]. It was shown that MFCs with AiC cathode reactions can utilize bioethanol effluent at a CE up to 49% and average current density up to 1043 mA/m2 using a substrate loading rate of 2 g·COD/L∙day. This current is equivalent to a volumetric production of 57 A/m3 and can make the bioethanol process more attractive. The finding that the AiC cathode set-up efficiently and robustly generated current on the bioethanol effluent provides a good base for integrating MFCs in bioethanol biorefineries for electricity production.

4. Materials and Methods
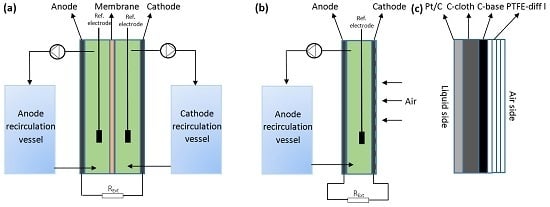
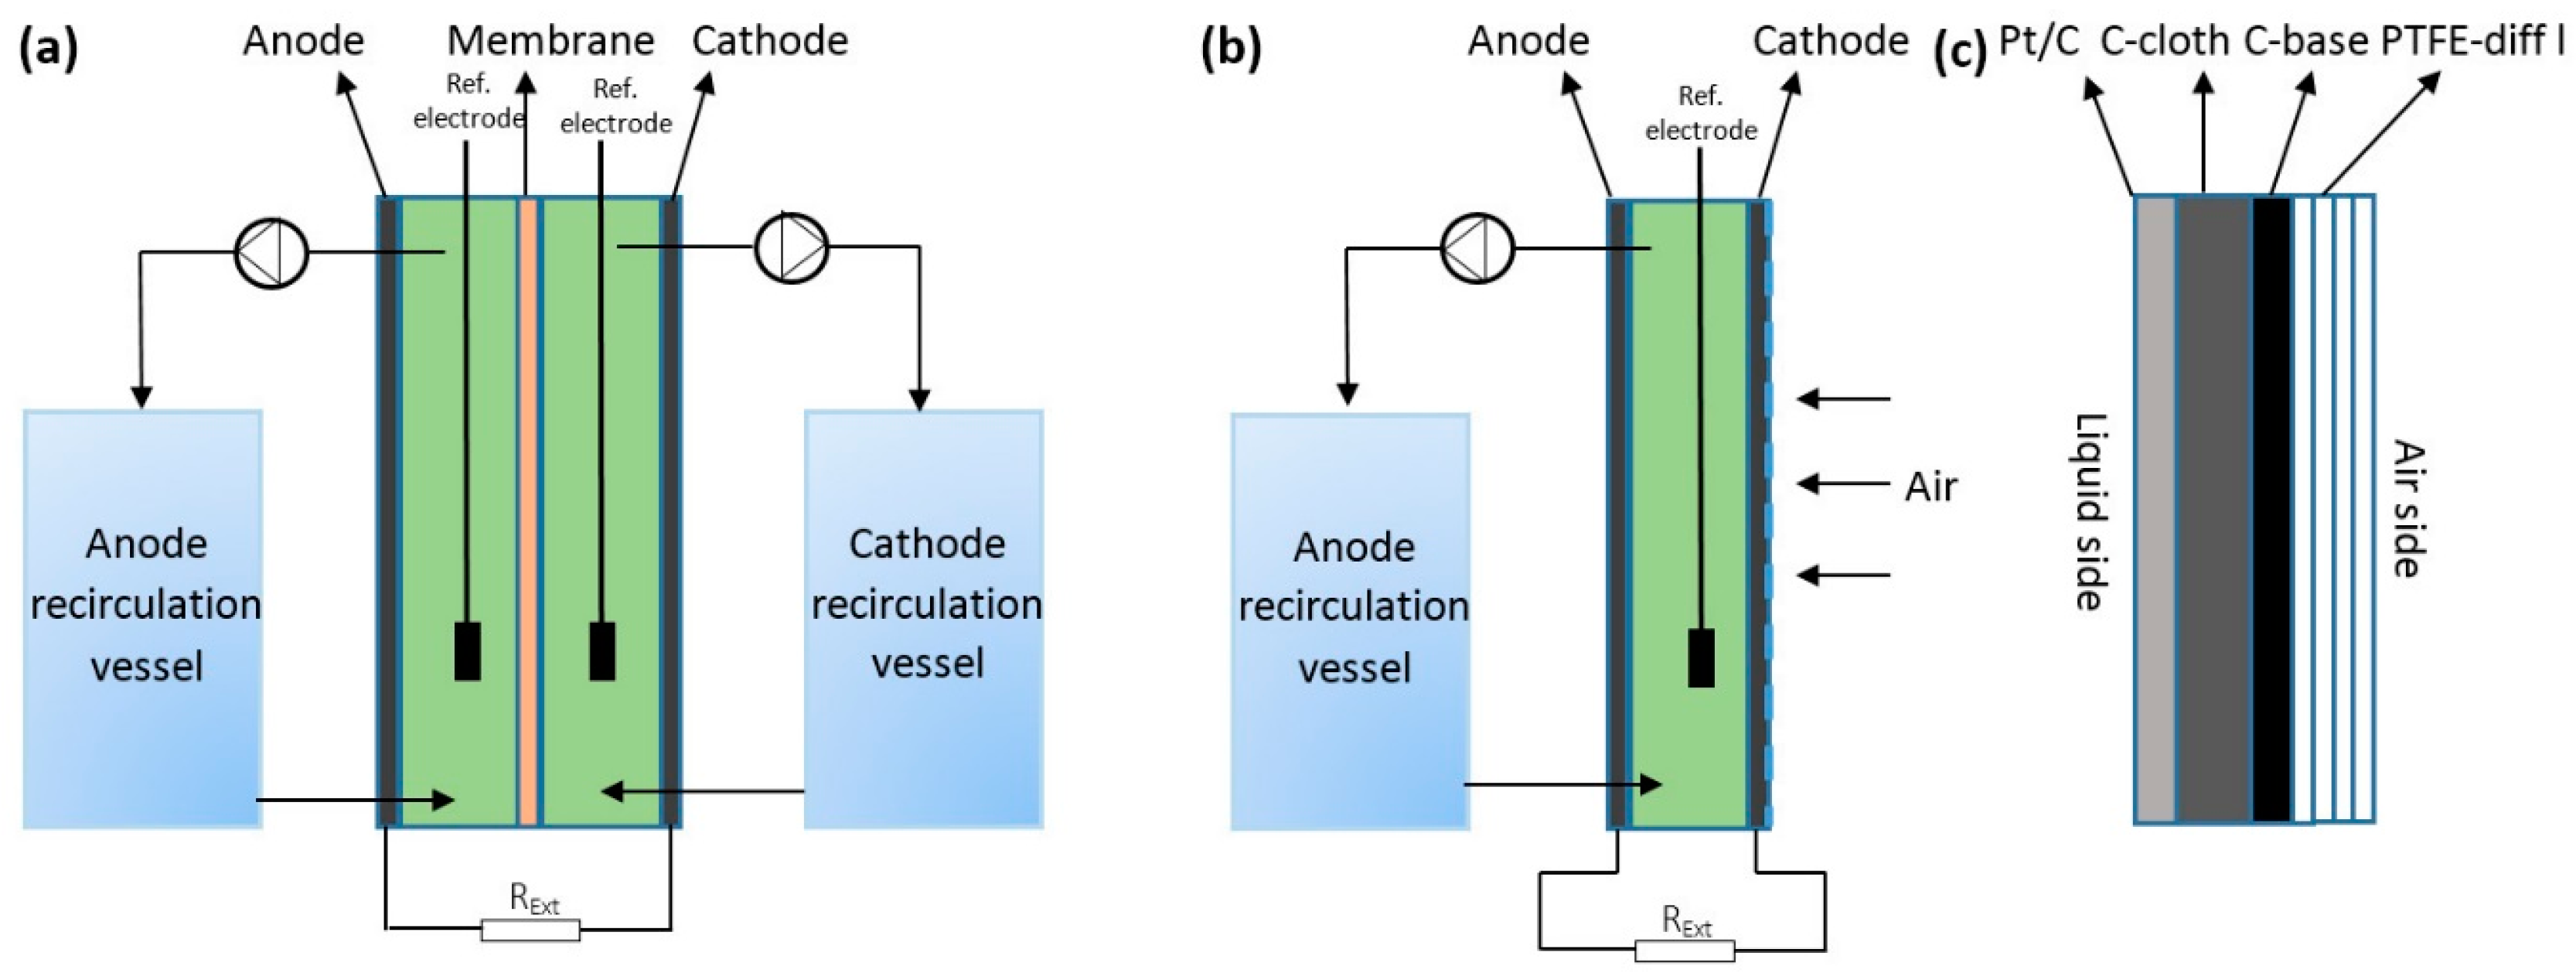
4.1. Reactor Setup

Three MFC reactors including two dual-chamber reactors (FeC-MFC and DOC-MFC) and one single-chamber membrane-less reactor (AiC-MFC) were constructed from Perspex acrylic frame (11 cm × 8 cm × 1.9 cm; volume = 167 mL; Perspex Distribution Ltd., Tamworth, UK) as described by Clauwaert et al. [21]. The schematic drawings of the reactors are shown in Figure 1. FeC- and DOC-MFC consisted of separated anode and cathode compartments. The anode or cathode had a separate recirculation vessel (0.5 L) from which the liquid was pumped through the anode or cathode at a rate of 50 mL/min. The anode and cathode were assembled by stainless steel mesh, 3.18 mm thick carbon felt (#43199, Alfa Aesar, Karlsruhe, Germany) and steal frame for current collection. A proton exchange membrane (Nafion™ N117, Dupont Co., Wilmington, DE, USA) with an area of 88 cm2 was placed between the chambers.
The anode design in the AiC-MFC was similar to the anode designs in the MFCs with FeC and DOC, while the cathode was made of 30% wet-proofed carbon cloth (CCWP3030, Fuel Cell Earth LLC, Woburn, MA, USA) coated with 10% platinized carbon (Pt/C 5 mg/cm2; PTC10-1, Fuel Cell Earth LLC) layer on the solution-facing side and a carbon diffusion layer on the air-facing side (Figure 1b,c). The coating of Pt/C catalyst layer and carbon diffusion layer was prepared as described by Cheng et al. [22]. The carbon base layer was prepared by mixing carbon powder (Vulcan XC-72, Fuel Cell Earth LLC) with 40% polytetrafluoroethylene (PTFE, #430935, Sigma Aldrich, Brøndby, Denmark) solution (12 µL/mg of carbon powder) and air-drying at room temperature for 2 h followed by heating at 370 °C for 30 min. Additional PTFE diffusion layers were made by brushing a 60% PTFE solution onto the coated side, followed by air-drying for 20 min and heating at 370 °C for 15 min. PTFE diffusion layers were coated four times using 4 mg/cm2 of PTFE per coating to obtain optimal thickness [22]. 10% Pt/C catalyst was then applied to the solution-facing side of the carbon cloth with Nafion solution (#527106, Sigma Aldrich) as binder [22].

4.2. Operational Condition and Inoculation

The basic anolyte consisted of M9 medium prepared as described by Rabaey et al. [23]. The carbon source (either sodium acetate or bioethanol effluent) was added to the medium. The cathode solution for DOC-MFC was 10 g/L NaCl solution with continuous air bubbling, while the catholyte for FeC-MFC was 100 mM K3Fe(CN)6 and 100 mM phosphate buffer (pH = 6.7). The cathode solution was replaced at the beginning of each cycle. The MFCs were operated at room temperature (23 ± 2 °C) and inoculated with the effluent of an active acetate-fed MFC [5]. This MFC was originally inoculated with lake sediment collected from Sorø, Denmark (55°25′21′′N, 11°32′23′′E) [5]. The duration of the periods, using varied substrate loading rate and external resistance are outlined in Table 2.

4.3. Preparation of Bioethanol Effluent

Bioethanol effluent was obtained through hydrothermal treatment of 1 kg wheat straw (Triticum aestivum L.) at 190 °C for 10 min on the Mini IBUS pretreatment pilot plant at Department of Chemical and Biochemical Engineering, Technical University of Denmark [24]. The pretreated slurry was separated by filtration into a filter cake and a filtrate. Simultaneous saccharification and fermentation was performed with baker’s yeast (Saccharomyces cerevisiae) [6] on the filter cake suspended in the filtrate to get a dry matter (DM) content of 100 g/L in 200 mL suspension. The pre-hydrolysis was done with the cellulase enzyme preparation Cellic® CTec2 (Novozymes A/S, Bagsværd, Denmark) at a dosage of 15 filter paper units/g DM for 24 h at 50 °C followed by fermentation for 120 h at 32 °C with a yeast dosage of 2 g/L. The obtained liquid was centrifuged at 3000 g for 5 min. The supernatant was vacuum distilled to remove 50% of ethanol rich distillate. The remaining bioethanol effluent contained 65 g/L COD, 20.5 g/L xylose, 1.8 g/L arabinose, 0.8 g/L glucose, 1.1 g/L lactic acid, 2.5 g/L propionic acid and 0.3 g/L formic acid [6].

4.4. Chemical and Electrochemical Analysis

The COD concentration was determined using the chemical kit LCK349 supplied from Hach (Manchester, UK). The anode and cathode electrode potentials were recorded versus a reference electrode with a potential of +197 mV versus the standard hydrogen electrode (Ag/AgCl; #MF2079; Bioanalytical Systems Inc., West Lafayette, IN, USA) every 15 min by a datalogger [6]. In polarization tests, the external resistance was varied between 10 Ω and 50 kΩ. EIS was carried out with a potentiostat (SP-150, Bio-Logic, Grenoble, France) to estimate the ohmic resistance and internal resistance of anode and cathode. EIS was done in the three-electrode mode within the frequency range from 20 kHz to 10 mHz with an alternating current signal amplitude of 10 mV. For the anode impedance, the anode was used as working electrode and the cathode electrode as counter electrode. For determination of the cathode resistance, the electrodes were connected oppositely. The reference electrode was inserted in the compartment containing the working electrode. CE was calculated as the ratio of accumulative charges produced from the MFCs to the charges released from substrate degradation.

5. Conclusions

The comparative study of the electricity production in MFCs equipped with three different cathodes showed that the FeC and AiC cathodes performed better than the DOC-cathode system. The results also verified that it was possible to generate current using bioethanol effluent as the feed in MFCs. Although the FeC cathode performance was superior, the AiC cathode was found to perform satisfactorily, and is proposed as a competitive, non-toxic cathode reaction type for MFC-electricity production on modest COD loading rates of bioethanol effluent sidestreams. The implications of the results are that electricity production can be integrated into bioethanol refineries.

Acknowledgments

The authors are grateful to Danida Fellowship Centre for supporting the research project “Biobased Electricity in Developing Countries”, DFC No. 11–091 Risø. The financial support from China Scholarship Council (CSC) for Guotao Sun’s project is gratefully acknowledged (CSC No. 2011635051). We appreciate the constructive comments from Lise Bomholt Højgaard, DTU and the technical support from Michael Krogsgaard Nielsen.

Author Contributions

All three authors contributed substantially to the work. Guotao Sun and Anders Thygesen designed experiments; Guotao Sun conducted the experiments and data analysis; Anders Thygesen and Anne S. Meyer supervised and interpreted the experimental work; Guotao Sun, Anders Thygesen and Anne S. Meyer wrote the paper.

Conflicts of Interest

The authors declare no conflict of interest.

Abbreviations

AiCAir cathode
CECoulombic efficiency
CODChemical oxygen demand (g)
DOCDissolved oxygen cathode
EanAnode electrode potential (V)
EcaCathode electrode potential (V)
EISElectrochemical impedance spectroscopy
FeCFerricyanide cathode
IaveAverage current density (A/m2)
LsubSubstrate loading rate g·COD/(L·day)
MFCMicrobial fuel cell
PTFEPolytetrafluoroethylene
Pt/CPlatinized carbon
RextExternal resistance (Ω)

References

  1. Logan, B.E.; Hamelers, B.; Rozendal, R.; Schröder, U.; Keller, J.; Freguia, S.; Aelterman, P.; Verstraete, W.; Rabaey, K. Microbial fuel cells: Methodology and technology. Environ. Sci. Technol. 2006, 40, 5181–5192. [Google Scholar] [CrossRef] [PubMed]
  2. Sun, G.; Thygesen, A.; Ale, M.T.; Mensah, M.; Poulsen, F.W.; Meyer, A.S. The significance of the initiation process parameters and reactor design for maximizing the efficiency of microbial fuel cells. Appl. Microbiol. Biotechnol. 2014, 98, 2415–2427. [Google Scholar] [CrossRef] [PubMed]
  3. Lovley, D.R. Electromicrobiology. Annu. Rev. Microbiol. 2012, 66, 391–409. [Google Scholar] [CrossRef] [PubMed]
  4. Xie, X.; Hu, L.; Pasta, M.; Wells, G.F.; Kong, D.S.; Criddle, C.S. Three-dimensional carbon nanotube-textile anode for high-performance microbial fuel cells. Nano Lett. 2011, 11, 291–296. [Google Scholar] [CrossRef] [PubMed]
  5. Sun, G.; Rodrigues, D.S.; Thygesen, A.; Fernando, D.; Meyer, A.S. Inocula selection in microbial fuel cells based on anodic biofilm abundance of Geobacter sulfurreducens. Chin. J. Chem. Eng. 2016, 24, 379–387. [Google Scholar] [CrossRef] [Green Version]
  6. Sun, G.; Thygesen, A.; Meyer, A.S. Acetate is a superior substrate for microbial fuel cell initiation preceding bioethanol effluent utilization. Appl. Microbiol. Biotechnol. 2015, 99, 4905–4915. [Google Scholar] [CrossRef] [PubMed]
  7. He, Z.; Mansfeld, F. Exploring the use of electrochemical impedance spectroscopy (EIS) in microbial fuel cell studies. Energy Environ. Sci. 2009, 2, 215–219. [Google Scholar] [CrossRef]
  8. Clauwaert, P.; Aelterman, P.; Pham, T.H.; de Schamphelaire, L.; Carballa, M.; Rabaey, K.; Verstraete, W. Minimizing losses in bio-electrochemical systems: The road to applications. Appl. Microbiol. Biotechnol. 2008, 79, 901–913. [Google Scholar] [CrossRef] [PubMed]
  9. Rismani-Yazdi, H.; Carver, S.M.; Christy, A.D.; Tuovinen, O.H. Cathodic limitations in microbial fuel cells: An overview. J. Power Sources 2008, 180, 683–694. [Google Scholar] [CrossRef]
  10. Ter Heijne, A.; Schaetzle, O.; Gimenez, S.; Fabregat-Santiago, F.; Bisquert, J.; Strik, D.P.B.T.B.; Barriere, F.; Buisman, C.J.N.; Hamelers, H.V.M. Identifying charge and mass transfer resistances of an oxygen reducing biocathode. Energy Environ. Sci. 2011, 4, 5035–5043. [Google Scholar] [CrossRef] [Green Version]
  11. Dominguez-Benetton, X.; Sevda, S.; Vanbroekhoven, K.; Pant, D. The accurate use of impedance analysis for the study of microbial electrochemical systems. Chem. Soc. Rev. 2012, 41, 7228–7246. [Google Scholar] [CrossRef] [PubMed]
  12. Aelterman, P.; Versichele, M.; Marzorati, M.; Boon, N.; Verstraete, W. Loading rate and external resistance control the electricity generation of microbial fuel cells with different three-dimensional anodes. Bioresour. Technol. 2008, 99, 8895–8902. [Google Scholar] [CrossRef] [PubMed]
  13. Bond, D.R.; Lovley, R. Electricity production by Geobacter sulfurreducens attached to electrodes. Appl. Environ. Microbiol. 2003, 69, 1548–1555. [Google Scholar] [CrossRef] [PubMed]
  14. Thygesen, A.; Poulsen, F.W.; Min, B.; Angelidaki, I.; Thomsen, A.B. The effect of different substrates and humic acid on power generation in microbial fuel cell operation. Bioresour. Technol. 2009, 100, 1186–1191. [Google Scholar] [CrossRef] [PubMed]
  15. Thygesen, A.; Possemiers, S.; Thomsen, A.B.; Verstraete, W. Integration of microbial electrolysis cells (MECs) in the biorefinery for production of ethanol, H2 and phenolics. Waste Biomass Valoriz. 2010, 1, 9–20. [Google Scholar] [CrossRef]
  16. Liang, P.; Huang, X.; Fan, M.Z.; Cao, X.X.; Wang, C. Composition and distribution of internal resistance in three types of microbial fuel cells. Appl. Microbiol. Biotechnol. 2007, 77, 551–558. [Google Scholar] [CrossRef] [PubMed]
  17. Gil, G.C.; Chang, I.S.; Kim, B.H.; Kim, M.; Jang, J.K.; Park, H.S.; Kim, H.J. Operational parameters affecting the performance of a mediator-less microbial fuel cell. Biosens. Bioelectron. 2003, 18, 327–334. [Google Scholar] [CrossRef]
  18. Leong, J.X.; Daud, W.R.W.; Ghasemi, M.; Liew, K.B.; Ismail, M. Ion exchange membranes as separators in microbial fuel cells for bioenergy conversion: A comprehensive review. Renew. Sustain. Energy Rev. 2013, 28, 575–587. [Google Scholar] [CrossRef]
  19. Manohar, A.K.; Bretschger, O.; Nealson, K.H.; Mansfeld, F. The use of electrochemical impedance spectroscopy (EIS) in the evaluation of the electrochemical properties of a microbial fuel cell. Bioelectrochemistry 2008, 72, 149–154. [Google Scholar] [CrossRef] [PubMed]
  20. Sleutels, T.H.J.A.; Heijne, A.T.; Buisman, C.J.N.; Hamelers, H.V.M. Bioelectrochemical systems: An outlook for practical applications. Chem. Sustain Chem. 2012, 5, 1012–1019. [Google Scholar] [CrossRef] [PubMed]
  21. Clauwaert, P.; Verstraete, W. Methanogenesis in membraneless microbial electrolysis cells. Appl. Microbiol. Biotechnol. 2009, 82, 829–836. [Google Scholar] [CrossRef] [PubMed]
  22. Cheng, S.; Liu, H.; Logan, B.E. Increased performance of single-chamber microbial fuel cells using an improved cathode structure. Electrochem. Commun. 2006, 8, 489–494. [Google Scholar] [CrossRef]
  23. Rabaey, K.; Ossieur, W.; Verhaege, M.; Verstraete, W. Continuous microbial fuel cells convert carbohydrates to electricity. Water Sci. Technol. 2005, 52, 515–523. [Google Scholar] [PubMed]
  24. Ambye-Jensen, M.; Thomsen, S.T.; Kádár, Z.; Meyer, A.S. Ensiling of wheat straw decreases the required temperature in hydrothermal pretreatment. Biotechnol. Biofuels 2013, 6. [Google Scholar] [CrossRef] [PubMed] [Green Version]
Figure 1. (a) Schematic diagram of the dual-chamber microbial fuel cell (MFC) reactor used with the ferricyanide cathode (FeC) and dissolved oxygen cathode (DOC); (b) single-chamber MFC reactor using an air cathode (AiC) electrode in a sandwich construction with the membrane; (c) composition of the AiC containing platinized carbon (Pt/C) coated carbon cloth (C-cloth), one carbon base layer (C-base) and four polytetrafluoroethylene diffusion layers (PTFE-diff l) facing the air side. The circuit diagrams are indicated with external resistance (RExt).
Energies 09 00388 g001
Figure 2. (a) Cell voltage and (b) power density plotted as a function of current density in the MFCs with DOC, FeC and AiC cathodes. In (a), slope = −(Internal resistance Ωm2).
Energies 09 00388 g002
Figure 3. Electrode potential curves vs. Ag/AgCl reference electrodes in the three types of MFC cathodes: (a) DOC; (b) FeC and (c) AiC. Anode and cathode potentials are plotted vs. current density. The slopes α equals the individual electrode resistances in Ωm2.
Energies 09 00388 g003
Figure 4. Electrochemical impedance spectroscopy (EIS) spectrum of the (a) cathode and (b) anode as the normalized imaginary impedance (Z”) vs. the normalized real impedance (Z’). The inserted plots show the data at low Z’ used for estimation of the ohmic resistance.
Energies 09 00388 g004
Figure 5. Continuous MFC processes experiment: (a) external resistance ( –––– , left Y-axis) and chemical oxygen demand load ( - - - - , right axis) applied during the 7 periods for the total 26 days of experiment; (b) current density responses recorded for the MFCs with different cathode types: DOC, FeC and AiC, during the 26 days of experiment.
Energies 09 00388 g005
Table 1. Ohmic resistance obtained from the EIS spectra of the three cathode types: DOC, FeC and AiC in Figure 3. Data are compared with internal resistance estimated by linear regression using Figure 2a and Figure 3.
Cathode TypeDOC-MFCFeC-MFCAiC-MFC
PartAnodeCathodeCellAnodeCathodeCellAnodeCathodeCell
UnitΩm2Ωm2Ωm2Ωm2Ωm2Ωm2Ωm2Ωm2Ωm2
Ohmic resistance0.020.05 0.070.04 0.070.02
Internal resistance0.080.430.460.070.110.180.220.100.32
Table 2. Operational parameters including substrate loading rate (Lsub), external resistance (Rext), anode electrode potential (Ean), cathode electrode potential (Eca) and coulombic efficiency (CE) for the three cathode types vs. period number. The potential is reported vs. Ag/AgCl reference electrodes. Acetate was used in Period 1 and bioethanol effluent in Periods 2–7.
ParametersDOC-MFCFeC-MFCAiC-MFC
PeriodTimeLsubRextEanEcaIaveCEEanEcaIaveCEEanEcaIaveCE
UnitDayg·COD/L/dmVmVmA/m2%mVmVmA/m2%mVmVmA/m2%
1110.5150−470−29014218−44014044441−37015040325
230.5150−470−2901467−42015045722−34016039718
321.0150−470−2901456−42016044516−44015043813
421.075−470−34017315−39014069136−43010068433
521.047−460−39018619−360160111462−3705092049
642.047−460−3901845−390140127930−40050104323
722.027−420−3901844−340140164028−5010080212

