Article

New Electro-Thermal Battery Pack Model of an Electric Vehicle

1
Institute of Vehicle System Technology, Karlsruhe Institute of Technology, Karlsruhe 76131, Germany
2
Institute of Data Processing and Electronics, Eggenstein-Leopoldshafen 76344, Germany
*
Author to whom correspondence should be addressed.
Energies 2016, 9(7), 563; https://doi.org/10.3390/en9070563
Submission received: 30 May 2016 / Revised: 4 July 2016 / Accepted: 12 July 2016 / Published: 20 July 2016

Abstract

:
Since the evolution of the electric and hybrid vehicle, the analysis of batteries’ characteristics and influence on driving range has become essential. This fact advocates the necessity of accurate simulation modeling for batteries. Different models for the Li-ion battery cell are reviewed in this paper and a group of the highly dynamic models is selected for comparison. A new open circuit voltage (OCV) model is proposed. The new model can simulate the OCV curves of lithium iron magnesium phosphate (LiFeMgPO4) battery type at different temperatures. It also considers both charging and discharging cases. The most remarkable features from different models, in addition to the proposed OCV model, are integrated in a single hybrid electrical model. A lumped thermal model is implemented to simulate the temperature development in the battery cell. The synthesized electro-thermal battery cell model is extended to model a battery pack of an actual electric vehicle. Experimental tests on the battery, as well as drive tests on the vehicle are performed. The proposed model demonstrates a higher modeling accuracy, for the battery pack voltage, than the constituent models under extreme maneuver drive tests.

Graphical Abstract

1. Introduction

The global climate change, escalation in fuel cost, and the energy consumption, urged the necessity to replace the fossil fuel with renewable and environment friendly energy sources. Battery electric vehicles (BEV) are one major application, demonstrating the replacement of fossil fuel by renewable energy. Li-ion batteries have become the preferable energy storage for the future electric vehicles [1]. They receive greater attention than other battery types, such as lead-acid and nickel-cadmium batteries, due to their practical physical characteristics. They have a high specific energy, specific power, power density and a long life cycle. Moreover, their self-discharge rate is lower compared to other types of batteries [1,2,3].
Figure 1 demonstrates a typical discharge characteristic curve of a lithium-ion battery. The battery voltage extends between an upper and lower voltage limits Vfull and Vcut-off, respectively. Vcut-off represents the empty state of the battery where the minimum allowable voltage is reached. This restriction is meant to protect the battery from deep depletion. The section formed between Vfull, Vexp and the correspondences capacity rates (C-rate) 0 and Qexp is identified as the exponential region of the discharge characteristic curve, at which the discharged voltage changes exponentially regarding to the battery capacity. The voltage holds an approximately steady value for C-rates beyond Qexp up to the nominal C-rate Qnom, where the nominal Vnom voltage is reached. Not only is the battery voltage influenced by the discharge rate, but the battery capacity is also diminished at high discharge rates. This occurs as a sharp voltage drop at the end of the discharge process, as indicated in Figure 1. At that rate the discharge terminates at Vcut-off [4].
The vehicle under test (VUT) is equipped with battery cells of a cathode type LiFeMgPO4. Lithium iron phosphate cells are characterized by their flat open circuit voltage curve (OCV). Hence, the cell voltage stays almost constant over the complete state of charge (SOC) range [2,3,6]. The battery pack of the VUT consists of 19 modules. Each module comprises six cell blocks connected in series; a single cell block is constructed out of 50 LiFeMgPO4–graphite cells, connected in parallel. In total, there are 300 cells within the single battery module. Each cell block has a nominal voltage of 3.2 V, amounting to a total voltage of 19.2 V. The battery specifications are given in Table 1. A Controller Area Network (CAN) communication environment is used for the control and management of the battery modules. More technical information about the VUT is available in the Appendix.
In this paper, we will investigate the different battery modeling methods to decide which approach will be the most appropriate for modeling the battery pack of VUT. Then, we will select a group of the most thorough models for Li-ion batteries. These models will contribute to the development of the proposed battery model, which will be considered for modeling actual battery pack voltage response when the VUT undergoes severe driving maneuvers.
The paper is organized as follows. Section 2 presents the different modeling techniques of Li-ion batteries. Three models are elected from the reviewed models and are discussed in more details in Section 3. In Section 4 the thermal behavior of the battery is elaborated. The experimental tests are described in Section 5. The models are evaluated and a new, improved model is developed and proposed in Section 6. Finally, the conclusions are stated at the end of the paper.

2. Existing Battery Models

Different modeling approaches are found in the literature. The most prominent battery modeling techniques are: Electrochemical, analytical, and circuit-based models [8]. Electrochemical models employ non-linear differential equations to model the chemical and electrical behavior of the cell [4,9]. Detailed knowledge of the battery chemistry, material structure and other physical characteristics are essential to achieve high accuracy and cover a large number of different operating points. However, the producers of batteries will rarely reveal the full parameters set of their products. Another shortcoming of electrochemical models is the high computational effort required to solve the non-linear partial differential equations [8]. Electrochemical models are better suited for research in battery’s components fabrication, like electrodes and electrolyte [4,10]. The analytical modeling, on the other hand, reduces the computational complexity for the battery. However, that would be on the expense of capturing the circuit physical features of the battery, such as open circuit voltage, output voltage, internal resistance, and transient response [8].
Lumped electrical circuit models offer low complexity combined with high accuracy and robustness in simulating batteries dynamics [11,12,13]. Models with single or double resistor-capacitor (RC) networks are the best candidates for simulating the battery module [12,13,14]. RC parameters employed to model the battery characteristic show a dependency on temperature, charge/discharge rates and the SOC. Several techniques had been discussed in literature [1,15,16,17,18,19] for SOC estimation. Lam and Bauer [20] proposed a circuit model for the Li-ion battery with variable open circuit voltages, resistances and capacitances. The equivalent circuit components were represented as empirical functions of the current direction, the SOC, the battery temperature and the C-rate. Tremblay et al. [5,21] proposed an improved version Shepherd’s model [22]. This model considers the influence of SOC on the OCV by considering the polarization voltage in the discharge-charge model. Different dynamic models for Li-ion, lead-acid, NiMH and NiCd battery typed were presented in Reference [5]. However, neither the temperature effect nor the variation of the internal resistance were considered. Saw et al. [23] investigated the thermal behavior for a LiFePO4–graphite battery by coupling the empirical equations of the modified Shephard’s battery model with a lumped thermal model for the battery cell. The temperature development of a complete vehicle battery pack under different driving cycles was simulated in [23]. Tan et al. [24] have incorporated the thermal losses to Shephard’s model for Li-ion battery cells by adding temperature dependent correction terms to the model. Wijewardana et al. [1] proposed a generic electro-thermal model for Li-ion batteries. The model considers potential correction terms accounting for electrode film formation and electrolyte electron transfer chemistry. In addition, the constant values in the empirical equations that represent the equivalent circuit components of the battery were adjusted. These equations were employed to model the electrical components in dependence of SOC and temperature. Wijewardana et al. consider the C-rate effect in the estimation of SOC by employing an extended Kalman filter technique. Computational thermal models and temperature distribution estimations were proposed in References [25,26,27,28]. Additionally, finite element analysis models to estimate the temperature distribution in the battery were presented in References [25,27,28,29]. This kind of simulation requires knowledge of thermal properties of the battery cell materials, such as thermal capacity, density, mechanical construction and cooling of the battery. For an accurate parameterization intensive and precise measurements are necessary.

3. Overview of Selected Dynamic Battery Models

The equivalent circuit battery model provides a generic, dynamic way of modeling Li-ion batteries with moderate complexity. The moderate model complexity supports the integration of the model in a multiphysical simulation, allowing to analyze dynamic effects of the electric drive train. Three models are selected from the literature as the best candidates for Li-ion battery modeling, since they are the most thorough among the reviewed models. These models are:
  • Tremblay et al. [5] (battery model 1)
  • Lam and Bauer [20] (battery model 2)
  • Wijewardana et al. [1] (battery model 3)

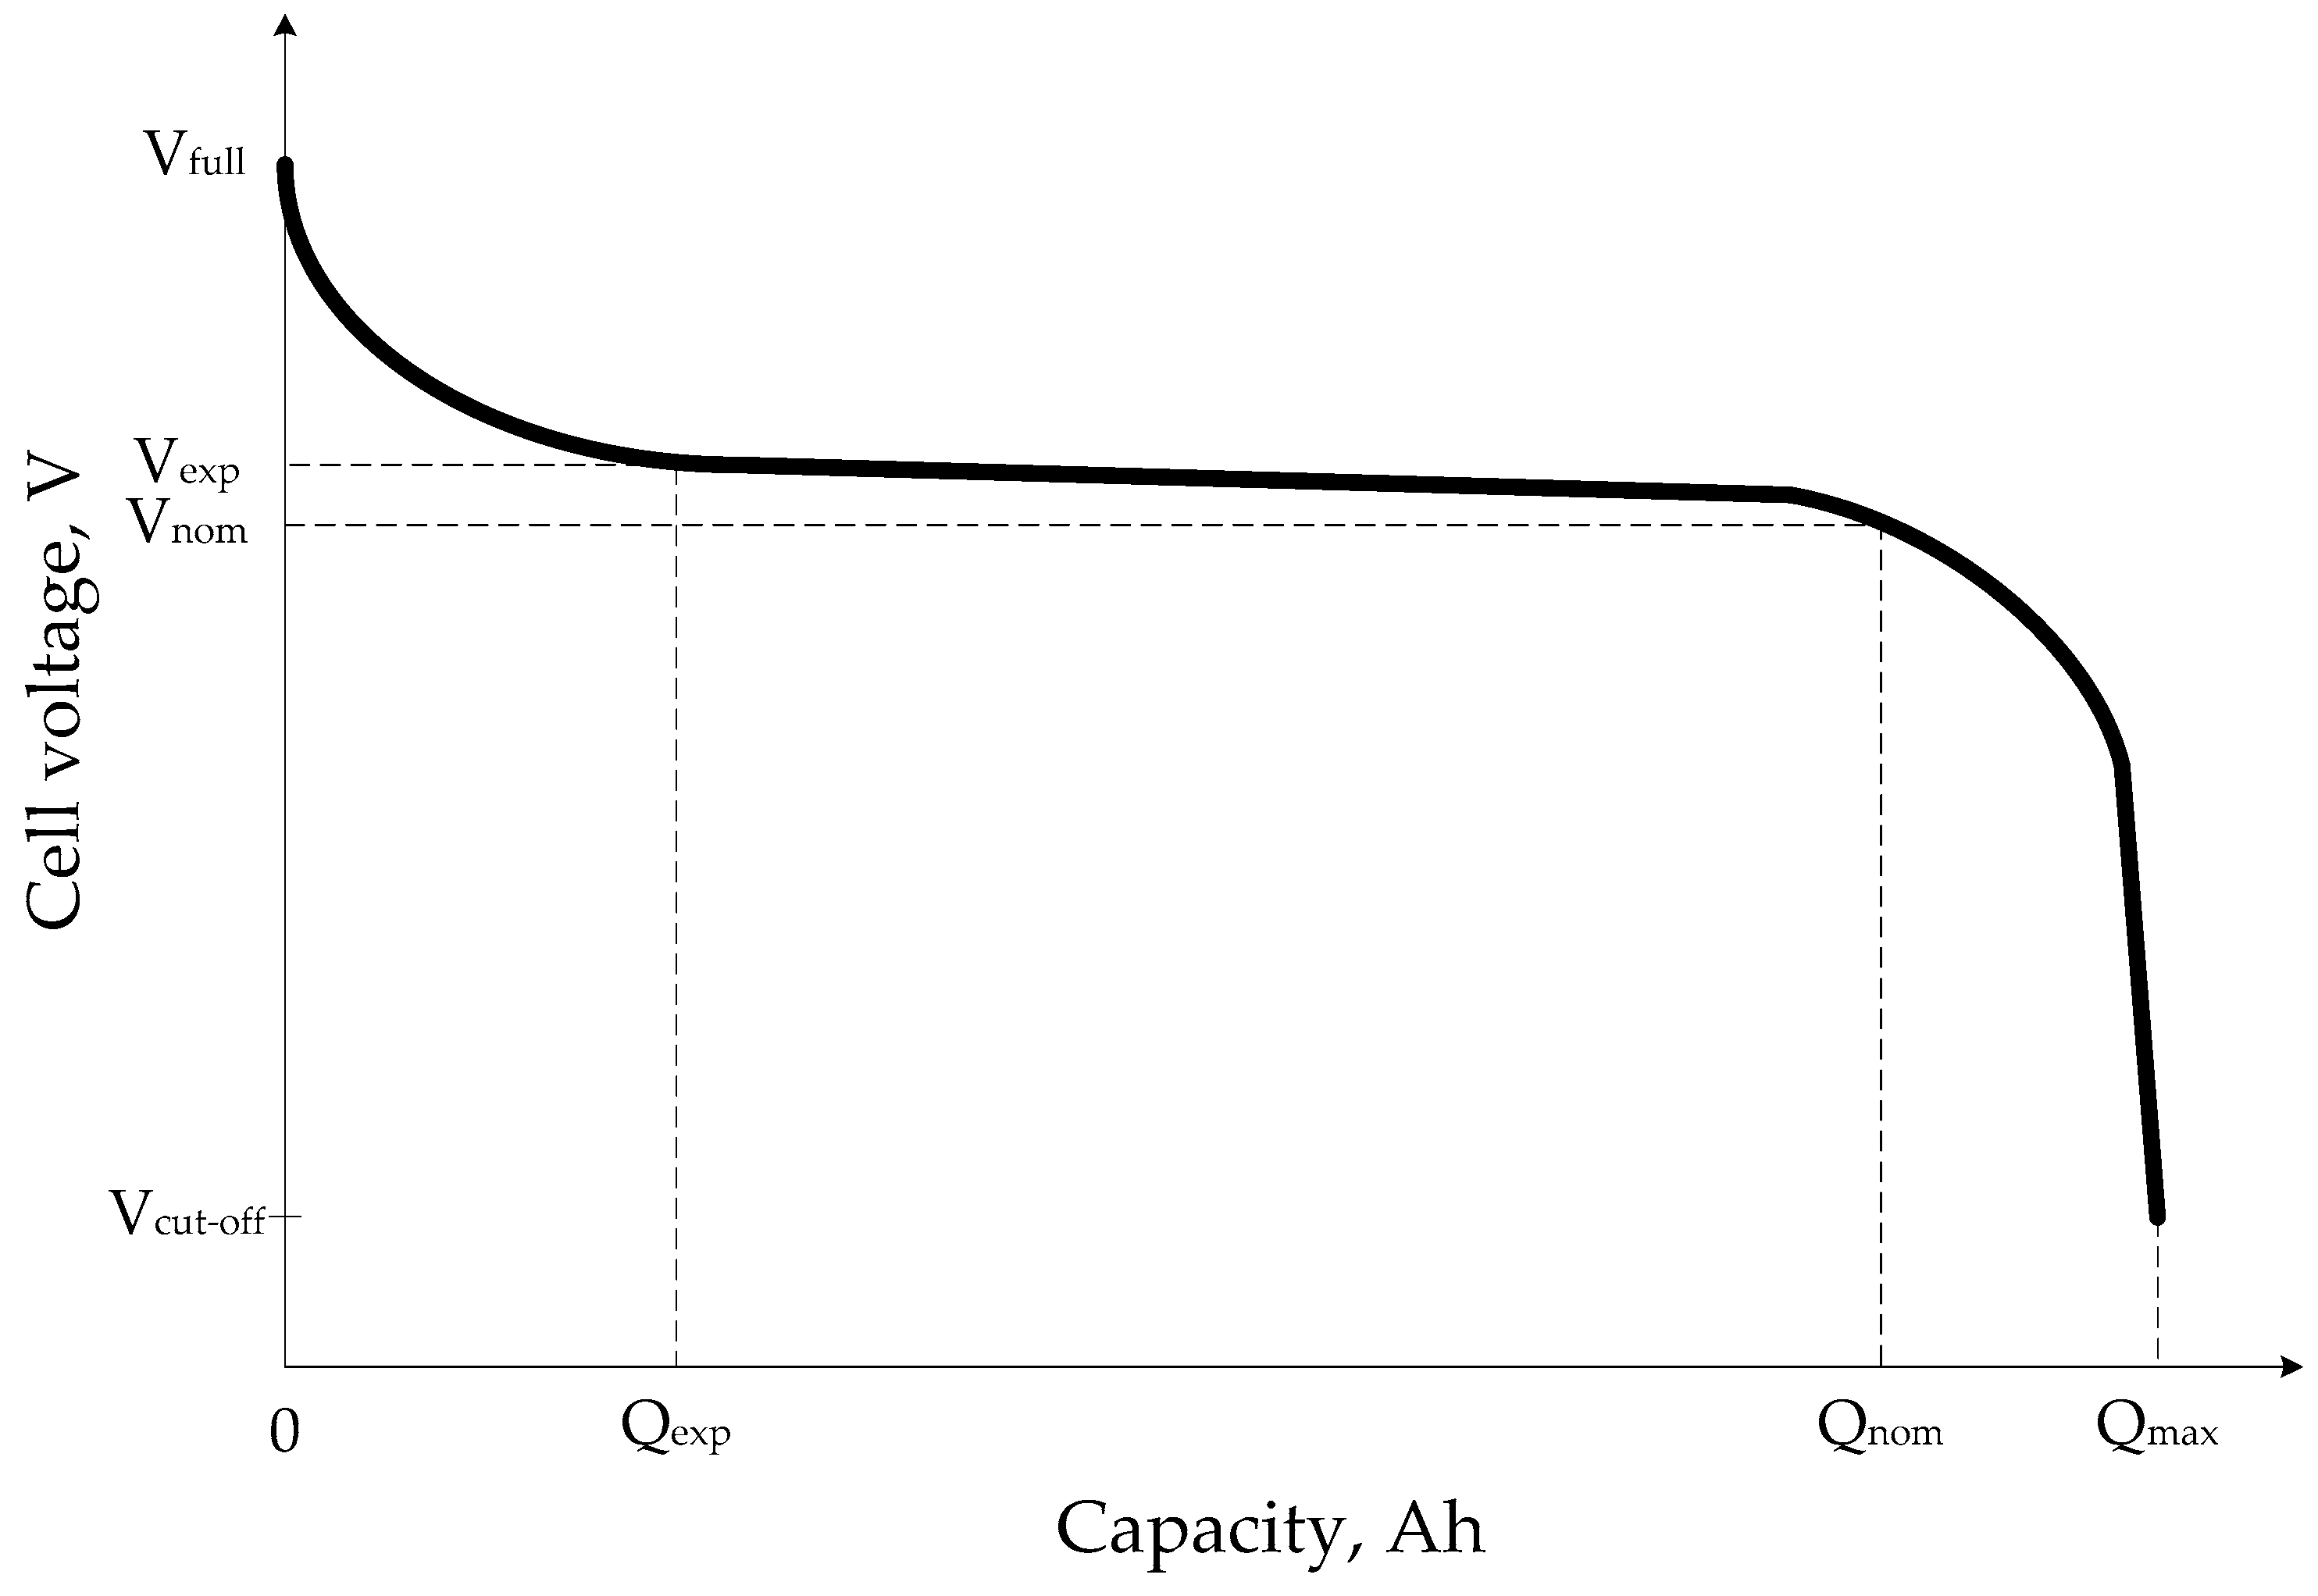
3.1. Tremblay Battery Model (Battery Model 1)

Tremblay and Dessaint [5] improved their own model in Reference [21]. The new model is shown in Figure 2. Only three points on the steady state manufacturer’s discharge curve are required to parametrize the model, which are the full voltage, the end point of exponential voltage region, and the nominal voltage. The variation of the OCV from a reference constant voltage (E0) is related to SOC changes by incorporating a polarization constant (K).
In case of discharging the output voltage reads:
V b a t t = E 0 R    i K Q Q i t    ( i t + i * ) + A e B    i t
and for charging, the equation becomes:
V b a t t = E 0 R    i K Q i t 0.1 Q    i * K Q Q i t    i t + A e B    i t
the variables and constants in Equations (1) and (2) are defined in Table A1 in the Appendix A.1.
Although, the charging and discharging characteristics are extensively modeled, some other influential factors like the variations in internal resistance (R) and temperature influence are not considered. The capacity fading effect is not taken into account in this model as well.

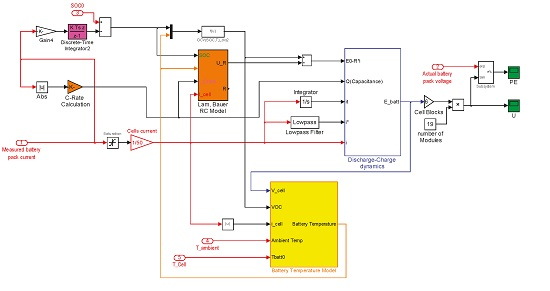
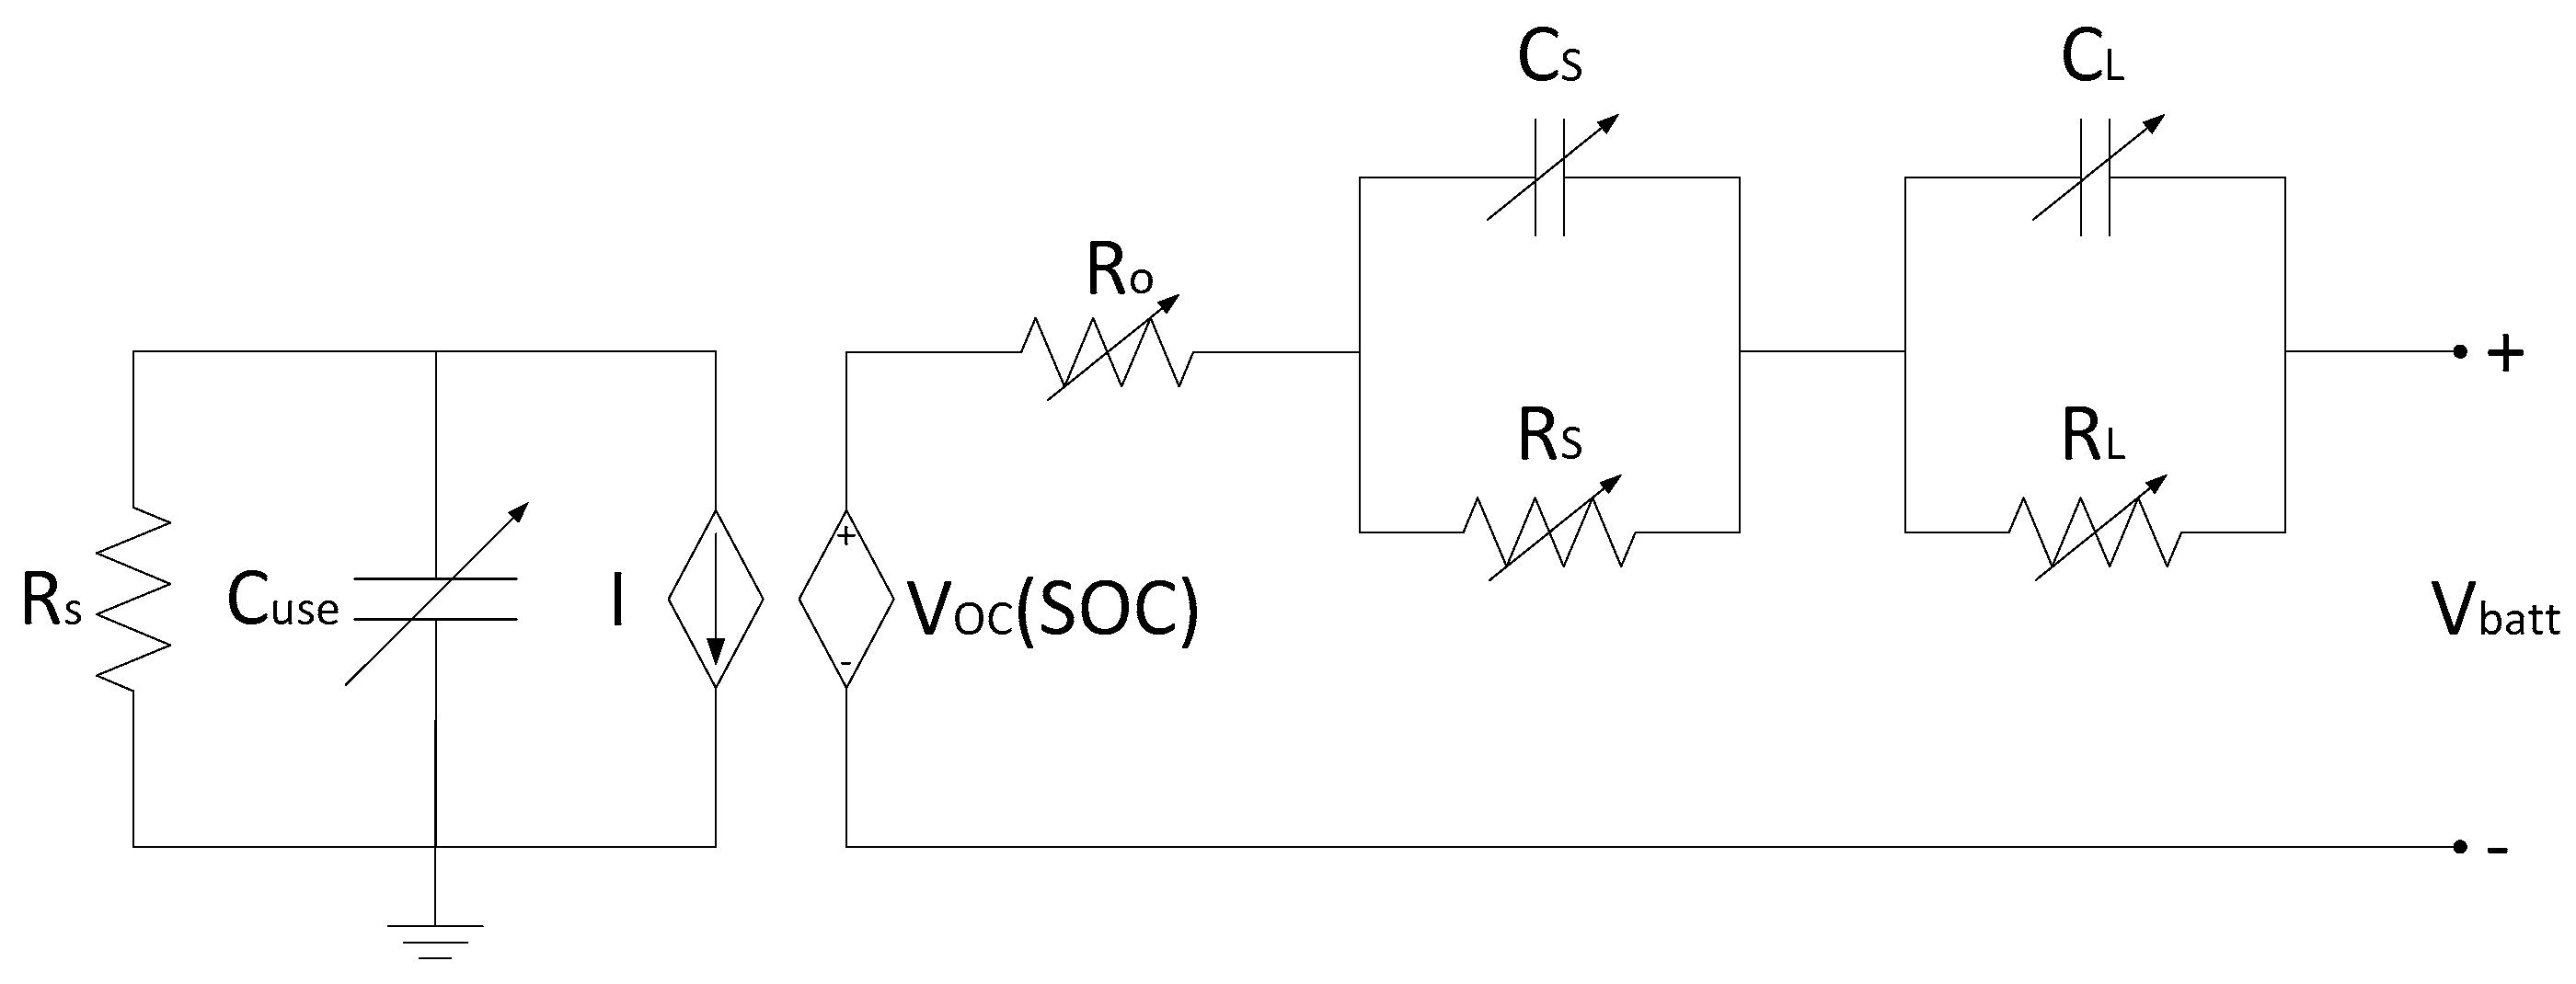
3.2. Lam and Bauer Battery Model (Battery Model 2)

The Lam and Bauer battery equivalent circuit model is shown in Figure 3. The model demonstrates the VOC as a function of SOC, a variable ohmic resistance Ro, and two variable RC-networks: RSCS and RlCl for the short and the long time transient responses, respectively. Lam and Bauer also showed the relation between capacity fading due to aging and different stress influences, which are the cell’s temperature, C-rate, SOC and intensity of discharge. Lam and Bauer parametrized their equations through curve fitting of experimental measurements. They employed in their tests the LiFePO4 battery cell. The equivalent circuit resistors and capacitors equations for temperatures from 20 °C and above are detailed in Equations (7)–(28) in Reference [20]. We refer also to the VOC equation with the corrected constants as proposed in Reference [20]:
V OC ( SOC ) = 0.5863   e 21.9   SOC + 3.414 + 0.1102   SOC 0.1718   e 8 × 10 3 1 SOC

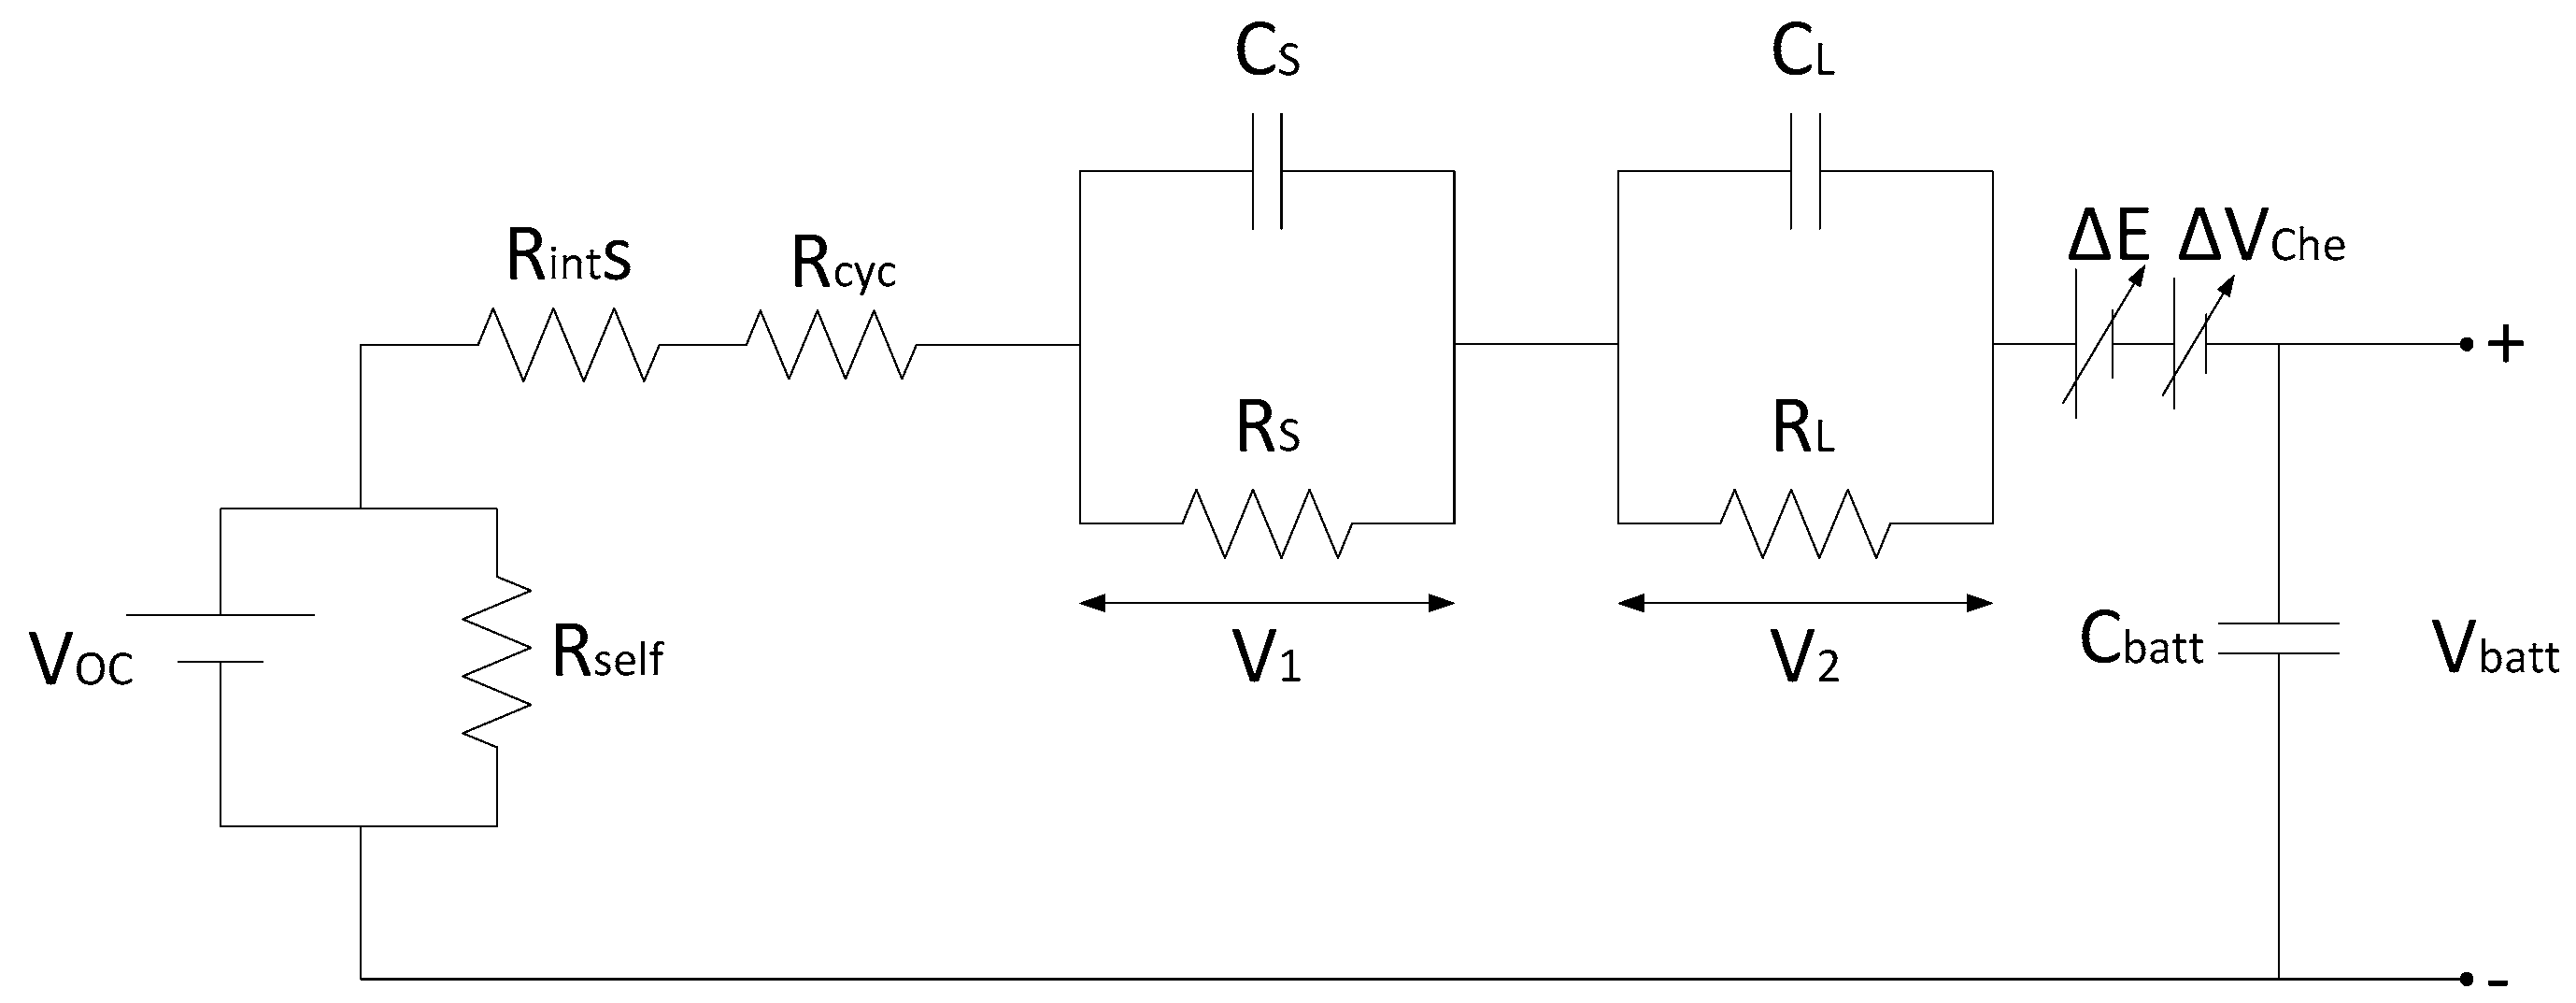
3.3. Wijewardana Battery Model

A different perception, than the two previous models, is adopted in this model. The electrical components, RS, CS, RL, CL are functions of SOC and independent of the temperature. Only the series internal resistance resistor is a function of SOC and temperature (RintS(SOC,T)). The temperature influence is considered by adding potential correction terms, which are voltage due to electrode film formation (ΔE) and voltage due to electrolyte electrons transfer formation (ΔVChe). The capacity fading effect is modeled as an additional series resistance Rcyc. The battery output voltage is computed by subtracting the voltage drop of each circuit element from the VOC value. Figure 4 demonstrates Wijewardana battery model.
The battery output voltage of this model reads [1]:
V batt = V OC i ( R intS + R cyc ) V 1 V 2 E ( T ) V Che ( T )
E ( T ) = ( 1 + C E 1 T ) d V r d T | T = T cell T
V Che ( T ) = β w   e x p ( 1 / t ) T + d V Che d T | T = T cell ( C Che + C Che 1 T ) ( 1 + β ) T
The values of the model parameters are listed in the Appendix.

3.4. Assessment of Battery Models Qualities

Three different highly dynamic to model Li-ion batteries have been proposed. Each model has its dominant features. Table 2 summaries the qualities of each model. The (+) sign implies that the corresponded feature is considered in the model. Whereas, a (++) sign denotes an extensive consideration to the related feature. In contrast, the (-) sign means that the related feature was assigned as a constant or it is not considered at all in the model. Battery model 2 considers more factors than the other models. However, each model must be evaluated with experimental data to investigate its accuracy.

4. Battery Thermal Model

A general energy balance is applied to estimate the battery cell temperature. It is assumed that the thermal distribution inside the cell is uniform and that the conduction resistance inside the battery cell is negligible compared with the convection and radiation heat transfer [1,23,27,28]. The change in temperature depends significantly on the battery thermal capacity (Cp) and the difference between the generated heat and the dissipated heat. The dissipation of the heat to the battery surrounding is performed by convection and radiation. Generated heat comprises two sources, irreversible heat generation by means of the effective ohmic resistance of the cell’s material, and reversible generated heat due to the entropy change in both cathode and anode. The total entropy changes in the battery cell can be considered as zero according to References [1,29,30]. The temperature development inside the battery cell is described as:
m C p d T cell d t = i ( V OC V batt ) h A cell T ϵ σ A cell ( T cell 4 T amp 4 )
where ΔT is the difference between the battery cell and the ambient temperatures (TcellTamp), h is the natural convection coefficient, m is the cell mass, i is the cell current, Acell is the surface area of the single battery cell, σ is Stefan-Boltzmann constant, and ε is the emissivity of heat. Assuming that the temperature differences between the cells in the single battery module are small, Equation (7a) can be generalized for the whole battery module as:
M C p d T cell d t = I ( V OC V batt ) h A T ϵ σ A ( T cell 4 T amp 4 )
where M is the total cells mass, I is the battery current, A is the surface area of the cells blocks in the single battery module.
Saw et al. [23] has pointed out to the contribution of the contact resistance in heat generation. The contact resistance can be neglected in the investigated batteries, since the cells are realizing low ohmic over wide cell connectors by means of welded connections. Fifty individual cells are connected in parallel and we have a nominal current about 1.4 A per cell. The resistance of the single contact is 0.2 mΩ. With four welding points per cell connectors, the contact resistance for the single battery cell became 50 μΩ. The power loss in the single cell due to contact resistance is determined as: Ploss = Icell2Rcontact = 0.098 mW/cell, which is a negligible amount, thermally, as well as electrically.

5. Experimental Characterization of the Battery and the Vehicle under the Test

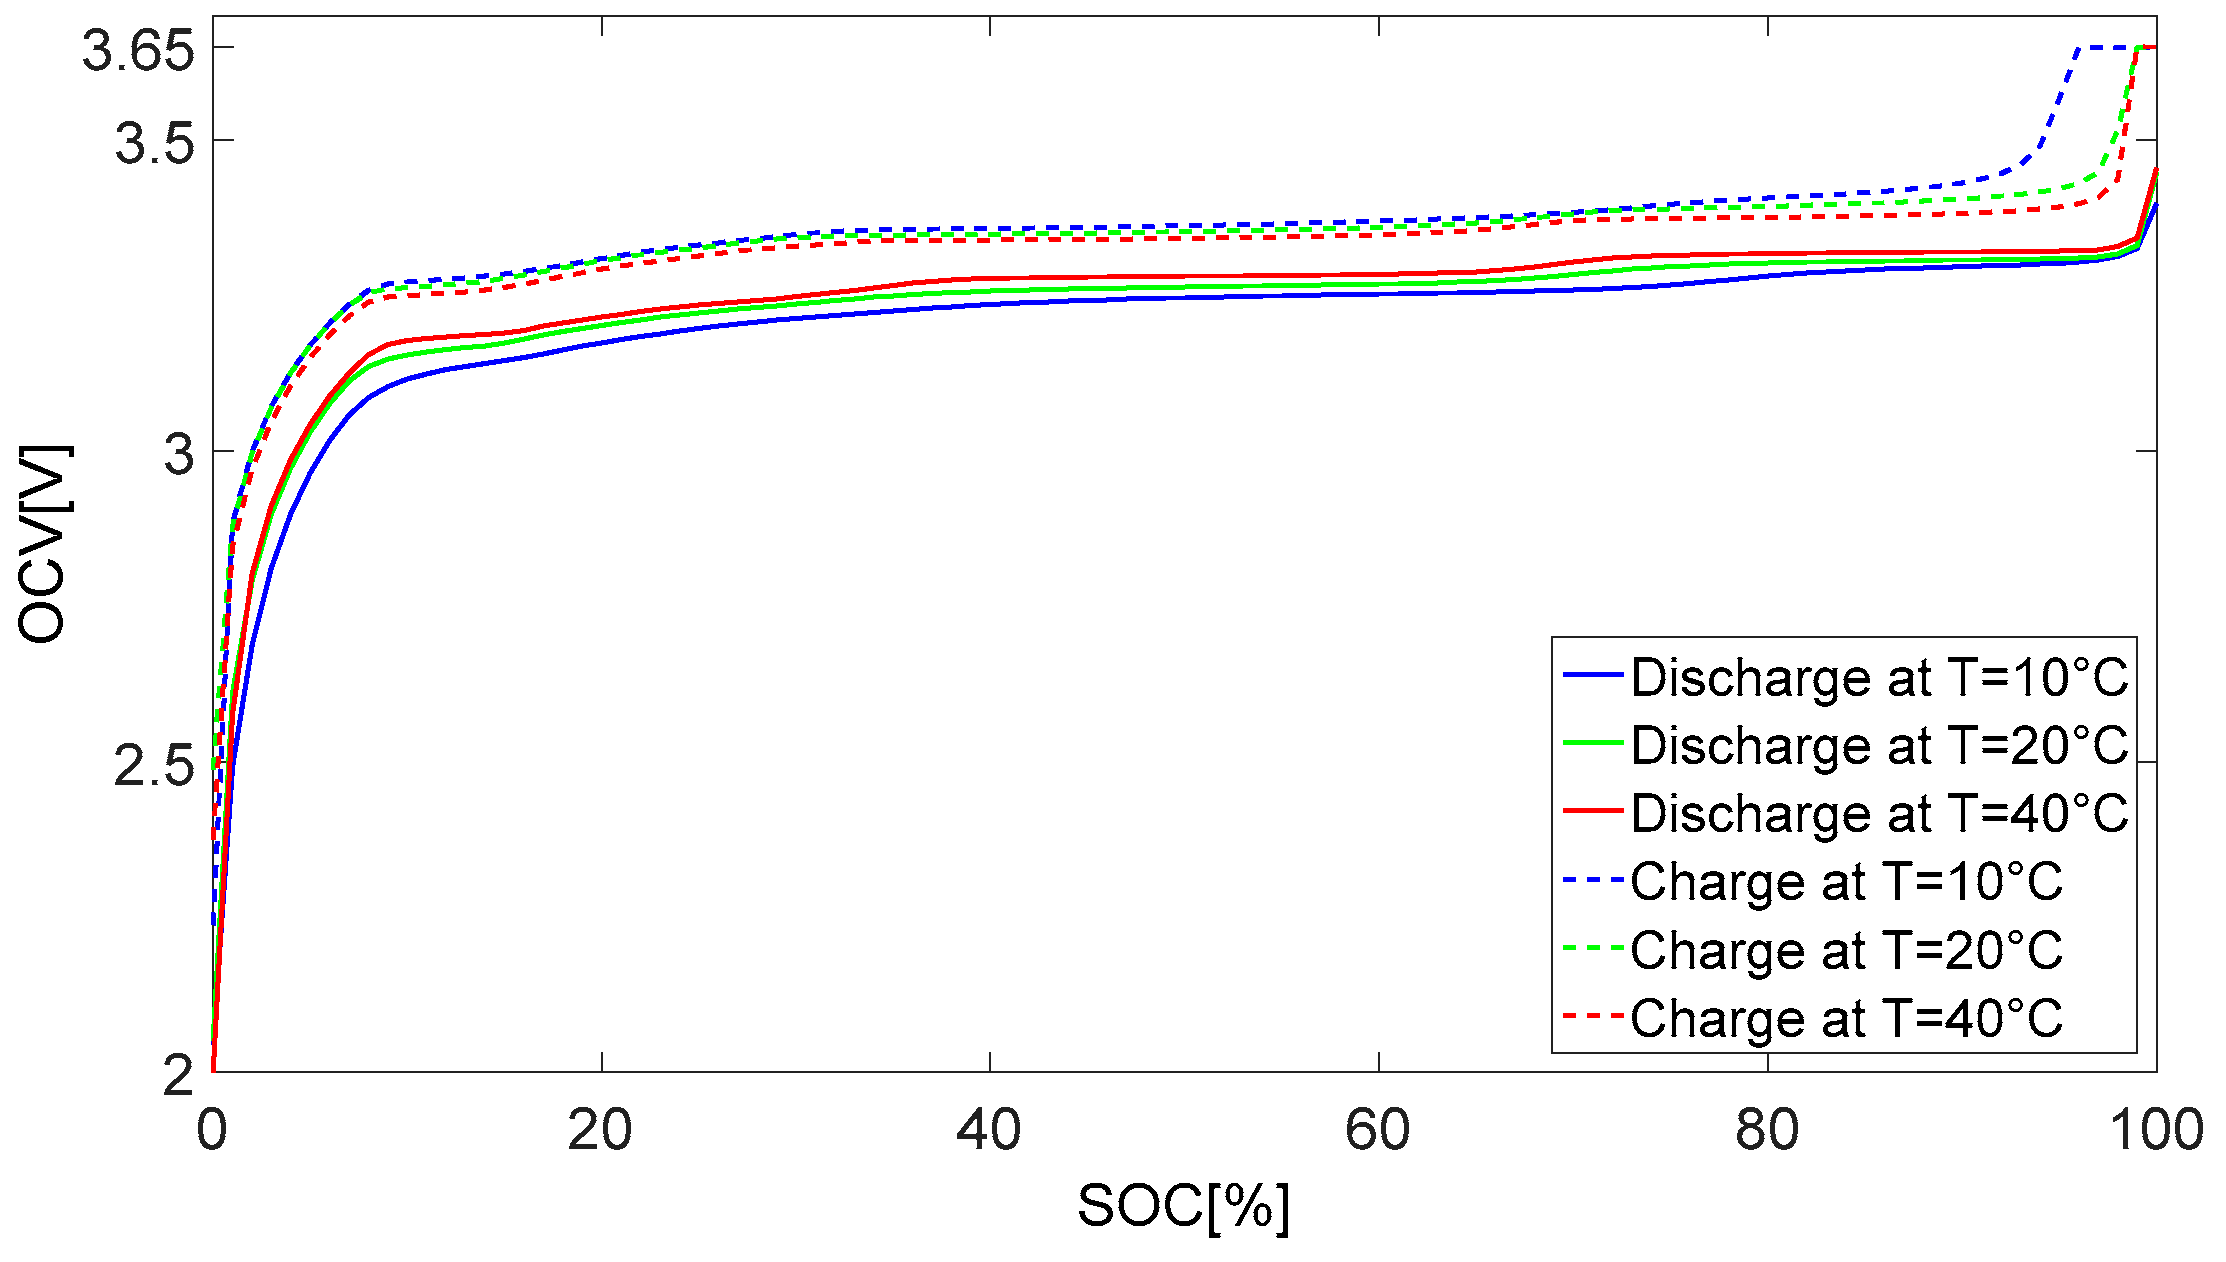
5.1. Battery Measurements

In order to characterize the LiFeMgPO4-battery, several experimental tests were implemented on the battery at different conditions. OCV vs. SOC measurements were performed at 10, 20 and 40 °C. The battery was discharged until the cut-off voltage of 2 V was reached and then recharged up to the nominal capacity. A Low C-rate of C/10 was used to minimize the dynamic effects and to achieve a good approximation to an open circuit. Figure 5 demonstrates the charge and discharge OCV curves over the SOC for various temperatures. It is noticeable that the lower the operating temperatures, the higher the difference between charging and discharging.

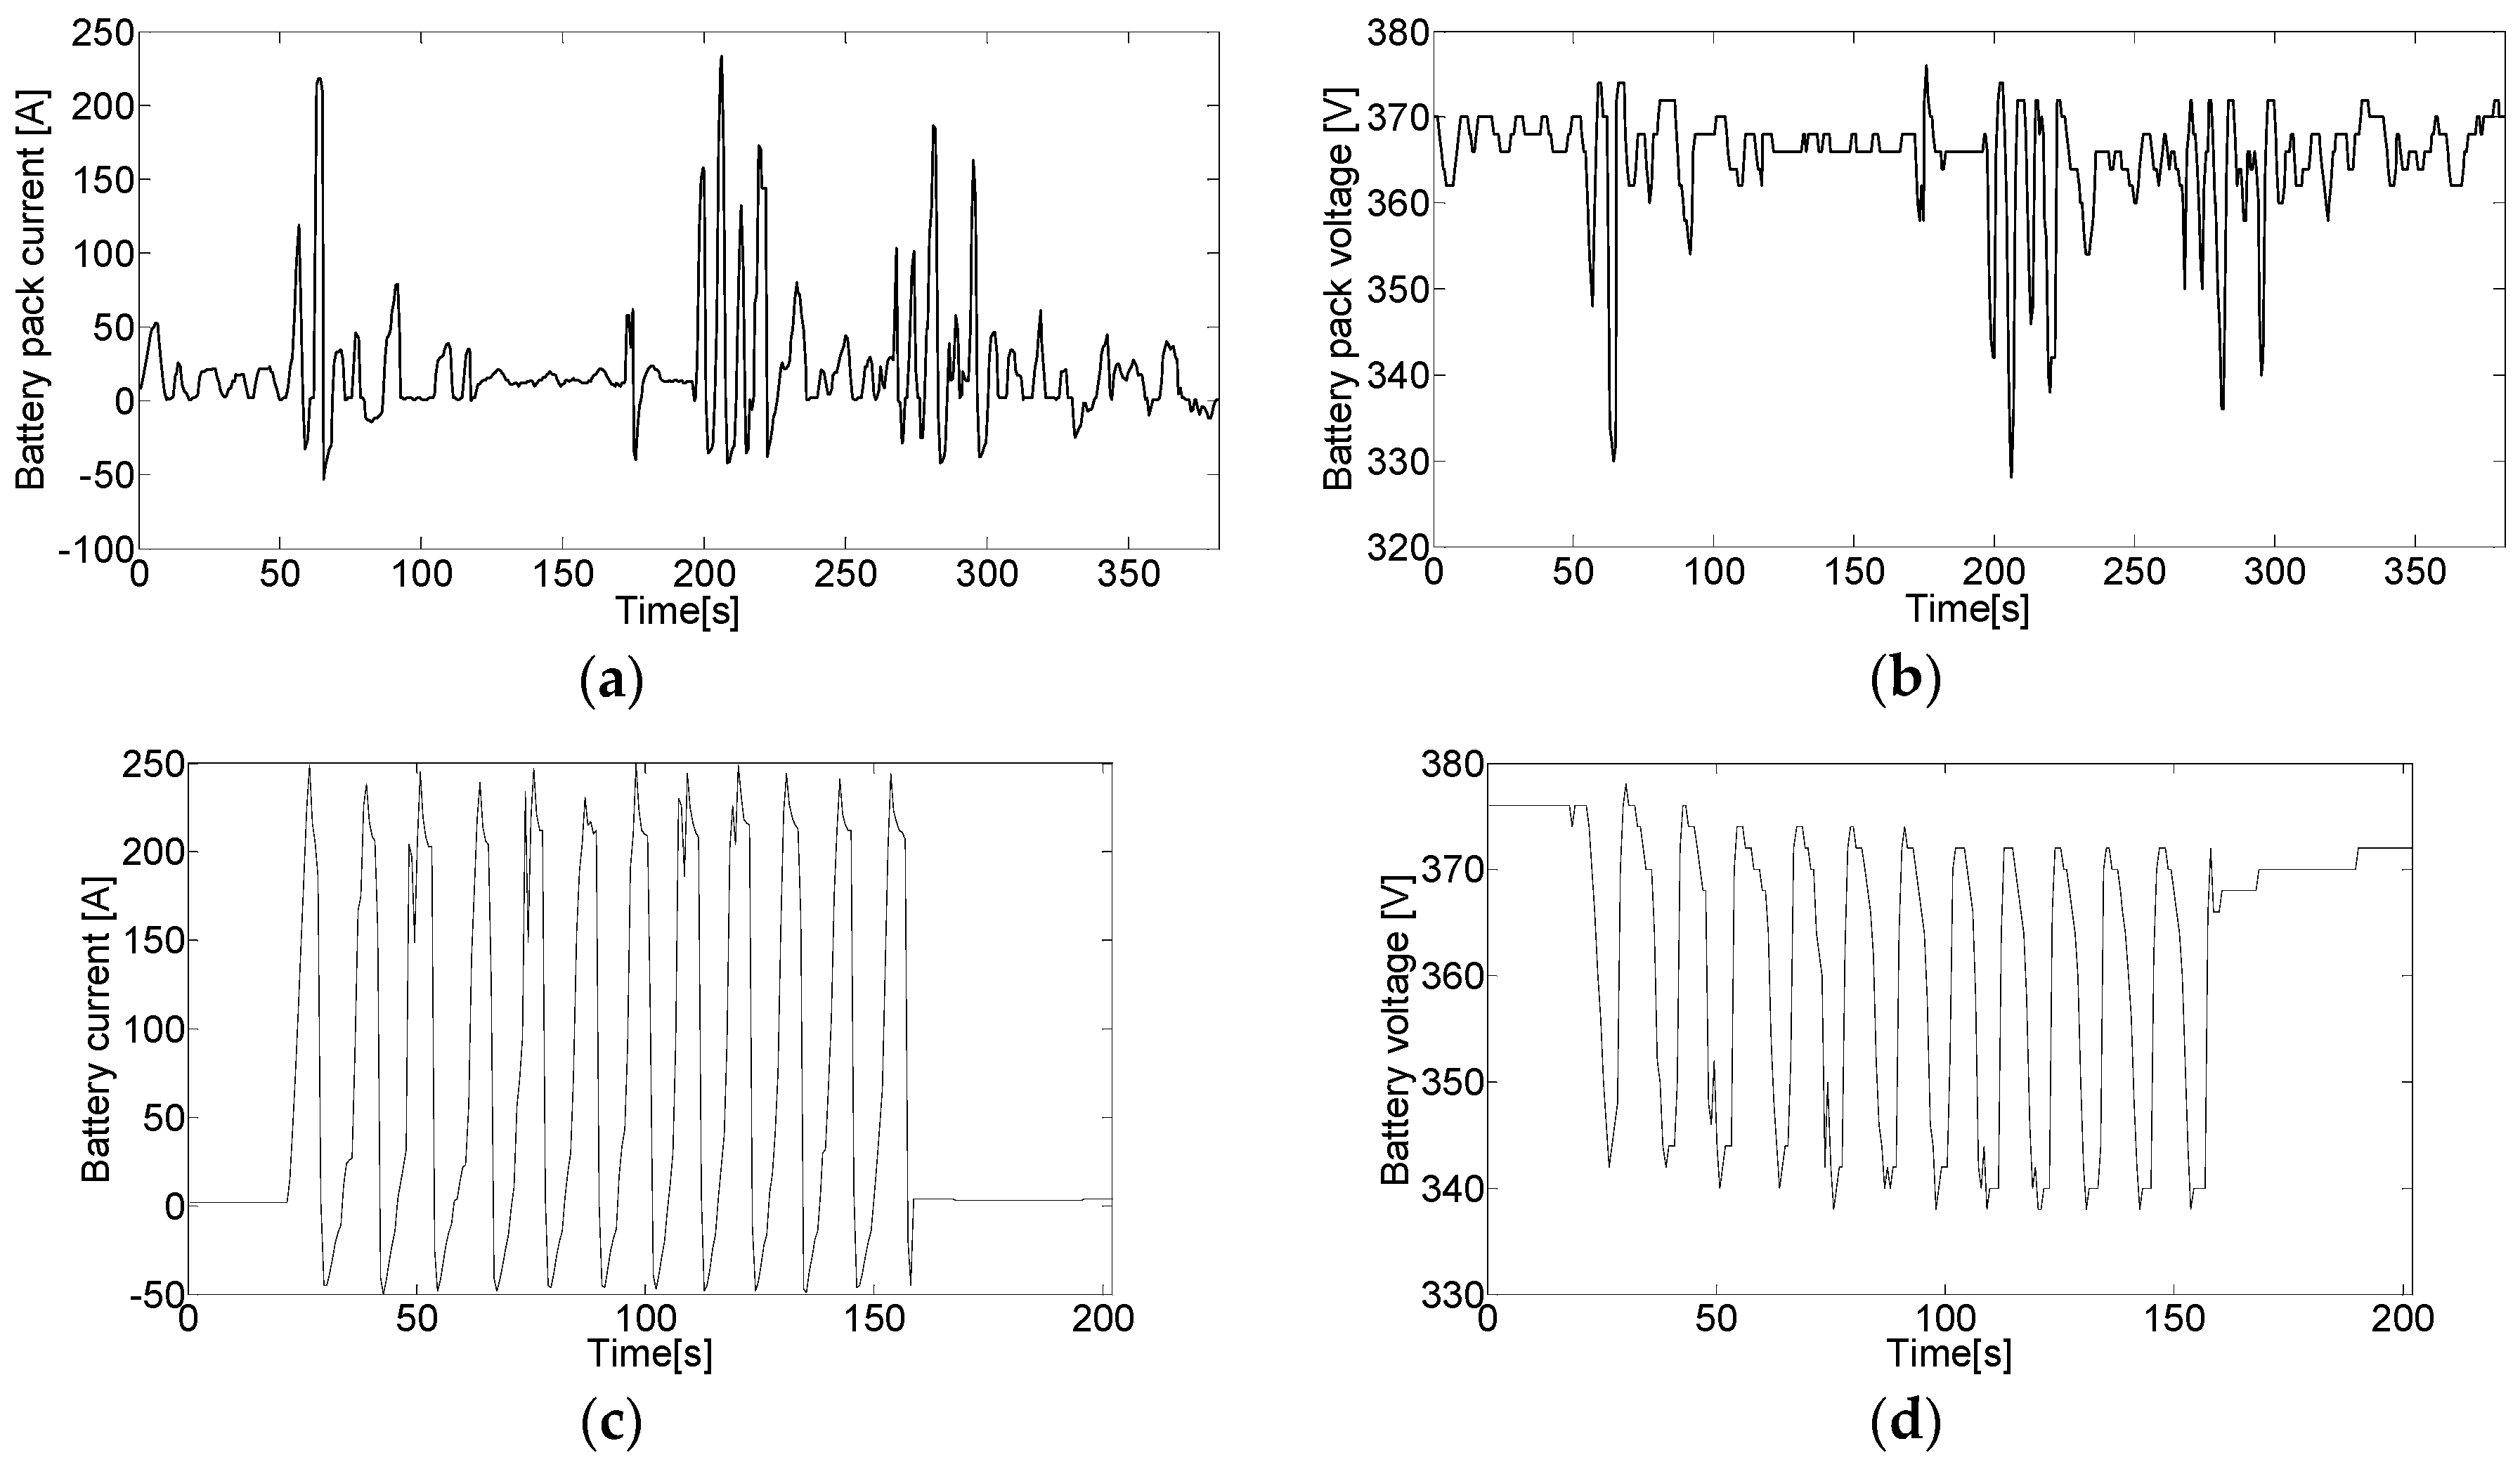
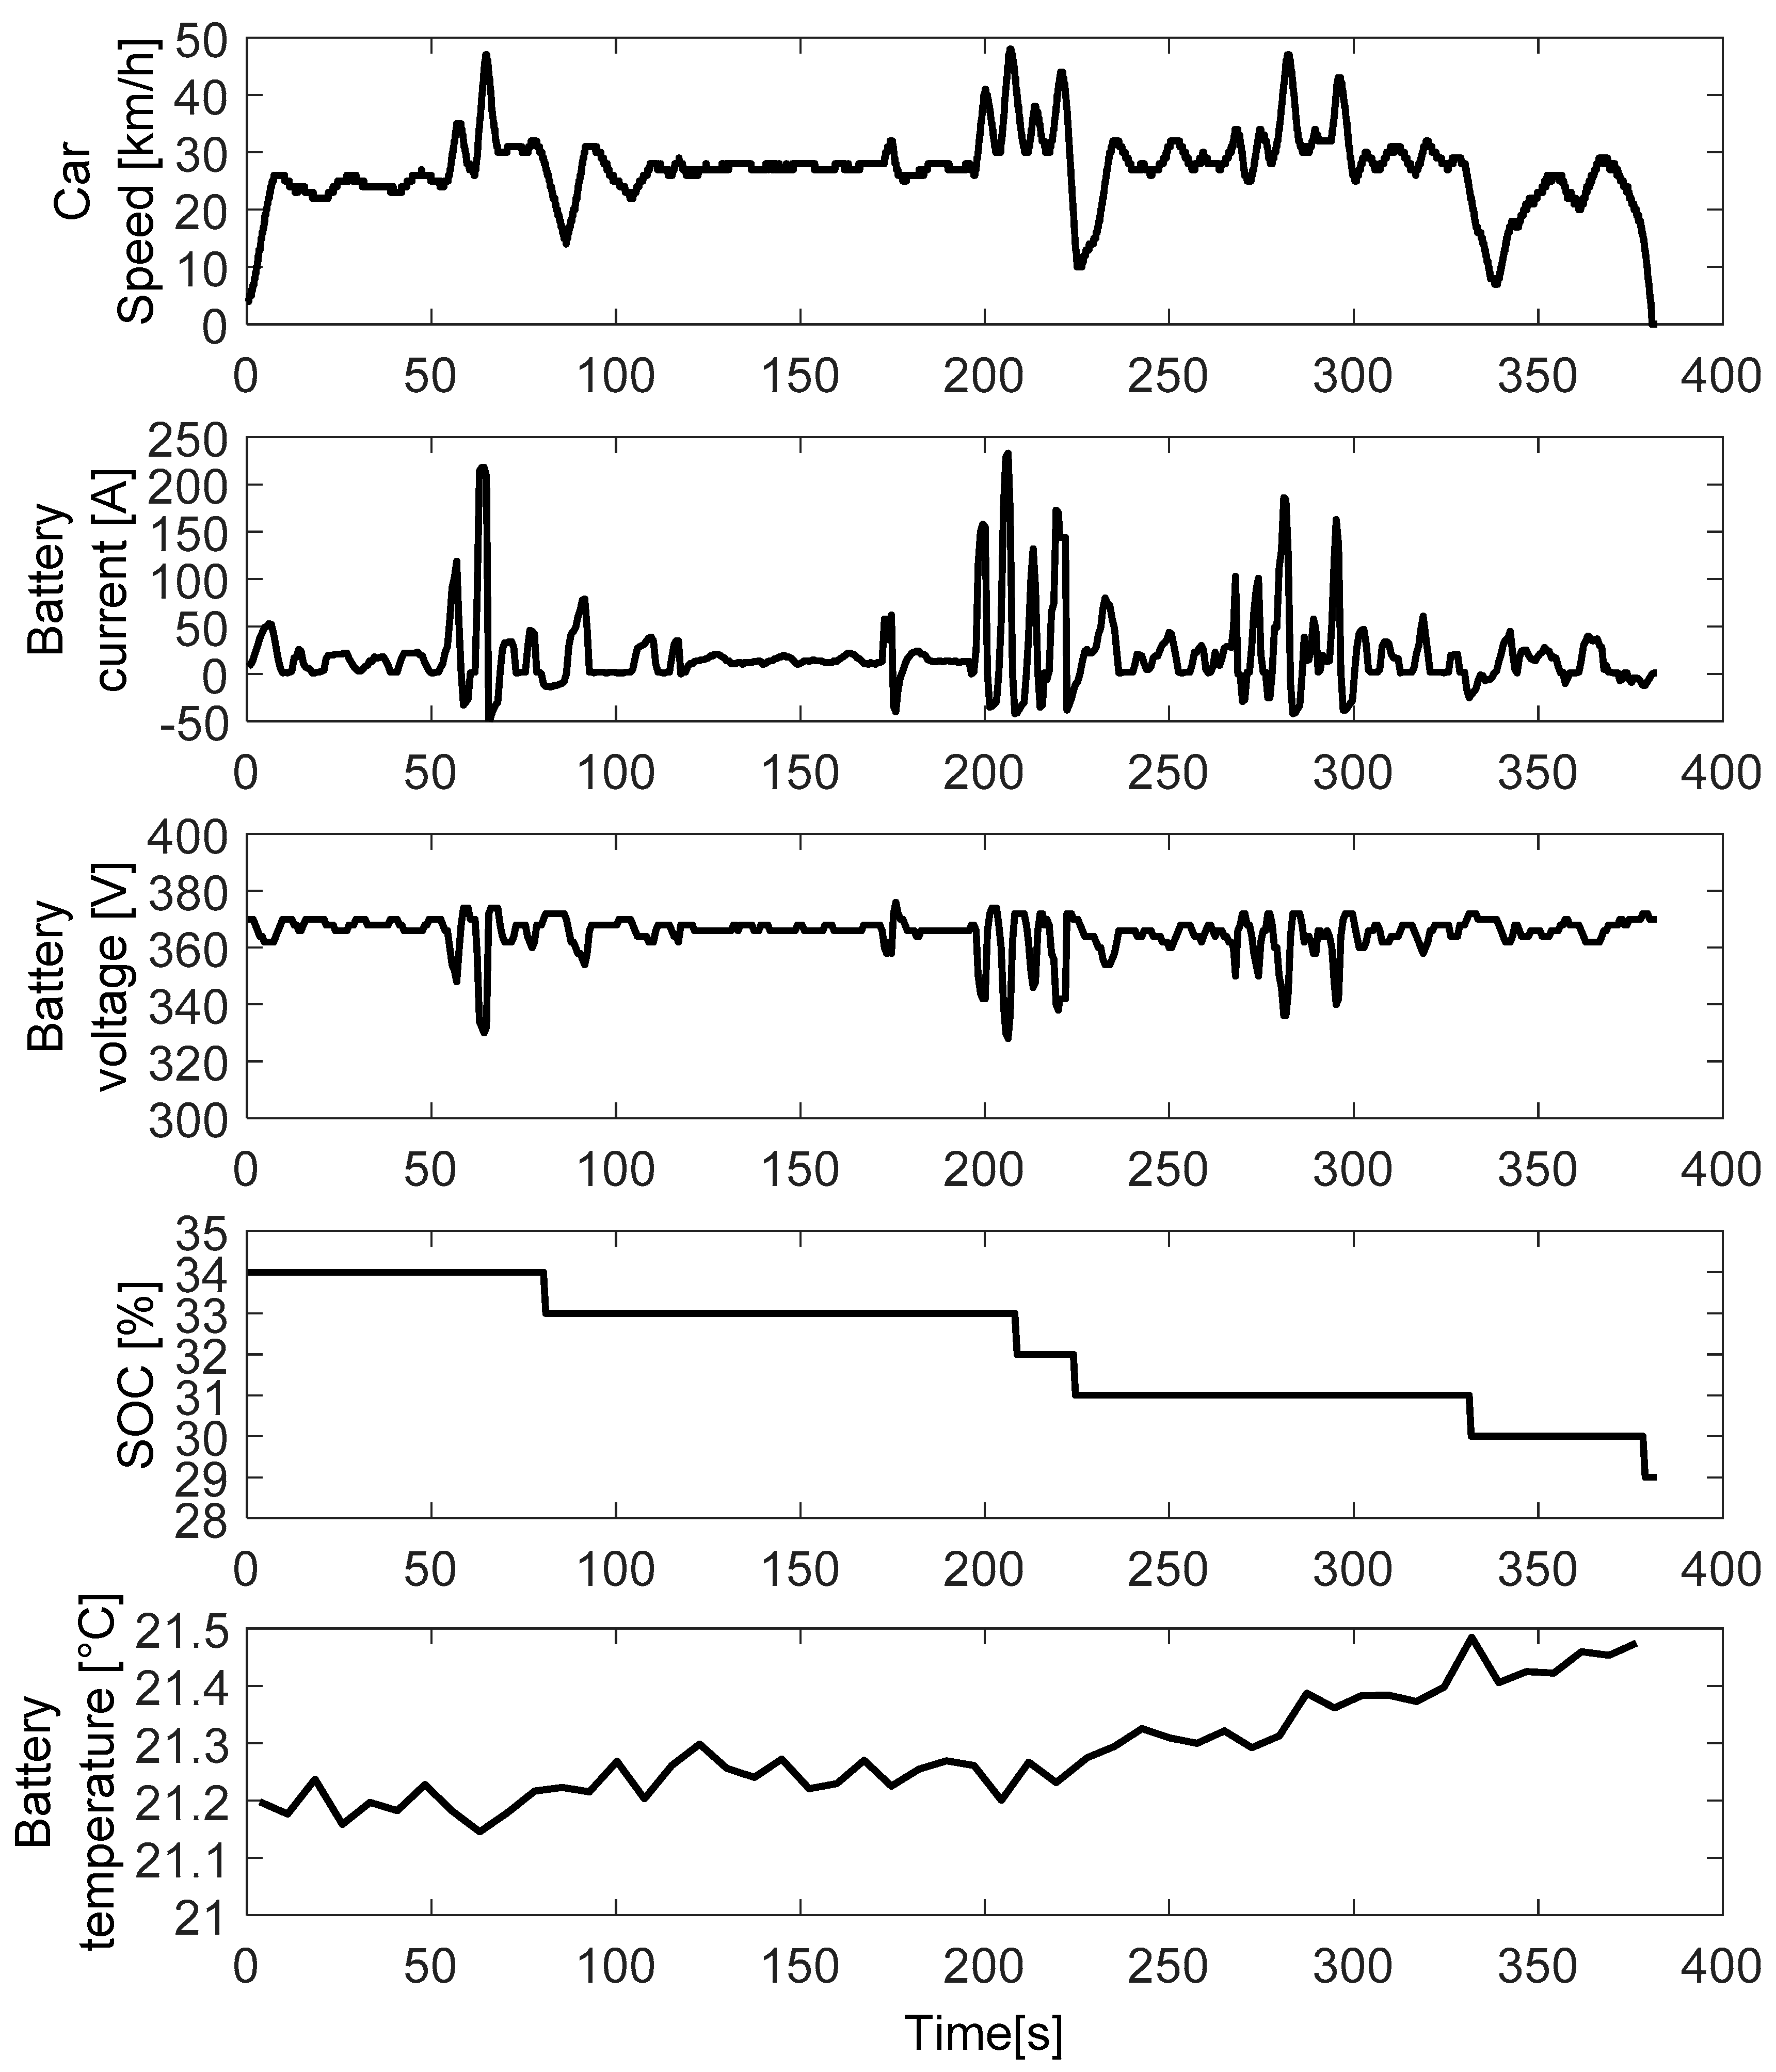
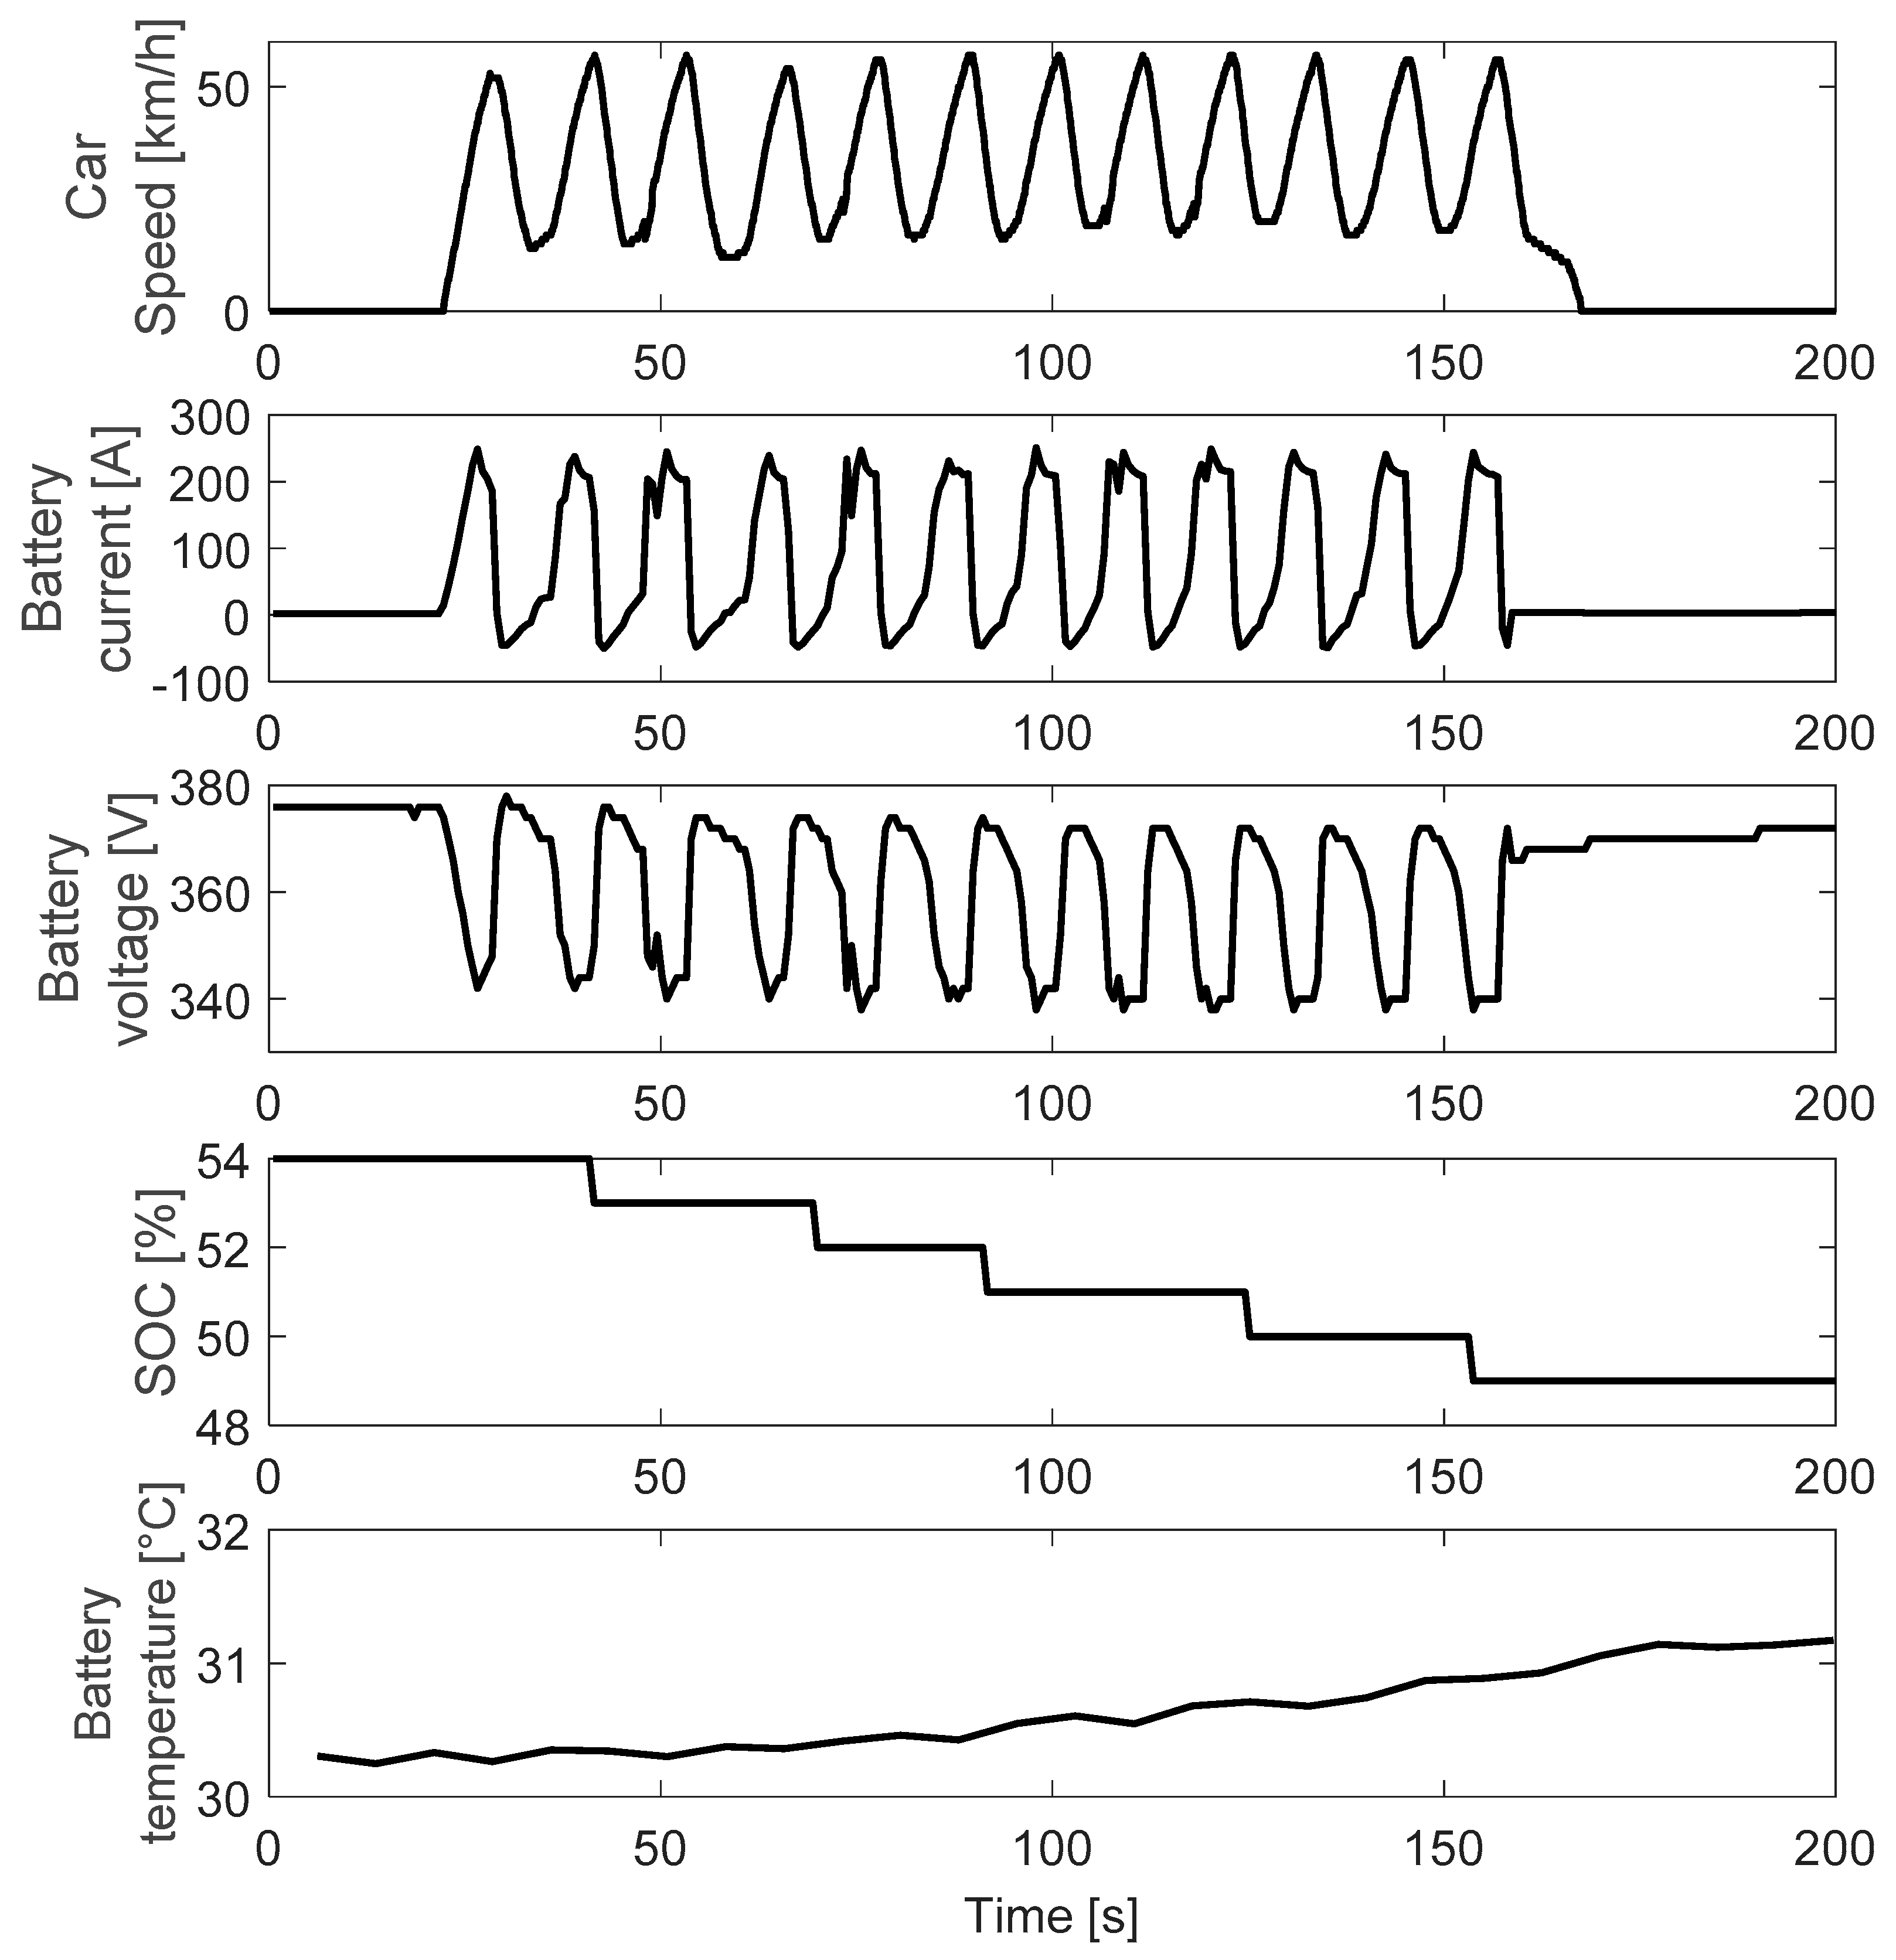
5.2. Driving Tests on the Real Vehicle

The objective of a real test is to find a real driving maneuver reference signal to validate the battery model performance. Nevertheless, the battery model should be able to simulate the actual system in real operating conditions, not merely charging-discharging cycles. Two driving tests were performed with the test vehicle for the purpose of investigation the system and collecting the experimental data. The tests were executed on the testing ground at Karlsruhe Institute of Technology (KIT). The experimental data attained from the CAN bus are displayed in Figure A1 and Figure A2 in the Appendix A.2. Then, the data were processed in MATLAB. In the first test, the vehicle was driven in a counterclockwise circular direction for about 230 s. Then the direction for driving was reversed and the test was resumed. A variable pedal input was implemented in order to cover a broader range of data. This test represents an aggressive driving scenario, leading to discharge rate of up to 3.4 C. The second test was implemented by subjecting the vehicle to a sequence of sudden accelerations and decelerations. These tests were performed this way to create highly fluctuating signals in the battery system, which are shown in Figure 6. The dynamic responses of battery voltage can be used to evaluate the battery models, discussed above.

6. Battery Models Validation

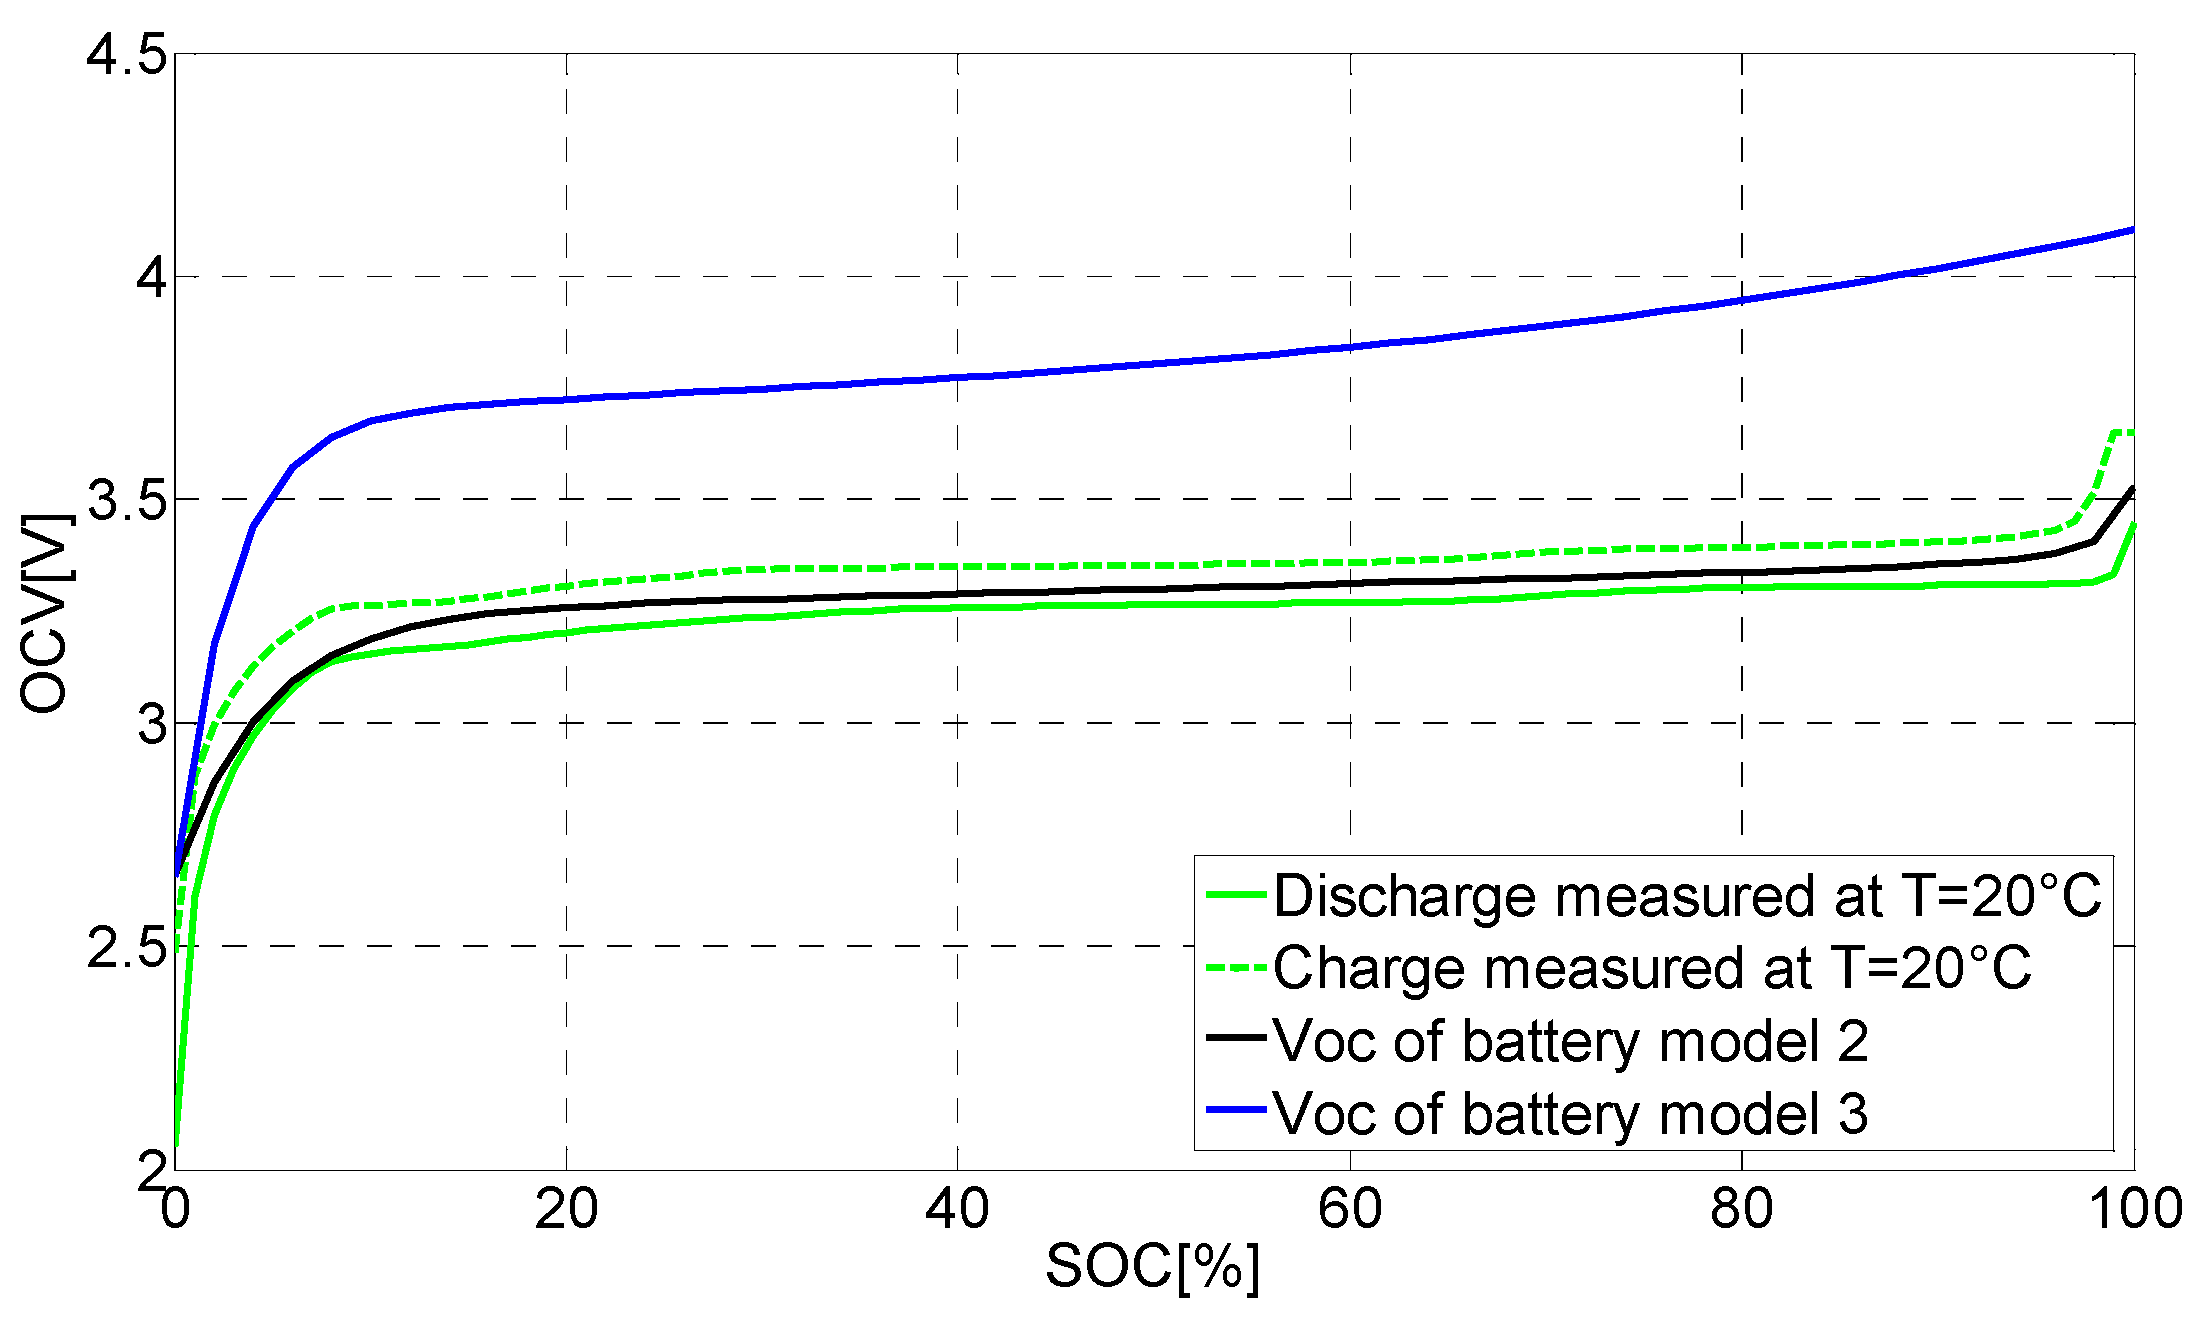
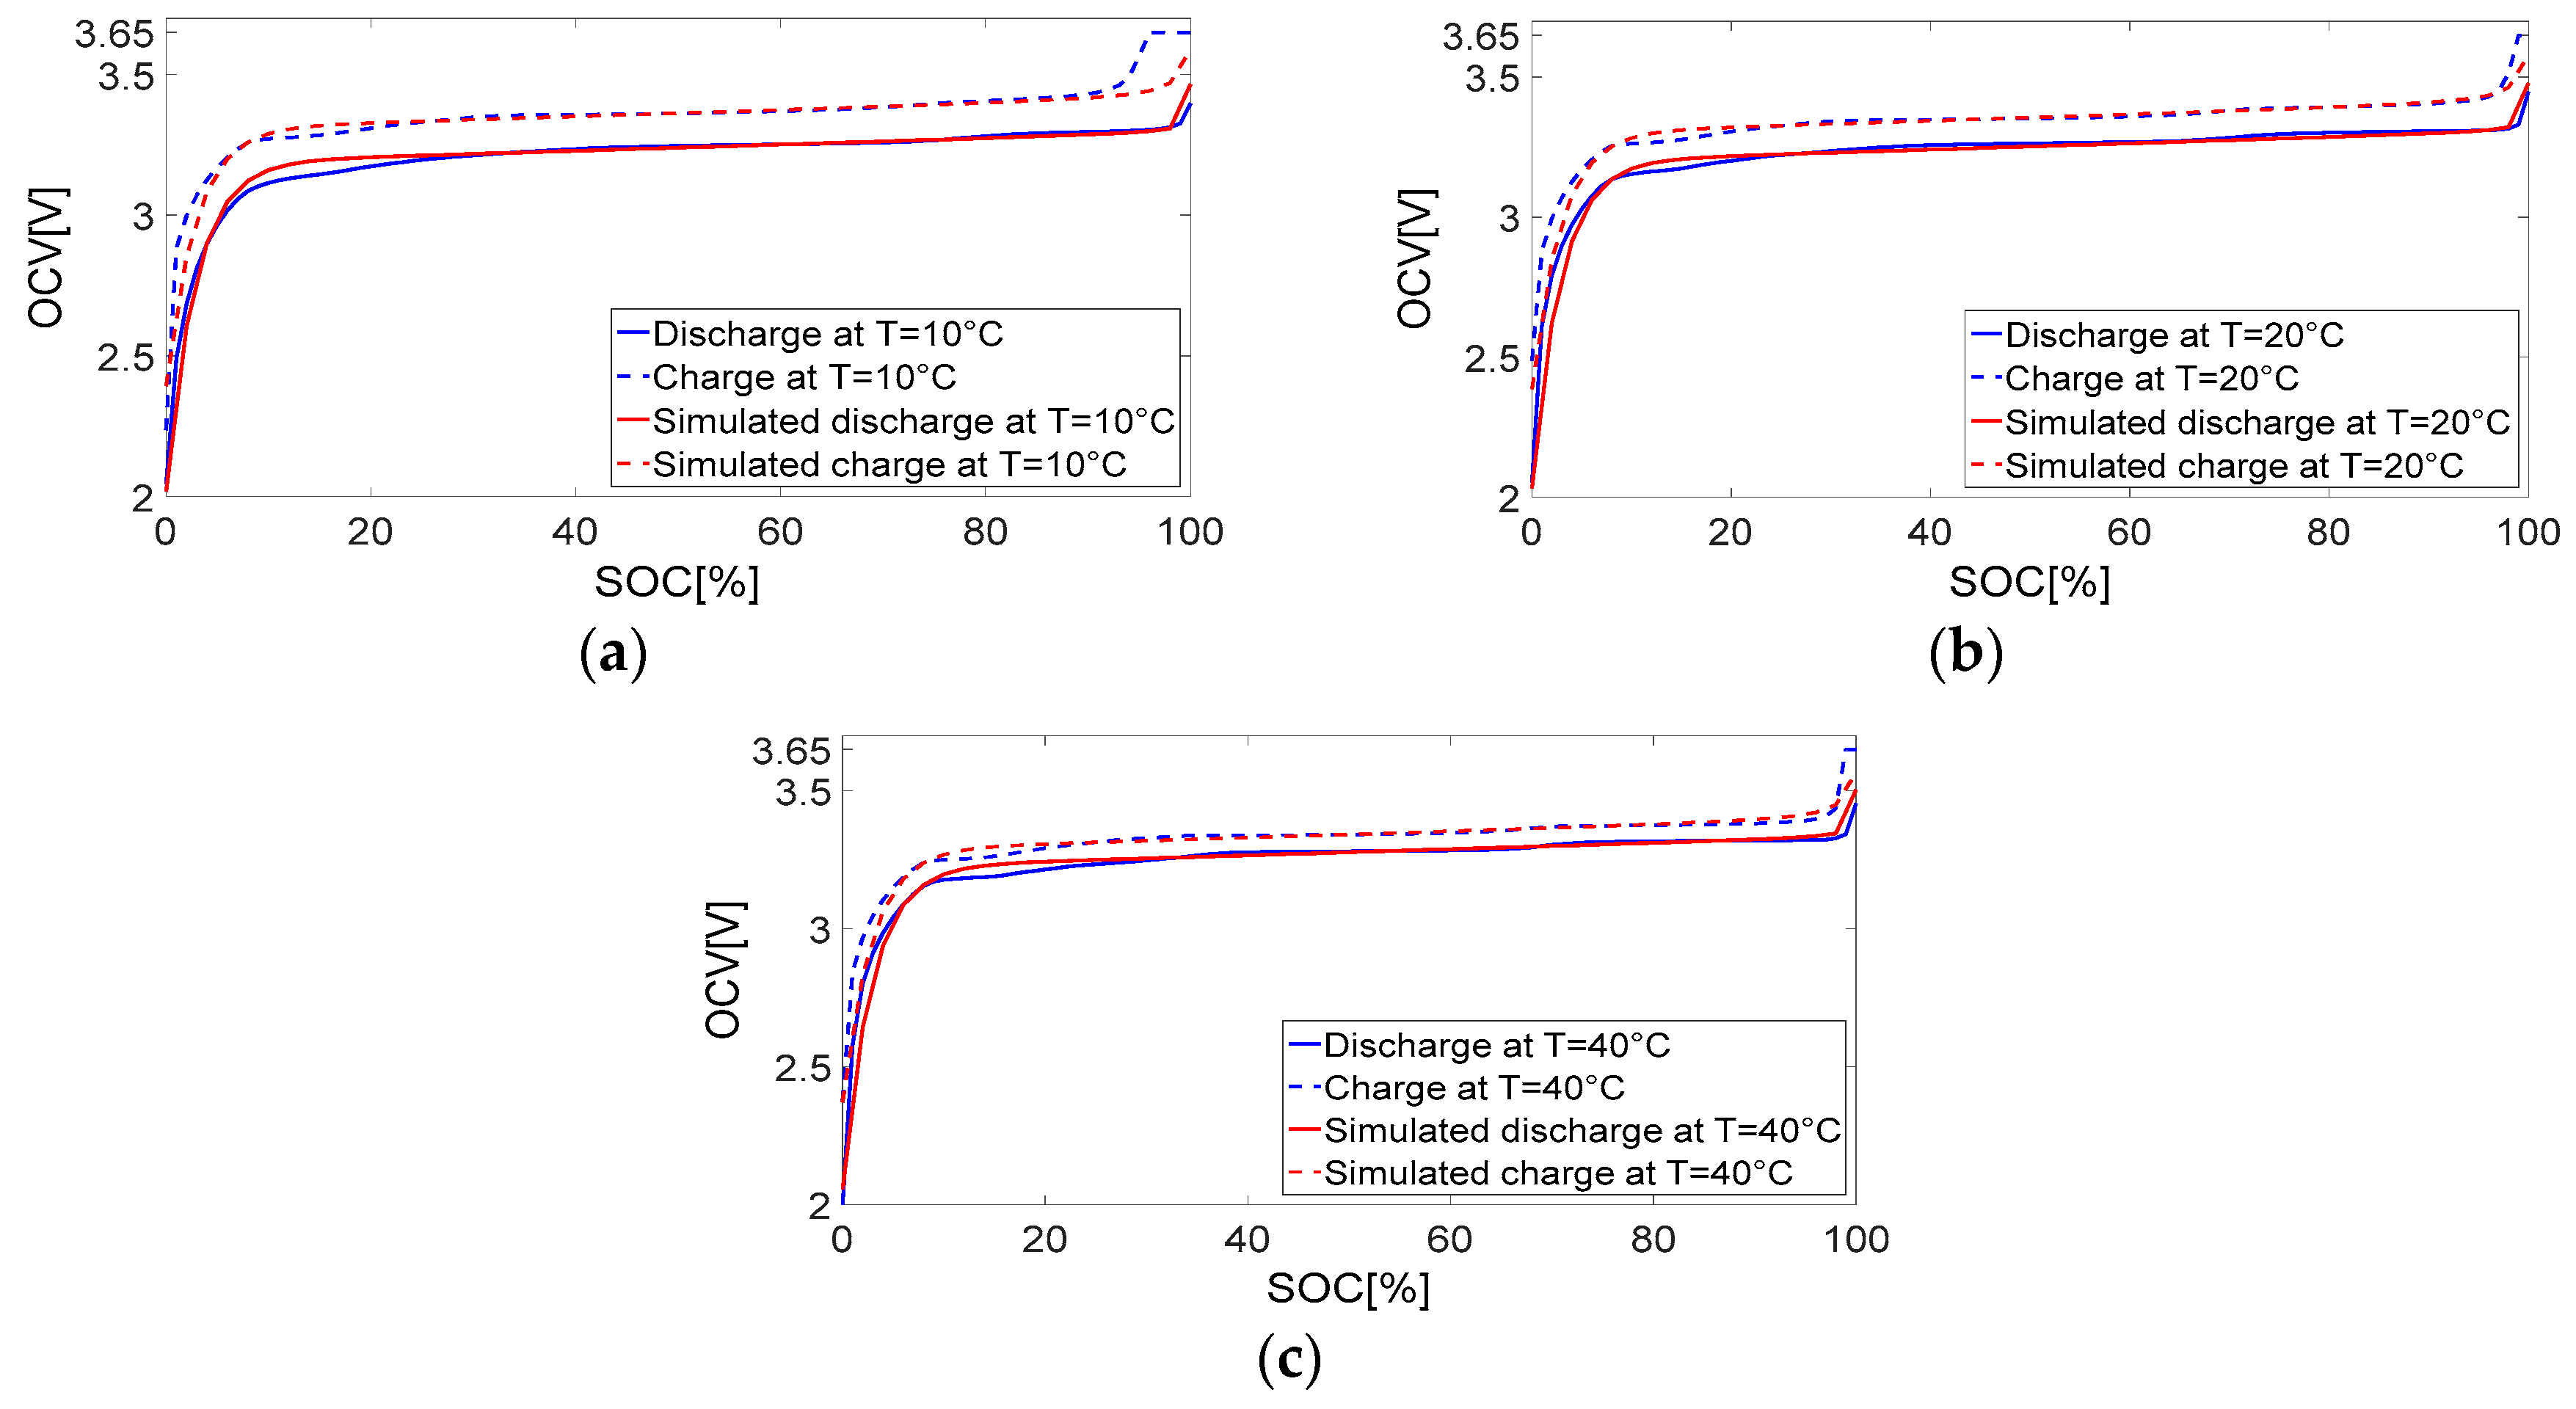
6.1. Evaluating the Open Circuit Voltage Models (VOC)

Wijewardana et al. [1] have employed a common model for VOC that is widely used and found in literature. Lam and Bauer [20] have redefined the model equation to suit the LiFeMgPO4 cathode type batteries. They concluded that the OCV is temperature independent. They justified this conclusion based on small changes of the OCV measurements due to temperature variations, which were in the range 2–8 mV [20]. An absolute error of 30 mV for LiFeMgPO4 battery cell will lead to an uncertainty of 13% in the SOC estimation at 1 C discharge and 25 °C, according to Blank et al. [31]. The battery of our vehicle is LiFeMgPO4-cathode type. Its OCV curves are presented earlier in Figure 6. According to our measurements, the OCV temperature alteration is from 15 to 90 mV, which is about 10 times higher than the result presented in Reference [20]. In our study, we use a battery module that contains 6 cellblocks in series, with 50 cells in parallel for each. Moreover, the vehicle’s battery pack has 19 modules. With this combination of battery cells, the range of voltage alteration becomes 1.71–10.26 V, which is a considerable change in the battery pack output voltage.
We validated both VOC models in References [1,20] by comparing the simulation results with our own measurements, as shown in Figure 7. We selected the charge-discharge curves at T = 20 °C to be the references for validation. The VOC model utilized in battery model 3 does not fit our measurements. The VOC of battery model 2 better fits the experimental data. The deviation in an SOC range spanning from 10% to 90% is about 0.03 V. This deviation increases at low temperature.
The influence of the temperature variation on the OCV curves is defined as d V OC / d T . From the measurements shown in Figure 6, the value of this term was found to be 1.25 mV in case of discharge and 0.69 mV for charging. The VOC model 2 model is modified for better fitting of the OCV curve along the SOC range and the temperature influence is considered. The new VOC is modeled by Equations (8) and (9) and the constants values of the new VOC are presented in Table 3. The validation results are shown in Figure 8 and in Table 4.
V OC , discharge ( SOC , T ) = a 1   e a 2 SOC + a 3 + a 4   SOC + a 5   e a 6 1 S O C + T   d V OC , d / d T
V OC , charge ( SOC , T ) = b 1   e b 2 SOC + b 3 + b 4   SOC + b 5   e b 6 1 SOC + T   d V OC , c / d T

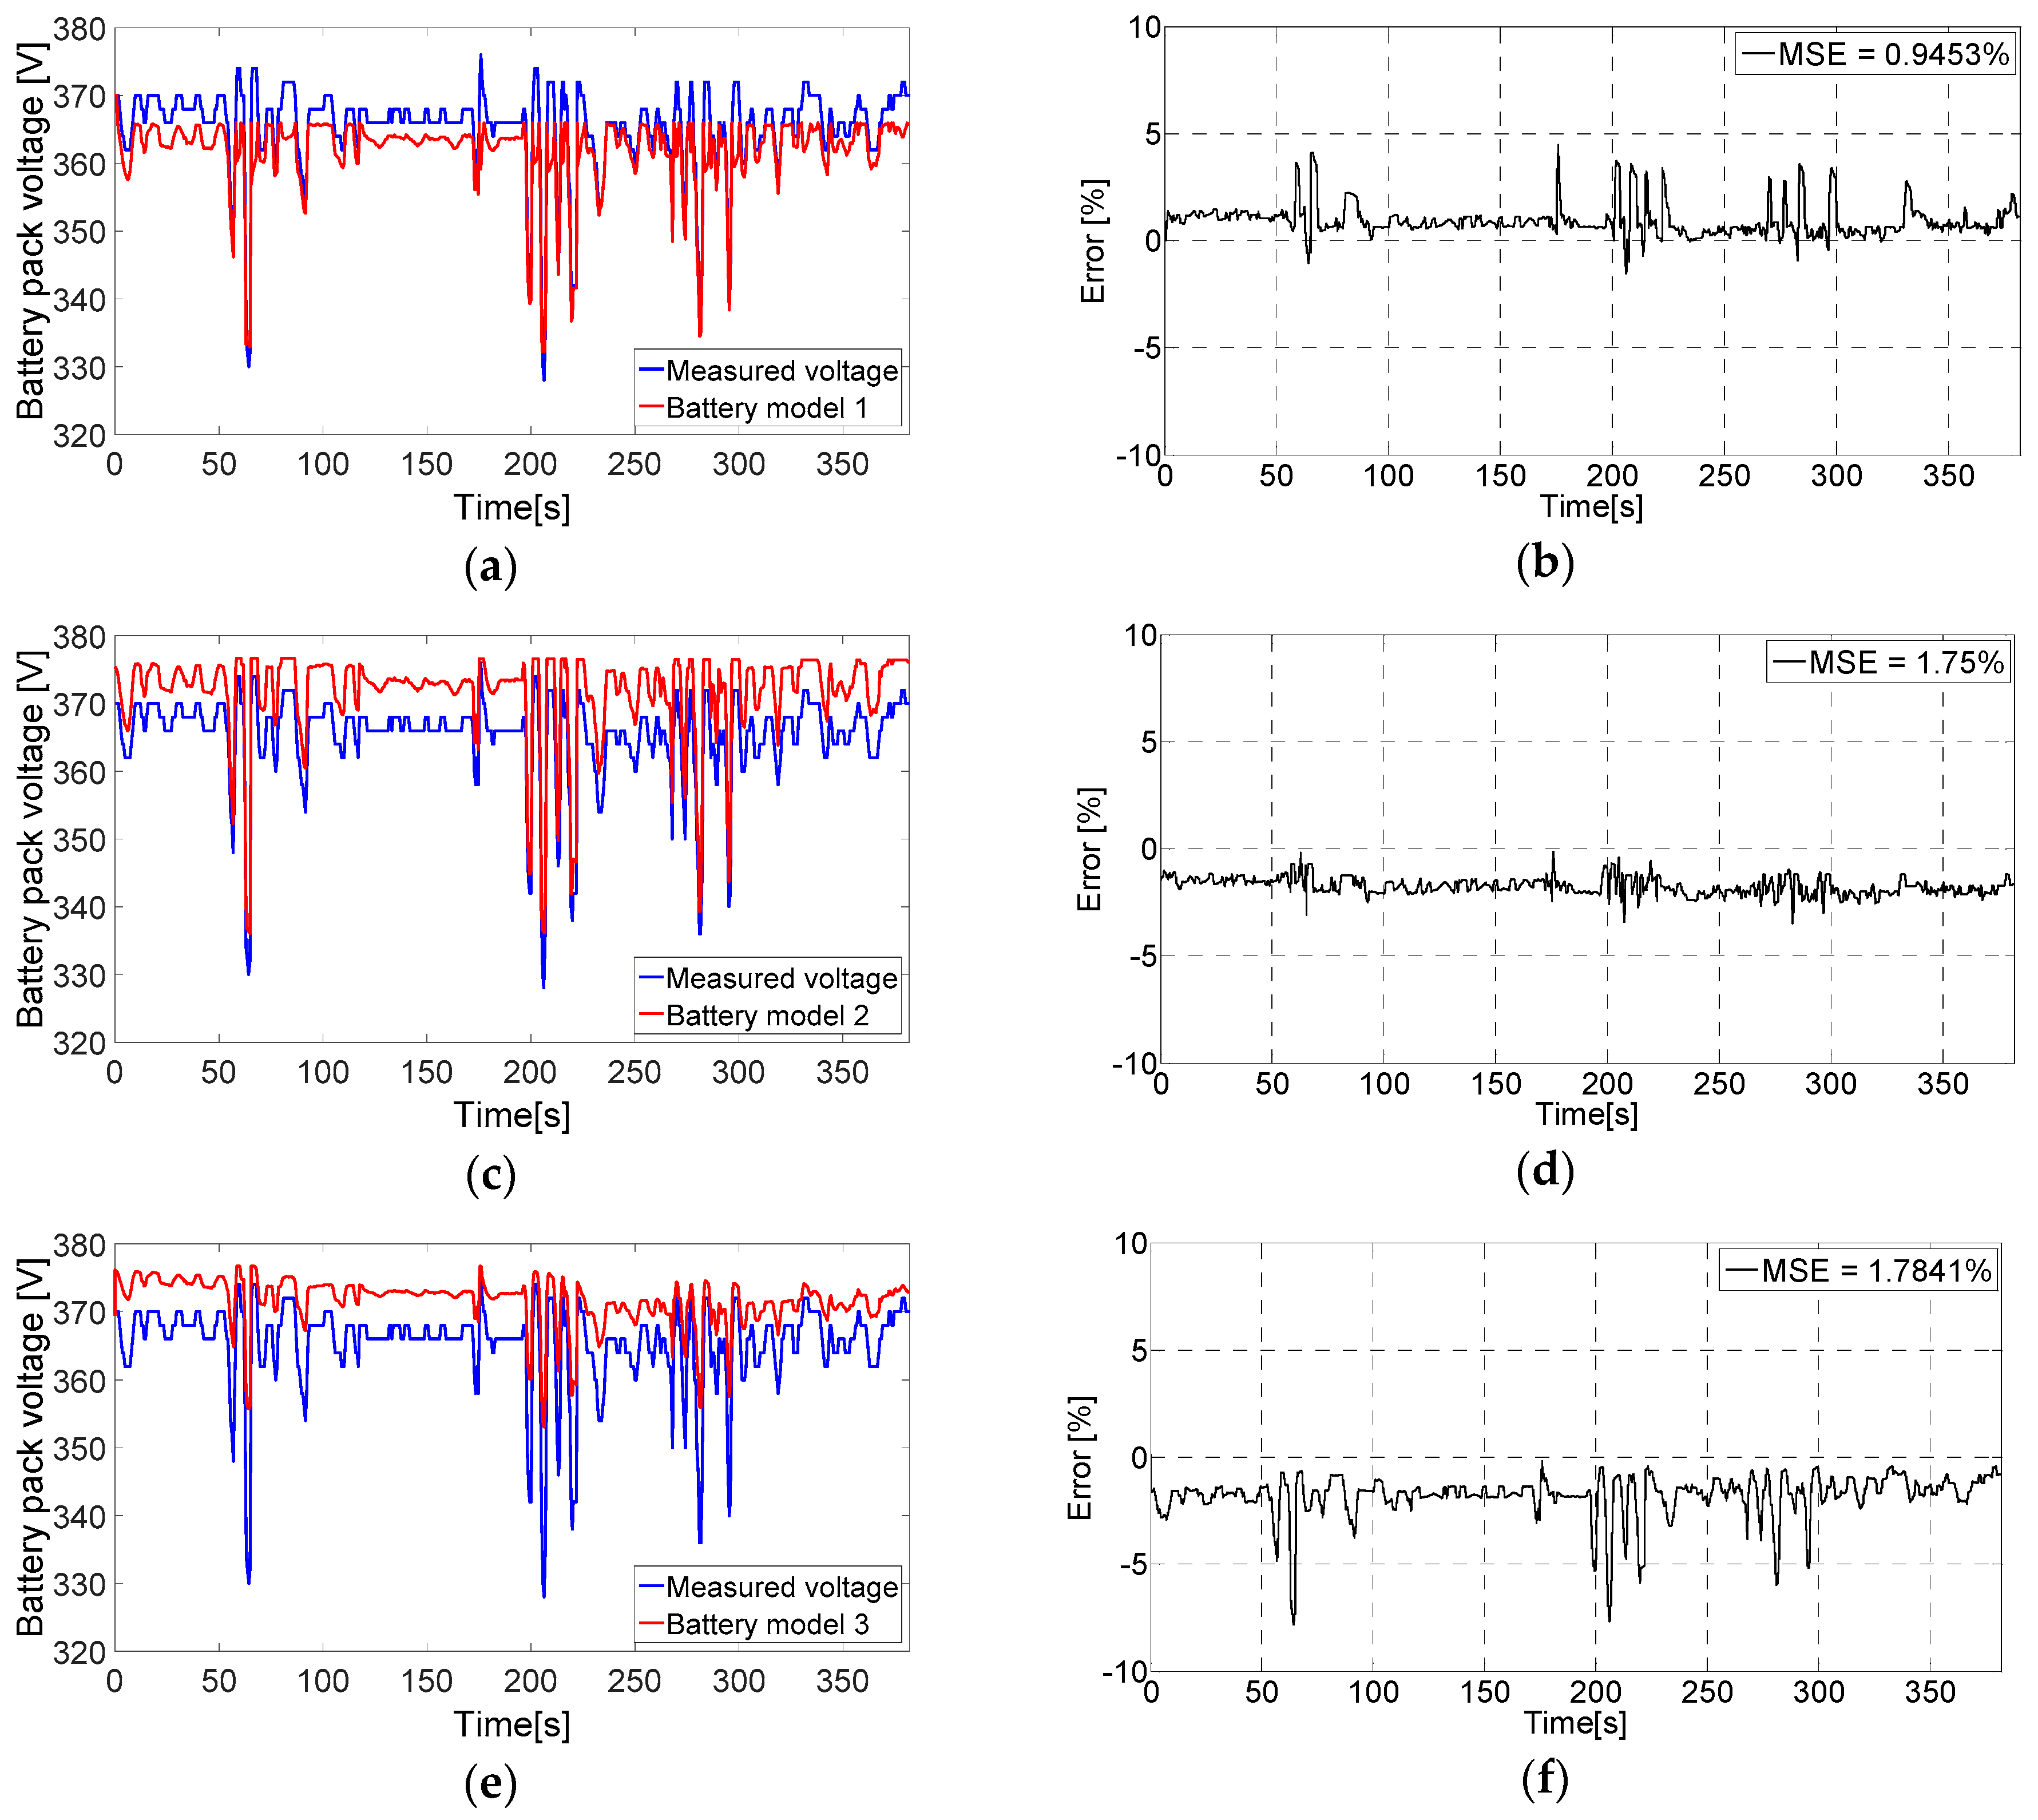
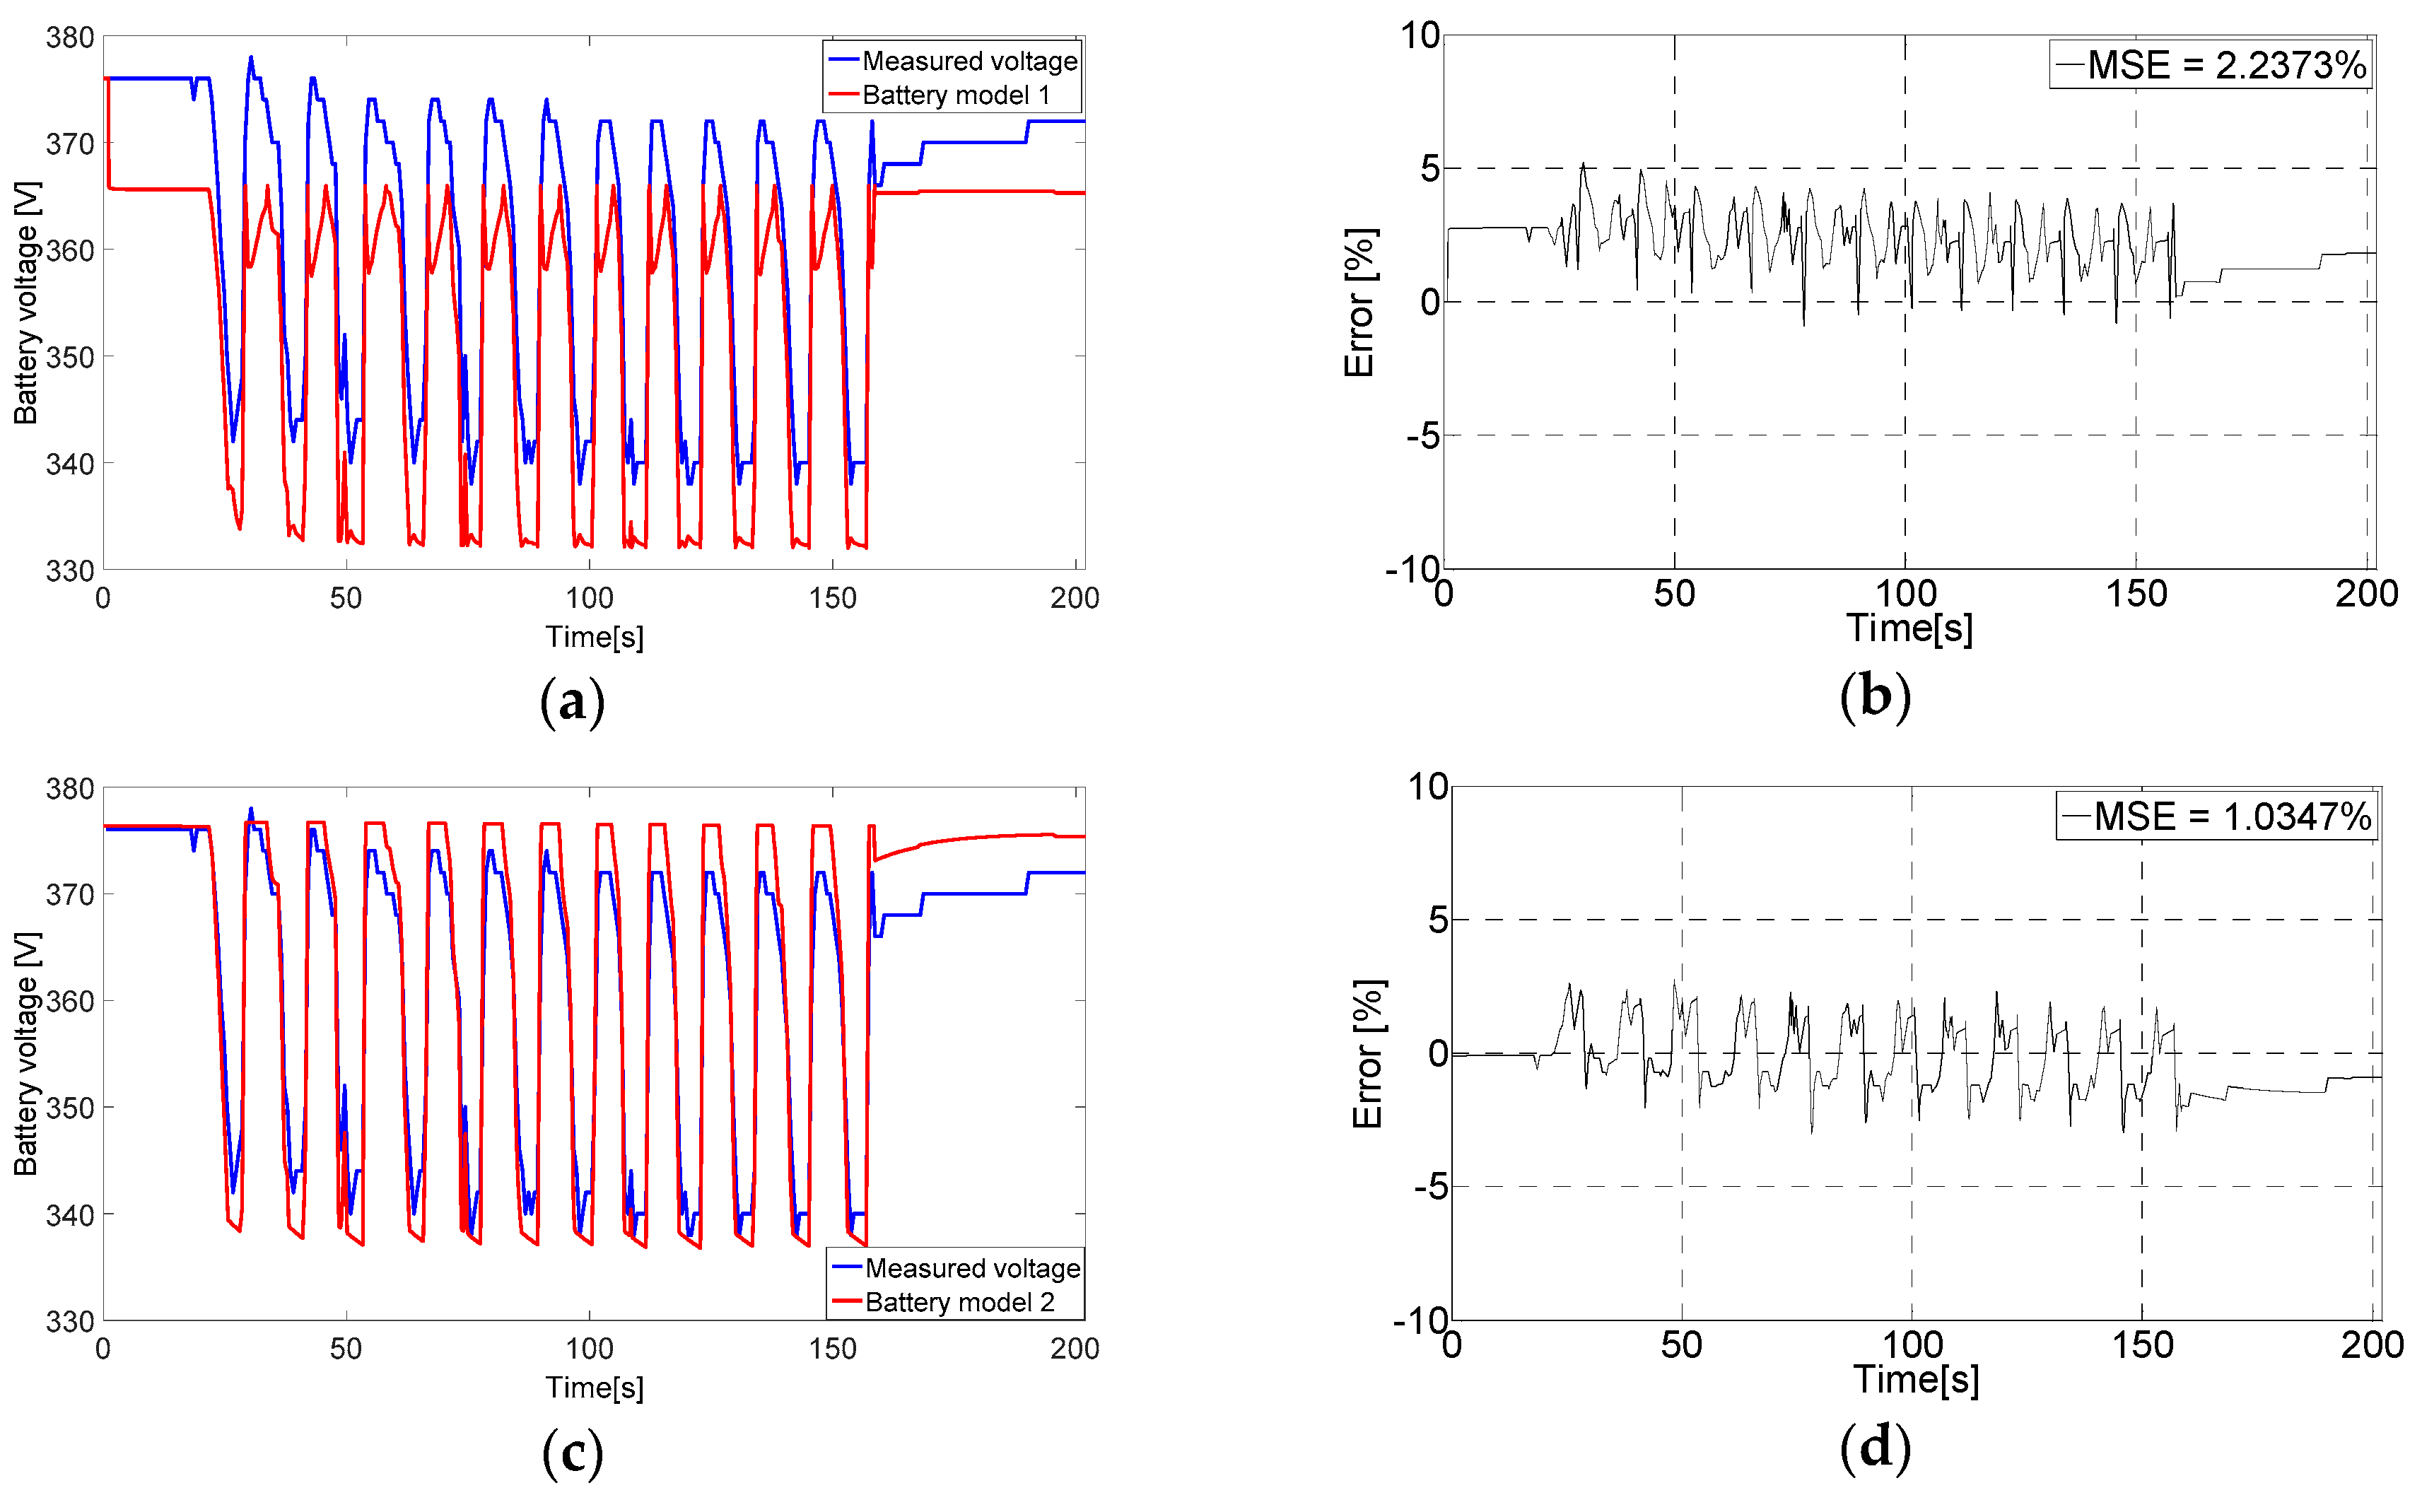
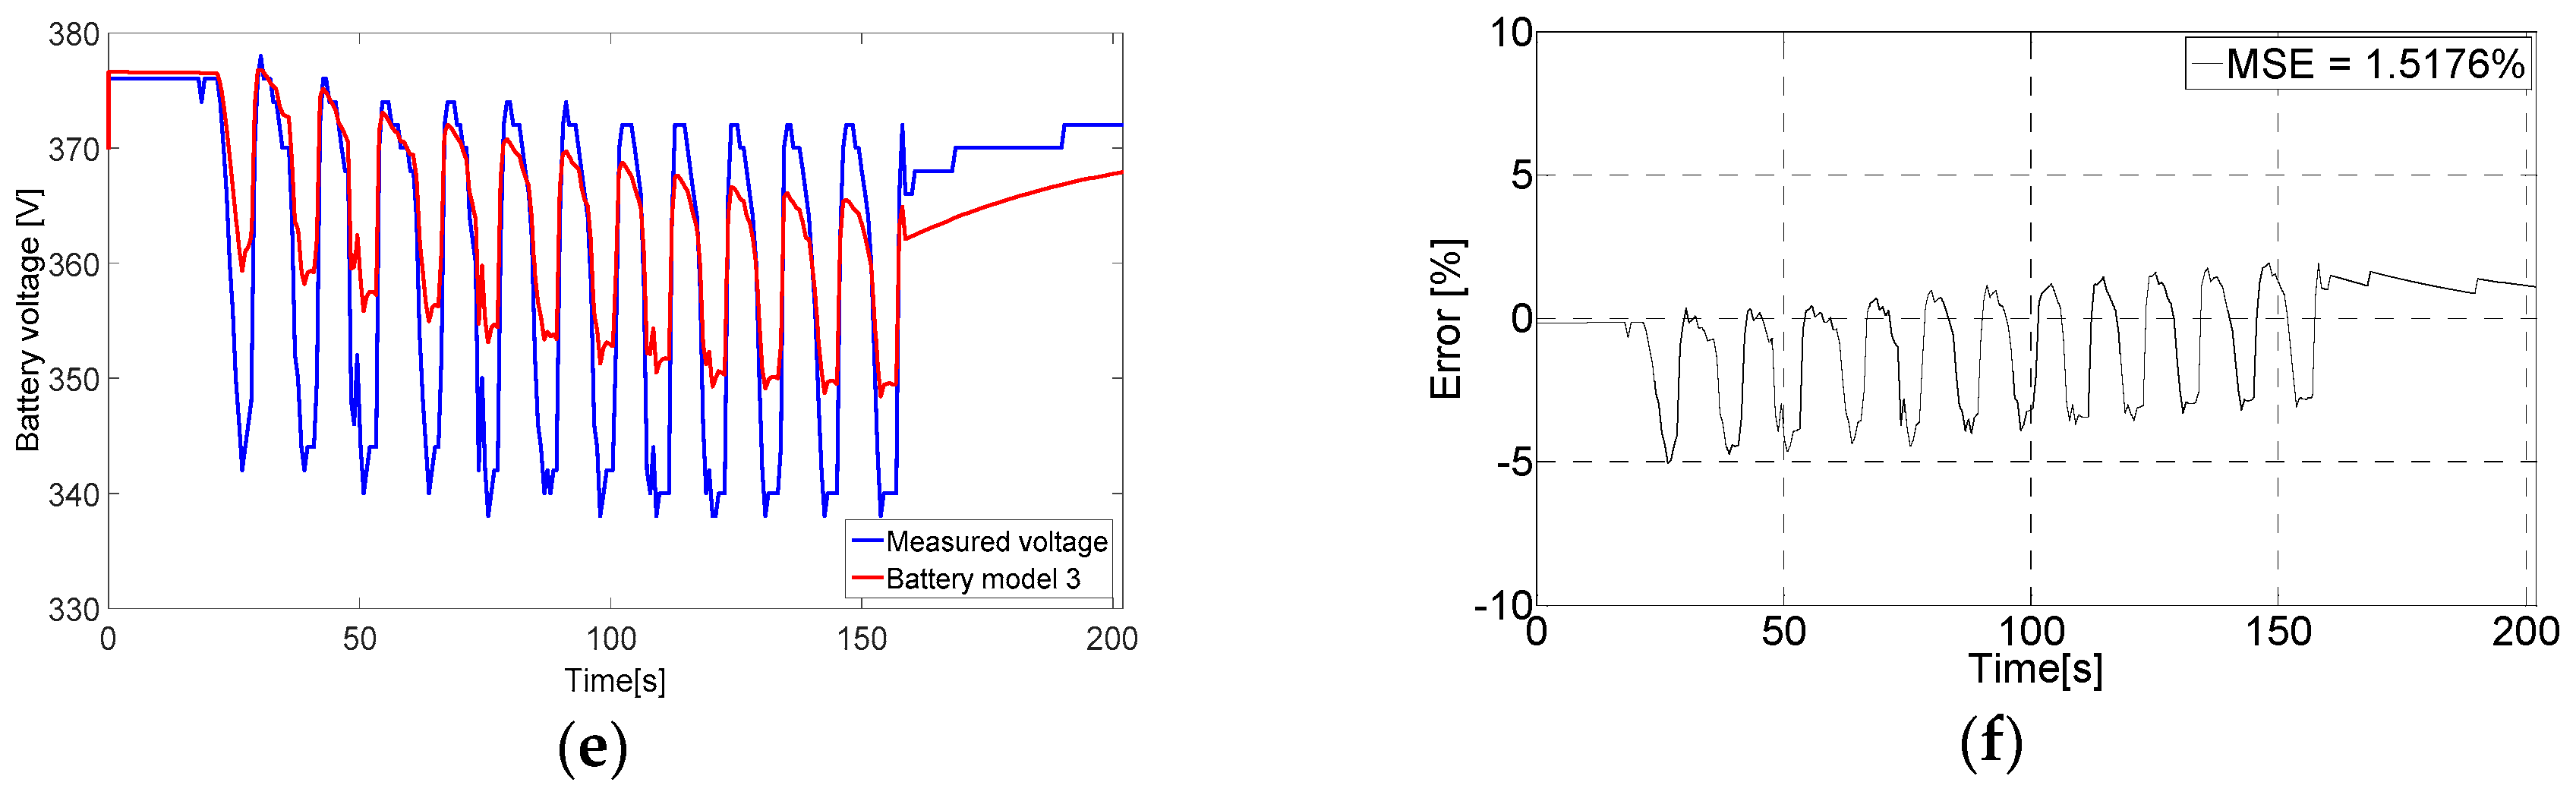
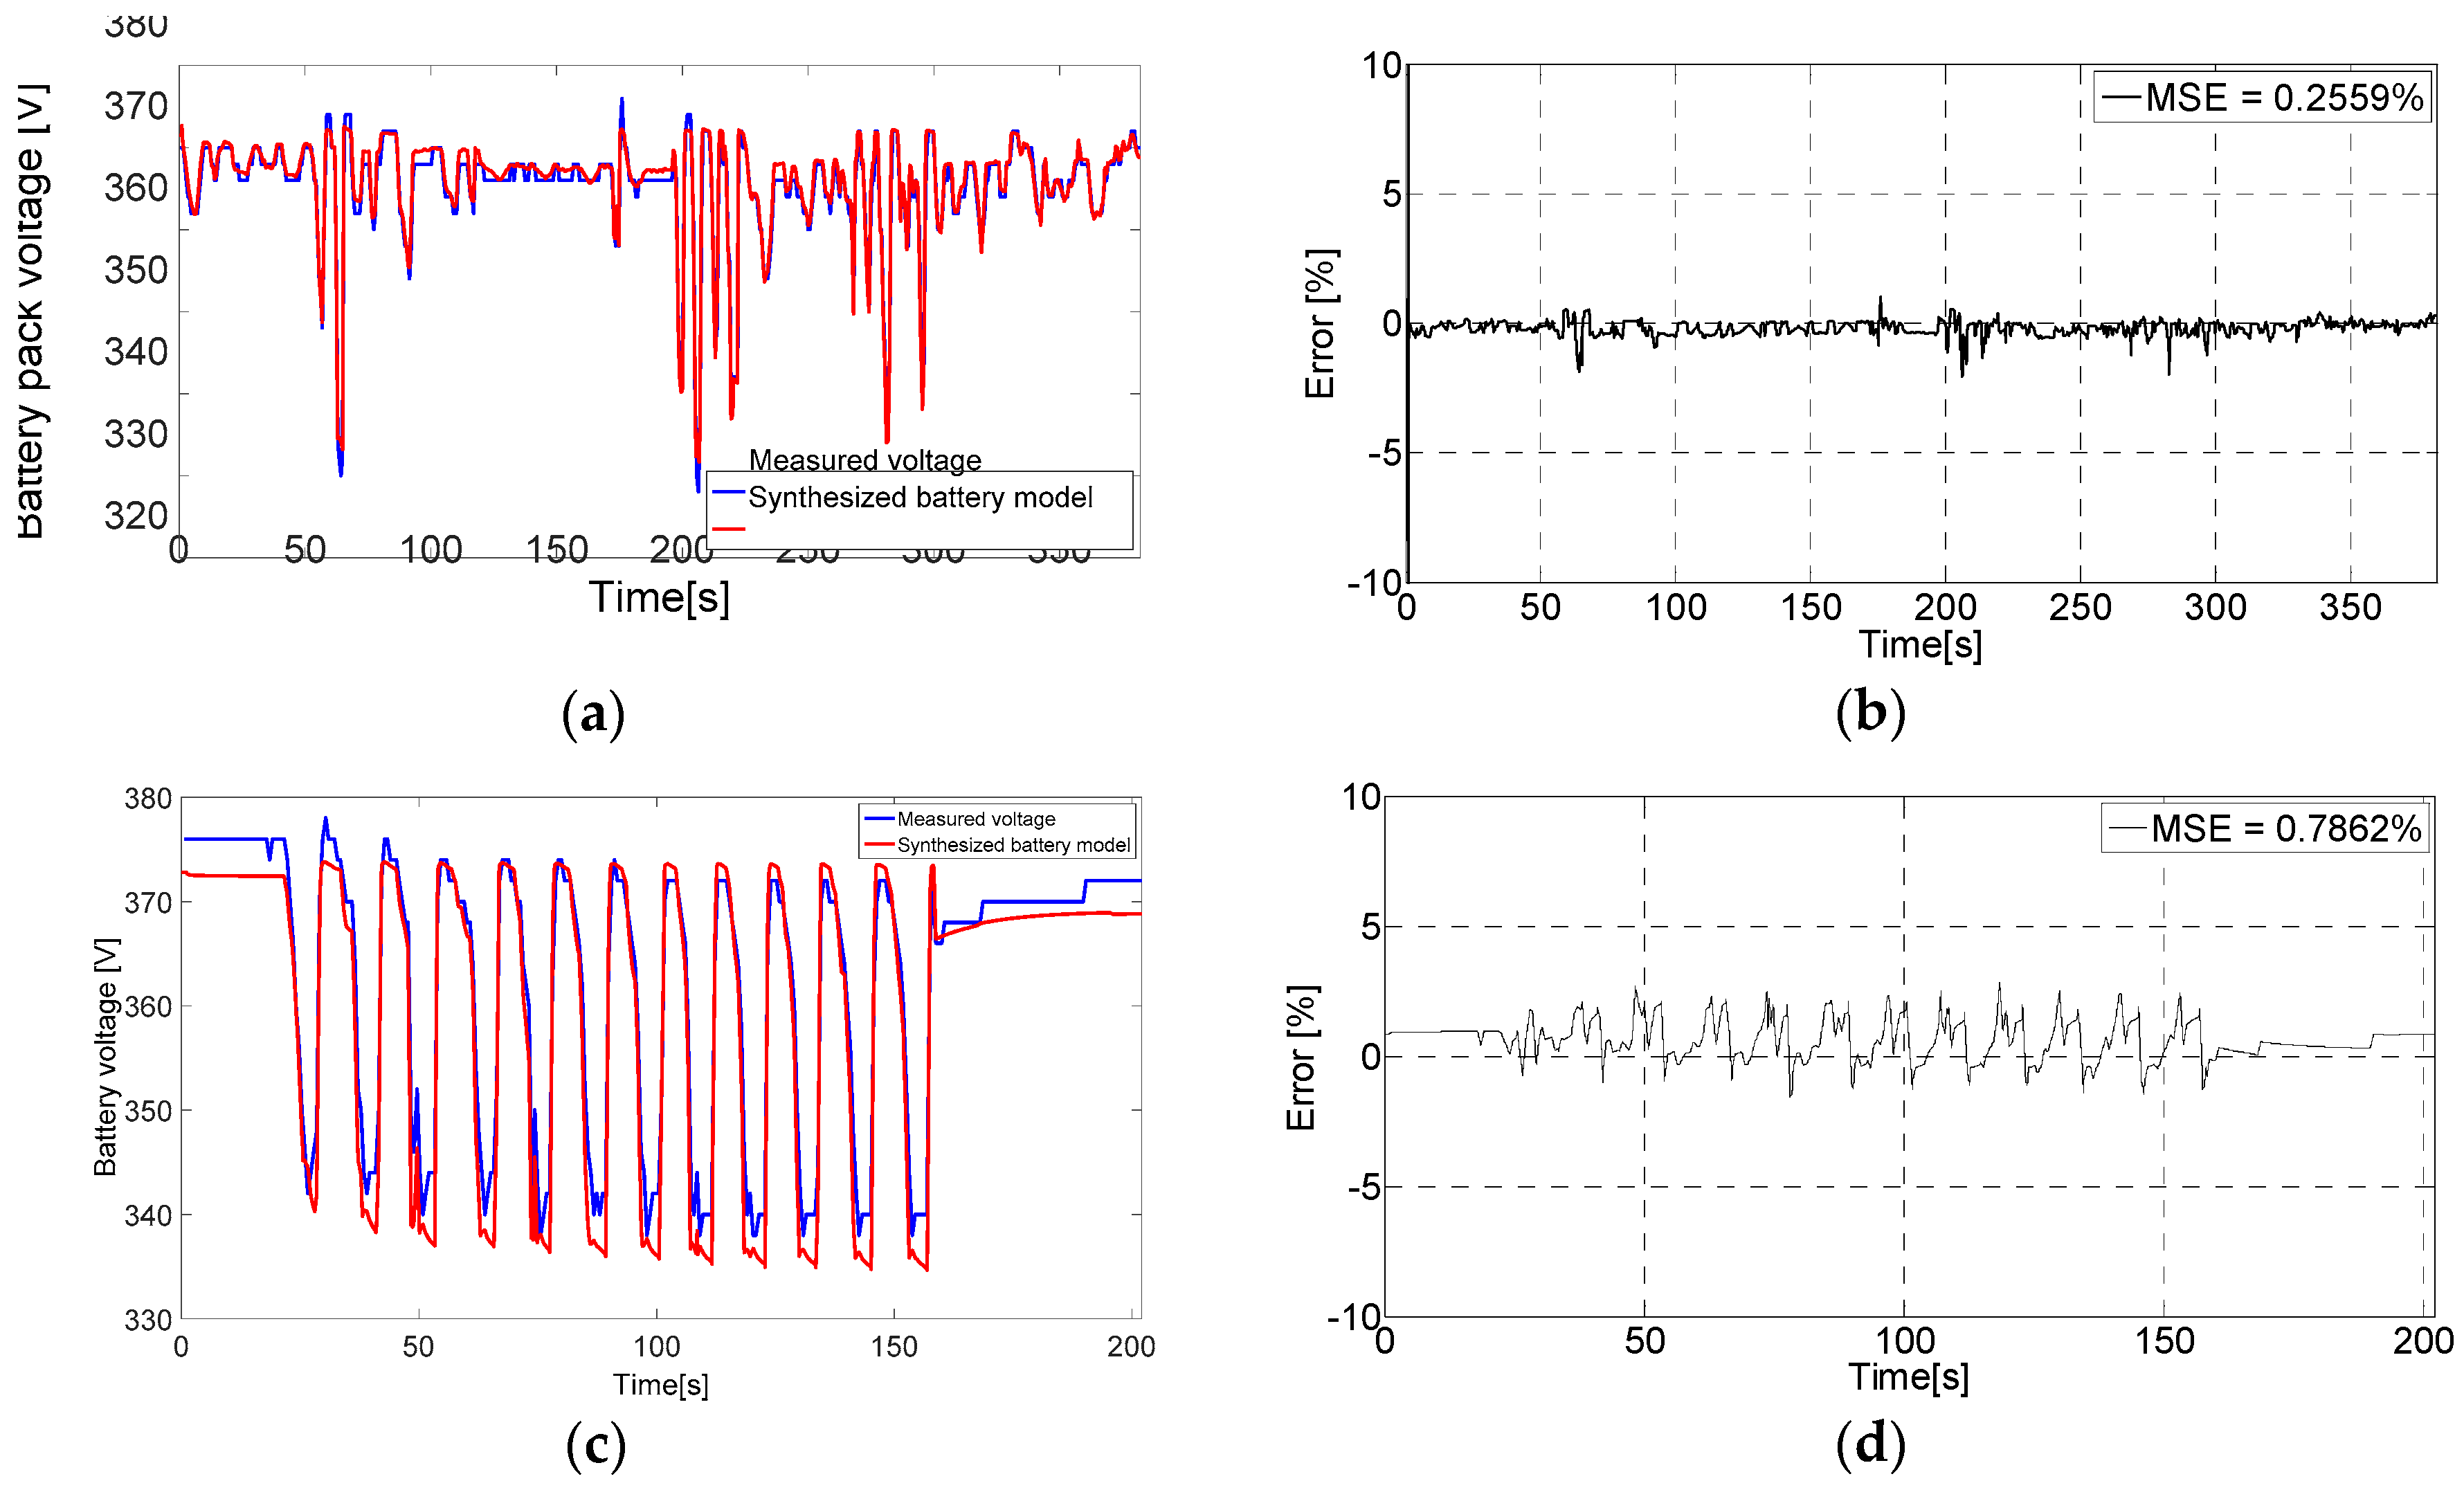
6.2. Evaluating the Battery Models Output Voltage

The accuracy of each model is yet to be proved. For objective comparison, the thermal model elaborated in Section 4 is employed for all models. The battery currents in Figure 6a,c are designated as the inputs for all models and the output voltage of each model is investigated against the voltage response signal, shown in Figure 6b,d. The VOC of model 3 [1] showed a large deviation from the actual curve, as shown in Figure 7. Therefore, the VOC derived from model 2 [20] will be also utilized in model 3. Figure 9 and Figure 10 demonstrate the responses of the three models for both driving test. The simulation results gained from model 1 reveal the highest accuracy for the first test. The mean squared error between the measured voltage and the simulated voltage by model 1 is less than 1%. However, it performed the worst in the second test. The good performance of model 1 in the first test ascribed to the fact that the test conditions were nearly matching the standard condition for defining the constant voltage (E0). E0 is equal to the nominal voltage at 20 °C, which is equal to 3.21 V and the initial voltage of the single battery cell is estimated as 3.25 V. When the test second driving test was performed at different circumstances, the outcome was not as good as it in the first case. Figure 10a reveals a relatively large offset error in the response of battery model 1 with a mean square error (MSE) of about 2.24%. Model 2 performed moderately with percentage errors between 1% and 2%. The offset errors between the reference signal and initial voltage value of both battery models 2 and 3 were minor, whereas Equation (3) is employed in both models for the estimation of VOC. The simulation results of model 3 indicate less dynamic response than the other two models. It could not conduct the drastic changes in the battery current input signal.

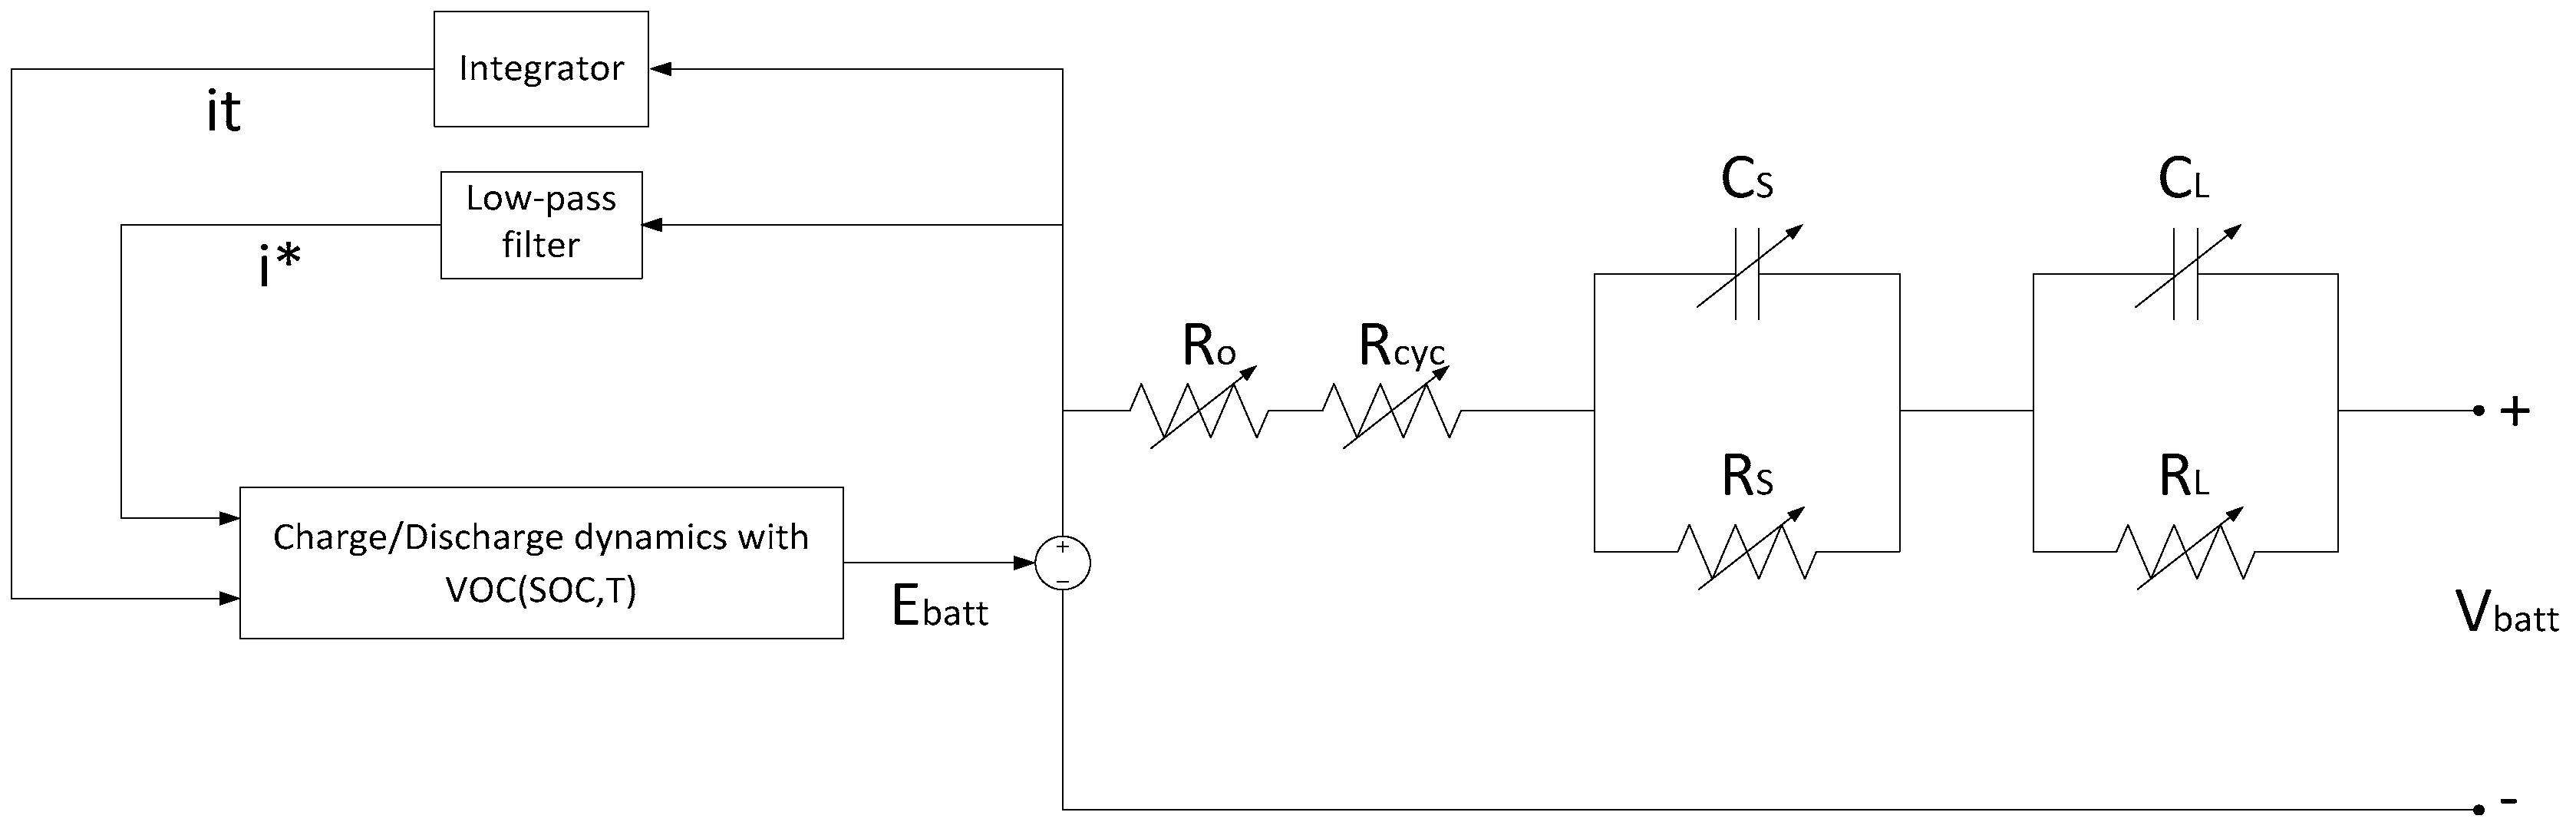
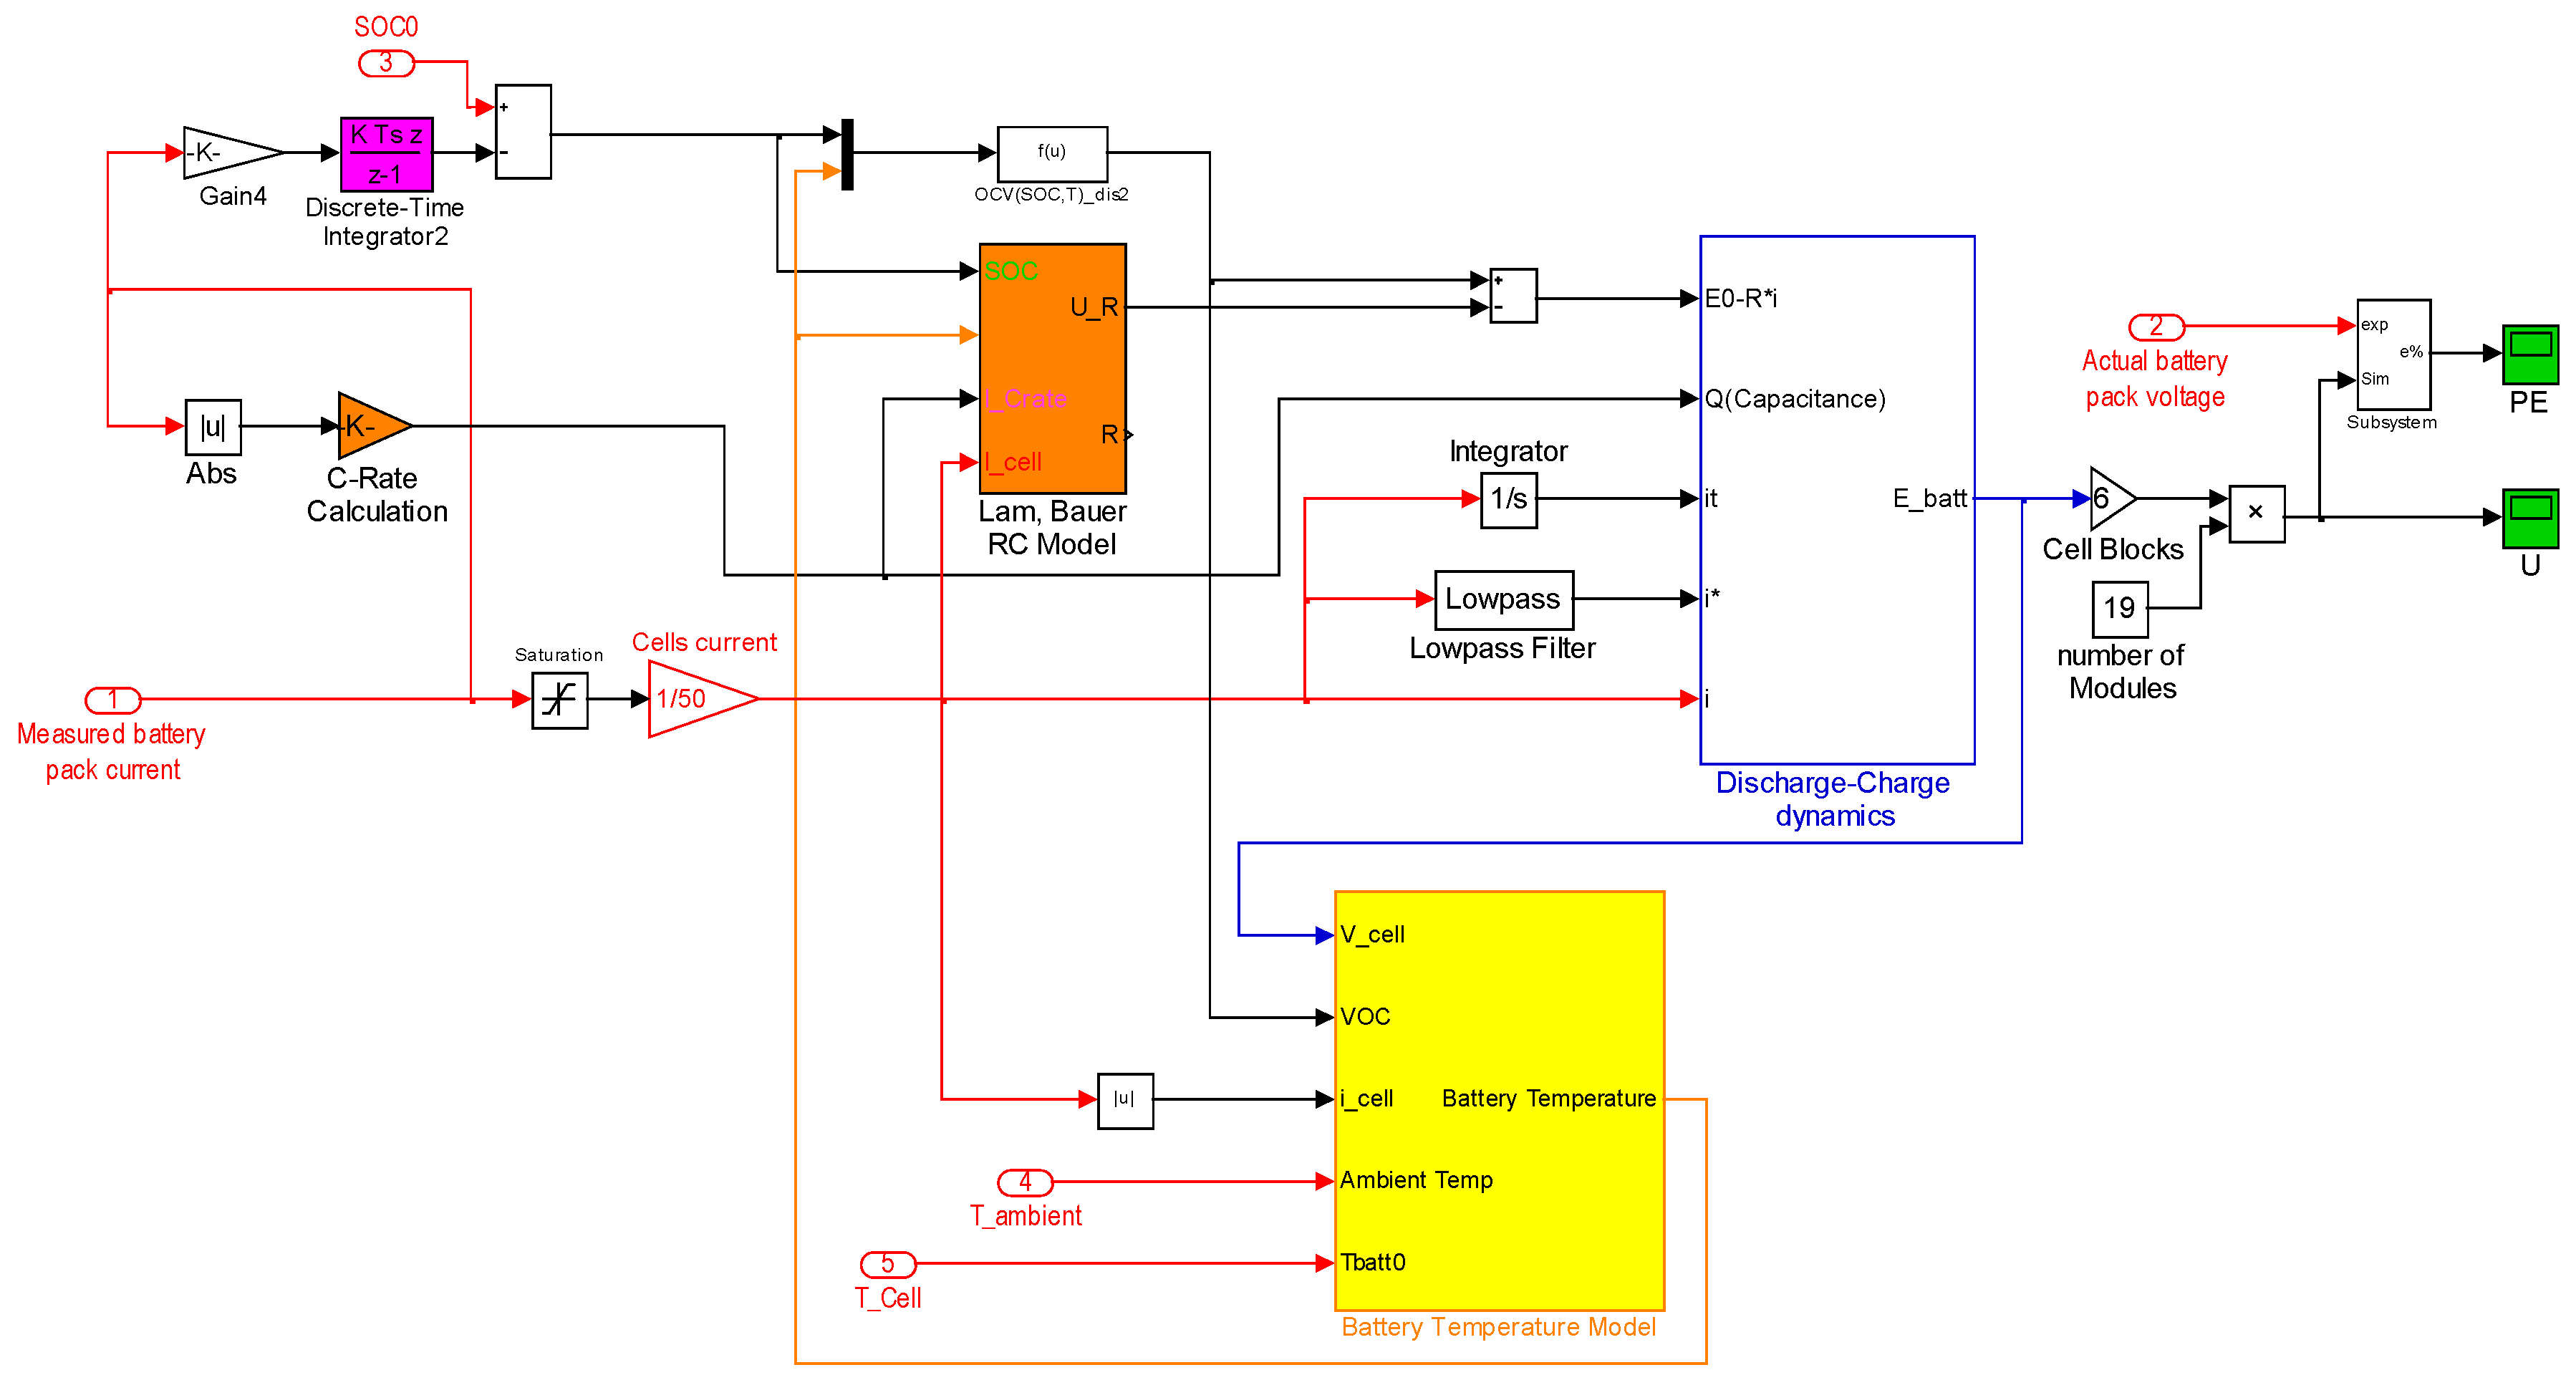
6.3. The Proposed Synthesized Battery Model

It is explicable that each model has some flaws, as determined in Table 2. The simulation results in Figure 9 and Figure 10 prove that even the best performing models need to be further improved. Accordingly, a synthesized model that holds the best qualities of each model has been developed. First, the charge-discharge characteristics of model 1 are considered. Additionally, the discharging part our proposed VOC(SOC,T) is employed instead of constant (E0) value. Then, the highly detailed internal resistance model of battery model 2 in case of discharging, which is represented by Equations (7)–(11), (17)–(19), (21), (27) in Referance [20], is taking the place of the constant internal resistance (R). The capacity fading effect is considered by adding Rcyc from battery model 3 to the internal resistance. The empirical equations in case of discharging are implemented because the charging-discharging hysteresis is properly modeled by model 1. The synthesized model is shown in Figure 11.
In case of discharging, the output voltage reads:
V batt = V OC , discharge ( SOC , T ) ( R O + R cyc + V S + V L )    i K Q Q i t    ( i t + i * ) + A e B    i t
and for charging, the equation expressed as:
V batt = V OC , discharge ( SOC , T ) ( R O + R cyc + V S + V L )    i K Q i t 0.1 Q    i * K Q Q i t    i t + A e B    i t
where
d V S d t = i C S V S R S C S
d V L d t = i C L V L R L C L
The resistances and capacitors values are determined through Equations (14)–(18):
R s ( SOC , ϑ ) = ( c 1 e ( c 2 SOC ) + c 3 + c 4 SOC ) + c 5 ϑ + c 6 SOC ϑ
C s ( SOC , ϑ ) = ( c 7 SOC 3 + c 8 SOC 2 + c 9 SOC + c 10 ) + c 11 SOC ϑ + c 12 ϑ
R l ( SOC , ϑ , I C r a t e ) = ( ( c 13 e ( c 14 SOC ) + c 15 + c 16 SOC ) + c 17 ϑ e ( c 18 SOC ) + c 19 ϑ ) × ( c 20 ( I C r a t e ) c 21 + c 22 )
C l ( SOC , ϑ ) = ( c 23 SOC 6 + c 24 SOC 5 + c 25 SOC 4 + c 26 SOC 3 + c 27 SOC 2 + c 28 SOC + c 29 ) + c 30   e c 31 / ϑ
R o ( SOC , ϑ ) = ( c 32 SOC 4 + c 33 SOC 3 + c 34 SOC 2 + c 35 SOC + c 36 ) c 37 e c 38 / ( ϑ c 39 )
where ϑ is the battery cell temperature in Kelvin (°K) and c1–c39 are constants, which their values are listed in Table 5.
The new model shows a significant improvement in the simulation response, as shown in Figure 12. The mean square error was reduced to only 0.256%. The new model shows also the best result when it employed for simulating the rapid acceleration and deceleration driving test, though it had a small offset error at the beginning of 3.2 V. This error yielded from an absolute voltage error of 0.028 V in proposed VOC model, represented by Equation (8), at the specified SOC and temperature values. The battery models are simulated in MATLAB/Simulink environment. Figure 13 shows the Simulink model for the proposed battery model.

7. Conclusions

A battery is a sophisticated system, which necessitates a detailed model for accurate simulation. Many factors must be considered in the battery model for accurate simulation results. Charging-discharging dynamics, battery internal resistance, and open circuit voltage are the most significant aspects for battery modeling. Temperature is an influential factor for all of these aspects. The difference between the charging and discharging in the OCV curves increases at low temperatures. This phenomenon occurs due to the decrement in battery capacity, which in turn appears as a result of a rise of the internal resistance. Neglecting the effect of temperature will lead to inaccuracy in simulation. Even the slightest errors in the simulation results of the battery cell model, would grow significantly when the model is extended to the complete battery pack. Battery model 1 has two flaws. Firstly, it assumes the initial voltage value to be the nominal battery cell voltage. This assumption led to large offset from the actual value, when the vehicle was tested at about 30 °C. Secondly, it considers a constant internal resistance of the battery, which is in fact a very fluctuating quantity that affects the battery cell current and the voltage response as well. The proposed battery model has compensated for these shortages and it has accurately simulated the battery pack voltage response on the real vehicle.

Author Contributions

Muhammed Alhanouti made the literature review on the current battery models, proposed the synthesized battery model, developing the simulation models, and wrote the paper. Martin Gießler and Thomas Blank designed and performed the battery measurements, and they helped in editing the paper content. Frank Gauterin supervised the work of this paper and approved the results

Conflicts of Interest

The authors declare no conflict of interest.

Appendix

Appendix A.1. Nomenclature

Table A1. Battery models parameters.
Parameter (Unit)SymbolValue
Constant voltage (V)E03.21 [23]
Constant internal resistance (Ω)R0.0833
Polarization constant (V/(Ah)) or polarization resistance (Ω)K0.0119 [23]
Battery capacity (Ah)QVariable
Actual battery charge (Ah)itVariable
Exponential zone amplitude (V)A0.2711 [23]
Exponential zone time constant inverse (Ah)−1B152.130 [23]
Battery current (A)iVariable
Filtered current (A)i*Variable
Voltage change due to electrolyte electrons transfer formationΔVCheVariable
the effective voltage gradientdVChe/dT0.0016 [1]
Constant property of electrolyteCChe0.07 [1]
Constant property of electrolyteCChe10.001 [1]
Constant property of electrolyteb0.0012 [1]
Constant property of electrolytew0.012 [1]
Voltage change due to electrode film formationΔEVariable
voltage gradientdVr/dT0.00003 [1]
Constant propertyCE10.00011 [1]
Battery module surface area (m2)A0.283954
Battery cell mass (kg)m0.04 [23]
Battery module mass (kg)M12
Specific heat capacity (J·kg−1·K−1)Cp1360 [27]
Stefane-Boltzmann constant (W·m−2·K4)σ5.67 × 10⁻⁸
Emissivity of heatε0.95
Natural heat convection constant (W·m−2·K−1)h4

Appendix A.2. Driving Tests

Figure A1. The measured data of the circular drive test.
Energies 09 00563 g014
Figure A2. The measured data of the rapid acceleration and deceleration drive test.
Energies 09 00563 g015

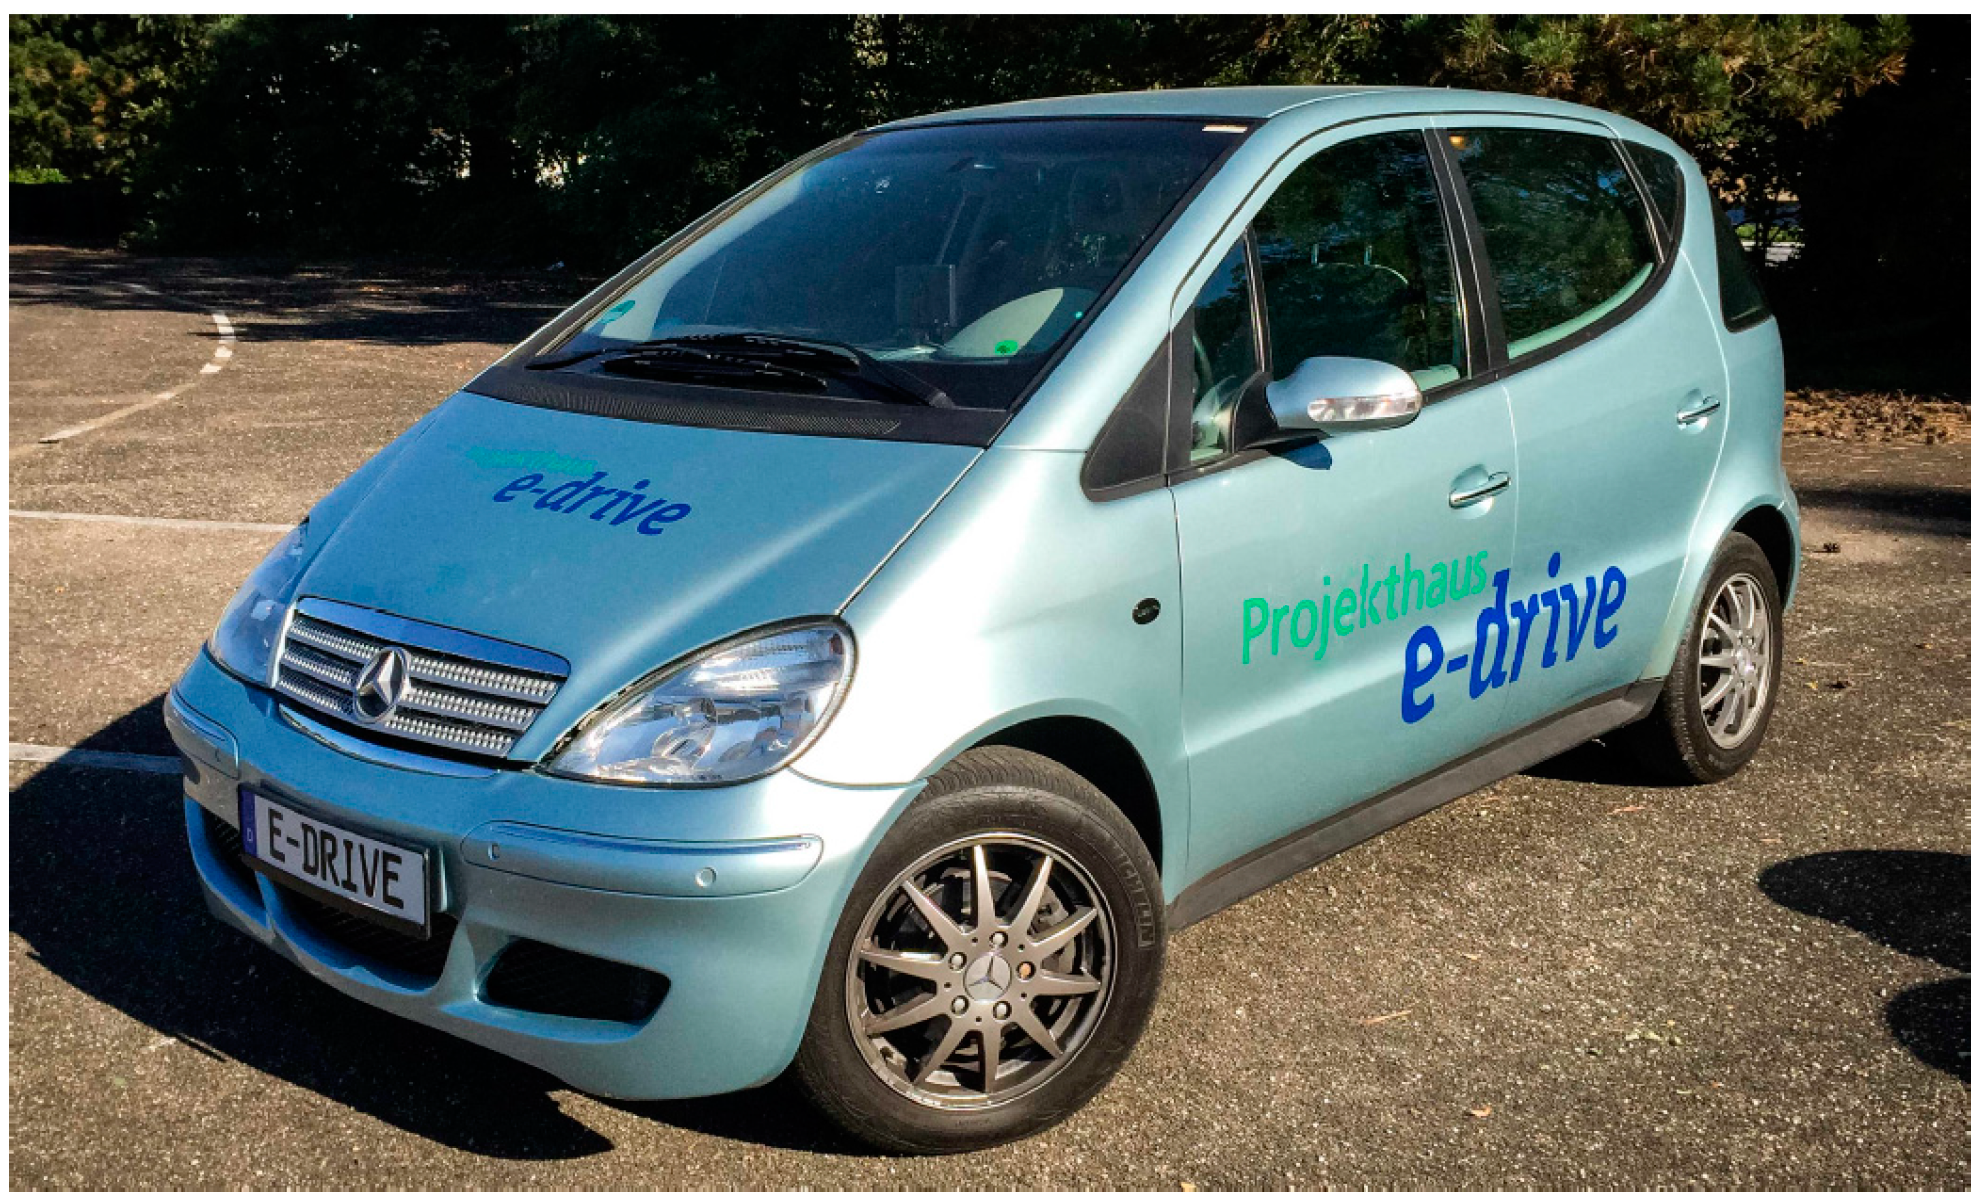
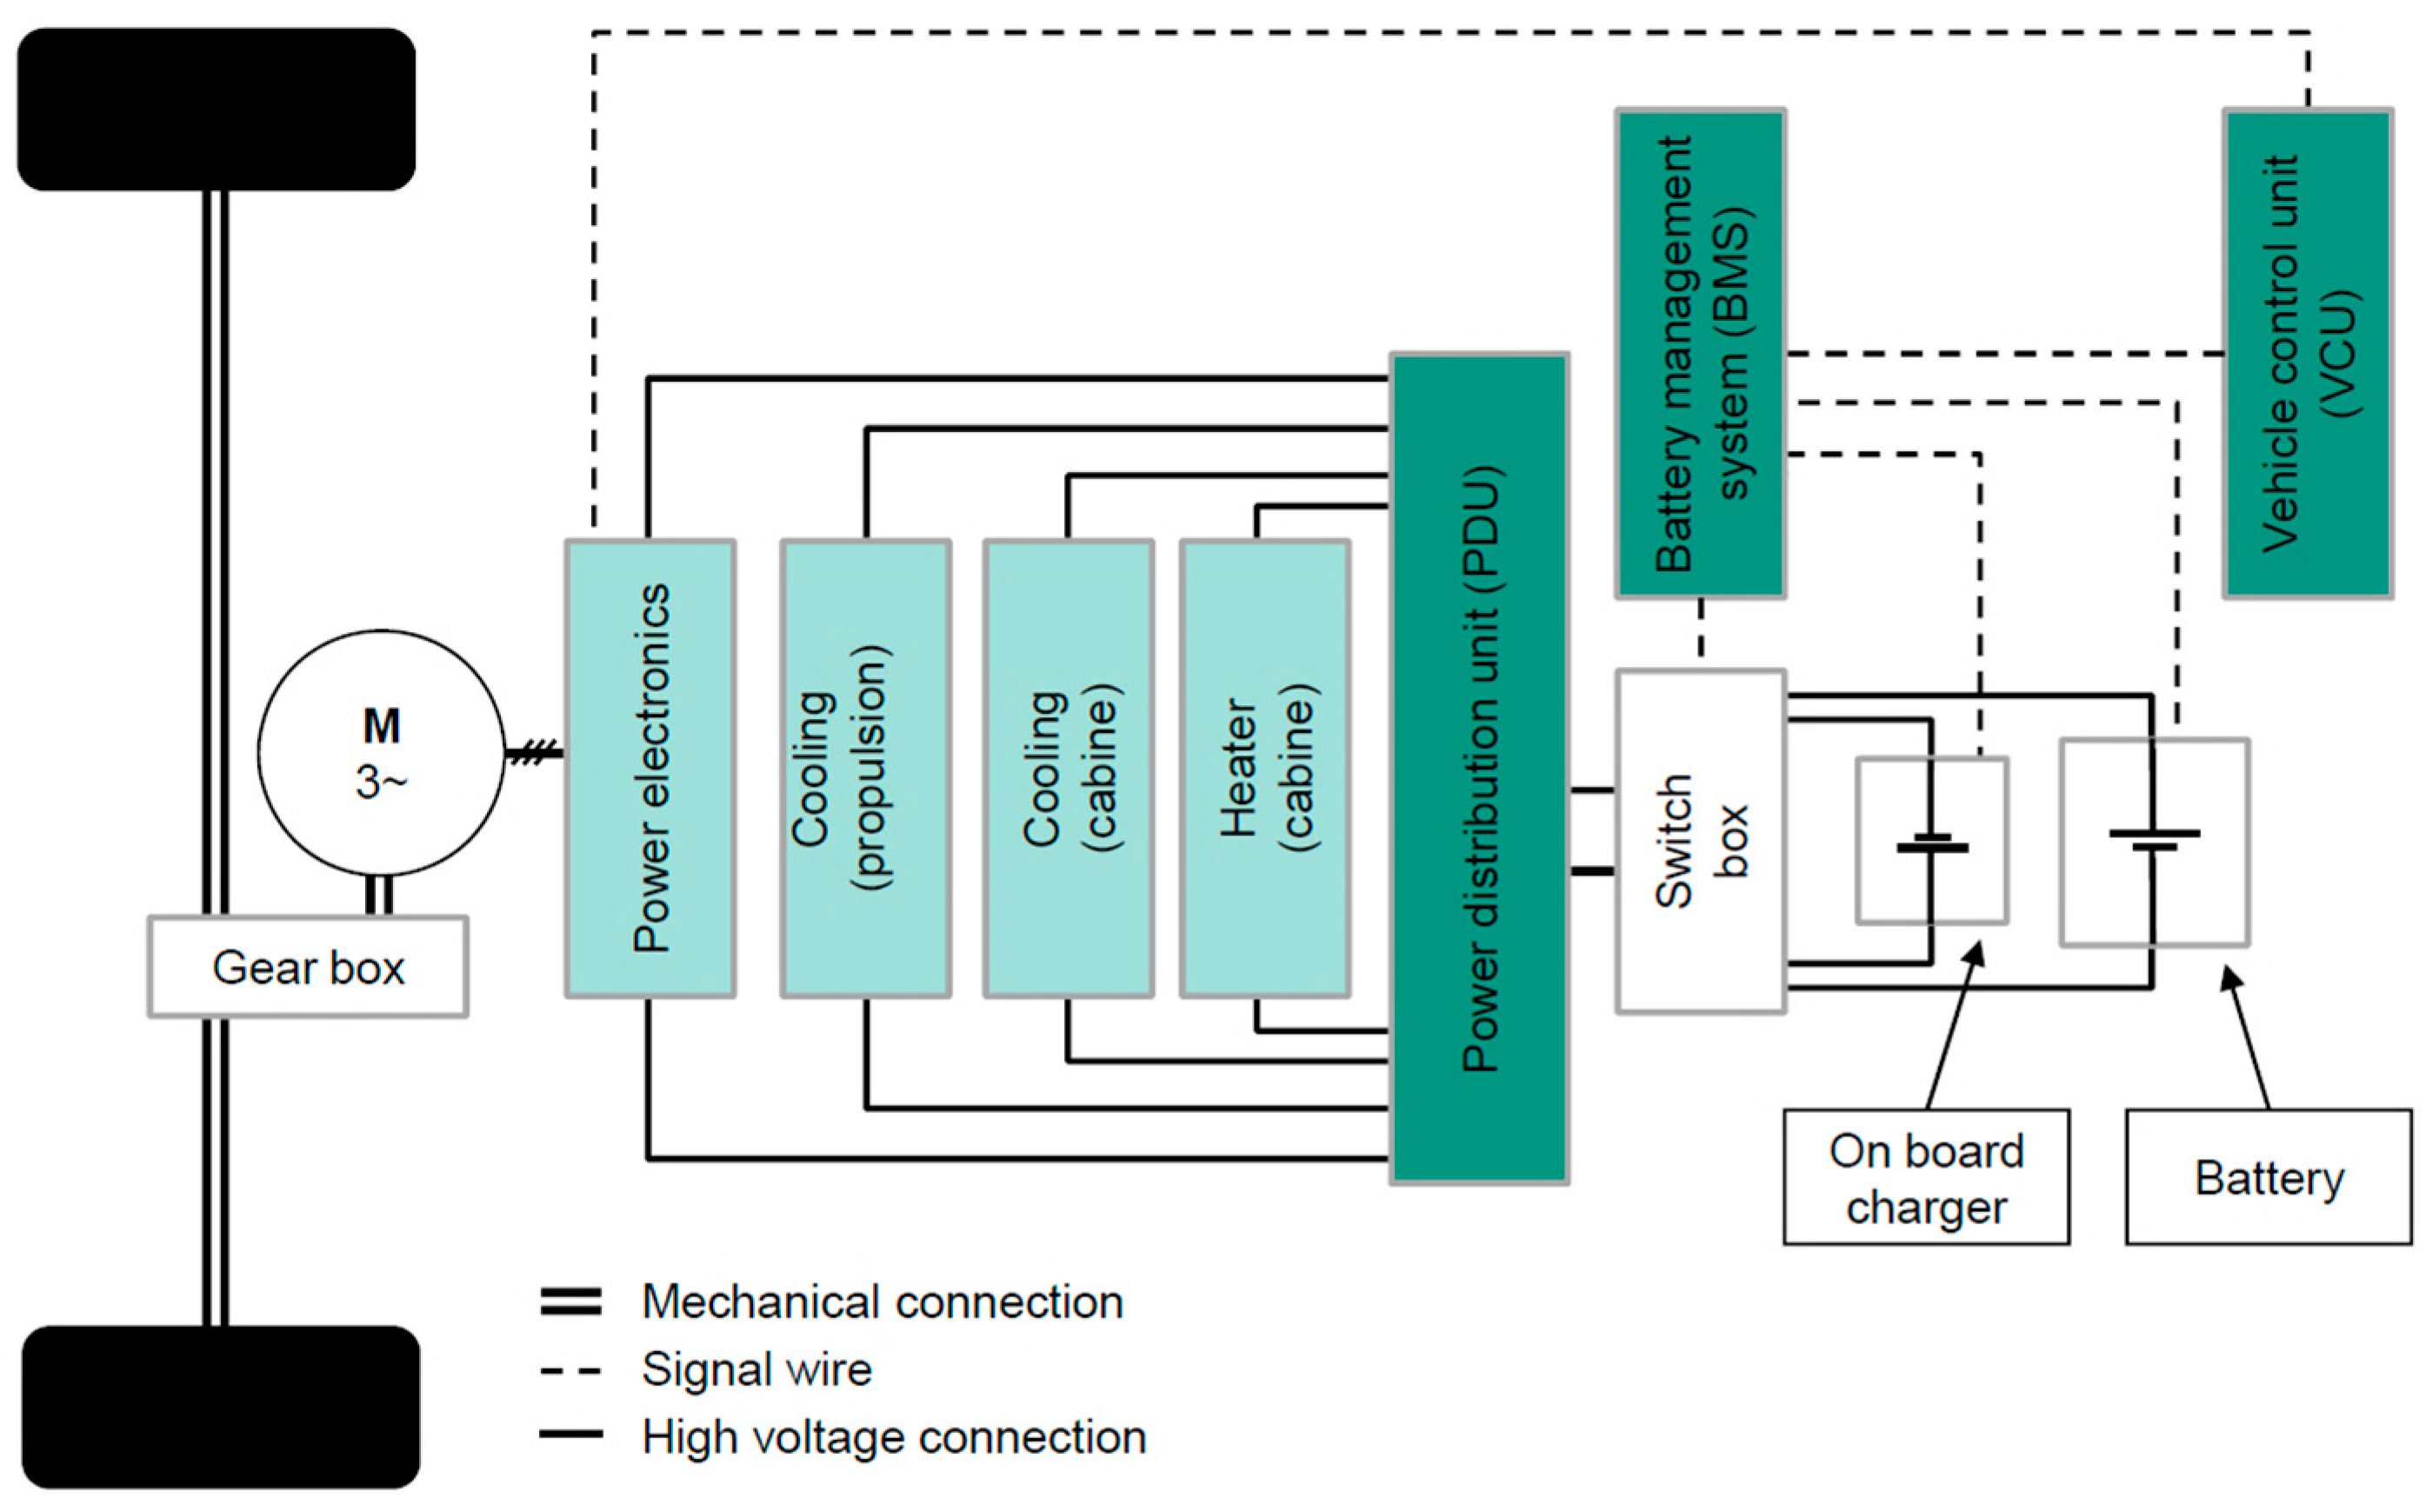
Appendix A.3. The Vehicle under the Test

An electric hydrogen front wheel passenger car (Figure A3) was modified by the institute for “FAhrzeug-SystemTechnik” (FAST) of the Karlsruhe Institute of Technology to a battery electric vehicle (BEV), [30]. A battery pack was installed in the vehicle. This vehicle is used for research in different automotive engineering and e-mobility related projects. The propulsion systems comprises an induction motor with a single gear transmission. The motor specifications are listed in Table A2.
Figure A3. Vehicle under test.
Energies 09 00563 g016
Table A2. Technical data of electric motor.
ParameterValue
Rated Power, PN45 kW
Peak Power, Pmax68 kW
Peak Torque, Tmax210 N·m
Rated Speed, nN3000 rpm
The motor shown in Figure A4 is powered by the AC current, delivered from the power electronics that converts the DC current supplied by the battery. As the driver presses the accelerator pedal, a corresponding “torque demand” signal is converted by the vehicle control unit (VCU) to an appropriate signal for the motor control unit (power electronics), which in turn transforms it into a current frequency signal. The motor control unit (MCU) is incorporated with a thermal derating system in order to limit the torque demand received by the power electronics and to prevent any critical operating conditions for the motor. The assigned powertrain can accelerate the vehicle to a maximum speed of 120 km/h.
Figure A4. The basic drive train topology of the Mercedes A-Class research vehicle [30].
Energies 09 00563 g017

References

  1. Wijewardana, S.; Vepa, R.; Shaheed, M.H. Dynamic battery cell model and state of charge estimation. J. Power Sources 2016, 308, 109–120. [Google Scholar] [CrossRef]
  2. Doppebattery Model 2auer, M. Hybrid and Electric Vehicles—Lecture Notes; ETI-HEV, Karlsruhe Institute of Technology: Karlsruhe, Germany, 2014.
  3. Ivers-Tiffee, E. Batteries and Fuel Cells—Lecture Notes; IWE, Karlsruhe Institute of Technology: Karlsruhe, Germany, 2012. [Google Scholar]
  4. Illig, J. Physically Based Impedance Modelling of Lithium-Ion Cells. Ph.D. Thesis, Karlsruhe Institute of Technology, Karlsruhe, Germany, 2014. [Google Scholar]
  5. Tremblay, O.; Dessaint, L.-A. Experimental validation of a battery dynamic model for EV applications. World Electr. Veh. J. 2009, 3, 1–10. [Google Scholar]
  6. Padhi, A.K.; Nanjundaswamy, K.S.; Goodenough, J.B.D. Phospho-olivines as positive-electrode materials for rechargeable lithium batteries. J. Electrochem. Soc. 1997, 144, 1188–1194. [Google Scholar] [CrossRef]
  7. Valence Technology. U-Charge® XP Rev 2 User Manual; Valence Technology, Inc.: Austin, TX, USA, 2011. [Google Scholar]
  8. Lin, N.; Ci, S.; Li, H. An enhanced circuit-based battery model with considerations of temperature effect. In Proceedings of the 2014 IEEE Energy Conversion Congress and Exposition (ECCE), Pittsburgh, PA, USA, 14–18 September 2014; pp. 3985–3989.
  9. Doyle, M.; Fuller, T.F.; Newman, J. Modeling of galvanostatic charge and discharge of the lithium/polymer/insertion cell. J. Electrochem. Soc. 1993, 140, 1526–1533. [Google Scholar] [CrossRef]
  10. Dees, D.W.; Battaglia, V.S.; Bélanger, A. Electrochemical modeling of lithium polymer batteries. J. Power Sources 2002, 110, 310–320. [Google Scholar] [CrossRef]
  11. He, H.; Xiong, R.; Guo, H.; Li, S. Comparison study on the battery models used for the energy management of batteries in electric vehicles. Energy Convers. Manag. 2012, 64, 113–121. [Google Scholar] [CrossRef]
  12. Hu, X.; Li, S.; Peng, H. A comparative study of equivalent circuit models for Li-ion batteries. J. Power Sources 2012, 198, 359–367. [Google Scholar] [CrossRef]
  13. He, H.; Xiong, R.; Fan, J. Evaluation of lithium-ion battery equivalent circuit models for state of charge estimation by an experimental approach. Energies 2011, 4, 582–598. [Google Scholar] [CrossRef]
  14. Hussein, A.A.; Batarseh, I. An overview of generic battery models. In Proceedings of the 2011 IEEE Power and Energy Society General Meeting, San Diego, CA, USA, 24–29 July 2011; pp. 1–6.
  15. Kroeze, R.C.; Krein, P.T. Electrical battery model for use in dynamic electric vehicle simulations. In Proceedings of the 2008 IEEE Power Electronics Specialists Conference, Rhodes, Greece, 15–19 June 2008; pp. 1336–1342.
  16. Liu, X.; Ma, Y.; Ying, Z. Research of SOC estimation for lithium-ion battery of electric vehicle based on AMEsim-simulink co-simulation. In Proceedings of the 32nd Chinese Control Conference (CCC), Xi’an, China, 26–28 July 2013; pp. 7680–7685.
  17. Szumanowski, A.; Chang, Y. Battery management system based on battery nonlinear dynamics modeling. IEEE Trans. Veh. Technol. 2008, 57, 1425–1432. [Google Scholar] [CrossRef]
  18. Zhang, C.; Jiang, J.; Zhang, W.; Sharkh, S.M. Estimation of state of charge of lithium-ion batteries used in HEV using robust extended Kalman filtering. Energies 2012, 5, 1098–1115. [Google Scholar] [CrossRef]
  19. Watrin, N.; Roche, R.; Ostermann, H.; Blunier, B.; Miraoui, A. Multiphysical lithium-based battery model for use in state-of-charge determination. IEEE Trans. Veh. Technol. 2012, 61, 3420–3429. [Google Scholar] [CrossRef]
  20. Lam, L.; Bauer, P.; Kelder, E. A practical circuit-based model for Li-ion battery cells in electric vehicle applications. In Proceedings of the 2011 IEEE 33rd International Telecommunications Energy Conference (INTELEC), Amsterdam, The Netherlands, 9–13 October 2011; pp. 1–9.
  21. Tremblay, O.; Dessaint, L.A.; Dekkiche, A.I. A generic battery model for the dynamic simulation of hybrid electric vehicles. In Proceedings of the 2007 IEEE Vehicle Power and Propulsion Conference, Arlington, TX, USA, 9–12 September 2007; pp. 284–289.
  22. Shepherd, C.M. Design of primary and secondary cells II. An equation describing battery discharge. J. Electrochem. Soc. 1965, 112, 657–664. [Google Scholar] [CrossRef]
  23. Saw, L.H.; Somasundaram, K.; Ye, Y.; Tay, A.A.O. Electro-thermal analysis of Lithium Iron Phosphate battery for electric vehicles. J. Power Sources 2014, 249, 231–238. [Google Scholar] [CrossRef]
  24. Tan, Y.K.; Mao, J.C.; Tseng, K.G. Modelling of battery temperature effect on electrical characteristics of Li-ion battery in hybrid electric vehicle. In Proceedings of the 2011 IEEE Ninth International Conference on Power Electronics and Drive Systems (PEDS), Singapore, Singapore, 5–8 December 2011.
  25. Pesaran, A.A. Battery thermal models for hybrid vehicle simulations. J. Power Sources 2002, 110, 377–382. [Google Scholar] [CrossRef]
  26. Kim, Y.; Siegel, J.B.; Stefanopoulou, A.G. A computationally efficient thermal model of cylindrical battery cells for the estimation of radially distributed temperatures. In Proceedings of the 2013 American Control Conference (ACC), Washington, DC, USA, 17–19 June 2013; pp. 698–703.
  27. Rad, M.S.; Danilov, D.L.; Baghalha, M.; Kazemeini, M.; Notten, P.H. Thermal modeling of cylindrical LiFeMgPO4 Batteries. J. Mod. Phys. 2013, 4, 1–7. [Google Scholar] [CrossRef]
  28. Fan, L.; Khodadadi, J.M.; Pesaran, A.A. A parametric study on thermal management of an air-cooled lithium-ion battery module for plug-in hybrid electric vehicles. J. Power Sources 2013, 238, 301–312. [Google Scholar] [CrossRef]
  29. Sun, Y. Construction and Validation of a Thermal FEM-Model of an Automobile Battery. Master’s Thesis, Karlsruhe Institute of Technology, Karlsruhe, Germany, 2011. [Google Scholar]
  30. Gießler, M.; Fritz, A.; Paul, J.; Sander, O.; Gauterin, F.; Müller-Glaser, K.D. Converted vehicle for battery electric drive: Aspects on the design of the software-driven vehicle control unit. In Proceedings of the 2nd International Energy Efficient Vehicle Conference (EEVC), Dresden, Germany, 18–19 June 2012.
  31. Blank, T.; Lipps, C.; Ott, W.; Hoffmann, P.; Weber, M. Influence of environmental conditions on the sensing accuracy of Li-Ion battery management systems with passive charge balancing. In Proceedings of the 17th European Conference on Power Electronics and Applications, Geneva, Switzerland, 8–10 September 2015; pp. 1–9.
Figure 1. Typical discharge characteristic curve of Li-ion battery [4,5].
Energies 09 00563 g001
Figure 2. Tremblay and Dessaint battery discharge model.
Energies 09 00563 g002
Figure 3. Lam and Bauer battery circuit model.
Energies 09 00563 g003
Figure 4. Wijewardana battery circuit model.
Energies 09 00563 g004
Figure 5. Charge and discharge OCV curves over SOC.
Energies 09 00563 g005
Figure 6. CAN bus measurements: (a) Battery pack current for the circular driving test; (b) Battery pack voltage for the circular driving test; (c) Battery pack current for the rapid acceleration and deceleration driving test; (d) Battery pack voltage for the rapid acceleration and deceleration driving test.
Energies 09 00563 g006
Figure 7. Comparing the Voc model with measured experimental results.
Energies 09 00563 g007
Figure 8. The new Voc model and measured experimental data: (a) T = 10 °C; (b) T = 20 °C; (c) T = 40 °C.
Energies 09 00563 g008
Figure 9. Battery simulation models and reference voltage signal for circular driving test: (a) Battery model 1 response; (b) Mean square error of battery model 1; (c) Battery model 2 response; (d) Mean square error of battery model 2; (e) Battery model 3 response (f) Mean square error in battery model 3.
Energies 09 00563 g009
Figure 10. Battery simulation models and reference voltage signal for rapid acceleration and deceleration driving test: (a) Battery model 1 response; (b) Mean square error of battery model 1; (c) Battery model 2 response; (d) Mean square error of battery model 2; (e) Battery model 3 response (f) Mean square error in battery model 3.
Energies 09 00563 g010aEnergies 09 00563 g010b
Figure 11. The proposed synthesized battery model.
Energies 09 00563 g011
Figure 12. The proposed synthesized battery model and reference voltage signal: (a) Proposed model response for the circular driving test; (b) Error of proposed model voltage for the circular driving test; (c) Proposed model response for the rapid acceleration and deceleration driving test; (d) Error of proposed model voltage for the rapid acceleration and deceleration driving test.
Energies 09 00563 g012
Figure 13. The proposed synthesized battery simulation model.
Energies 09 00563 g013
Table 1. Technical data of LiFeMgPO4 Battery [7].
Parameter (Unit)Value
Nominal Module Voltage (V)19.2
Nominal Module Capacity (Ah)69
Max Continuous Load Current (A)120
Peak Current for 30 s (A)200
Table 2. Comparison between the battery models.
FeatureBattery Model 1Battery Model 2Battery Model 3
Charge-Discharge hysteresis++Considered in the output voltage+Considered in the internal resistance (R) equations-Charge-discharge
Open circuit voltage-Constant value for E0+VOC(SOC)+VOC(SOC)
Internal resistance (R)-Constant value++R(SOC,T,C-rate)+R(SOC,T)
Temperature influence-Not considered+Considered in the internal resistance model+Considered as potential correction terms
Capacity fading-Not considered+Considered in the battery’s used capacity estimation+Considered in the battery’s internal resistance (R) estimation
Total Assessment 2 6 4
Table 3. VOC parameter values.
ConstantValueConstantValue
a1−1.166b1−0.9135
a2−35b2−35
a33.344b33.484
a40.1102b40.1102
a5−0.1718b5−0.1718
a6−2 × 10⁻³b6−8 × 10⁻³
dVOC,d/dT0.00125dVOC,c/dT0.00069
Table 4. Accuracy of the proposed VOC model.
Temperature °CMSE in Discharge Model %MSE in Charge Model %
100.52320.8914
200.53200.5719
400.57510.4522
Table 5. Constants values of Equations (14)–(18).
ConstantValueConstantValueConstantValueConstantValue
c11.080 × 10−2c11−6.580c21−6.919 × 10⁻¹c31−2.398 × 10³
c2−11.03c1212.11c222.902 × 10−1c321.298 × 10−1
c31.827 × 10−2c132.950 × 10−1c232.130 × 106c33−2.892 × 10⁻¹
c4−6.462 × 10⁻³c14−20.00c24−6.007 × 10⁶c342.273 × 10−1
c5−3.697 × 10⁻⁴c154.722 × 10−2c256.271 × 106c35−7.216 × 10⁻²
c62.225 × 10−4c16−2.420 × 10⁻²c26−2.958 × 10⁶c368.980 × 10−2
c71.697 × 102c176.718 × 10−3c275.998 × 105c377.613 × 10−1
c8−1.007 × 10³c18−20.00c28−3.102 × 10⁴c3810.14
c91.408 × 103c19−5.967 × 10⁻⁴c292.232 × 103c392.608 × 102
c103.897 × 102c206.993 × 10−1c303.128 × 103

