1. Introduction
The current grid has been rightly described as a “product of rapid urbanisation” [
1], one plagued with numerous challenges from utilities and consumers perspectives alike. However, as the wind of transformation continues to blow across the energy landscape, monitoring and control have been identified as basic capabilities missing in the legacy system. Smart grids cannot solve all the problems associated with energy systems, though they are envisioned to meet many of them and uncover new possibilities. To this end, industry players are leveraging developments in information and communication technology (ICT) to drive the needed modernisation. In particular, availability of reliable two-way communication systems will form the foundation for other advanced services and applications. Hence, ICT is a key enabler as manifested in advanced metering infrastructure (AMI) implementation [
2].
From a utility’s perspective, in addition to smart metering, one of the promises of smart grids is the possibility of achieving optimal strategies for deploying generating assets to meet long-term business objectives. According to [
3], some tangible deliverables from smart grid initiatives include real-time pricing, demand response (DR), electric vehicle charging control, integration of distributed energy resources (DER), consumer’s access to consumption information and end-to-end information security [
4]. It should be pointed out, however, that only smart metering and DR are considered in this paper.
Neighbourhood area networks (NANs) are comprised of several home area networks (HANs) connected to a utility’s network through a communication link. High-capacity media such as fibre optics are either over-provisioned or economically unviable for relatively low-data communication environments such as NANs. Like other control networks, automation in this case involves communication of control signals among grid devices to produce tangible outcomes such as automatic remote disconnection, transmission of alarms, outage notification and remote maintenance. Hence, loss or prolonged delay of control signals can have an adverse effect on the performance of the AMI.
In terms of ubiquity, wireless local area networks (WLANs) are the closest rival to power line networks, given that they are both prevalent in most homes. Wireless Fidelity (Wi-Fi) is known for its mobility and ease of deployment. However, there are regions within the network where wireless signals are either non-existent or too weak to reliably carry out communication such as in underground structures and buildings with metallic walls. To fill that gap, a pervasive channel is required; hence, power lines appear a natural fit for AMI applications and by extension, many other smart grid services. The model of of AMI presented in this paper investigates the overall network performance using Wi-Fi, broadband power line communications (BPLC) and narrowband PLC (NPLC) as the last mile between the data collector (DC) and smart meters.
Considering the number of houses involved in smart grids and potential impact of failures, rather than isolated studies of physical (PHY) or media access control (MAC) layer performance, it is important to assess the performance of a wide range of communication systems. Given that most existing communication technologies were developed for conventional data networks, it is important to understand how much tweaking is required to achieve optimal network performance in line with defined service objectives. For such mission-critical services as power delivery, it is expedient to evaluate the performance of a complete communication system to enable engineers achieve optimal designs. The main contribution of this paper is to propose an efficient way to exploit BPLC as a backhaul for AMI applications without compromising service quality. The results are within the performance thresholds implemented in [
2].
The rest of this paper is organised as follows. Motivation and related work are discussed in
Section 2, whereas
Section 3 describes our model of AMI application over power lines.
Section 4 presents the simulation environment used while our results are discussed in
Section 5. Finally, the key conclusions are highlighted in
Section 6.
2. Motivation and Related Work
AMI facilitates measurement and control of energy distribution through a bi-directional communication between the smart meters, smart meter data management (SMDM) and other servers [
5]. As with conventional broadband services, last mile and backhaul account for a substantial part of cost of providing connectivity for AMI services. This is because, while a single wide area network (WAN) or long haul serves all customers in the area, last mile distributes connectivity to individual smart meters. According to [
2], examples of services supported by the AMI include smart metering, demand response (DR), remote disconnection/reconnection, tamper notification (smart meter), load control, meter firmware upgrade and remote meter diagnosis. In the past, some BPLC technologies were tested for smart metering and a few were deployed for commercial internet access [
6]. Prior to now, NPLC was generally preferred in the industry (G3-PLC, PRIME) and in terms of standardisation (IEEE 1901.2 and ITU-T Ghnem) [
7]. This is further reinforced by development of various NPLC technologies [
8]. Certainly, there are good reasons to choose NPLC ahead of BPLC in certain situations. A key reason is that it offers long transmission range and that the transceivers can be less expensive.
Furthermore, many smart grid applications require low data rate; hence, it is understandable that NPLC dominated previous discussions [
9,
10,
11,
12,
13,
14], and funded projects such as [
15,
16,
17,
18,
19] in relation to smart grids and their applications in low voltage (LV) regions. Apart from electromagnetic compatibility (EMC) issues in PLC generally [
20,
21], other major arguments against BPLC have been that 2–30 MHz cannot traverse an medium voltage/low voltage (MV/LV) step-down transformer without external bypass coupling circuit and that it suffers from high attenuation with distance [
6]. Even with a bypass coupler, theoretical studies [
22] and field trials results have shown that the three-phase distribution transformer exhibits asymmetric transfer function between LV–MV and MV–LV paths [
23]. A common inference from both studies is that such an asymmetric behaviour could affect data rate regardless of whether NPLC or BPLC is employed.
Results from recent studies [
24] and success stories emerging from various pilots suggest that BPLC still holds some potential, yet untapped [
15,
25,
26,
27]. Selection of a PLC technology needs to consider physical characteristics of the line and network topology as they impose certain performance constraints on PLC systems. In addition, characteristics of the power lines in each segment (MV, LV), cable design, orientation and isolation of LV loads also affect signal propagation [
6]. For example, noise-generating load are mostly found in LV networks and overhead lines favour PLC more than those underground do. Equipped with power network physical characteristics, part of the design goal should therefore be minimisation of unwanted signals.
Generally, the use of PLC would be partly determined by the local or regional grid topology. For example, unlike the US where there are typically less than ten households per transformer, in Europe, the number of power meters per the MV/LV transformer is within 50–300 with average distance of 465 m from MV/LV transformer to consumer meters [
14]. Hence, strictly from business perspective, PLC is more amenable to the European market. Although, this geometric distribution alone does not in any way limit the market to Europe, combined with the strict spectrum regulation, they have jointly encouraged the widespread adoption of PLC for smart metering in Europe in contrast with other regions such as North America, Australia and Japan with more flexible spectrum regulation [
8]. The ultimate choice of communication systems in a region will be based on numerous factors including technical considerations and economic viability.
Attenuation in BPLC is widely acknowledged as a major concern, given that it increases with distance and frequency. However, feedback from some projects in this area [
28] have shown that raw data rate of several tens of Mbps are achievable for links up to 500 m. This throughput can potentially support smart metering applications based on European LV network topology [
14]. DR is another AMI application used by utilities to efficiently match power demand with generation. By dynamically changing the price of electricity during peak demand, utilities induce lower energy consumption in consumers’ homes and facilities. To do this, energy providers offer some incentives to consumers to reduce their usage or shift loads to less critical periods. Upon receiving the price or rebate information, the consumer decides to either reduce overall consumption or shift some (or all) loads. Different aspects of DR operations are well documented in [
29,
30,
31,
32]. One key feature of DR is that it provides an alternative to extra power generation at peak demand making DR a valuable application, one that is mutually beneficial to providers and consumers.
To extend these services to the homes, other wireline and wireless technologies require expensive or dedicated infrastructure to deliver data rates at comparable distances with BPLC. Considered individually, BPLC systems come at higher cost than NPLC, but compared with other options for backhaul connectivity such as digital subscriber line (DSL), fibre optics, Wi-Fi, very small aperture terminal (VSAT) and worldwide interoperability for microwave access (WiMAX), the benefits of large throughput and low cost of ownership offered by BPLC clearly outweighs its setup cost. To achieve similar performance, WiFi needs several repeaters; WiMAX needs a base transceiver station (BTS), fibre optic links need expensive cables and complex work authorisations from government agencies. Some of these options also require recurring maintenance costs.
Next generation grid also provides services such as mobile workforce management. This implies that, in addition to AMI applications, the backhaul link will also support traffic originating from a mobile workforce. Hence, the backhaul must be able to accommodate medium and long-term expansion as the volume of network traffic grows. These expectations raise key questions in terms of capacity provisioning and performance of backhaul. Selecting from the array of existing communication systems, key questions are:
What extent of network changes are required to deliver acceptable service quality to AMI applications?
Considering the crucial role of backhaul in the end-to-end connectivity, what are cost-effective options feasible without compromising service objectives?
Addressing these questions will not only help to avoid bottleneck at the backhaul but also to design a communication network that is optimal, scalable and fit for purpose at minimal cost. In reality, many providers (for example in the UK) rely on data service (GPRS) from telecom companies for backhaul/last mile, the challenges with this include:
Third party dependency: failures within a telecom providers’ networks extend to energy providers’ networks; this can potentially affect electricity grid operation. Therefore, it provides little resilience against natural or man-made disruptions in telecom networks.
Non-transparent quality-of-service (QoS): without visibility into a network of Internet service provider (ISP), energy providers do not have control over traffic engineering and prioritisation based on business and operational dynamics.
Security and privacy issues: with fine-grain consumption data analysed over a period, a consumer could be adequately profiled to reveal patterns such as occupancy, life style, daily or weekly routine. These could lead to breach of personal security and privacy.
Recurrent fees: aggregated over several thousands or millions of homes, the cost of data transfer could be enormous.
The use of BPLC as backhaul intrinsically provides solutions to the concerns enumerated above. In a bid to address some of the issues, another approach could be to deploy BPLC as backup links for the purpose of high availability. These developments make BPLC an interesting area for further investigation.
3. System Model
This section describes the AMI models employed in this paper as illustrated in
Figure 1 and
Figure 2. AMI applies to electricity, gas and water metering [
33]. The principle is generally the same, except for gas and water in which flow meters are battery-powered. However, this paper focuses on AMI for electricity. In all cases, the meters are equipped with advanced solid-state components that collect and dispatch time-based data; hence, bidirectional communication is vital. Notwithstanding the popularity of wireless communications, PLC is the only communication technology that naturally aligns with topology of power distribution network. Unlike other media such as Wi-Fi, Ethernet or fibre optic cables, PLC provides connectivity directly to devices without the need for dedicated wirings. However, since the power line infrastructure was built primarily to deliver electricity, data signals experience various forms of distortions and losses as they propagate through it. For instance, the sudden switching "OFF" and "ON" of electrical loads by users in NANs change the electrical configurations, characteristics and noise level in the channel.
The IEEE 2030 reference architecture [
34], which eventually evolved into the smart grid interoperability reference model (SGIRM), consists of two broad components: (i) the smart grid architectural perspectives (IAPs) and (ii) the characteristics of the data that flows between entities within these perspectives. From design and implementation points of view, the IAP component provides perspectives from power systems and information and communications technology (ICT) domains. In order to address the uniqueness of each area and promote interoperability among the system components, three IAPs were subsequently defined as Power System IAP (PS-IAP), Information Technology IAP (IT-IAP) and Communications Technology IAP (CT-IAP). While the (PS-IAP) focuses on generation, delivery and consumption of power, the (IT-IAP) is mainly concerned with data management and process control. Lastly, the CT-IAP focuses on connectivity, providing guidelines for communication networks, protocols, media and performance. The CT-IAP is of most interest in this paper. In terms of design, the CT-IAP specifies three types of networks summarized as follows [
17]: (i) the
x-area network/energy service interfaces (ESIs), comprising customer-side networks such as HANs, building area networks (BANs), industrial area networks (IANs) for connecting intelligent electronic devices (IEDs) in the consumer domains to allow energy statuses to be monitored and remotely controlled; (ii) the NANs, to interconnect energy service interface (ESI) and smart meters to utility operations/control centre and (iii) the backhaul, for interconnecting utility network to other networks in the distribution and consumer domains. These CT-IAP specifications are mapped into the logical networks presented in
Figure 1 and
Figure 2.
3.1. Smart Metering over Power Lines
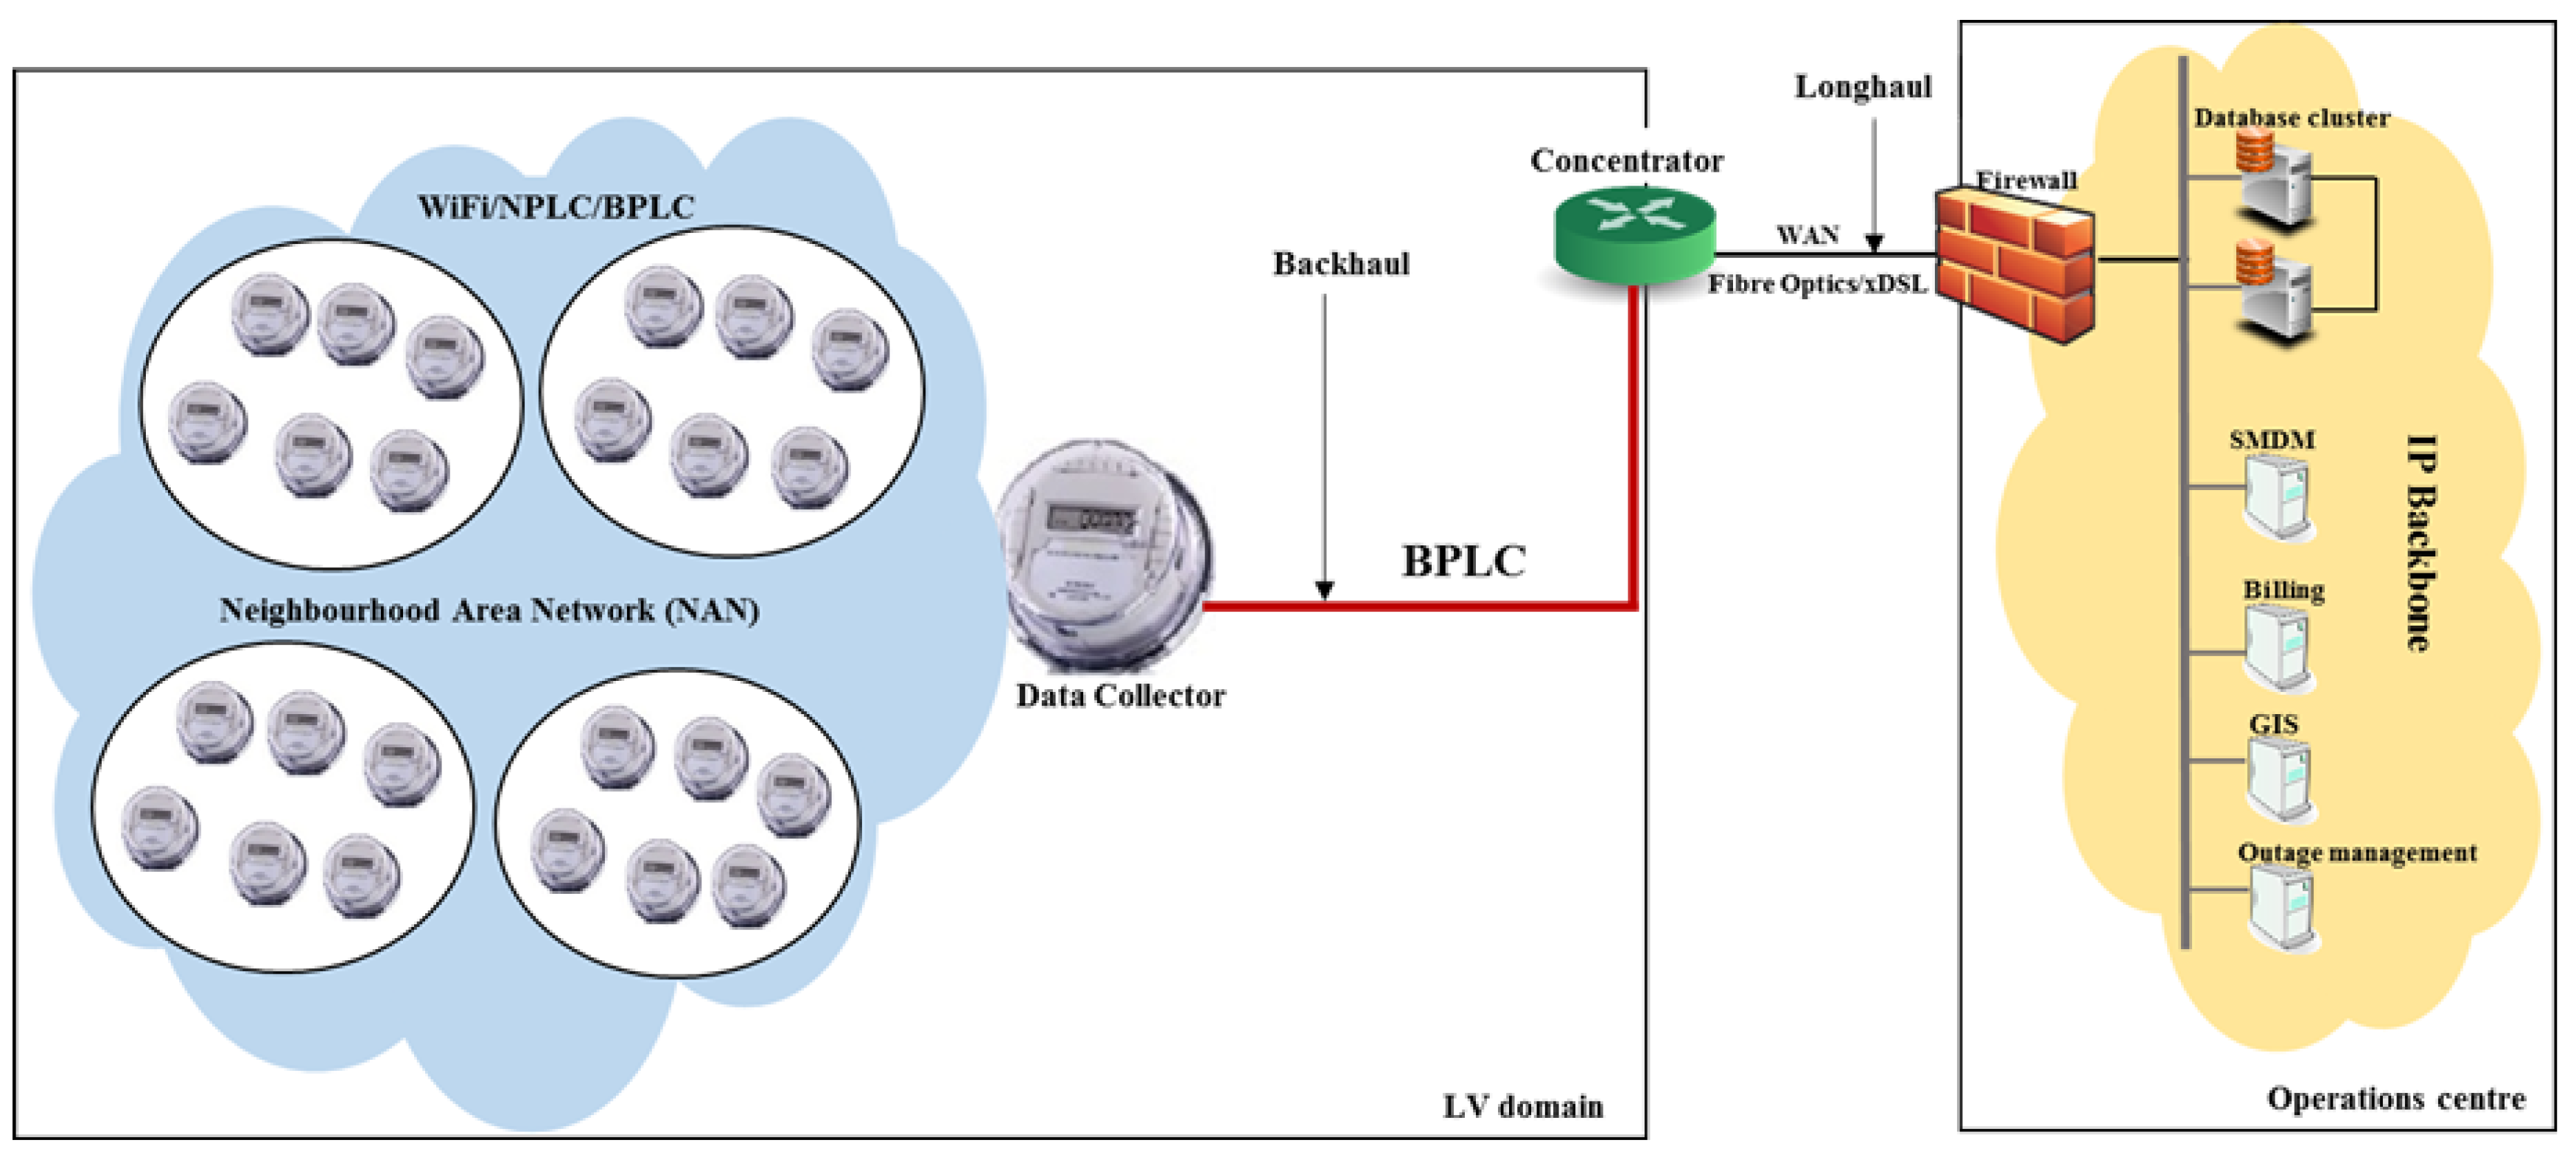
The model of smart metering studied in this paper is illustrated in
Figure 1. Our aim here is to use BPLC as the communication medium between the DC and the concentrator. Typically, each meter may send its reading periodically according to predefined schedule or on-demand. In addition to the traditional measurement role, a smart meter is also communication-capable. We consider a network of smart meters in which BPLC provides backhaul connectivity between the smart meter network and the concentrator. A DC is deployed within a cluster of houses and each smart meter forms adjacency with it. This model investigates the overall network performance using Wi-Fi, BPLC and NPLC as the last mile between the DC and smart meters. The role of the DC is to obtain consumption information from the smart meter, validate it and transmit it to the respective server using concentrator as the gateway. Being a smart meter itself, the DC, therefore, combines its primary metrological functions with traffic aggregation. From a network viewpoint, this approach offers a security advantage in that only valid endpoints such as smart meters authenticated by the DC are allowed to upload data. Based on the configured power line parameters presented in the next section, the network performance is discussed. The concentrator is assumed to be co-located with the transformer at the local substation and at the other end connected to the smart meters to form an extended local area network (LAN) of smart meters, otherwise known as NANs as shown in
Figure 1.
Instead of individual connection from the smart meter to the concentrator, the DC, acting as a network relay, backhauls the aggregated traffic via BPLC; this logically reduces the distance-related losses especially for meters located at the far end of the service region. The DC is positioned at the beginning of the cluster and rather than a dedicated device, we promote one of the smart meters (with upgraded resources) within the network to act as a DC. This results in a hub-and-spoke network topology in which endpoints form adjacency with the DC (hub), this approach saves space, cost and energy. The hub in this case is strictly in the context of the network topology to illustrate the connection between the smart meters (spokes) and the local aggregating node (hub). The field geometry employed is such that smart meters are separated by (10, 10) in the x-y Cartesian plane, yielding an Euclidean distance of 14.142 m between any two adjacent meters. The concentrator is an intelligent subsystem that collates and tracks measurements from one or more DCs and ensures the data is uploaded to utility network in a timely fashion over the WAN. Hence, high-speed links are required in the WAN, given that it collates measurements from all meters fed from the transformer. The DC employed in this work is without preference for any layer of device (except PHY). However, in real implementation, the choice of the DC (bridge, switch, router, firewall, traffic optimiser) will be guided by the level of intelligence and/or security required at the network edge.
As NPLC is susceptible to narrowband interference from broadcast stations, BPLC also suffers from broadcast emissions from citizens’ radios and other sources [
20,
21]. Generally, within the LV networks, electrical cables run from transformers in the secondary substation to neighbourhoods, branching off to individual homes or clusters. Since many users share the same physical medium, if multiple users are transmitting, signals from one home may interfere with another. As the number of concurrent transmissions increases in the neighbourhood, the chances of interference also increases [
35]. However, since the bandwidth for BPLC is larger (1–80 MHz in standard and up to 100 MHz in implementation) [
36], BPLC can avoid some frequency bands without compromising the data rate [
10,
36,
37,
38]. This resilience makes a huge difference between NPLC and BPLC in terms of effective throughput [
39].
Depending on the density, a single DC can serve several tens or a few hundreds of households. For example, there are urban centres where population density is relatively high such that corresponding building density and LV power line configuration allow service delivery to large numbers of households within relatively small geographical boundaries. Compared with wireless options (such as GPRS, 3G, etc.), clear advantages of this model are the fiscal and operational efficiency and reduction of failure domain.
3.2. Demand Response over Power Lines
DR can be implemented in many ways. Apart from peak shaving and load relief in emergencies, DR programs can also be used to provide ancillary services. The description and delay requirements of various load-driven ancillary services are outlined in [
40]. The DR simulated in this paper is based on the implementation in [
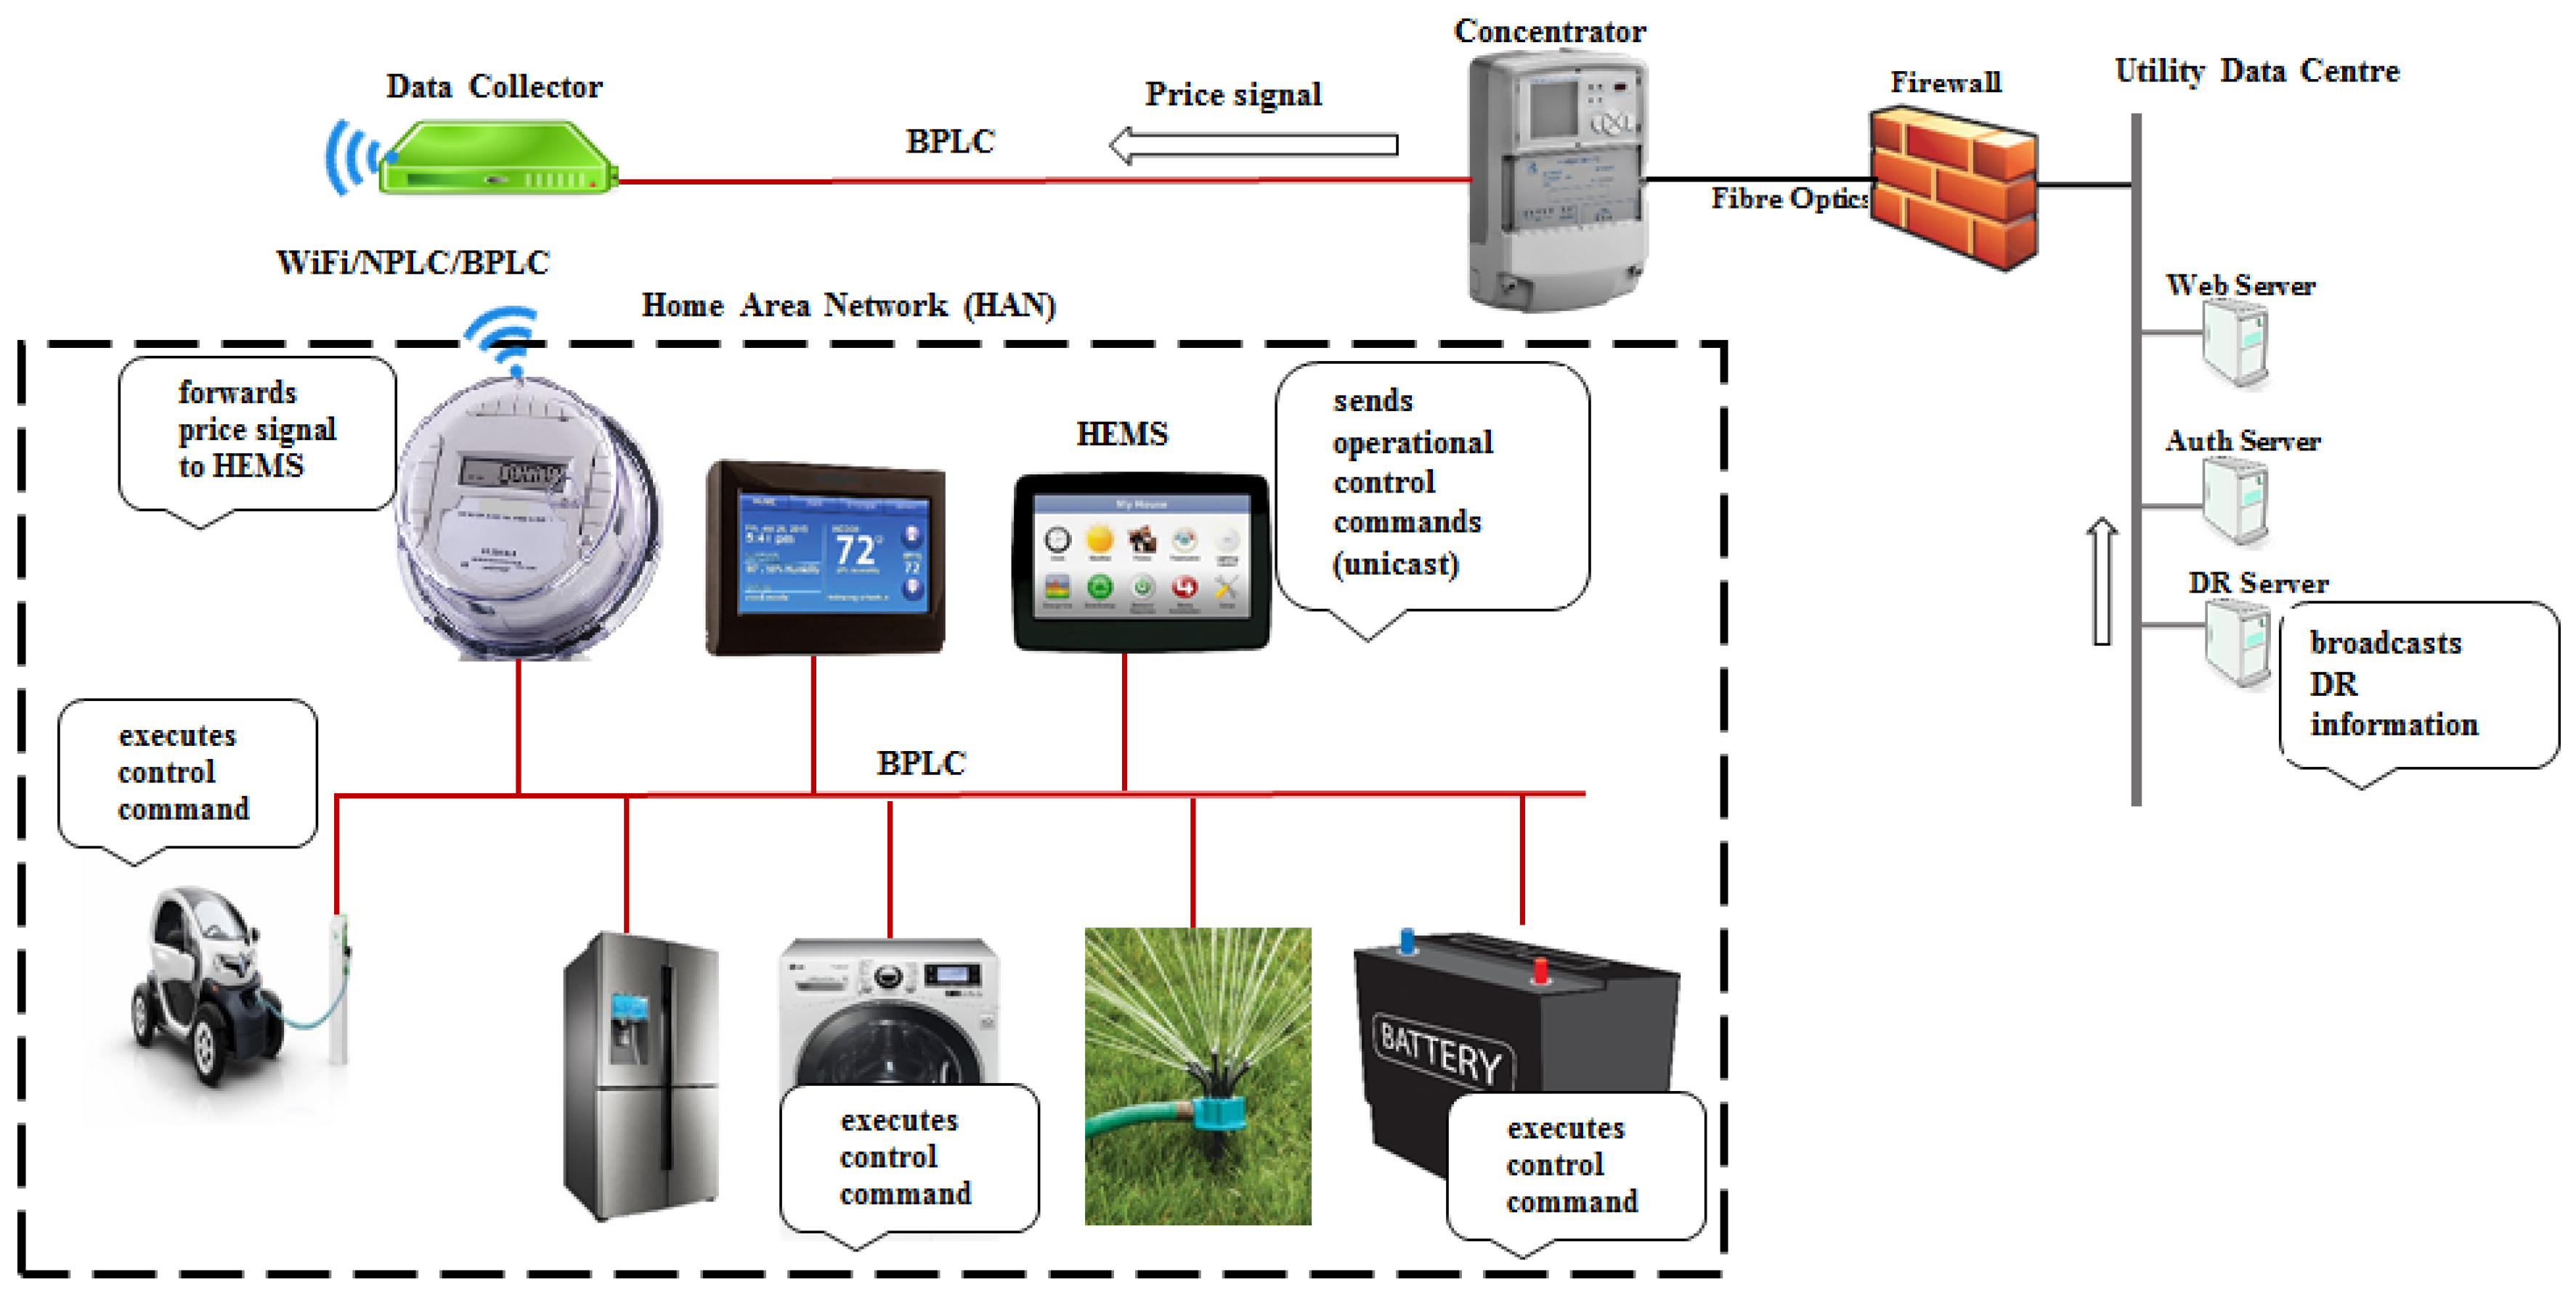
2]. By inducing consumption patterns in response to reserve level or unforeseen changes in the grid, this type of price-driven DR program can also be used for load shedding or shifting, thus providing an additional degree of freedom in terms of grid reliability. While it is possible for each customer to administer the energy management system (EMS) in the home, based on a mutually approved service level agreement (SLA), it is also possible for a provider to control customer’s loads directly through the local EMS. A typical HAN consists of everyday smart domestic loads connected to the energy distribution network through the smart meter. The loads register with the EMS which monitors, controls and coordinates their operations.
Figure 2 illustrates a simple DR model over the power line network showing exchange of price and control signals.
4. Simulation Setup
This section presents the experimental setup used in this study. Although other network simulators tools such as OMNeT++ or OPNET are possible, all simulations in this work were carried out in NS-3. NS-3 was chosen for two reasons: (i) the electrical properties of the cable are taken into account in the development of the power line channel model provided in [
41], thus resulting in a power line channel that can be integrated into mainstream NS-3, a free network simulator. This power line channel model is based on transmission line theory (TLT). Unlike OMNeT++, which will require modification of the Ethernet module to emulate power line based on shared media access technique carrier sense multiple access with collision avoidance (CSMA/CA) and additional adaptations [
42]; (ii) within NS-3 environment, upper layer protocols (IP, transport, application) can run on top of the PHY/MAC provided in the PLC module to investigate complete PLC systems. The provided PLC module supports BPLC and NPLC, while the Home Plug AV (with downgraded throughput) is employed for the BPLC, and the NPLC is based on IEEE 1901.2 standard.
Power line is a time-, frequency- and location-variant channel. Accordingly, impedance can be fixed, time-selective and/or frequency-selective. For simplicity, we employ fixed line impedance for the duration of meter reading and DR activities. Although the IEEE 1901 standards defined specification for PHY and MAC layers, since IP is widely used as network layer protocol, the nodes in this paper are IPv6-enabled. For the purpose of this work, the AMI environment was setup in a simulator using some libraries provided in [
41]. Respective networks are consequently designed to emulate topologies shown in
Figure 1 and
Figure 2 using Wi-Fi and PLC. System parameters used in this simulation are illustrated in
Table 1,
Table 2 and
Table 3, some of which are derived from AMI applications implemented in [
2].
Although the IEEE 1901 prescribes CSMA/CA and TDMA at MAC layer, CSMA/CA is used to access the power line medium, whereas TDMA is used for contention-free data transmission, [
28,
39]. CSMA/CA is chosen in this work to observe the network performance in a contention-based scenario in the NAN. In simulating AMI applications, different upload schedules have been used in literature, for instance 50 s was used for smart metering in [
43]; however, we chose 30 min in this work to emulate half-hourly uploads. In addition, the range of measured background noise varies widely in literature [
44,
45], and in this work we applied
dBm/Hz. In addition, impulsive noise was implemented in the simulation as random pulses with power spectral density (PSD), inter-arrival time and duration of
dBm/Hz, 0–2 ms and 0–1 ms, respectively.
The simulation results in the next section represent near-extreme situations in which all meters attempt to upload or download data at the same time. This is to stress-test the system and examine its performance in worst-case scenarios. The metering application traffic is modelled as client-server communication, utilising user datagram protocol (UDP) at transport layer. The sever application is installed on the SMDM server while the client is installed on the smart meters. That way, the smart meters send their readings, and, as a response, the SMDM server returns per flow acknowledgement to each smart meter, indicating the number of packets received in the flow. Generally, the choice between transmission control protocol (TCP) and UDP is a matter of trade-off between efficiency (throughput and delay) on one hand, and delivery guarantees with flow control on the other. However, given that transmission of metering information is typically characterised by short transactions that do not require persistent connection between SMDM servers and the smart meters, it is more beneficial to employ UDP.
In the case of DR, since peak price advertisement is multicast traffic which does not elicit acknowledgement, we simply modelled it as a UDP-based application in which the client (installed on DR server) simply sends price signals to the UDP server (installed on smart meters). The connection between the concentrator and the utility data centre is modelled as a high capacity link (fibre optic) with 2 ms latency. UDP is generally beneficial for services in which per-packet in-band acknowledgement and error-correction are unnecessary or can be done at the application layer. This relieves the application of the extra overhead associated with error-correction and flow control at transport layer. In other words, by building reliability into the metering software, using UDP, the smart metering application can communicate reliably without incurring the retransmission delay and other performance constraints imposed by TCP congestion control mechanisms. Hence, since meter readings are typically periodic and peak price signalling is one-way, UDP appears more suitable than TCP.
Using basic performance indices, we assess the network in terms of latency, successful upload/downloads and reliability. In principle, communication latency comprises mainly of queuing delay and wireline delay. The queuing delay is directly proportional to the buffer size of each intervening switch or router, and the line delay is determined by data rate of the communication link. Communication delay on a network can generally be expressed as
Given application size S (in bits) with
P number of packet and overhead
A (in bits), wireline delay for each packet can be calculated as
where
C is the link capacity in bps. Assuming other delays are negligible, end-to-end delay can be expressed as
is the time interval between when a packet arrive a network device and when it was transmitted. Equation (3) applies to all switching devices on the communication path. The total latency is therefore given by
where
n is the number of switching devices such that
. Equations (1)–(4) hold true for all First-In First-Out (FIFO) scheduling systems where packets are scheduled for transmission in the order they arrive. Here, latency is measured as the interval between transmission and delivery of packets. Similarly, we compute the packet delivery ratio (PDR) as the ratio (expressed in percentage) of the total transmitted packets successfully acknowledged during an upload session consisting of several flows. It should be noted that variation of the power line channel is not considered in this work. Reliability is also evaluated in terms of the number of successful uploads and downloads during smart metering and DR operations, respectively. For an AMI consisting of
m smart meters, the average availability of connection to each meter can be expressed as
where
is the time that a particular smart meter
i is registered with the DC since the last reset.
m is the number of smart meters registered with DC since the last reset.
is the time since the last reset.
5. Results and Discussion
In this section, we present and discuss the simulation results of the system under consideration. This work employs a clustered architecture in which data from smart meters are aggregated into the collector within the NAN. Rather than individual transmissions, this simplified network empowers the collector to upload all metering data in a single flow. This is considered more efficient and particularly beneficial for smart meters at the far end of service area. While maintaining BPLC as the backhaul, each of Wi-Fi, NPLC, and BPLC are deployed in the last mile, and end-to-end system performance is evaluated.
5.1. Network Reliability
In reality, applications respond differently to network characteristics. For instance, a 500 MB firmware download into a smart meter will prefer a slower but reliable link to ensure completeness instead of one that is fast and intermittent. Conversely, near real-time applications such as outage notification, peak price or other alarm signals would generally favour fast links given that their sizes are smaller and the probability of packet loss is small too. Therefore, completeness is a key performance indicator for smart metering. To demonstrate this, we investigate reliability of the network by computing PDRs and successful transmission for various packet sizes.
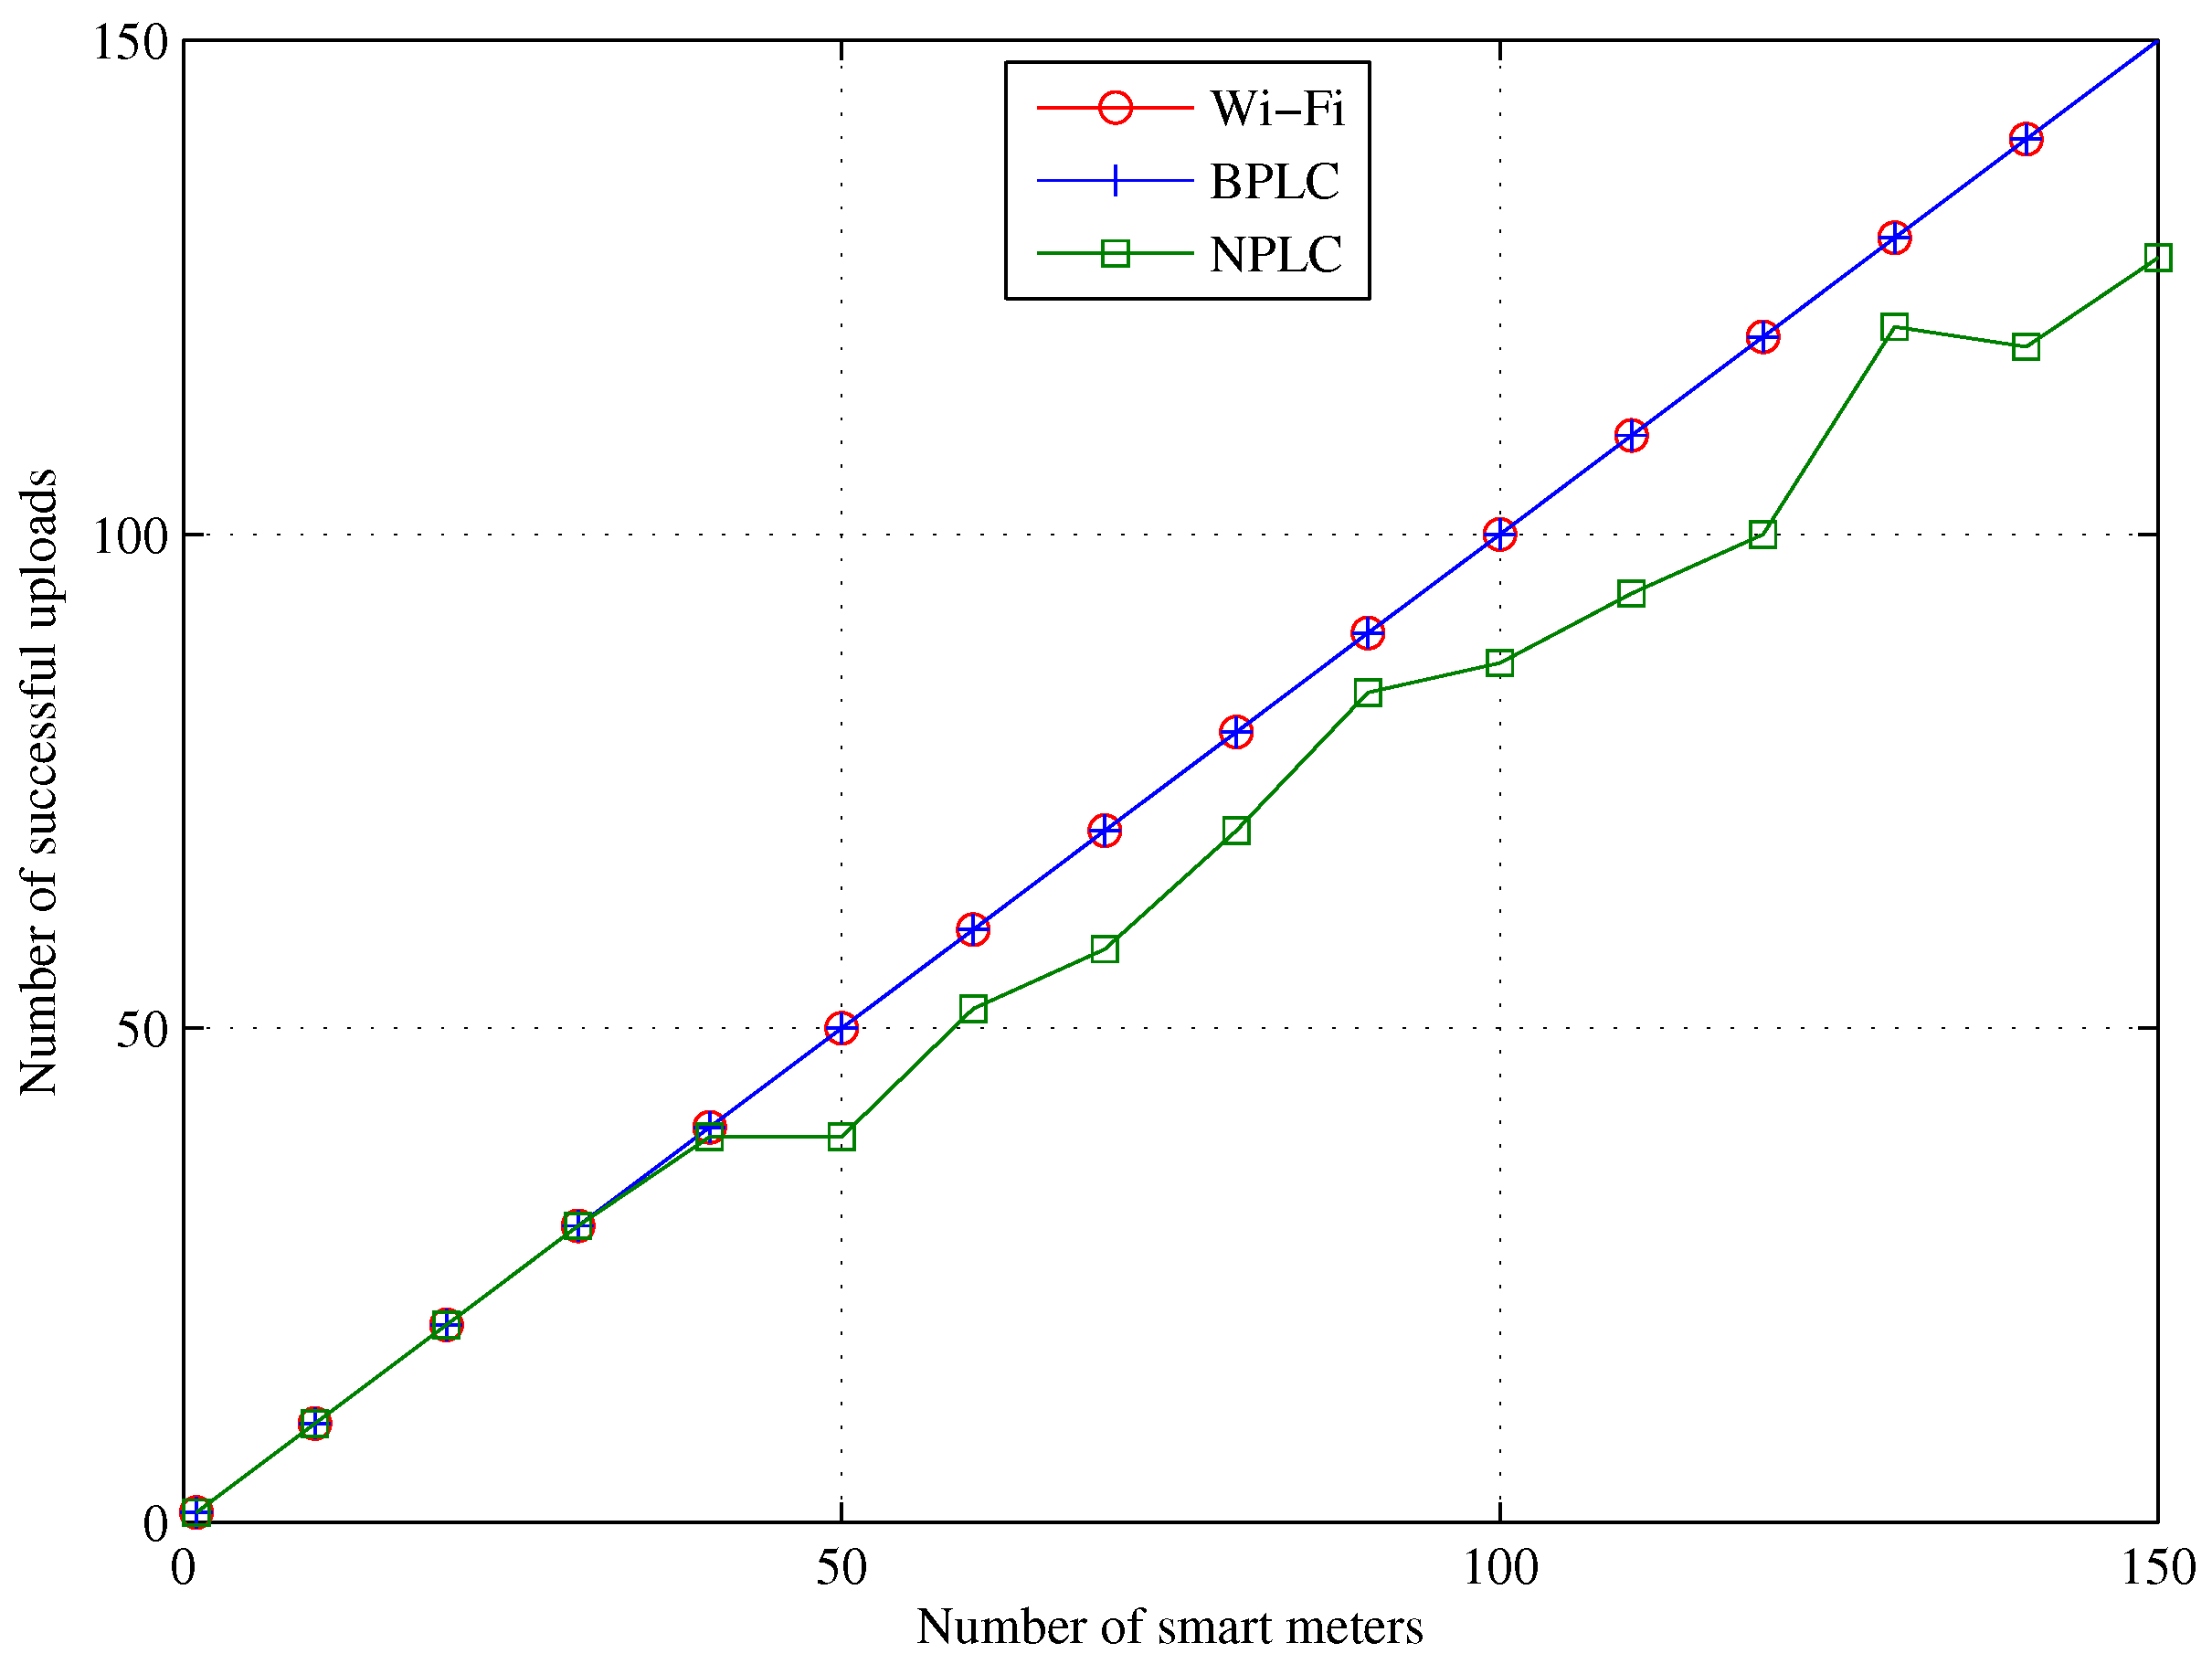
A successful upload is considered as one in which 100% of transmitted packets are received and acknowledged by the SMDM within a window of 30 minutes. We reckon this is a simple way of ensuring accuracy and completeness of metering information.
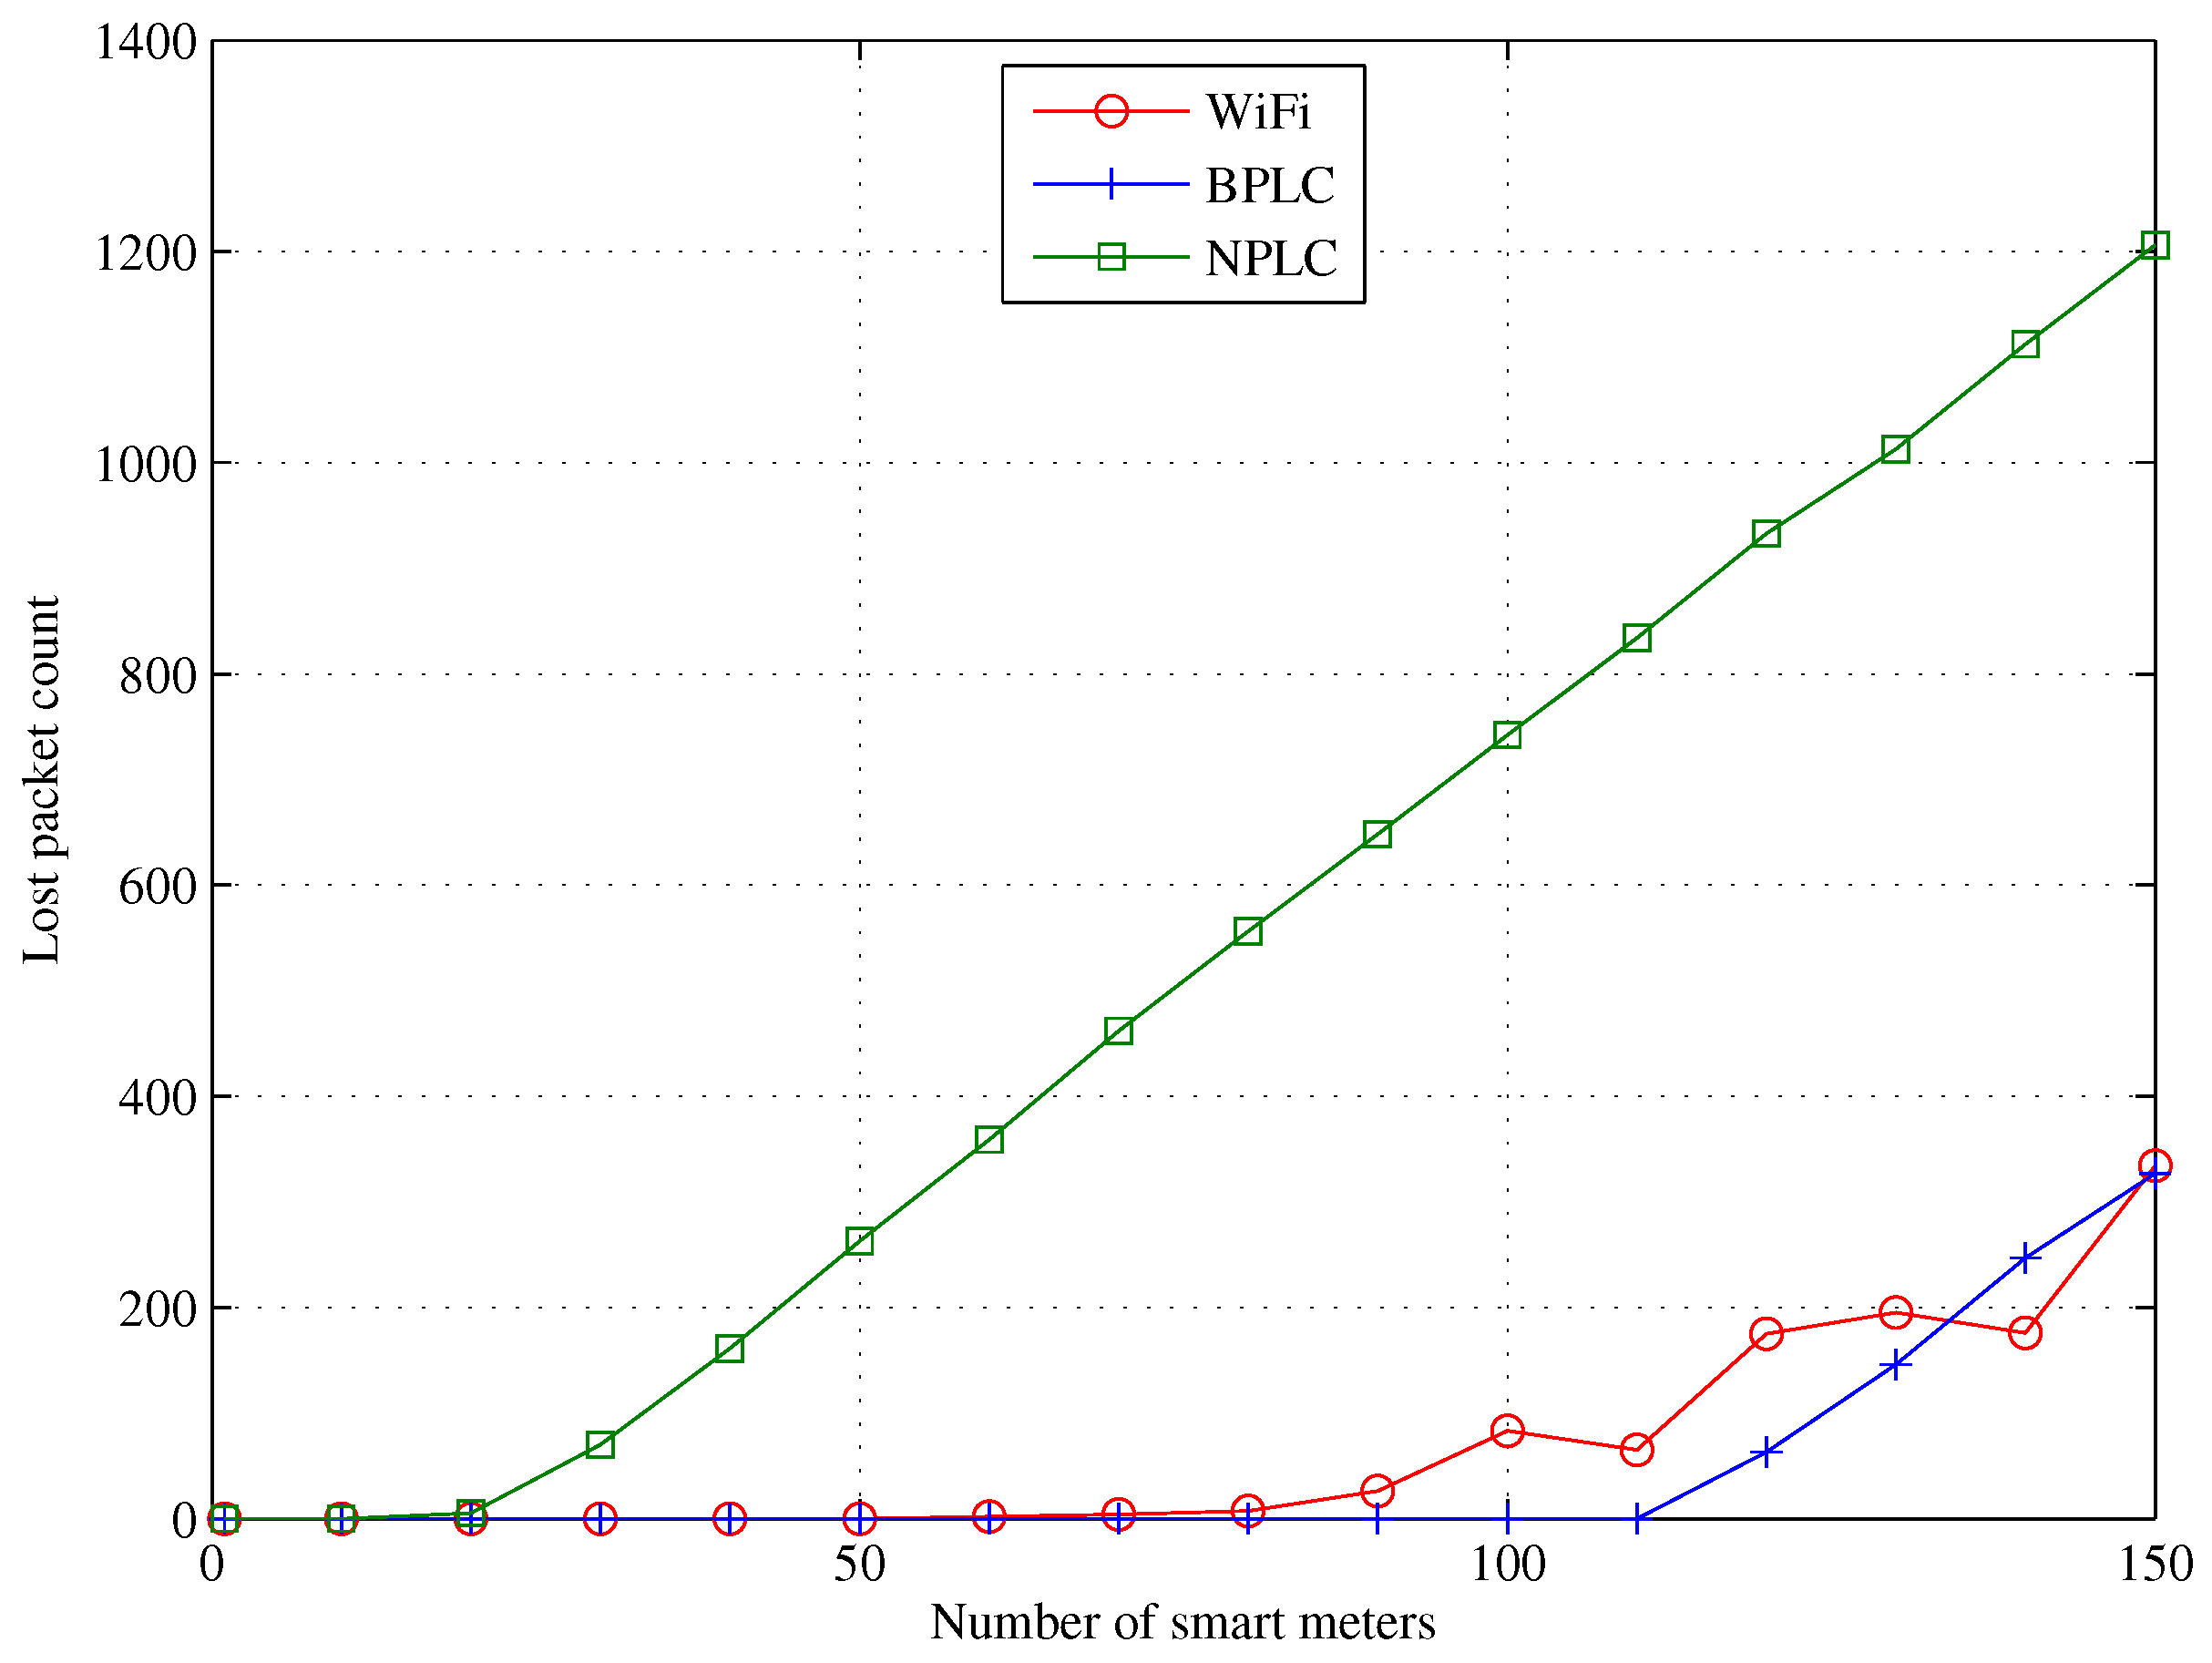
Figure 3 illustrates the number of successful uploads of meter reading as the cluster size is varied from 1 to 150. It is worthy to note that the specification of BPLC deployed at the last mile is same as the backhaul. This result implicitly indicates that BPLC can also support a flat architecture where each smart meter connects directly with the concentrator. The figure also reveals that when used in the last mile, BPLC adequately meets traffic requirements of smart metering.
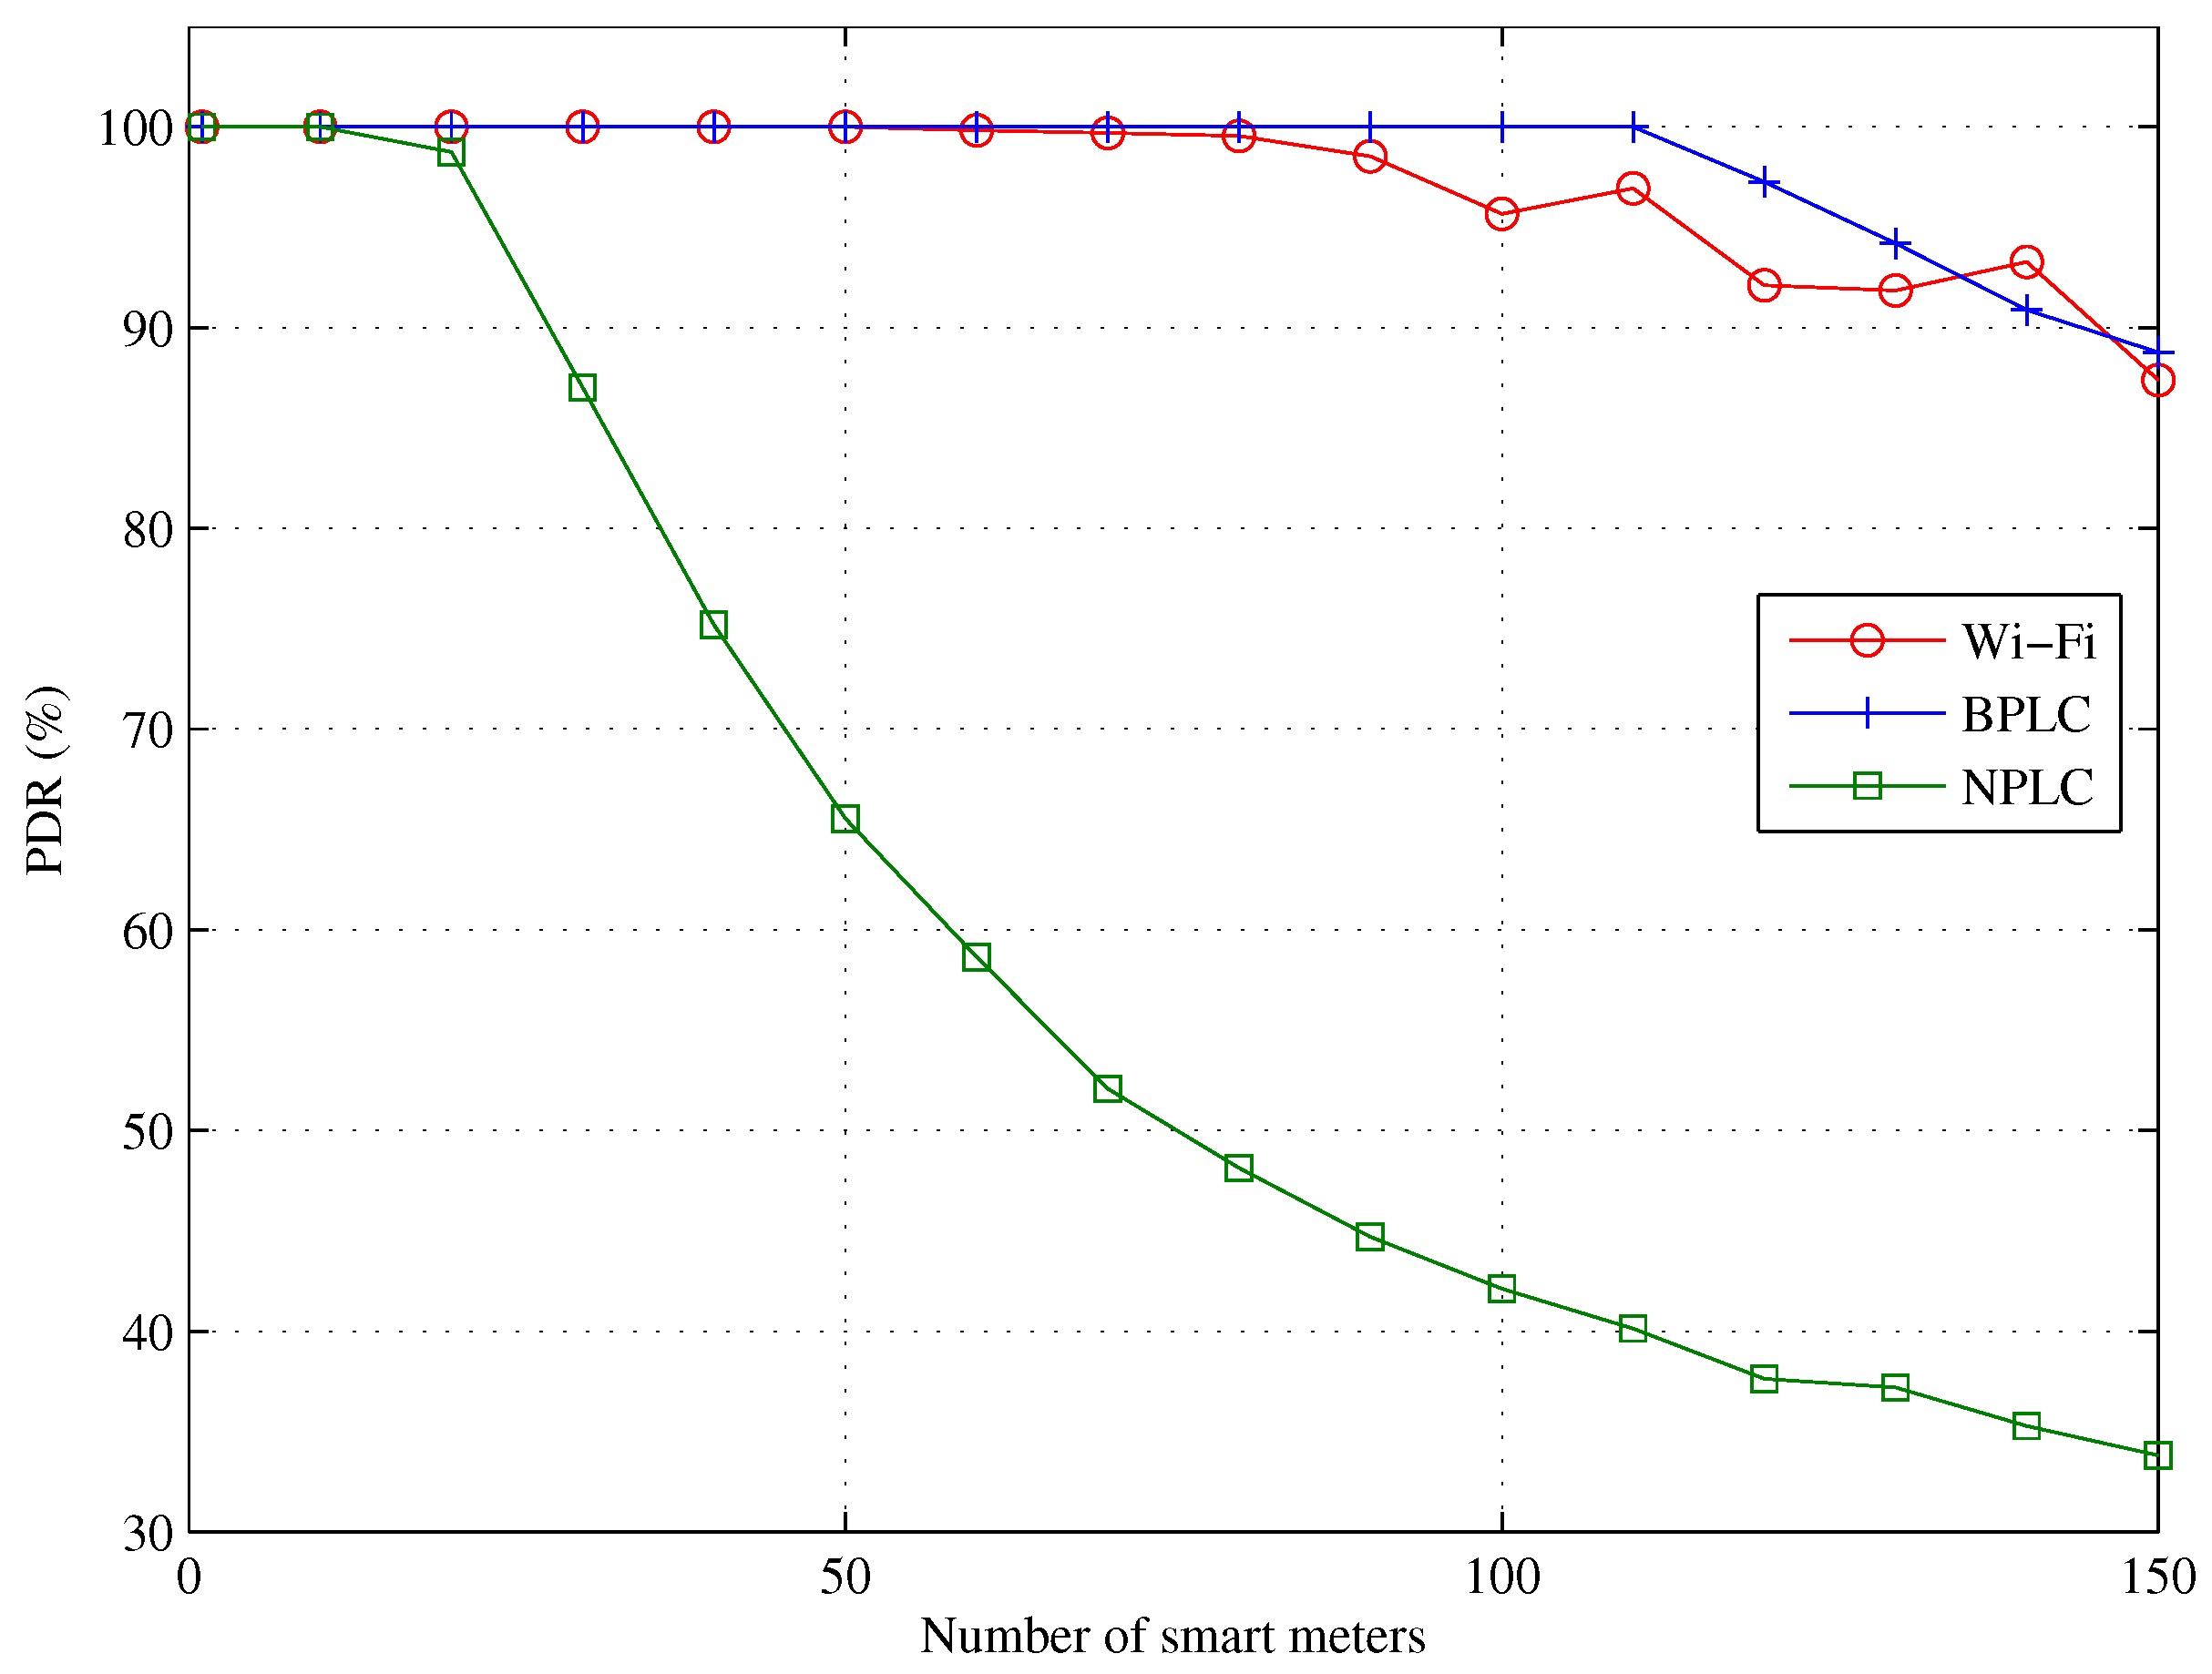
Figure 4 and
Figure 5 show the relationship between the number of smart meters and packet delivery.
The 802.11 specification supports maximum payload of 2304 bytes (before encryption). Basic encryption such as Wi-Fi protected access with advanced encryption standard WPA (AES) adds an extra 16 bytes of header. Hence, maximum transmission unit (MTU) of 2320 bytes is configurable on 802.11, 2200 bytes and is applied in this paper. Whereas BPLC supports 1500 bytes, we implemented 1280 bytes to enable it transmit complete IPv6 packets without fragmentation. The higher MTU of Wi-Fi should ordinarily enable it to transmit larger amount of data in each flow.
Figure 3,
Figure 4 and
Figure 5 show that apart from MTU, data rate affects packet delivery. This is further substantiated by the wide disparity between Wi-Fi and NPLC. Theoretically, NPLC deliver 500 kbps at PHY layer, and the model used in this work delivered 363.233 kbps, whereas Wi-Fi employed 2 Mbps. In terms of performance, it can also be inferred from the results that the reliability degrades as the cluster size increases. This is reasonable as a higher number of smart meters implies more network load and contention within the NAN.
Nevertheless, based on the network configuration employed, it is evident that Wi-Fi, BPLC and NPLC can effectively support smart metering in cluster sizes up to 30. It is therefore natural to assume that with appropriate cluster sizing, BPLC can potentially provide the backhaul connectivity for smart metering, irrespective of the last mile. The AMI is generally a low data environment (except firmware upgrade), with advanced error correction, more flexibility, robust modulation and coding schemes, real networks can achieve better performance than the basic one discussed here. Peak price signalling is also investigated, and our observations are presented in
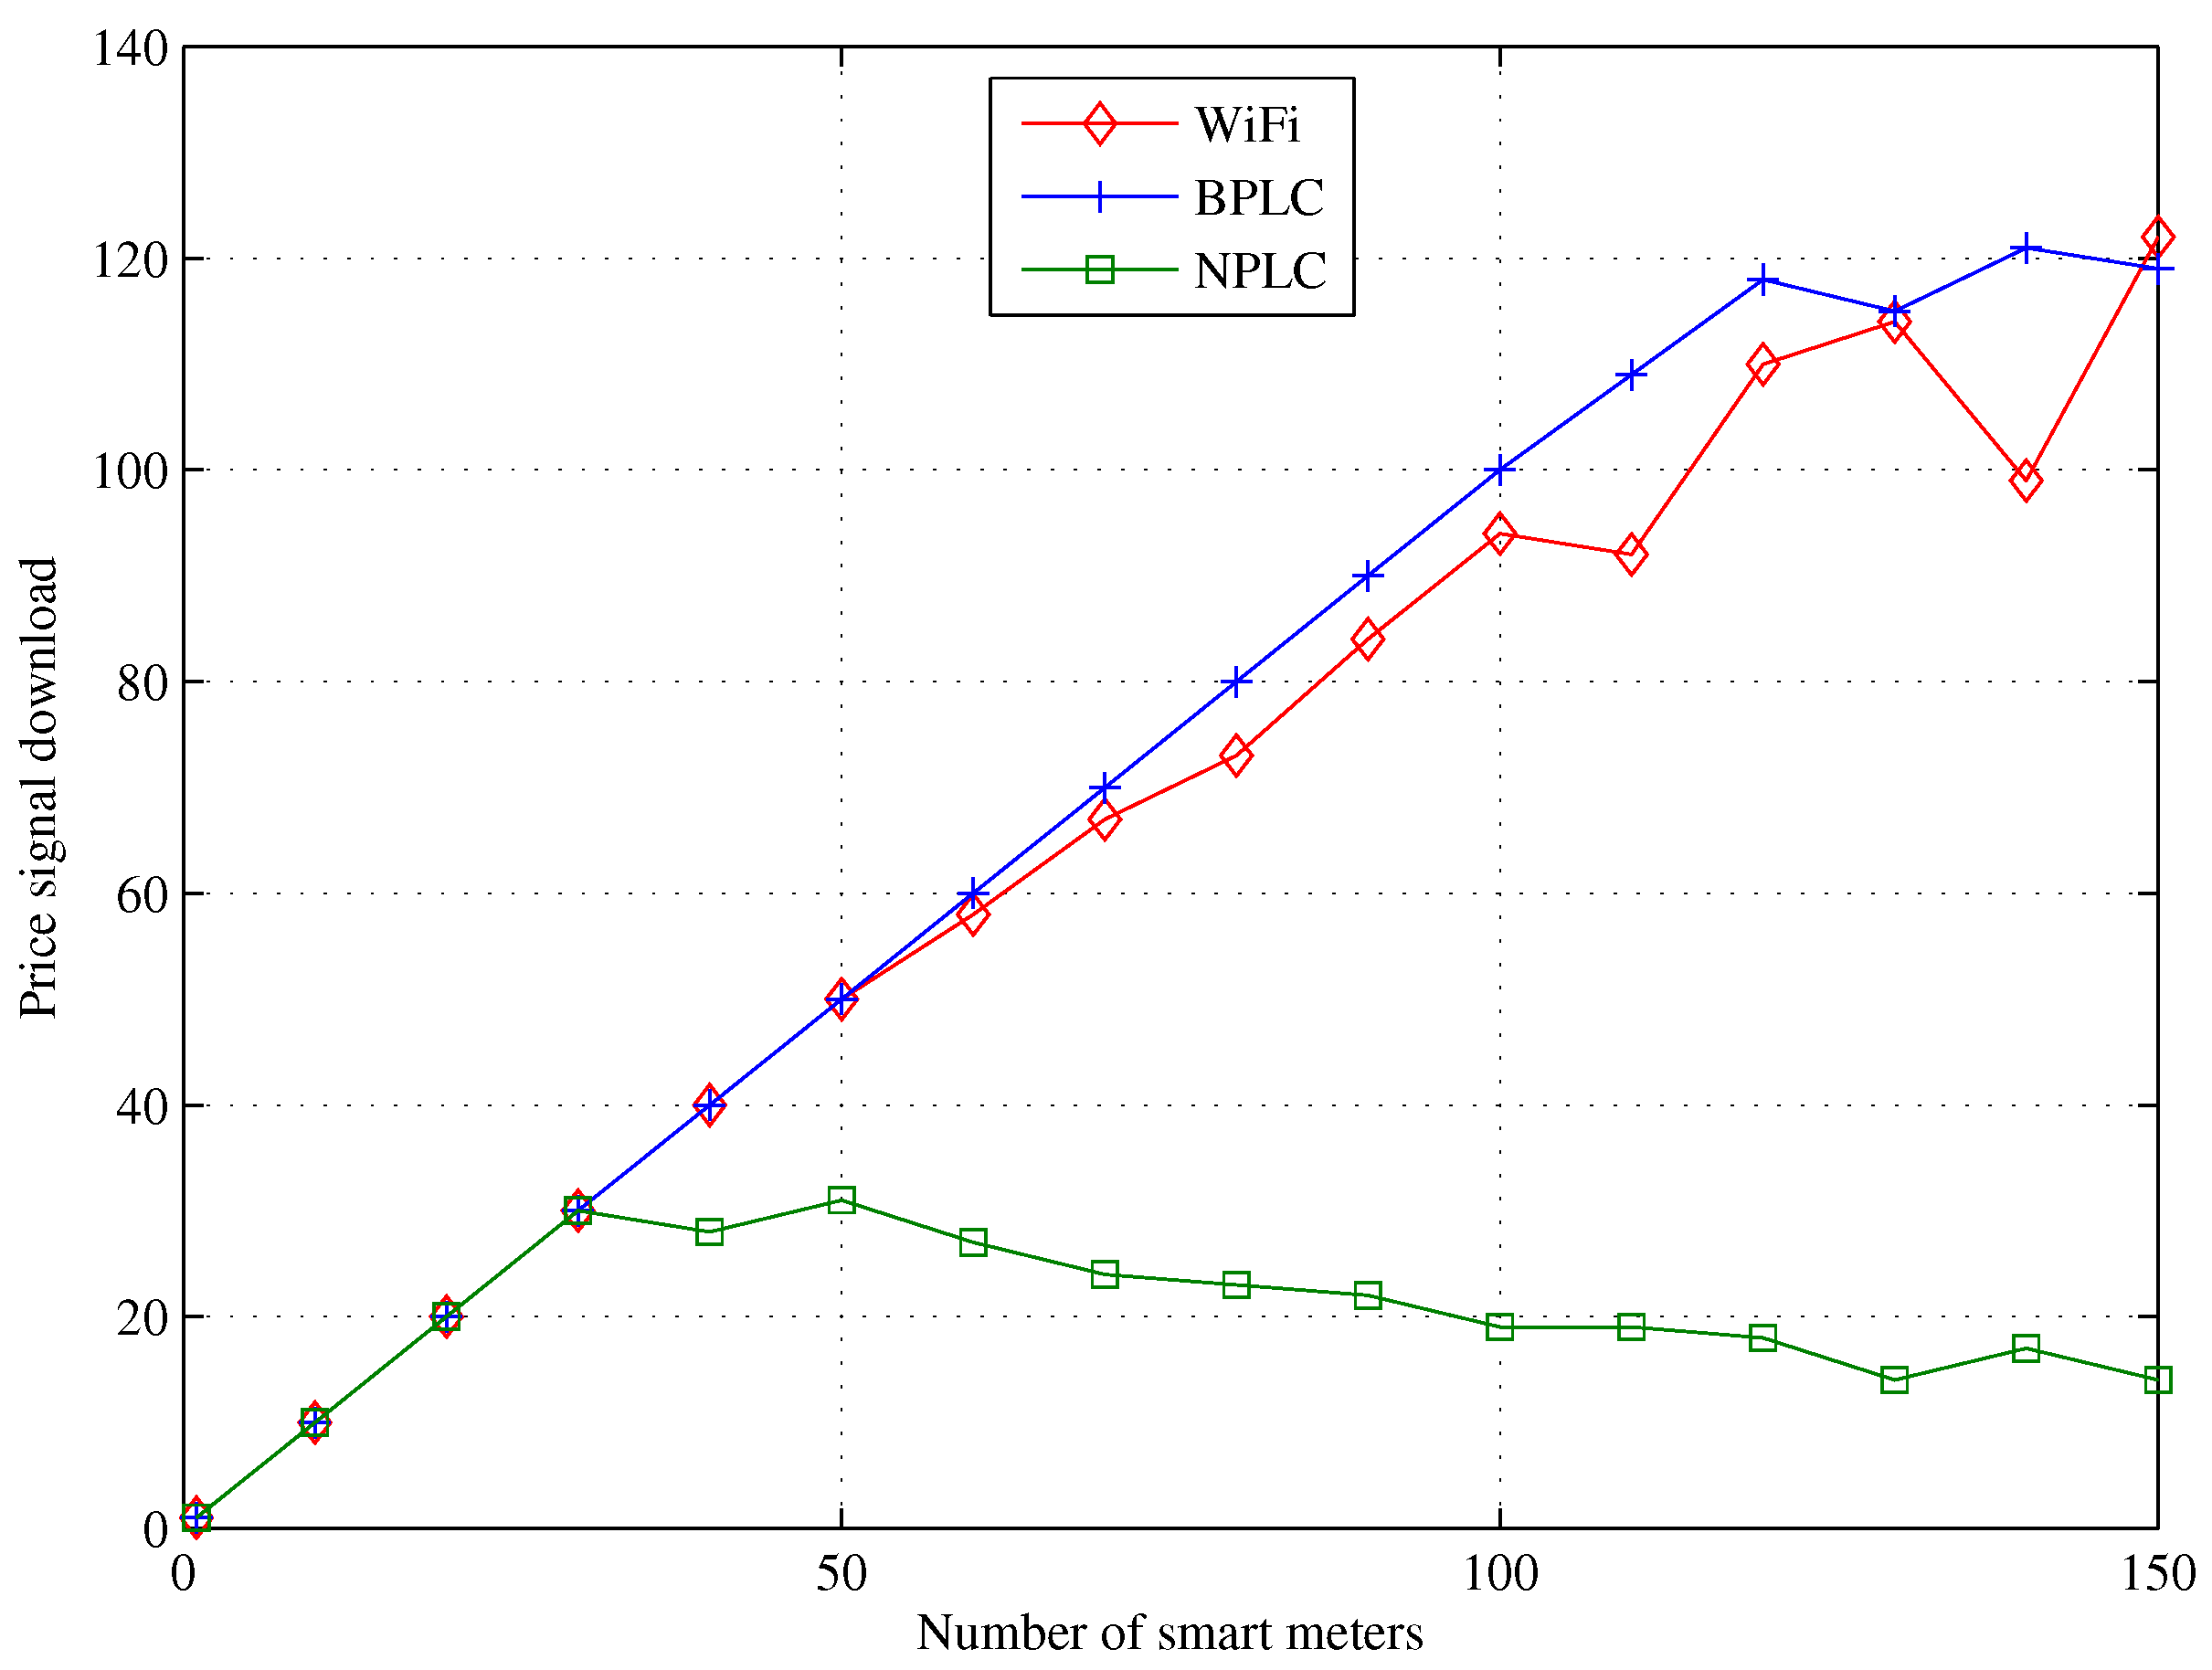
Figure 6.
Since price signals are time-bounded, price information is usually less than 100 bytes [
2,
5] to facilitate timely delivery. DR application size of 60 bytes is applied in this study, and the concentrator receives peak price messages and forwards them to the collector. Since the collector shares a network with other smart meters, it simply forwards the price signal as multicast. From the results presented in
Figure 6, it follows that if all other conditions are unchanged, BPLC backhaul is adequate to support peak price broadcast from DR server to smart meters. Though the degree of success differs among the three communication systems, what is clear is that given a clustered AMI, BPLC is not a bottleneck and can reliably support smart metering at lower cost than traditional backhaul solutions such as fibre optics.
5.2. Communication Delay
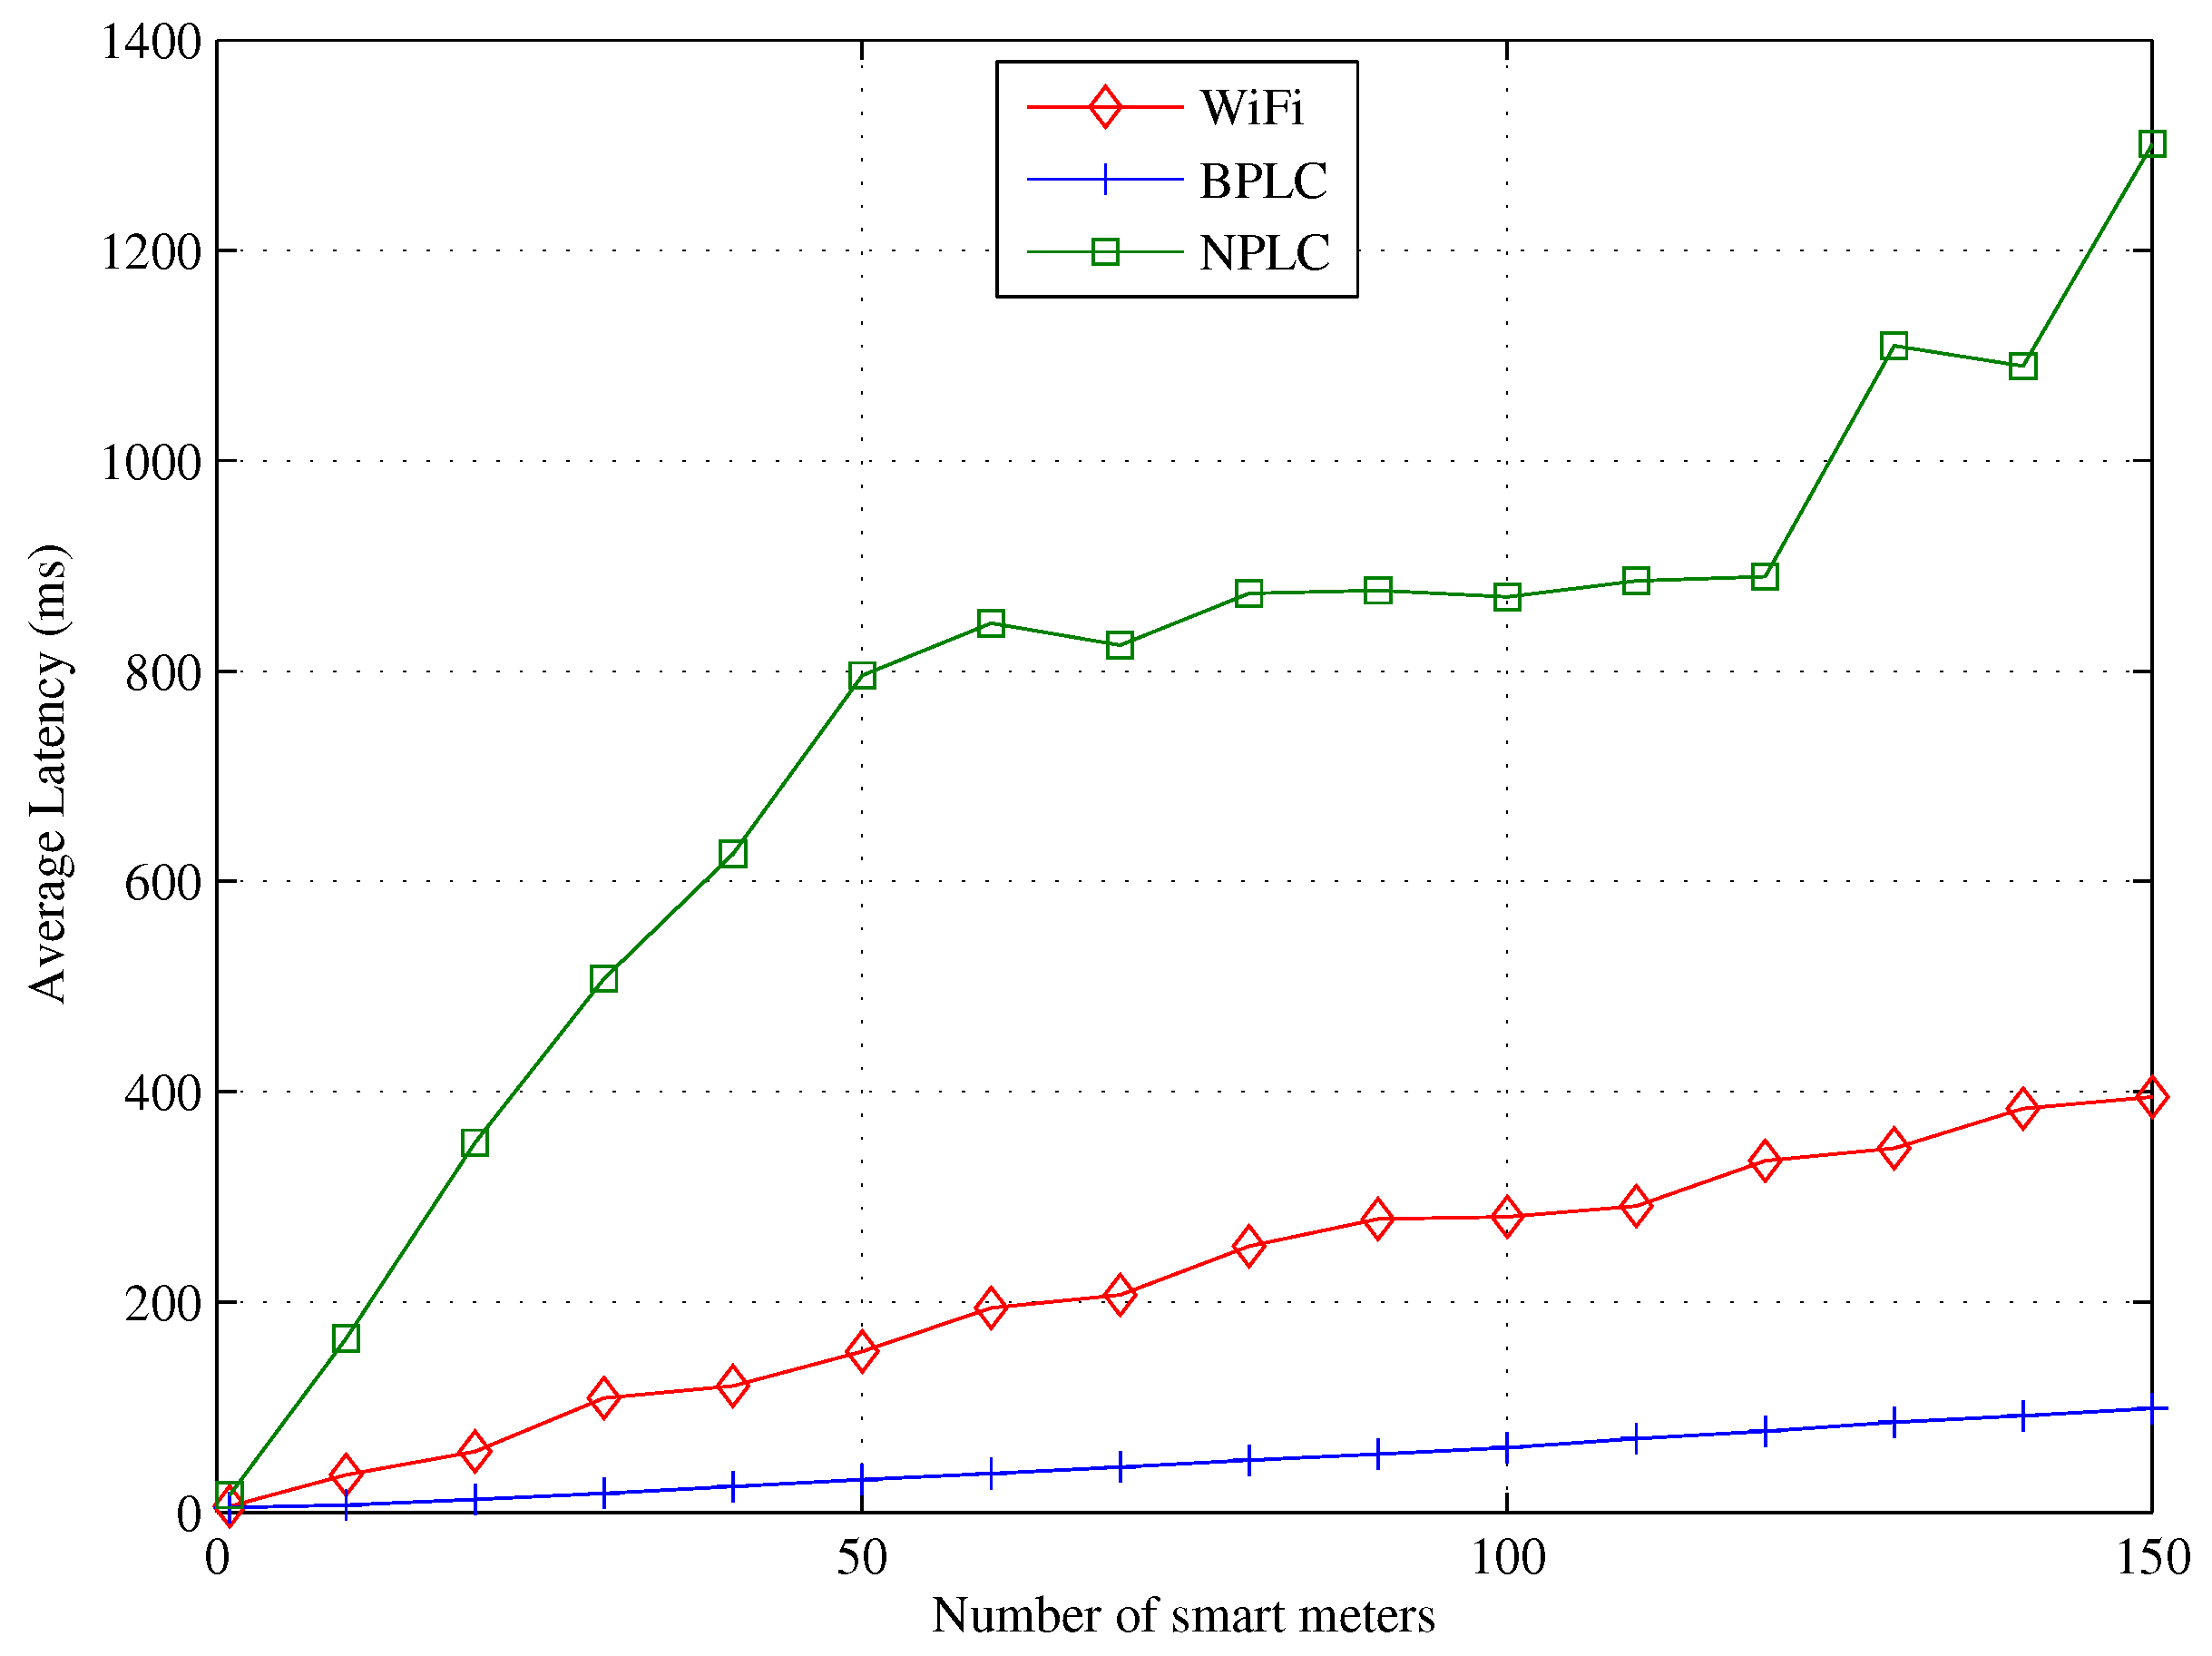
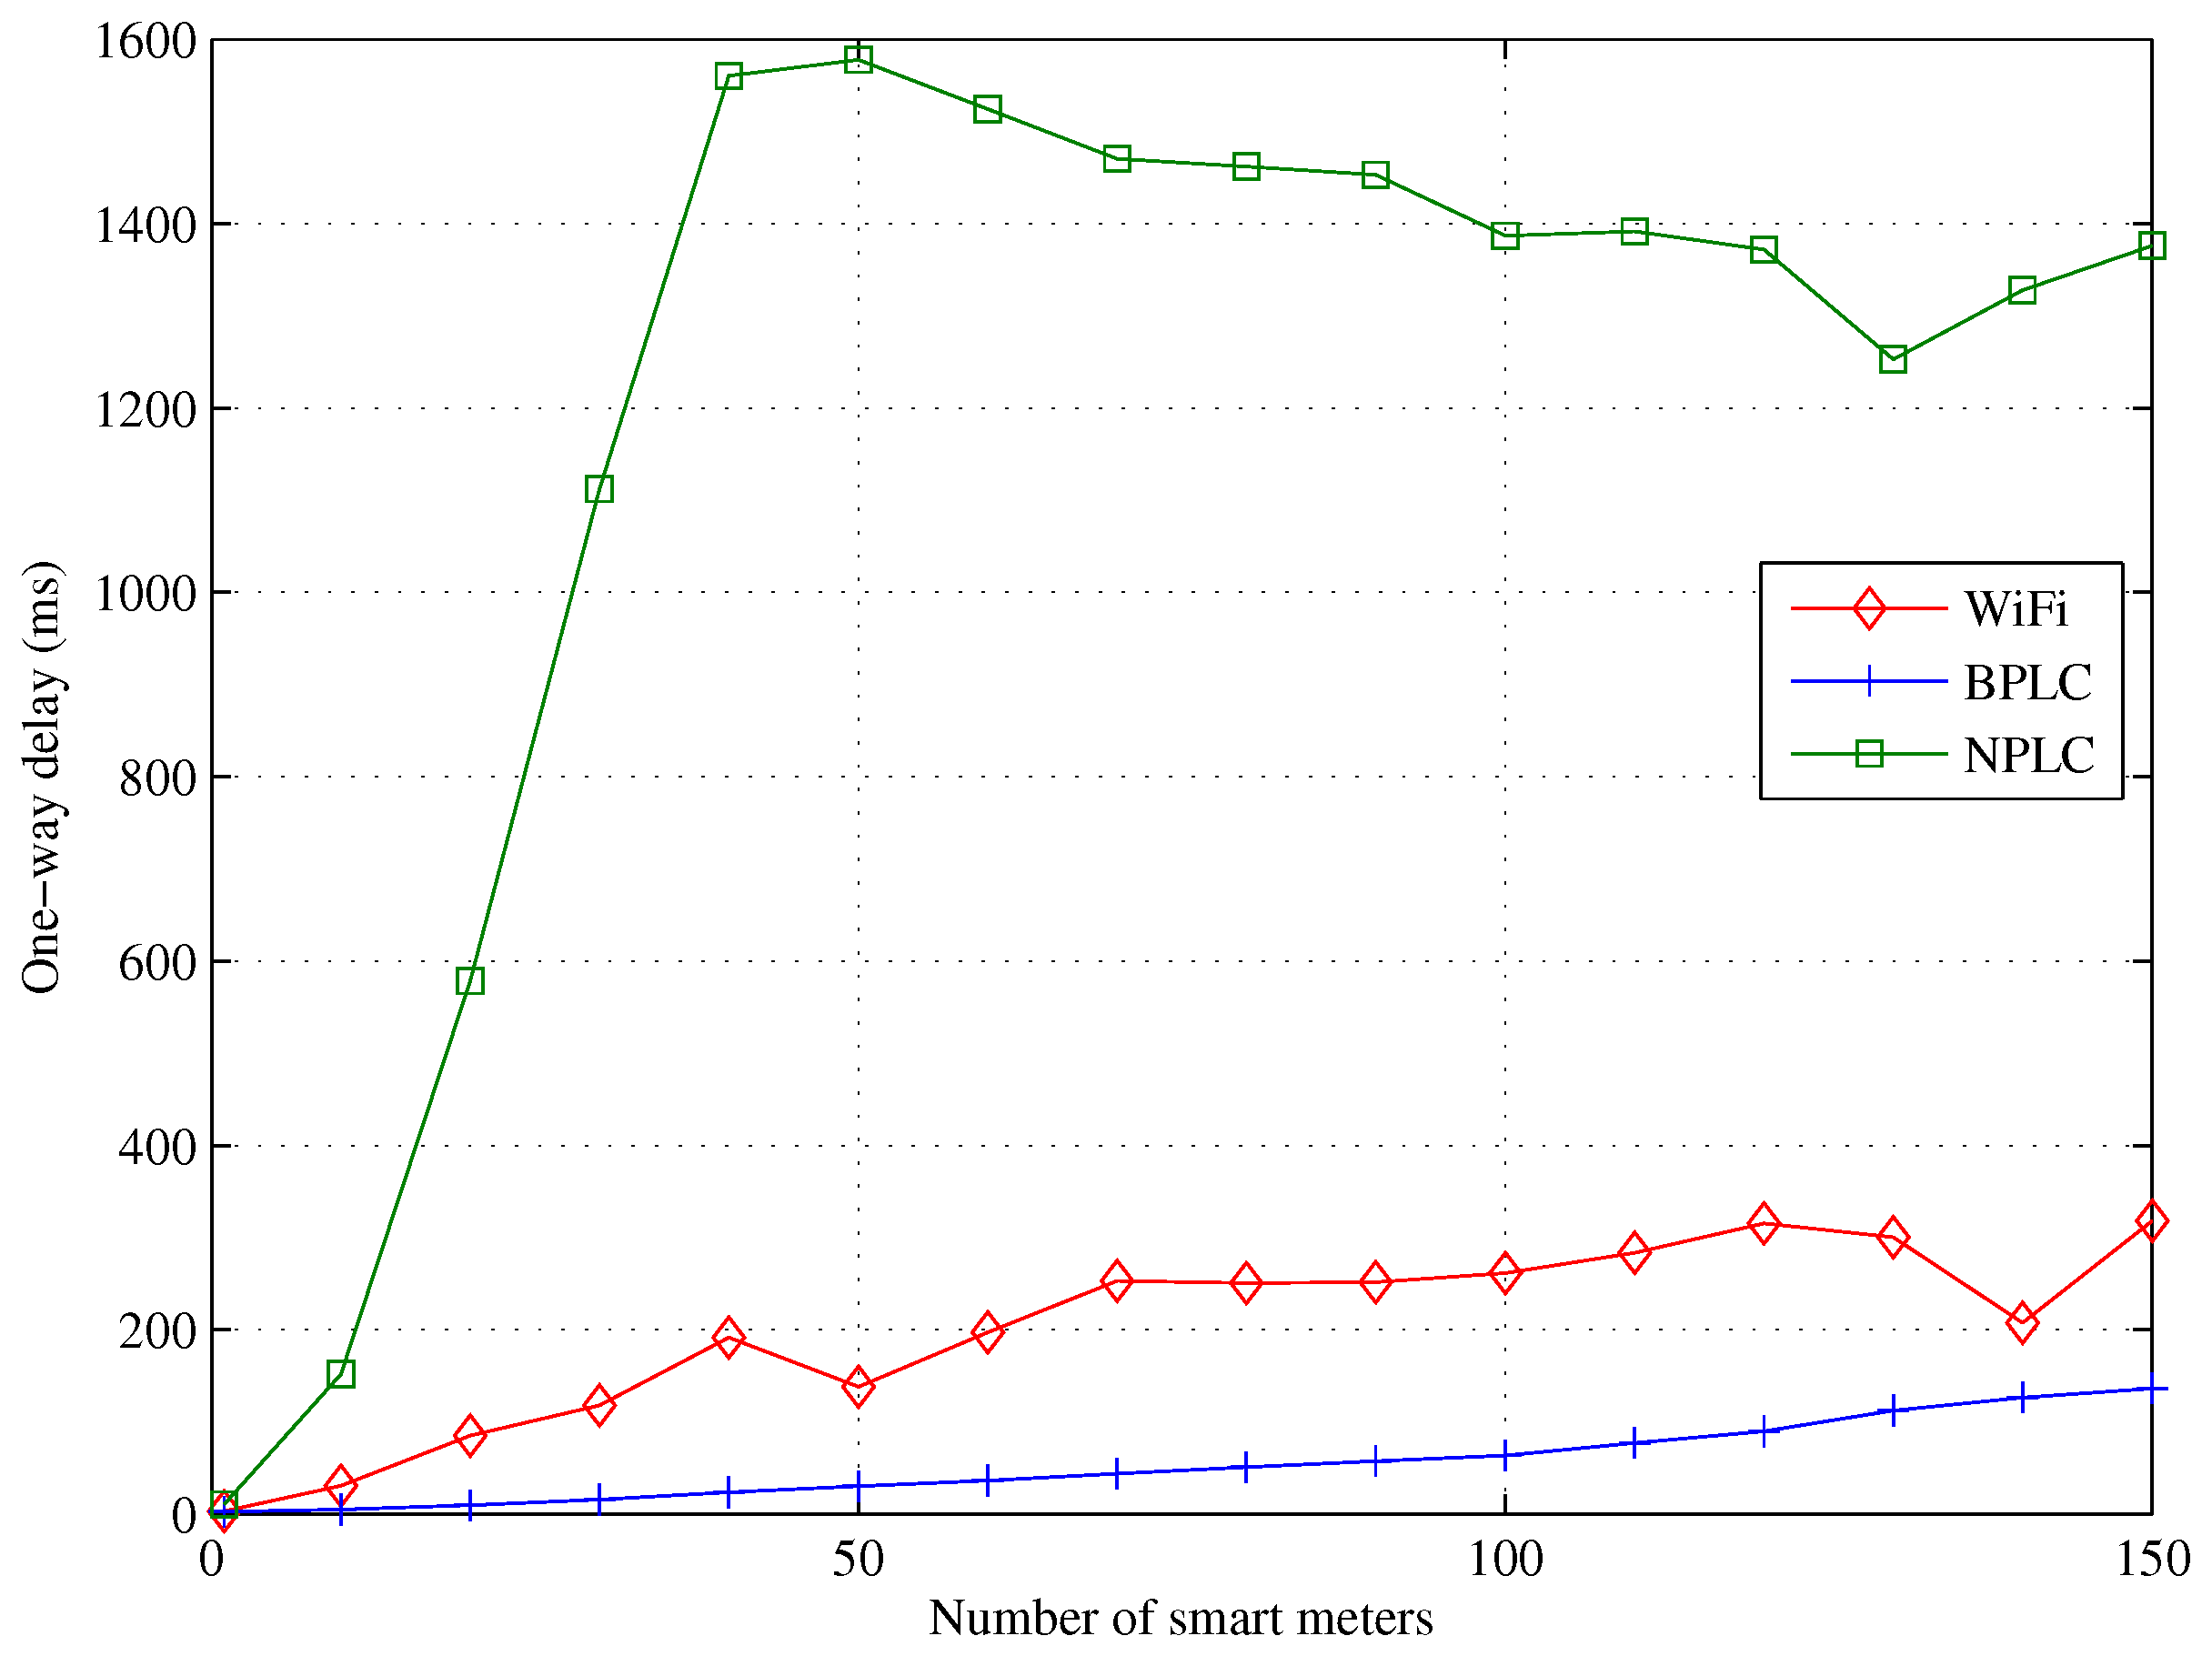
Using the same network of 150 smart meters, here we evaluate the average latency performance of packets as they traverse from the smart meters to the SMDM server and vice versa. The BPLC in the backhaul and last mile employed 1.8–20 MHz with 19.7204 Mbps PHY rate. A modest binary phase shift keying (BPSK) has been employed in this study, in real implementation, the backhaul may employ a higher order modulation scheme to deliver higher data rate. To simulate completeness of metering information, we model meter readings as UDP echo traffic. Consequently, we investigate various forms of delays associated with smart metering and DR applications. Our results are presented in
Figure 7 and
Figure 8.
Within the 30 min window, SMDM is expected to return acknowledgement and only acknowledged uploads are counted as successful. Although NPLC exhibited an impressive performance in
Figure 3, this is traded off with high latency in
Figure 7. However,
Figure 7 and
Figure 8, indicate that even with the low rate modulation of BPLC in last mile and backhaul in a clustered network, it still provides a backhaul that meets the strict delay requirement of peak price signalling. The main observation from
Section 5.2 and
Section 5.3 is that, thus far, BPLC has demonstrated capacity to convey aggregated traffic between the NAN and the provider’s network.
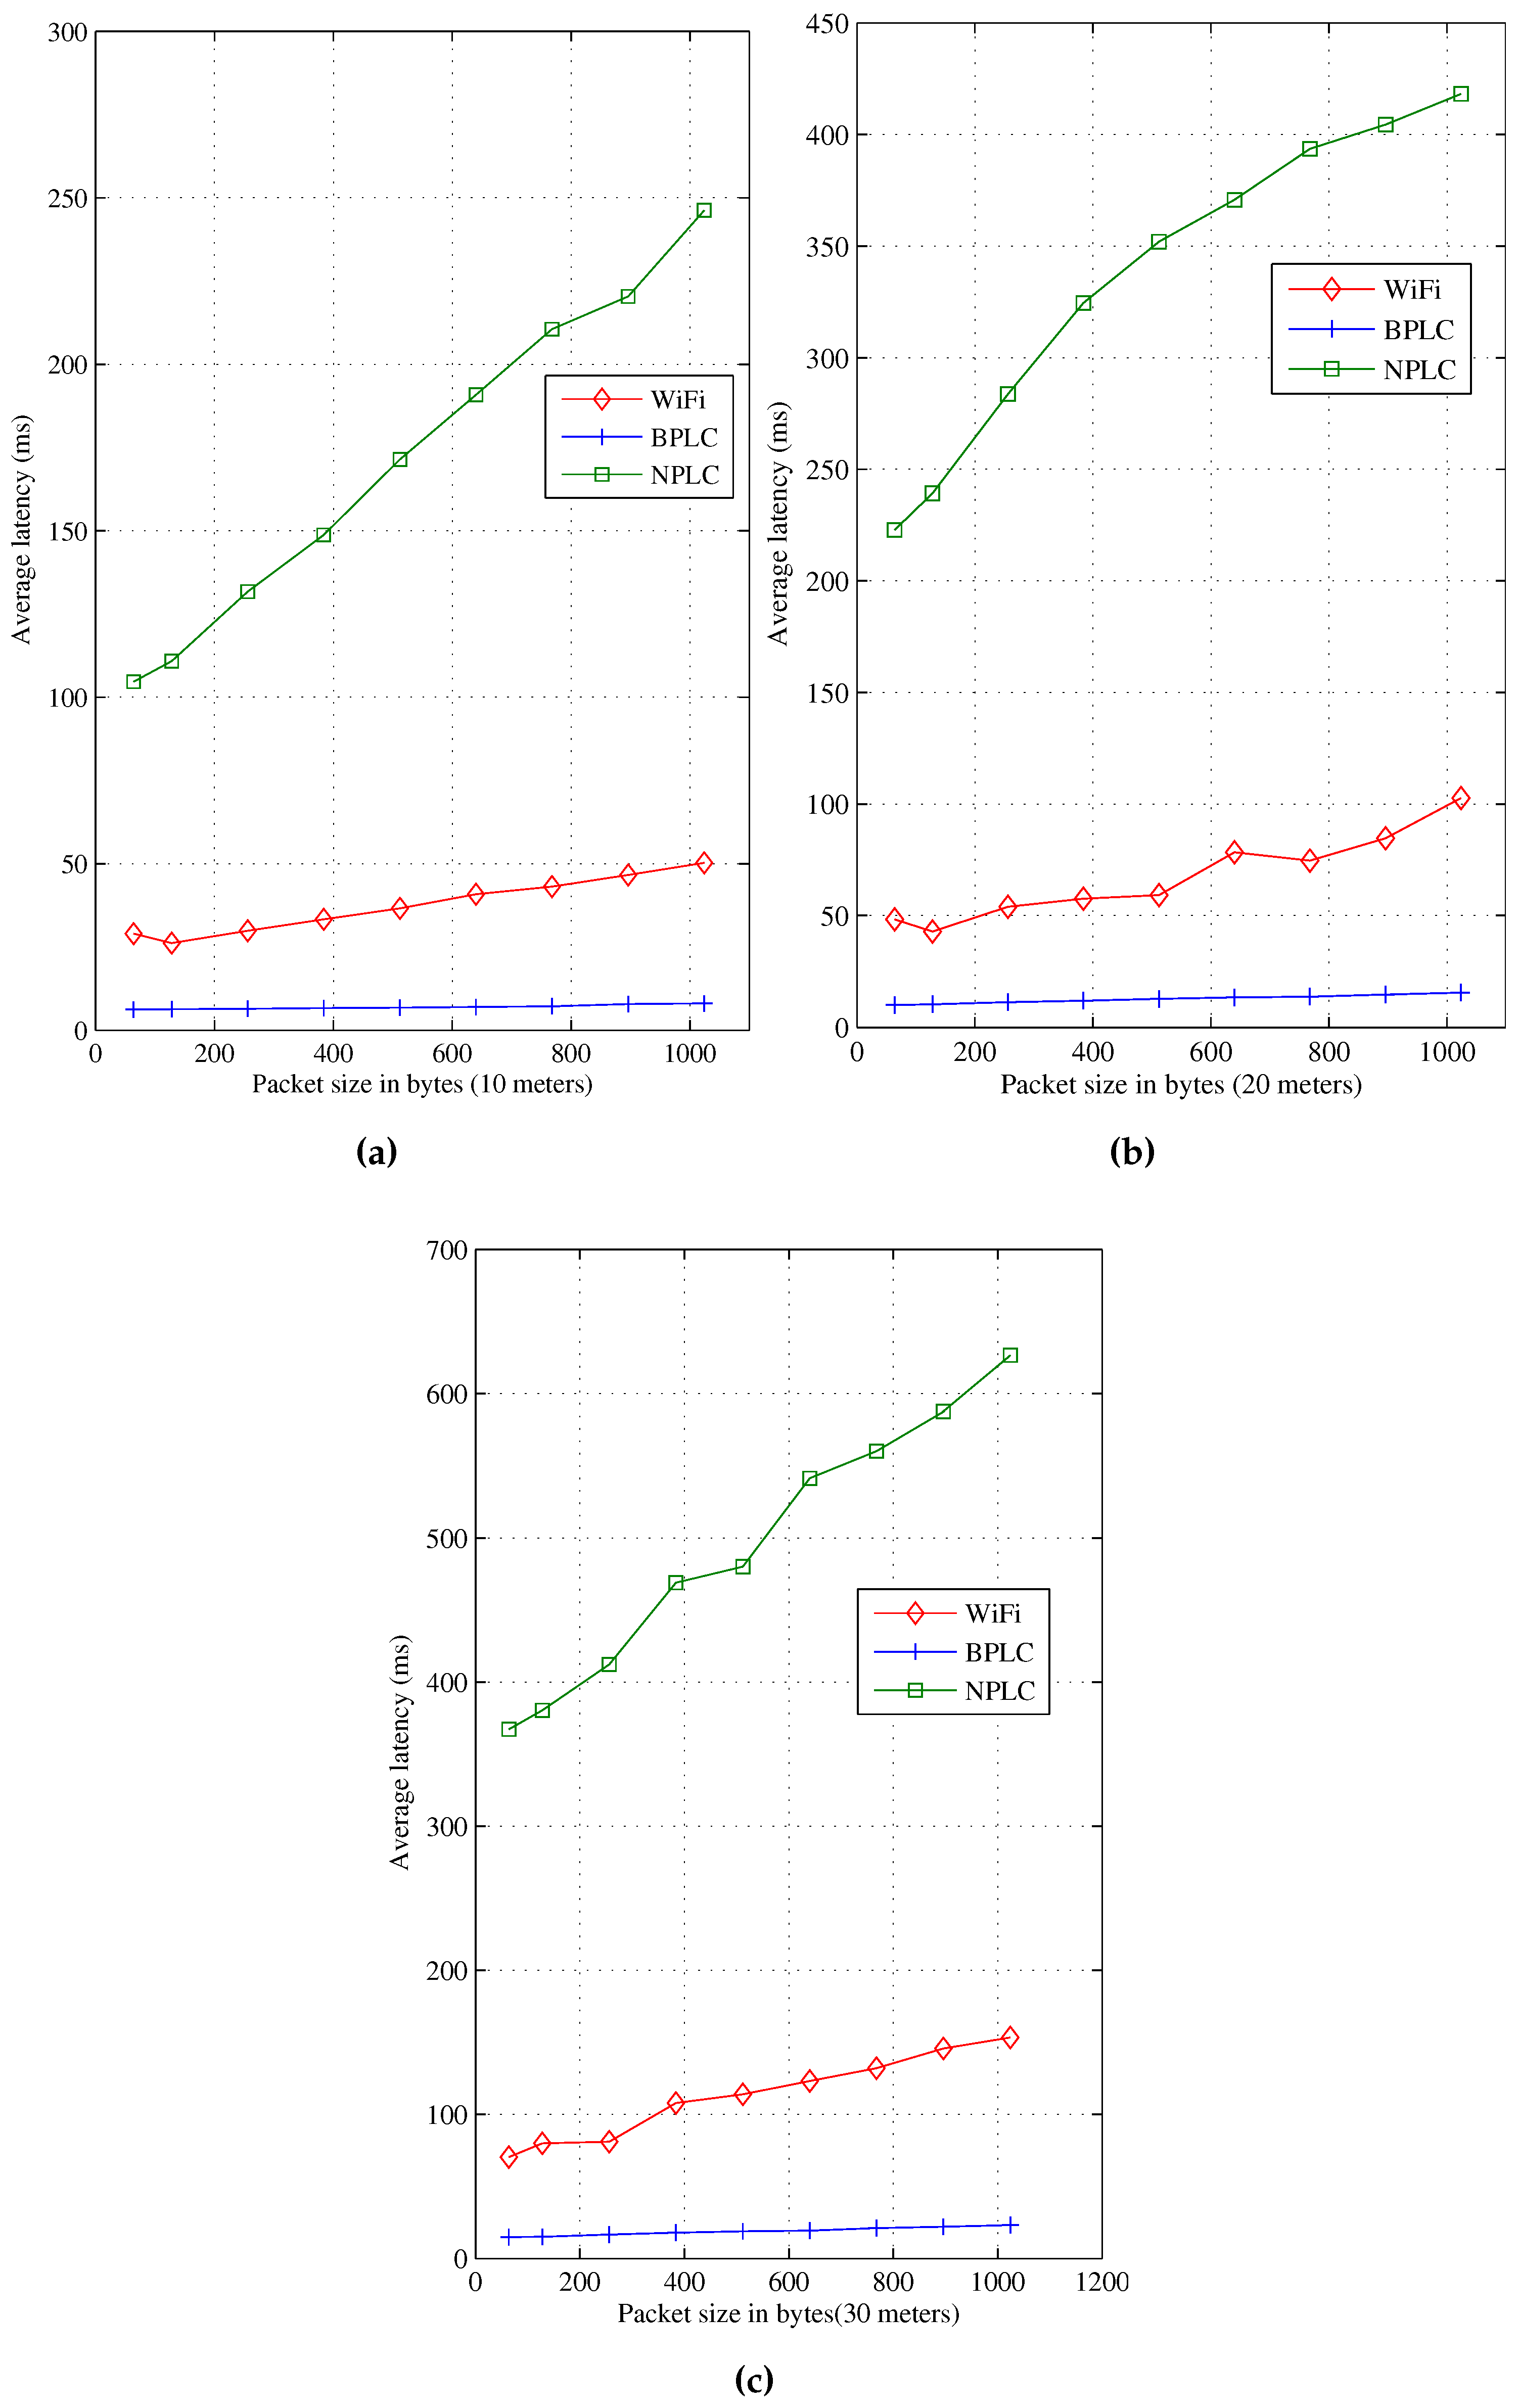
5.3. Effect of Packet Size on Latency
It can been observed from
Figure 3 and
Figure 6 that the three communication systems in the last mile achieved 100% packet delivery for cluster size 10–30. Given this level of reliability, our aim in this subsection is to determine whether there are other factors that could affect performance, and, if they exist, investigate to what extent they can offset system performance. We therefore select cluster sizes 10, 20 and 30 and study the effect of packet sizes on latency. The results are illustrated in
Figure 9.
Figure 9 depicts variation of latency with different packet sizes for cluster sizes of 10, 20 and 30. We observe that while large packet size transfers more data per time given that overhead is fixed, it does not guarantee timely delivery of the packets. The impact of large packet size is worse in channels with low data rate as large packet occupy the channel for a longer duration than small ones. On the other hand, sending many small messages is less efficient as the overhead is duplicated in all packets; however, smaller packets are faster to deliver, resulting in lower latency, and are less prone to error.
Figure 9 clearly shows that the performance gap between Wi-Fi and NPLC widens as the application packet size increases. It is therefore recommended that, in meeting QoS requirements of AMI traffic, efficiency should be matched with latency to determine application size. From the point of view of backhaul, these figures show that BPLC is capable of meeting these requirements.
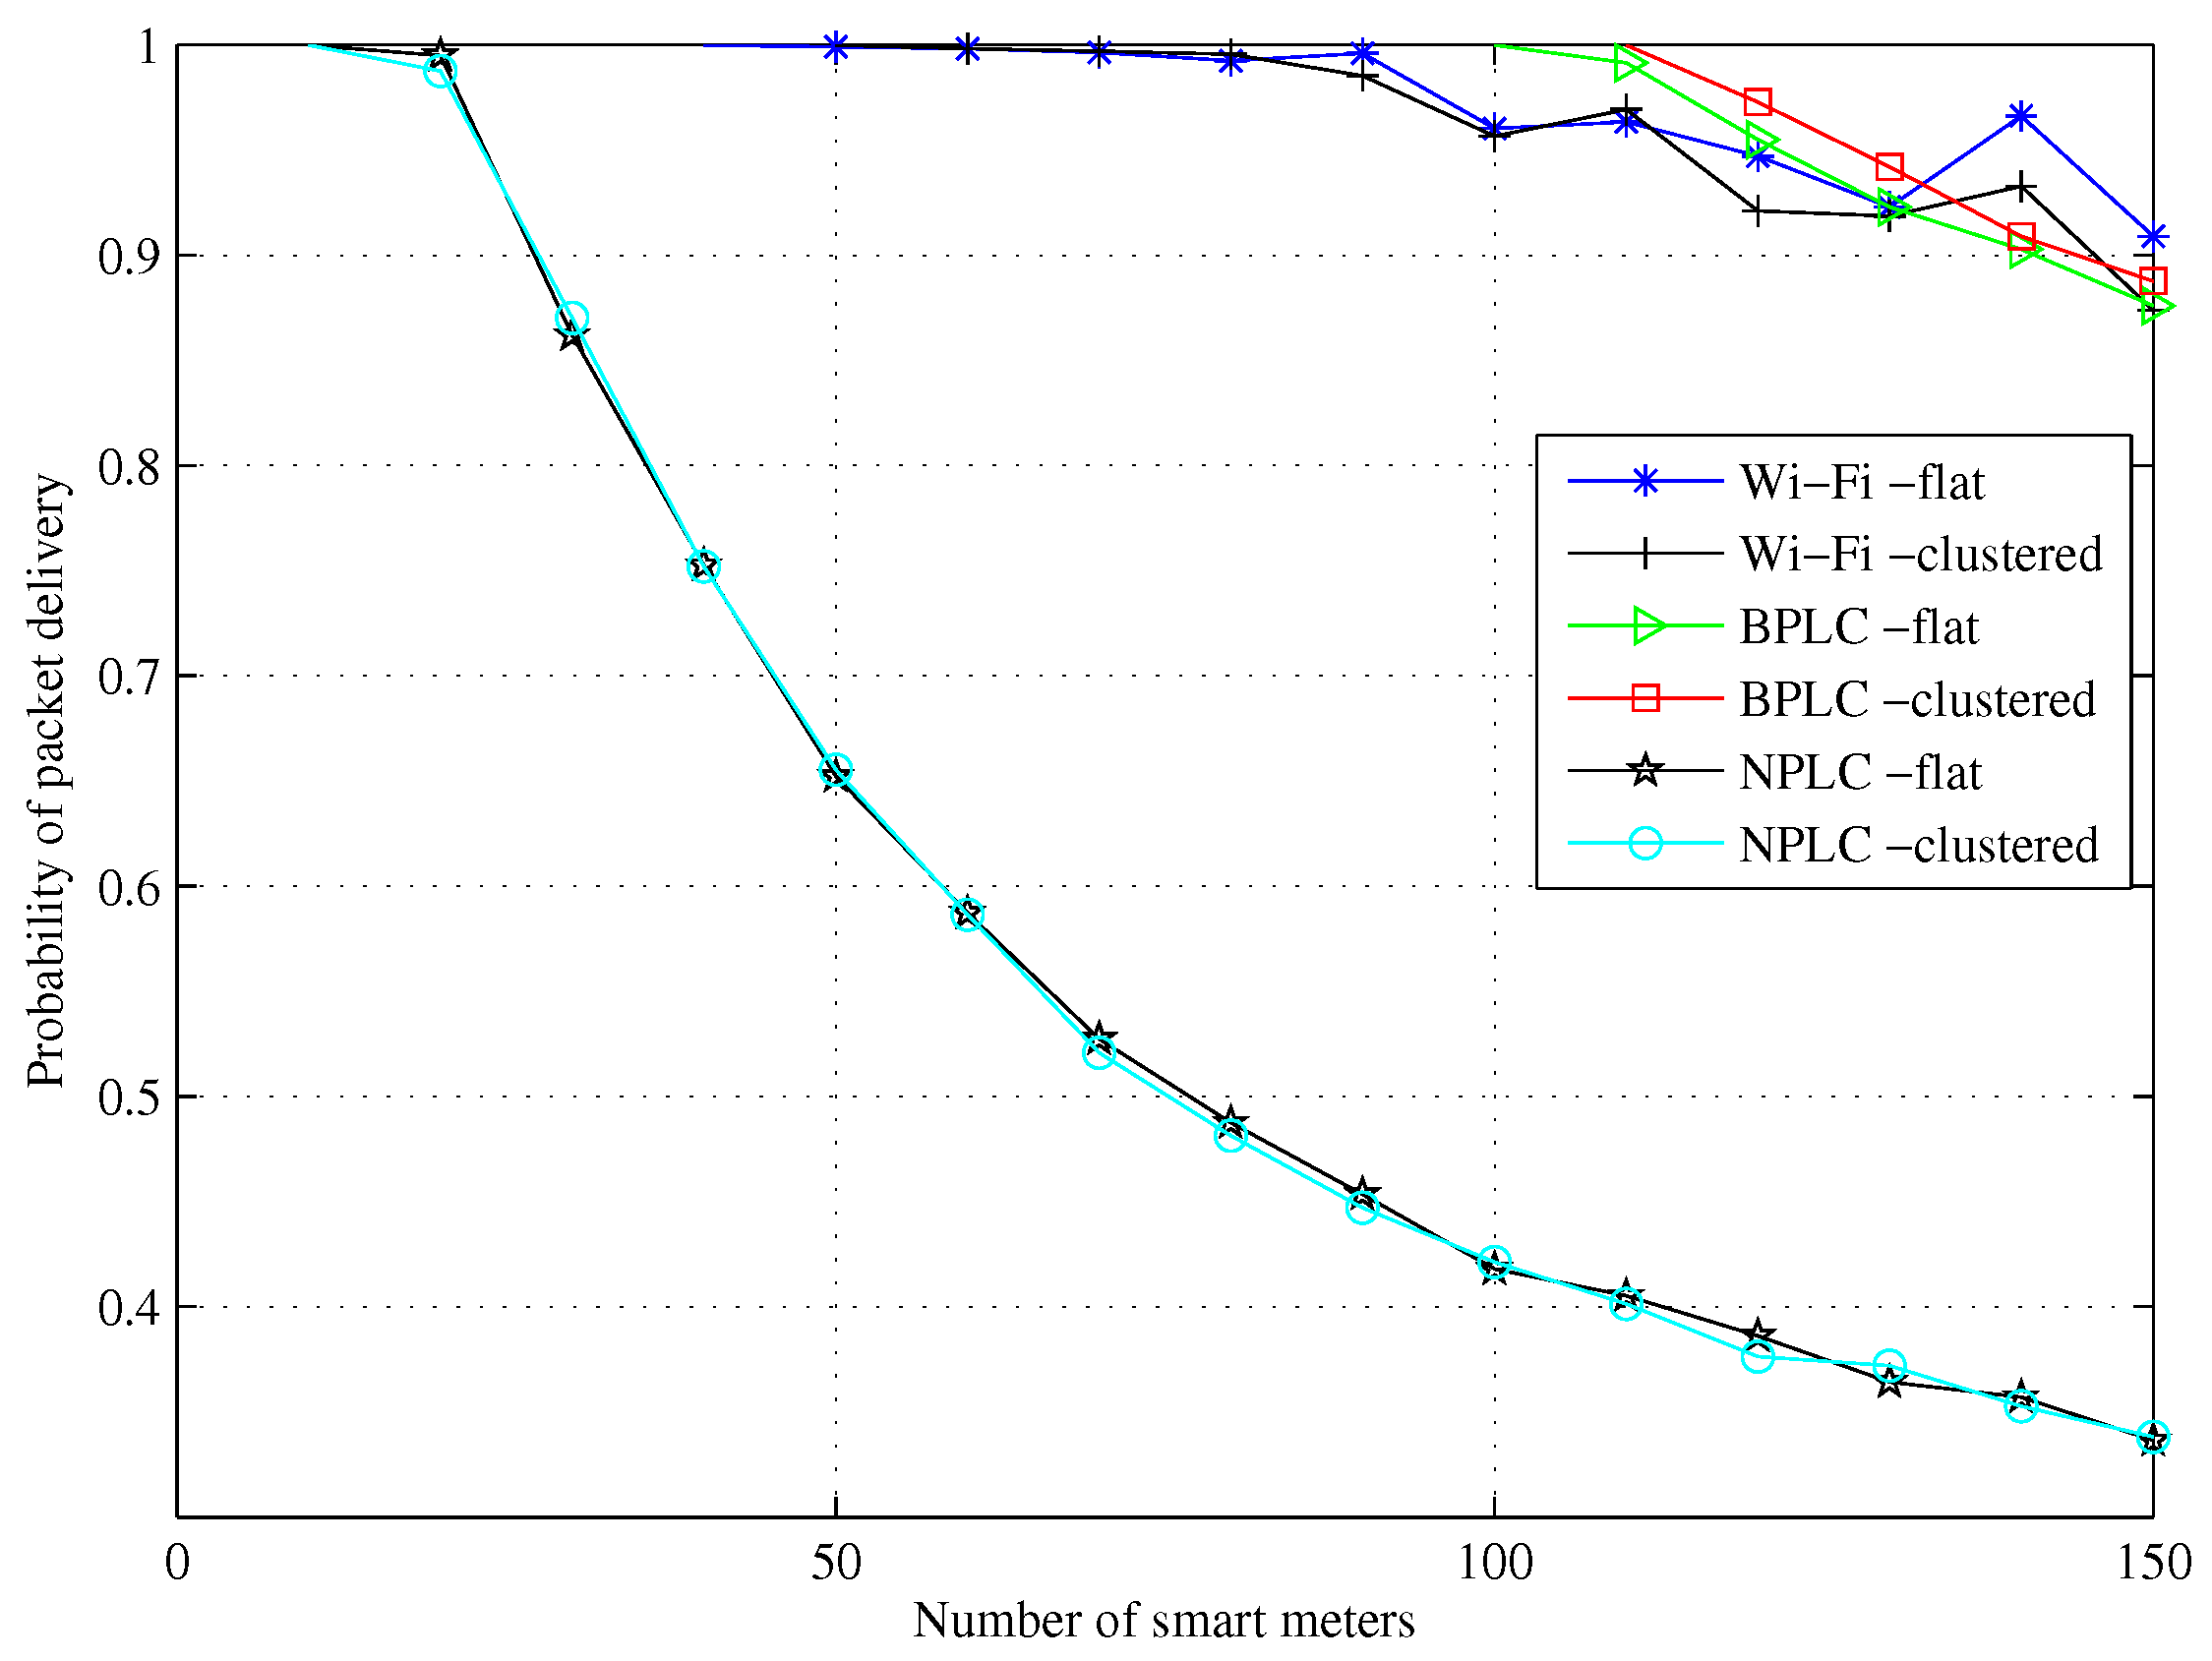
5.4. PPD Performance
In this subsection, while clustered and flat (without DC) networks are compared and the impact of aggregation is discussed. The effect of DC position on probability of packet delivery (PPD) is also examined. PPD is defined here as the ratio of received to transmitted packets in a given flow. Since this quantity bears direct consequences on application, it is adopted as a measure of network reliability.
Figure 10 illustrates the PPD performances of Wi-Fi, BPLC and NPLC in flat and clustered networks. As can be seen from
Figure 10, for cluster sizes below 50 smart meters, Wi-Fi and BPLC are not affected by the DC. This is reasonably true given their capacities to push more data through the network compared with NPLC.
While Wi-Fi exhibited an improvement in packet delivery by approximately 0.4% with 80 smart meters and 0.6% with 110 smart meters respectively. With BPLC, the performance gain from the DC is most evident at cluster sizes 100 to 150 smart meters. One plausible explanation is that as the number of smart meters increases, the contention for network resources also increases. Therefore, the chances of smart meters at the far end of the cluster to successfully deliver packet within the allotted time diminishes which translates to coverage limitation. The benefit of an DC in this case is to help enhance packet delivery and improve network coverage. In the case of NPLC, performance fluctuates with different cluster sizes. The maximum improvement of 1% is observed at cluster size 30 while the highest penalty of % is observed at 120 smart meters. Apart from 110, for clusters between 60 and 150 m, DC adversely affected the PPD. It is worthy to note that although DC, being a relay, contributes to network latency, its benefit is still visible because despite the additional latency, end-to-end delay falls within acceptable limits.
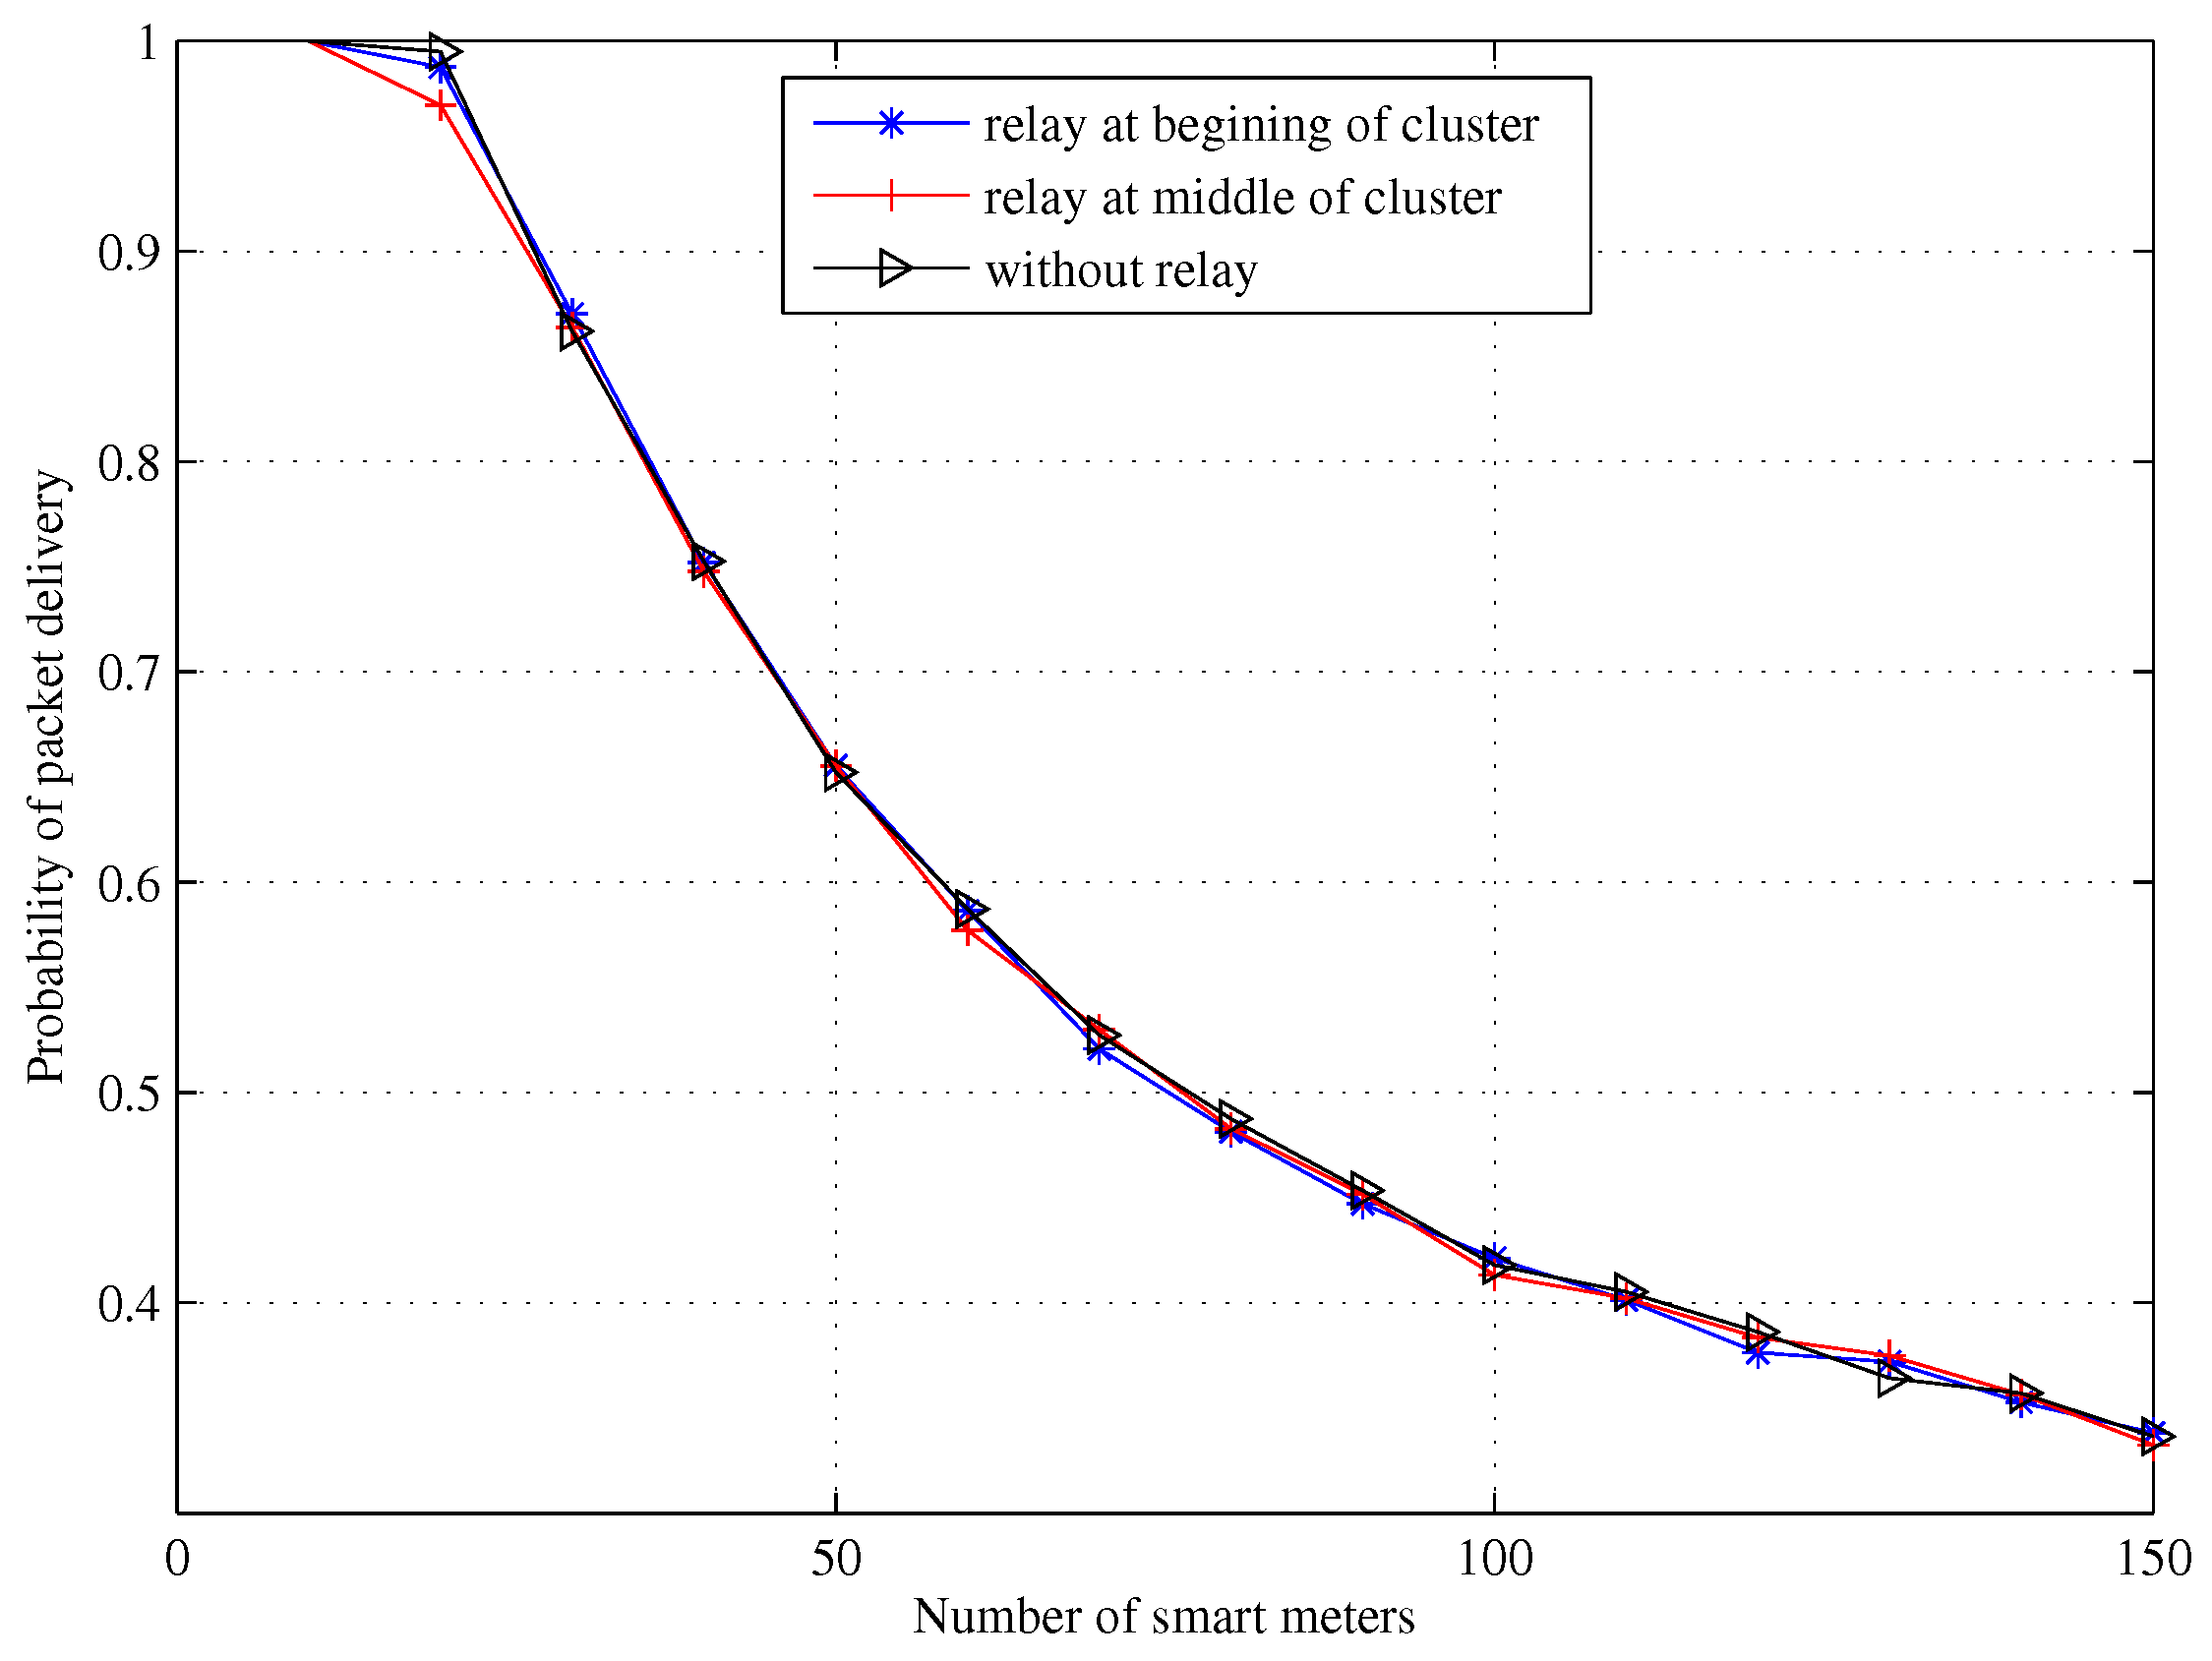
Figure 11 shows the effect of DC position on PPD performance when NPLC lastmile is used. As seen in this figure, the effect of DC is negative for cluster sizes up to 20 smart meters, hence aggregation is not recommended for small cluster sizes, except where the smart meters are widely dispersed and direct communication with concentrator is not feasible. It can also be seen that with the DC at the beginning of the cluster, PPD improves at 30, 50, 100 and 150 cluster sizes. The maximum improvement occurred at 30, where PPD increased by approximately 1%. With the DC at the middle of the cluster, PPD improved at 30, 50, 70 and 130, the maximum occurred at 130 where it rose by approximately 3%. Though these improvements in probabilities are small, they could potentially increase the number of successful reading uploads by smart meters.


