1. Introduction
Globally, while the construction industry has made a major contribution to social and economic development, a great deal of energy and many resources are used in construction [
1]. The construction process consumes 40% of the world economy’s resources and is responsible for 40% to 50% of the greenhouse gases (GHGs) generated [
2]. A lot of CO
2 is emitted during the material manufacturing, transportation and construction stages [
3,
4]. The construction process is therefore a very significant factor environmentally [
5]. In addition, the CO
2 emission factor is very important in the construction industry [
6], and the amount of energy and number of materials consumed during the construction process is considerable [
7]. During the life cycle of a building, a large amount of CO
2 is also generated in the operation process. Most previous research has focused on CO
2 emissions from construction materials [
8,
9,
10,
11,
12] and a few studies have been conducted on CO
2 emissions resulting from the building material manufacturing process and on the energy consumption of construction equipment [
6], transportation for materials, and treatment of waste [
13,
14]. However, there is still a lack of studies related to GHG or CO
2 emissions in the construction process that target the actual construction site [
15].
This study deals with the environmental impact of CO
2 emissions in the material production phase, transportation phase, construction phase, and waste treatment phase of the construction site. In the study of the material production phase, the Korea Life Cycle Inventory Database (LCI DB) was used to determine CO
2 emissions for each task, and the actual amount of oil consumption for transportation equipment was identified in the material transportation phase. In the construction phase, the amount of oil used in the construction equipment [
16,
17,
18] and the amount of electricity consumed in the temporary office were calculated separately. In the waste treatment process, CO
2 emissions from the transportation phase, intermediate treatment phase, and landfill phase were estimated. In this regard, the aim of this study is to calculate accurate and quantitative CO
2 emissions through the measurement and estimated results of CO
2 generated from the construction site, and to propose alternatives for the reduction in CO
2 emissions that arise from the construction process.
2. Measurement and Calculation Methods
2.1. Methods
While the life cycle of buildings is usually divided into the production of materials, transportation of materials, construction phase, operational and maintenance phase, and dismantling and disposal phase [
19,
20,
21], in this study it was divided into the material production phase, material transportation phase, and on-site construction phase. While there are six types of main factors contributing to global warming (CO
2, CH
4, N
2O, HFCS, PFCS, and SF
6), as defined in the UN Framework Convention on Climate Change, the subject of this study is the calculation of CO
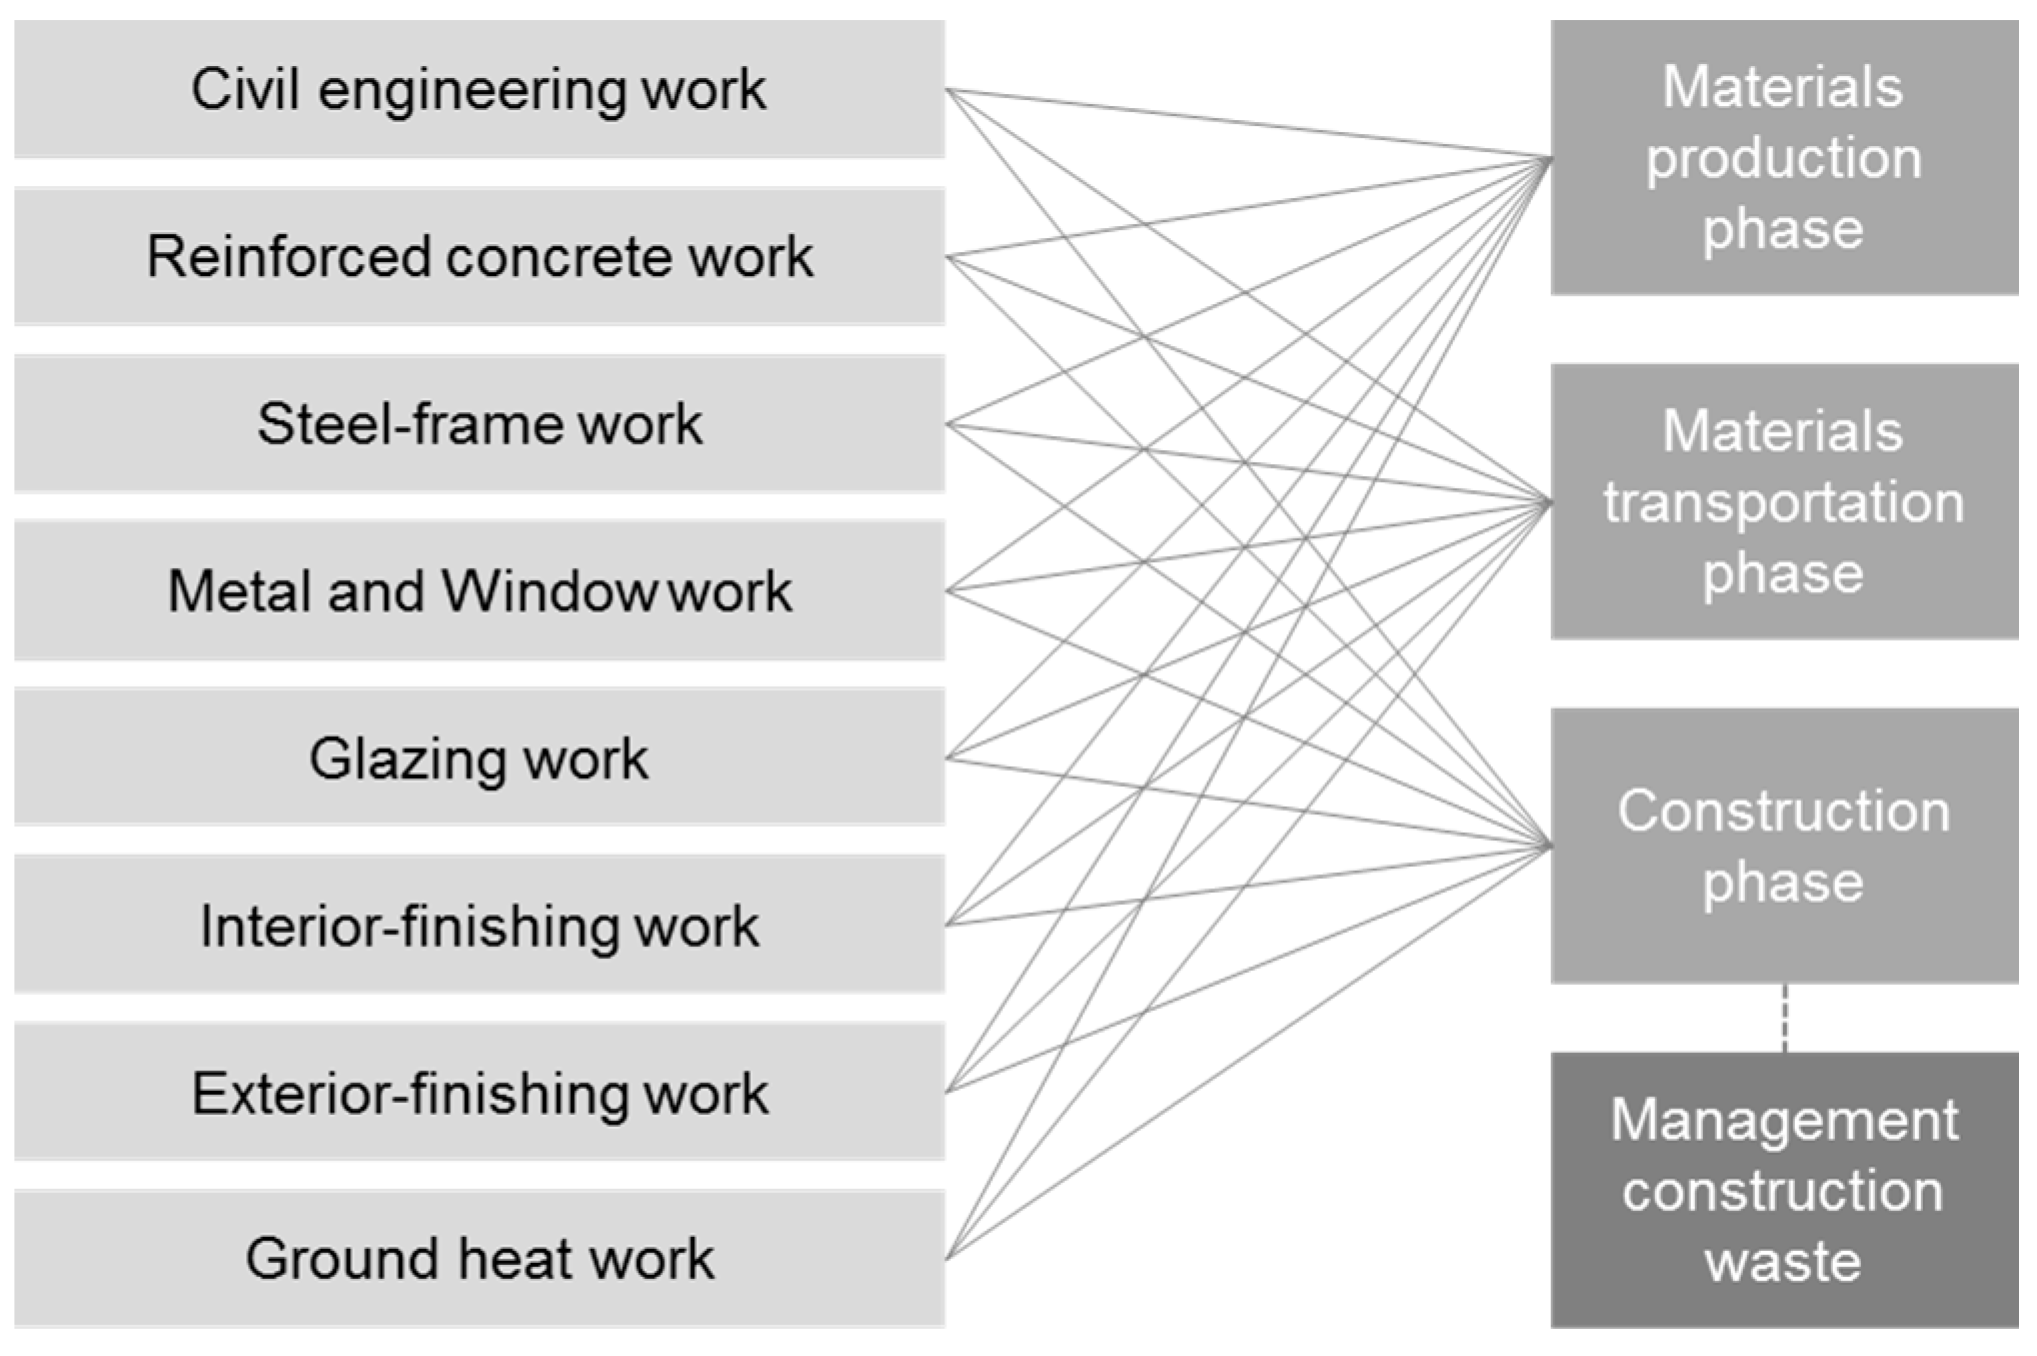
2 emissions. The subjects of evaluation for each type of work are shown in
Figure 1, and detailed construction processes are listed below:
- (1)
Civil engineering works: soil cement wall (SCW) work, pre-stressed high-strength concrete (PHC) pile work, earthwork, appurtenant work;
- (2)
Reinforced concrete works: rebar, formwork, concrete construction, lifting, and temporary work;
- (3)
Steel-frame works: steel structure erection, deck plate;
- (4)
Metal and window work;
- (5)
Glass work;
- (6)
Interior finishing works: masonry/plaster work, waterproof work, painting/insulation work;
- (7)
Exterior finishing work;
- (8)
Ground heat construction: closed/open loop.
In addition, CO2 emissions were included with respect to the treatment of wastes generated from the construction process. However, landscaping and electrical construction, and HVAC equipment construction completed after the evaluation period were excluded from the scope of this study.
2.1.1. Calculation Method for Material Production Phase
For the selection of materials according to work type, the quantity of input materials that account for more than 90% of the material cost was calculated based on the quantity calculation and itemized statements, prioritizing the key materials. Carbon emissions according to the material inputs were estimated using Korea LCI DB information network [
22]. The Korea Environment Industry & Technology Institute has compiled a Life Cycle Inventory Database of the materials according to the ISO 14044 process.
2.1.2. Calculation Method for Material Transportation Phase
In order to calculate the amount of oil consumption in the material transportation phase, the type of transport equipment, specifications, transport distance, oil used, and oil consumption rate were investigated according to the materials introduced for each process and method. Since fuel economy varies depending on the load capacity, driving speed, road condition, and latency, additional investigations on the actual oil usage logs, vehicle instrument panel (oil gauge), and interviews with drivers were conducted for exact calculation. If it was difficult to identify the actual amount of oil consumption, the average fuel economy of the vehicle to transport the materials was used.
2.1.3. Calculation Method for on-site Construction Phase
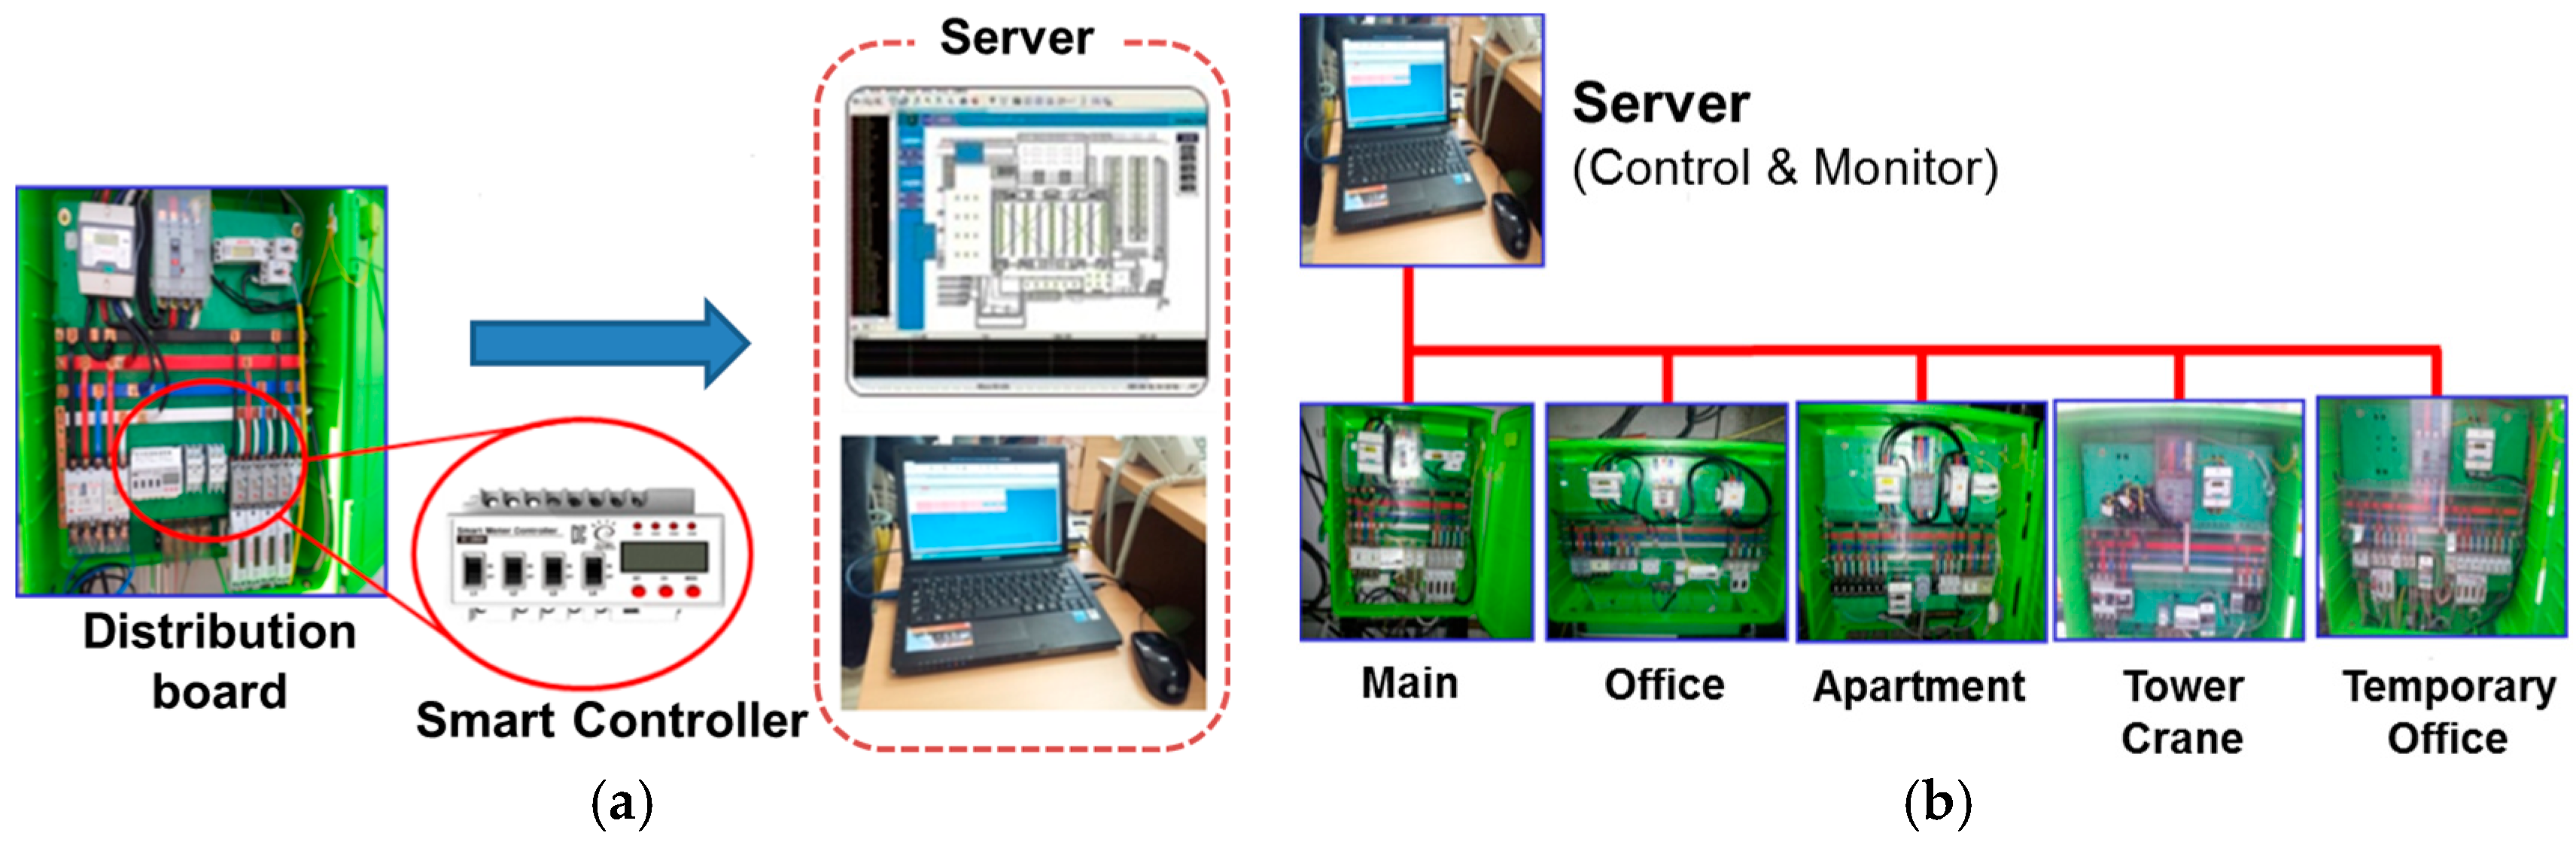
The amount of energy consumption in the on-site construction phase was subdivided into oil and electricity consumption for calculation. Oil energy sources were limited to diesel oil; gasoline and kerosene were excluded from the evaluation due to their minimal usage. The amount of electricity consumption was analyzed based on the measurement data after setting a remote meter reading plan prior to starting construction work. For monitoring of electricity consumption, the usage was divided into common temporary work, temporary office, direct construction, and lifting equipment as shown in
Figure 2, and the exact amount of electricity consumption was measured by the remoter meter reading, and then investigated and analyzed.
2.1.4. Calculation Method for Waste Treatment Phase
The waste treatment process CO2 emissions arising from the construction process were calculated by adding the CO2 emissions of the transportation phase, intermediate treatment phase, and landfill phase. The CO2 emissions due to electricity consumption and oil used for transportation of construction equipment were calculated.
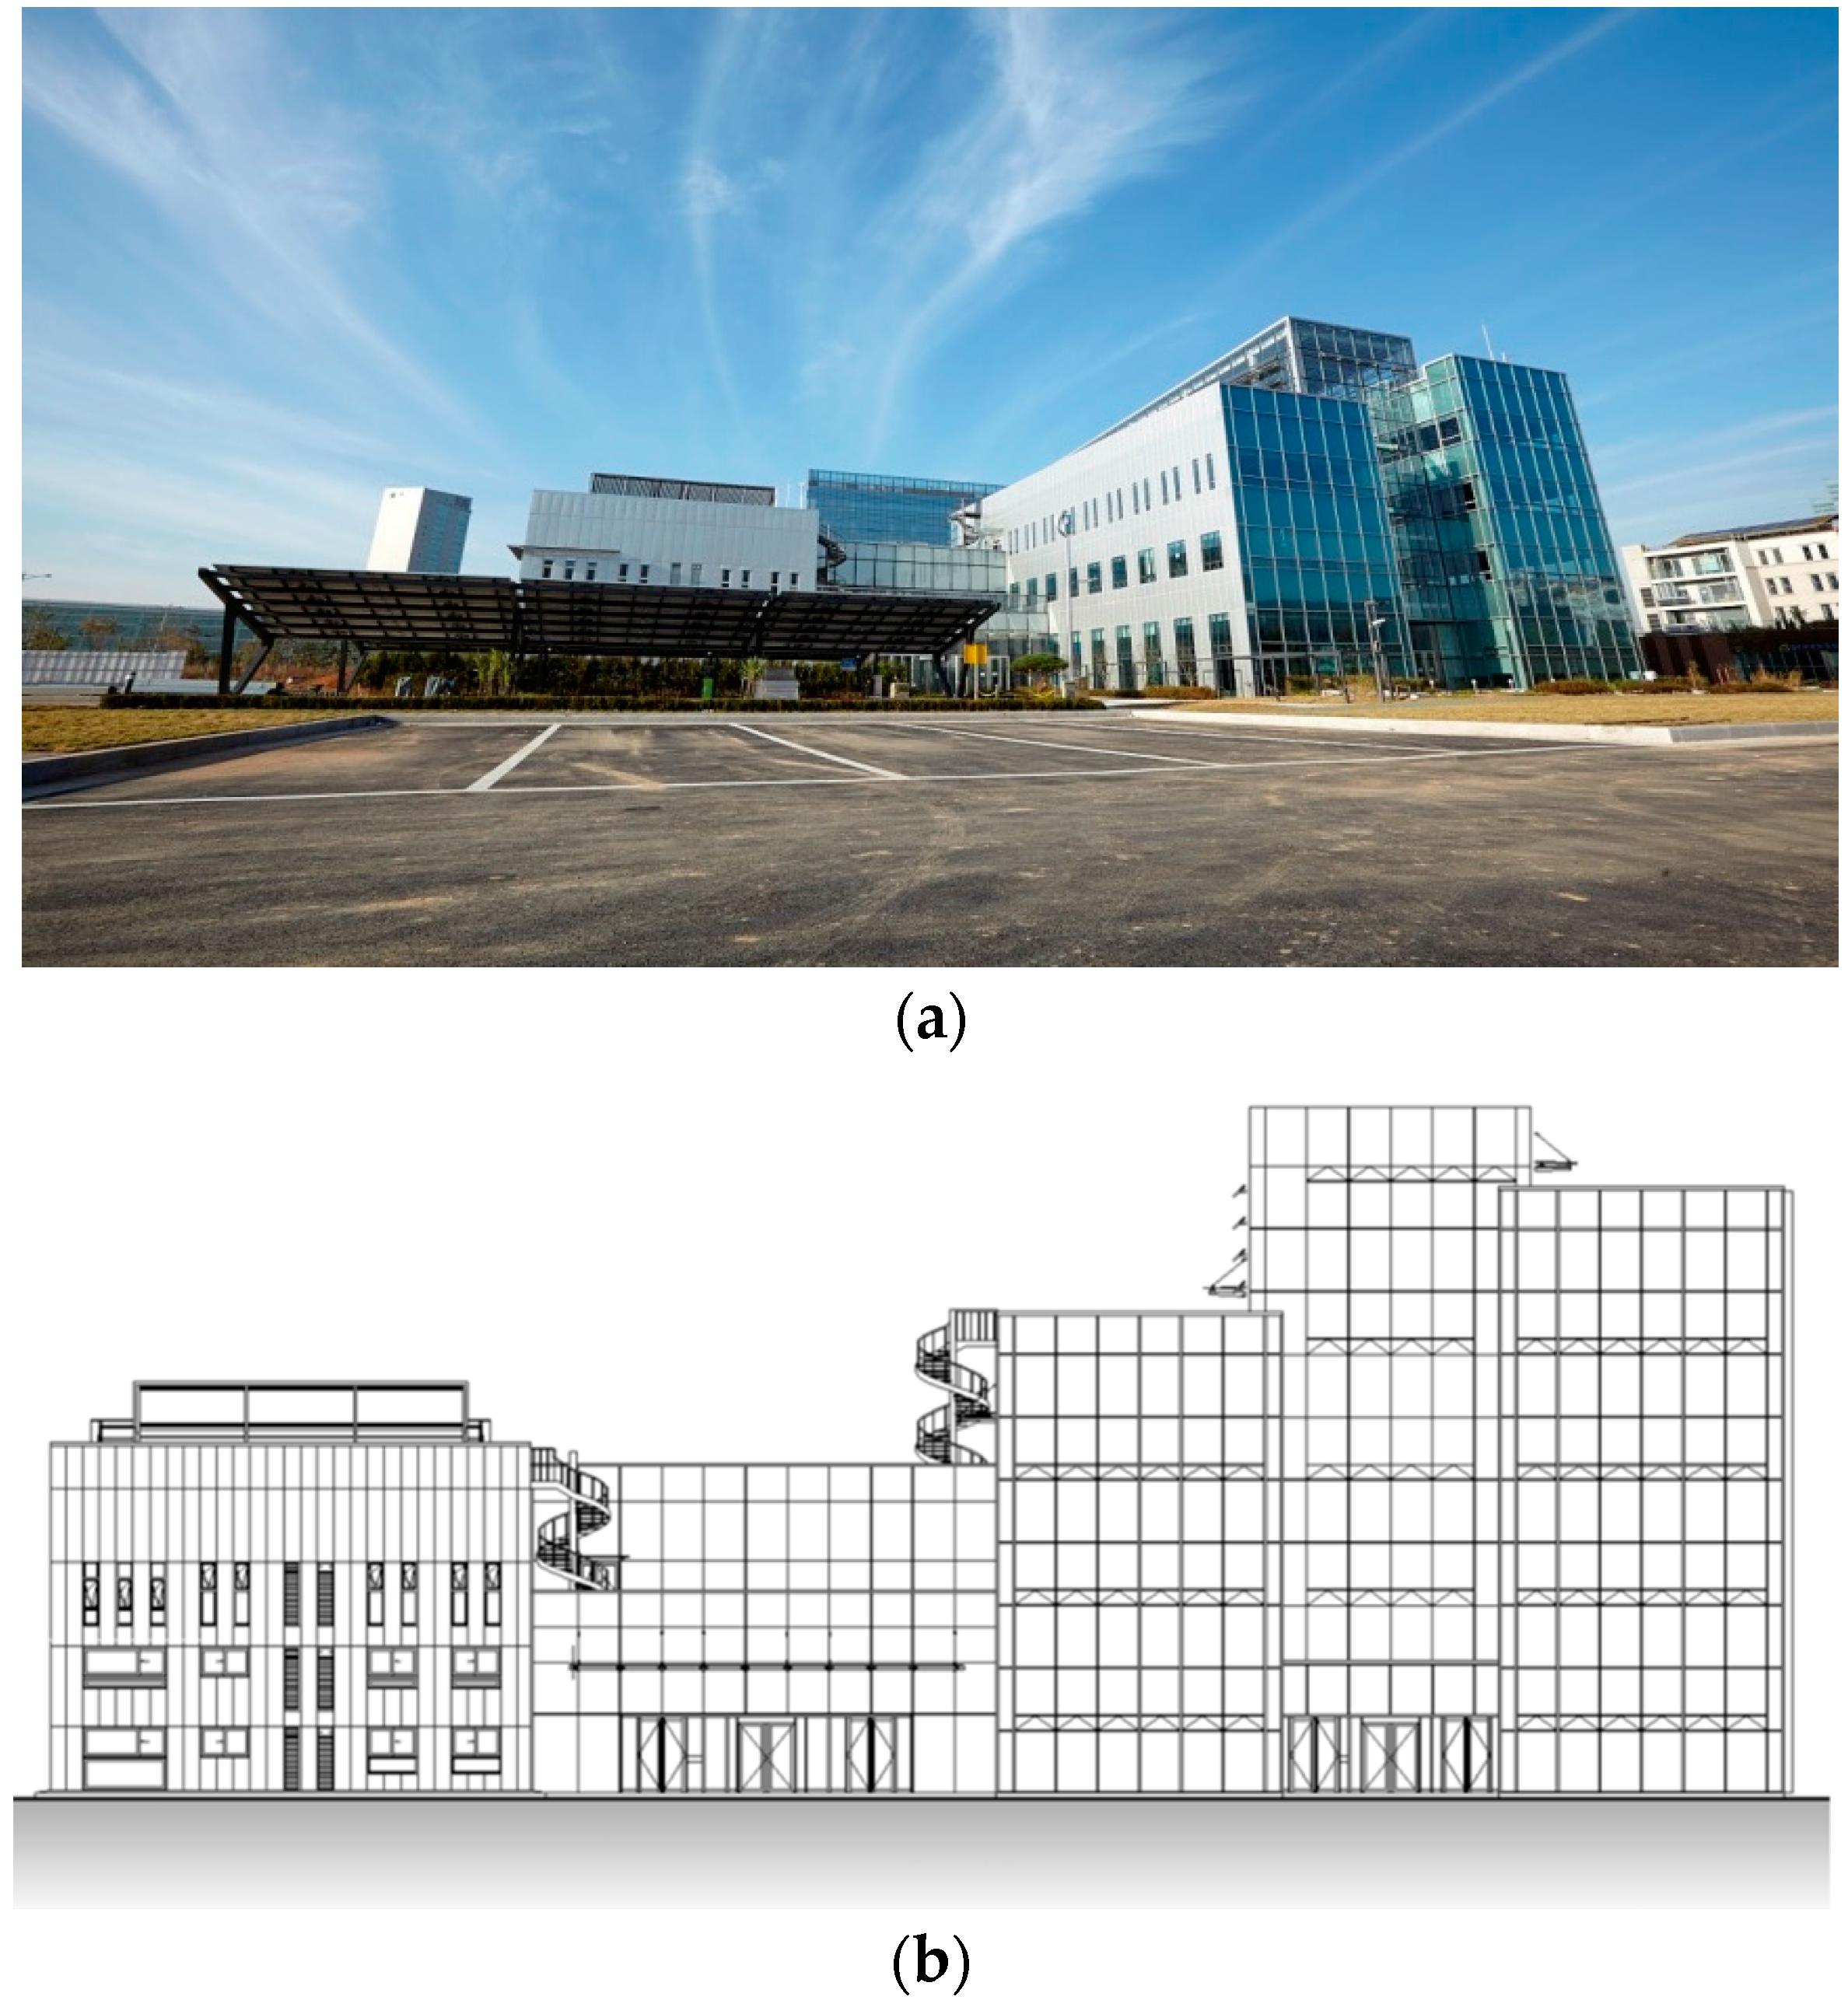
2.2. Case Study Building
The subject of evaluation is a building complex, including offices and apartment housing (
Figure 3 and
Table 1). The total construction period of the building is 12 months. The evaluation period of this study is from September to June, and all processes conducted during this period were investigated and monitored.
3. Results
3.1. CO2 Emission Analysis Results
3.1.1. CO2 Emissions in the Material Production Phase
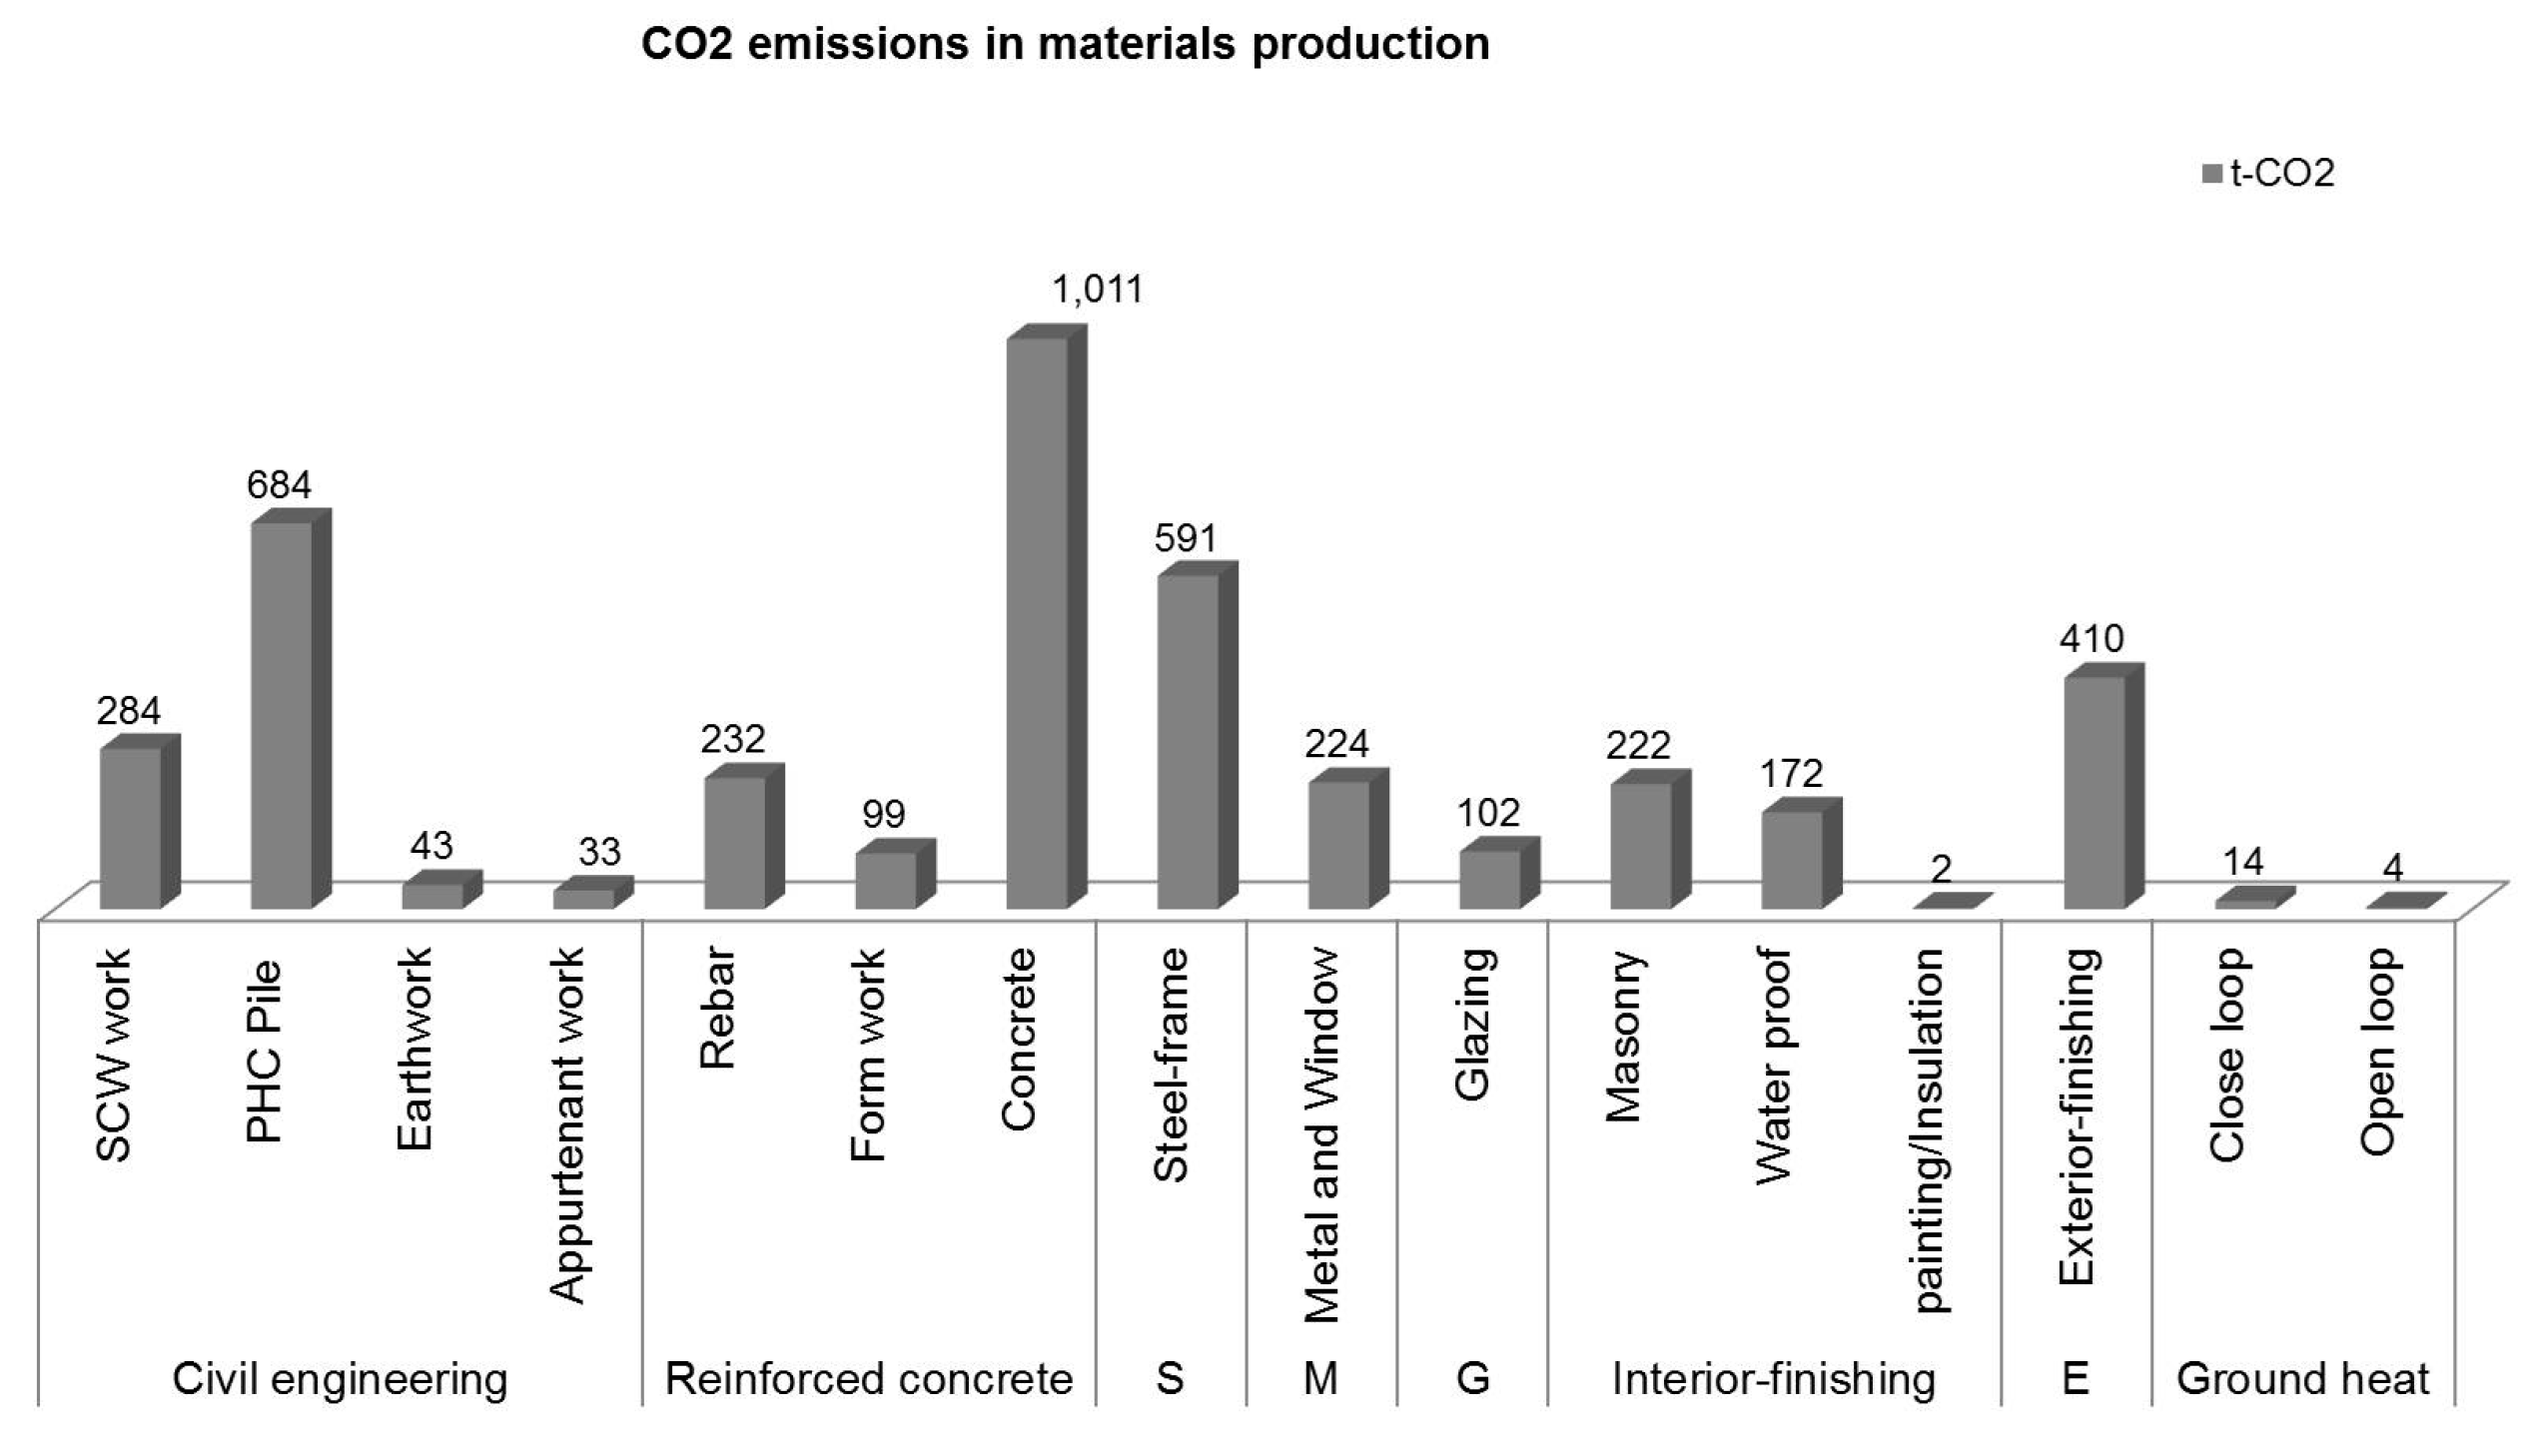
Examination of the CO
2 emissions in the material production phase according to the detailed process reveal that CO
2 emissions from ready-mixed concrete production in the concrete construction of the reinforced concrete works were calculated to be 1011.3 (t-CO
2), which accounts for the largest portion of 24.5% in the total CO
2 emissions from the material production phase, followed by 684.4 (t-CO
2) 16.6% of foundation work (PHC PILE), 591.2 (t-CO
2) 14.3% from steel materials of steel construction, 410.0 (t-CO
2) 9.9% from steel curtain walls of exterior work, and 284.2 (t-CO
2) 6.9% of SCW bulk cement. CO
2 from building materials of the top five detailed processes accounted for 72.2% of the total CO
2 emissions (
Figure 4).
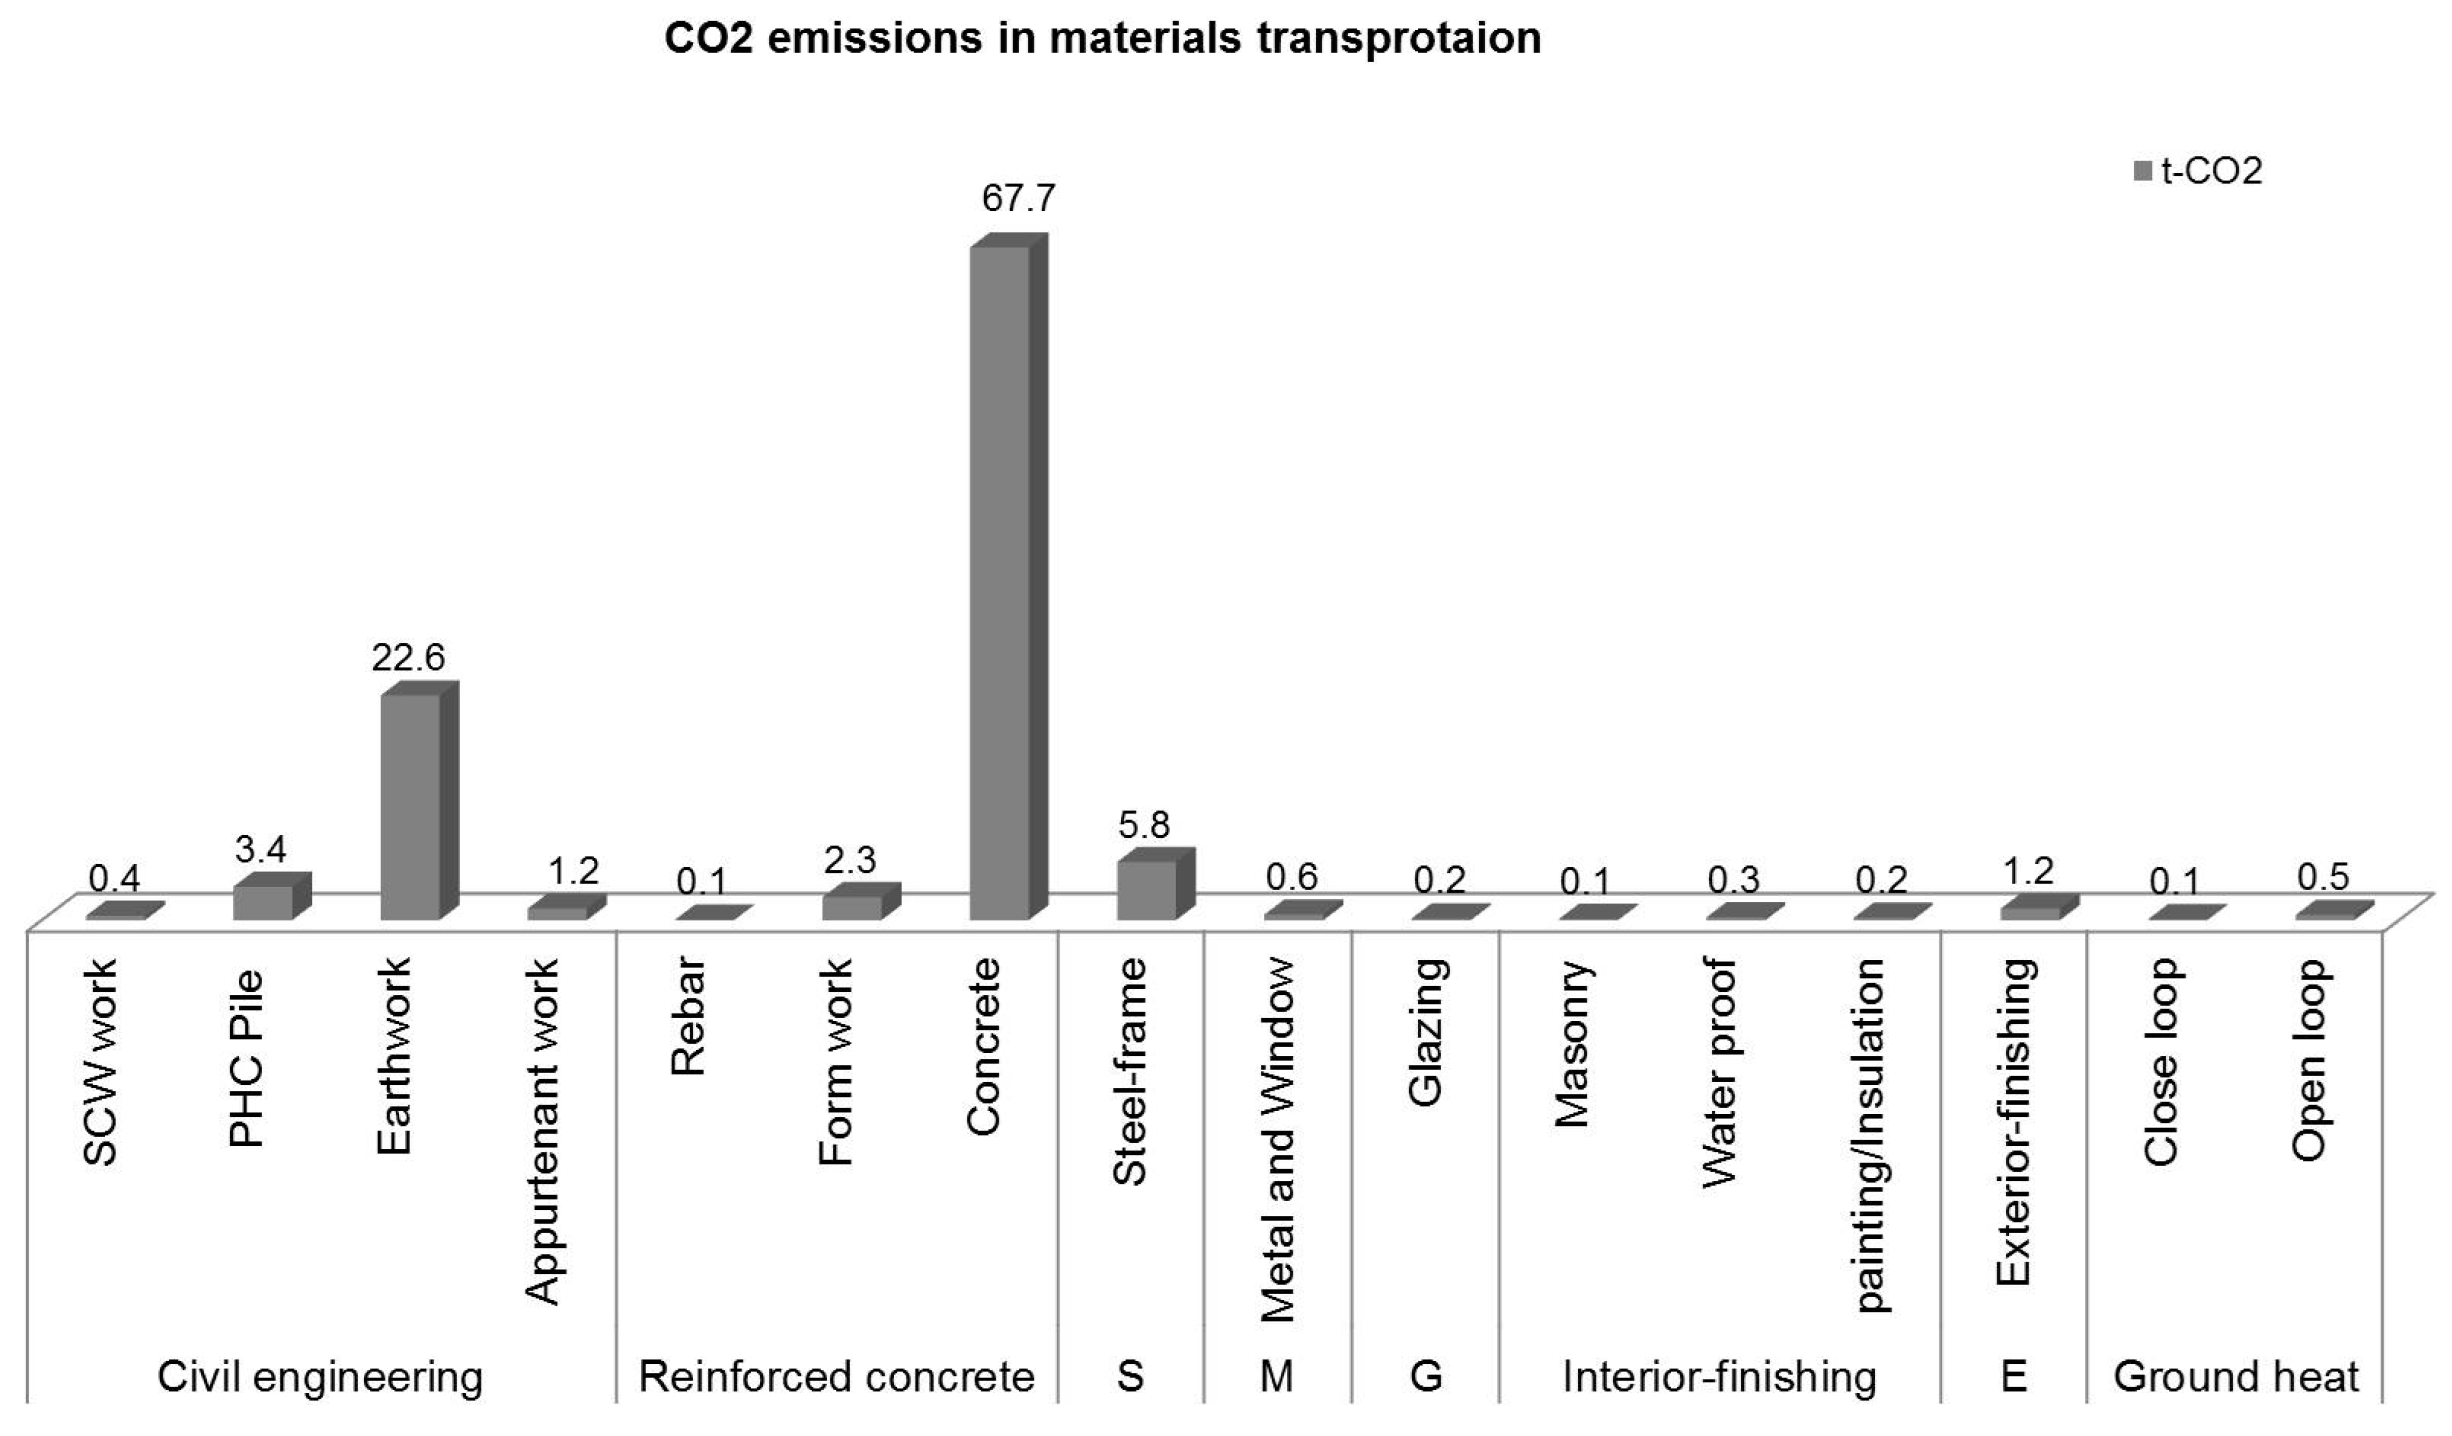
3.1.2. CO2 Emissions in the Material Transportation Phase
In the material transportation phase, the amount of CO
2 emissions was calculated to be 107.7 (t-CO
2), which comprises 2.4% of the total CO
2 emissions. CO
2 emissions from the ready-mixed concrete transportation of reinforced concrete works showed the highest figure with 68.7 (t-CO
2), corresponding to 63.4% of the total CO
2 emissions from the material transportation phase as shown in
Figure 5.
In the case of the ready-mixed concrete vehicle for transportation of concrete materials, the fuel economy was calculated by analyzing the round-trip distance from the place of shipment by the supplier and statement of oil use by vehicle, and the oil consumption of the vehicle was 26,093 L, which accounts for most of the entire transportation phase. In addition, the fuel economy was calculated to be 0.56 (km/L), which was significantly below the average fuel economy of 4.0 (km/L) of the vehicle specifications, showing the largest energy consumption in the transportation phase. This indicates that the transportation distance between the ready-mixed concrete factory and the site has the greatest effect on the CO2 emissions in the construction process.
In the case of earthworks, energy consumption can be reduced by utilizing the dumping site to minimize sediment transportation and the distance for backfilling. Therefore, CO2 emission was calculated to be 22.6 (t-CO2) 21.2%, followed by 6.8 (t-CO2) 5.5% from the transportation of steel materials of steel construction, and 3.4 (t-CO2) 3.1% of foundation work (PHC PILE).
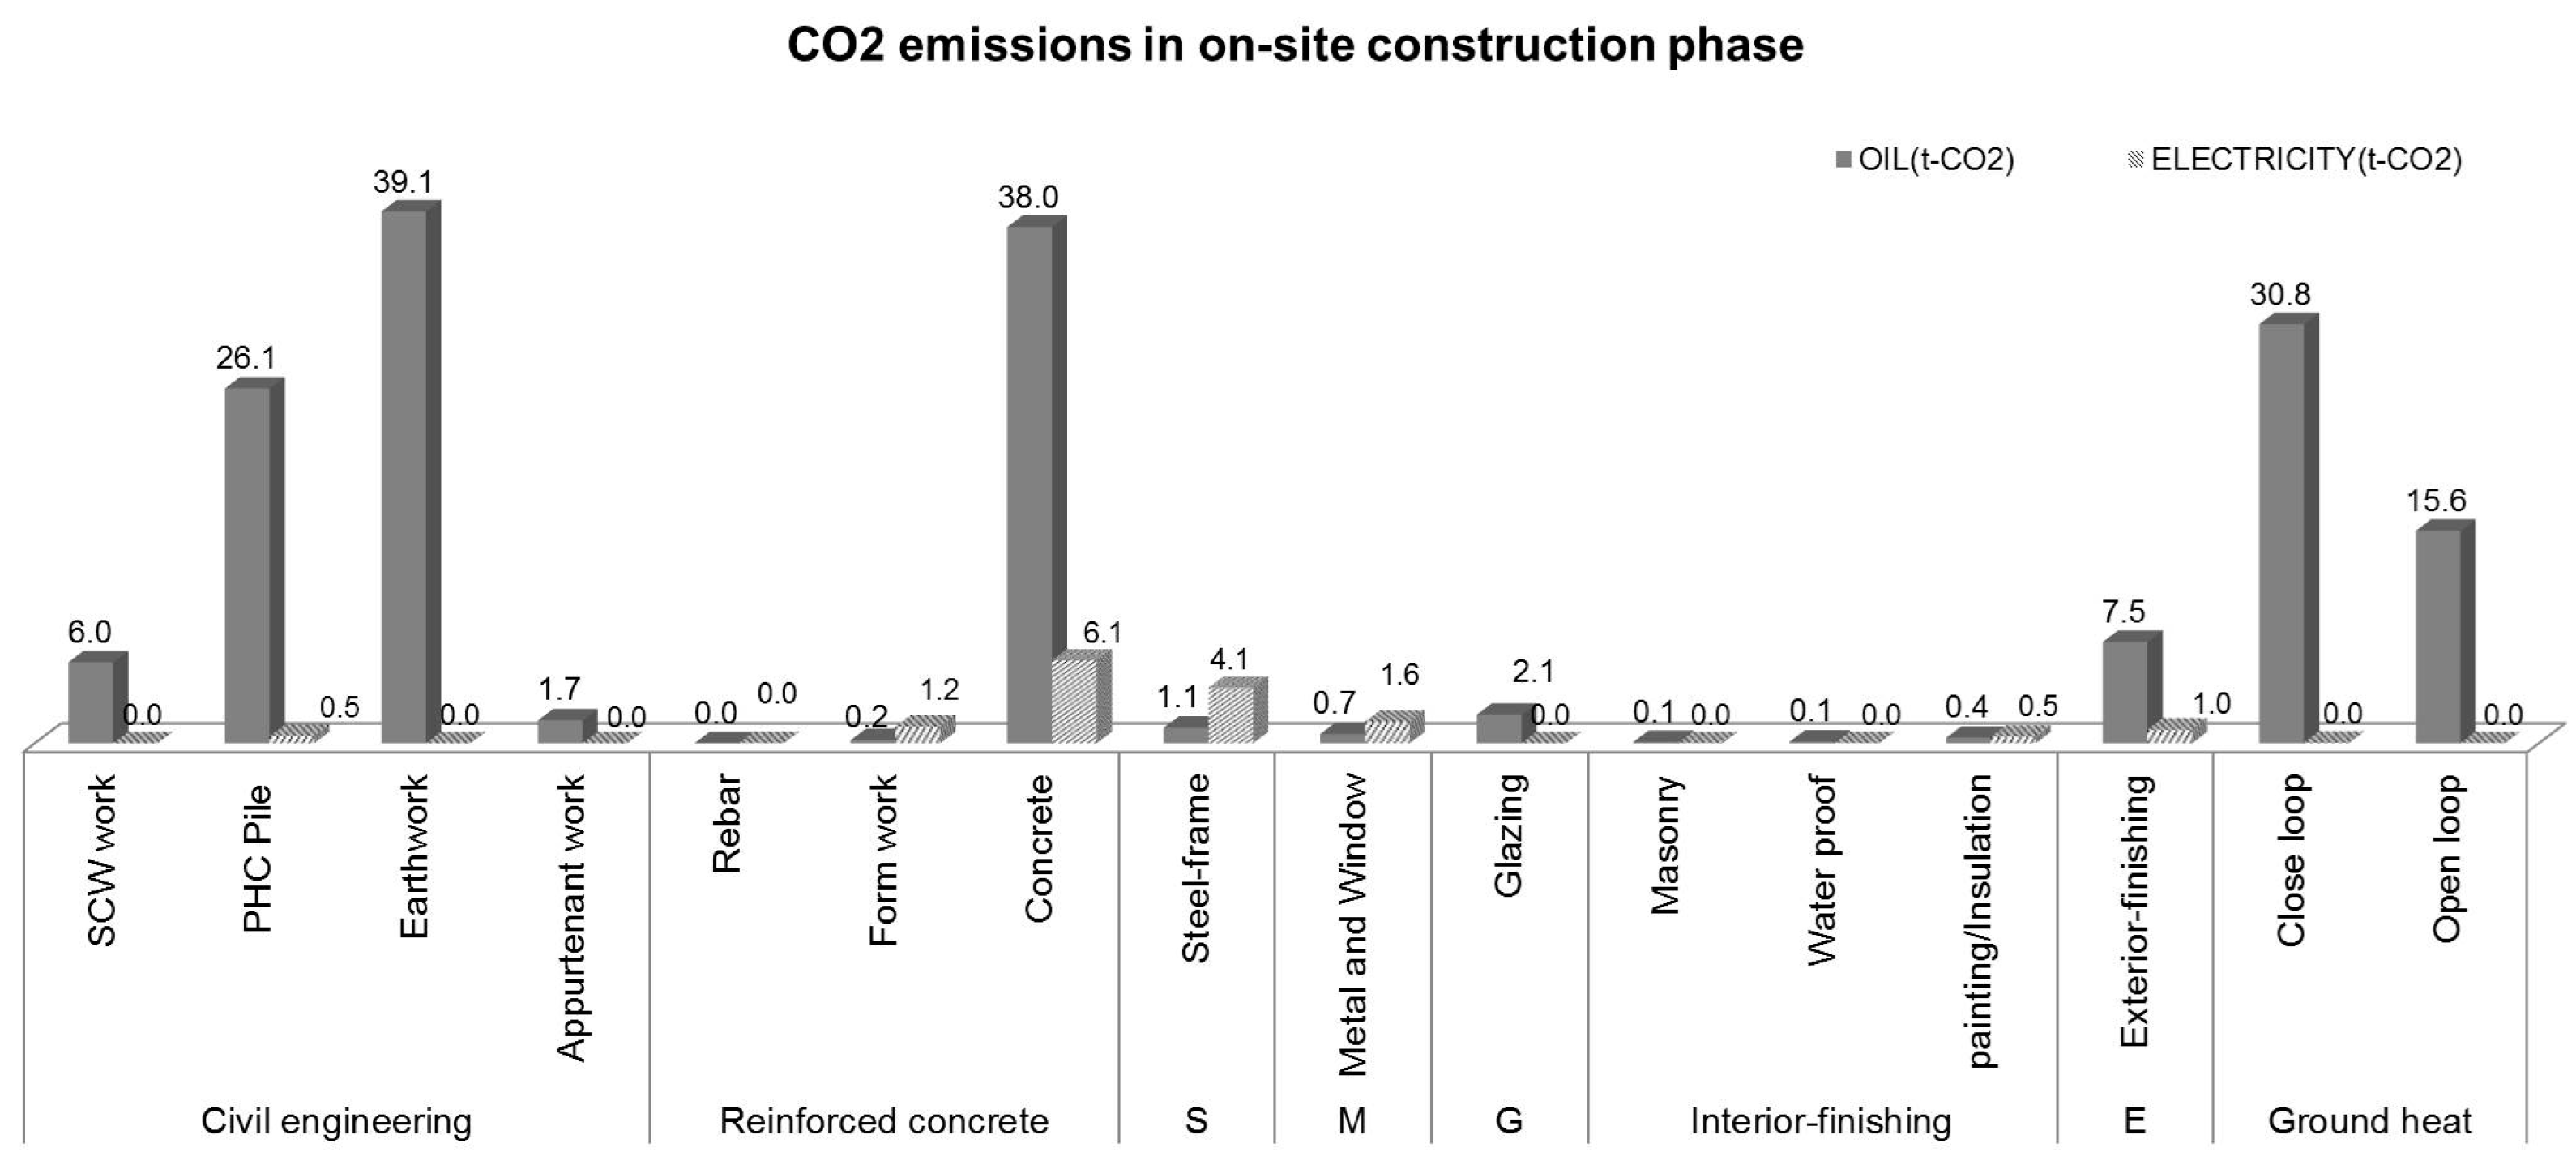
3.1.3. CO2 Emissions in the on-site Construction Phase
In the on-site construction phase, the oil and electricity energy consumption according to the detailed work processes is shown in
Figure 6. CO
2 emissions from the on-site construction phase was highest in reinforced concrete work that uses the largest quantities of equipment in the process with 44.1 (t-CO
2) 23.9%, followed by earthworks with 39.1 (t-CO
2) 21.2%, ground heat construction (close loop) with 31.9 (t-CO
2) 16.7%, foundation work (PHC PILE) with 26.7 (t-CO
2) 14.4%, and ground heat construction (open loop) with 16.6 (t-CO
2) 8.5%. CO
2 emission from these five work types corresponds to 84.6% of the total CO
2 emissions in the on-site construction phase, which indicates that the energy consumption due to the use of various construction equipment according to work methods in the construction process results in high CO
2 emissions.
3.1.4. CO2 Emissions in the Waste Treatment Phase
The waste treatment process is largely divided according to the physical property of waste as follows: (1) discharge, transport, demolition/incineration or treatment, recycling step; and (2) discharge and landfill step. The energy consumption and CO2 emissions of the waste transportation phase were then calculated.
The total amount of waste generated during the evaluation period was 530 ton, and the total oil consumption (diesel oil) in the transportation phase was 527 L. The total CO2 emissions from the waste transportation phase was calculated to be 1.4 (t-CO2).
Of the wastes discharged from the construction process, the materials with physical properties that require crushing, grinding, and incineration at the intermediate treatment company include construction sludge, waste concrete, and waste wood. With the use of oil (316 L) and electricity (787.1 kWh) consumption, the total CO2 emission was calculated to be 1.2 (t-CO2).
Mixed waste is immediately transported to the landfill for treatment. The oil consumption was 10.05 L, and thus the CO2 emission was calculated to be 26.06 (kg-CO2).
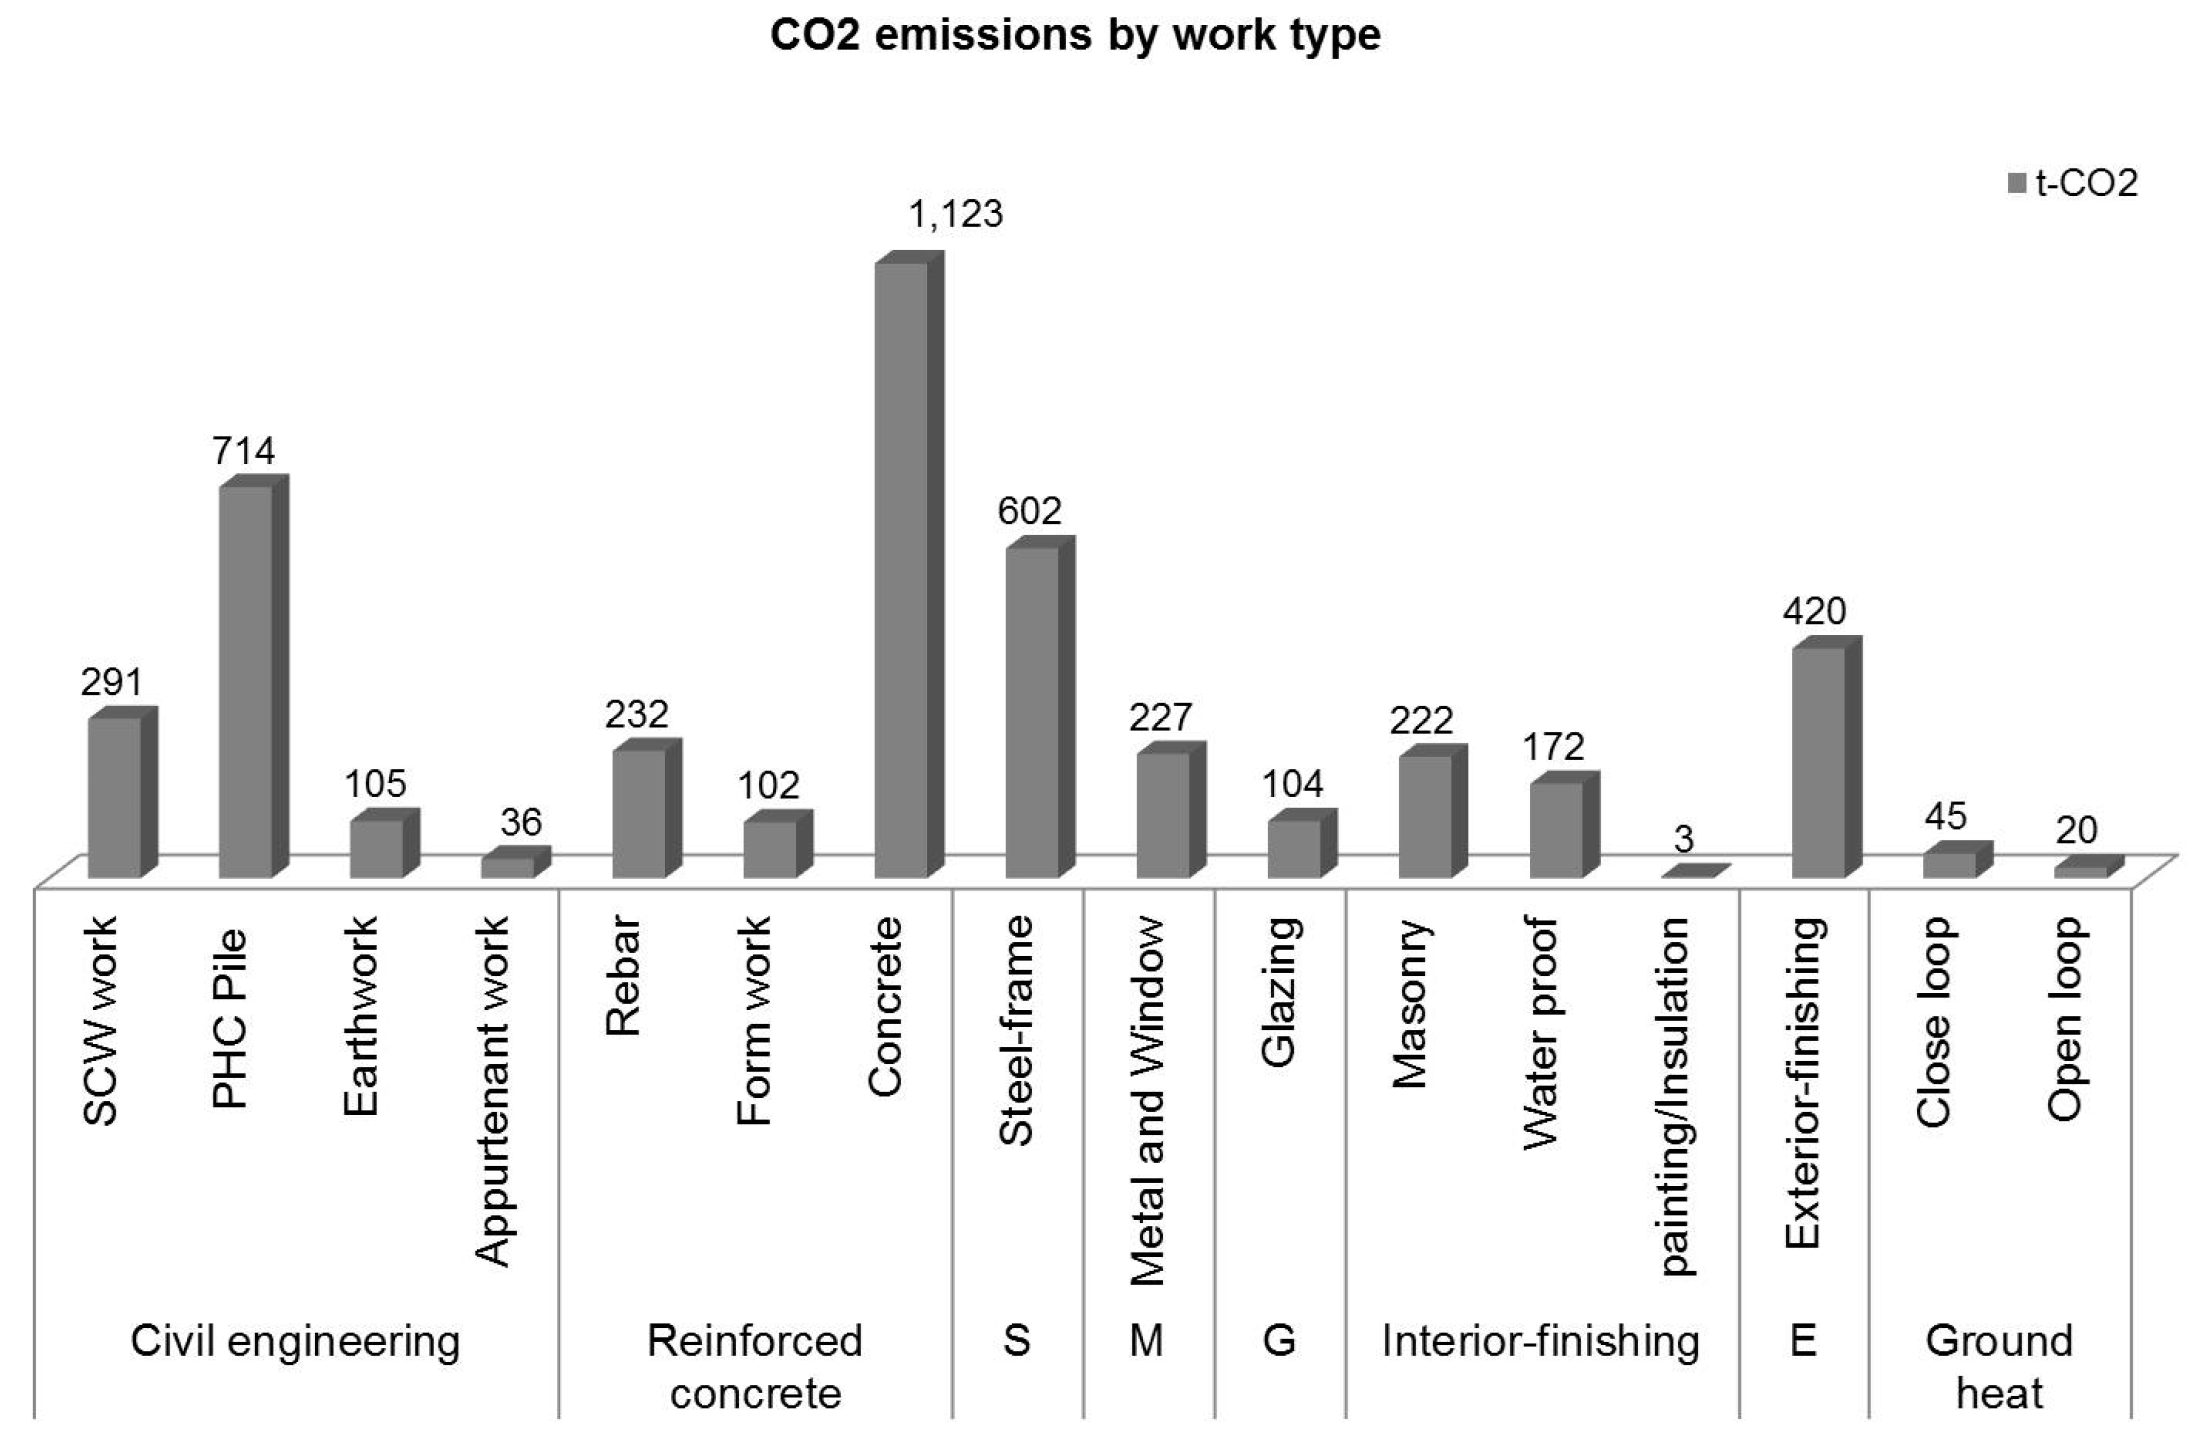
3.1.5. Total CO2 Emission According to Work Type
For the total CO
2 emissions in the construction phase, the results of CO
2 emissions calculated from the preceding material production phase, material transportation phase, and on-site construction phase were added. The concrete construction of reinforced concrete works was calculated to be 1123.1 (t-CO
2), which corresponds to 25.4% of the total CO
2 emissions, followed by foundation work (PHC PILE) 714.4 (t-CO
2) 16.2%, steel structure erection 602,294.59 (kg-CO
2) 13.6%, exterior work 419.7 (t-CO
2) 9.5%, and SCW work 290.7 (t-CO
2) 6.6%, as shown in
Figure 7.
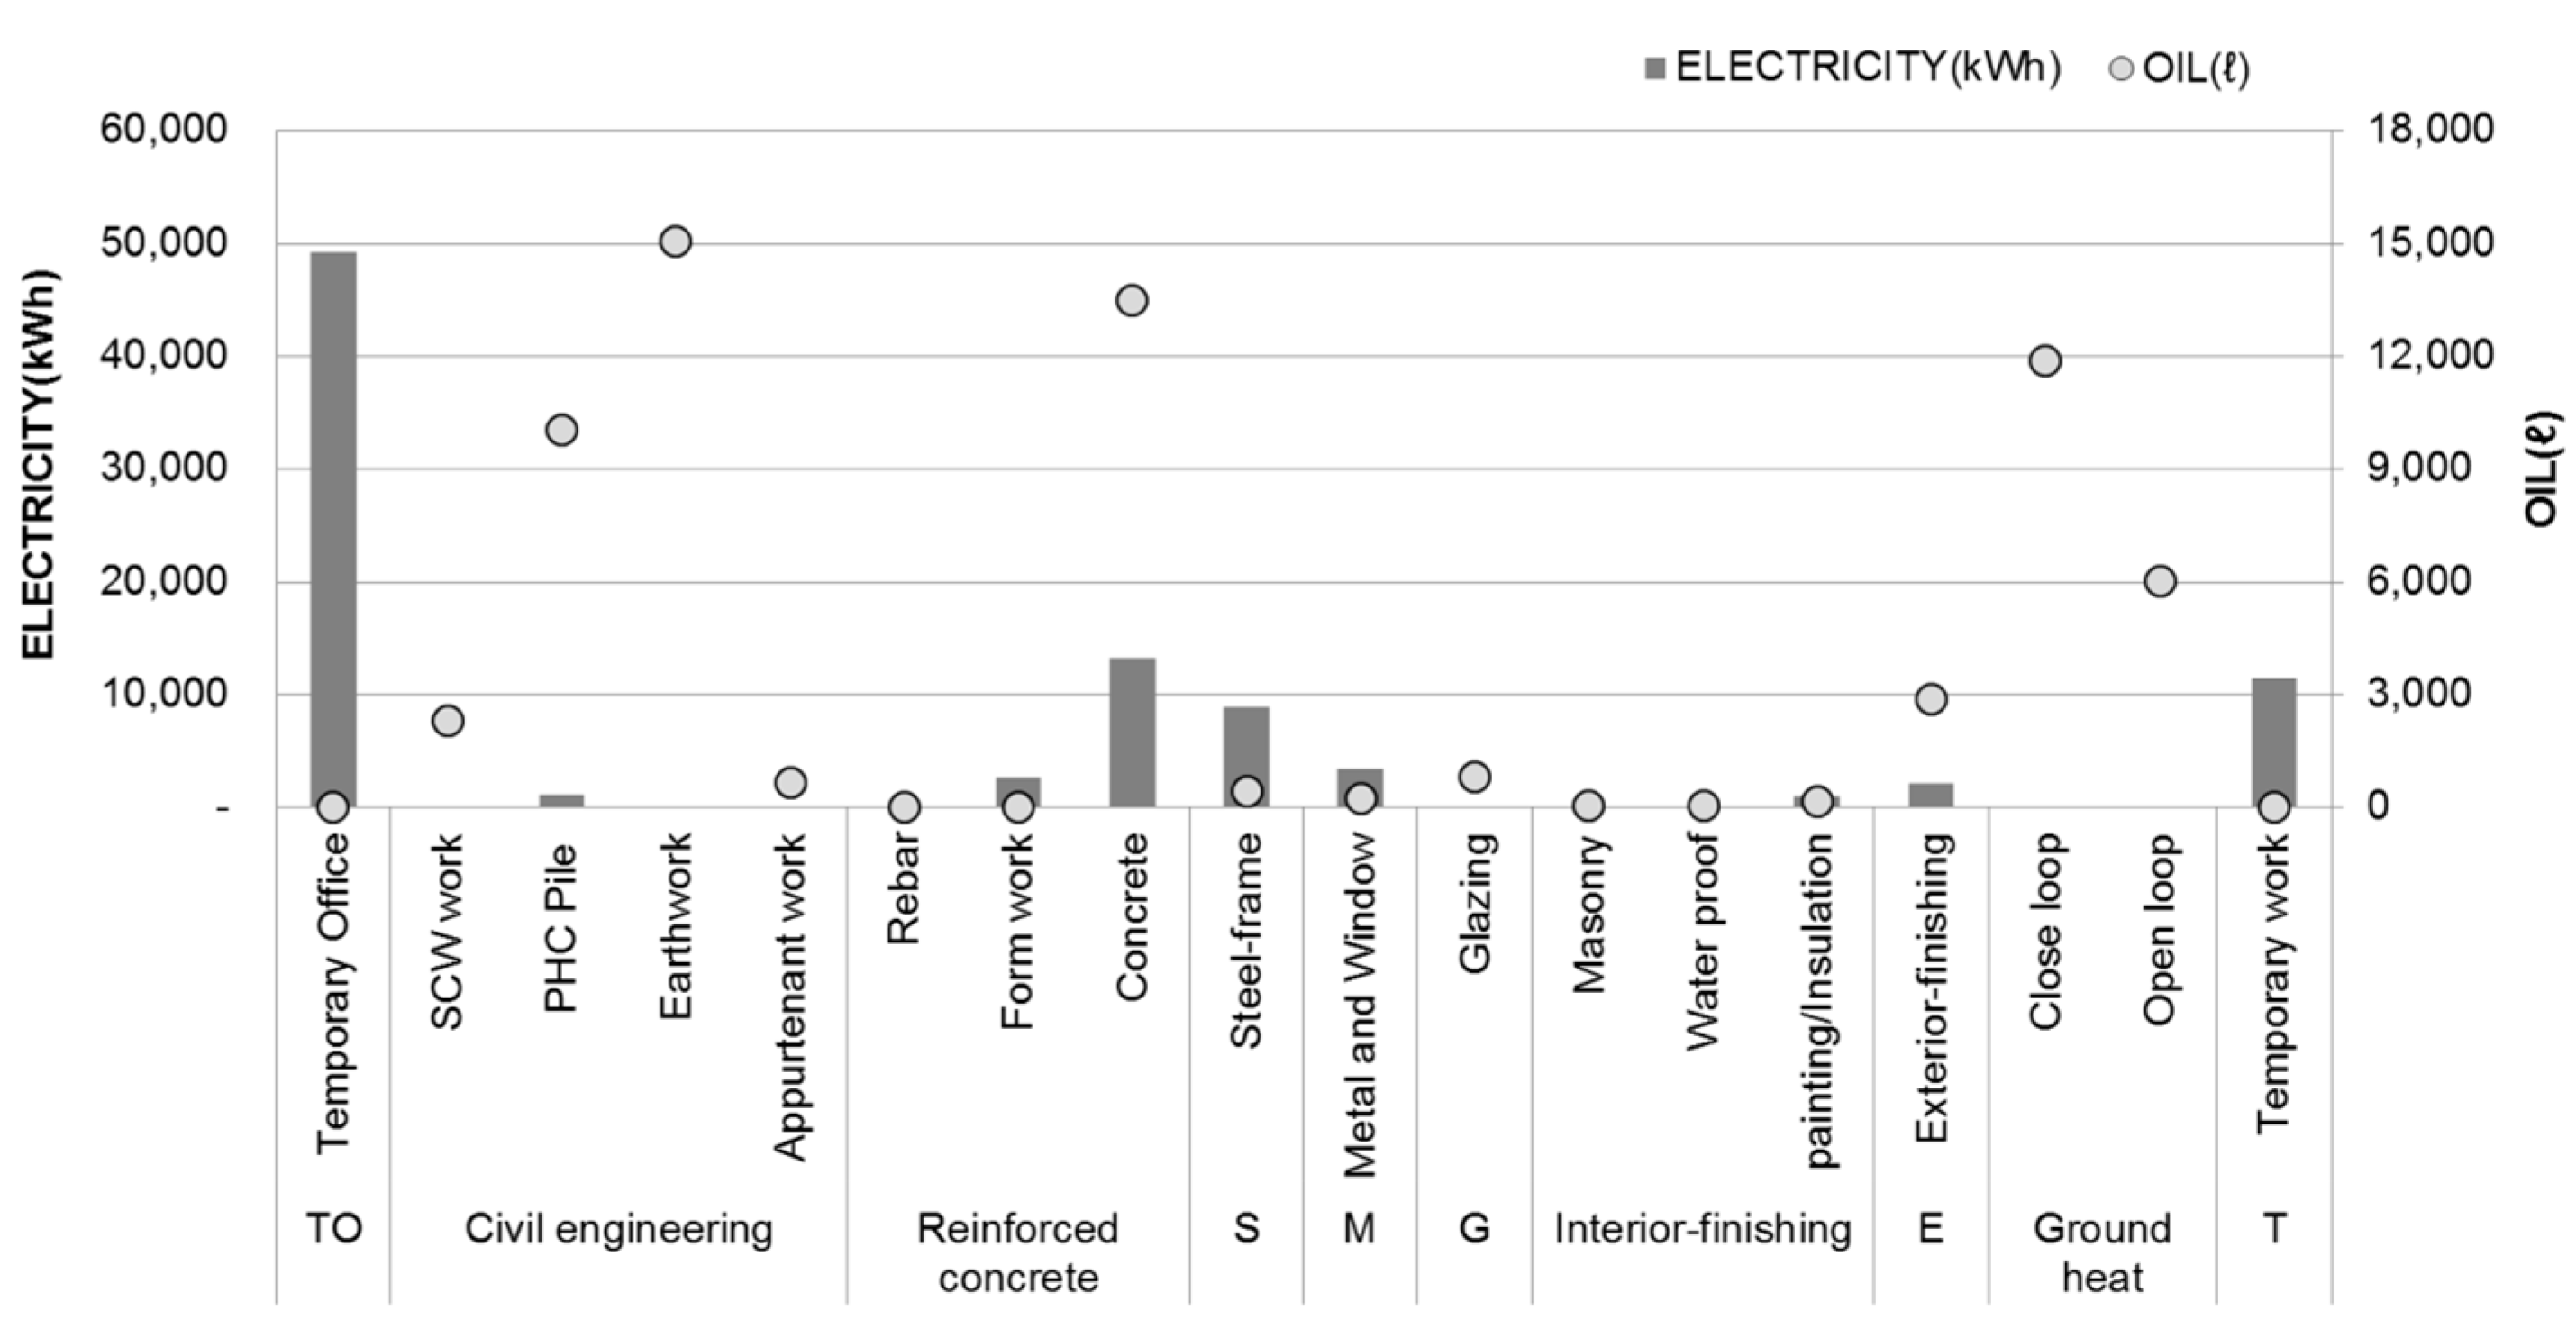
3.1.6. Analysis of Electrical and Oil Consumption in the Construction Phase
The total electricity consumption in the on-site construction phase was 93,793 kWh, and it was measured at 49,255 kWh 52.5% for the temporary office, showing the largest consumption, followed by direct construction, lifting equipment, and common temporary work. The electricity consumption for the temporary office was higher than that of the direct construction because of the concentrated use of computerized office equipment and heaters during the winter.
An analysis of electricity consumption according to the process shows that the electricity used in reinforced concrete works was 13,270 kWh, which accounts for 14.1% of the total electricity consumption, followed by common temporary work 11,520 kWh 12.3%, steel structure erection 8910 kWh 9.5%, metal and window work 3454 kWh 3.7%, and exterior work 2191 kWh 2.3%. The electricity consumption from these five processes accounted for 41.9% of the total electricity consumption, indicating that field management is important for emission sources from electricity used in these processes.
Oil consumption varies depending on the use of transport vehicles in the material transportation phase and construction equipment and instruments in the on-site construction phase. The total oil consumption was estimated to be 106,607 L, and the amount of oil used in the construction process was 65,476 L. Most of the oil is consumed in the process, which uses a lot of construction equipment, and the oil consumption was highest in earthworks, followed by reinforced concrete work, and ground heat construction as shown in
Figure 8.
3.2. CO2 Emission Intensity Results
Through the construction period and construction cost according to work type, a correlation with CO
2 emissions was investigated. In addition, CO
2 emissions were examined through the system capacity and gross floor area for each work type as shown in
Table 2.
3.2.1. CO2 Emissions According to Construction Cost
As shown in
Table 2, the construction cost was highest in the exterior work, followed by reinforced concrete work and steel structure construction. Related to this, civil engineering works showed high CO
2 emissions compared to the construction cost, followed by interior finishing works and reinforced concrete works. Among civil engineering works, SCW work and foundation work (PHC PILE) was high, as well as masonry and plasterwork among the interior finishing works. Exterior work was found to produce low CO
2 emissions compared to the construction cost.
3.2.2. CO2 Emissions According to Construction Period
In the entire construction, the process that shows the highest level of CO2 emissions compared to the number of actual working days was civil engineering work, followed by reinforced concrete work and steel structure construction. Of these, the civil engineering work showed high CO2 emissions in SCW work and foundation work (PHC PILE). The percentages of formwork (a subset of reinforced concrete work) and painting/insulation work (a subset of interior finishing work) make up 14.4% and 5.5%, respectively, of the total number of actual working days, but CO2 emissions was relatively low with 2.4% and 0.1% of the total emissions, respectively.
The percentages of waterproofing and masonry/plaster work in the total number of working days was 6.0% and 3.8%, respectively, but the energy consumption was 0.1% and 0.04%, respectively, of the total energy consumption, showing the lowest energy consumption compared to the number of working days.
3.2.3. CO2 Emissions According to Installation Capacity and Area by Process
CO
2 emission intensity results according to gross floor area and unit capacity are listed in
Table 2. In steel structure construction, CO
2 emission intensity per unit weight of steel materials was highest with 1.6 (t-CO
2/t). When calculated with total floor area, reinforced concrete work was calculated to be as high as 262.34 (kg-CO
2/m
2).
3.3. CO2 Reduction Measures Found in the Construction Process
In terms of material selection, in the foundation work, the CO2 emission of 35.7 (t-CO2) was reduced through the reduction in materials and changes in construction equipment specifications by changing high-strength PHC pile to ultra-high-strength PHC pile and reducing the number of piles and embedded depth based on the structural reanalysis and precision analysis-based design. The reduced figure corresponds to 5.0% of the total CO2 emissions in the foundation work. In addition, the CO2 emission of 553.7 (t-CO2) was reduced by using environmentally-friendly concrete made by recycling blast-furnace slag, a steel byproduct, and the reduced figure is equivalent to 37.9% of the total CO2 emissions in the reinforced concrete work.
In terms of material transportation, as a result of reducing the energy consumption resulting from the transportation by selecting a nearby glass processing plant, the CO2 emission reduction was calculated to be 186.37 (kg-CO2), which accounts for 0.2% of the total CO2 emissions. This suggests that the energy consumption can be reduced by using materials and resources produced in nearby regions for all the materials required for the entire process in addition to glass materials.
In terms of construction, the construction period was reduced by applying a hollow-slab method to one floor and thus reducing input materials such as rebar, plywood formwork, shoring, and concrete, thereby helping to reduce CO2 emissions to 8.5 (t-CO2).
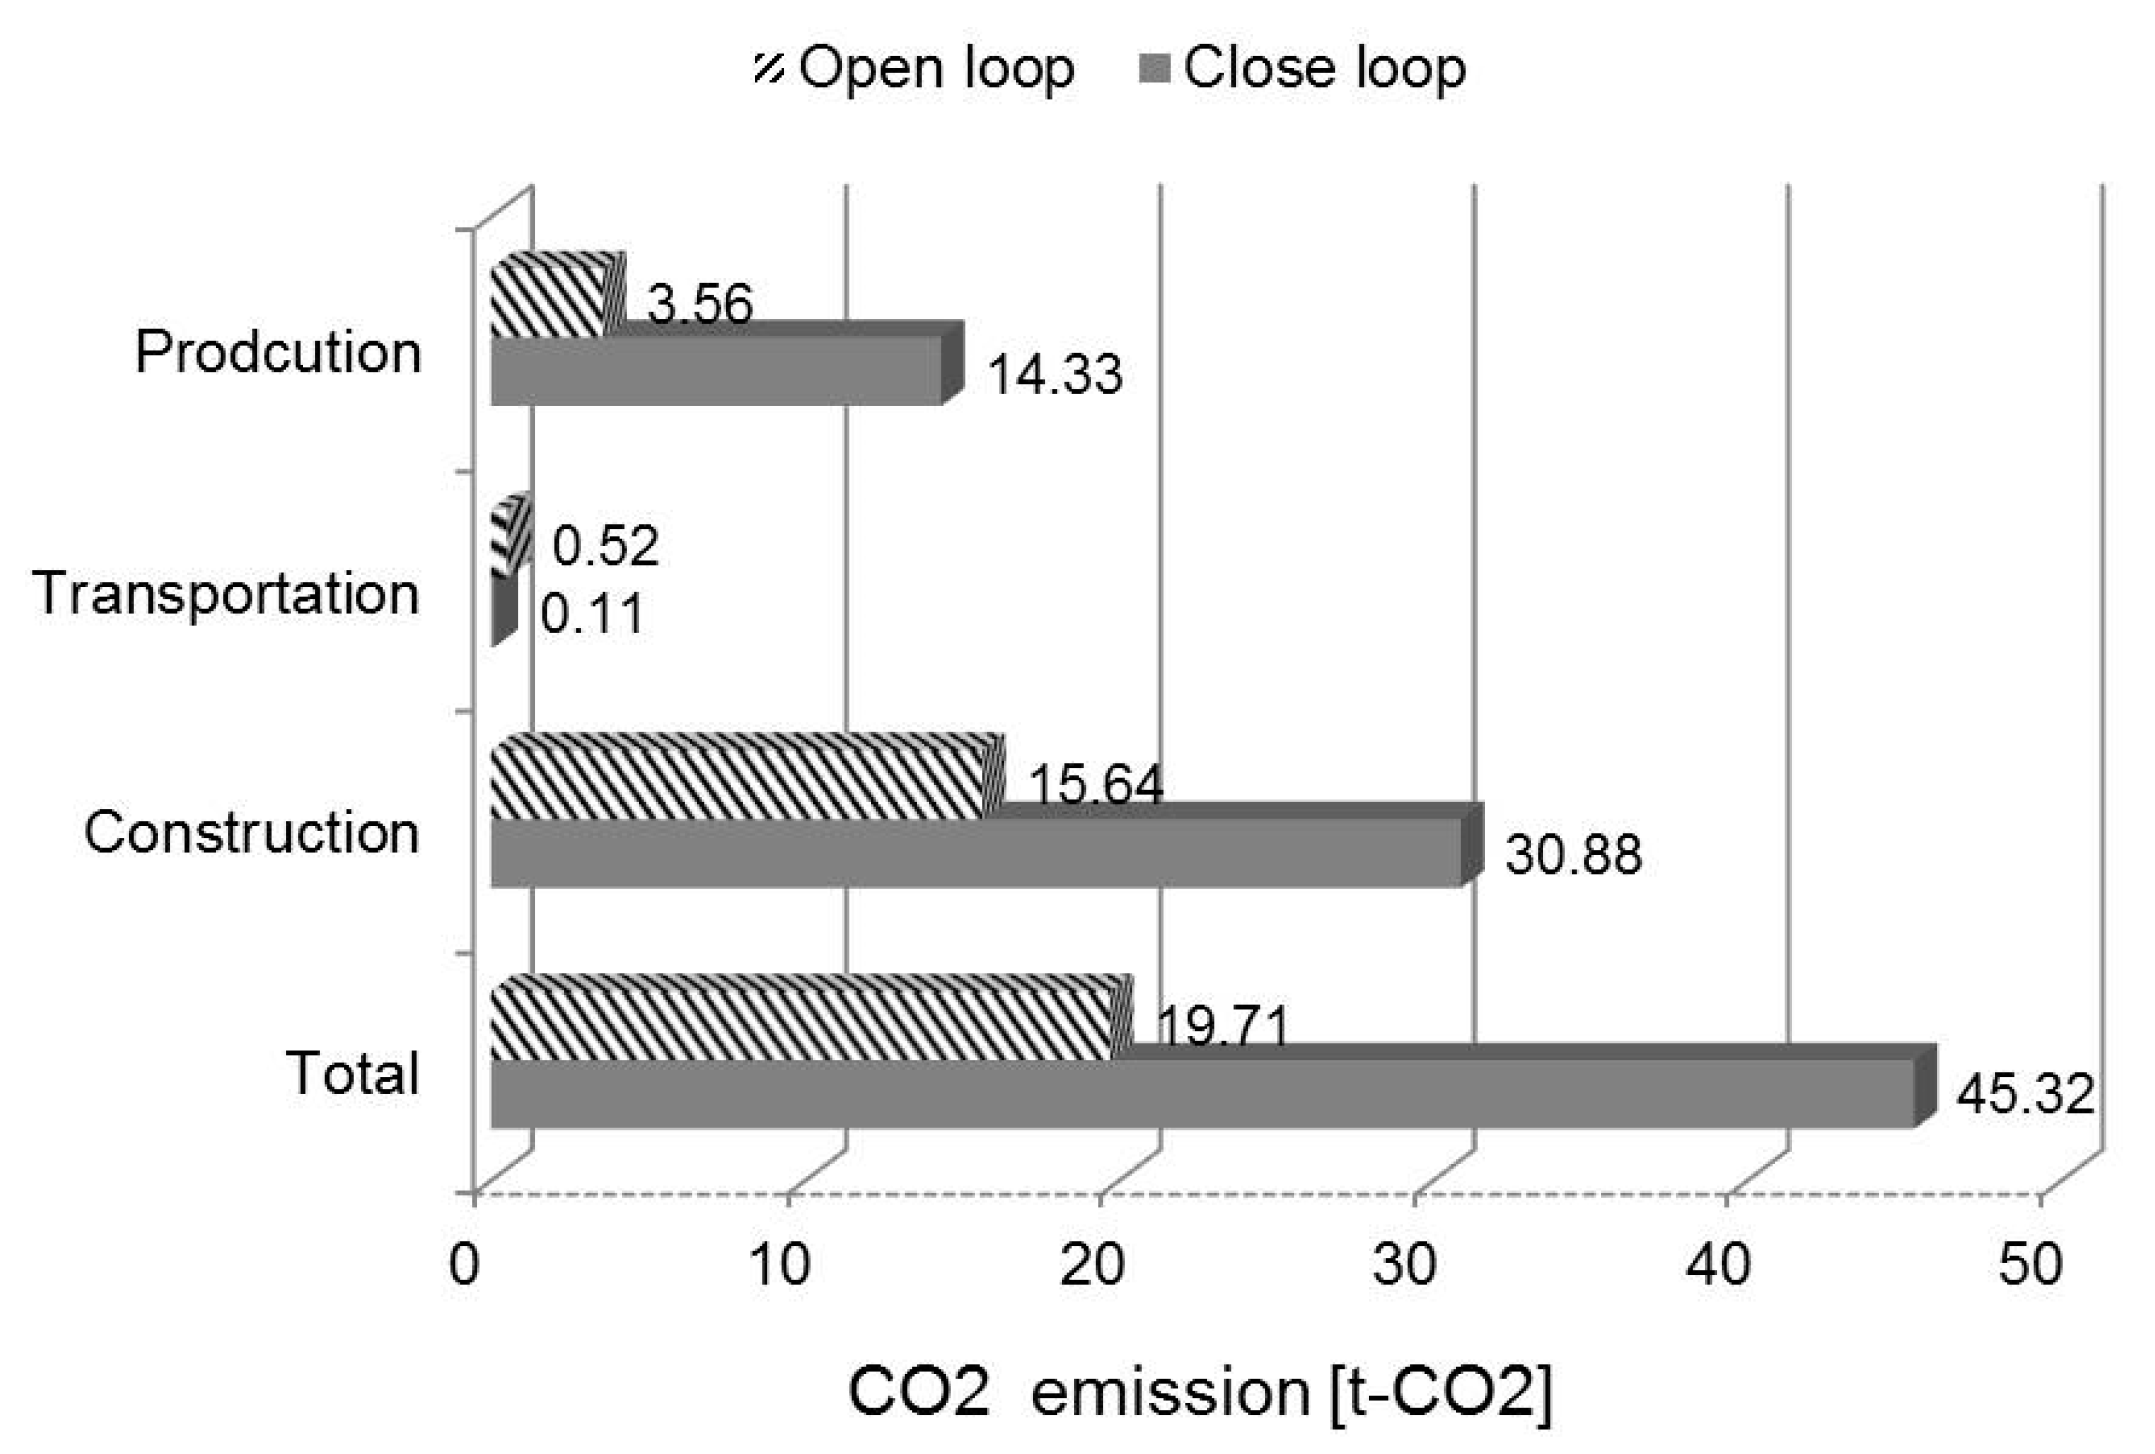
Figure 9 shows a comparative analysis between closed type and open type of ground heat construction in relation to the total CO
2 emissions in the construction phase. According to the analysis results, the open type was found to be advantageous not only in terms of energy efficiency, but also in terms of reduction of construction period and costs. In addition, the total CO
2 emission from the construction phase was doubled in the closed type compared to that of the open type. In this study, the capacity of the closed type was 58 RT and that of the open type was 52 RT. Therefore, the open-type method of ground heat construction is expected to become a more environmentally friendly component technology if it secures the same energy performance as the closed-type method.
From the waste treatment process, the transportation energy consumption was reduced by managing the sediment transport of earthwork at the dumping site within the construction site and using it again in backfilling. The CO2 emission of 37.5 (t-CO2), corresponding to 45.4% of the total CO2 emissions in earthworks, was reduced accordingly. The 3.3 CO2 reduction measures were applied to the original construction design and emissions were reduced by 656.4 (t-CO2) and the total amount of CO2 emissions was reduced by 13%.
4. Discussion
In the material production phase in this case study, the amount of CO
2 emissions was highest for ready-mixed concrete, followed by PHC pile, cement, ready-mixed mortar, steel structure materials, rebar, and glass materials. The percentage of CO
2 emissions of these materials constituted 80% of the total CO
2 emissions. These materials constituted over 70% of the total CO
2 emissions in other research as well [
23,
24].
For the reduction in CO2 emissions from the material transportation phase, material suppliers need to be selected by considering the moving distance from the materials manufacturing plant, the supplier, and the processing factory to the construction site. A purchase process linked to CO2 emission management plans also needs to be devised and measures need to be taken to reduce the energy consumption of material transport vehicles.
In the case of CO2 emissions from the on-site construction phase, CO2 emissions were estimated to be high in processes that require high energy consumption due to the use of construction and lifting equipment. For the detailed process, CO2 emission was calculated to be highest in concrete construction, earthworks, foundation (PHC PILE) work, and ground heat system construction. These processes are classified as those in which CO2 reduction controls are available in terms of on-site management; thus, substantial construction management is required for the reduction of CO2 emissions. This needs to be achieved through the establishment of optimal plans for the selection of materials and methods, the creation of the best construction proposals, energy consumption monitoring of the construction process, and performance management from the design phase. The amount of CO2 emissions from the on-site construction phase of metal/window work was only 1% compared to that from the material production phase. Thus, measures to recycle and reuse the existing metal materials need to be considered in terms of the efficiency of resources. The use of unnecessary metal materials needs to be reduced and alternative materials need to be selected. The energy consumption in the interior finishing works, including masonry/plaster work, waterproofing work, and painting/insulation work showed a relatively smaller consumption pattern compared to that of other work types. This is because the above processes require a great deal of man power compared to using construction equipment.
CO
2 emission intensity was evaluated according to the construction cost, construction period, gross floor area, and capacity, and was investigated according to the amount of CO
2 emitted: reinforced concrete work, civil engineering work, steel structure construction, exterior work, and interior finishing work. CO
2 emissions from the five work types were found to account for 90% of the total CO
2 emissions, which indicates that plans and measures are urgently needed to reduce the CO
2 emissions for these types of works. Data from the determination of CO
2 emission intensity related to the construction period for each process can be utilized as an important resource to predict life-cycle CO
2 emissions and environmental loads of buildings in the project planning stage. Since there is a significant difference between the construction period given in the construction schedule and the number of actual working days, the CO
2 emission intensity determined from the annual working capacity utilization rate and the number of actual working days is expected to contribute to predicting environmental loads that are more accurate, created from the construction period. This research focused only on the construction process due to the limits in use and maintenance and disposal. However, the application and disposal phase constituted 70% of the total CO
2 emissions in other research [
25,
26].
5. Conclusions
In this study, CO2 emissions were calculated with respect to the material production, material transportation, construction process, and waste treatment phases on an actual construction site. Since the oil and electric energy consumed during the construction process was evaluated by direct monitoring, more specific and quantified CO2 emissions were calculated for each process, and measures for reduction in CO2 emissions were selected and analyzed based on the results.
CO2 emissions from the material production phase were calculated to be 4128 (t-CO2), which constitutes 93.4% of the total CO2 emissions. On the other hand, CO2 emissions from the material transportation phase and on-site construction phase were 107 (t-CO2) and 185 (t-CO2), respectively, which account for 2.4% and 4.2% of the total CO2 emissions. Thus, it can be seen that the selection of input materials and resources is important for the reduction of CO2 emissions.
Through this study, CO2 emissions and energy consumption according to work type were evaluated with respect to the material selection, transportation, and construction phase. The amount of CO2 emissions arising from the construction site was reduced by finding and practicing measures to reduce CO2 emissions for each process. Therefore, CO2 emissions in the construction phase need to be specifically identified, an alternative proposal needs to be devised, and a systematic construction management plan is needed to find measures for reducing the environmental impacts and CO2 emissions in the life cycle of buildings.
Acknowledgments
This research was supported by a grant (11 High-tech Urban G03) from High-Tech Urban Development Program Funded by Ministry of Land, Infrastructure and Transport of Korean Government.
Author Contributions
As the primary author, Min-Seop Seo initiated the study and performed the majority of the analysis. Taeyeon Kim supervised the study and led the data analysis and methodology. Goopyo Hong and Hyungkeun Kim analyzed the data and contributed in editing the paper and proofreading the manuscript.
Conflicts of Interest
The authors declare no conflict of interest.
References
- Asif, M.; Muneer, T.; Kelley, R. Life cycle assessment: A case study of a dwelling home in Scotland. Build. Environ. 2007, 42, 1391–1394. [Google Scholar] [CrossRef]
- Desingning with Vision: A Technical Manual for Material Choices in Sustainable Construction; California Integrated Waste Management Board: Sacramento, CA, USA, 2000.
- Jeong, Y.-S.; Lee, S.-E.; Huh, J.-H. Estimation of CO2 emission of apartment buildings due to major construction materials in the Republic of Korea. Energy Build. 2012, 49, 437–442. [Google Scholar] [CrossRef]
- Lu, Y.; Cui, P.; Li, D. Carbon emissions and policies in China’s building and construction industry: Evidence from 1994 to 2012. Build. Environ. 2016, 95, 94–103. [Google Scholar] [CrossRef]
- Pacheco-Torres, R.; Jadraque, E.; Roldán-Fontana, J.; Ordóñez, J. Analysis of CO2 emissions in the construction phase of single-family detached houses. Sustain. Cities Soc. 2014, 12, 63–68. [Google Scholar] [CrossRef]
- González, M.J.; Navarro, J.G. Assessment of the decrease of CO2 emissions in the construction field through the selection of materials: Practical case study of three houses of low environmental impact. Build. Environ. 2006, 41, 902–909. [Google Scholar] [CrossRef]
- Gerilla, G.P.; Teknomo, K.; Hokao, K. An evaluation of carbon emission changes in the Japanese housing sector from 1980–1995. J. Asian Archit. Build. Eng. 2005, 4, 509–515. [Google Scholar] [CrossRef]
- Dimoudi, A.; Tompa, C. Energy and environmental indicators related to construction of office buildings. Resour. Conserv. Recycl. 2008, 53, 86–95. [Google Scholar] [CrossRef]
- Börjesson, P.; Gustavsson, L. Greenhouse gas balances in building construction: Wood versus concrete from life-cycle and forest land-use perspectives. Enegy Policy 2000, 28, 575–588. [Google Scholar] [CrossRef]
- Gerilla, G.P.; Teknomo, K.; Hokao, K. An environmental assessment of wood and steel reinforced concrete housing construction. Build. Environ. 2007, 42, 2778–2784. [Google Scholar] [CrossRef]
- Suzuki, M.; Oka, T.; Okada, K. The estimation of energy consumption and CO2 emission due to housing construction in Japan. Energy Build. 1995, 22, 165–169. [Google Scholar] [CrossRef]
- Emmanuel, R. Estimating the environmental suitability of wall materials: Preliminary results from Sri Lanka. Build. Environ. 2004, 39, 1253–1261. [Google Scholar] [CrossRef]
- Cole, R.J. Energy and greenhouse gas emissions associated with the construction of alternative structural systems. Build. Environ. 1998, 34, 335–348. [Google Scholar] [CrossRef]
- Guggemos, A.A.; Horvath, A. Decision-support tool for assessing the environmental effects of constructing commercial buildings. J. Archit. Eng. 2006, 12, 187–195. [Google Scholar] [CrossRef]
- Yan, H.; Shen, Q.; Fan, L.C.H.; Wang, Y.; Zhang, L. Greenhouse gas emissions in building construction: A case study of One Peking in Hong Kong. Build. Environ. 2010, 45, 949–955. [Google Scholar] [CrossRef]
- Li, X.; Zhu, Y.; Zhang, Z. An LCA-based environmental impact assessment model for construction processes. Build. Environ. 2010, 45, 766–775. [Google Scholar] [CrossRef]
- Abolhasani, S.; Frey, H.C.; Kim, K.; Rasdorf, W.; Lewis, P.; Pang, S.-H. Real-world in-use activity, fuel use, and emissions for nonroad construction vehicles: A case study for excavators. J. Air Waste Manag. Assoc. 2008, 58, 1033–1046. [Google Scholar] [CrossRef] [PubMed]
- Ahn, C.; Pan, W.; Lee, S.; Peña-Mora, F. Enhanced estimation of air emissions from construction operations based on discrete-event simulation. In Proceedings of the International Conference on Computing in Civil and Building Engineering, Nottingham, UK, 30 June–2 July 2010.
- Adalberth, K. Energy use during the life cycle of singleunit dwellings: Examples. Build. Environ. 1997, 32, 321–329. [Google Scholar] [CrossRef]
- Cole, R.J.; Kernan, P.C. Life-cylce energy use in office buildings. Build. Environ. 1996, 31, 307–317. [Google Scholar] [CrossRef]
- Junnila, S.; Horvath, A. Life-cycle environmental effects of an office building. J. Infrastruct. Syst. 2003, 9, 157–166. [Google Scholar] [CrossRef]
- Korea Environmental Industry & Technology Institutue (KEITI). Available online: http://www.edp.or.kr/lci/lci_intro.asp (accessed on 7 April 2016).
- Wu, H.J.; Yuan, Z.W.; Zhang, L.; Bi, J. Life cycle energy consumption and CO2 emission of an office building in China. Int. J. Life Cycle Assess. 2011, 17, 105–118. [Google Scholar] [CrossRef]
- Zhang, Z.; Wang, B. Research on the life-cycle CO2 emission of China’s construction sector. Energy Build. 2016, 112, 244–255. [Google Scholar] [CrossRef]
- Zhang, Y.; Zheng, X.; Zhang, H.; Chen, G.; Wang, X. Carbon emission analysis of a residential building in China through life cycle assessment. Front. Environ. Sci. Eng. 2014, 10, 150–158. [Google Scholar] [CrossRef]
- Peng, C. Calculation of a building’s life cycle carbon emissions based on ecotect and building information modeling. J. Clean. Prod. 2016, 112, 453–465. [Google Scholar] [CrossRef]
© 2016 by the authors; licensee MDPI, Basel, Switzerland. This article is an open access article distributed under the terms and conditions of the Creative Commons Attribution (CC-BY) license (http://creativecommons.org/licenses/by/4.0/).


