
Coherence Effects on the Power and Tower Loads of a 7 × 2 MW Multi-Rotor Wind Turbine System

Abstract
:1. Introduction
2. Simulation Outlines
2.1. Analysis Method
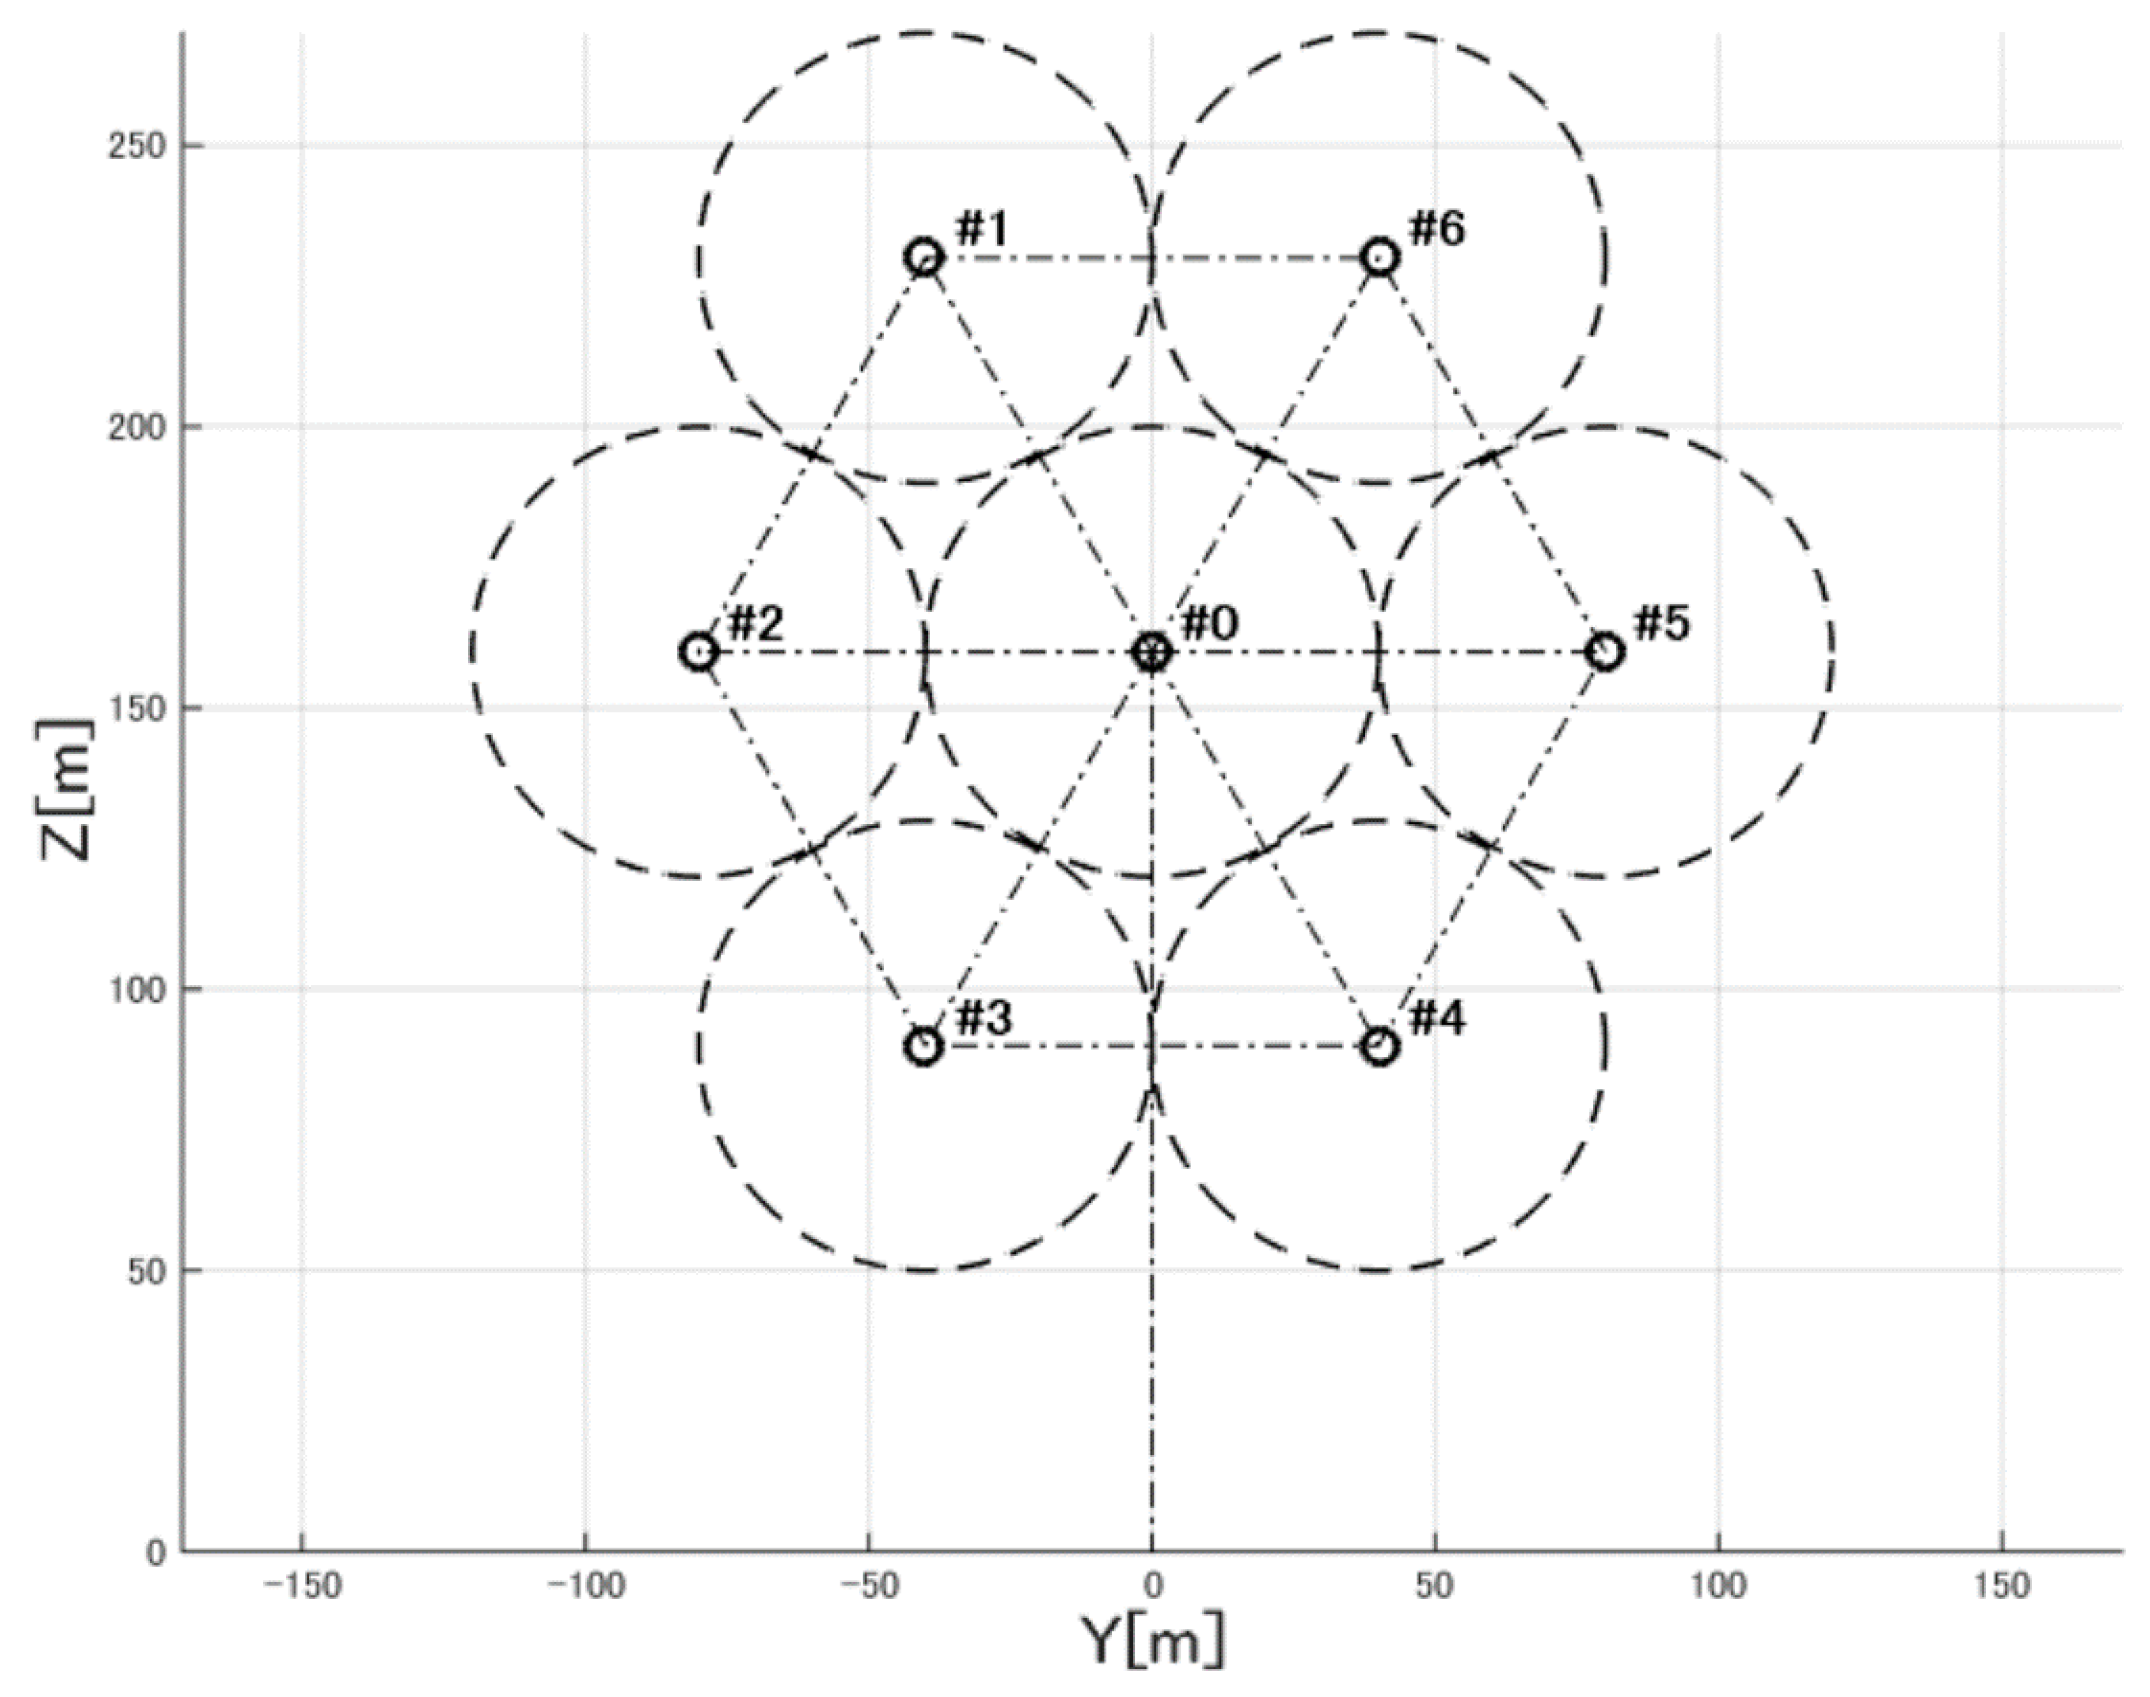
2.2. Wind Turbine Model
- Number of rotor: 7.
- Rotor diameter: 80 m.
- Rated power: 2 MW.
- Number of blades: 3.
- Tilt angle: 0°.
- Rotor speed: 12–20 min−1.
- Cut in-out wind speed: 4–25 m/s.
- Blade mass: 6.5 t.
- Rotor mass: 33.6 t.
- Nacelle mass: 72.0 t.
- Flapwise 1st mode frequency: 0.87 Hz.
- Edgewise 1st mode frequency: 1.30 Hz.
- Flapwise 2nd mode frequency: 2.81 Hz.
- -
- The aerodynamic interferences between the support structure and the wind turbine rotors were ignored, as the detailed structure was not designed yet. Additionally, the interactions between the mutual rotors were also ignored, as they provide minor effects on the loads and the performance, as mentioned in [1].
- -
- Elasticities were considered up to the second mode of the blade flapwise and to the first mode of the blade edgewise. Other structures, such as the tower and the nacelle supports, were assumed to be rigid bodies.
- -
- A conventional variable speed, variable pitch control was assumed. The controller parameters were determined based on those used in Yoshida [9].
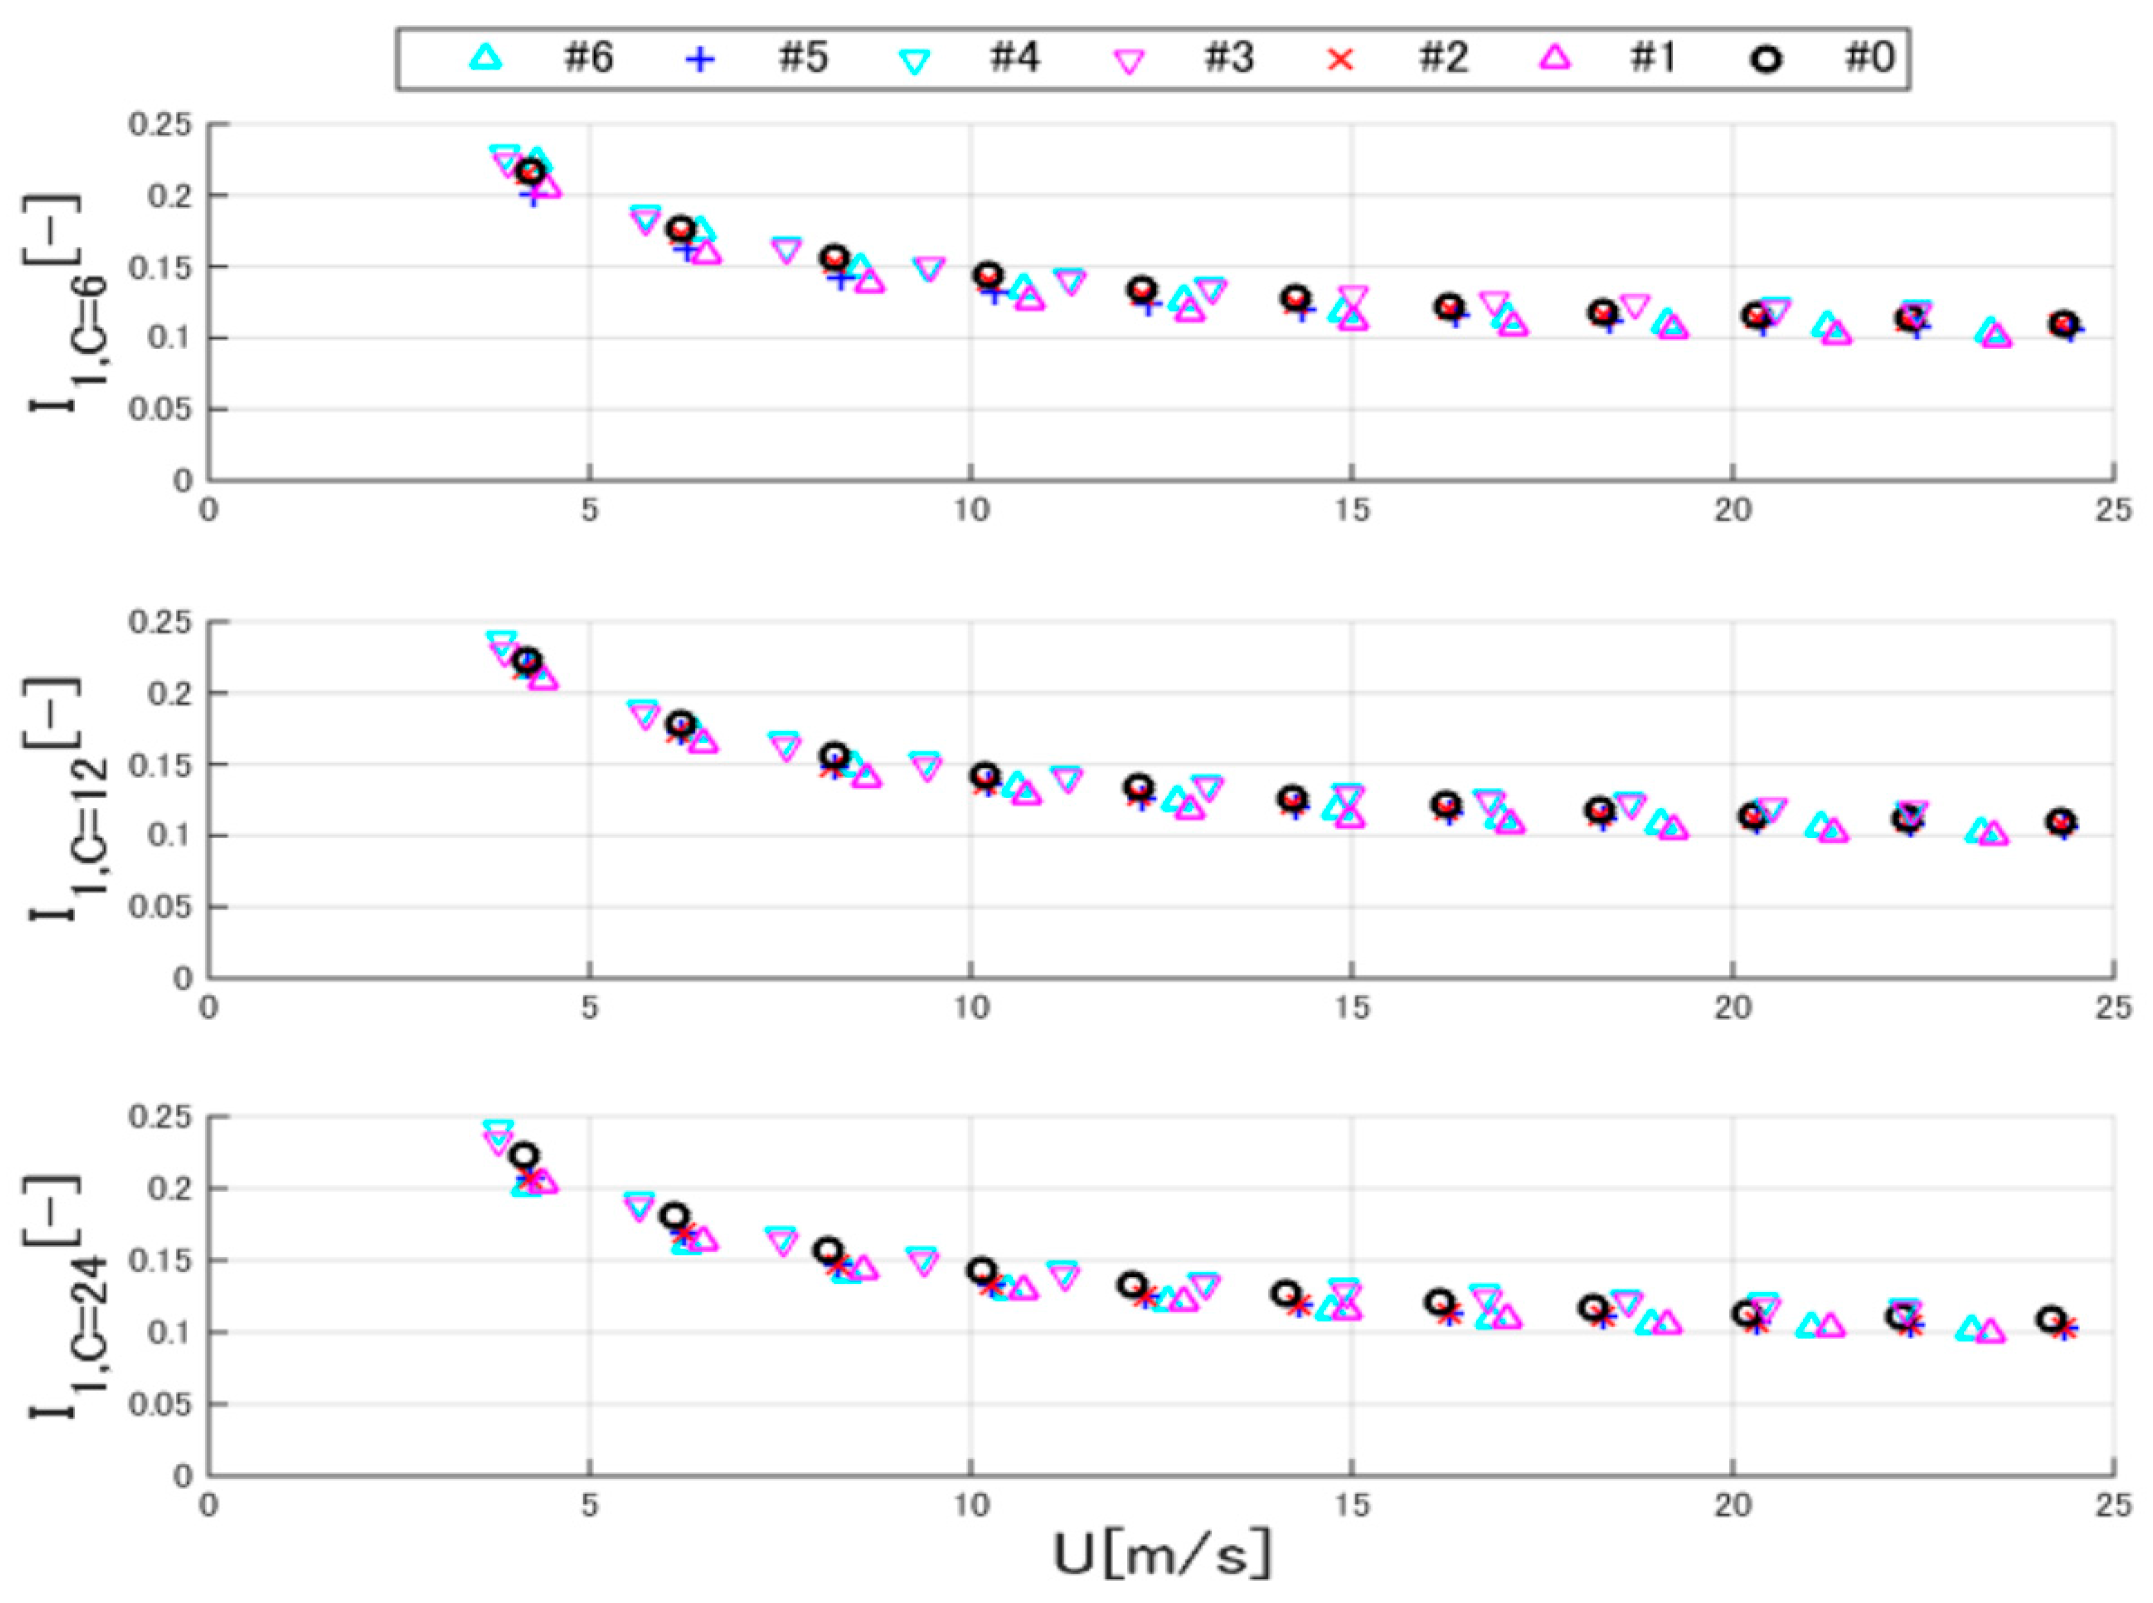
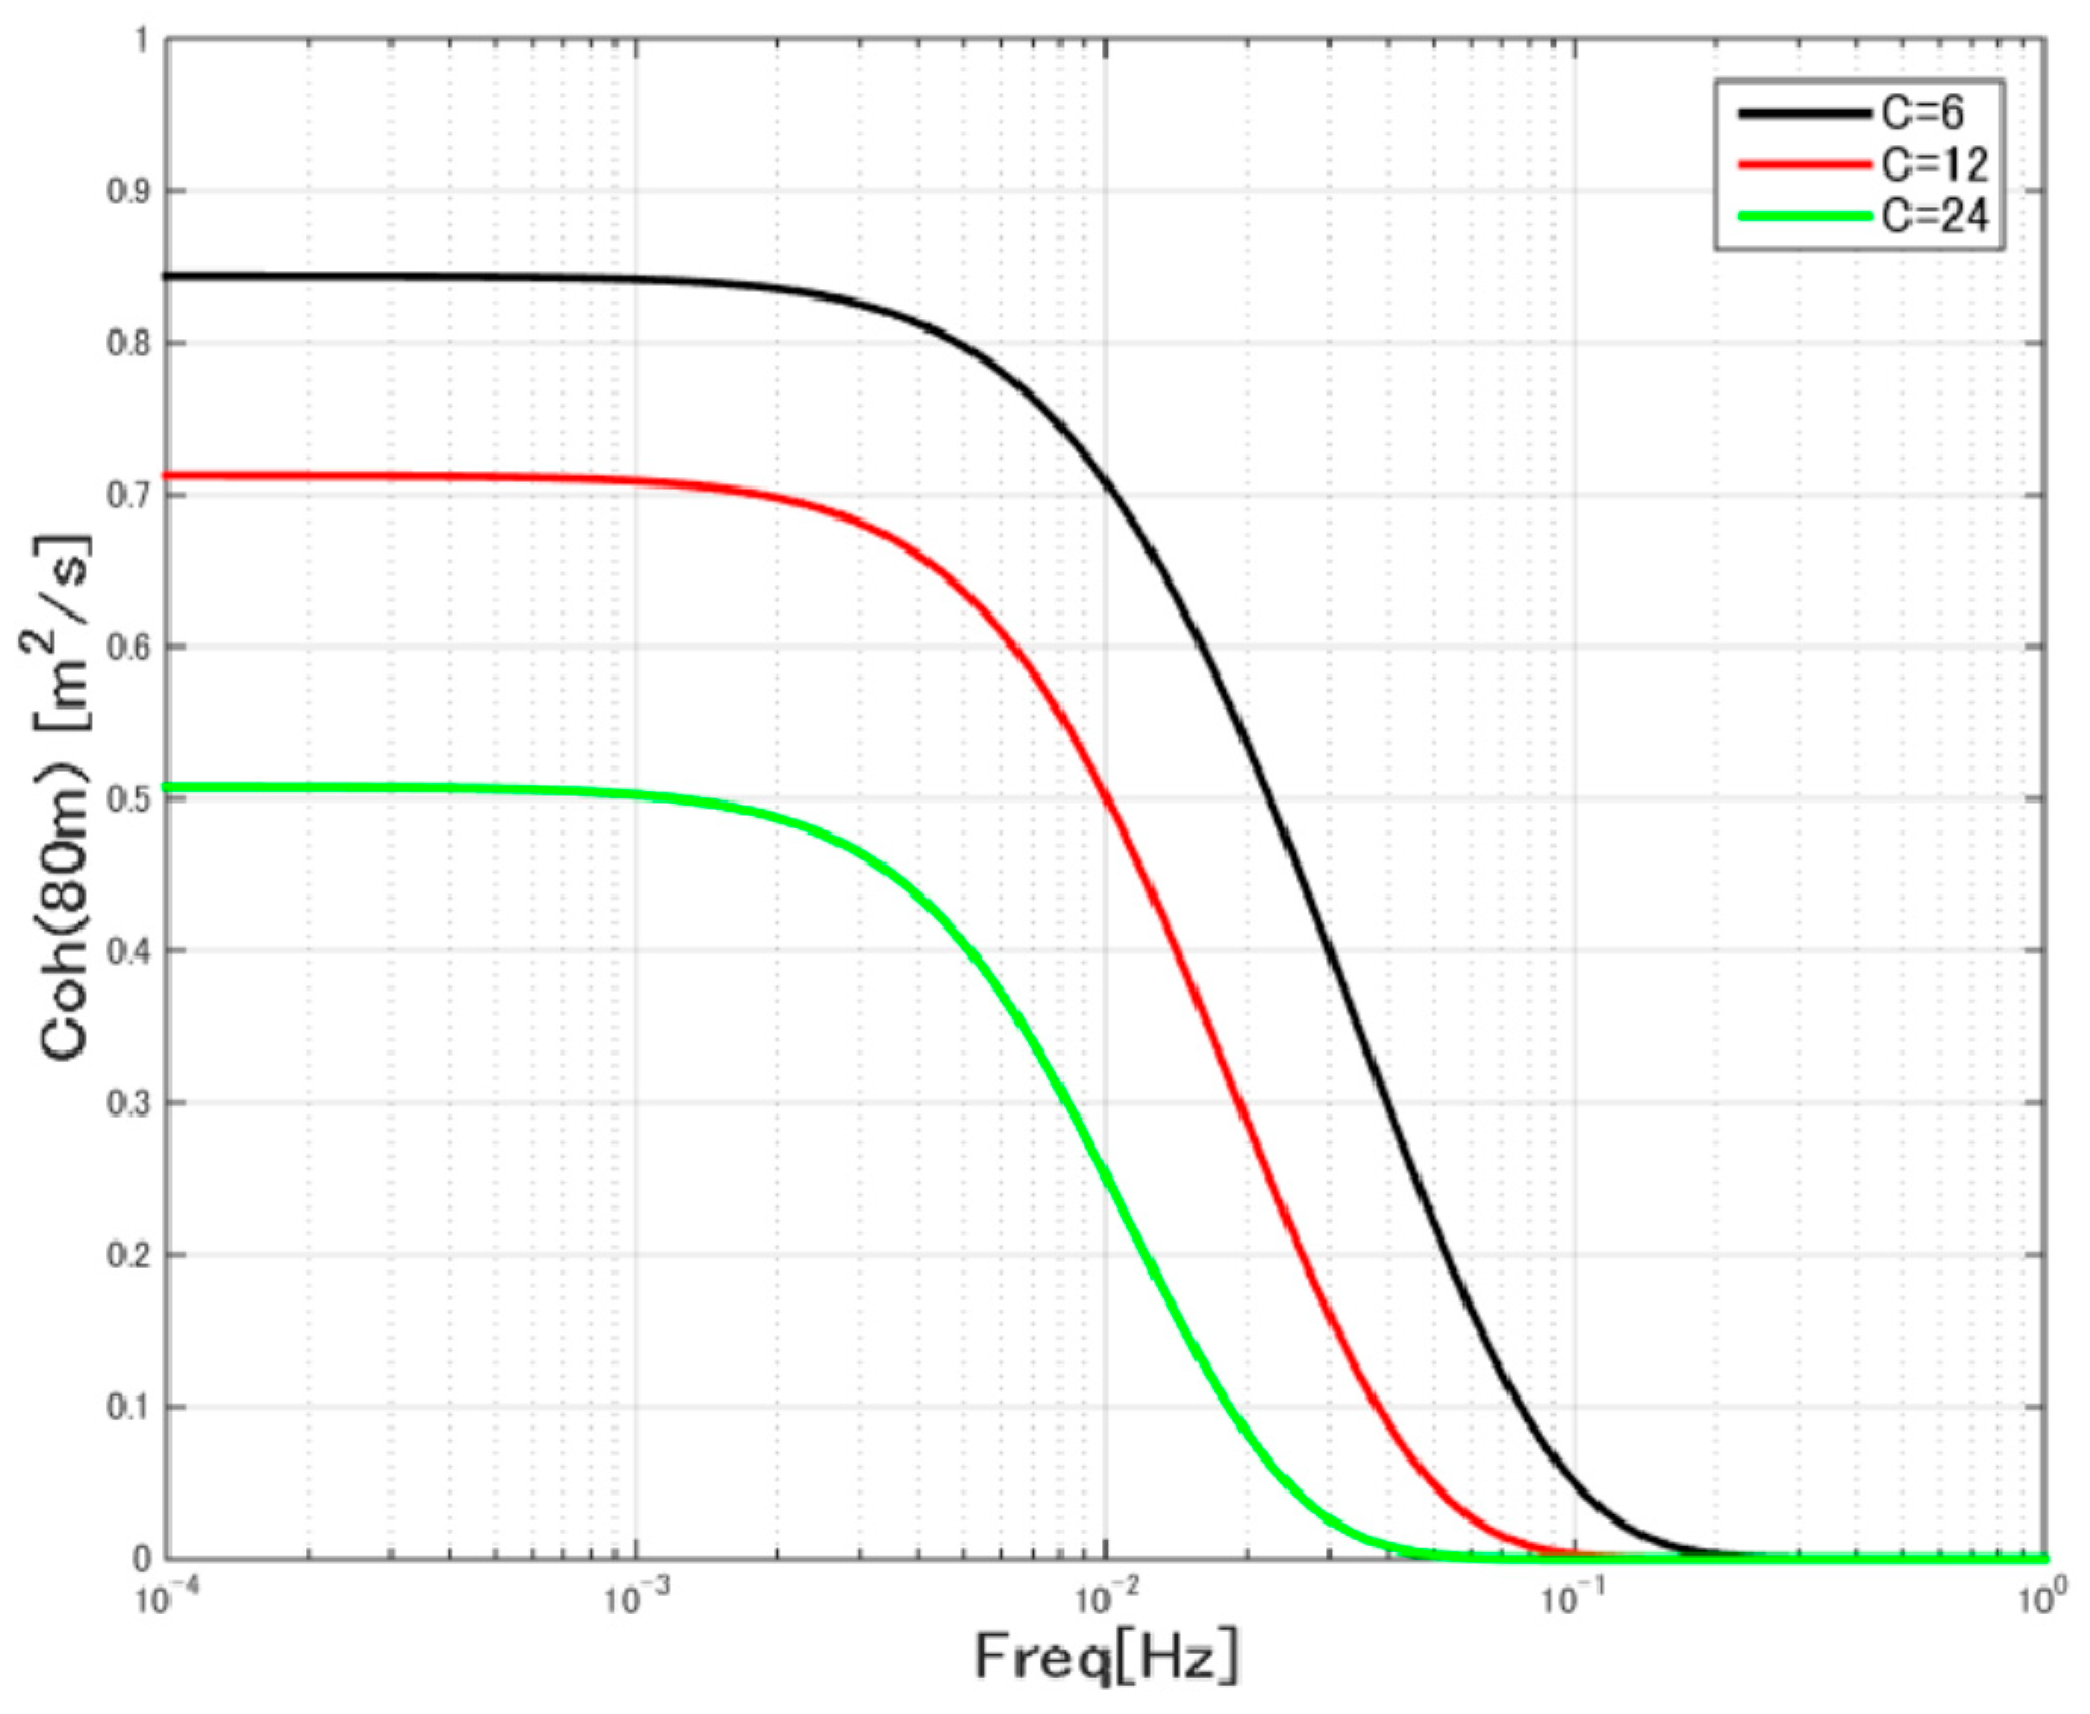
2.3. Wind Model
- -
- Wind model domain and resolution: Table 2.
- -
- Average wind speed: 4–24 m/s (each 2 m/s).
- -
- Turbulence: Category C (12% at 15 m/s).
- -
- Turbulence model: Kaimal.
- -
- Average wind shear exponent: 0.14.
- -
- Average inclination: 0°.
- -
- Average yaw angle: 0°.
- -
- Coherence decay constant (Equation (2)): 6, 12, 24.
2.4. Analysis Conditions
- -
- Duration: 600 s/case.
- -
- Sampling period: 0.04 s.
3. Basic Characteristics
3.1. Rotor Speed and Pitch Angle
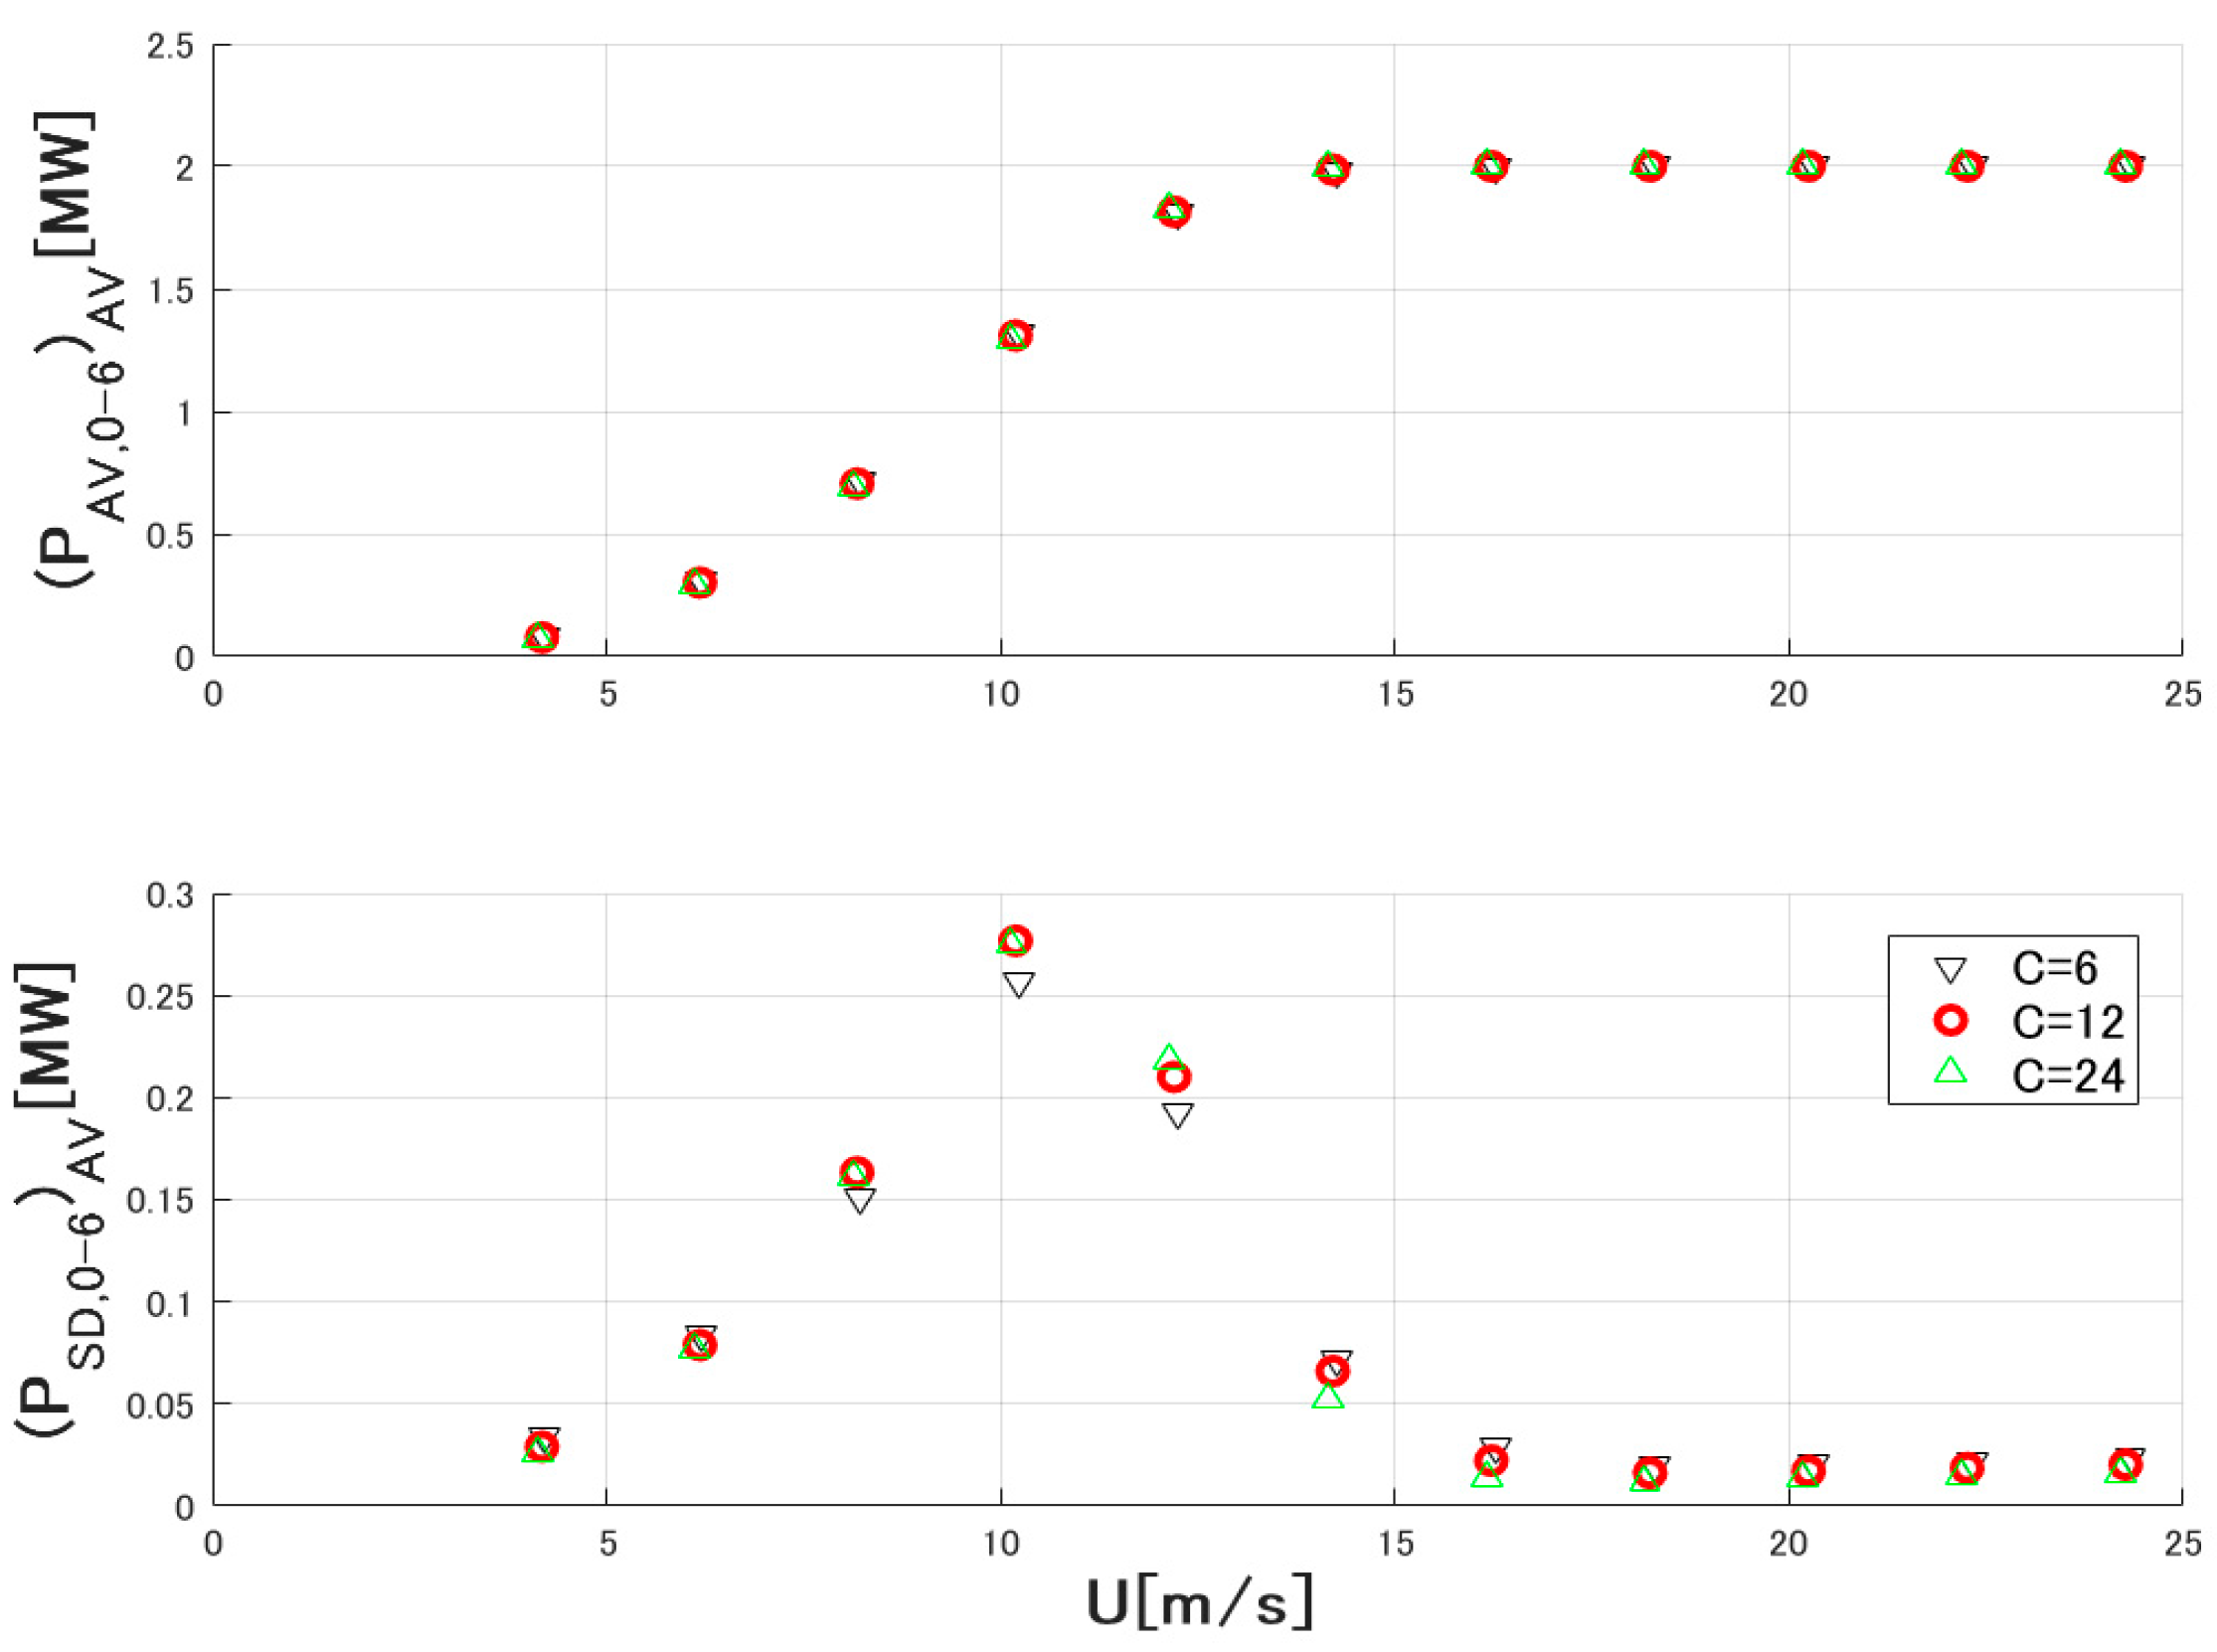
3.2. Output Power
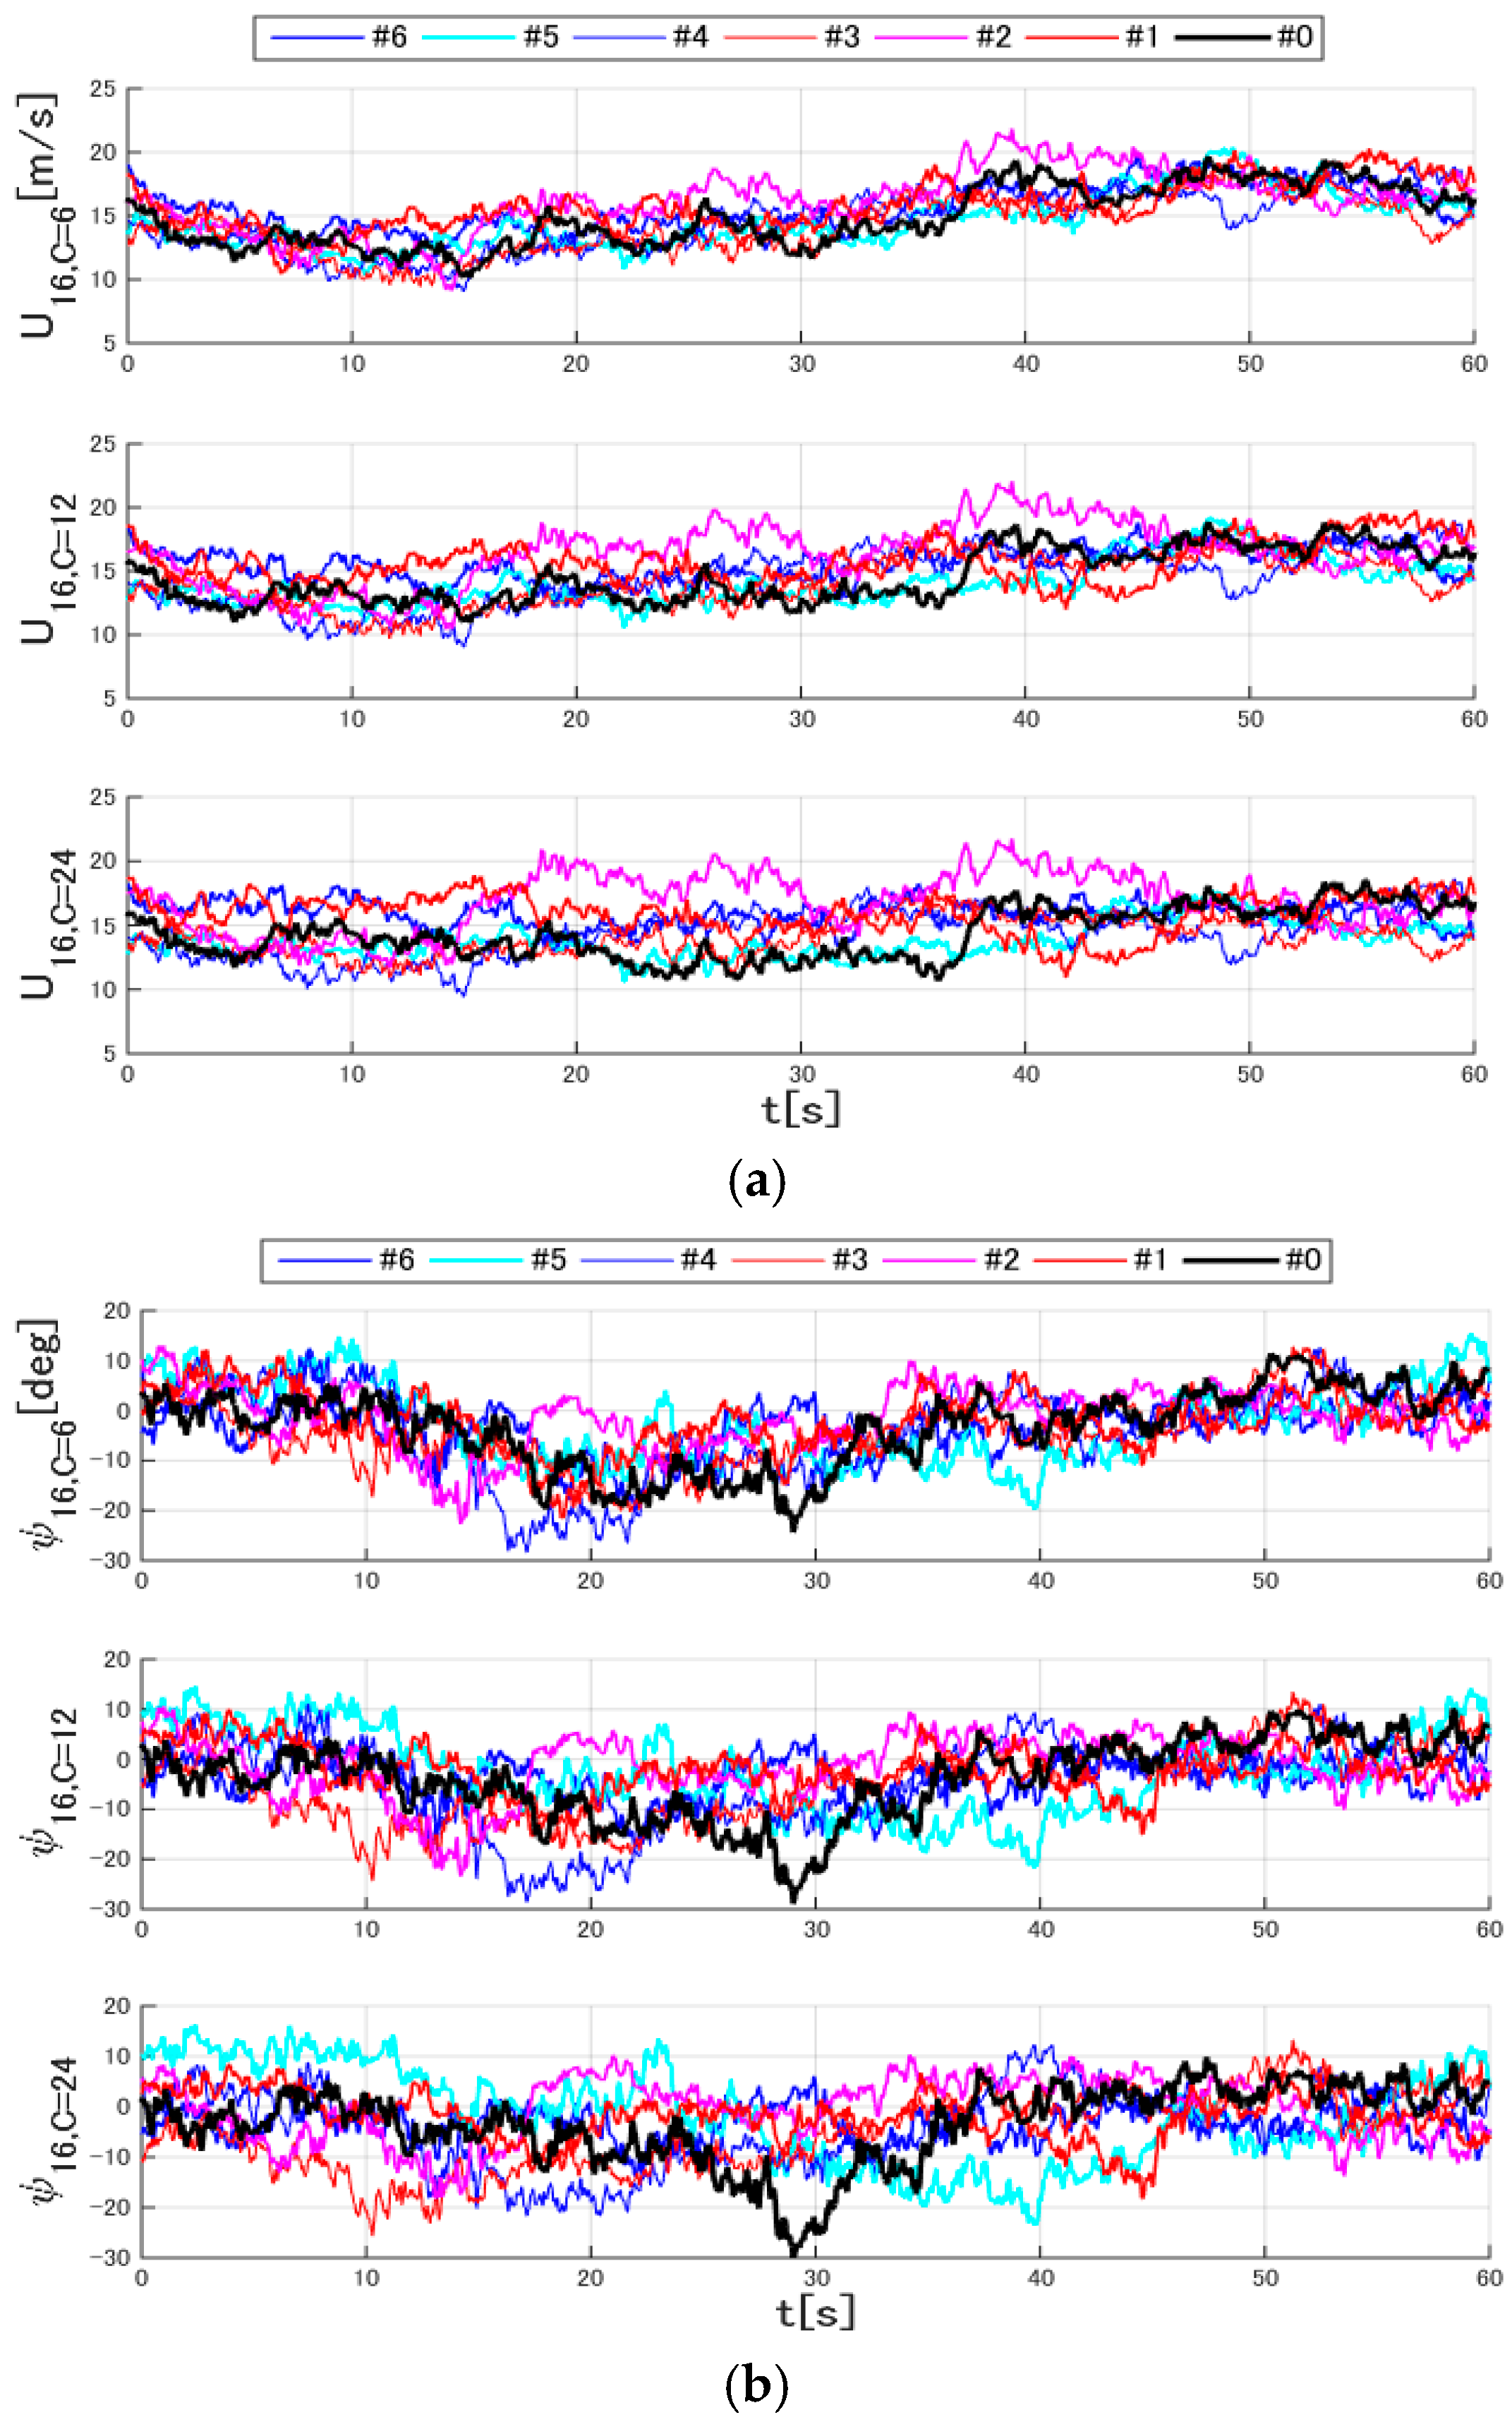
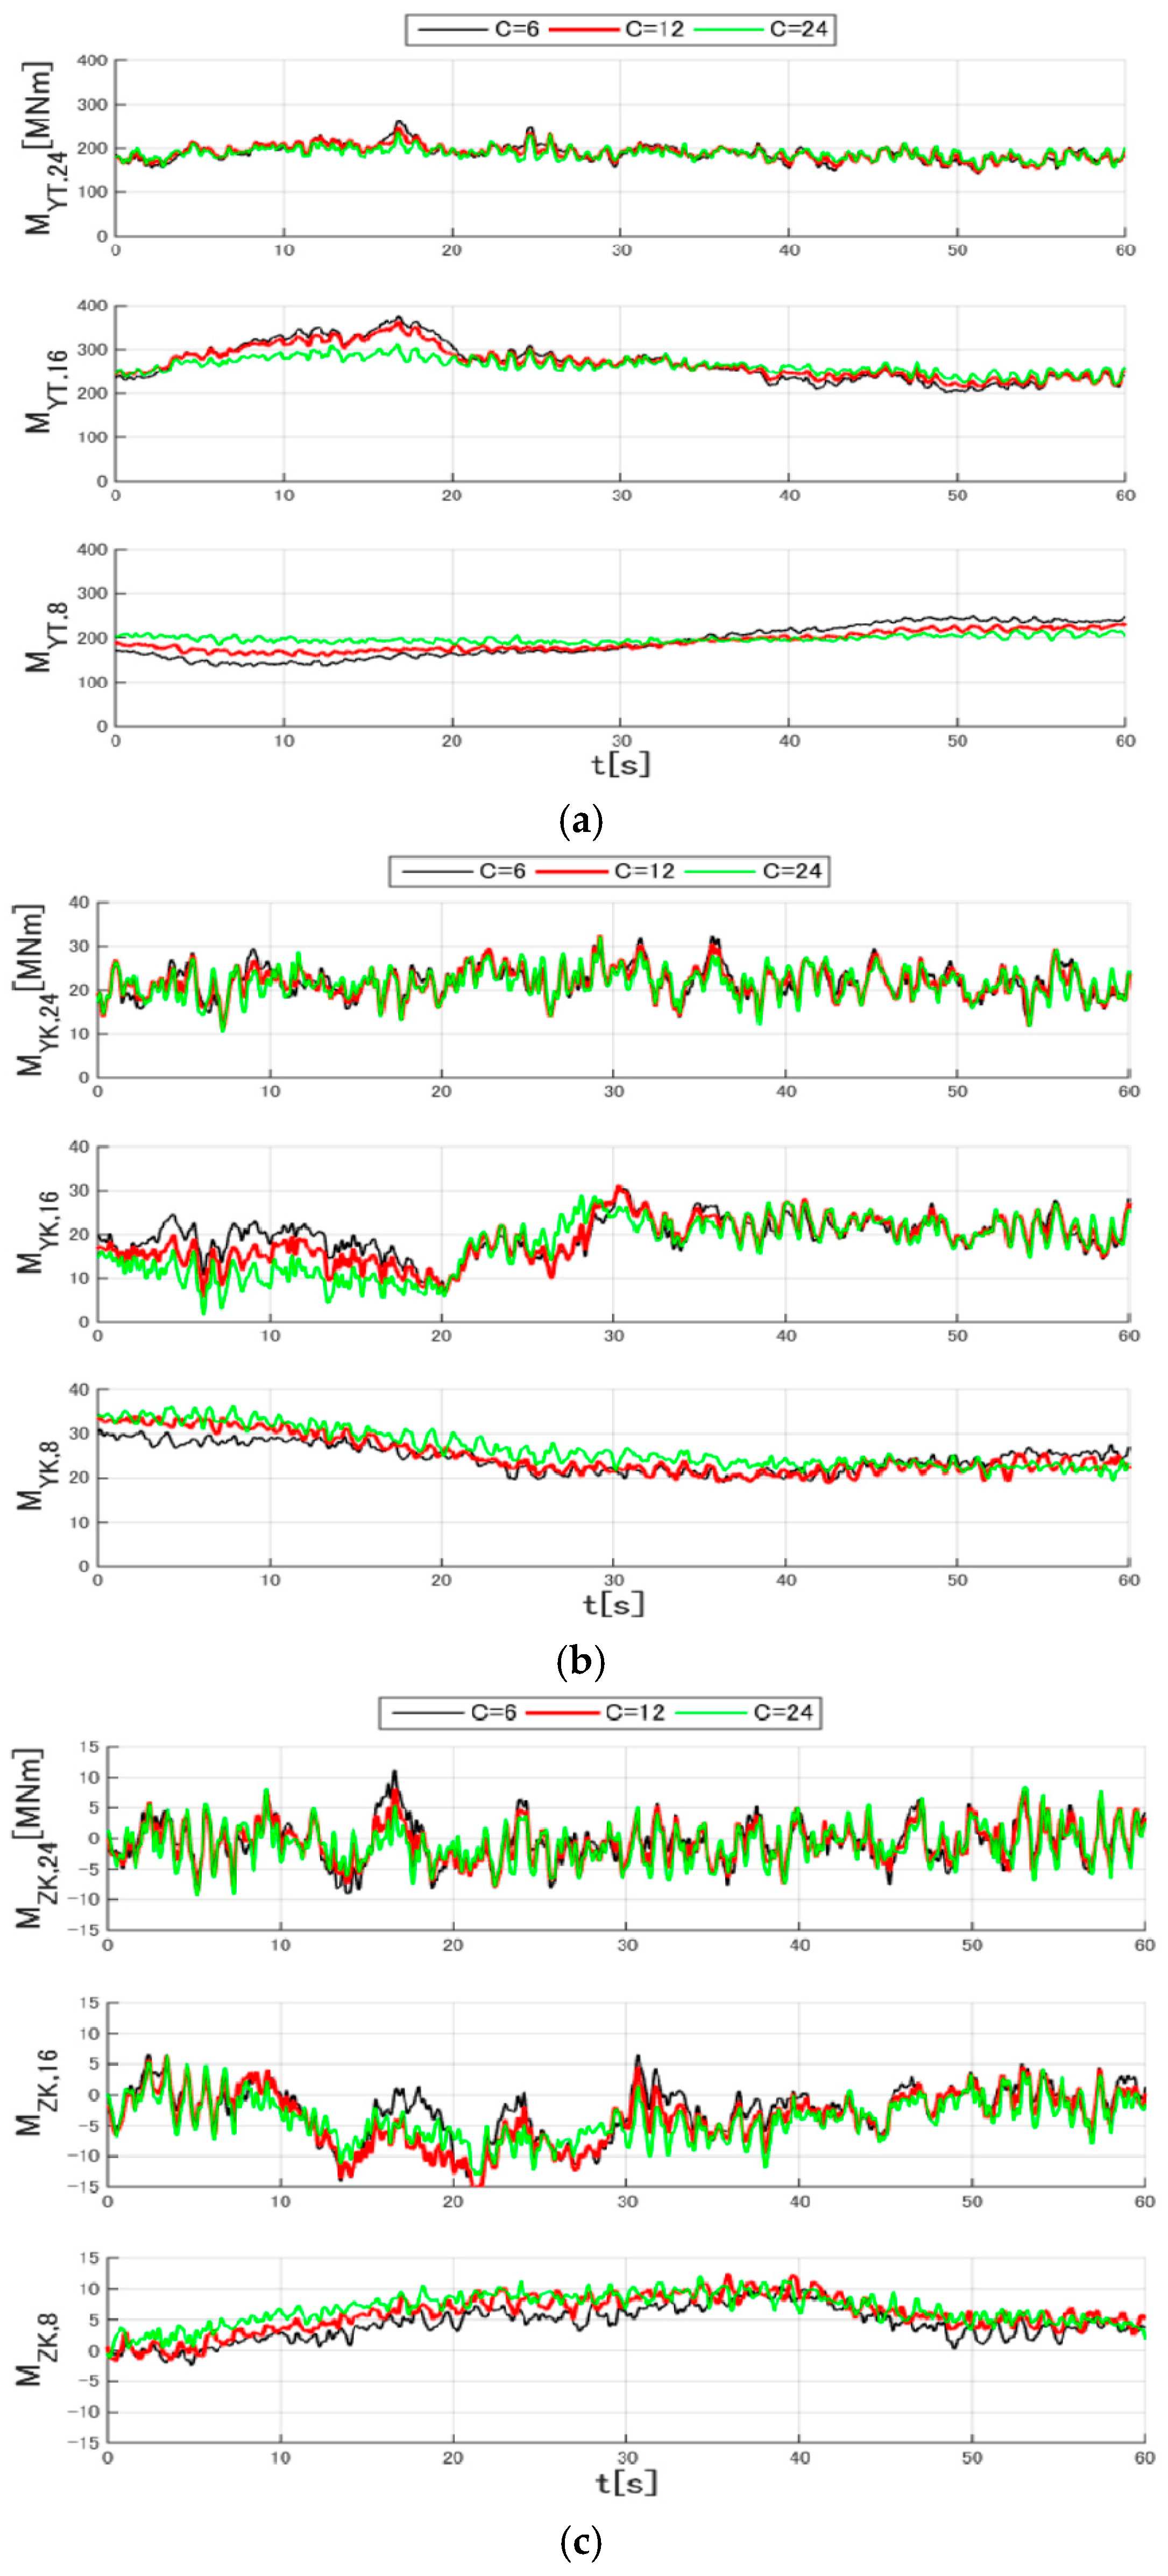
4. Tower Loads
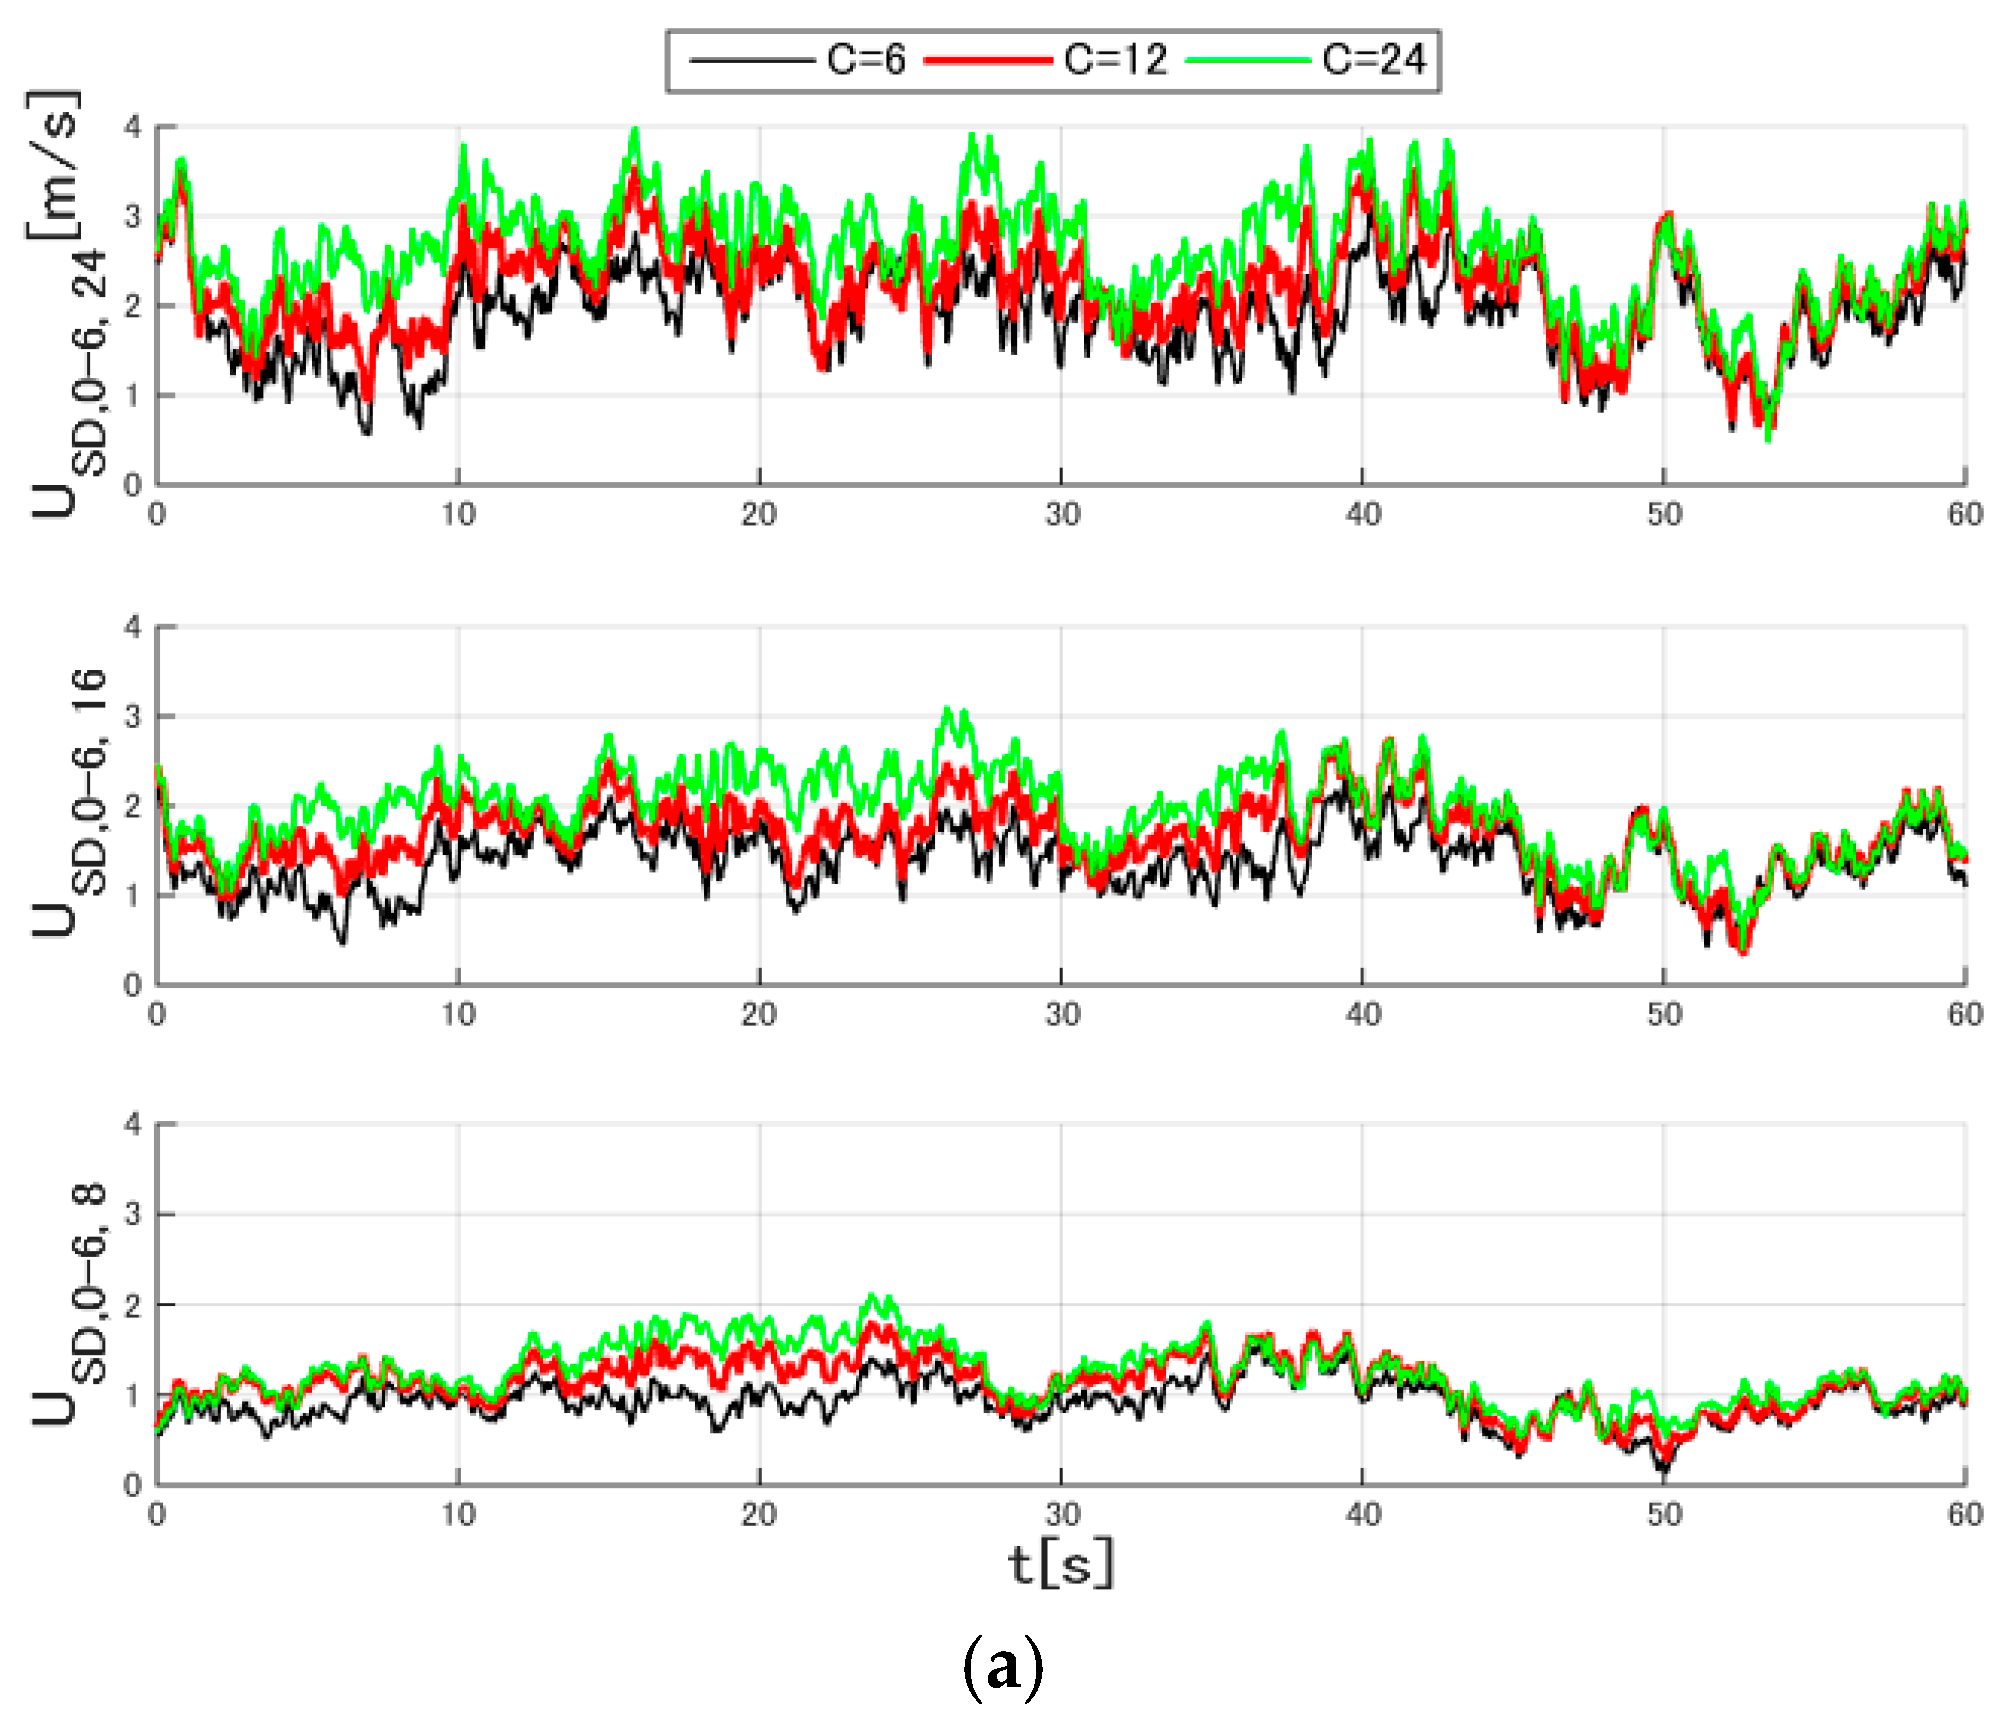
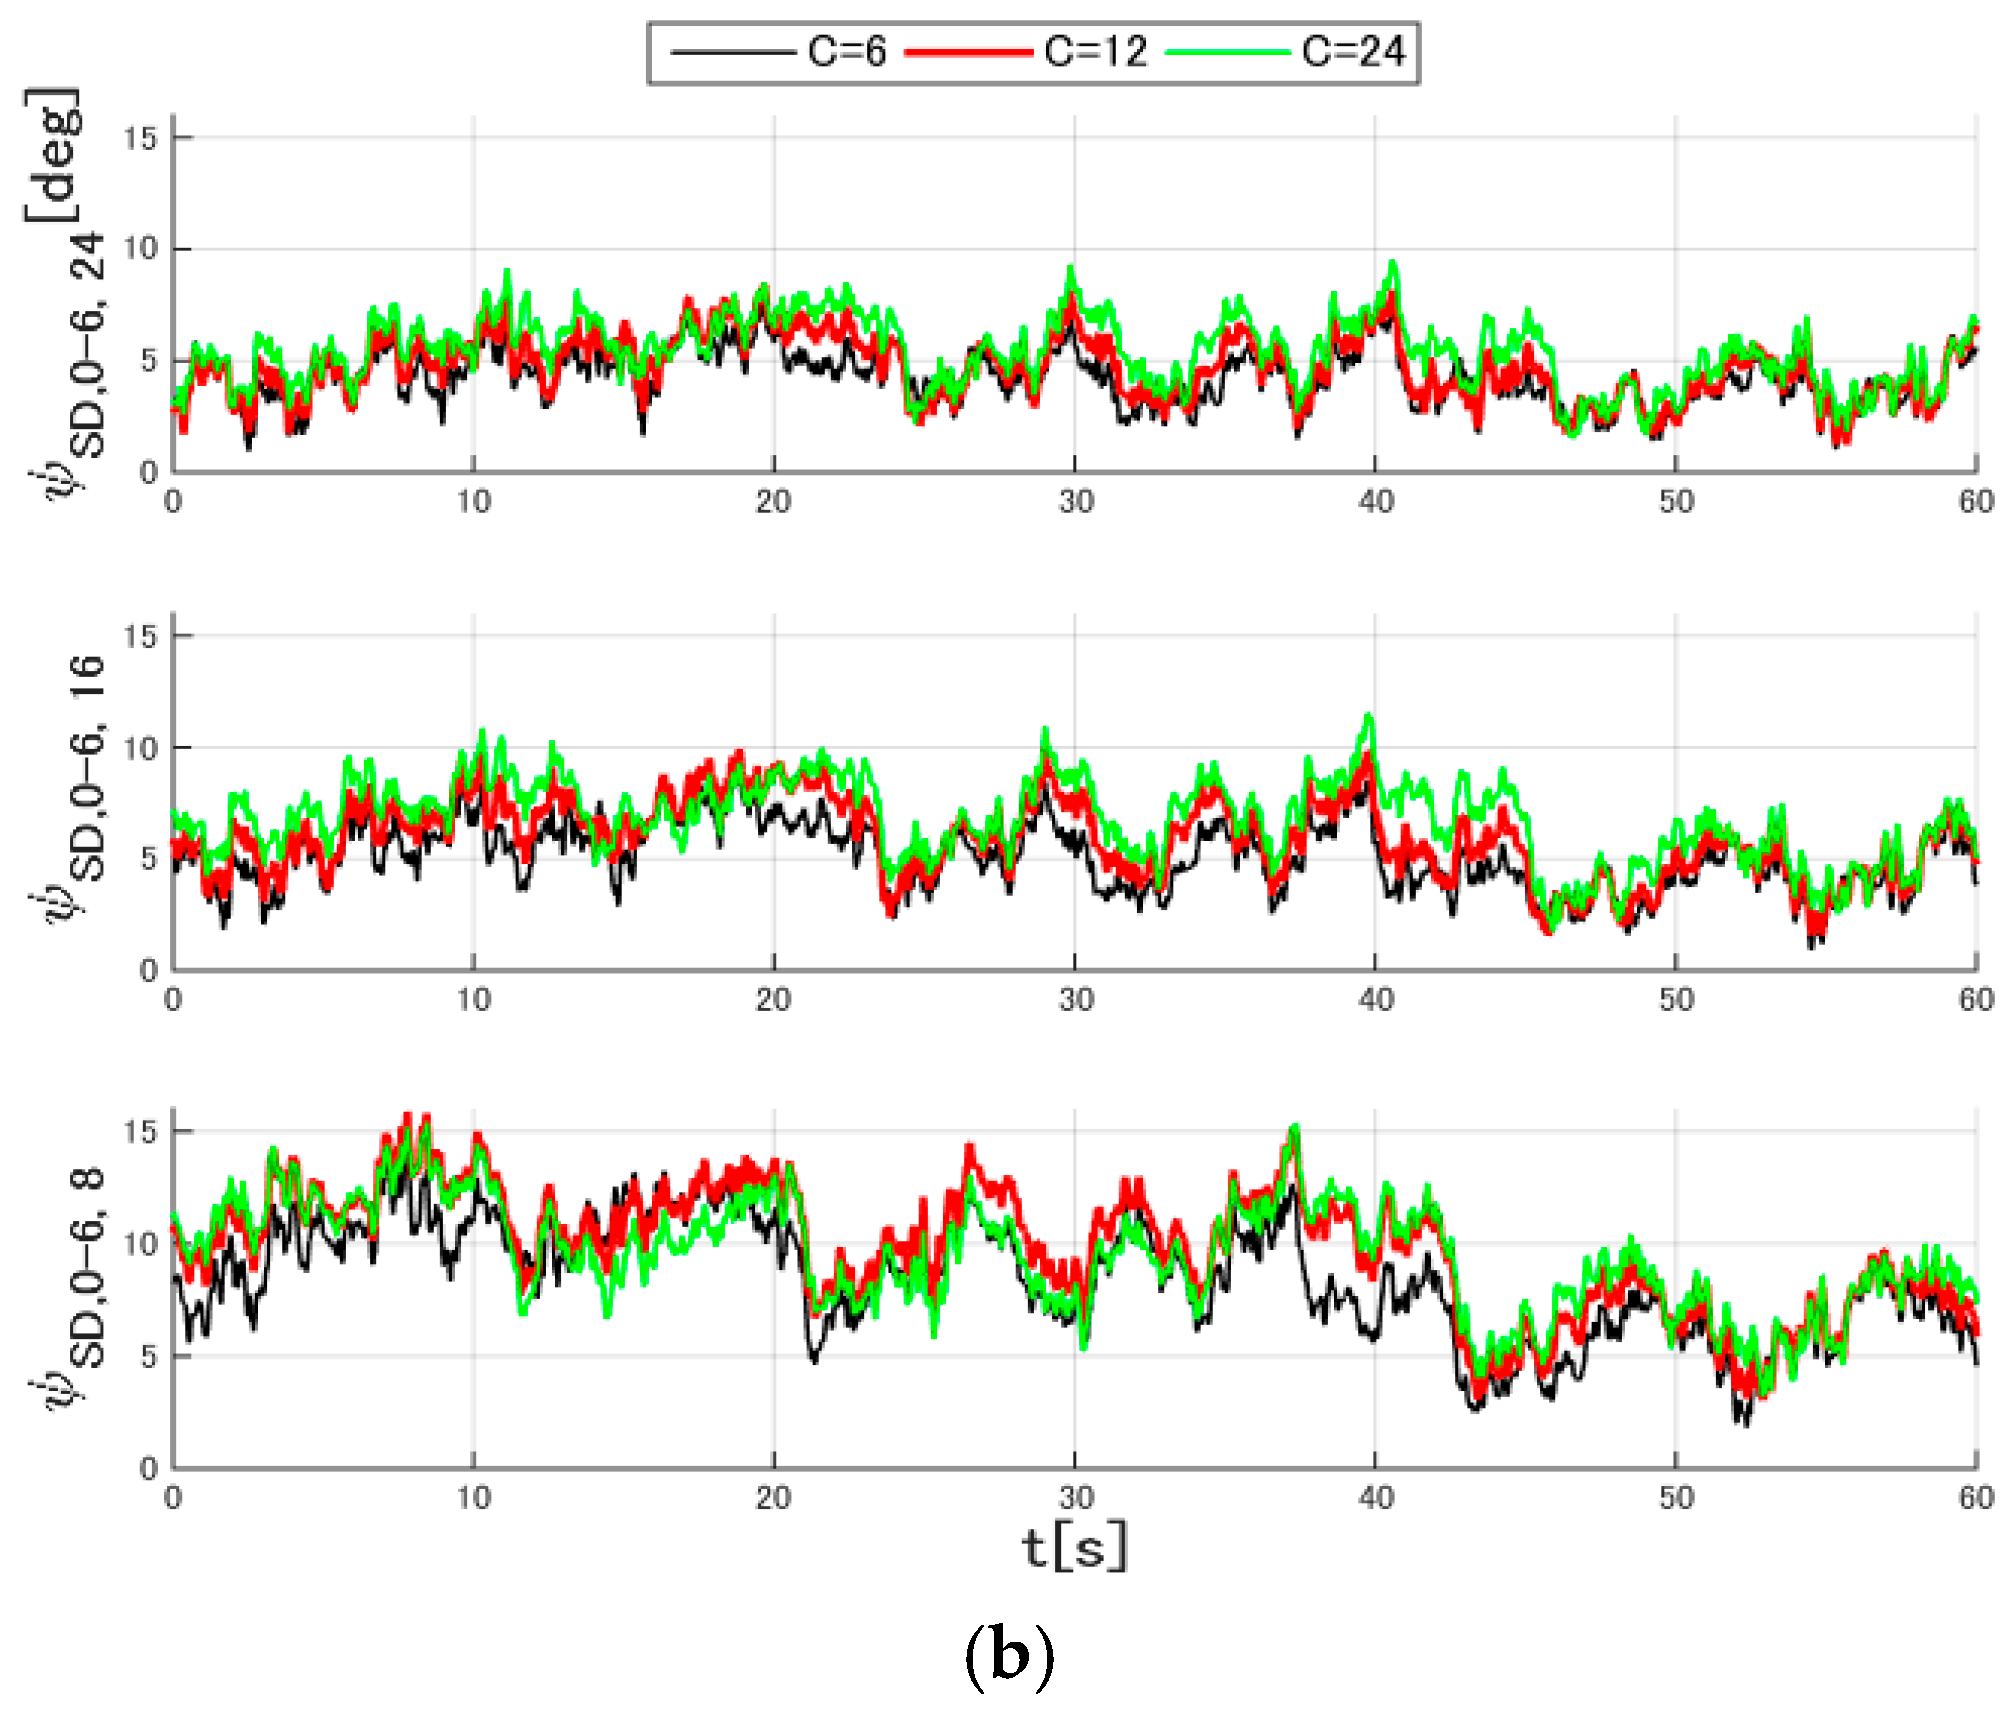
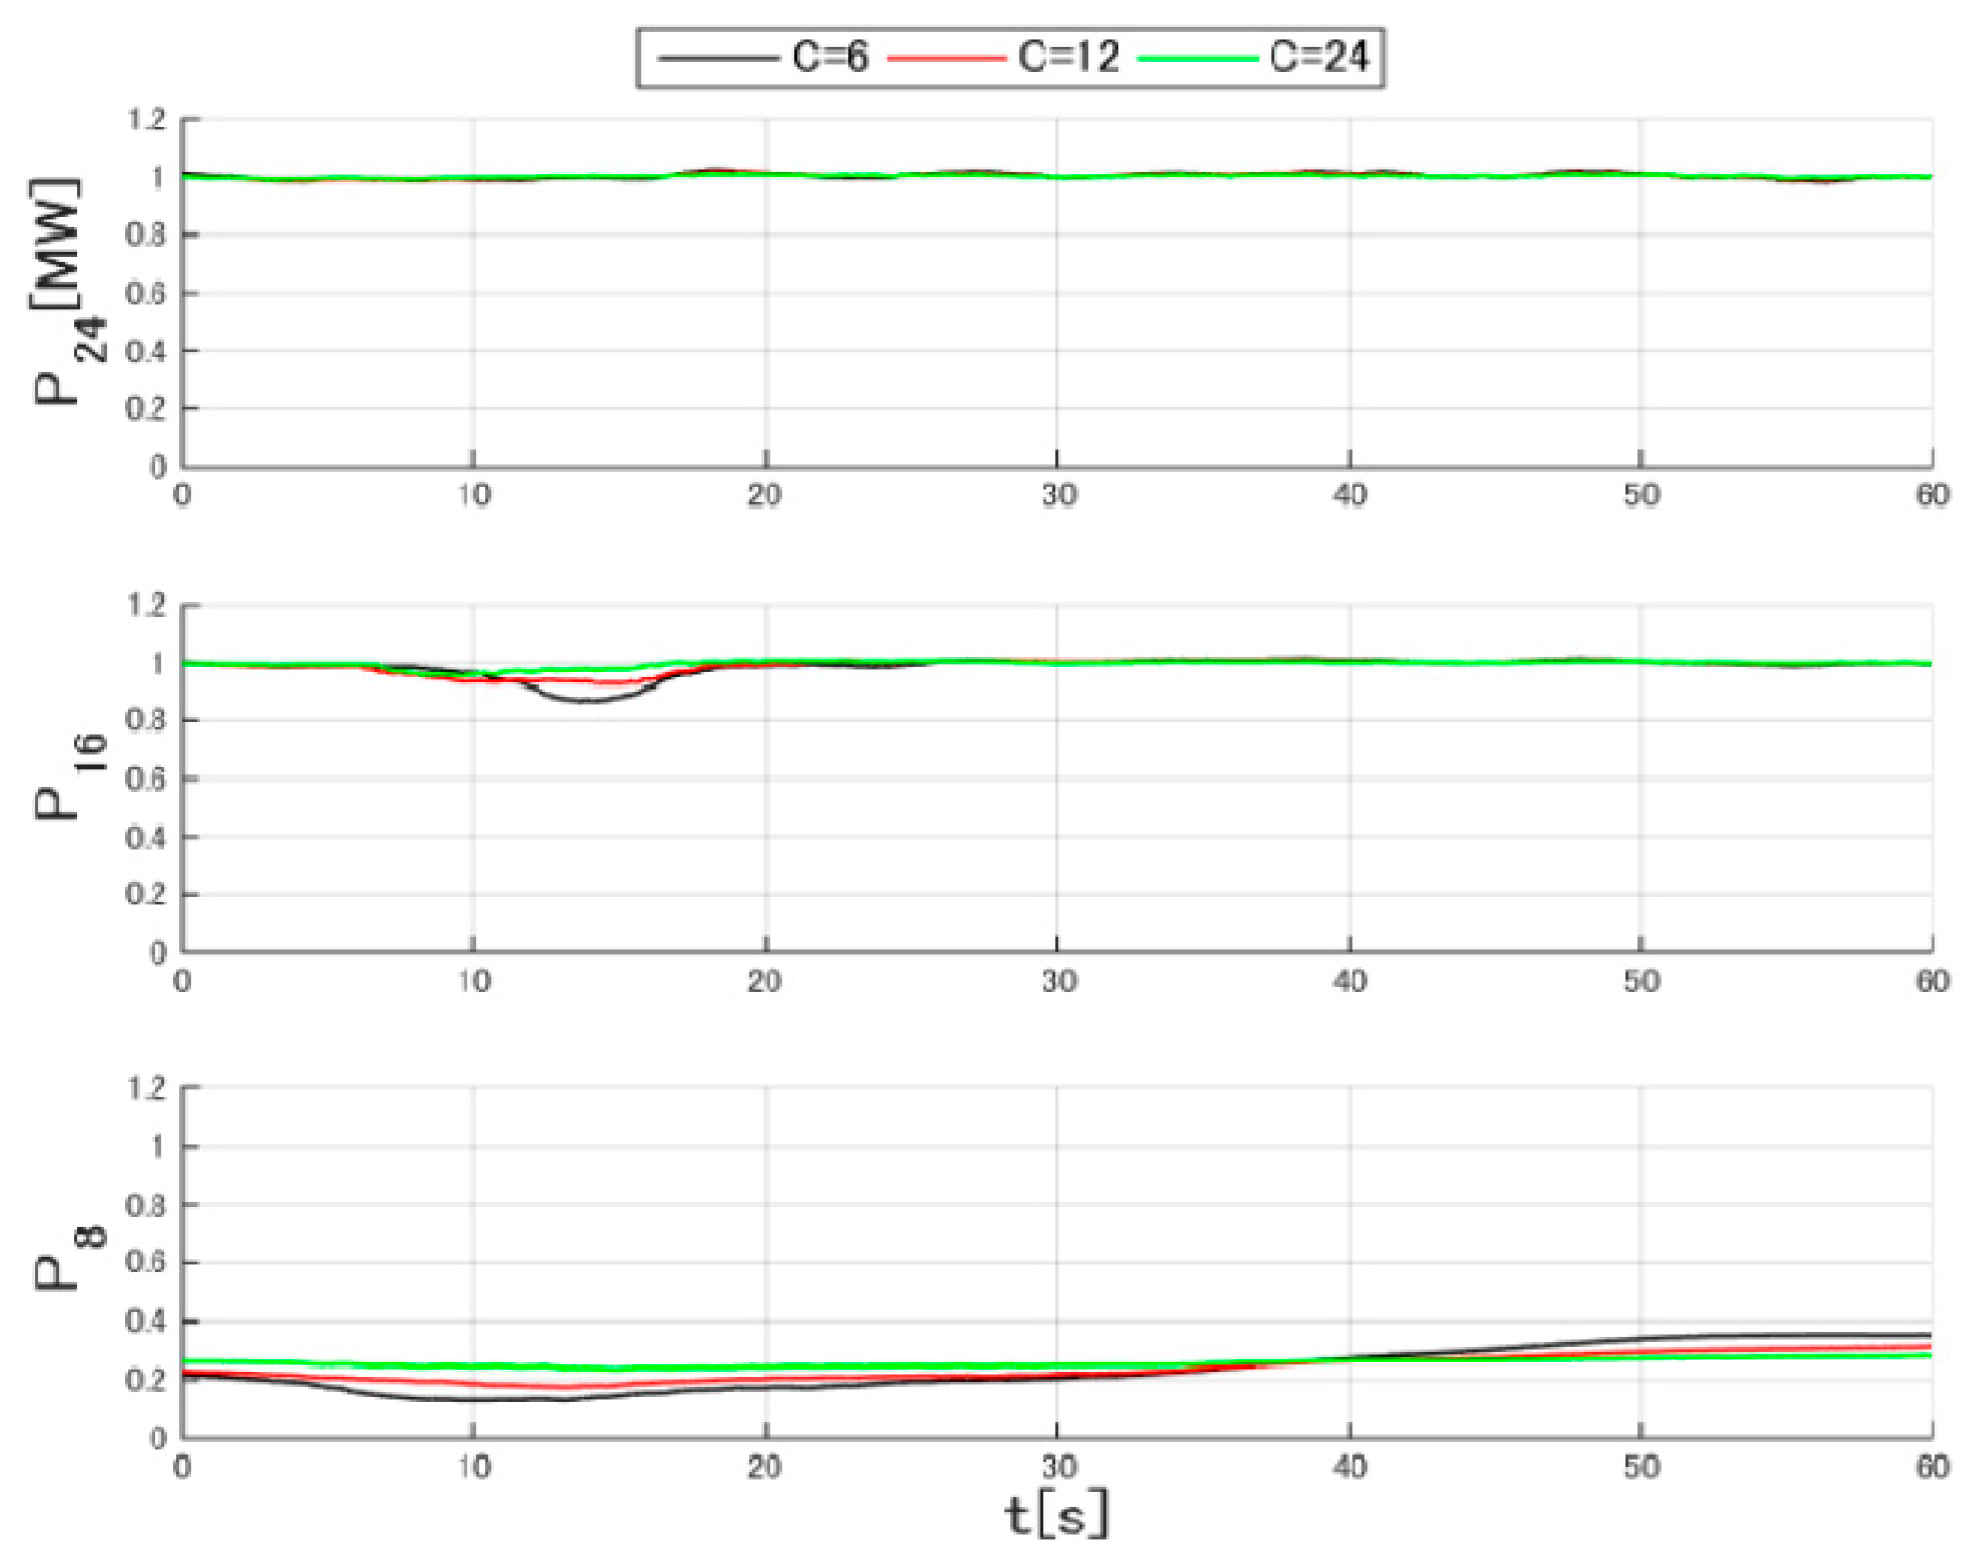
4.1. Time History
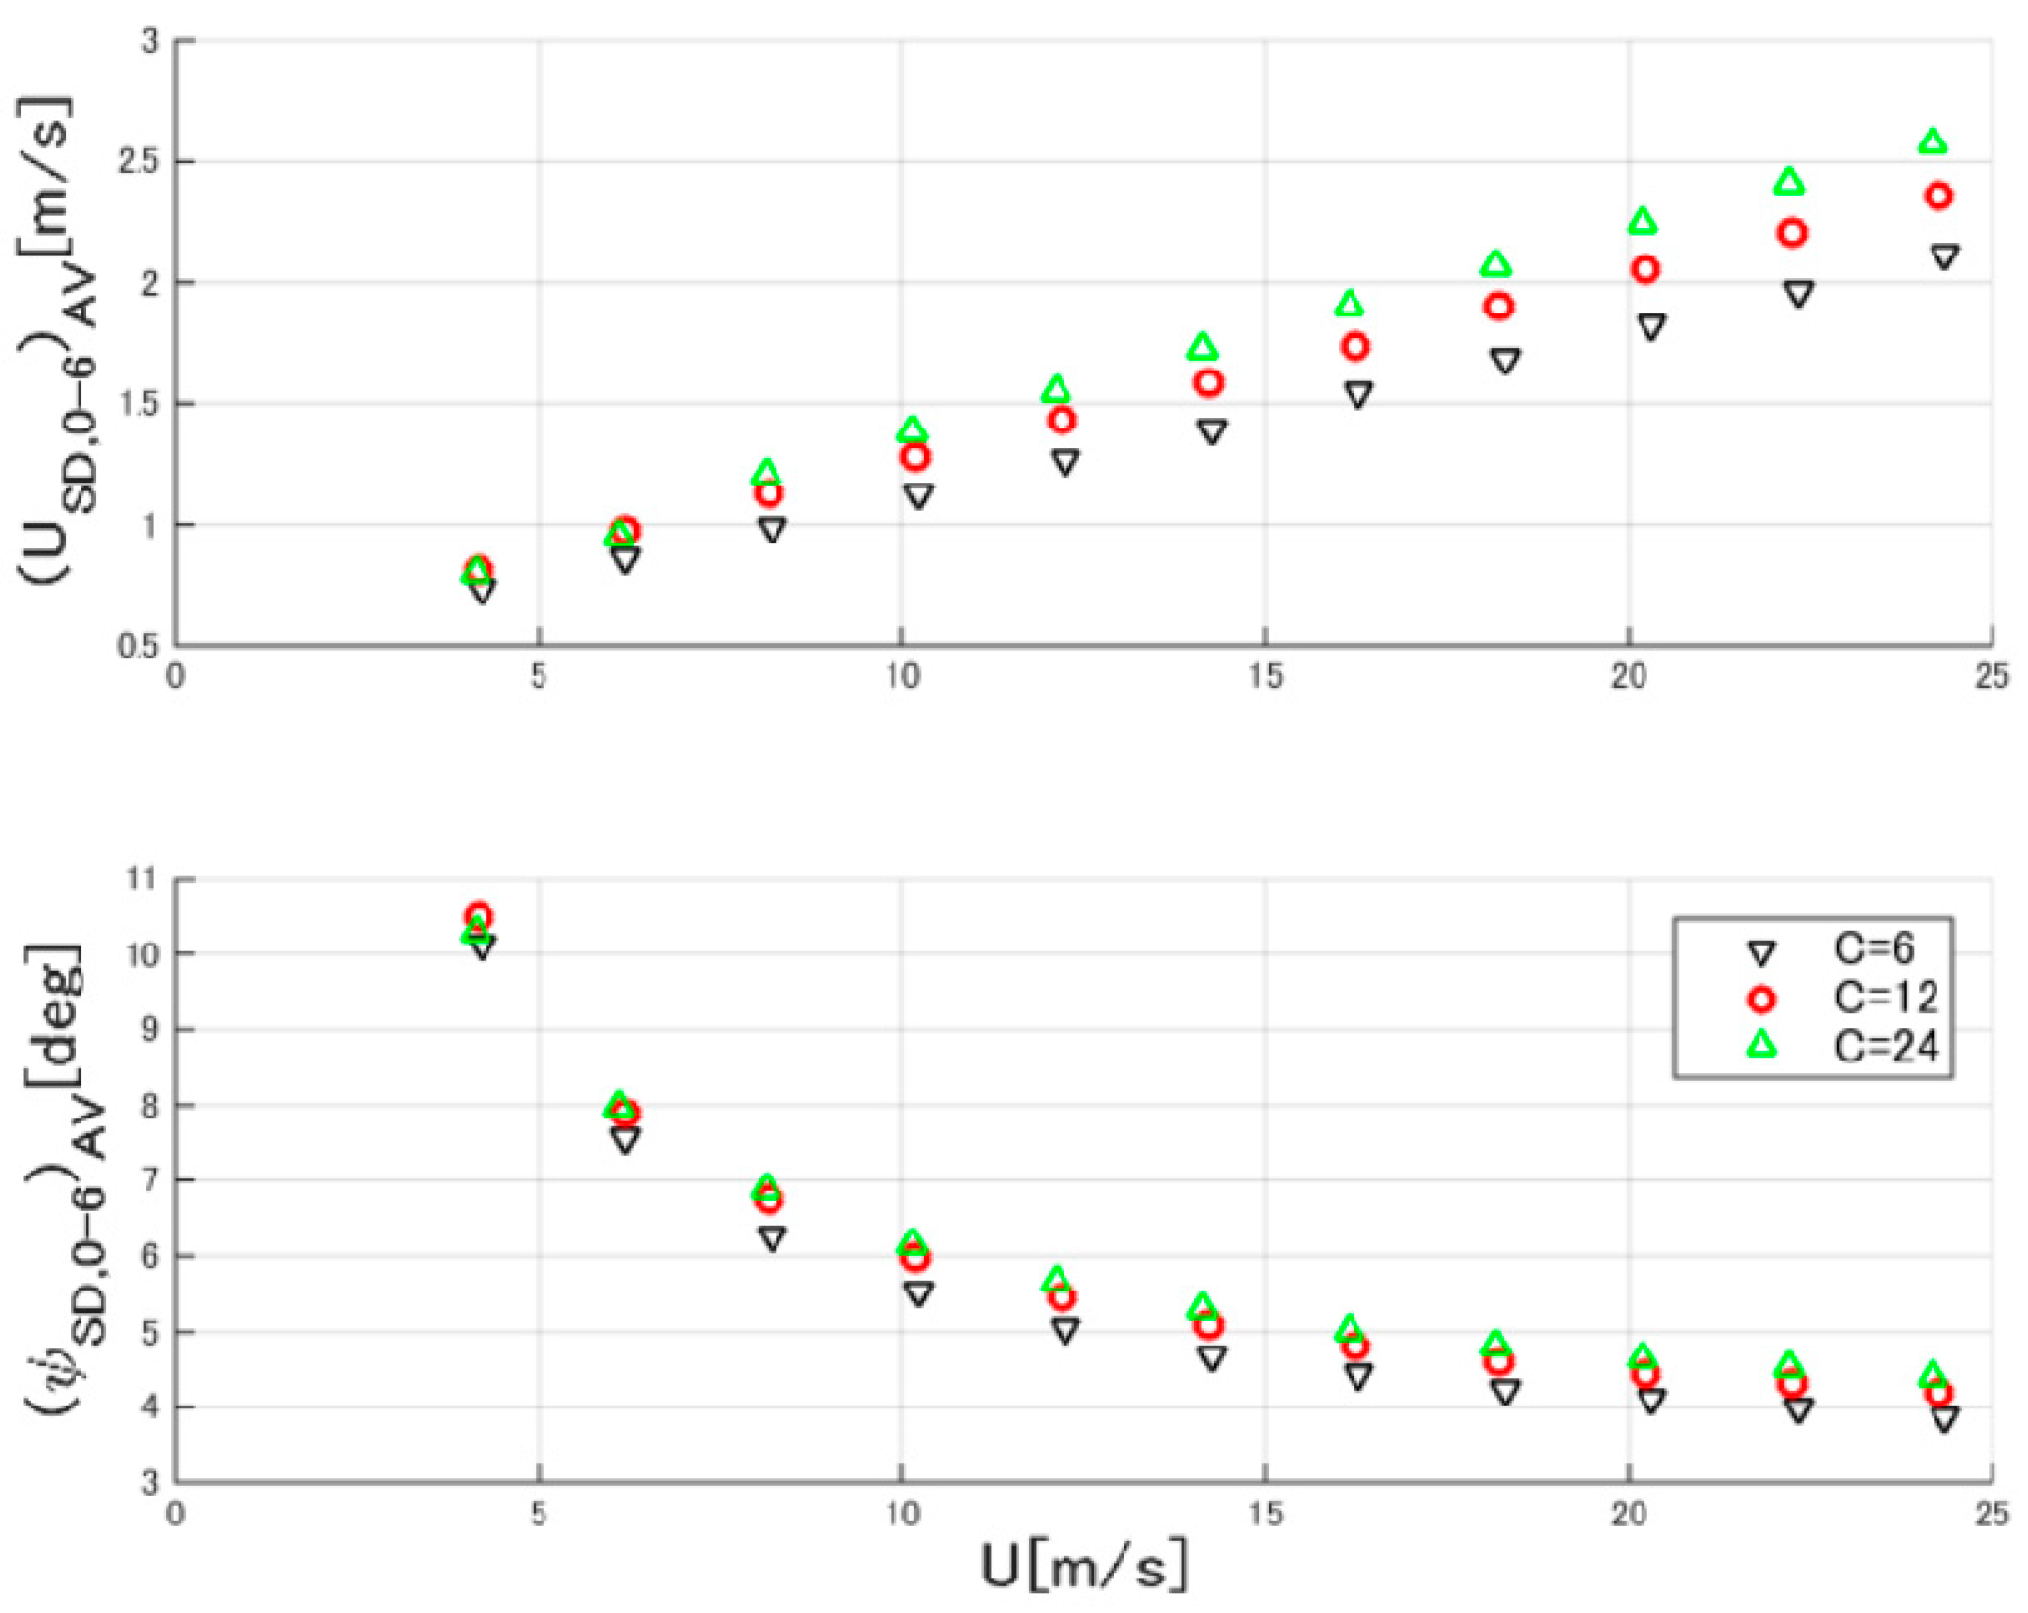
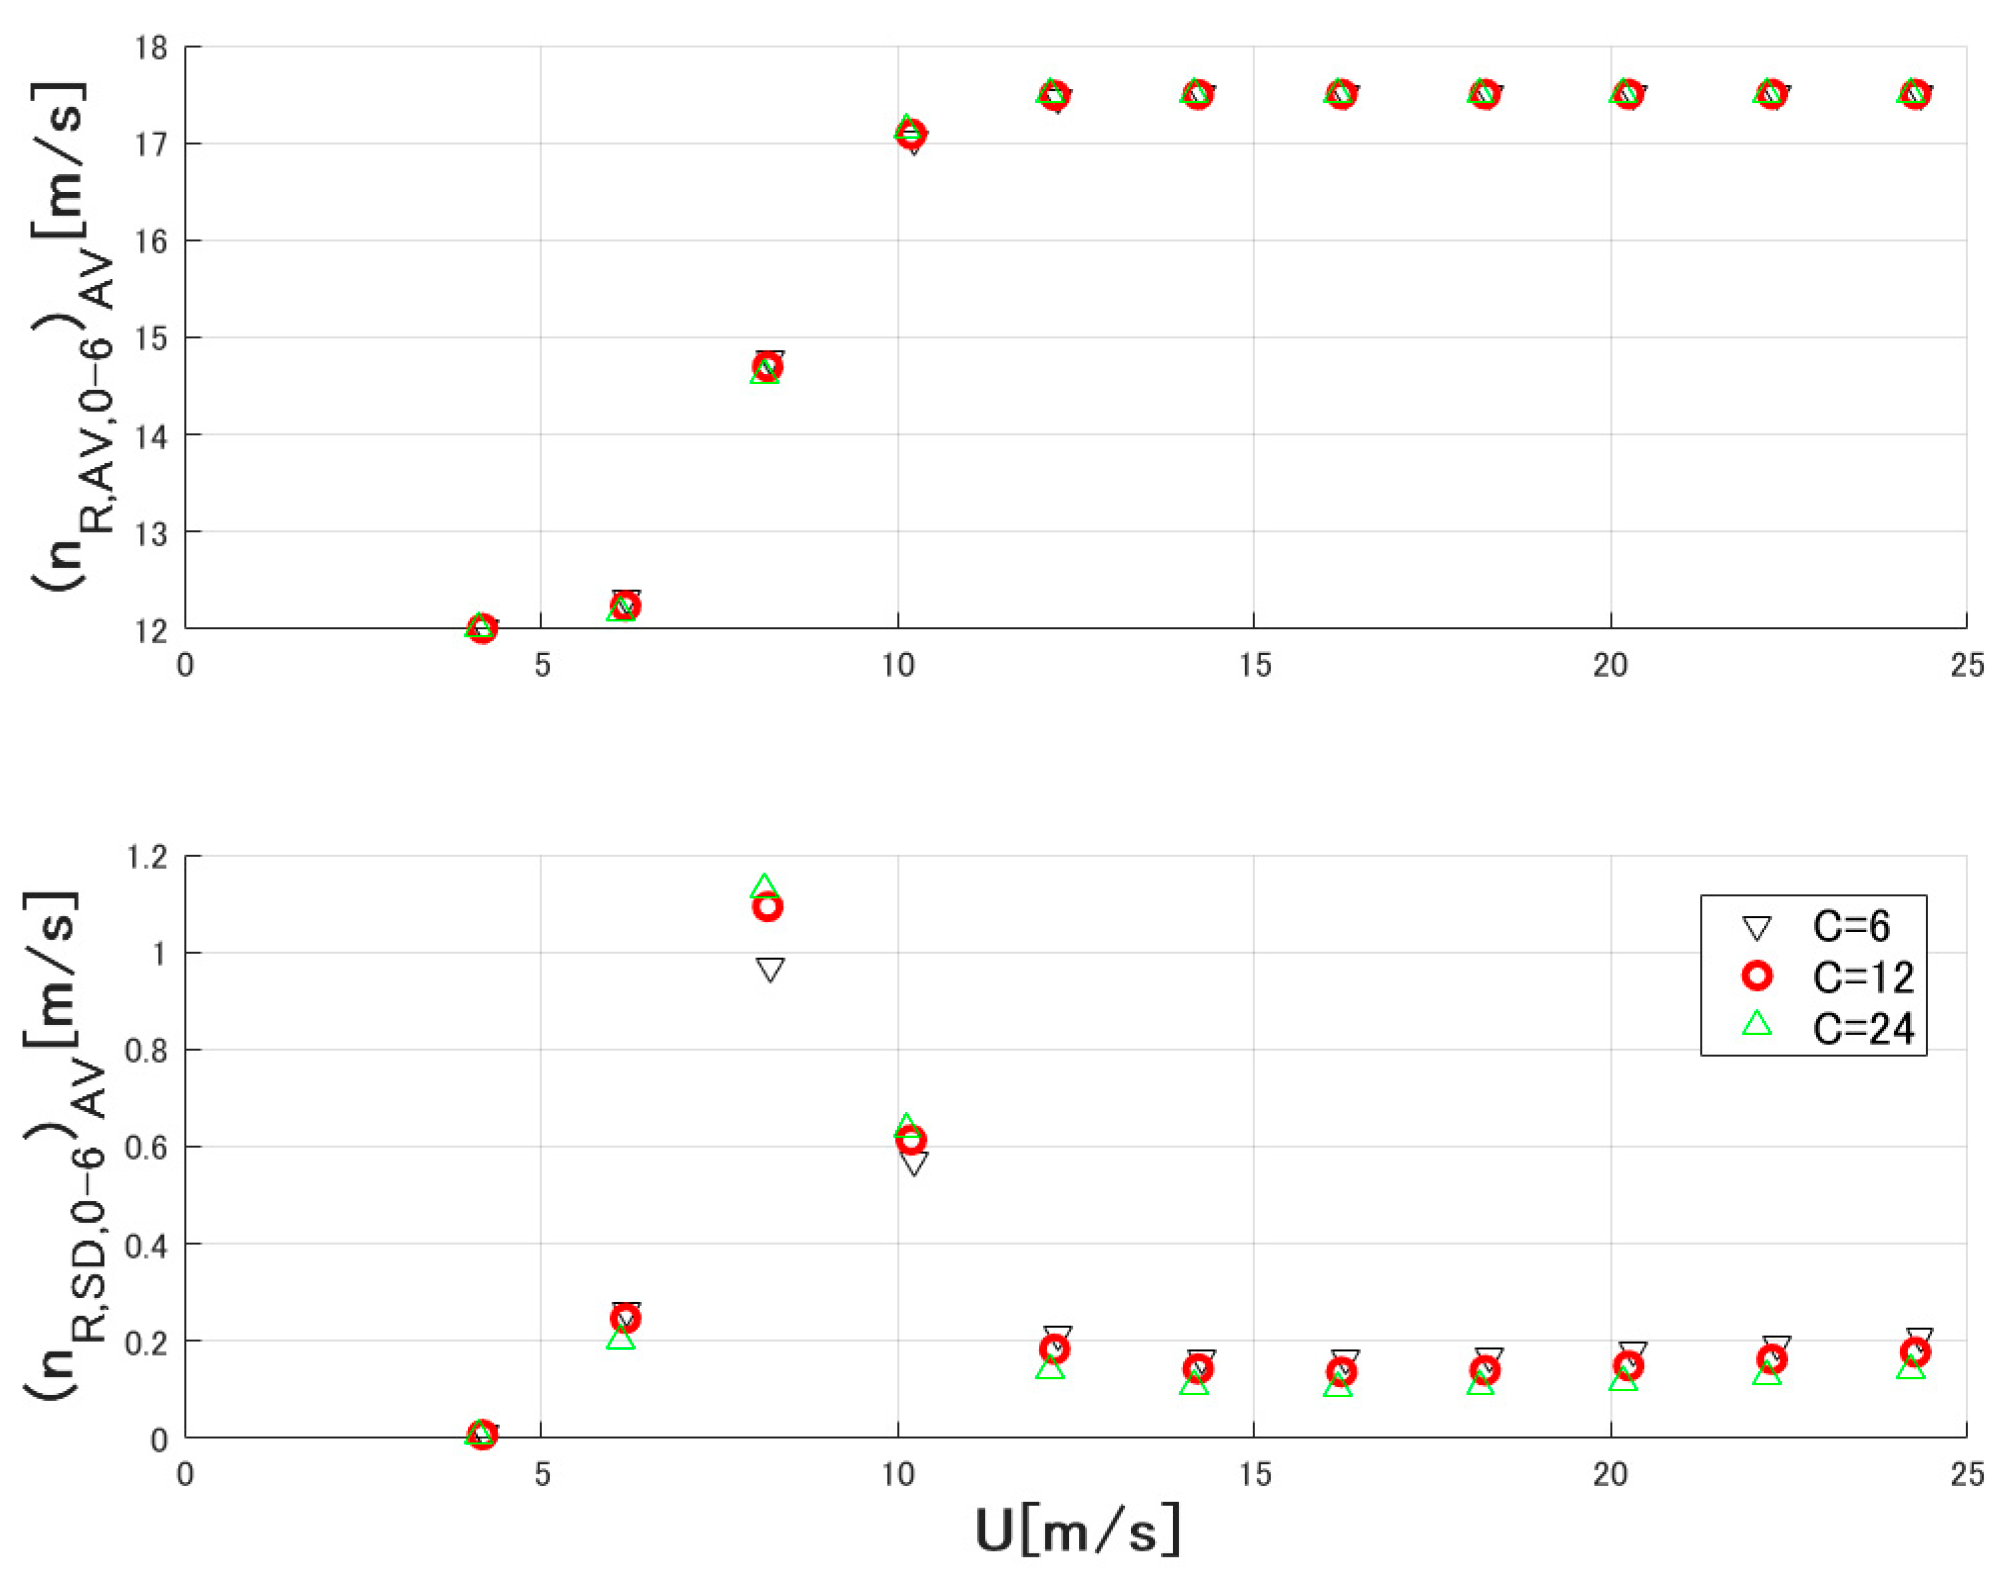
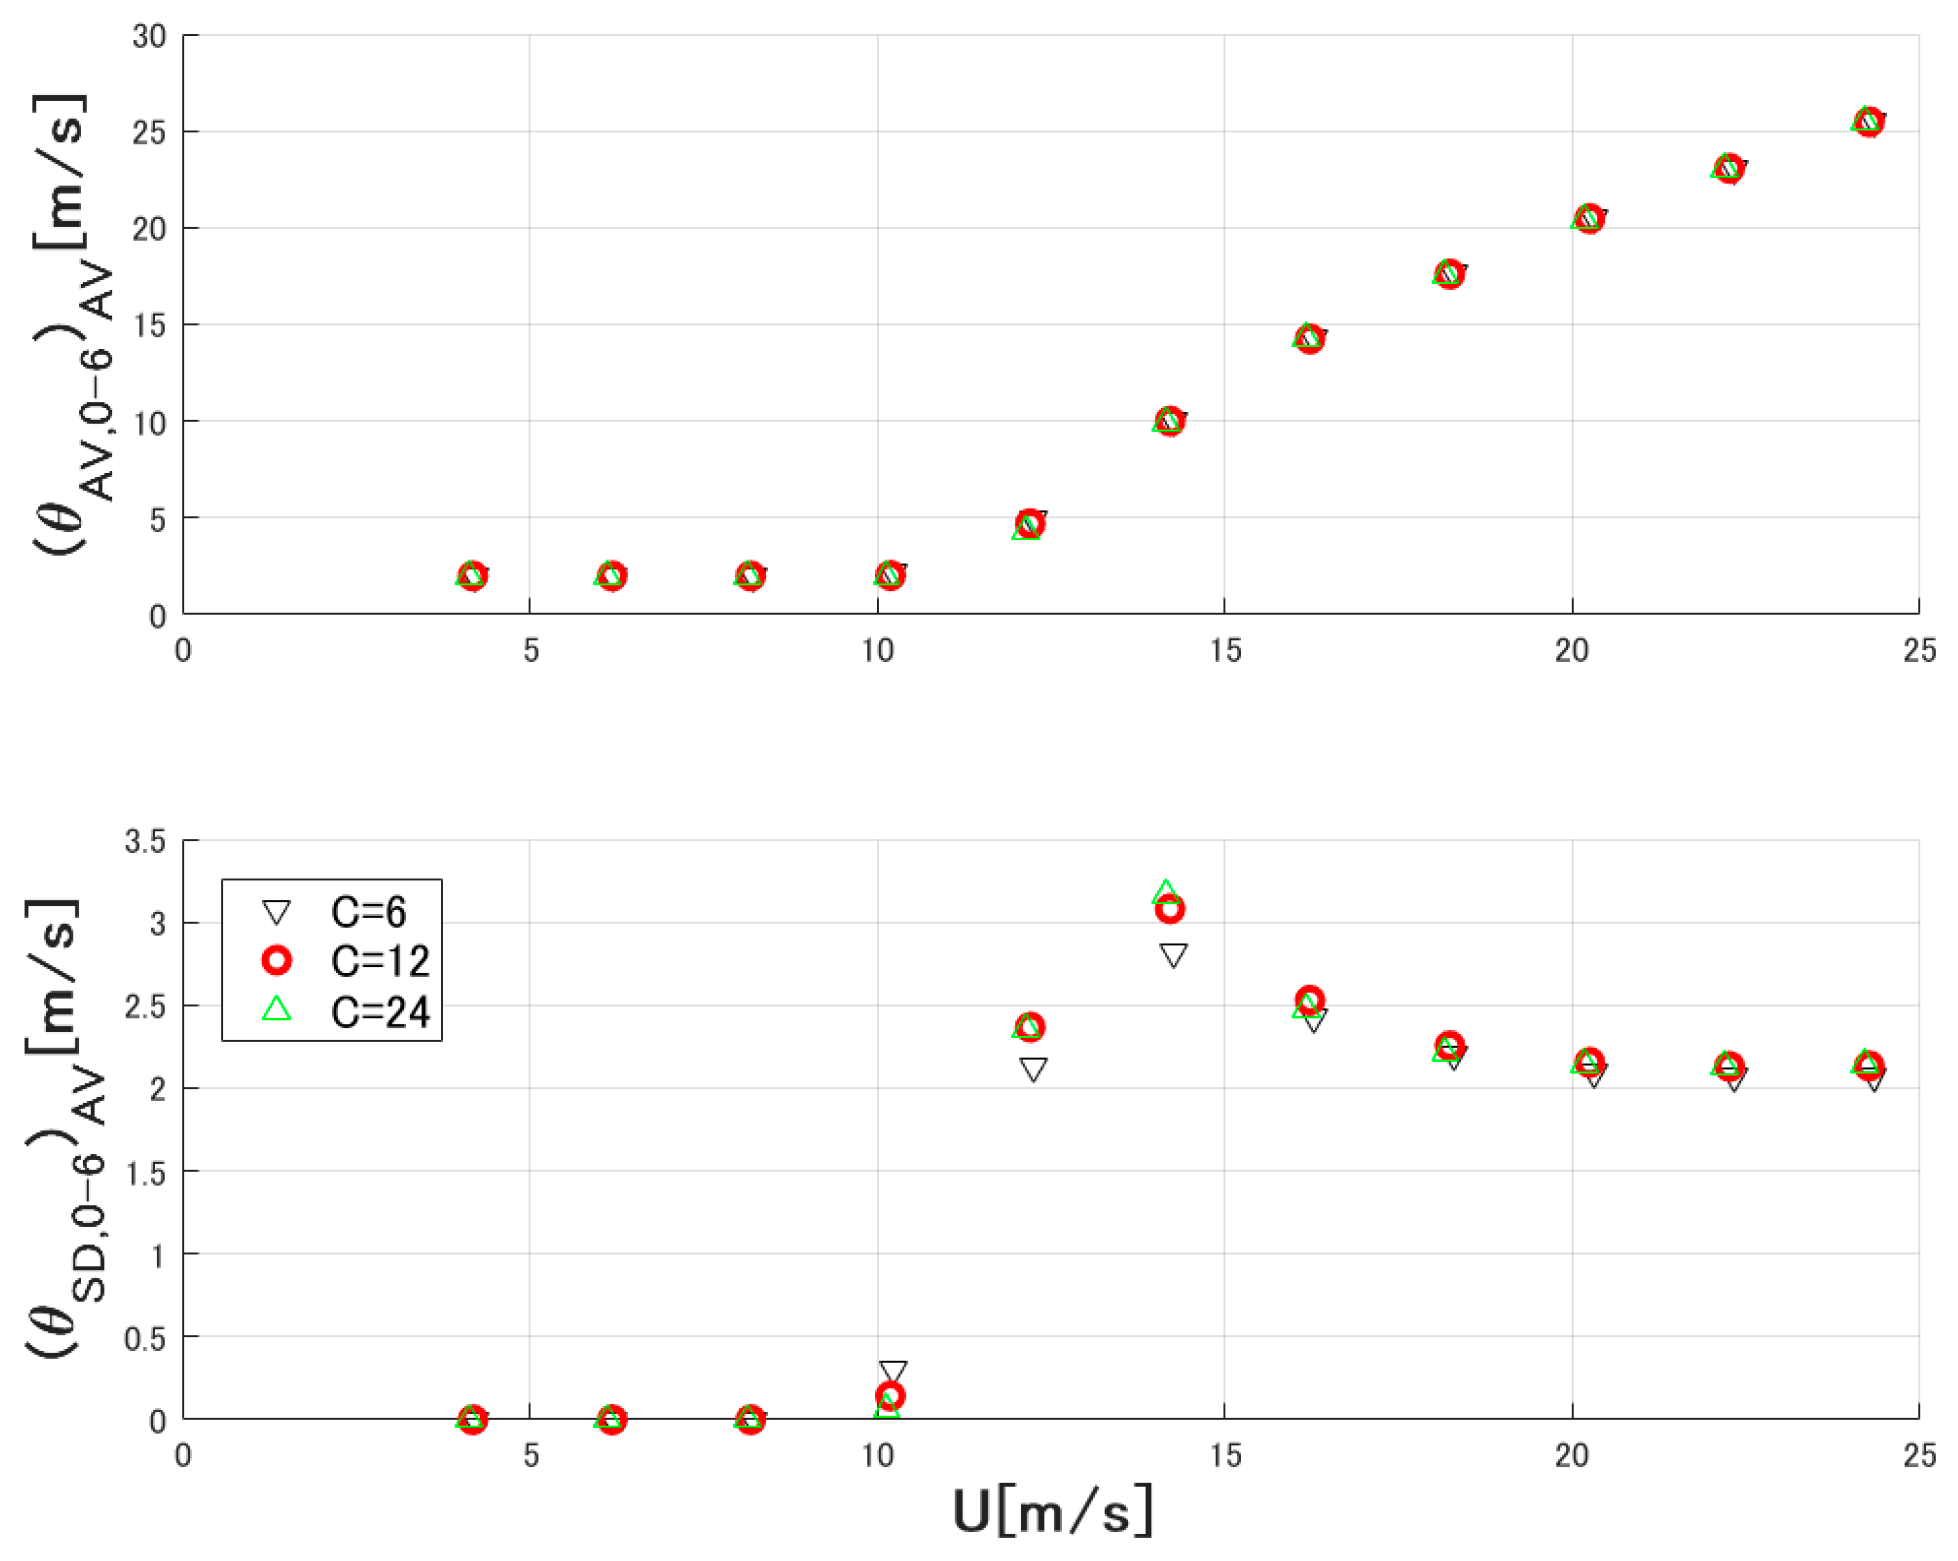
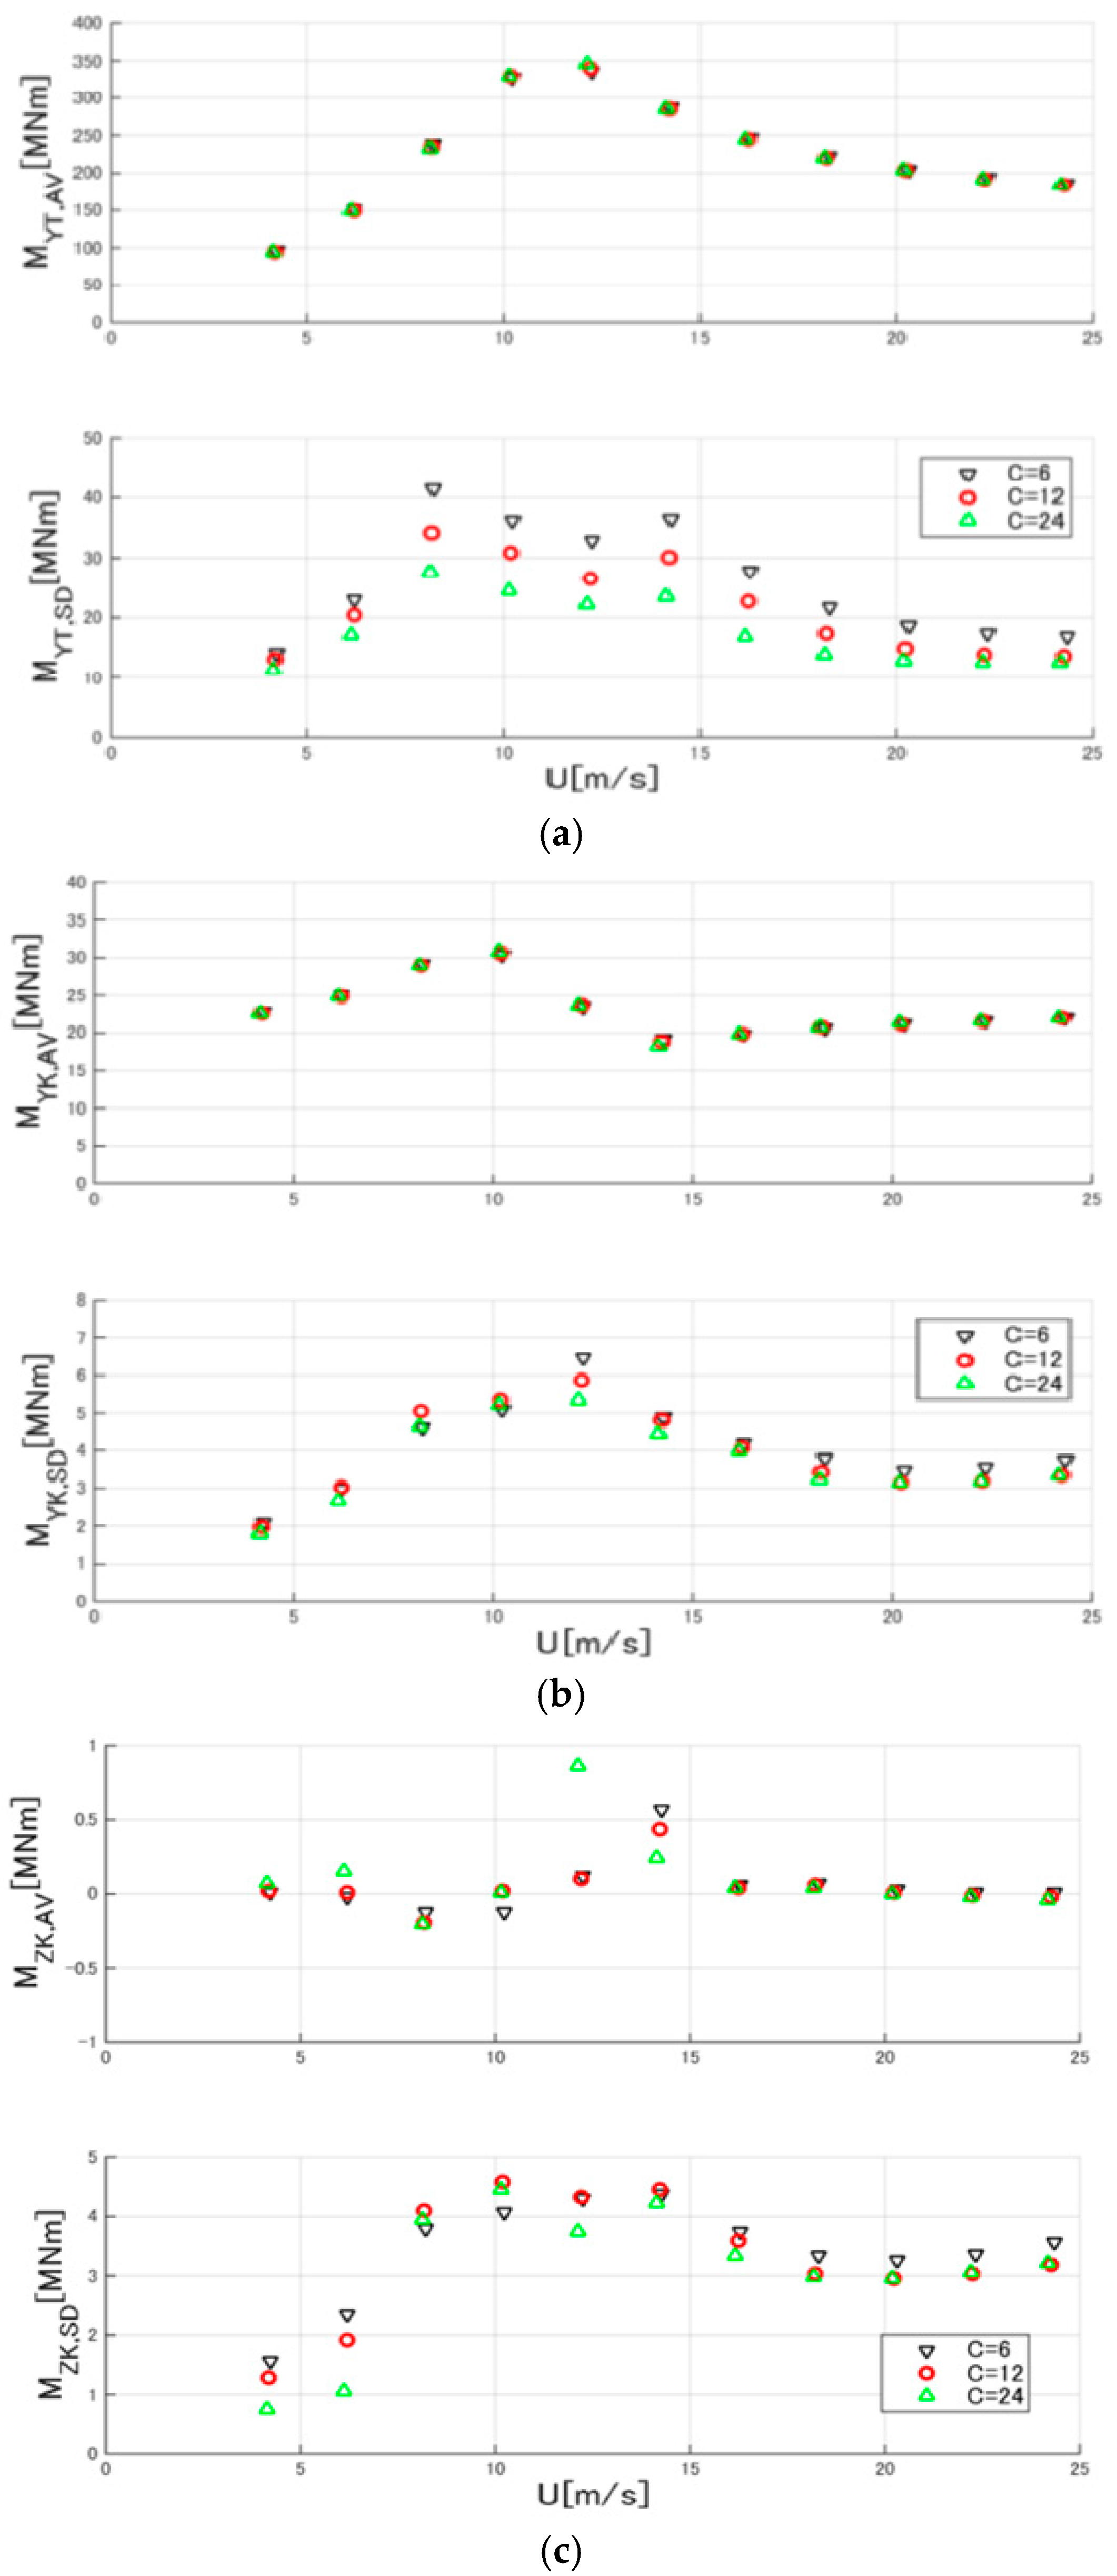
4.2. Statistics to Average Wind Speed
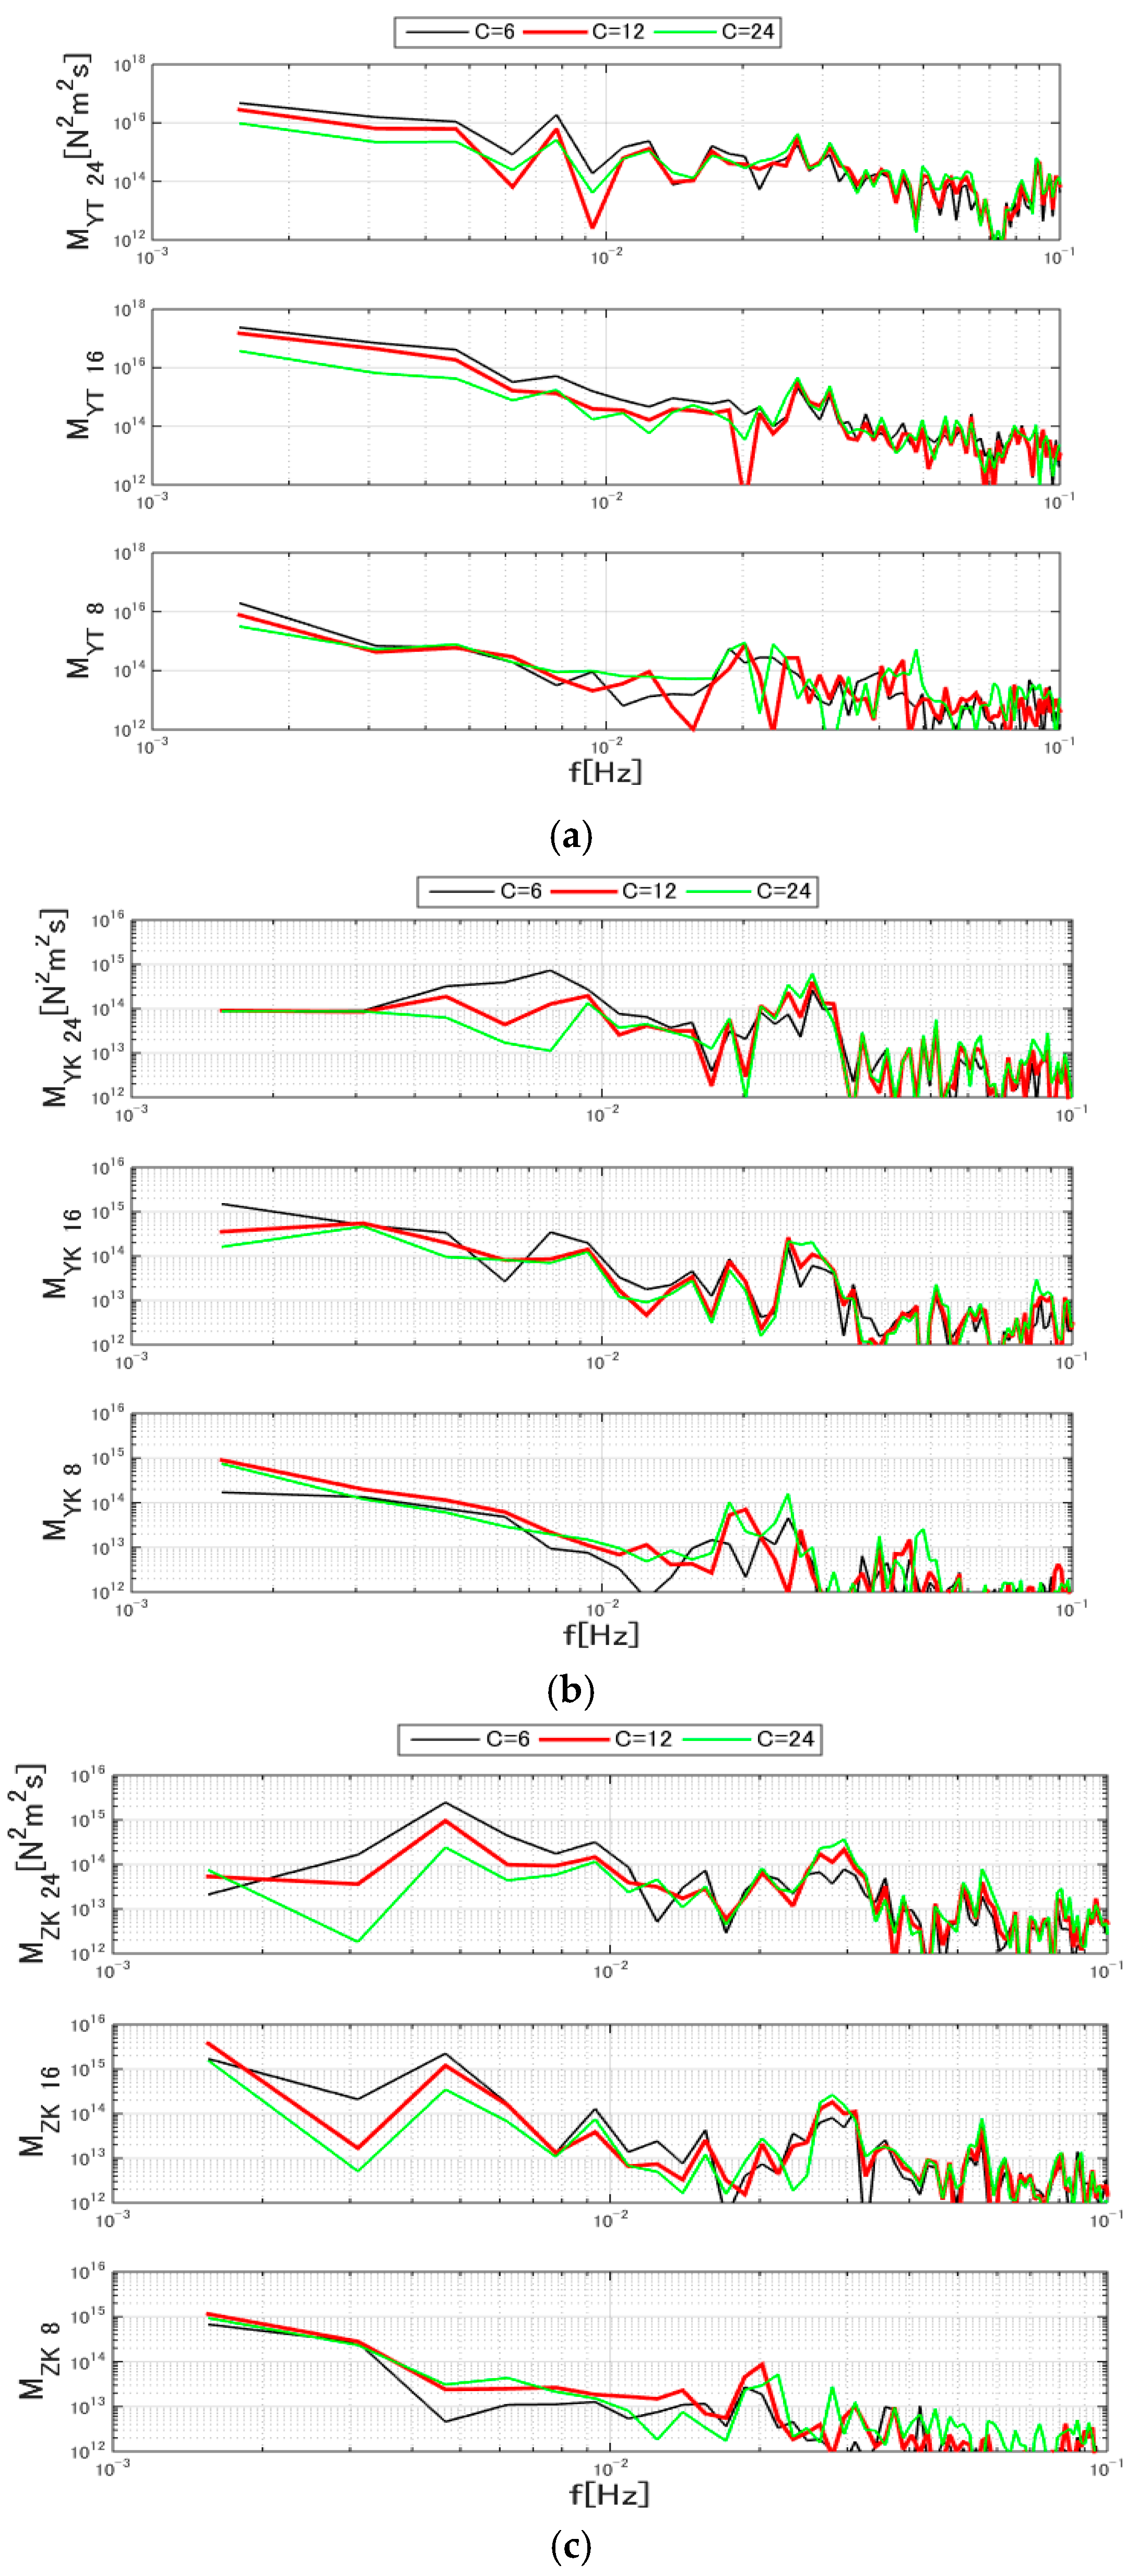
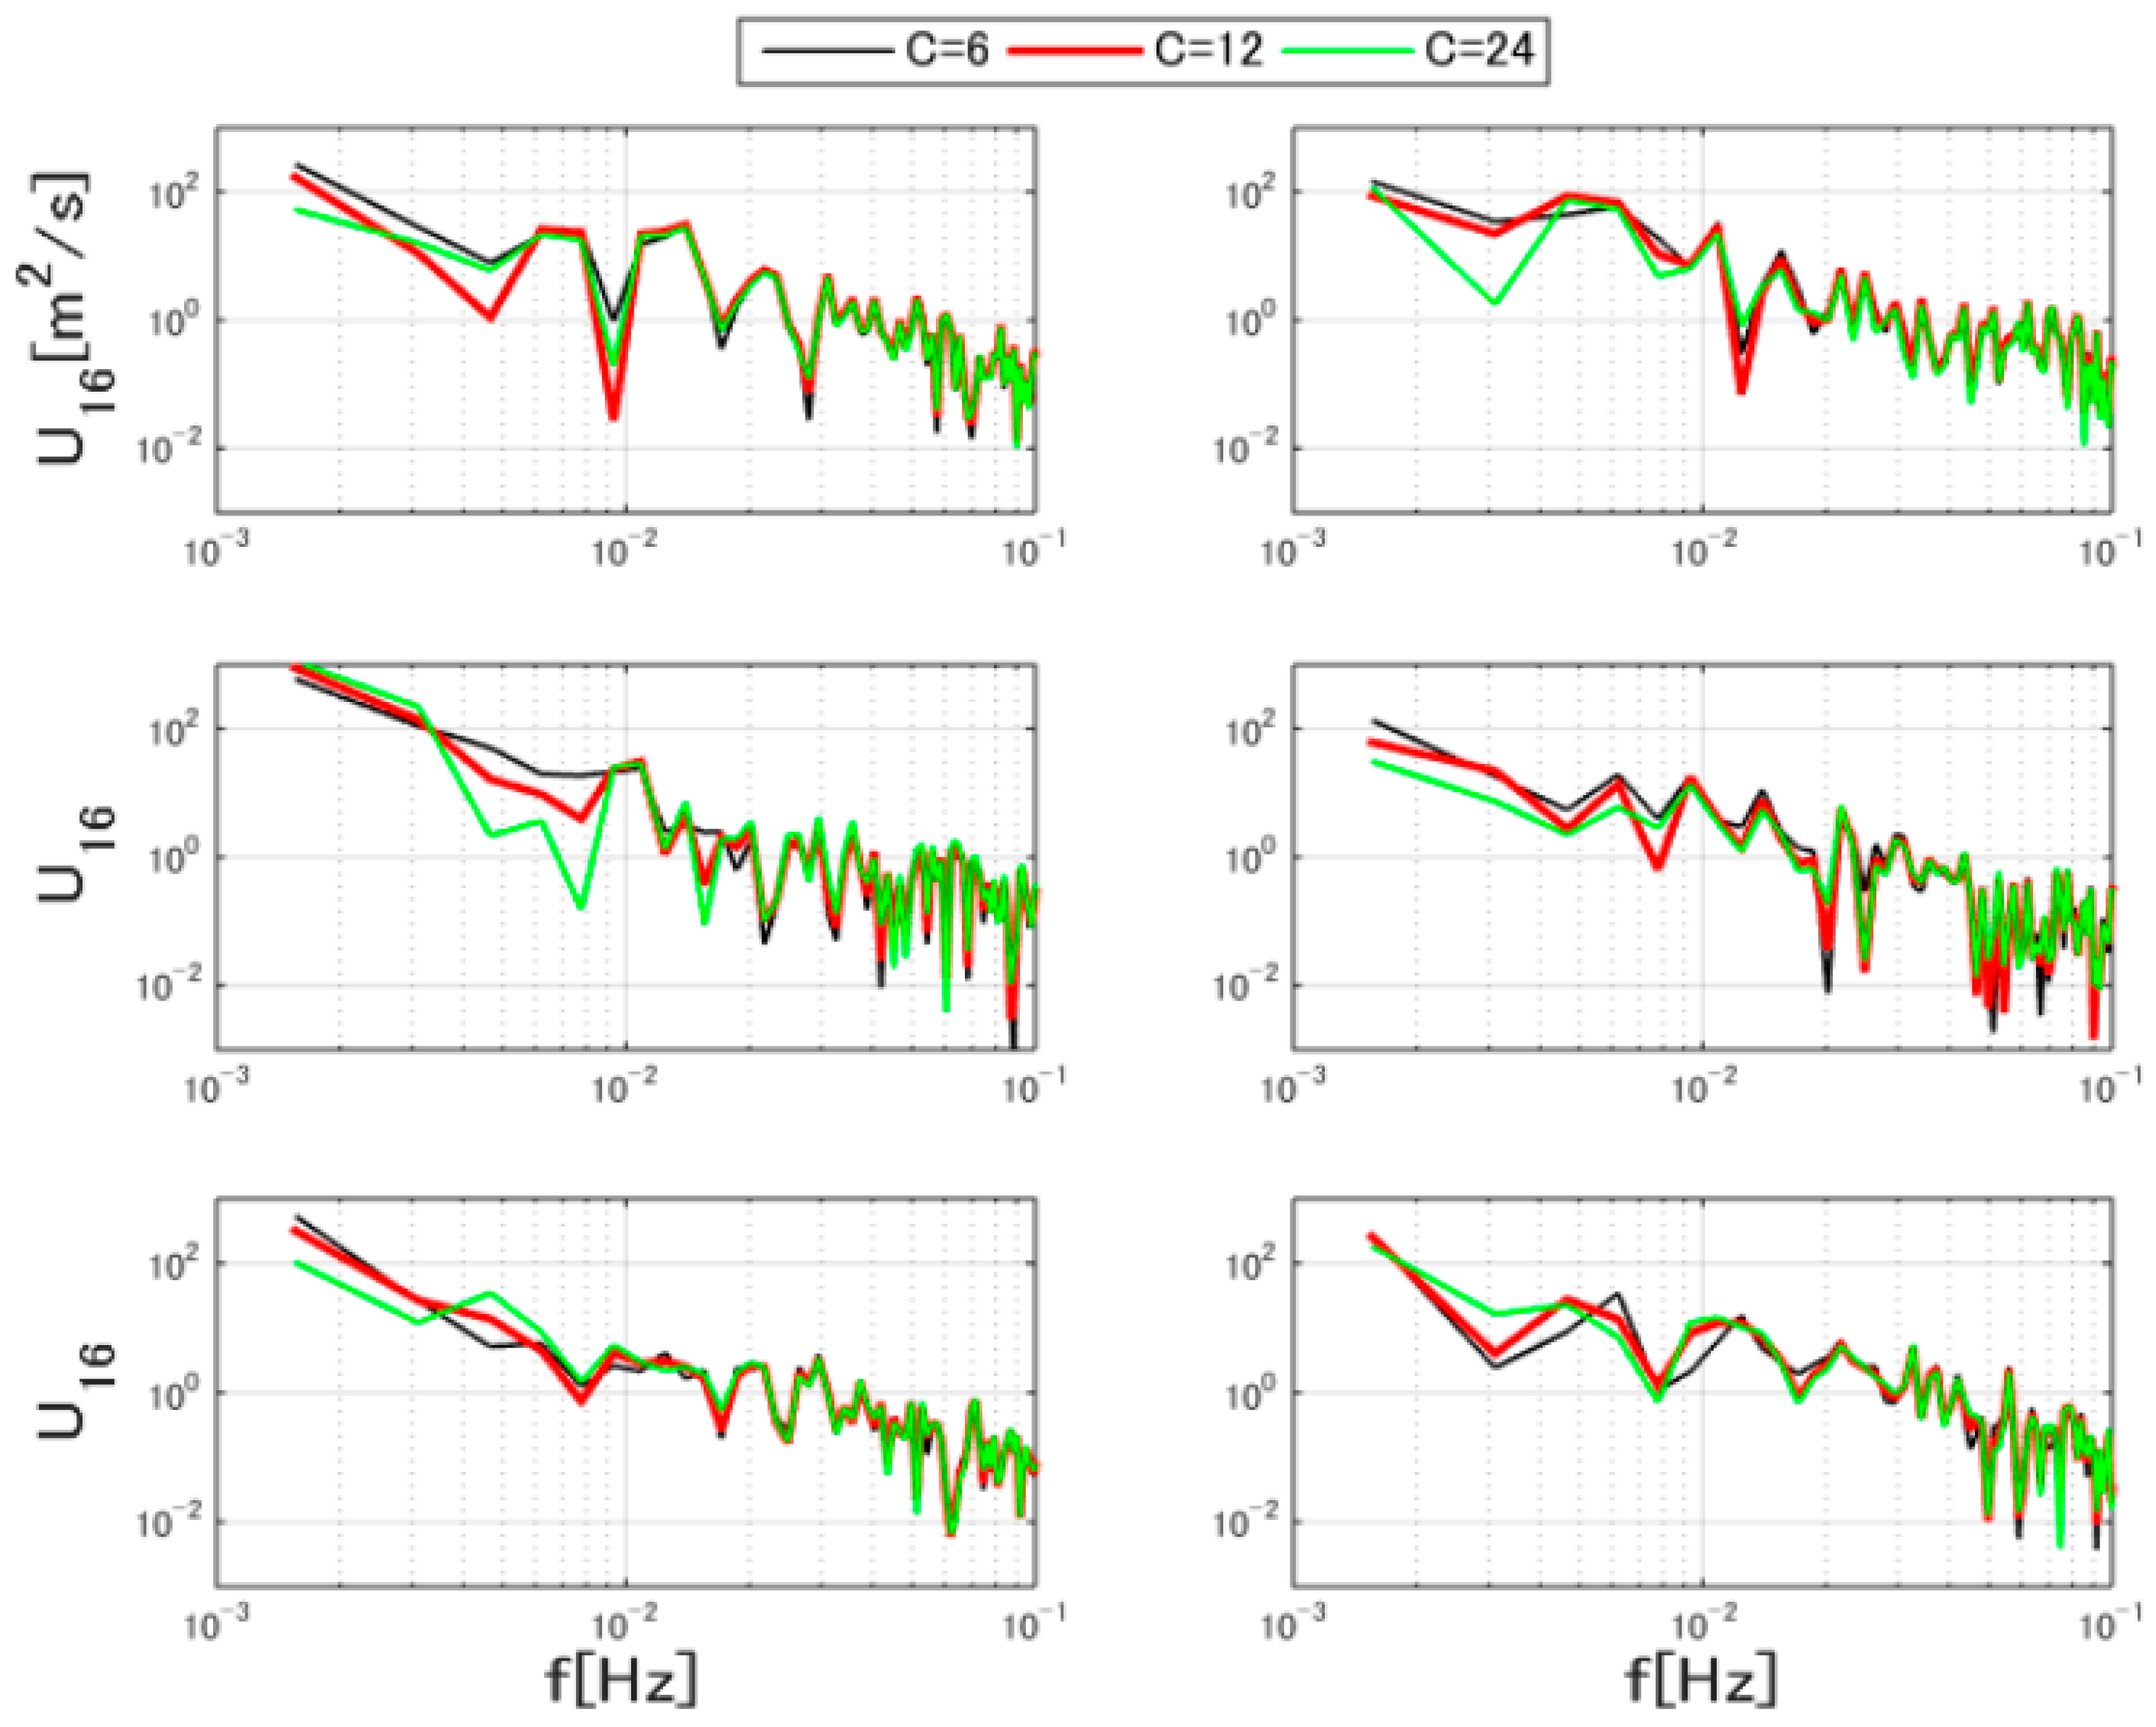
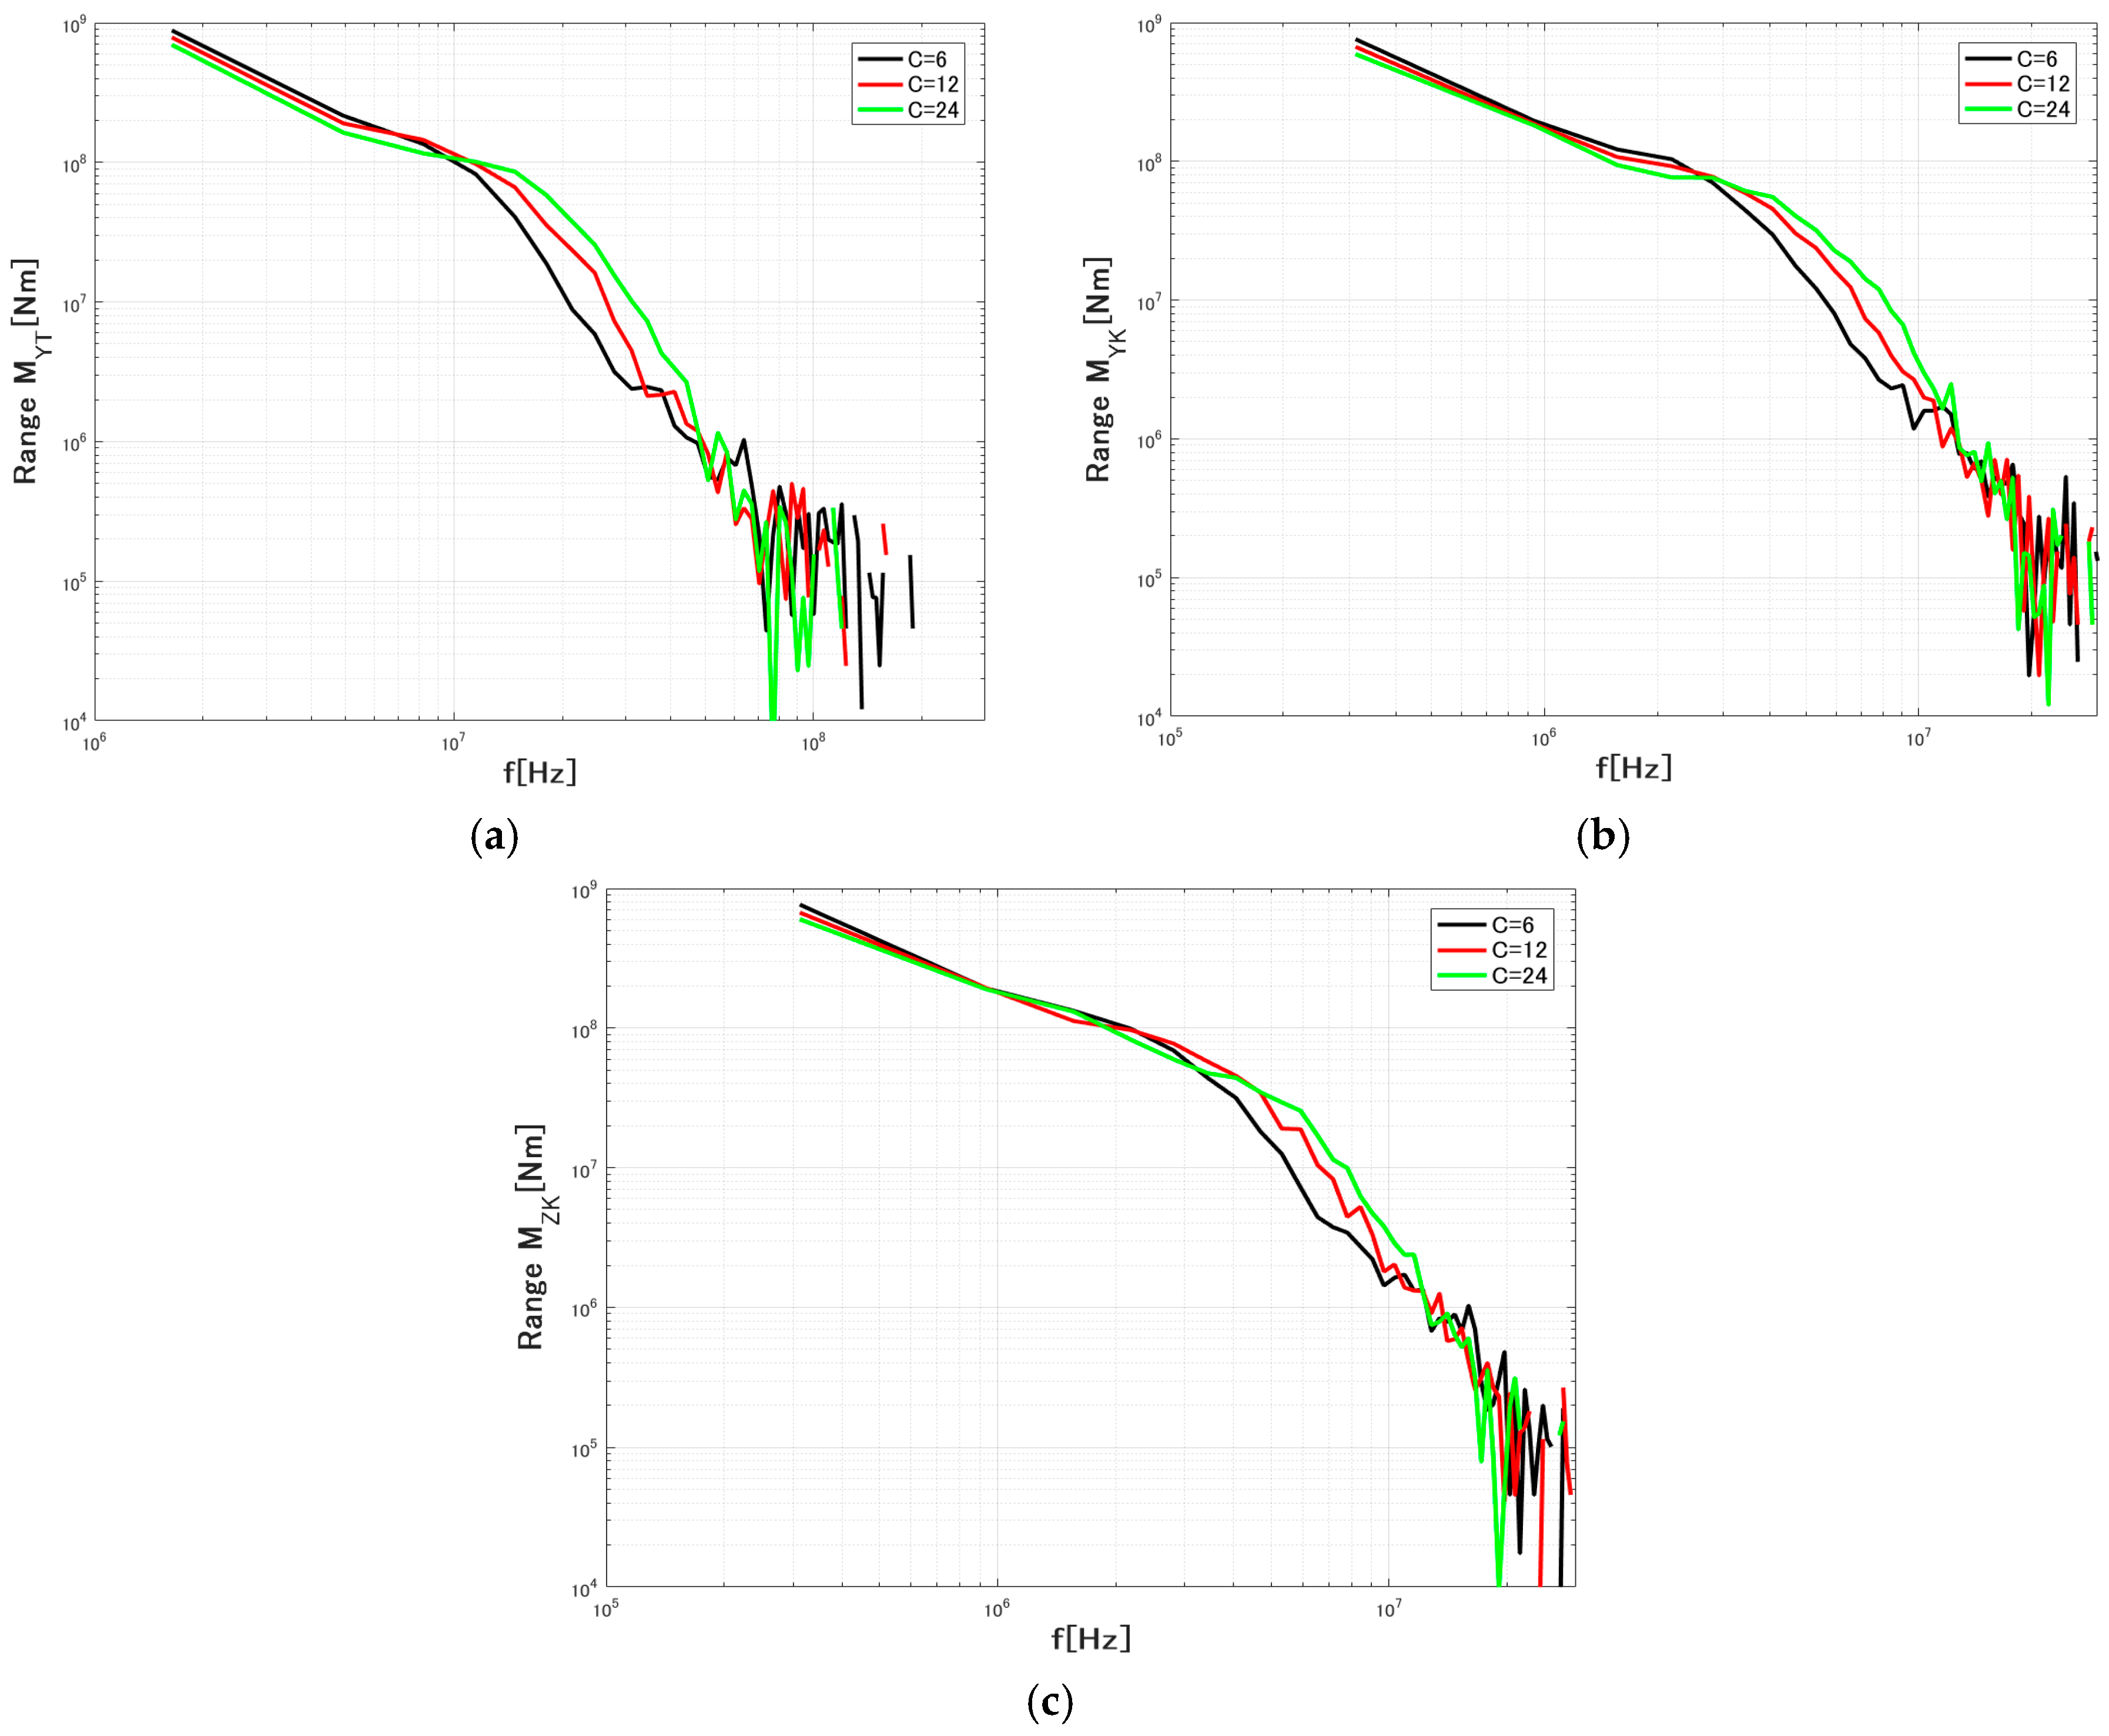
4.3. Power Spectral Density
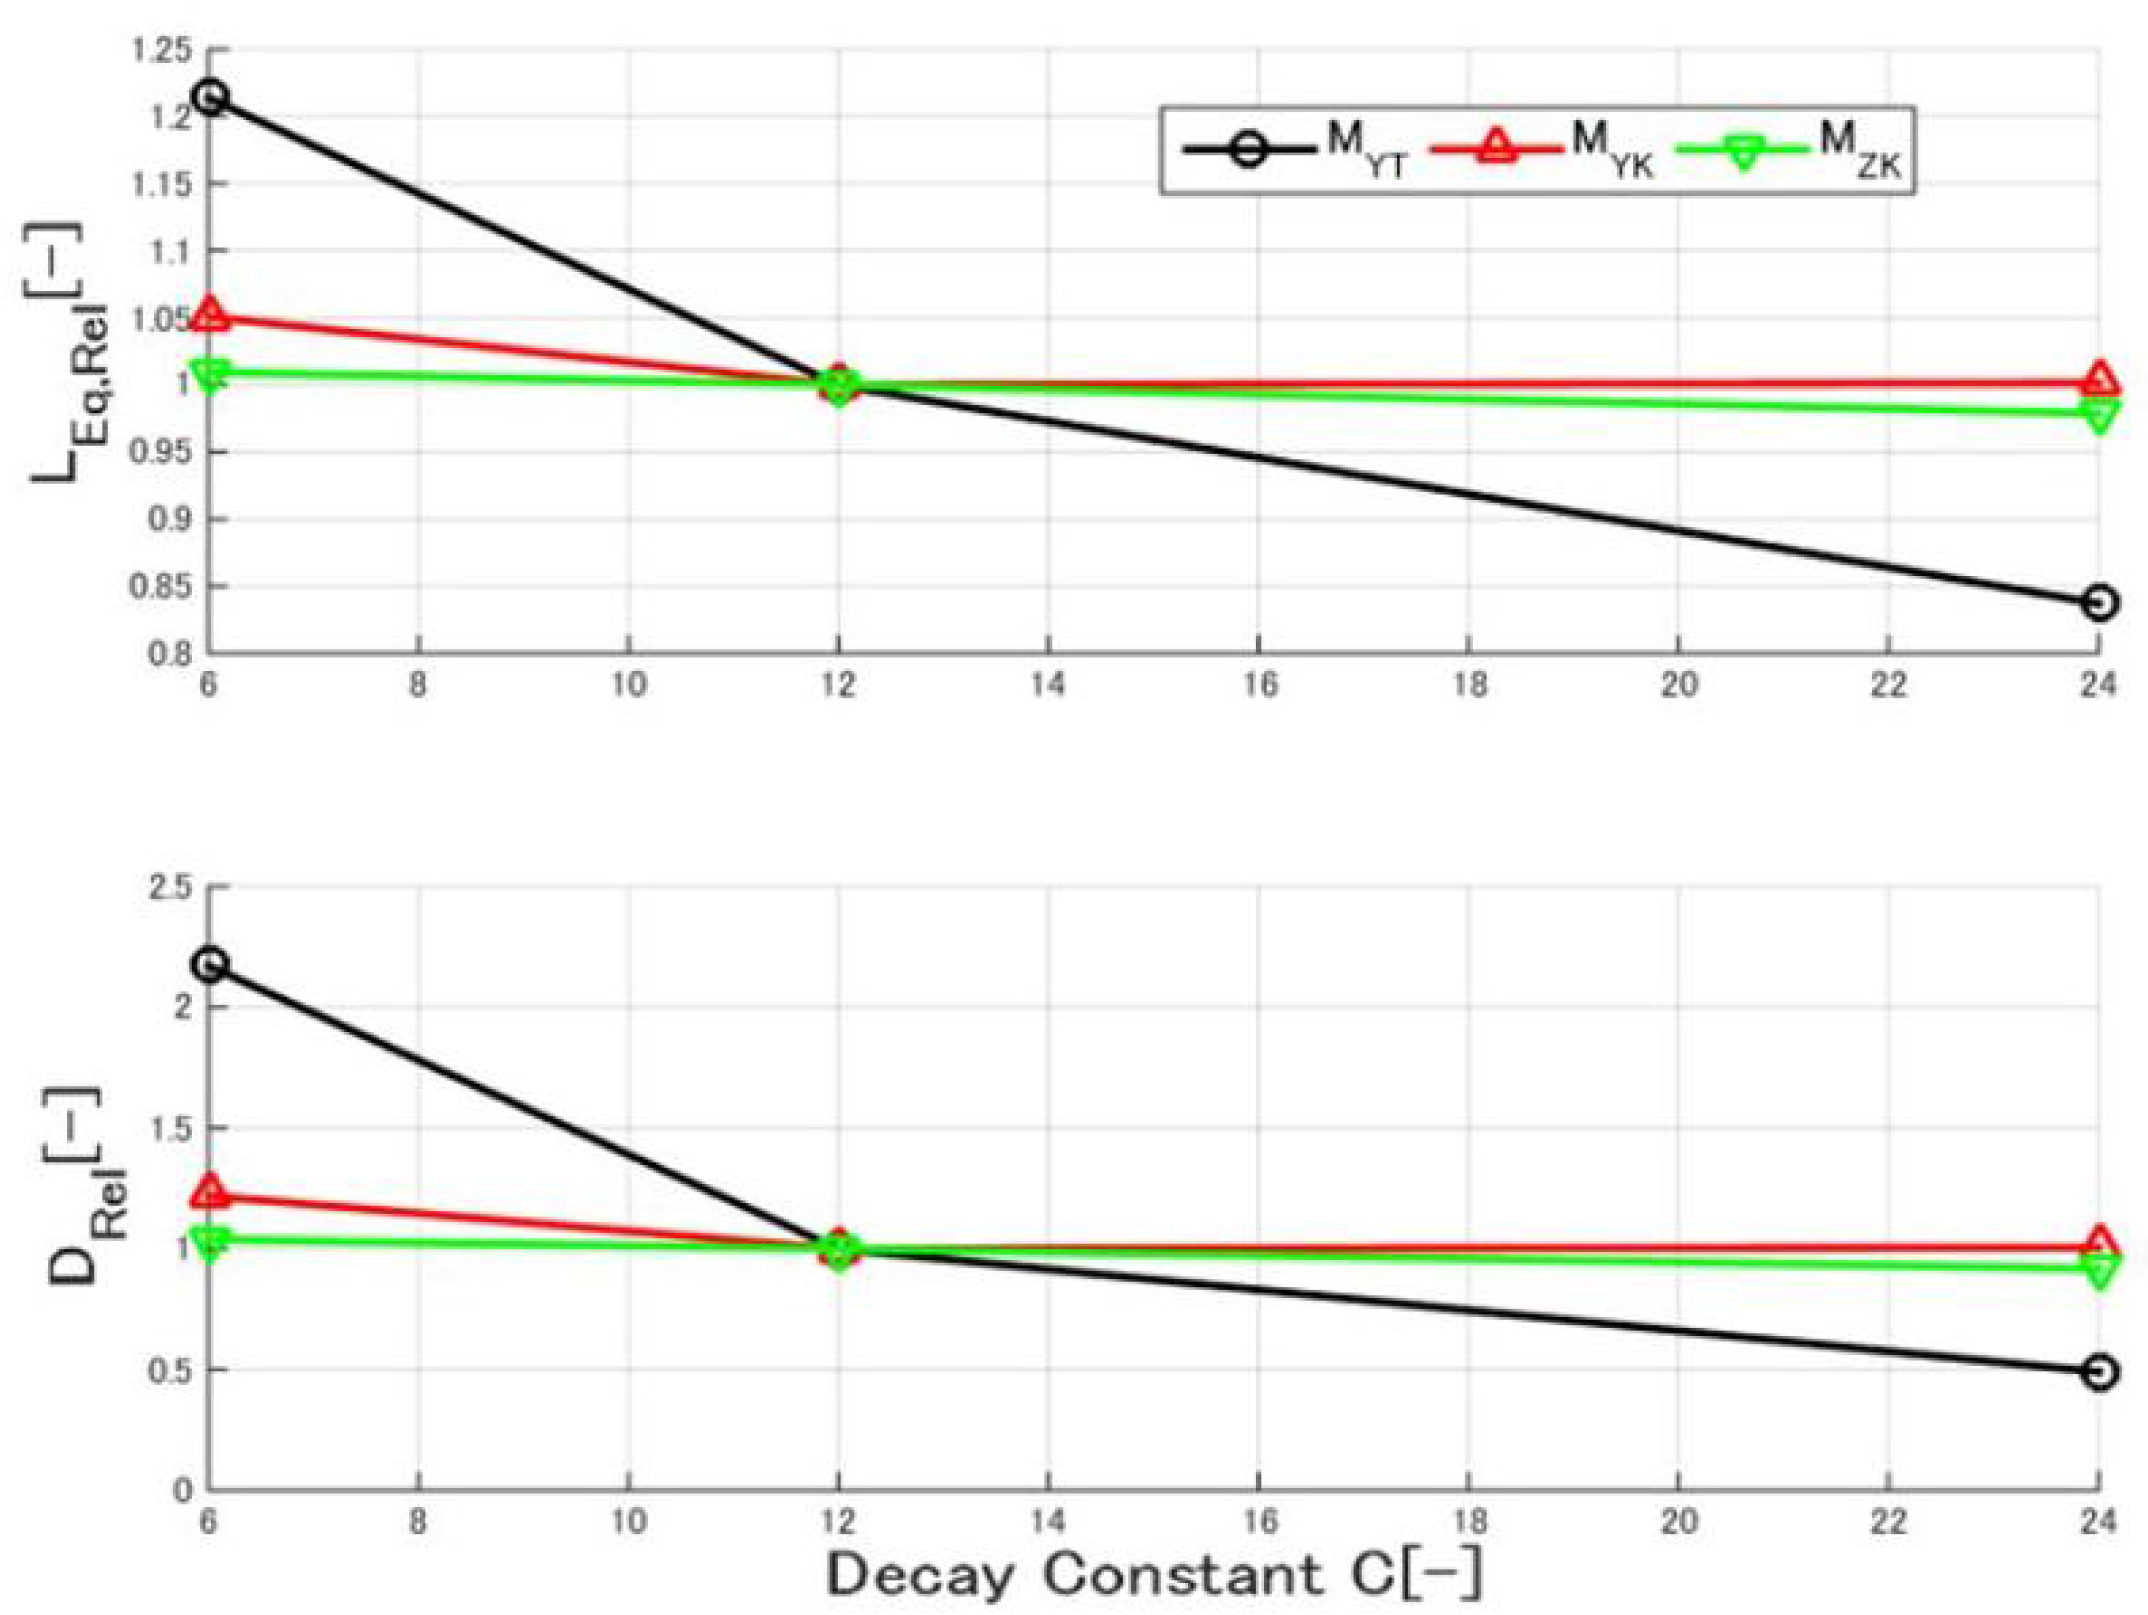
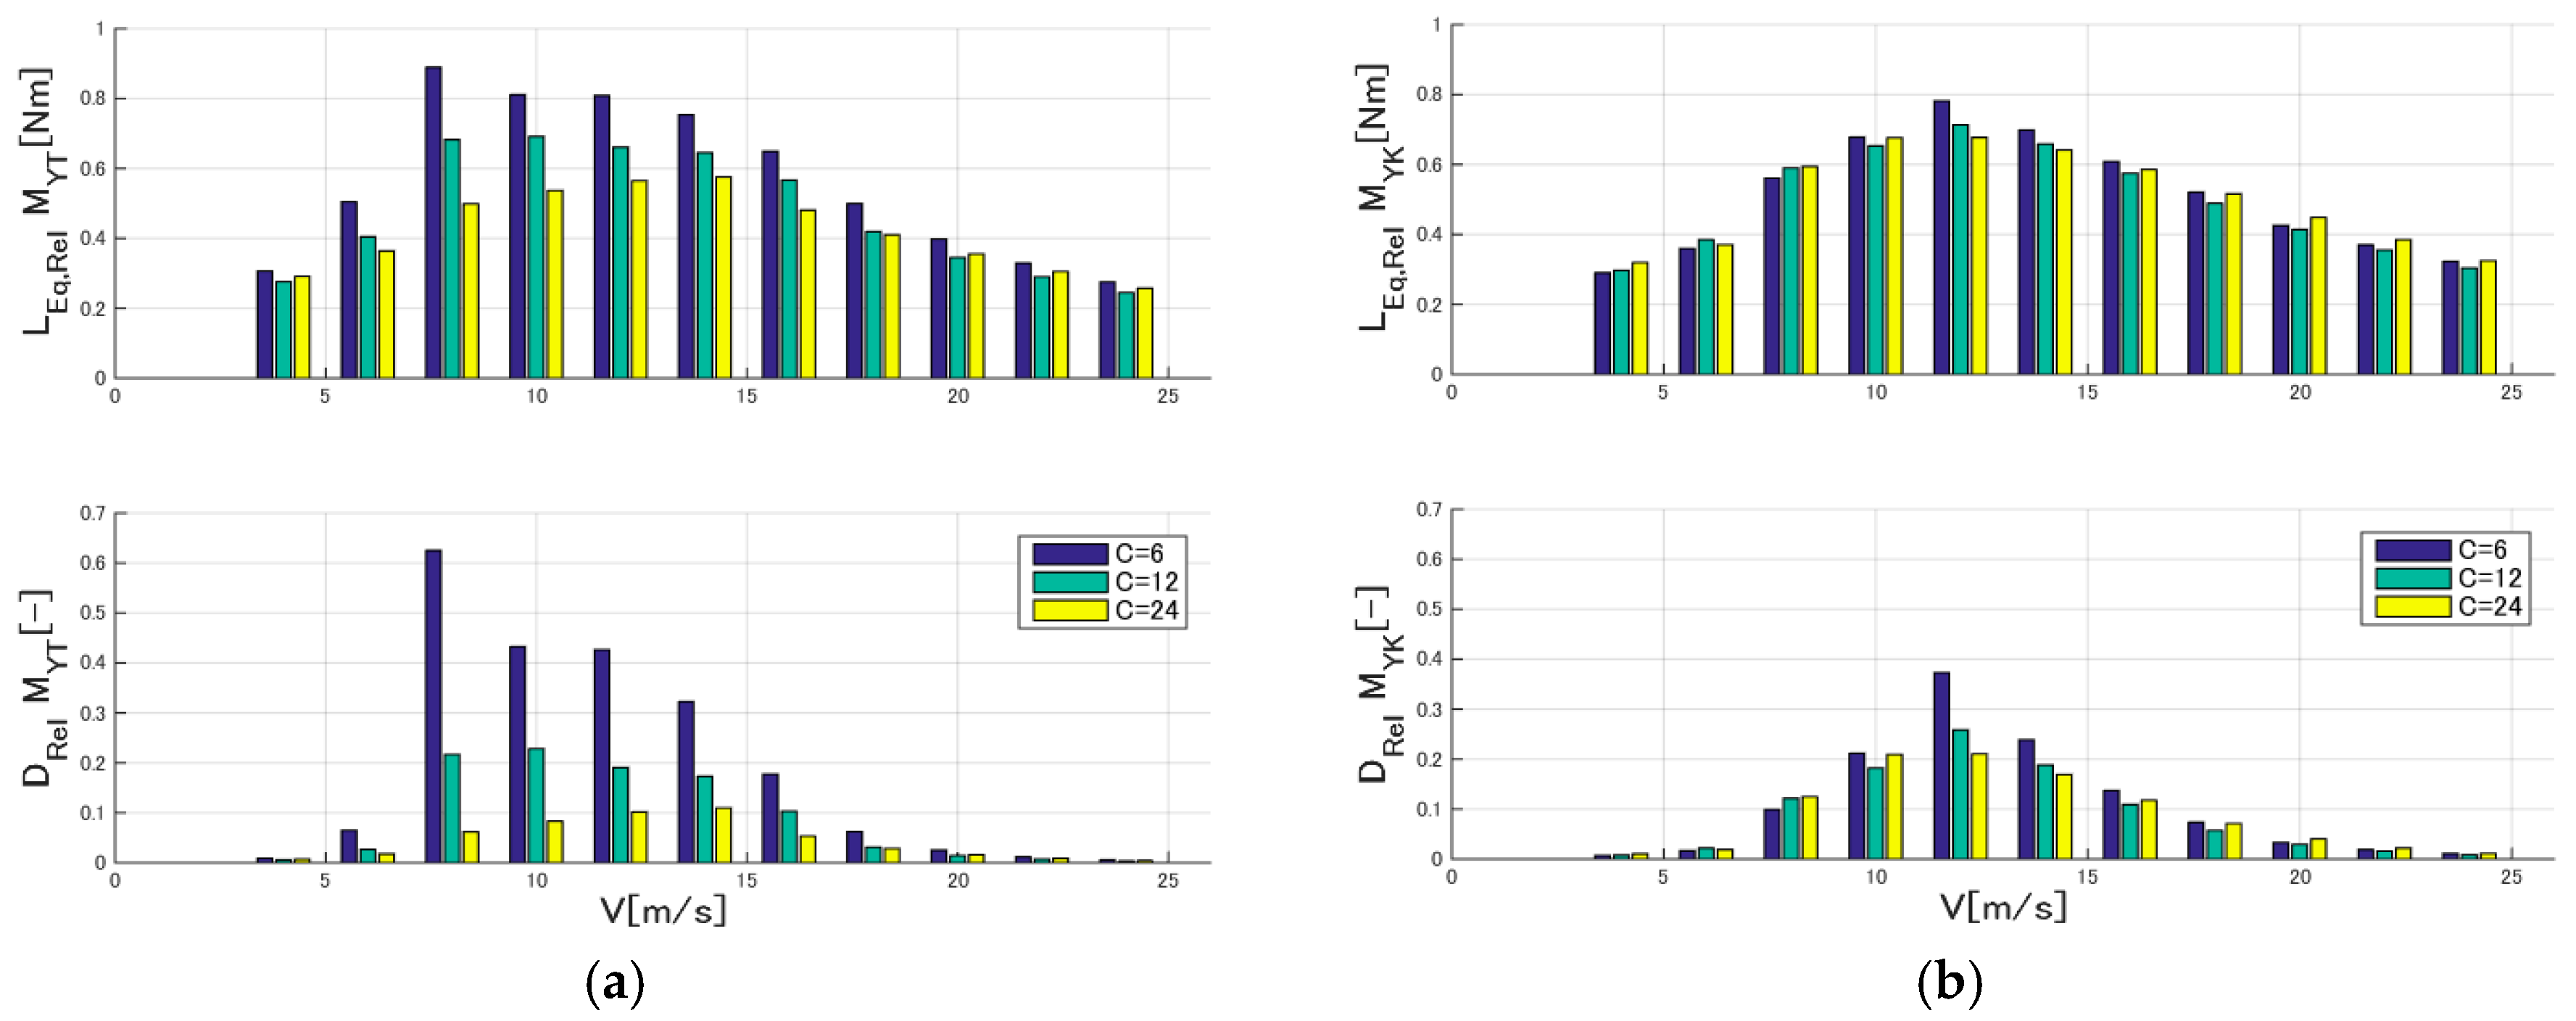
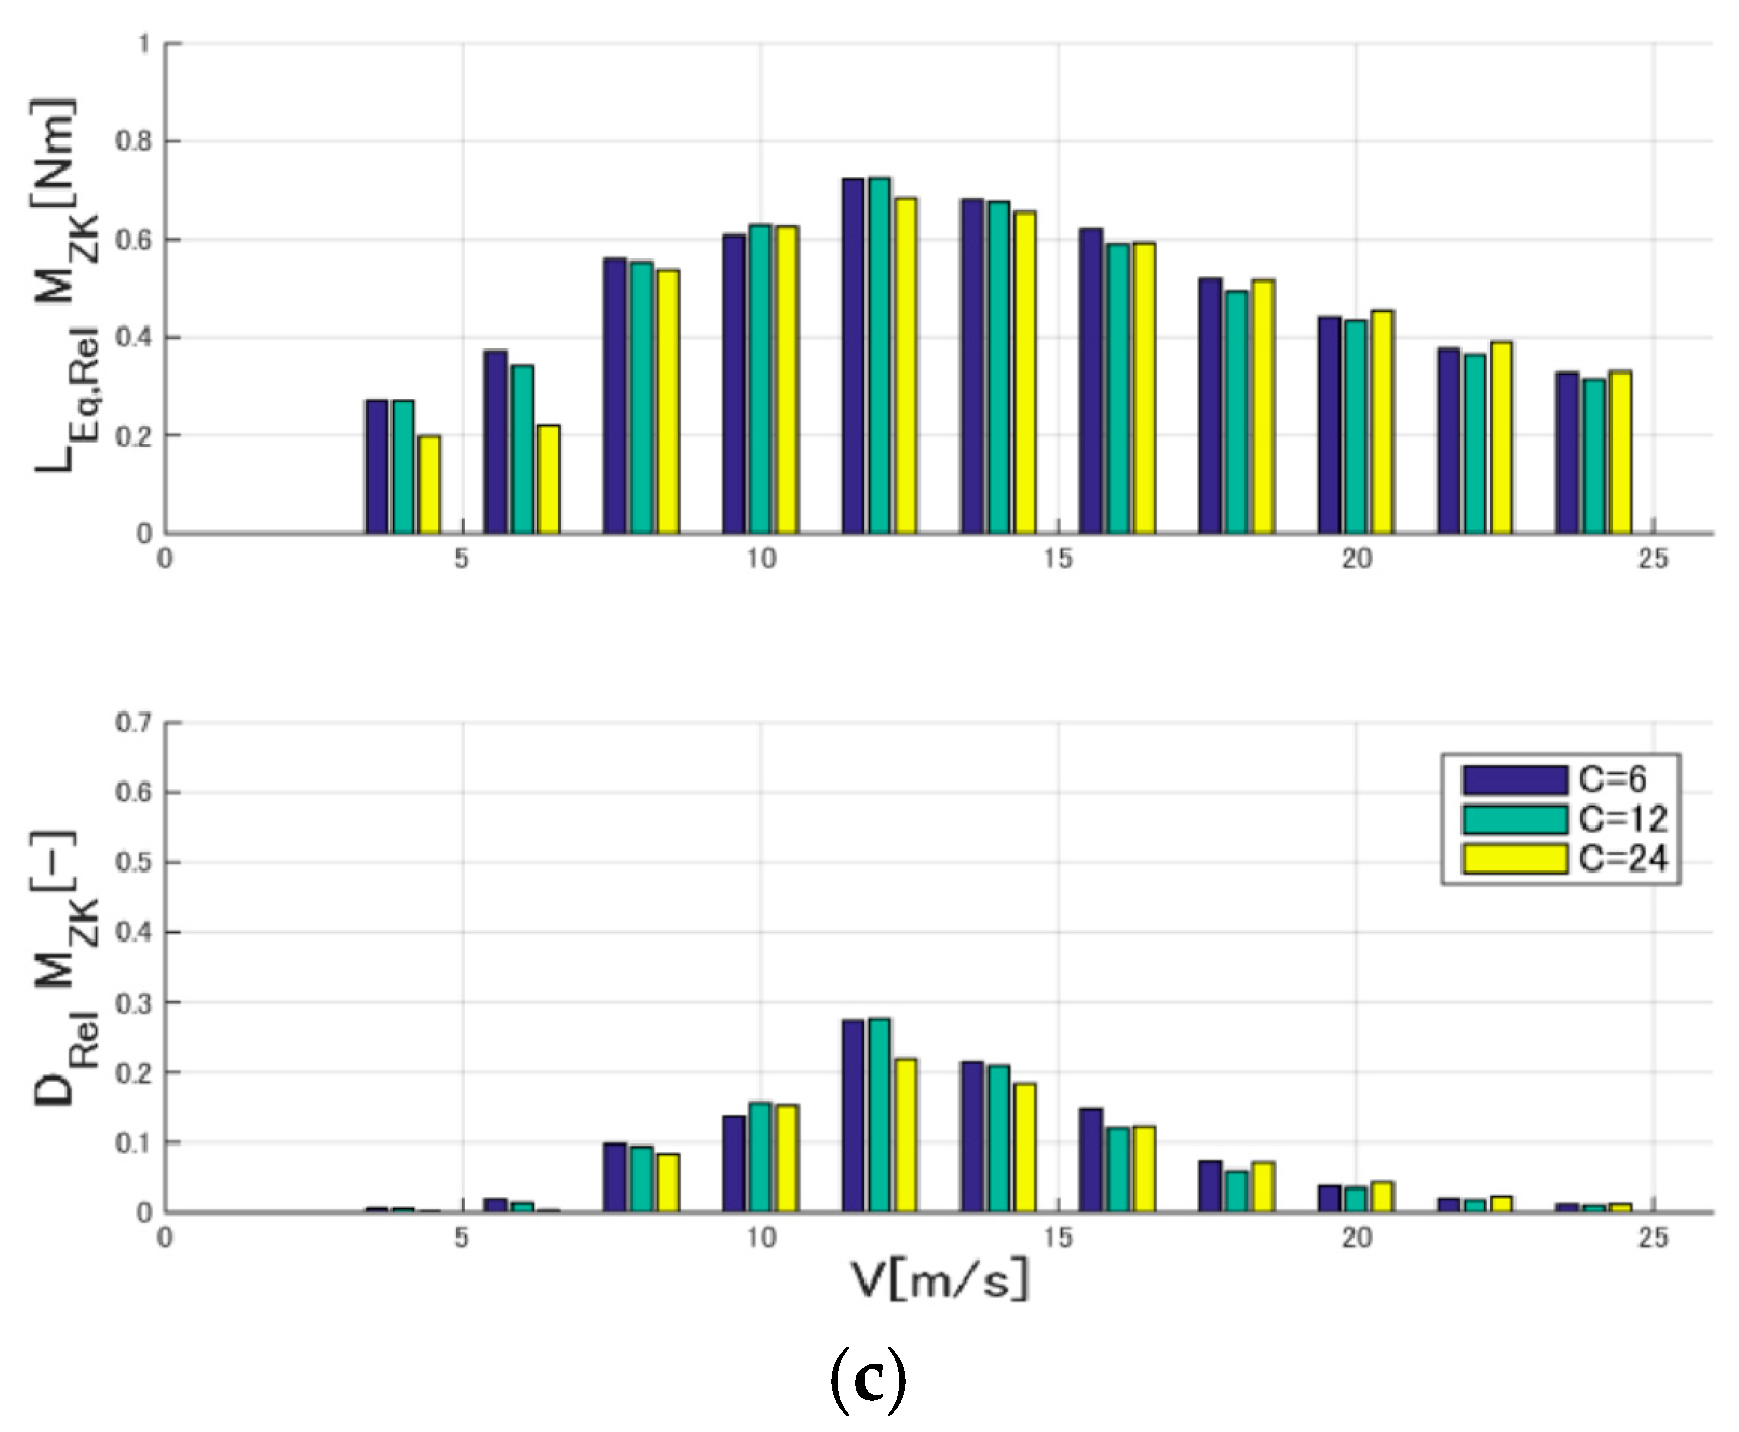
4.4. Fatigue Loads and Damages
5. Conclusions
- -
- The following results were found through a dynamic simulation of a 7 × 2 MW MRS in this study. The coherence affects the fatigue loads of a large-scale MRS. In the most significant case, the fatigue damage of the tower base fore-aft bending was more than doubled between C = 6 and C = 12.
- -
- The effects of the coherence are different between the collective (tower base fore-aft bending, power, etc.) and differential (tower top nodding, yawing, etc.) loads. A larger coherence causes larger fatigue damages for the collective loads. On the contrary, a smaller coherence causes larger fatigue damages for the differential loads.
- -
- Although an MRS is out of scope of the present IEC61400-1 standard, the coherence should be defined carefully in the design of large-scale MRSs, as it affects the design significantly.
Acknowledgments
Author Contributions
Conflicts of Interest
Abbreviations
| DEL | Damage equivalent load |
| IEC | International Electrotechnical Commission |
| MRS | Multi-rotor system |
| NEDO | New Energy and Industrial Technology Development Organization |
| PSD | Power spectral density |
| SRS | Single-rotor system |
References
- Ranson, D.L.; Moore, J.J. SwRI Engineers Design, Build and Test a Prototype Wind Turbine Array; Southwest Research Institute: San Antonio, TX, USA, 2009. [Google Scholar]
- Goltenbott, U.; Karasudani, T.; Ohya, Y.; Jamieson, P. Aerodynamic analysis of clustered wind lends turbines. In Proceedings of the 8th International Symposium on the East Asian Environment Problems, Fukuoka, Japan, 9–10 December 2014.
- Jamieson, P. Multi Rotor Systems, in Innovation in Wind Turbine Technology; Wiley-Blackwell: Chichester, UK, 2011. [Google Scholar]
- Jamieson, P.; Branney, M. Structural considerations of a 20 MW multi-rotor wind energy system. J. Phys. Conf. Ser. 2014, 555. [Google Scholar] [CrossRef]
- Jamieson, P.; Branney, M.; Hart, K.; Chaviaropoulos, P.K.; Sieros, G.; Voustinas, S.; Chasapogiannis, P.; Prospathopoulos, J.M. Deliverable 1.33 Innovative Wind Turbine Concepts—Multi-Rotor System. Available online: http://www.innwind.eu/Publications/Deliverable-reports (accessed on 10 June 2016).
- Verma, P. Multi Rotor Wind Turbine Design and Cost Scaling. Master’s Thesis, University of Massachusetts Amherst, Amherst, MA, USA, September 2013. [Google Scholar]
- Mate, G.M. Development of Support Structure for Multi-Rotor Wind Turbines. Master’s Thesis, University of Massachusetts Amherst, Amherst, MA, USA, September 2014. [Google Scholar]
- DNV GL, BLADED, version 4.7; DNV GL: Bristol, UK, 2015.
- Yoshida, S. Variable speed-variable pitch controllers for aero-servo-elastic simulations of wind turbine support structures. J. Fluid Sci. Technol. 2011, 6, 300–312. [Google Scholar] [CrossRef]
- Wind Turbines—Part 1: Design RequirementsIEC-61400-1, 3rd ed.; International Electrotechnical Commission: Geneva, Switzerland, 2005.
- Saranyasoontorn, K.; Manuel, L.; Veers, P.S. A comparison of standard coherence models for inflow turbulence with estimates from field measurements. J. Sol. Energy Eng. 2004, 126, 1069–1082. [Google Scholar] [CrossRef]


| # | x(m) | y(m) | z(m) |
|---|---|---|---|
| 0 | 0 | 0 | 160 |
| 1 | 0 | −40 | 230 |
| 2 | 0 | −80 | 160 |
| 3 | 0 | −40 | 90 |
| 4 | 0 | 40 | 90 |
| 5 | 0 | 80 | 160 |
| 6 | 0 | 40 | 230 |
| Direction | x-wise | y-wise | z-wise |
|---|---|---|---|
| Domain | 600 s | 300 m | 300 m |
| Resolution | 0.05 s | 10 m | 10 m |
© 2016 by the authors; licensee MDPI, Basel, Switzerland. This article is an open access article distributed under the terms and conditions of the Creative Commons Attribution (CC-BY) license (http://creativecommons.org/licenses/by/4.0/).
Share and Cite
Yoshida, S.; Goltenbott, U.; Ohya, Y.; Jamieson, P. Coherence Effects on the Power and Tower Loads of a 7 × 2 MW Multi-Rotor Wind Turbine System. Energies 2016, 9, 742. https://doi.org/10.3390/en9090742
Yoshida S, Goltenbott U, Ohya Y, Jamieson P. Coherence Effects on the Power and Tower Loads of a 7 × 2 MW Multi-Rotor Wind Turbine System. Energies. 2016; 9(9):742. https://doi.org/10.3390/en9090742
Chicago/Turabian StyleYoshida, Shigeo, Uli Goltenbott, Yuji Ohya, and Peter Jamieson. 2016. "Coherence Effects on the Power and Tower Loads of a 7 × 2 MW Multi-Rotor Wind Turbine System" Energies 9, no. 9: 742. https://doi.org/10.3390/en9090742