Article

Study of a New Quick-Charging Strategy for Electric Vehicles in Highway Charging Stations

School of Electrical Engineering, Southeast University, No. 2 Sipailou, Nanjing 210096, China
*
Author to whom correspondence should be addressed.
Energies 2016, 9(9), 744; https://doi.org/10.3390/en9090744
Submission received: 24 June 2016 / Revised: 5 September 2016 / Accepted: 8 September 2016 / Published: 14 September 2016

Abstract

:
To solve the problem, because of which conventional quick-charging strategies (CQCS) cannot meet the requirements of quick-charging for multiple types of electric vehicles (EV) on highways where vehicle inflow is excessive, this paper proposed a new quick-charging strategy (NQCS) for EVs: on the premise of not affecting those EVs being charged, the remaining power of the quick-charging pile with multiple power output interfaces is used to provide a synchronous charging service for EVs waiting in the queue. To verify the effectiveness of this strategy, a power distribution model of charging pile and a queuing model of charging station (CS) were constructed. In addition, based on an actual highway service area where vehicle inflow is excessive during the simulation period (0:00–24:00), charging situations of CQCS and NQCS were respectively simulated in a charging station (CS), with different number of chargers, by basic queuing algorithm and an improved queuing algorithm. The simulation results showed that when the relative EV inflow is excessive, compared to CQCS, NQCS not only can reduce user waiting time, charging time, and stay time, but also can improve the utilisation rate of charging infrastructure and service capacity of CS and reduce the queue length of CS. At the same time, NQCS can reduce the impact on the power grid. In addition, in NQCS, the on-demand power distribution method is more efficient than the average power distribution method. Therefore, NQCS is more suitable for quick-charging for multiple types of EVs on highways where vehicle inflow is excessive.

1. Introduction

Global climate change and severe environmental pollution have become important issues. Currently, electric vehicles (EV), as a kind of low-carbon and environmentally friendly mode of transport, have become a research focus [1,2] of concern to many national governments, vehicle manufacturers, and energy enterprises. With large-scale popularisation of EVs, charging stations (CS) constructed on highways will provide favourable conditions for long-distance driving of EVs [3,4]. Limitations in charging time for EVs, which can affect the convenience of EV charging, are mainly caused by the constraints of the power level of charging facilities [5] and acceptable charging profile of EV batteries [6,7]. With the rapid development of quick-charging technology [8,9], as well as the rapid development of EV battery technology [10,11,12], substantial reductions in charging time have great significance for improving the operational efficiency of CSs and charging convenience of EVs. Under the current fast-charging technology, EV charging and CS operation influence each other. If some guiding measures are taken, they can effectively adjust interactions between EVs and CSs [13,14,15,16,17]. Beyond this, however, the parallel output characteristics and charging strategy of charging facilities can also affect the EV charging and CS operation. Particularly, in the process of quick-charging for multiple types of EVs on highways where vehicle inflow is excessive, there are some problems with conventional quick-charging strategies (CQCS) in terms of the parallel output characteristics and charging strategy of charging facilities for EVs at a CS, which is an in-station issue.
At first, there is difference between battery capacities of multiple types of EVs driving on highways. Therefore, the characteristic curves of corresponding battery quick-charging also differ. Generally, the conventional quick CS takes the maximum quick-charging power of high-capacity battery as the power limit on its charging piles. In addition, conventional quick CS is usually equipped with a number of the same type of quick-charging piles (every quick-charging pile only has one power output interface, permitting it to provide a charging service for only one EV at a time) to improve sharing utilisation rate of charging infrastructure. However, low vehicle inflow, difference of multiple types of battery capacities and the variable power charging phase of battery [6,7] can all reduce the utilisation rate of charging infrastructure. Secondly, EVs in CSs on highways where vehicle inflow is excessive usually have to wait to be charged, which means that EVs waiting in the queue are controllable (i.e., they have potential utility value). However, the current CQCS does not recognise nor use the potential value therein. This may cause excessive user waiting time. In addition, in the process of charging EVs in the conventional quick CS, the intensive volatility of charging loads poses a greater challenge to power supply adjustment on the power grid [14]. Furthermore, three problems concerning resource allocation characteristics and operating mode of conventional quick CS arise: (1) the current CQCS does not fill the power coast-down of EVs in the quick-charging progress under variable power conditions, causing low utilisation rates of charging infrastructure; (2) it ignores the controllability of electric vehicles waiting in the queue, causing excessive user waiting time; and (3) it affects the power grid and poses a greater challenge to power supply adjustment on the power grid. Therefore, CQCS cannot meet the requirement of quick charging for multiple types of EVs on highways where vehicle inflow is excessive. It is thus necessary to seek out a new quick-charging strategy (NQCS) for EVs to solve these problems.
There are at present two common EV quick-charging strategies: one is the inter-station EV-guided charging strategy; the other is the in-station EV-coordinated charging strategy. The inter-station EV-guided charging strategy means that EVs can charge different CSs by using the guiding method to reduce user waiting time and improve the utilisation rate of charging infrastructure and reduce the impact on the power grid. The guided method is sub-divided into the reservation guided method [13,14,15,16] and electricity price-guided method [17]. A reservation-guided method means that the user interacts with the platform that will then specify a CS for the user, which lays more emphasis on how to offer suitable charging options for EV users, without considering either the effect of electricity price on user choice or management of user charging process. The electricity price-guided method means that the user actively selects the CS for charging or manages the EV charging process under the guidance of current electricity prices. Current research mainly focuses on the reservation-guided method and the ordered reservation algorithm employed by service platforms to specify CSs for the users. Yang et al. [13,14] proposed a CS reservation strategy for urban areas where quick CSs are highly concentrated. By using the optimal reservation algorithm, an ideal CS is allocated to the vehicle with a reservation, improving the utilisation rate of charging infrastructure and reducing user waiting time; however, the optimal reservation algorithm is executed at the price of selection of the user’s driving ability (which can be reflected by the remaining range of the EV before charging the battery) by multiple CSs, which means that unfairness may exist. Yan et al. [15] proposed an optimal path recommendation strategy for urban EVs and made a comparison with the shortest path strategy to verify the effectiveness of the optimal path recommendation strategy. However, this also comes down to the issue of selection of CSs for EVs. Yang et al. [16] proposed a CS recommendation strategy for EVs on highways. It adopted a global algorithm to allocate the optimal CS to EVs, which effectively reduced user waiting time. Chen et al. [17] conducted an in-depth analysis of characteristics of charging demand of EVs on highways and operating demand of CSs. To avoid unfairness of CS selection, it proposed a CS selection strategy guided by state-based electricity prices. It adopted state-based prices to incentivise the user to charge his/her vehicle in advance, so as to increase selective power of the corresponding CS. This can improve utilisation rate of charging infrastructure, reduce the user’s charging cost and waiting time, and reduce the effects of EVs on power grid operation and highway traffic. The aforementioned literatures mainly examined the problem of CS selection in different areas (urban and highway areas) but did not study the charging process after an EV enters a quick CS.
The in-station EV-coordinating charging strategy means that EVs can charge in an orderly fashion at a CS by using the coordinating charging method to reduce user waiting time and improve the utilisation rate of charging infrastructure and reduce the impact on the power grid. The coordinating charging method is divided into an inter-EV-coordinating charging strategy [18,19], a coordinating charging strategy between EVs and the energy storage system [7,20], and a coordinating charging strategy between EVs and new energy sources [6]. Of course, some reports cover the quick-charging process of EVs in CS. Zhao et al. [6] gave comprehensive consideration to the characteristics of photovoltaic power generation output, peak-and-valley electricity prices, and power outage of EVs, before proposing a charging strategy integrating EVs with photovoltaic power generation output and achieving the goal of stabilising fluctuations in charging load, thereby lowering charging cost for users, and absorbing new energy as much as possible by partitioned optimisation of charging power. Sun et al. [7] presented a control strategy for fast CS fitted with a flywheel energy storage system in a quick CS; the fluctuation of charging load can be reduced by the energy storage system with the proposed control strategy. Bodet et al. [18] proposed an in-station EV-coordinating charging strategy. By coordinating, the charging power and service order among EVs are optimised, so as to improve the utilisation rate of electric energy of the CS and reduce user waiting time and impacts of charging load on the power grid. However, the literature offers a hypothesis that the service order of an EV can be adjusted and interferes in the charging process of the EV; however, these methods are hard to realise in practical application, hampering effective implementation of this charging strategy. Hu et al. [19] proposed a charging power control strategy for EV quick charging, in which real-time chargeable power output by the power grid would be allocated to EVs according to some power allocation method, so as to reduce the impact of EV quick-charging on the power grid. This strategy also interferes in the EV-charging process. Ding et al. [20] proposed a synergetic charging strategy of a quick CS and energy storage system. By controlling charging and discharging of the energy storage system and tracking quick-charging load of EV, the strategy reduces the impact of EV quick-charging on the power grid. Although these reports covered the charging process of EV quick-charging, some [18,19] will incur problems when they are used in quick-charging strategies for multiple types of EVs on highways. Therefore, this paper will explore another inter-EV-coordinating charging strategy for EVs at a CS, which cannot add other costs.
Generally, CSs and EVs on highways both have their own operating rules that have been agreed upon, performed, and executed by both parties. For CSs, they have to arrange charging services according to the user’s entrance order, charging needs, and instinct characteristics of the battery. For EV users, once entering the CS, the user has to accept the charging service according to his/her entrance order. If no unoccupied charging infrastructure is available, the user has to wait in the queue and is not allowed to jump that queue; in the charging process, the user’s charging need is not allowed to change and the EV is not allowed to leave the charging infrastructure; and after charging, the EV should leave the CS as soon as possible so as not to affect the charging of other EVs. As these rules are open and applied by all CSs and EV users, the EV quick-charging process is not controllable. Thus, it is hardly practical to control the EV entrance order, charging needs, and characteristics of the battery.
To solve the problem in which the CQCS cannot meet the requirement of quick charging for multiple types of EVs with different battery sizes on highways where vehicle inflow is excessive, this paper proposed a NQCS for EVs, which is an inter-EV-coordinating charging strategy at a CS: on the premise of not affecting the EVs being charged, the remaining power of the quick-charging pile with multiple power output interfaces [21] is used to provide synchronous charging service for EVs waiting in the queue. That is why this research discovered, and made use of, the potential value of EVs waiting in the queue. Then, a solution for the analysis and verification of the NQCS is proposed, including a power distribution model for EVs while waiting, a queuing model for a CS, and an improved queuing algorithm. The major contributions of this study are as follows:
  • A new quick-charging strategy for multiple types of EVs with different battery sizes at a highway CS (where vehicle inflow is excessive) is proposed for the first time, which is summarised as follows: on the premise of not affecting the EVs being charged, the remaining power in the quick-charging pile with multiple power output interfaces is used to provide synchronous charging services for EVs waiting in the queue. This can reduce EV user waiting time, charging time, and dwell time, but can also improve the utilisation rate of charging infrastructure and service capacity of CS and reduce the queue length at the CS. At the same time, this can reduce the effects on the power grid.
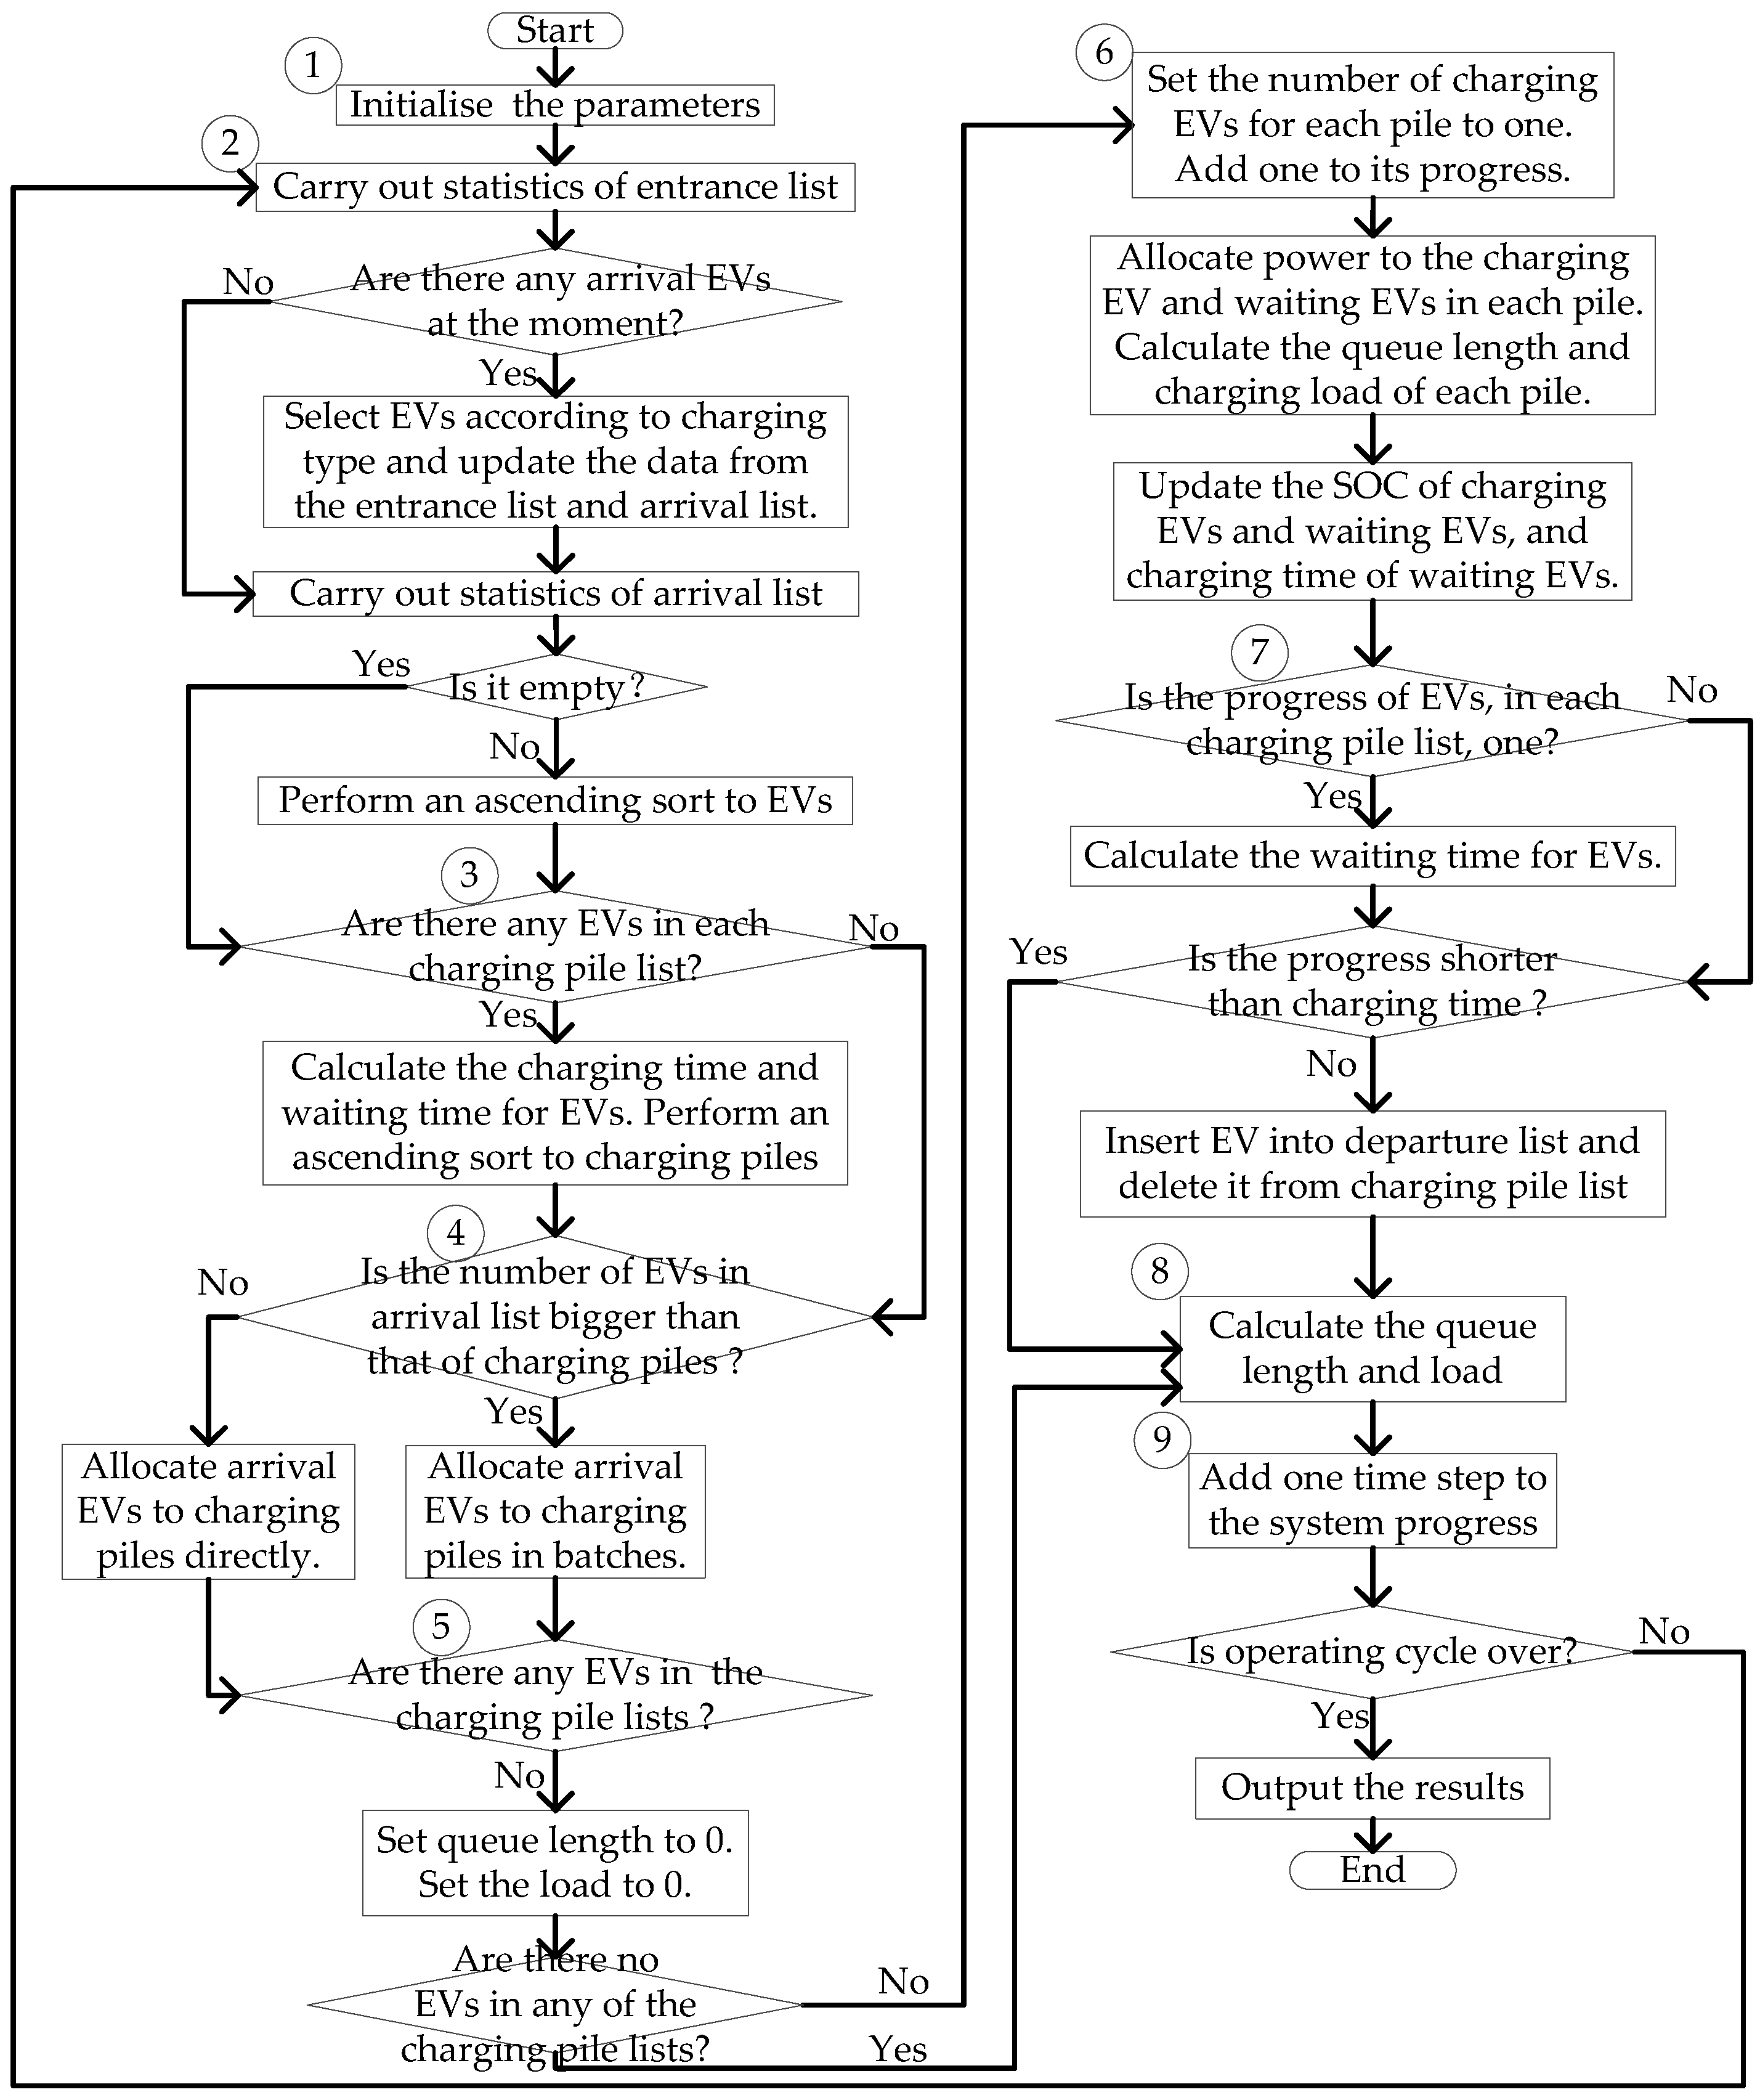
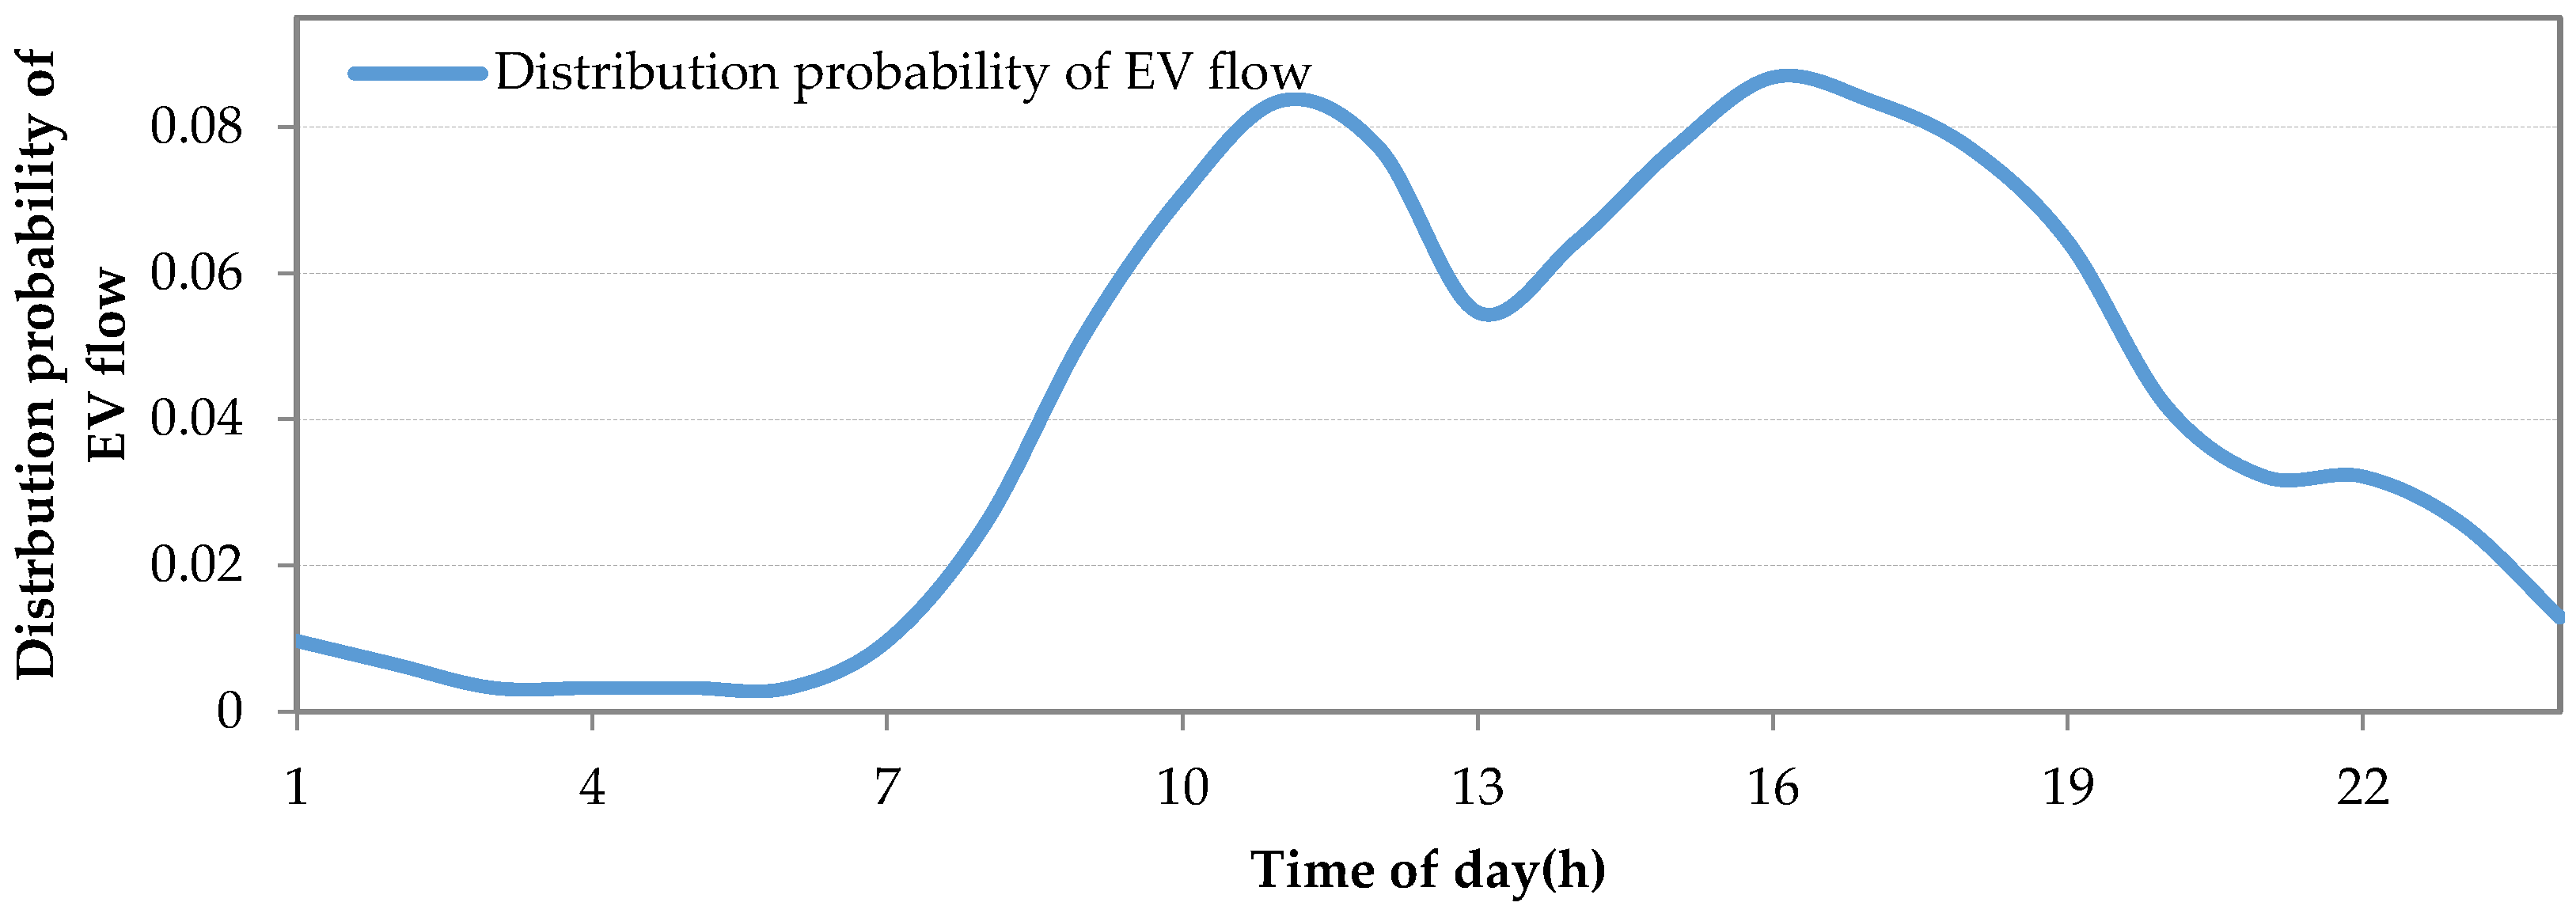
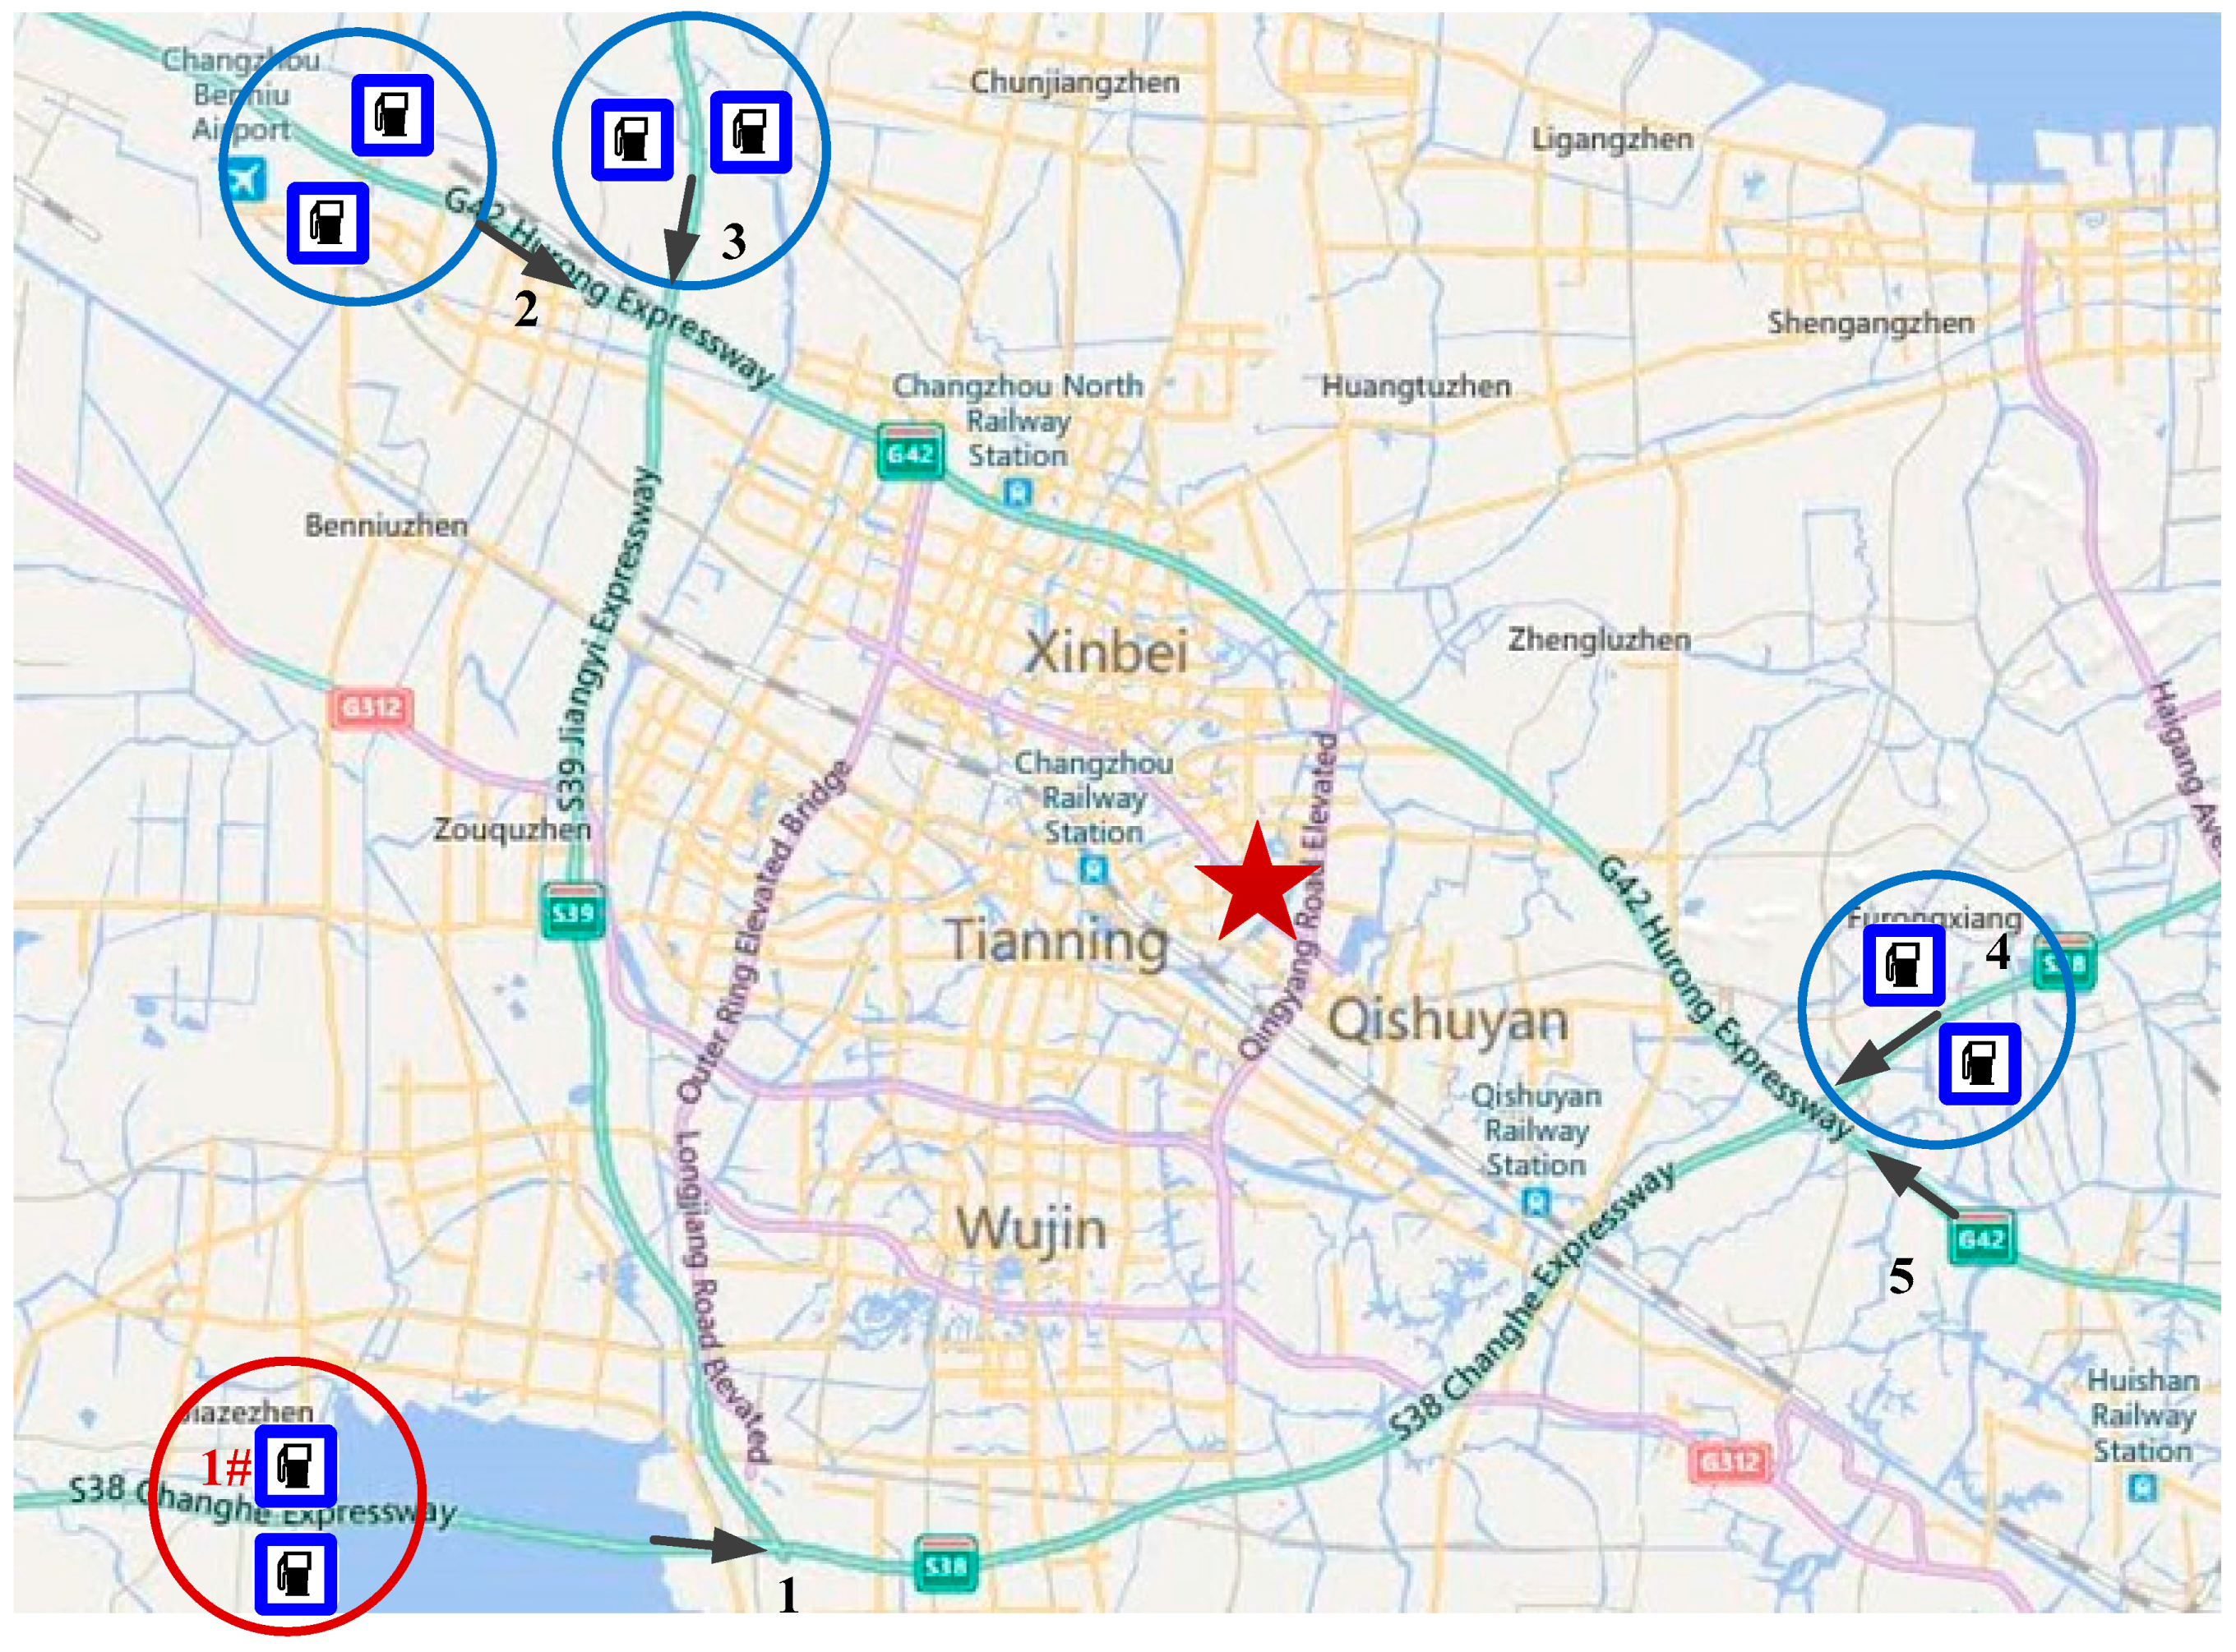
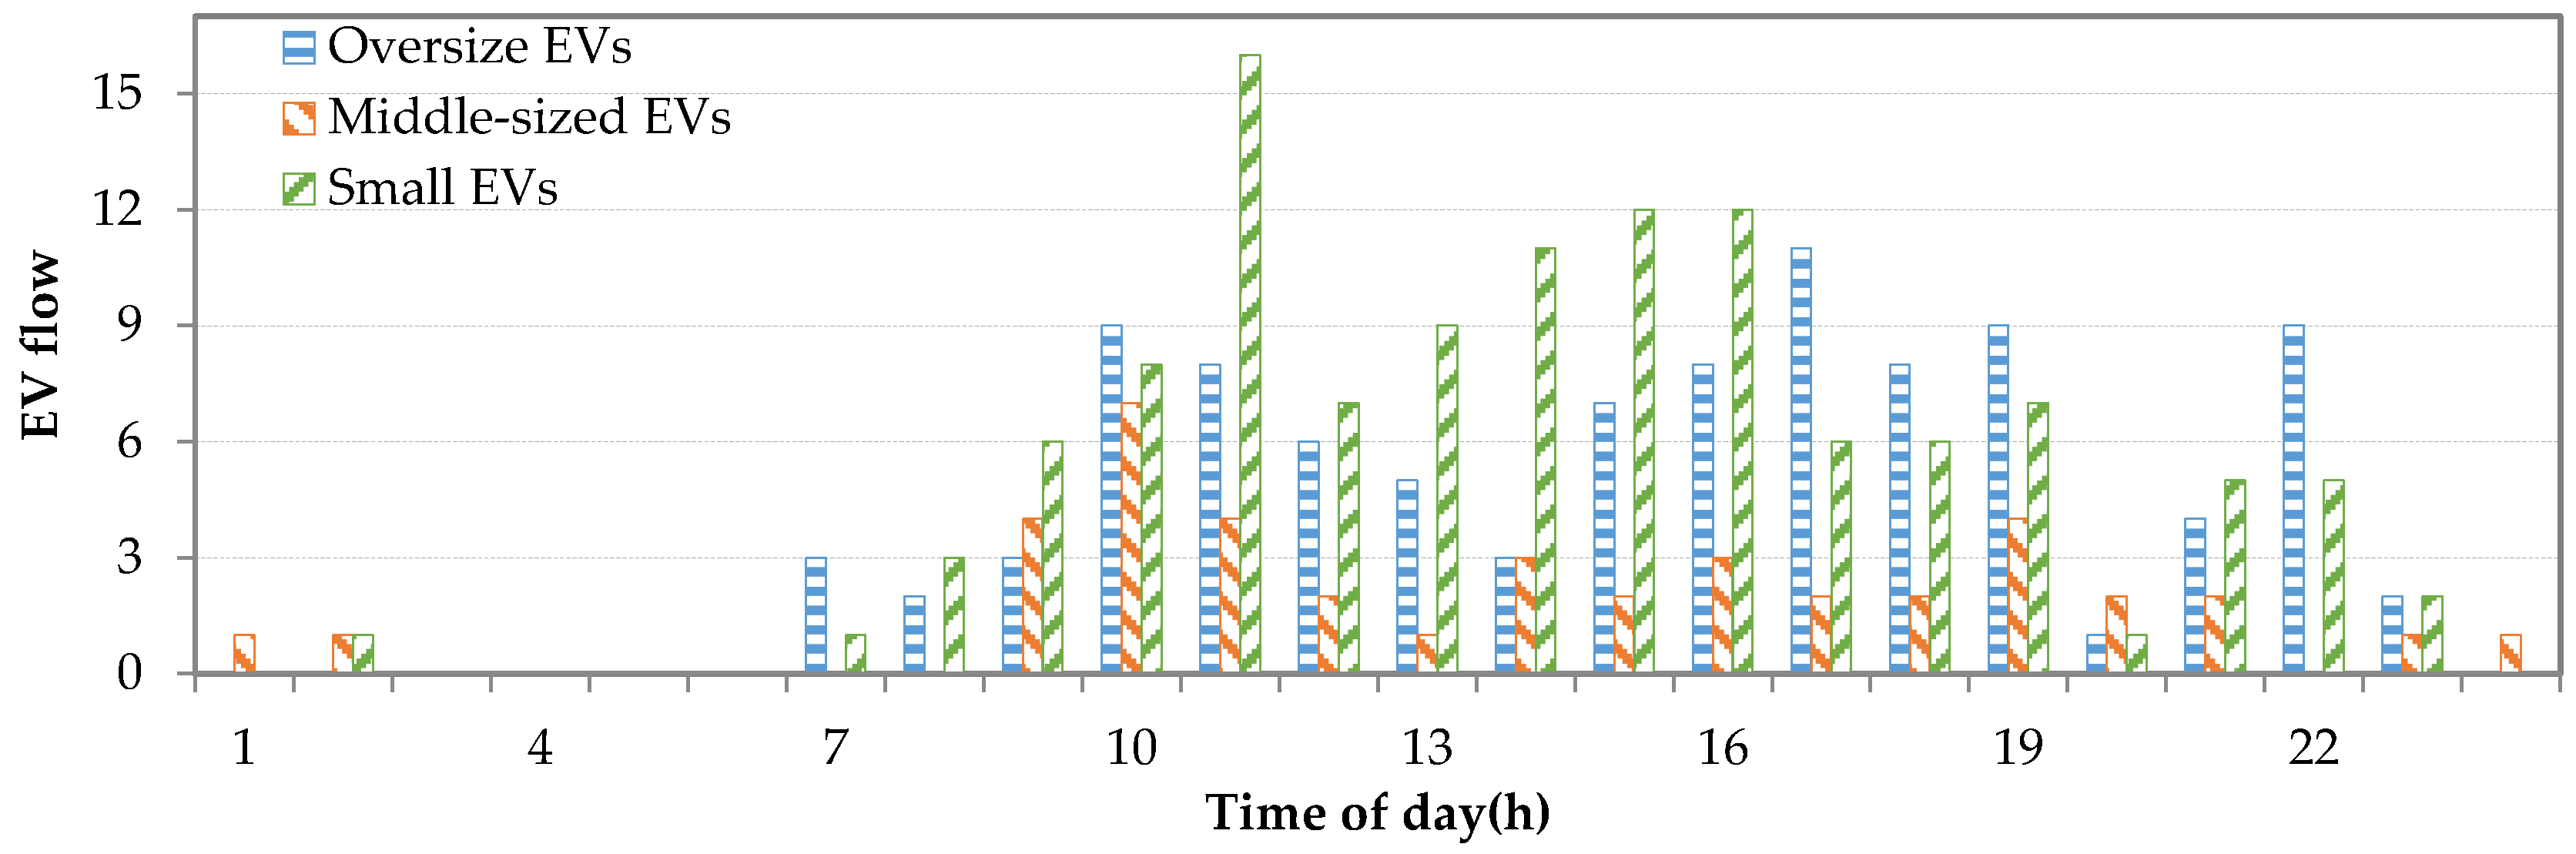
  • A solution for analysis and verification of the new quick-charging strategy is proposed, including the power distribution models for charging, the established queuing model of CS according to statistics of multi-type gasoline vehicles on Jiangsu highway, and the improved queuing algorithm, which can provide an important basis for the simulation.

2. New Quick-Charging Strategy and Power Distribution Model

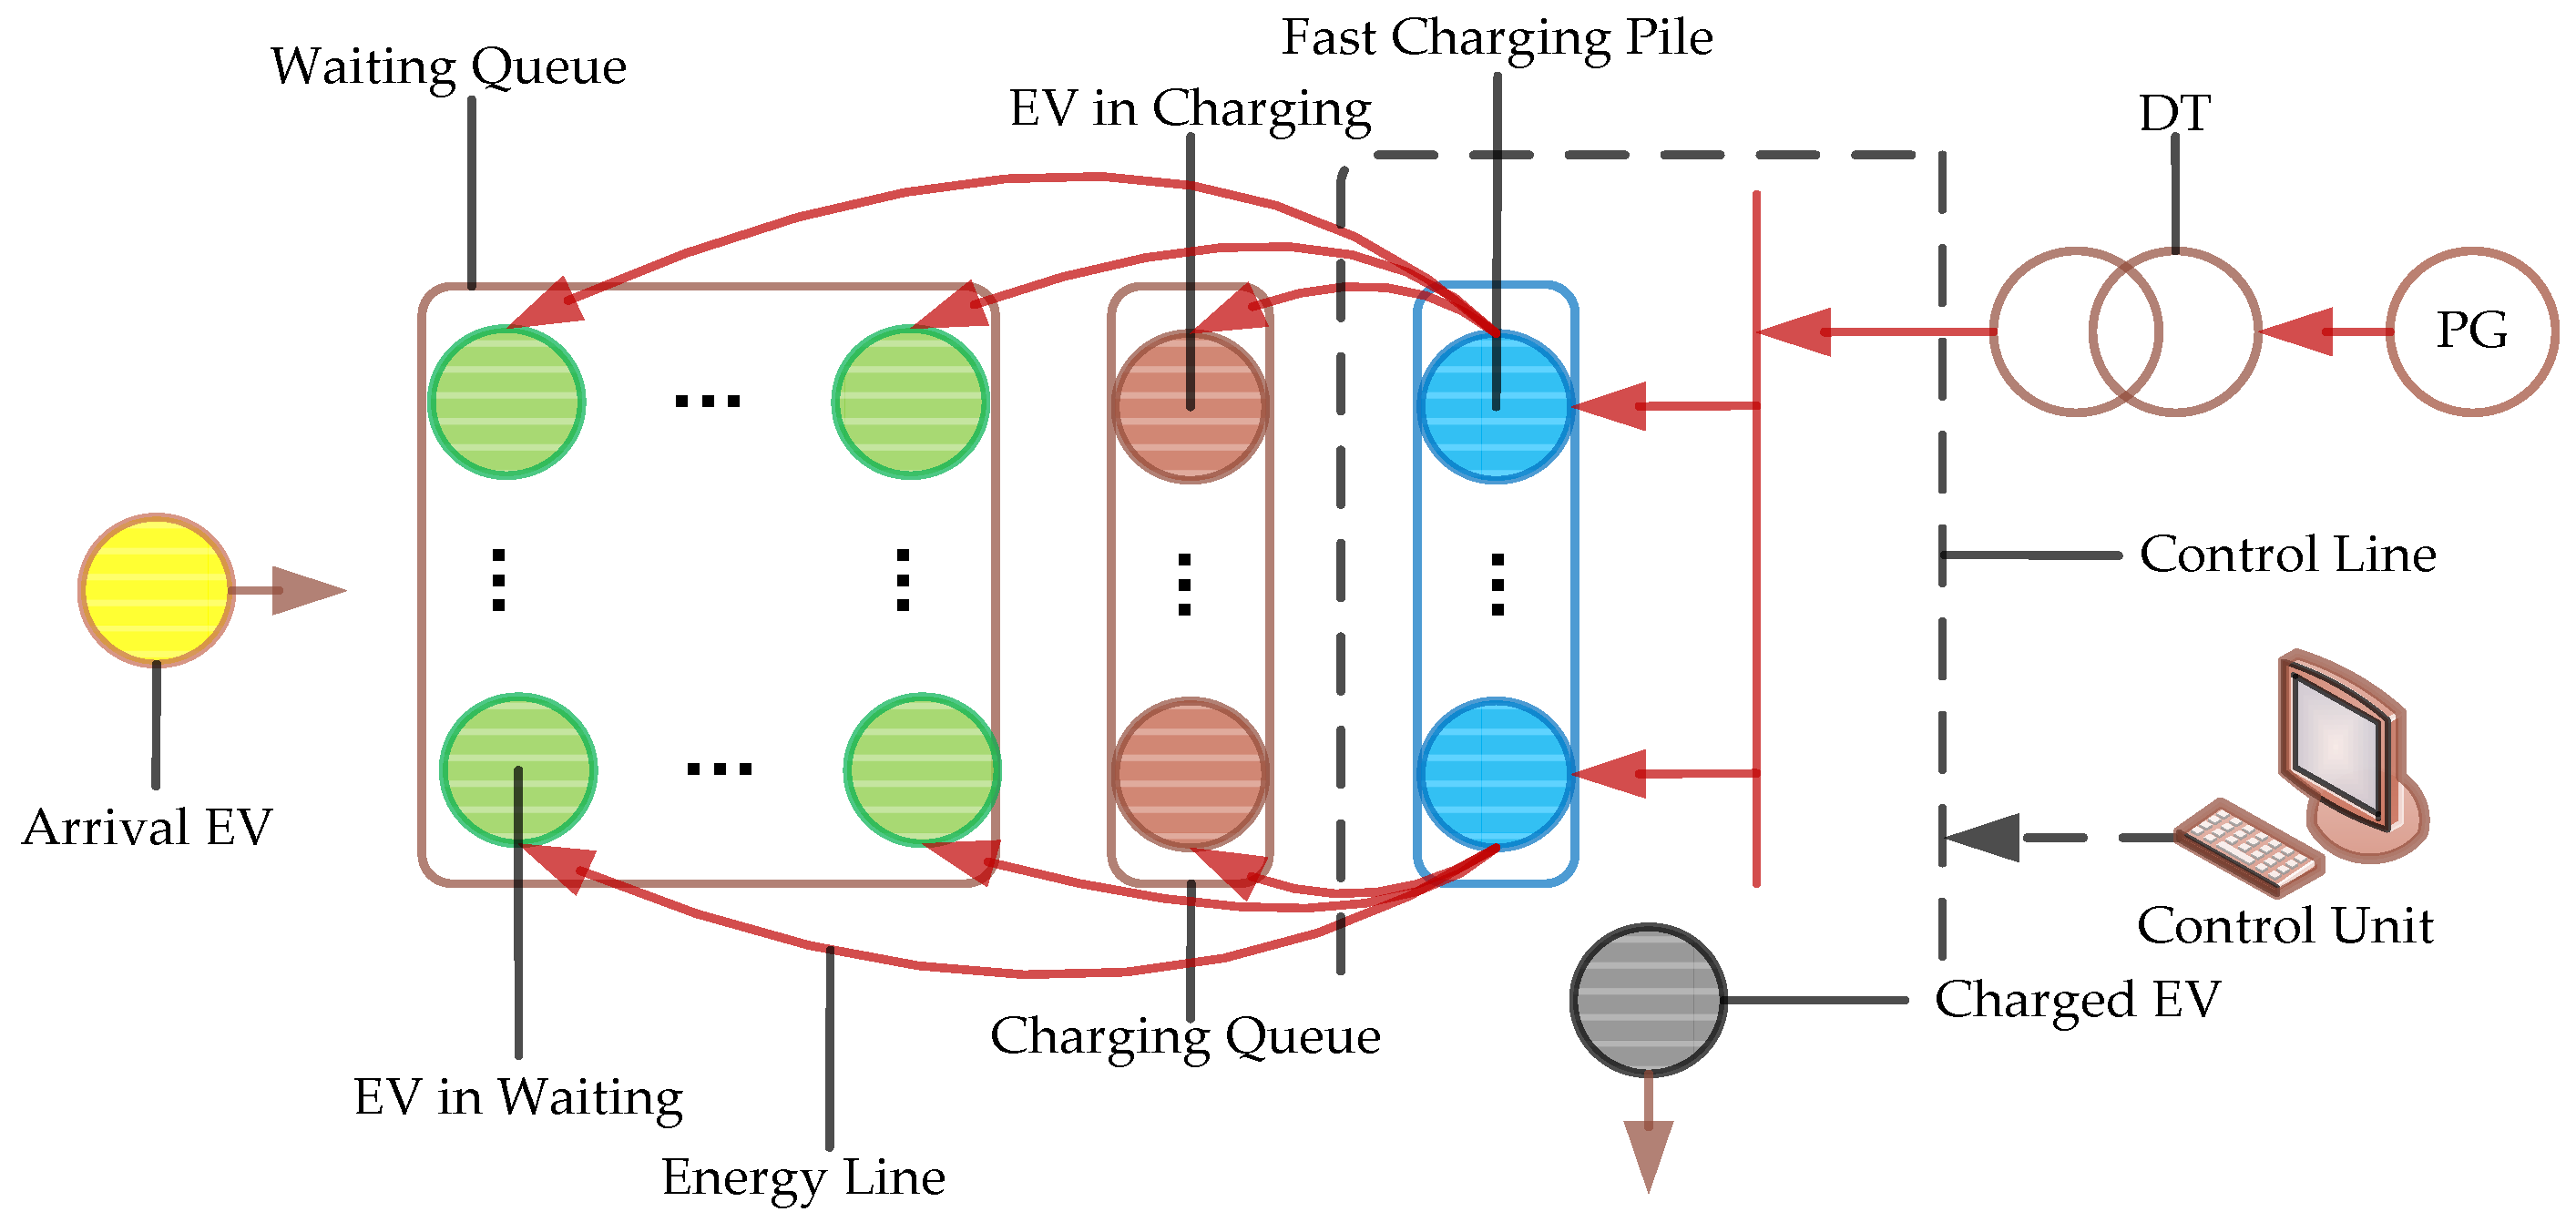
The charging infrastructure system structure of the new quick CS established by this paper is shown in Figure 1. The system consists of a power grid (PG), distribution transformer (DT), fast-charging piles with multiple power output interfaces, a control unit, and EVs in the station. In addition, EVs, regardless of where they are in the charging service queue—either charging or waiting in the queue—are all connected to the corresponding charging pile. We assume that the control unit and fast-charging piles can track the EV battery power and obtain the EV battery information. The specific processes are as follows: at first, the recommended charging profile [6,7] of each EV can be built into its battery management system (BMS) before leaving the factory. In addition, a charging-data communication channel can be established between the BMS of EV and the connected fast-charging pile. Secondly, the recommended charging profile of the charged EV can be transmitted to the connected fast-charging pile via the charging-data communication channel. Thirdly, the connected fast-charging pile, controlled and supplied with required electrical energy from the power grid by the control unit, can collect the real-time EV charging profile and the state of charge (SOC) of the battery being charged in the EV, which can output and adjust the charging power according to the real-time EV charging profile and SOC of the EV battery.
Like conventional quick CSs, the new quick CS is also equipped with a number of the same type of quick-charging piles to realise common utilisation of multiple types of EVs; the difference, however, is that the charging pile of the new CS has a number of power output interfaces, which can provide charging services to EVs in the waiting queue without any effects on other EVs in the charging process. In Figure 1, the number of output interfaces for charging piles depends on the specific charging equipment. In addition, the charging pile can adjust the power allocation among several EVs. There are thus four states for EVs in the quick CS: arrival state, waiting state, charging state, and departure state. Generally, conventional quick CSs do not provide any services to waiting state EVs. In contrast, this paper breaks out of such a conventional service mode and proposes a new quick-charging strategy (NQCS) for EVs based on the charging infrastructure system structure of the new quick CS: on the premise of not affecting any other EVs being charged, the remaining power of the quick-charging pile with multiple power output interfaces is used to provide synchronous charging services for EVs waiting in the queue. In the NQCS, one power output interface of the quick-charging pile is configured as the main output interface for providing a charging service to the charging state EVs; the remaining power output interfaces are configured as sub-output interfaces for providing a charging service to waiting EVs; and the main and sub-output interfaces can all be set according to state and entrance order of the connected EVs, so as to avoid the problem of non-continuity in the charging process when an EV’s state turns from waiting into charging. In addition, the power of the main output interface of each charger is offered according to the priority required to meet charging EV needs: each charging pile allocates the remaining power to waiting state EVs on demand one by one without interfering with the charging EV. There are two power distribution methods, i.e., the average power distribution method and on-demand power distribution method [19], the mathematical models of which are described below.

2.1. Average Power Distribution Model

In the NQCS, each quick-charging pile independently operates and corresponds to a number of parking spaces for providing charging services to charging state, and waiting state, EVs. For each quick-charging pile, it not only satisfies the charging demand of the charging state EVs, but also allocates the remaining power to waiting state EVs on an average need basis. At the same time, it restrains the charging power of waiting state EVs for not exceeding the quick-charging power limit of the corresponding battery. Thus, the distribution power for each EV in waiting can be calculated as:
P w av ( i , k ) = Min [ P ch max P ev c n 1 , R i max ( SOC ) ]
where Min [ · ] is the minimum value function; P w av ( i , k ) is the allocated power for the waiting state EV i which is connected to quick-charging pile k; P ch max is the maximum power of charging pile k; P ev c is the power of charging EV connected to the quick-charging pile k; n is the multi-power output quick-charging pile number; R i max ( SOC ) 
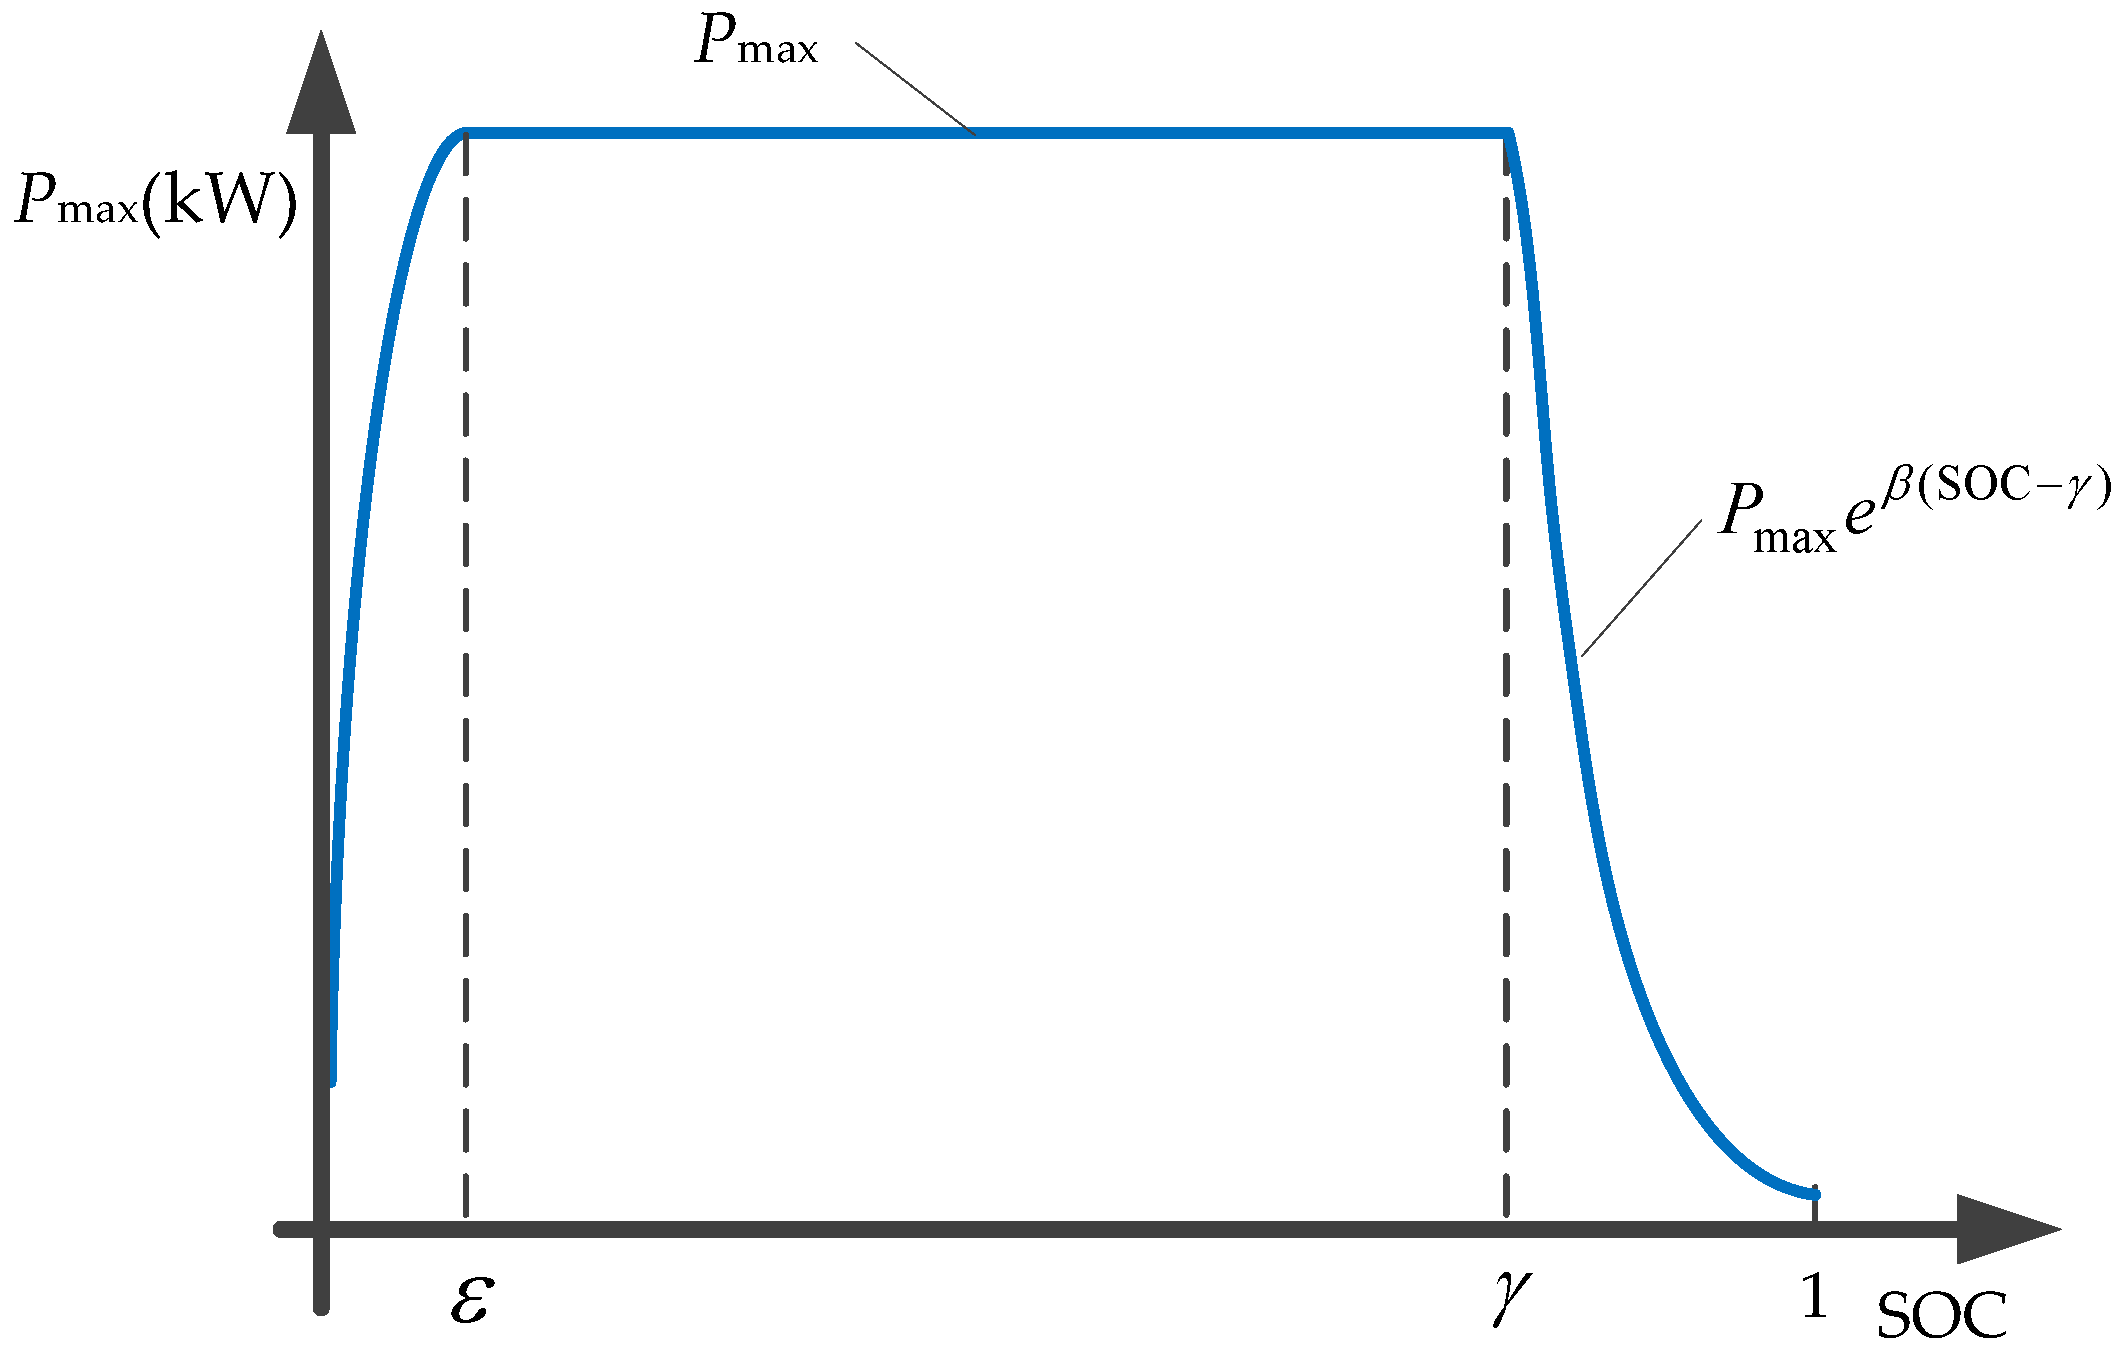
is the quick-charging power limit of the battery of the waiting state EV 
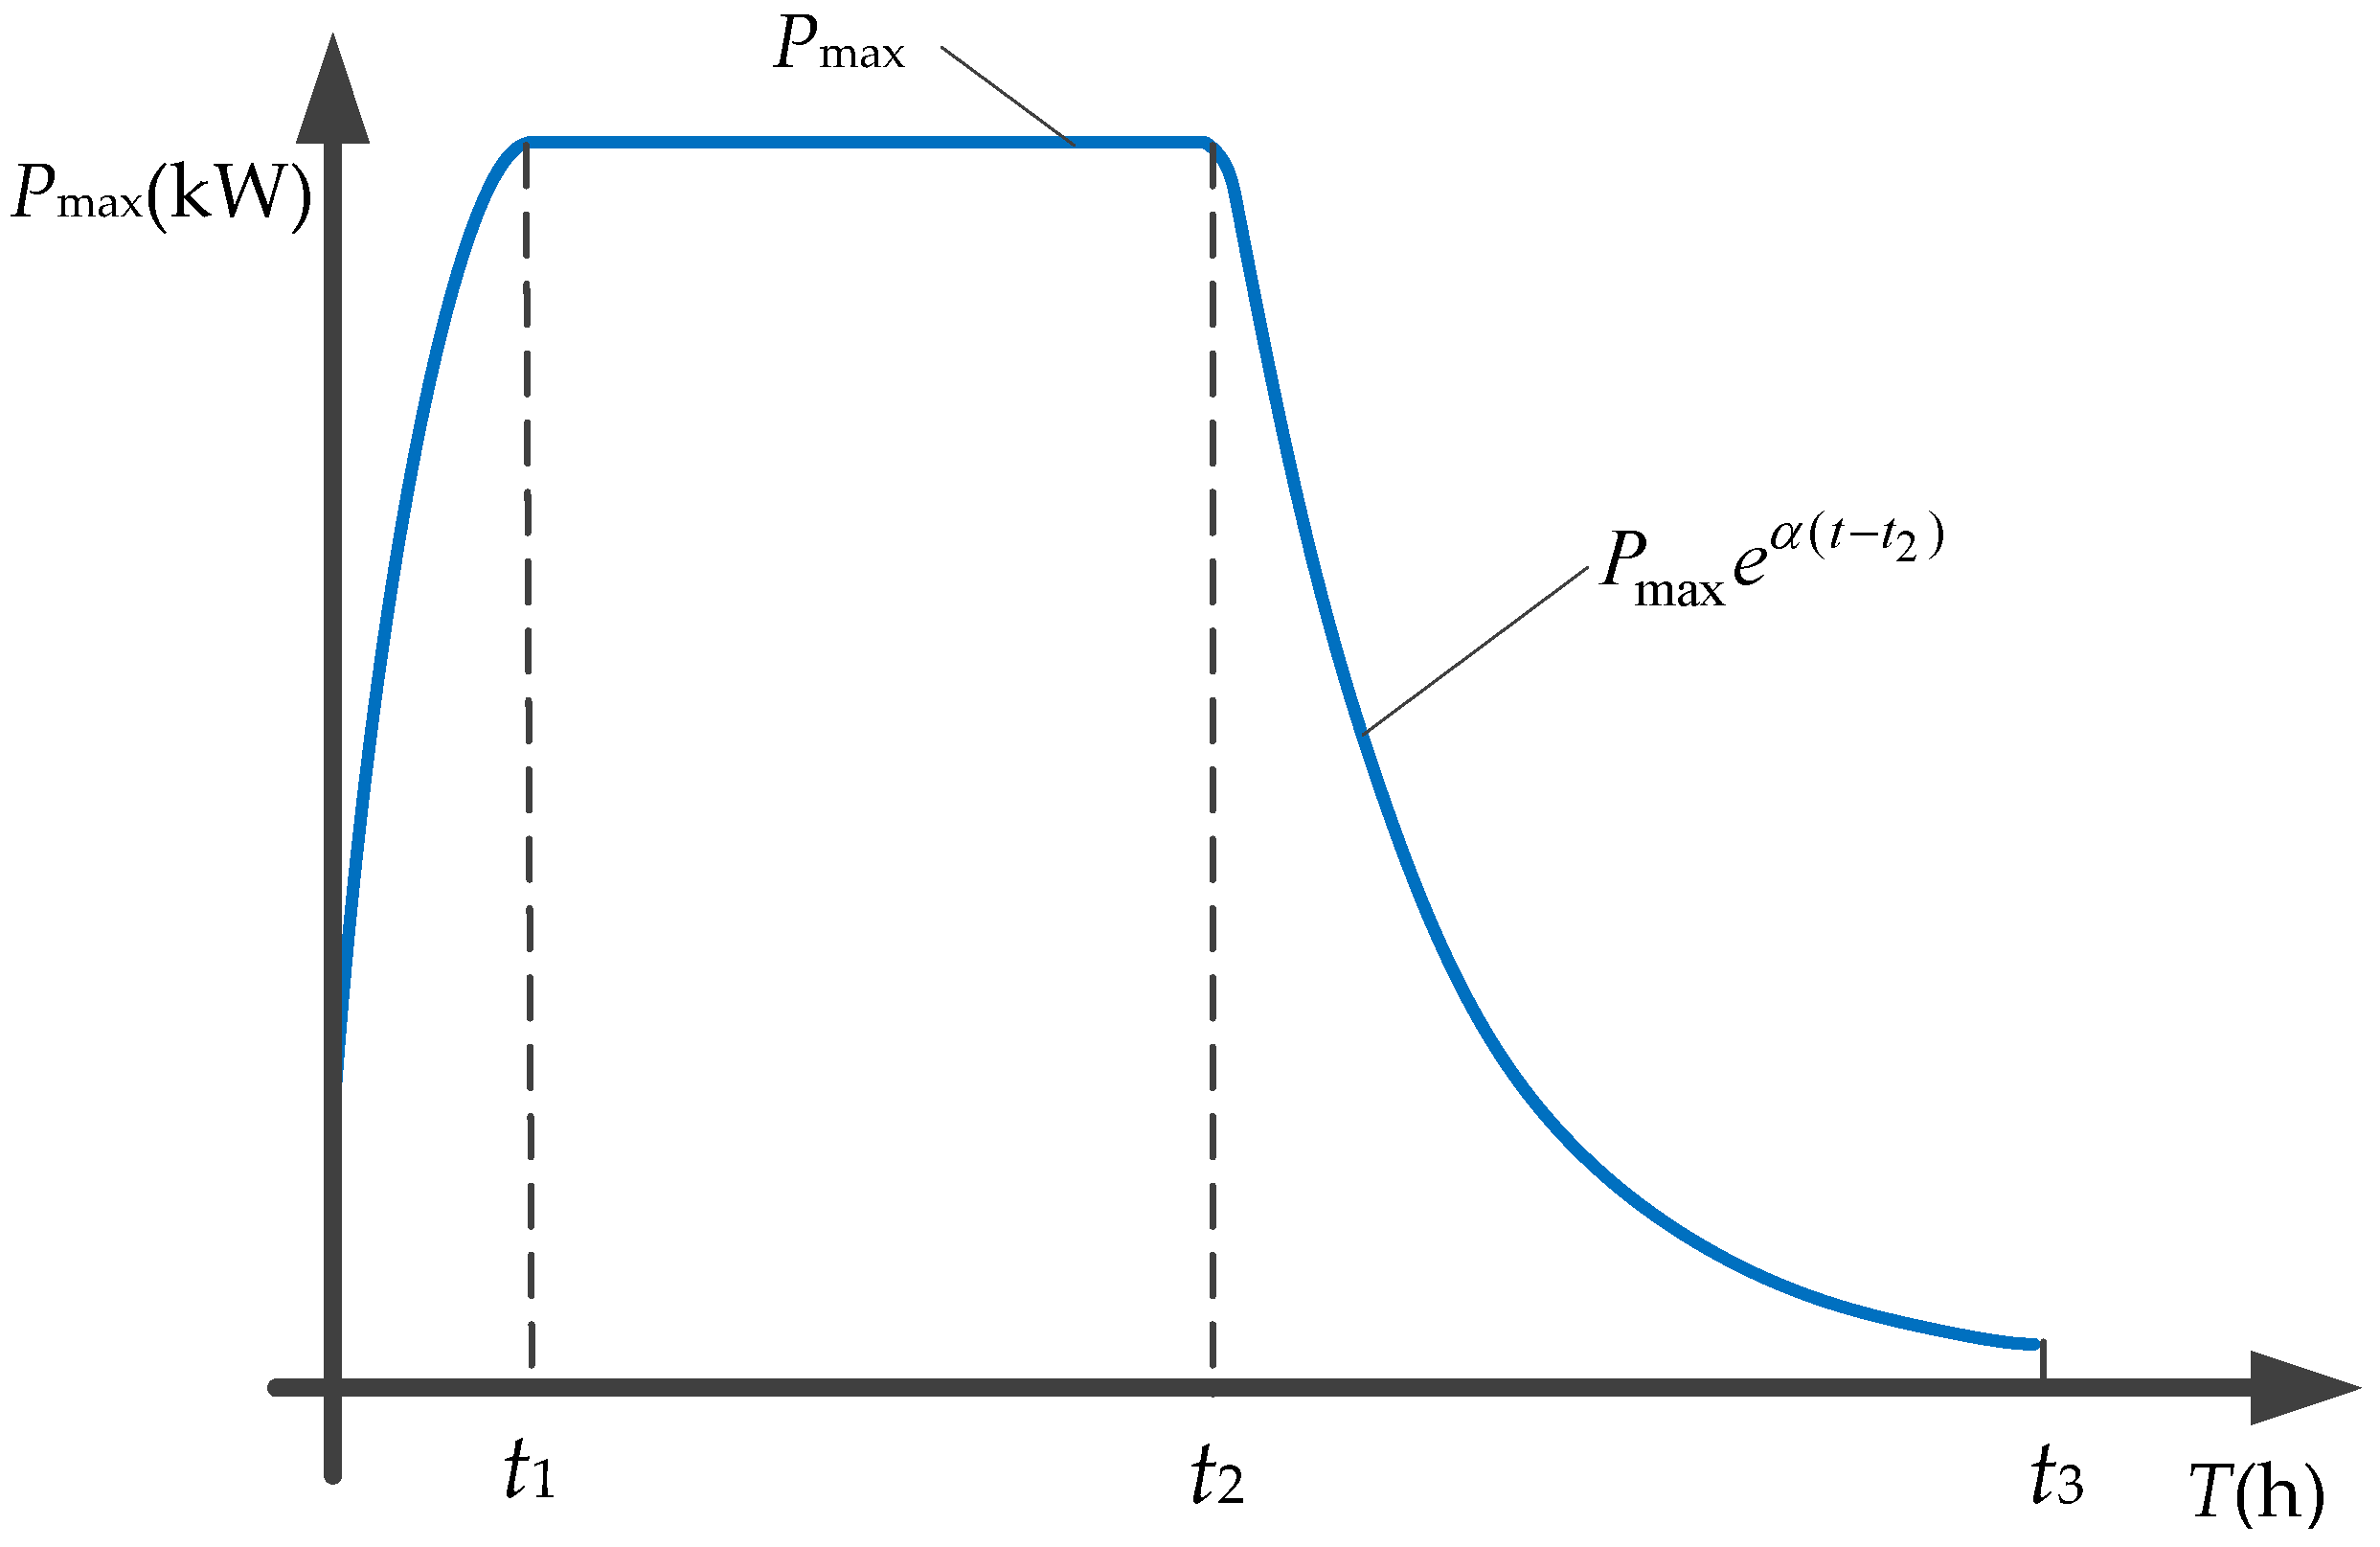
i, which is a function of its state of charge as shown in Figure 2. Considering the battery life [6,7], it is recommended that the remaining SOC of EV battery is not too low before charging. Therefore, in this paper, the charging power limit between 0 to ε is not considered.
The recommended charging profile in Figure 2 is specific to the particular manufacturer of EV battery, which generally contains two stages: constant power and variable power stages. To maintain EV battery health, it is recommended that the charging power profile served by fast chargers not exceed the charging profile defined by the manufacturer [6,7]. The charging power limit of the battery is calculated as:
R i max ( SOC ) = { P i max , if SOC ( ε ,   γ ] P i max e β ( SOC γ ) , if SOC ( γ ,   1 ]
where P i max is the maximum charging power for battery of EV i; ε, β and γ are charging parameters of the EV battery i; ε or γ is the battery SOC level corresponding to the start/end of the constant power stage accepting the charging power profile; and β is a fitting parameter of the exponential function used for the accepted charging power profile.

2.2. On-Demand Power Distribution Model

According to the operating mechanisms of highway CSs and EVs, EV users consciously accept a charging service in accordance with the principle of “first in, first-charged”. In addition, the charging state EV has the highest priority for a charging service; the EV following it has the second priority; and the remaining waiting state EVs have the lowest priority. For each quick-charging pile, it allocates the remaining power to waiting state EVs on demand. At the same time, it restrains the charging power of waiting state EVs so as to not exceed the quick-charging power limit of the corresponding battery. Thus, the distribution power for each EV in waiting can be calculated as:
P w st ( i , k ) = Min [ Δ P k i , R i max ( SOC ) ]
where P w st ( i , k ) is the allocated power for the waiting state EV i which is connected to the quick-charging pile k; Δ P k i is the remaining power for the waiting state EV i, which is calculated as:
Δ P k i = { P ch max P ev c , if i = 1 Δ P k i 1 R i 1 max ( SOC ) , if Δ P k i 1 > R i 1 max ( SOC ) , i > 1 0 , if Δ P k i 1 R i 1 max ( SOC ) , i > 1

3. Queuing Model for Charging Station (CS)

EVs in CSs on highways with heavy vehicle inflow usually have to wait to be charged. Every CS and EV in the station constitutes a queuing system, which is shown in Figure 1. A queuing model for the CS is established to verify the effectiveness of CQCS and NQCS, as described below.

3.1. Model of Pause Ratio for Electric Vehicles (EVs) on Highways

In the highway area, the utilisation rate of service area of different types of EVs is a statistical value, which is usually affected by many factors such as EV type, inter-service area distance and user physiological needs. We introduce and define a pause ratio (which is the ratio of the number of EVs entering the service area to that of all the EVs passing the service area during a day). The pause ratios in different types of EVs are different. Thus, according to [22], it is assumed that the pause ratio for each type of EVs on a highway is calculated as:
Z pr = K A 3 V
where K is a coefficient value which can be calculated as in [23]; A is the inter-service area distance; and V is average speed of the EVs.

3.2. Model of Daily Station Inflow

According to [22], we supposed that the daily station inflow of the same type of EVs is related to the pause rate, charging proportion, and road section inflow. Thus, the daily station inflow of the same type of EVs on highways is calculated as:
d r = Z pr F r
where Fr is the daily inflow of the same type of EVs in the road section where the service area is located. Since there is a big difference in the vehicle flow during different time periods, the station inflow of the same type of EVs on highways at different times is calculated as:
D r ( t ) = D r ( t ) + 1 , if ρ t 1 < κ i < ρ t , i = 1 , , d r
ρ 0 = 0 , ρ t = k = 1 t p k , t = 1 , , s
where κ i is a random number between 0 and 1; s is the number of segments of the uniform and discrete probability density curve; ρ t is the cumulative probability of the t curve section for the flow of the same type of EVs; p k is the probability of the t curve section for the flow of the same type of EVs.

3.3. Model of Arrival Time for EVs

Given highway users’ driving characteristics, we purposed that the arrival time of the same type of EVs satisfies a uniform distribution within every time frame [24]. Thus, the arrival time is calculated as:
T i a = Int [ ω × Unfi ( t 1 , t ) ] , i = 1 , , n t , if n t > 0
where Unfi ( · ) is a uniform random number generator; Int [ · ] is an integral function; ω is a default value which is a unit-converter coefficient; if the unit of each time frame is hours and the time step unit is minutes, then ω = 60; nt is the station inflow of the same type of EVs at time t.

3.4. Model of Waiting Time for EVs

Waiting time is one of the key factors influencing user satisfaction [25]. Thus, the waiting time of the EV i is expressed as:
T i w = T i s T i a
where T i s is the starting time of EV charging.

3.5. Model of Charging Time for EVs

At present, the typical strategy of the EV battery charging is a two-stage method [6,7]. Since the charging time of the EV is related to the initial state of charge ( SOC i s ) of an EV, the expected state of charge ( SOC i e ) of EV as well as the charging curve of the EV battery, the charging time of the EV is calculated as:
T i c = χ ( SOC i e ) χ ( SOC i s )
where χ ( SOC i ) is the innate charging characteristic function of the battery of EV i, representing the charging time from referential state of charge ε to target state of charge SOC i . Since the remaining SOC of an EV battery is not too low before charging, from 0 to t1, the charging profile is not considered. Therefore, the recommended charging profile at different times is shown in Figure 3.
Based on the parameters of recommended charging profiles in Figure 2 and Figure 3, χ ( SOC i ) is calculated as:
χ ( SOC i ) = { t 2 t 1 γ ε ( SOC i ε ) + t 1 , if SOC ( ε ,   γ ] t 3 t 2 1 r ( SOC i γ ) + t 2 , if SOC ( γ ,   1 ]
where t1, t2 and t3 are charging parameters of the EV battery. Since the charging power in its variable power stage is described by an exponential function, the parameters α and β are calculated as:
{ β = t 3 t 2 1 γ α e α ( t 3 t 2 ) = ( 1 γ ) Q i P i max α + 1
where the parameter α is calculated numerically.
As no waiting state EV is charged, conventional quick-charging strategies do not affect the initial state of charge of the battery of waiting state EVs. The initial state of charge is thus the state when the EV enters the station. In contrast, the new quick-charging strategy makes full use of the waiting stage, making the initial state of charge of the EV different from the state when it enters the station.
SOC i s = SOC i a + 1 Q i T i a T i s P i w ( t ) d t
where P i w ( t ) is the distribution power for the waiting EV i which is connected to quick-charging pile k; T i s which in turn is the starting time of EV charging; T i a is the arrival time of EV charging; Q i is the capacity of the battery. As each waiting EV is charged before its main charging time, the new quick-charging strategy can affect the remaining battery level of waiting EV.

3.6. Utilisation Ratios of Charging Facilities of CS

In contrast to [17], based on the total number of running piles and the utilisation ratio of output power, the utilisation ratio of charging facilities of the CS can be calculated as:
θ = 1 N t N c t = 1 N t k = 1 N c P t k P ch max
where N t is the total number of time periods; N c is the maximum number of charging piles of the CS; P t k is the power consumed by running pile k at time t; P ch max is the maximum output power of charging pile k at time t.

4. Improved Queuing Algorithm (IQA)

CQCS can be simulated and solved by the basic queuing algorithm [17]. However, NQCS has its own unique modus operandi: it discovers, and makes use of, controllability of the waiting state EVs to provide a suitable charging service to them as they wait. This increases the initial battery power of waiting state EVs and reduces the charging time, so as to reduce waiting time of the next EV. Because the basic queuing algorithm cannot simulate the charging of waiting state EVs this paper proposes an improved queuing algorithm (IQA) to simulate charging of EVs in NQCS.
According to the literature [17], we define the minimum driving ability of the EV from the current CS to the next CS, which is calculated as:
SOC min d = Δ L L max + δ min
where ∆L is the length of the road from the current CS to the next CS(km); Lmax is the maximum mileage of the EV(km); and δmin is the minimum SOC of the battery, which is usually set to 0.05.
According to Equation (15), the charging EVs are divided into forced charging EVs and adjustable charging EVs. A forced charging EV means that the EV has to charge because the remaining SOC of the EV battery is insufficient to reach the next CS (SOC ≤ SOC min d ). An adjustable charging EV means that the EV can charge when the CS is idle. Otherwise, the adjustable charging EV can leave the CS because the remaining SOC of the EV battery is sufficient to reach the next CS (SOC > SOC min d ). The flowchart of IQA is as shown in Figure 4 and the following are the specific procedures:
Step 1
Initialise the system’s operating cycle, time step, entrance list (where the vector of the arrival customer in each line includes five variables such as the progress, duration and load in charging, arriving, and waiting times of the EV), arrival list, charging pile lists, departure list, and the maximum number of charging piles. Generate the arrival time of EVs entering the CS in the system’s operating cycle by using related data and Equations (5) to (8), and add it to the entrance list. Set the values of other variables to 0.
Step 2
Assess statistics from the EV entrance list and judge if there are any EVs entering the CS at that moment. If so, judge the charging type of EV users according to Equation (15) and proceed to Step (2.a); otherwise, do Step (2.b). Step (2.a): if the type of the EV user is a forced charging EV user, set the state of his/her EV to its arriving state, add one to the queue length including charging EVs, and put the EV into the arrival list and delete it from the entrance list. Otherwise, judge if there are any idle parking spaces in the CS; if not, let the adjustable EV user leave the CS, and delete it from the entrance list; if so, set the state of his/her EV to its arriving state, add one to the queue length including charging EVs, and put the EV on the arrival list and delete it from the entrance list. Step (2.b): analyse the statistics of the current EV arrival list and judge if there are any EVs in the arrival list; if there are any, the arrival list should be sorted in ascending order in accordance with the EV arrival times.
Step 3
Judge if there are any EVs in each charging pile list; if there are, successively calculate actual charging time of every EV according to Equations (10)–(13), but do not update the charging time. At the same time, calculate and record the waiting time of any EVs yet to be allocated power. All charging pile lists should be in ascending order in accordance with the waiting time of EVs to be allocated power.
Step 4
Judge if the number of EVs in the arrival list is bigger than the total number of charging piles; if so, allocate the arrival state EVs to charging piles in batches. Calculate and record the waiting time of those EVs to be allocated. At the same time, all charging pile lists should be sorted in ascending order in accordance with the waiting time of EVs yet to be allocated; otherwise, directly allocate the arrival state EVs to charging piles in order.
Step 5
Judge if there are any EVs in the charging pile lists; if not, set the number of charging state EVs to 0, the queue length to 0, and the charging load to 0. Judge if there are no EVs in any of the charging pile lists; if there are, turn to Step 8; otherwise, turn to Step 6.
Step 6
Set the number of charging state EV of each charging pile list to one, and add one to its charging progress. At the same time, set the state of remaining EVs as being in the waiting state, calculate the queue length, and allocate power to the charging state EVs and waiting state EVs in accordance with the on-demand or average power distribution method. In addition, according to Equations (10)–(13), update the state of charge of the EVs in charging and waiting states as well as the charging time of waiting state EVs.
Step 7
Judge if the charging progress of each EV, in each charging pile list, is one; if so, calculate its waiting time according to Equation (9) and set its state to charging state. Judge if the current charging state EV has completed its charging process; if so, delete it from the charging pile list, set its state as departing, and put it onto the departure list.
Step 8
Add the queue lengths of all charging pile lists as the station queue length. Add the charging power of all charging pile lists as the station charging load. The utilisation rate of charging infrastructure of the CS can be calculated according to Equation (14).
Step 9
Add one time step to the current analysis and judge if the result is smaller than the service period; if so, turn to Step 2, otherwise, end the program and output the result.

5. Numerical Simulation

5.1. Parameter Settings

5.1.1. Daily Traffic Flow Data and Probability Distribution of EVs on Highway

There are five primary roads in the region of Changzhou, Jiangsu [26], among which roads numbered 1 to 4 have a pair of service areas, respectively, as shown in Figure 5. This paper adopted service area No. 1 of primary road No. 1 as the simulation scenario for this quick-charging station operation.
According to statistical data [27] about Jiangsu’s highways, the average daily gasoline traffic flow is calculated as 51,232 vehicles at all highway entrances in Changzhou. Therefore, the average daily gasoline traffic flow of each primary road in 2014 is 10,246 vehicles, which can be used as the simulation data baseline for daily gasoline traffic flow at the entrance of primary road No. 1. According to statistical gasoline traffic flow data [28] of the Changzhou section of the Shanghai-Nanjing Freeway, this paper assumed that the probability distribution curve of traffic flow of EVs on primary road No. 1 is as shown in Figure 6. According to data from the south region of Jiangsu highways [29], gasoline traffic growth rates in the future are as shown in Table 1 and can be used as gasoline traffic growth rates in the future in the region of Changzhou. China’s vehicle stock (EV stock) will reach 400–523 million (60 million) in 2030 [30,31]. Accordingly, the calculated EV penetration rate is 0.11–0.15. For the sake of conservative estimation, China’s vehicle stock is set to 400 million. Therefore, if we assume that the EV penetration is 0.15, the average daily EV traffic flow in 2030 is calculated as 2547 vehicles on primary road No. 1 based on the average daily gasoline traffic flow (10,246 vehicles) in 2014 and its growth rate. At present, EVs have different sizes of battery capacity. It thus follows that EVs can be approximately divided into three types of electric vehicles, including oversized electric vehicles, middle-sized electric vehicles and small electric vehicles. According to statistical data for the southern network in Jiangsu [23], the proportions of oversized, middle-sized, and small gasoline vehicles were assumed to be 27:18:55, which can be used as an estimate of the proportions of EV types.

5.1.2. Parameter Settings of EVs

According to EV type, this paper adopted battery parameters of three models of Tesla EV [32] (capacity, maximum mileage, and maximum charging power) and survey statistical data of the three types of gasoline vehicles [22] (average driving speed V and coefficient K) as simulation parameters of the three EV models, as shown in Table 2. In addition, the initial battery power of each EV is set to comply with the normal distribution N (0.3, 0.05), and the range of the initial SOC for EVs is set to 0.15–0.45. The expected SOC of each EV in the simulation is set to 0.9. According to the literature [32], the charging parameters of a battery are set as follows: t1 = 0.1667, t2 = 0.6667, t3 = 1.25, ε = 0.1, γ = 0.8, The other parameters are calculated by Equation (12), as follows: α = −6.873, β = −20.046. Due to the maximum mileage of the EV being related to factors such as EV speed, outdoor temperature and air conditioning use, it is assumed that the simulated EVs are running on a sunny winter’s day in highways with good traffic conditions, and this means that the maximum mileage of the EV is obtained with these conditions, including the set vehicle speed, outdoor temperature of −10 (°C) and air conditioning set to recirculate [32].
In addition, the average distance between two service areas is 43.32 km [22]. The station inflow of the different types EVs on highways at different time periods is calculated by Equations (5)–(7), which are as shown in Figure 7. The arrival time for all EVs can be calculated by Equation (8).

5.1.3. Parameter Settings of CS

Given the inherent charging characteristic parameters of batteries in multiple types of EVs on highways and traffic inflow, this study set configurations of charging infrastructure of conventional CS and new CS as shown in Table 3.
NQCS mainly discovers, and makes use of, the potential value of waiting state EVs. To analyse its effectiveness, the paper applied this strategy to quick CSs where there are multiple types of EVs and high traffic inflow. In fact, the size of EV traffic inflow is relative to the size of total CS capacity [3,4]. When the traffic inflow is known, EV traffic inflow is greater and increases as the total CS capacity decreases. Therefore, in order to analyse the NQCS better when traffic inflow is known, the number of quick-charging piles in the new quick CS is set to 4, 5, 6, 7, or 8. The new quick CS is equipped with quick-charging piles that have four power output interfaces, among which the main output interface has a power output range set as the maximum charging power (120 kW, shown in Table 2) of the battery of an oversized vehicle, and the three sub-output interfaces have the same minimum output power of 2 kW according to the slow charging level. The power limit of the charging pile is thus set to 126 kW. Except when equipped with charging piles that have only one output interface, other configuration parameters of the conventional CS are all the same as those of the new CS. In addition, if the current queue length of EVs in a CS is more than the maximum number of the parking spaces of the CS, this paper assumed that if the excess users of EVs are forced charging users; they can wait for charging and park at the parking lot of the service area (these EVs are still counted in the queue length in this simulation), and if the excess users of EVs are adjustable charging users, they can leave the CS. Once the current queue length of EVs in CS is less than the maximum number of the parking spaces in the CS, forced or adjustable charging EVs can all park in the parking spaces within the charging area of CS in accordance with their order of arrival.

5.2. Results and Analysis

Based on the parameters in 5.1., in an actual highway service area where vehicle inflow is excessive during the simulation period (0:00–24:00), the charging situations of CQCS and NQCS were respectively simulated by a basic queuing algorithm and IQA: NQCS uses two power distribution methods (average power distribution method and on-demand power distribution method). The effects of different charging situations on EVs, CS, and power grid can be analysed as described below.

5.2.1. Effects of Different Charging Situations on EVs

The average waiting time is used for evaluating the total waiting time level of all charged EVs during the simulation period in different charging situations. Figure 8 shows the simulation result from which it is seen that the average waiting time of charged EVs in different charging situations increases as the number of chargers decreases (the relative vehicle inflow increases). The average power distribution method in NQCS is called NQCSA and the on-demand power distribution method in NQCS is called NQCSO. In terms of saving waiting time, NQCS is more efficient than CQCS, and NQCSO is more efficient than NQCSA.
The average charging time is used for evaluating the total charging time of all charged EVs during the simulation period in different charging situations. Figure 9 shows the simulation result in which as the number of chargers decreases, the average charging time of all charged EVs in NQCS decreases, but the average charging time of all charged EVs does not change in CQCS. Therefore, NQCS can significantly reduce user charging time, especially with four chargers of CS (for a relative vehicle inflow which is excessive). Meanwhile, in terms of saving charging time, NQCSO is more efficient than NQCSA. When the output maximum power of each charger is fixed, NQCS can reduce the charging time of an EV due to the fact that the chargers with a number of power output interfaces are used to be able to provide charging service to EVs in the queue.
The average stay time is used for evaluating the total stay time of all charged EVs during the simulation period in different charging situations. Table 4 shows the simulation result in which the average stay time of charged EVs in different charging situations increases as the number of chargers decreases. In terms of saving average stay time, NQCS is more efficient than CQCS, and NQCSO is more efficient than NQCSA. NQCS can reduce the stay time of EVs due to the fact that NACS can reduce user waiting, and charging times. In addition, NQCS saving stay time reflects the result in which NQCS can improve the charging rate for a CS.

5.2.2. Effects of Different Charging Situations on CS

During the simulation period, Table 5 shows the simulation result of the utilisation ratios of charging facilities of CS with a different number of chargers in different charging situations. As the number of chargers increases, the utilisation rate of charging infrastructure in NQCS decreases, but the utilisation rate of charging infrastructure in CQCS, which is small, does not change to any significant extent. Therefore, compared to CQCS, NQCS can significantly improve the utilisation rate of charging infrastructure, especially with four chargers of per CS (for a relative vehicle inflow which is excessive). Meanwhile, in terms of improving the utilisation ratio of charging facilities of CS, NQCSO is more efficient than NQCSA.
During the simulation period, Figure 10 shows the number of charged EVs in a CS with a different number of chargers in different charging situations. The number of EVs served for a CS in NQCS is more than that in CQCS, and number of EVs served for a CS in NQCSO is more than that in NQCSA. As the number of chargers increases, the number of EVs served for a CS in CQCS increases linearly, but in NQCS, the additional number of served EVs per CS decreases. Therefore, NQCS can significantly increase the number of served EVs per CS, especially when there are four chargers per CS (for a relative vehicle inflow which is excessive). NQCS can increase the number of EVs served for CS due to the fact that NQCS can improve the charging rate for CS, which can avoid the situation where more adjustable charging users leave the CS.
When the CS is busy, owing to the limited number of parking spaces for EV charging, forced charging users have to wait for charging in the parking spaces of the service area, but adjustable charging users can leave the CS. During the simulation period, Figure 11 shows the simulation result of the queue length of CS with different numbers of chargers (4, 5, 6, 7, and 8) in different charging situations.
From Figure 11a to Figure 11e, the maximum queue lengths during the simulation period with four to eight chargers in different charging situations are no more than the maximum number of parking spaces at the CS (16, 20, 24, 28, and 32), which means that no forced EVs have to park at the parking lot of the service area for charging in the simulation. As the number of chargers increases from Figure 11a to Figure 11e, the reduction of the queue length (overloaded working burden) is not significant due to the reason that more adjustable charging users enter the CS for charging. When the number of chargers is fixed during a time interval, the overloaded working burden for a busy CS can be relieved by guiding adjustable charging users towards the next CS for charging with using the status-of-use (SOU) charging prices [14]. In addition, from Figure 11a to Figure 11e, the area covered by the queue length curve of CS and the time axis in NQCS is less than that of CQCS, and the area in NQCSO is less than that of NQCSA. Therefore, compared to CQCS, NQCS can reduce the queue length of CS. Meanwhile, in terms of reducing the queue length of CS, NQCSO is more efficient than NQCSA.

5.2.3. Effects of Different Charging Situations on the Power Grid

During the simulation period, Figure 12 shows the simulation result of the charging load on a CS with different numbers of chargers (four, five, six, seven, and eight) in different charging situations.
From Figure 12a to Figure 12e, as the number of chargers increases, the fluctuations of charging load of CS in NQCSA and NQCSO are bigger, but the fluctuations in the charging load of the CS in CQCS are not obvious. To conduct quantitative analysis of the fluctuations of charging load on the CS, which can be used to show the effects of different charging situations on the power grid, a variable σ is introduced to reflect the fluctuation of charging load of CS [33], which is calculated as follows:
σ = 1 N t t = 1 N t ( P t c P t 1 c ) 2
where N t is the number of period of time; P t c is the charging load of a CS at time t.
Based on the charging load of a CS from Figure 12a to Figure 12e, the fluctuations of charging load on the CS with four to eight chargers in different charging situations are calculated by using Equation (16). Table 6 shows the simulation result of the fluctuations in the charging load on a CS with different numbers of chargers during the simulation period in different charging situations. Compared with the CQCS, NQCS can reduce the fluctuations of charging load on a CS and effects on the power grid. When the number of chargers per CS is four or five, in terms of reducing the fluctuations of charging load of CS, NQCSO is more efficient than NQCSA. However, for more than five chargers per CS, in terms of reducing the fluctuations of charging load on the CS, NQCSA is more efficient than NQCSO. This is because NQCS can play a role in filling the power coast-down of EVs in progress under variable power and solving the problem of charge diversity under constant power caused by capacity variance when the relative vehicle inflow is excessive, but this role diminishes as the vehicle inflow decreases. NQCS is therefore more suitable for quick-charging multiple types of EVs on highways where vehicle inflow is excessive.

6. Conclusions

This paper proposes, for the first time, a new quick-charging strategy (NQCS) for multiple types of electric vehicles (EVs) with different battery sizes at a highway charging station (CS), where vehicle inflow is excessive. The strategy is as follows: on the premise of not affecting those EVs being charged, the remaining power of quick-charging piles with multiple power output interfaces is used to provide a synchronous charging service for EVs waiting in the queue. According to the statistics of multi-type gasoline vehicles on Jiangsu highway and other related data, the EV traffic inflow on a selected highway can be estimated. Then, based on the estimated EV traffic inflow and Tesla EV data, three types of quick-charging strategies for EVs on highways have been studied in a CS with different numbers of chargers during a single day by using power distribution models, the queuing model for the CS, and an improved queuing algorithm. When the relative EV inflow is excessive (with four chargers in the CS in the simulation), the following conclusions may be drawn:
  • For EV users, in terms of saving waiting time, charging time, and dwell time for EVs in a CS, NQCS is more efficient than conventional quick-charging (CQCS) and NQCSO is more efficient than NQCSA. NQCS utilises the controlled characteristics of waiting EVs, charges them appropriately, and effectively shortens the charging time by using chargers with multiple power output interfaces. In this way, the waiting time of the next EV is reduced and thus the charging time and dwell time are also effectively reduced, improving user satisfaction and the charging efficiency of the CS.
  • For a CS, in terms of improving the utilisation ratio of charging facilities and the number of EVs served, and reducing the queue length at the CS, NQCS is more efficient than CQCS, and NQCSO is more efficient than NQCSA. NQCS effectively utilises the distributable power of each charging pile, not only meeting the charge requirements of EVs in progress, but also simultaneously allocating the rest of their available power to waiting EVs, thus improving the utilisation ratio of charging facility. In addition, the service provided at the CS is better due to great improvement in its charge efficiency, which can avoid the situation where more adjustable charging users leave the CS.
  • For the power grid, in terms of reducing fluctuations of charging load on the CS, NQCS is more efficient than CQCS, and NQCSO is more efficient than NQCSA. NQCS fills the power coast-down of EVs in progress under variable power, but also solves the problem of charge diversity under constant power caused by capacity variations. Hence, the fluctuations of charging load of CS can be effectively reduced and requirements imposed upon the adjustability of the grid are lower, thereby decreasing the overall effect from then on.
Furthermore, in NQCS, on-demand power distribution maximises the use of residual power to charge any waiting EVs and therefore is more efficient compared with the average power distribution. Therefore, compared with CQCS, NQCS can be used to solve the quick-charging problem for multi-type EVs on highways with heavier traffic.

Acknowledgments

This work was supported by State Grid Corporation of China, and Science and Technology Planning Project of Jiangsu Province (Grant no. BE2015004-4).

Author Contributions

The novel fast-charging strategy and the solution for analysis and verification of the charging strategy (including an established queuing model for a CS and an improved queuing algorithm) were done by Lixing Chen. He was also responsible for the simulation implementation for case study. In addition, this work was performed under the advisement and regular feedback of Xueliang Huang, Long Jin and Zhong Chen.

Conflicts of Interest

The authors declare no conflict of interest.

References

  1. Williams, J.H.; DeBenedictis, A.; Ghanadan, R.; Mahone, A.; Moore, J.; Morrow, W.R.; Price, S.; Torn, M.S. The technology path to deep greenhouse gas emissions cuts by 2050: The pivotal role of electricity. Science 2012, 335, 53–59. [Google Scholar] [CrossRef] [PubMed]
  2. Graditi, G.; Langella, G.; Laterza, C.; Valenti, M. Conventional and Electric Vehicles: A Complete Economic and Environmental Comparison. In Proceedings of the 2015 International Conference on Clean Electrical Power (ICCEP), Taormina, Italy, 16–18 June 2015.
  3. Ghamami, M.; Zockaie, A.; Nie, Y.M. A general corridor model for designing plug-in electric vehicle charging infrastructure to support intercity travel. Transp. Res. Part C 2016, 68, 389–402. [Google Scholar] [CrossRef]
  4. Morrissey, P.; Weldon, P.; O’Mahony, M. Future standard and fast charging infrastructure planning: An analysis of electric vehicle charging behavior. Energy Policy 2016, 89, 257–270. [Google Scholar] [CrossRef]
  5. Wang, S.; Crosier, R.; Chu, Y. Investigating the power architectures and circuit topologies for megawatt superfast electric vehicle charging stations with enhanced grid support functionality. In Proceedings of the 2012 IEEE International Electric Vehicle Conference (IEVC), Greenville, SC, USA, 4–8 March 2012.
  6. Zhao, G.; Huang, X.; Qiang, H. Coordinated control of PV generation and EVs charging based on improved DECell algorithm. Int. J. Photoenergy 2015. [Google Scholar] [CrossRef]
  7. Sun, B.; Dragičević, T.; Freijedo, F.D.; Vasquez, J.C.; Guerrero, J.M. A Control Algorithm for Electric Vehicle Fast Charging Stations Equipped with Flywheel Energy Storage Systems. IEEE Trans. Power Electr. 2016, 31, 6674–6685. [Google Scholar] [CrossRef]
  8. Anseán, D.; Dubarry, M.; Devie, A.; Liaw, B.Y.; García, V.M.; Viera, J.C.; González, M. Fast charging technique for high power LiFePO4 batteries: A mechanistic analysis of aging. J. Power Sources 2016, 321, 201–209. [Google Scholar] [CrossRef]
  9. Flores, R.J.; Shaffer, B.P.; Brouwer, J. Electricity costs for an electric vehicle fueling station with Level 3 charging. Appl. Energy 2016, 169, 813–830. [Google Scholar] [CrossRef]
  10. Aziz, M.; Oda, T.; Ito, M. Battery-assisted charging system for simultaneous charging of electric vehicles. Energy 2016, 100, 82–90. [Google Scholar] [CrossRef]
  11. Fotouhi, A.; Auger, D.J.; Propp, K.; Longo, S.; Wild, M. A review on electric vehicle battery modeling: From Lithium-ion toward Lithium-Sulphur. Renew. Sustain. Energy Rev. 2016, 56, 1008–1021. [Google Scholar] [CrossRef]
  12. Arora, S.; Shen, W.; Kapoor, A. Review of mechanical design and strategic placement technique of a robust battery pack for electric vehicles. Renew. Sustain. Energy Rev. 2016, 60, 1319–1331. [Google Scholar] [CrossRef]
  13. Yang, Y.; Zhang, W.; Niu, L.; Jiang, J. Coordinated charging strategy for electric taxis in temporal and spatial scale. Energies 2015, 8, 1256–1272. [Google Scholar] [CrossRef]
  14. Pu, Y. A matching problem and an existence with optimum algorithm. J. Chongqing Univ. 2014, 2, 62–68. (In Chinese) [Google Scholar]
  15. Yan, Y.; Luo, Y.; Zhu, T.; Li, K. Optimal charging route recommendation method based on transportation and distribution information. Proc. CSEE 2015, 35, 310–318. (In Chinese) [Google Scholar]
  16. Yang, S.N.; Cheng, W.H.; Hsu, Y.C.; Gan, C.H.; Lin, Y.B. Charge scheduling of electric vehicles in highways. Math. Comput. Model. 2013, 57, 2873–2882. [Google Scholar] [CrossRef]
  17. Chen, L.; Chen, Z.; Huang, X.; Jin, L. A Study on price-based charging strategy for electric vehicles on expressways. Energies 2016, 9, 385. [Google Scholar] [CrossRef]
  18. Bodet, C.; Jablonowski, R.; Erickson, K.; Schülke, A. An optimal local charging strategy for competing electric vehicles on quick charging facilities. In Proceedings of the 2012 3rd IEEE PES International Conference and Exhibition on Innovative Smart Grid Technologies (ISGT Europe), Washington, DC, USA, 14–17 October 2012.
  19. Hu, H. A Study on Charging Power Control Strategy for Electric Vehicles at Charging Station. Master’s Thesis, University of Electronic Science and Technology of China, Chengdu, China, 2011. [Google Scholar]
  20. Ding, H.; Hu, Z.; Song, Y. Value of the energy storage system in an electric bus fast charging station. Appl. Energy 2015, 157, 630–639. [Google Scholar] [CrossRef]
  21. Xiao, Z. Analysis of construction of charging pile for electric vehicles. In Construction Materials and Decoration; Kitchen Sanitary Facilities Industry Association in Chengdu: Chengdu, China, 2015. (In Chinese) [Google Scholar]
  22. Kong, J.; Hong, J. Planning and Design of Service Area on Expressways; China Building Materials Press: Beijing, China, 2009; pp. 110–111. (In Chinese) [Google Scholar]
  23. Ji, J.; Chen, H. A study on calculation model and analysis for service area’s scale. J. Highway Transp. Res. Dev. 2006, 10, 171–173. (In Chinese) [Google Scholar]
  24. Ma, R.; Ye, L.; Qin, Z. Daily load random fuzzy modeling of highway electric vehicle charging stations. J. Changsha Univ. Sci. Technol. 2015, 12, 81–88. [Google Scholar]
  25. Fan, C.; Li, H.; Jia, J.; Hao, L. The relationships among waiting time, perceived economic loss and service satisfaction: A study of taxi drivers’ waiting for gas. Manag. Rev. 2014, 11, 99–105. [Google Scholar]
  26. Google’s Official Website. Expressways of Changzhou in Jiangsu. Available online: http://www.google.cn/maps/ (accessed on 18 February 2016).
  27. Shi, K. Jiangsu Traffic Yearbook; Editorial office of Jiangsu Traffic Yearbook: Jiangsu, China, 2014; pp. 418–419. (In Chinese) [Google Scholar]
  28. Guo, X. Highway Traffic Operation Analysis: Methods and Application; Southeast University Press: Nanjing, China, 2012. [Google Scholar]
  29. Sun, R.; Hu, B.; Wang, J. Forecast of Traffic Flow, Toll Income, and Cost of Operation Maintenance in Xiyi Highway, First-Grade Highway, and Huan-Taihu Highway; Jiangsu-Weixin Engineering Consultants Inc.: Nanjing, China, 2014. (In Chinese) [Google Scholar]
  30. Hao, H.; Wang, H.; Ouyang, M. Prediction of China’s passenger vehicle and commercial vehicle stocks. J. Tsinghua Univ. Sci. Technol. 2011, 6, 868–872. (In Chinese) [Google Scholar]
  31. Tan, X.; Zhao, H.; Peng, H.; Li, D. Quasi-real-time coordinated charging/discharging policy for electric vehicles. Trans. China Electrotech. Soc. 2015, 13, 69–76. (In Chinese) [Google Scholar]
  32. Tesla’s Official Website in China. Available online: https://www.tesla.cn/supercharger/ (accessed on 1 February 2016).
  33. Yan, Z. Value Assessment Research of Battery Energy Storage in Smart Grid. Master’s Thesis, Shanghai Jiaotong University, Shanghai, China, 2012. [Google Scholar]
Figure 1. Charging infrastructure system structure of the new quick charging station (CS).
Energies 09 00744 g001
Figure 2. Maximum charging power of battery at different state of charge.
Energies 09 00744 g002
Figure 3. Maximum charging power of battery at different times.
Energies 09 00744 g003
Figure 4. The flowchart of the improved queuing algorithm (IQA).
Energies 09 00744 g004
Figure 5. Primary roads in the region of Changzhou, Jiangsu.
Energies 09 00744 g005
Figure 6. Probability distribution curve of traffic flow of EVs on primary road No. 1.
Energies 09 00744 g006
Figure 7. The station inflow of the different types EVs on highways at different time periods.
Energies 09 00744 g007
Figure 8. Average waiting time of charged EVs for CSs with different numbers of chargers in different charging situations.
Energies 09 00744 g008
Figure 9. Average charging time of charged EVs during the simulation period in different charging situations.
Energies 09 00744 g009
Figure 10. Number of charged EVs for a CS with different number of chargers in different charging situations.
Energies 09 00744 g010
Figure 11. Queue length given different numbers of chargers in different charging conditions: (a) four chargers; (b) five chargers; (c) six chargers; (d) seven chargers; (e) eight chargers.
Energies 09 00744 g011
Figure 12. Charging load of a CS with different numbers of chargers during the simulation period in different charging conditions: (a) four chargers; (b) five chargers; (c) six chargers; (d) seven chargers; (e) eight chargers.
Energies 09 00744 g012
Table 1. Gasoline traffic growth rate in the future.
Period of TimeYearTraffic Growth Rate
12014–20155.4%
22016–20204.1%
32021–20253.1%
42026–20302.0%
Table 2. EV parameters.
TypeBattery CapacityMaximum MileageVCharging PowerK
Oversized EV85 kWh369.5 km70 km/h120 kW0.692391
Middle-sized EV60 kWh285.7 km90 km/h84.7 kW0.573061
Small EV40 kWh200.0 km110 km/h56.5 kW0.646392
Table 3. CS parameters.
TypeNumber of ChargersOutput InterfacesCharging Power LimitParking Spaces
Conventional CS4, 5, 6, 7, 81126 kW16, 20, 24, 28, 32
New CS4, 5, 6, 7, 84126 kW16, 20, 24, 28, 32
Table 4. Average stay time of charged EVs for CS with different number of chargers in different charging situations (unit: min).
Number of ChargersCQCSNQCSANQCSO
4135.767.157.9
5130.364.354.5
6127.460.746.8
7123.456.942.3
8121.553.640.2
Table 5. Utilisation ratios of the CS with different number of chargers during the simulation period in different charging situations.
Number of ChargersCQCSNQCSANQCSO
40.30960.58400.6208
50.30900.53730.5726
60.31460.48810.5049
70.30800.43240.4398
80.30390.38490.3849
Table 6. Fluctuations of charging load on a CS with different number of chargers during the simulation period in different charging situations (unit: kW).
Number of ChargersCQCSNQCSANQCSO
426.216.515.2
529.219.218.0
633.721.822.5
738.224.327.8
836.827.031.9

