Article

A First Principles Study of H2 Adsorption on LaNiO3(001) Surfaces

1
State Key Laboratory of Advanced Processing and Recycling of Non-ferrous Metals, Lanzhou University of Technology, Lanzhou 730050, China
2
School of Science, Lanzhou University of Technology, Lanzhou 730050, China
3
The School of Nuclear Science and Technology, Lanzhou University, Lanzhou 730000, China
*
Author to whom correspondence should be addressed.
Materials 2017, 10(1), 36; https://doi.org/10.3390/ma10010036
Submission received: 28 October 2016 / Revised: 30 December 2016 / Accepted: 31 December 2016 / Published: 5 January 2017
(This article belongs to the Section Energy Materials)

Abstract

:
The adsorption of H2 on LaNiO3 was investigated using density functional theory (DFT) calculations. The adsorption sites, adsorption energy, and electronic structure of LaNiO3(001)/H2 systems were calculated and indicated through the calculated surface energy that the (001) surface was the most stable surface. By looking at optimized structure, adsorption energy and dissociation energy, we found that there were three types of adsorption on the surface. First, H2 molecules completely dissociate and then tend to bind with the O atoms, forming two –OH bonds. Second, H2 molecules partially dissociate with the H atoms bonding to the same O atom to form one H2O molecule. These two types are chemical adsorption modes; however, the physical adsorption of H2 molecules can also occur. When analyzing the electron structure of the H2O molecule formed by the partial dissociation of the H2 molecule and the surface O atom, we found that the interaction between H2O and the (001) surface was weaker, thus, H2O was easier to separate from the surface to create an O vacancy. On the (001) surface, a supercell was constructed to accurately study the most stable adsorption site. The results from analyses of the charge population; electron localization function; and density of the states indicated that the dissociated H and O atoms form a typical covalent bond and that the interaction between the H2 molecule and surface is mainly due to the overlap-hybridization among the H 1s, O 2s, and O 2p states. Therefore, the conductivity of LaNiO3(001)/H2 is stronger after adsorption and furthermore, the conductivity of the LaNiO3 surface is better than that of the LaFeO3 surface.

1. Introduction

ABO3 perovskites are a group of inexpensive materials that possess high capacities; fast charge and discharge capabilities; and universally present the phenomenon of hydrogen storage. Therefore, perovskites have been systematically investigated as cathodes for nickel/metal hydride (Ni/MH) batteries. Thus, these materials have an important potential application value [1,2]. In recent years, many studies have been devoted to the investigation of the chemical properties of ABO3 perovskites, both experimentally and theoretically. Deng et al. [1] prepared LaFeO3 using a stearic acid combustion method and investigated the structure, chemical properties and hydrogen storage mechanism of LaFeO3 using X-ray diffraction (XRD), X-ray photoelectron spectroscopy (XPS) and mass spectrometry (MS), coupled with pressure composition temperature (PCT) methods; the analysis of the results showed that the discharge capacity was 626 mAh/g at 80 °C; however, Wang et al. [3] calculated the discharge capacity of LaFeO3 to be 662.4 mAh/g at 60 °C using a first principles method, where the maximum value of the discharge capacity increased with increasing temperature. Wærnhus et al. [4] reported on the electrical conductivity of polycrystalline LaFeO3 as a function of the thermal properties of the materials; and that the conductivity of LaFeO3 was affected by annealing for extended periods at temperatures above 1000 °C, prior to the conductivity measurements. Although the discharge capacity of LaFeO3 was sufficiently large enough for its use as a cathode in Ni/MH batteries, the required temperature was too high and had poor conductivity [1,3]. Hansmann et al. [5,6,7,8] reported that LaNiO3 materials possessed good conductivity. Kleperis et al. [9] focused on the discharge capacity of LaNiO3, which was also 360 mAh/g, according to theoretical works. Hsiao and Qi [10] reported that thin films of LaNiO3–x had good electrical conductivity when the sintering temperature was 600 °C; and the epitaxial films, particularly under tensile strain, presented higher stability. Although the discharge capacity of LaNiO3 is less than that of LaFeO3, LaNiO3 has better conductivity [11,12]. Kohn et al. [13] investigated the electronic structure of LaNiO3 using first principles density functional theory (DFT) calculations. Guan et al. [14,15] investigated the electronic structure of LaNiO3 using first principles calculations, and then calculated the surface energy of LaNiO3(001) and studied the electronic structure of the surface. Due to its good conductivity; high chemical stability; and high catalytic activity, LaNiO3 is often used in the manufacture of thin film electrode materials, electron emitters, and catalysts [11,16,17,18].
To correctly understand the changes in the microstructure of hydrogen storage materials and recognize the hydrogen storage properties of LaNiO3, it is important to research the hydrogen storage process for LaNiO3. The DFT evaluation is based on the plane wave expansion on this work. Starting from the surface of LaNiO3, the most stable surface was determined by calculating the surface energy. Then, the adsorption properties of H2 on the surface were investigated and included looking at changes in the electronic structure; electron and bond populations; and the change in electrical conductivity before and after adsorption, for the hydrogen storage process. The results were then compared with the existing experimental and theoretical data, and this comparison provides the corresponding microscopic mechanism and theoretical basis for further studies.

2. Models and Computational Methods

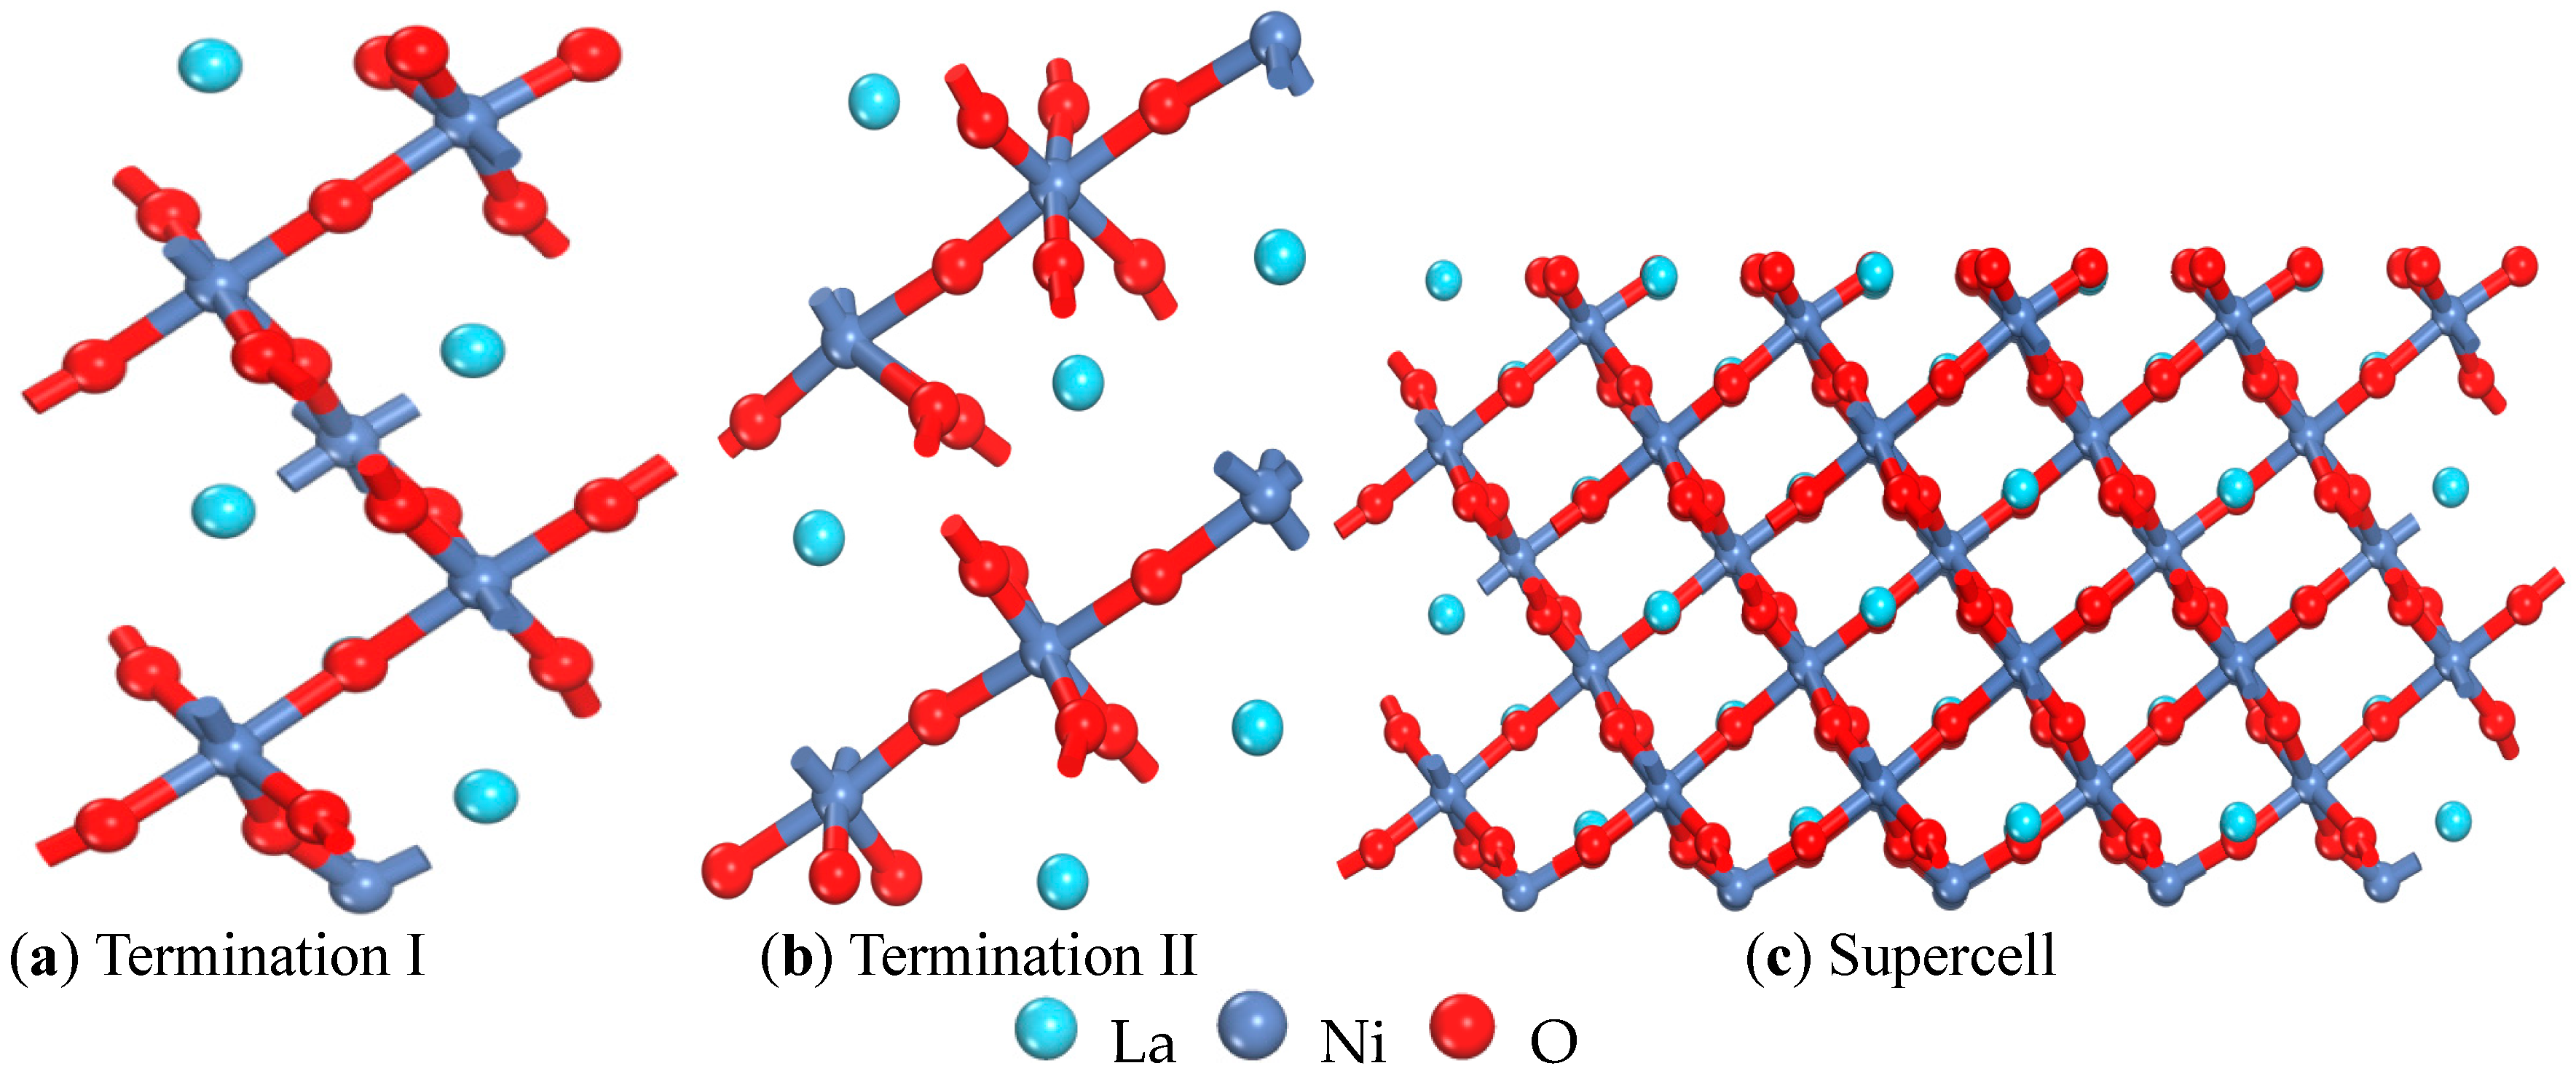
2.1. Calculation Parameters and Models

The first principles calculations were performed using the Cambridge Sequential Total Energy Package (CASTEP 7.1) computer code [19] in the framework of DFT, and the DFT evaluation was based on the plane-wave expansion. The generalized gradient approximation (GGA) [20] in the form of the Perdew-Burke-Ernzerhof function for exchange-correlation potential and the ultrasoft pseudopotential [21] are described for the electron-ion interaction. We treated the O (2s, 2p), Ni (3s, 3p, 3d, 4s), and La (5s, 5p, 5d, 6s) electrons as valence states, whereas the remaining electrons were kept frozen as core states. The partial occupancies were calculated using Finite temperature approaches—smearing methods—and the smearing was 0.1 eV. As the LaNiO3 crystal is a rhombohedral perovskite (R-3c), two models were used to study the properties of LaNiO3: LaO-terminated (Figure 1a, termination I) and Ni-terminated (Figure 1b, termination II). Due to calculation accuracy and computational efficiency considerations, the necessary convergence test for the cutoff energy and k-point mesh was performed, and all calculations were conducted using a cutoff energy of 600 eV and a 9 × 9 × 1 k-point mesh in the Brillouin zone, which is used for a 1 × 1 unit cell of the perovskite formula unit containing a total of 40 atoms. The results of the convergence test indicated that the model can meet the computational conditions. Considering computational accuracy, the 3 × 3 supercell was adopted (Figure 1c) to investigate the electronic structure of the most stable adsorption position. The k-point density was maintained as close to this value as possible for different slab calculations, and the convergence criteria for energy and displacement were 2.0 × 10⁻⁵ eV/atom and 10−3 Å, respectively. The vacuum region was 10 Å thick to ensure that the vacuum thickness was large enough to avoid spurious interactions between the slabs as well as to verify that the electrostatic potential was flat in the vacuum region for each result. The optimum lattice parameters (a = b = 5.3908 Å, c = 13.1074 Å) for LaNiO3 deviate slightly from the experimental values (a = b = 5.4534 Å, c = 13.1369 Å) [22], and indicates that the model can guarantee accurate calculations.

2.2. Calculations of Surface Energy

Surface energy can provide important information regarding the structural stability of the surface. According to the definition of Chiou Jr. and Carter [23], the surface energy density of a solid, which corresponds to the energy variation (per unit area) due to the creation of a surface, is given by
Esurf = (EslabNEbulk)/2A
where Eslab and Ebulk represent the total energy of the slab and the bulk total energy per LaNiO3 unit, respectively. N and A indicate the number of LaNiO3 units in the slab and the surface area of the slab, respectively.
The calculated surface energies of different LaNiO3 surfaces are presented in Table 1. The results indicate that the (001) surface possesses the lowest surface energy; therefore, the (001) surface is considered to be the most stable surface, which is similar to that in Reference [15] where the surface energy for the LaO-terminated (001) surface is approximately 2.03 eV/Å2. Choi et al. [24] and Evarestov et al. [25] also mention that the LaNiO3(001) surface is generally the most stable surface in perovskites. Thus, the LaNiO3(001) surface was investigated for hydrogen storage.

2.3. Calculations of Adsorption Energy and Dissociation Energy on the LaNiO3(001) Surface

Based on the analysis of the adsorption and dissociation energies on the (001) surface, the most stable adsorption site and related properties were investigated. The adsorption energy was defined with the following equation [26]:
E ads = E slab / H 2 E clean E H 2
where E clean and E slab / H 2   are the total energies of LaNiO3(001) and LaNiO3(001)/H2, respectively. E H 2   is the total energy of a H2 molecule. In terms of this definition, a negative value corresponds to an exothermic process and indicates a stable structure. Moreover, E dis   is the dissociation energy and can be expressed as the following equation:
E dis = 2 E H E H 2
where E H is the energy of a H atom. The dissociation energy of H2 is smaller than that of free H2, which indicates that H2 presents a dissociation phenomenon. A negative value shows that the H2 molecule has been completely dissociated and the smaller value indicates that dissociation is more abundant for H2.

3. Results and Discussion

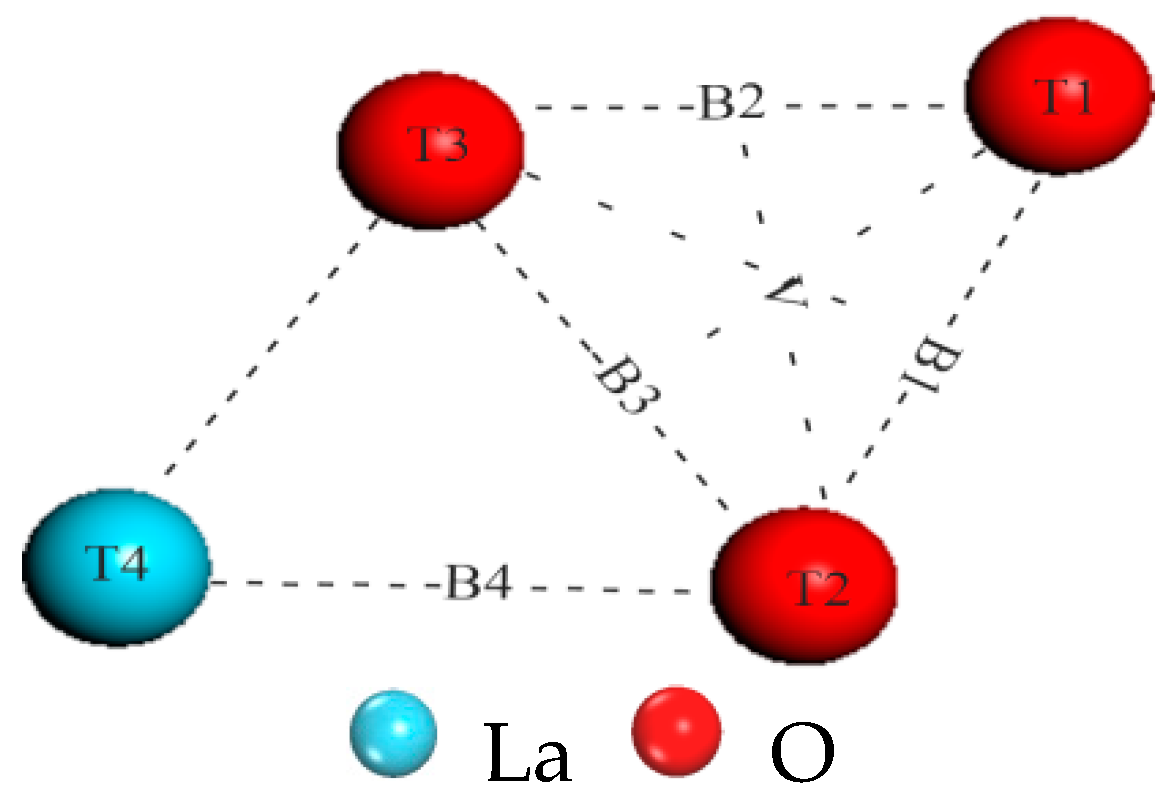
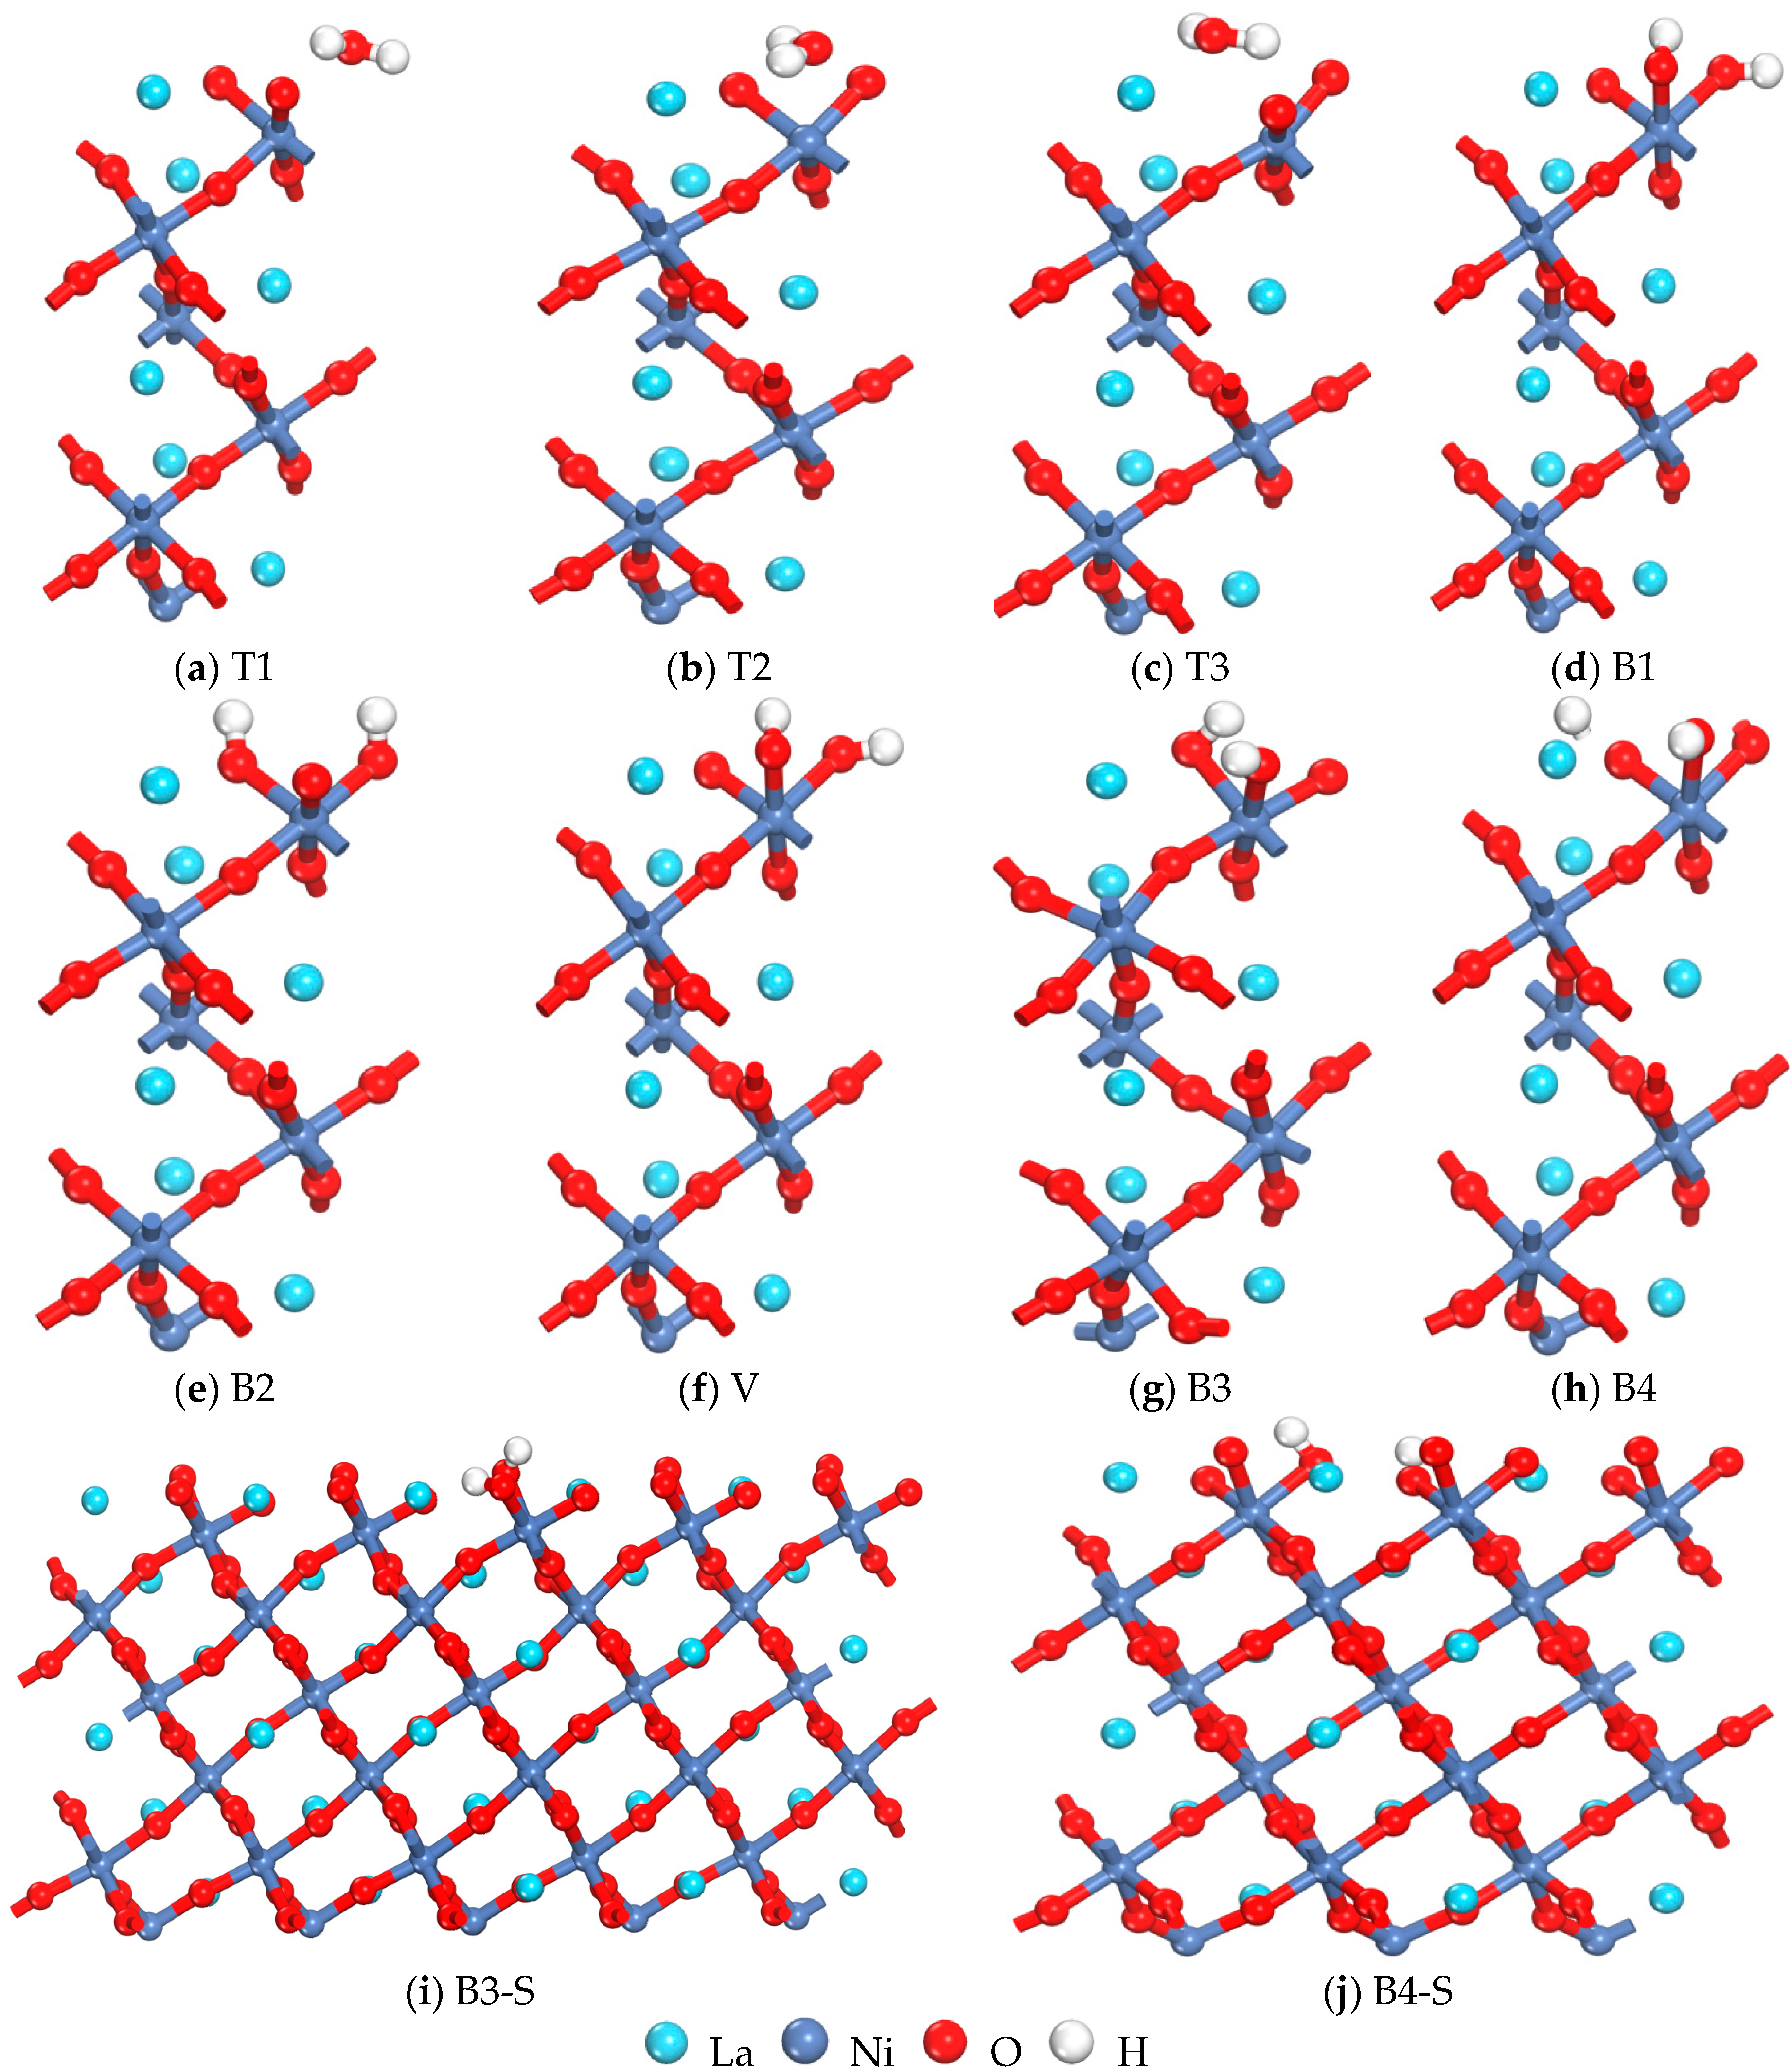
3.1. Analysis of Surface Adsorption Sites

All the possible adsorption sites for H2 in Termination I are shown in Figure 2. T1, T2 and T3 represent the top of O; T4 corresponds to the top of La; B1, B2 and B3 indicate the O; B4 corresponds to the La bridge; and V is a hollow site. T5 corresponds to the top of Ni in Termination II. As shown in Table 2 and Figure 3, the calculated adsorption energy Eads and dissociation energy Edis of different positions for the (001) surface are listed based on the previous definitions, and the minimum distance between H atoms and surface atoms after adsorption are also included (rH–H, rH–O, rH–La, and rH–Ni). The calculated rH–H and Edis for free H2 were 0.752 Å and −4.54 eV, respectively, and the result mostly agreed with the experimental values (0.752 Å and −4.48 eV) [27]. The calculated results indicated that when the H2 molecule was located on the B1, B2, B3 and V sites in Termination I, the calculated rH–H was clearly large and the Edis presented a negative value after geometry optimization, which showed that the H2 molecule had been dissociated and that the two H atoms approached the top of O and formed two –OH– with O atoms (as shown in Figure 3). The calculated Eads is significantly larger than −40 kJ/mol−1 (Eads is −0.415 eV for a H2 molecule), which indicates that this adsorption is a strong chemical adsorption [28] on these sites. The Eads is the largest on B3, which means that the LaNiO3(001)/H2 system achieved the most stable structure on B3. For computational accuracy, the 3 × 3 supercell was adopted (Figure 3i); moreover, the H2 molecule was located on the T1, T2 and T3 sites where two optimized H atoms approached an O atom to form a H2O molecule (Figure 3a–c). These structures were similar to the value that Lie and Clementi [29] used to calculate the geometric parameters of a H2O molecule (rH–O and rH–H are 0.978 Å and 1.545 Å, respectively) after geometry optimization. Interestingly, a H atom also approached an O to form a –OH–; however, another H was free on the B4 site after geometry optimization. After creating a 2 × 2 × 1 supercell to find its adsorption state, the calculation indicated that the free H approaches an O atom and forms a –OH–, as shown in Figure 3j. However, on T4, the value of Eads is positive (as the reaction is endothermic), and thus its adsorption is unstable. In Termination II, the values of rH–H and Edis are all almost identical to those of free H2, and the calculated Eads (−0.301 eV) was less than −0.415 eV on T5, which indicated that the adsorption process was physical [30]. However, physical adsorption needs to consider dispersion (van der Waals) interactions [31,32,33]; especially, when the adsorbed molecules are larger (e.g., water, methane, benzene adsorption). These are not to be neglected; however, as the focus of this article was to investigate the chemisorbed species, physisorption was not pursued further.
The calculated capture energy of the surface for a H2O molecule (−0.781 eV) undertaken during further analysis of the interaction forming a H2O molecule on the top of O with the surface showed a weak chemical adsorption. Here, the definition of the surface oxygen vacancy formation energy is as follows [34]:
E Vf = E vac E o + 1 2 ( E O 2 + h O 2 o )
where E vac and E o are the energies of the LaNiO3(001) surface; with and without an oxygen vacancy, respectively. E vac is the result of considering spin polarization.   E O 2 is the calculated energy of the O2 molecule, and h O 2 o is a correction term that accounts for errors that do not cancel between the treatment of oxygen in the gas and solid phases. The energy correction for O2 molecule is −1.36 eV [35].
Therefore, the calculated surface oxygen vacancy formation energy on T3 was −1.44 eV based on the definition, and the calculation result was slightly larger than that of the capture energy of the surface for a H2O molecule (−0.781 eV), which indicated that it was easy to form an oxygen vacancy on T3. The calculated Mulliken analysis of LaNiO3(001)/H2 on T3 is listed in Table 3, where O1, O2 and O3 represent three O atoms of the (001) surface. H1 and H2 indicate the two H atoms in a H2 molecule. The result indicated that after adsorption, the number of charges in the surface were reduced and electrons transferred from the H2O molecule to the surface. As the calculated bond populations of the H2O molecule with surface atoms are small, this means that the bonds are very weak; however, the large bond population of H–O in the H2O molecule means that the bond is very strong so that the H2O molecule could be separated from the surface. This result was supported by the electron and bond populations of LaNiO3(001)/H2 on T3. In conclusion, the interaction of a H2O molecule with the surface was weaker, therefore it was easy to separate from the surface to form an O vacancy. Rodriguez et al. [36] believed that the interaction between H2 and O vacancies are complex and that O vacancies affected the chemistry of H2 on the surface.

3.2. Chemical Process of Dissociation and Adsorption for H2 Molecules

The prerequisite for the reaction of a H2 molecule with the LaNiO3(001) surface is that the H2 molecule has to dissociate into two H atoms. Subsequently, further studies on the transition states and dissociation energy barrier of two types of dissociation processes of H2 molecules on the LaNiO3(001) surface were conducted by combining linear synchronous transit and quadratic synchronous transit. The initial structure of H2 molecules on the LaNiO3(001) surface are at T3 or B3 sites, and the final structure consisted of H2 molecules on the LaNiO3(001) surface after dissociation and adsorption. The transition states of the two dissociation processes and the activation energy barrier and reaction energy were obtained, and shown in Table 4. The H–H bond length in the transition state was somewhat stretched, the energy of the resulting structure was lower than that of the reactant, and the two processes were exothermic reactions. The results show that there is a certain reaction energy barrier in the dissociation and adsorption processes in both cases, which indicates that the reaction can be difficult to perform spontaneously and needs to be conducted under certain conditions such as heating or illuminating. From the optimized structure, we find that crystalloid defects are produced at the T3 site when two H atoms adsorb the same O atom to form a H2O molecule and form an oxygen vacancy after escaping from the surface. At the B3 site, two H atoms are adsorbed on two O atoms individually, thus, forming a –OH group. Comparison of the two types of dissociation and diffusion processes led to the following results: First, the activation energy barrier from the reactant to transition state at the T3 site was −0.869 eV, which meant that the reaction could easily occur; second, the activation energy barrier was −1.282 eV, which was slightly higher than the former case and contradicted the conclusion that optimal adsorption occurs at the B3 site. To determine the optimal adsorption site, the adsorption energies of a H2 molecule and H atom of an oxygen vacancy were calculated. The results indicated that adsorption would not occur in an oxygen vacancy for a H2 molecule, rather it escaped from the surface as the adsorption energy was only −0.228 eV. In contrast, when the H atom was located 2.458 Å or 3.455 Å from the surface, two H atoms both attached to a Ni atom in the vacancy due to adsorption in the optimized structure where the adsorption energy is −3.183 eV. Overall, the T3 site had a lower energy barrier for dissociation and adsorption; however, it is more difficult for the adsorption of a H2 molecule at this site because of the formed oxygen vacancy. Consequently, the B3 site was taken as the optimal adsorption site.

3.3. Analysis of Charge Population

Bonding strength among atoms is quantitatively analyzed based on charge population, and the formation of a chemical bond occurs via electron density redistribution among atoms such that the entire system achieves the lowest energy state [37]. When H2 adsorbs on the LaNiO3 surface with charge transfer, the electronic structure changes. Therefore, information about the interaction of H and the surface can be obtained by analyzing the Mulliken charge before and after adsorption. The Mulliken analysis was investigated through the projection of the plane-wave solutions onto a localized basis set [38,39,40,41]. The charge population was analyzed on B3 as it was the most stable structure in Termination I following geometry optimization. The charge populations on B3 are listed in Table 5, where, s, p and d refer to orbitals. This table shows that the population and the number of negative net charges of the O 2p orbital increase; the population of the H 1s orbital decreases; and the number of net charges significantly increases. This demonstrates that the electron of the H 1s orbital transfers to the O 2p orbital and that the H–O bond is clearly a covalent bond; subsequently, change to the other orbitals is minimal. To further analyze the bonding characteristics among atoms on B3, Table 6 lists the bond populations and bond lengths of atoms. Table 6 shows that the charge population of O–Ni clearly decreases and its bond length increases after geometry optimization. Therefore, the interaction of O–Ni is weak, but the charge population of H–O remarkably improves so that the interaction of H–O is strengthened.

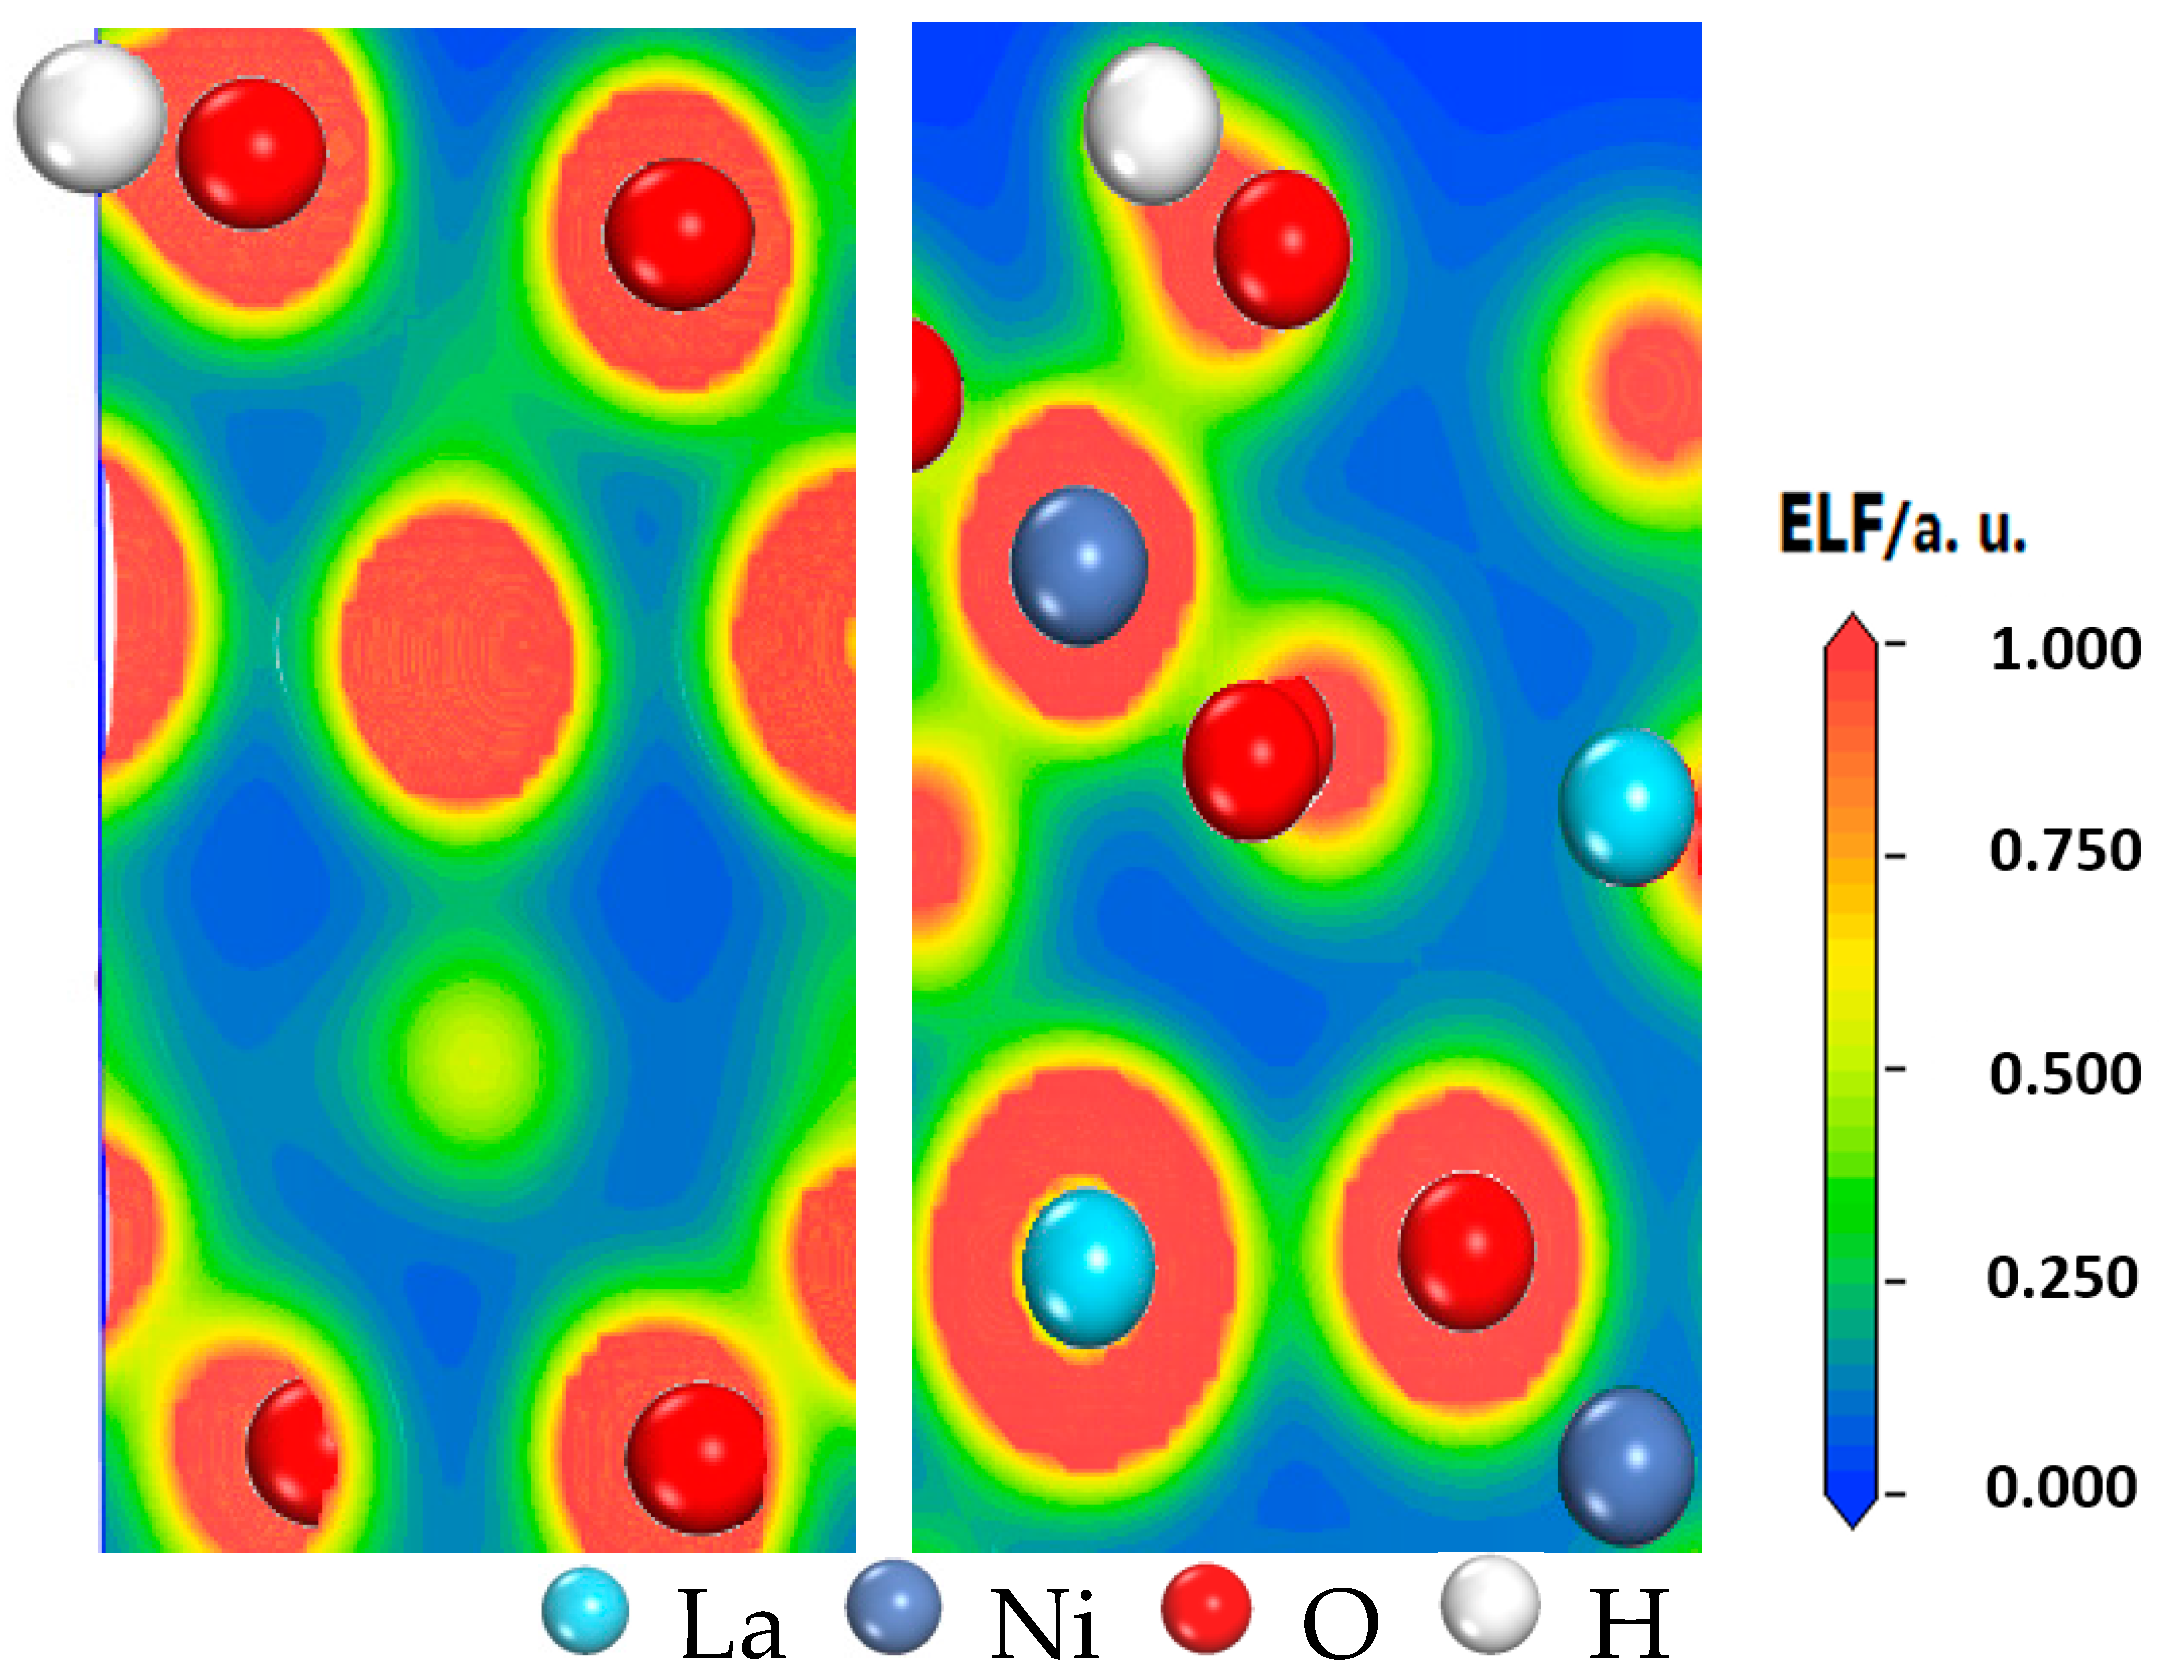
3.4. Analysis of Electron Localization Function

The electron localization function (ELF) is a tool for discussing charge transfer. Becke and Edgecombe [42] proposed a method for calculating local electron distribution, which is signified by graphs. This method analyzes electrons near the nuclear area, combination bonding area and the lone pair electrons of a system, and then further analyzes the characteristics and types of chemical bonds [43]. In Figure 4, the electron density distribution of H–O on B3 is shown; here, highly localized electrons show the strongest covalent bond on ELF = 1, (red parts), a metallic bond on ELF = 0.5 and stronger ionic bonding on 0 ≤ ELF < 0.5 [43]. As shown, the electron density is intense between H and O and is clearly biased toward the O atom, which indicates that H loses an electron and O gains an electron so that their effective charges are positive and negative, respectively. Furthermore, an electron density overlap clearly exists between H and O, and H–O is in the red area. Thus, the H–O bond is a typical covalent bond, which is consistent with the previous discussion of charge population.

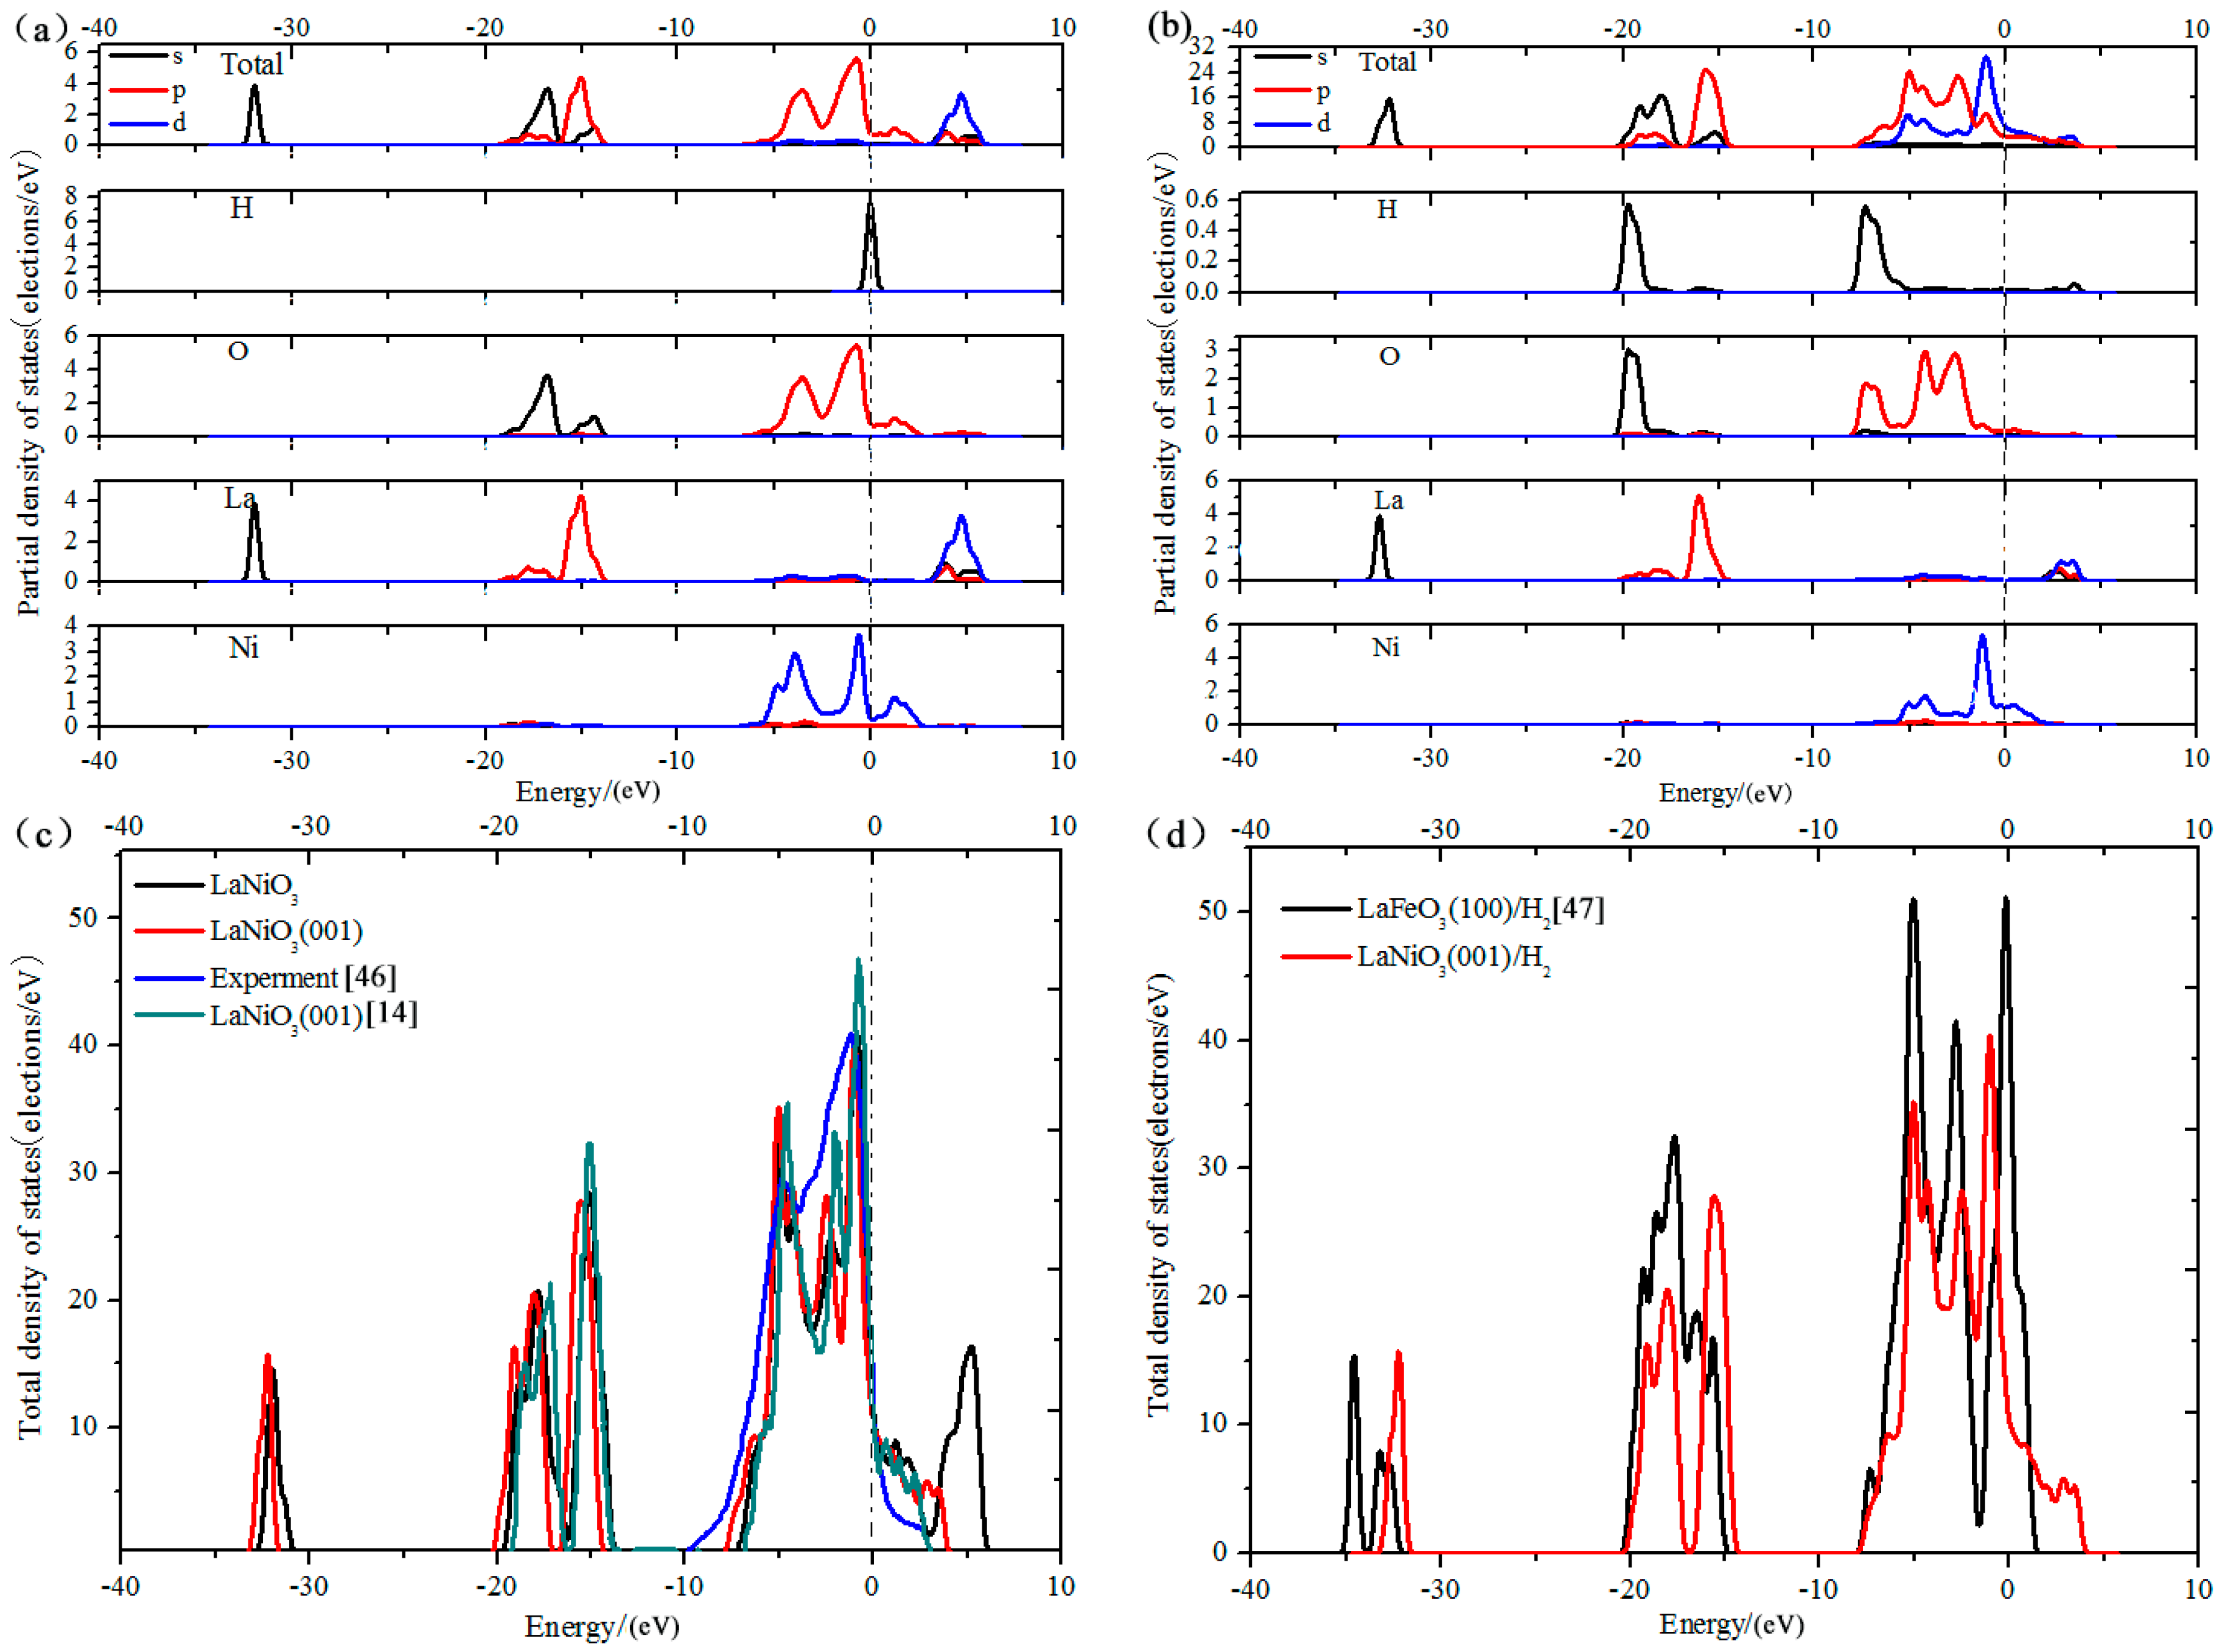
3.5. Analysis of Density of States

Density of states (DOS) reflects the number of states for the unit energy, and is important for analyzing bonding among atoms and material properties. Therefore, the analysis of DOS can further the understanding of the interaction of H and surface atoms. The total and partial DOS of LaNiO3(001)/H2 are shown in Figure 5, where an energy of zero corresponds to the Fermi level. Figure 5a presents the DOS prior to adsorption, and it can be observed that there is no band gap near the Fermi level. Consequently, it indicates metal properties and the highest occupied state of the surface occurs in the range of −6 to 2.5 eV—mainly due to the O 2p and Ni 3d orbits—which is principally similar to the conclusion of Guan et al. [14] who stated “there is no band gap in the LaNiO3(001) surface and the highest occupied state of the surface is from O 2p and Ni 3d orbits”.
Lee et al. [44] and Sarma et al. [45] reached the same conclusion. Sarma et al. [45] reported electronic structure calculations of the perovskite oxides LaMO3 (M = Ti to Ni) using the tight-binding linear-muffin tin-orbital method. When a H2 molecule is inserted on the (001) surface, significant changes occurred in the total and partial states of each atom, as shown in Figure 5b. Consequently, the DOS of H was highly dispersed and the highest occupied state moved slightly toward a deep level. This illustrates that an interaction exists between H and the surface. Moreover, the energy levels of the H 1s and O 2p orbitals are broadened in the DOS, which indicates that the interaction of H and the crystal face originates from the H and O atoms of the surface. In addition, the H 1s and O 2p orbitals overlap, and the existence of an apparent resonance after adsorption shows a covalent bond between H and O. The atomic Mulliken charges and average overlap population for the H–O bond were also calculated to qualitatively analyze the mechanism of hydrogen storage, as listed in Table 4 and Table 5.
The conductivity of a material can be evaluated through its DOS. The theoretical calculation and experimental results [46] are in good agreement, and shown in Figure 5c. The results indicate that bands overlap with each other, which indicates good electrical conductivity before and after adsorption. For LaNiO3(001)/H2, the width of the conduction band decreases approximately 2.2 eV and the state density of the electron moves to a lower level. Furthermore, the DOS peaks strengthen near the Fermi level where the chance of obtaining an electron increases, and indicates that the electrical conductivity of the LaNiO3(001)/H2 system strengthens after adsorption. This result is due to the electronic contribution of H 1s and O 2p orbitals, which enhances electron orbital hybridization and rearranges the distribution of electron density. In addition, Figure 5 presents a comparison of the total DOS of LaNiO3 and LaFeO3 [47]. As shown, the conduction band of the LaNiO3(001)/H2 system is larger, and there is a flat area near the Fermi level and an obvious peak across the Fermi energy level, compared to the lack of peak across the Fermi level for the LaFeO3(100)/H2 system. The conductivity calculated by Deng et al. [1] is LaNiO3 > LaCoO3 > LaCrO3 > LaFeO3; whereas when a H2 molecule is inserted in the system, the calculated conductivity of LaNiO3(001)/H2 is better than that of the LaFeO3(100)/H2 system.

4. Conclusions

The calculated surface energy indicated that the LaNiO3(001) surface was the most stable surface. Subsequently, the adsorption of H2 on this surface was calculated and analyzed. The conclusions are summarized as follows:
Three types of adsorption were found on the surface. First, H2 was placed on the top of O (T1, T2, and T3), where the optimization results revealed that the H2 molecules were dissociated and that the H atoms tended to bond at the tops of two O atoms, thus forming two –OH at these sites. Second, H2 was located on the O bridge (B1, B2, B3, and B4), and results indicated that H atoms tended to bond to the same O and form one H2O molecule. In the above two ways, H2 was primarily adsorbed via chemical adsorption. Finally, there were also some physical adsorption sites, for example, the top of La (T4).
On T3, the interaction for the formation of H2O and the (001) surface was weaker. Thus, H2O was easy to separate from the surface and generate O vacancies according to the analysis of atomic and bond populations before and after adsorption on T3.
Based on the analysis of the electronic structure of LaNiO3(001)/H2 on B3, the H2 molecule completely dissociated and formed –OH with the O atom from the surface, and was followed by the interaction of H and the surface, which mainly originated from the contribution of H 1s and O 2p orbitals. H–O was found to be a typical covalent bond.
There was no band gap, and the contribution of the highest occupied state was from O 2p and Ni 3d orbitals. The conductivity of the LaNiO3(001) system was stronger after adsorption, according to the analysis of the total DOS for the (001) surface before and after adsorption. Additionally, the conductivity of the LaNiO3/H2 system was better than that of the LaFeO3/H2 system based on the comparison of their total DOS.

Acknowledgments

The authors gratefully acknowledge the financial support from the National Natural Science Foundation of China (51562022), the fund of the State Key Laboratory of Advanced Processing and Recycling of Non-ferrous Metals, Lanzhou University of Technology (SKLAB02014004), the Basic Scientific Research Foundation for Gansu Universities of China (05-0342), the Science and Technology Project of Lanzhou City (2011-1-10), and the Special Program for Applied Research on Super Computation of the NSFC-Guangdong Joint Fund (the second phase).

Author Contributions

Yuhong Chen designed the project, Changchang Pan and Na Wu performed the calculations, Yuhong Chen and Changchang Pan prepared the manuscript, Cairong Zhang revised the paper, Meiling Zhang and Lihua Yuan analyzed the data, and all authors discussed the results and commented on the manuscript.

Conflicts of Interest

The authors declare no conflict of interest.

References

  1. Deng, G.; Chen, Y.; Tao, M.; Wu, C.; Shen, X.; Yang, H.; Liu, M. Electrochemical properties and hydrogen storage mechanism of perovskite-type oxide LaFeO3 as a negative electrode for Ni/MH batteries. Electrochim. Acta 2010, 55, 1120–1124. [Google Scholar] [CrossRef]
  2. Luo, B.C.; Wang, X.H.; Tian, E.; Wu, L.W.; Li, L.T. First-principles effective Hamiltonian simulation of ABO3-type perovskite ferroelectrics for energy storage application. J. Appl. Phys. 2016, 120, 074106. [Google Scholar] [CrossRef]
  3. Wang, Q.; Chen, Z.; Chen, Y.; Cheng, N.; Hui, Q. Hydrogen storage in perovskite-type oxides ABO3 for Ni/MH battery applications: A density functional investigation. Ind. Eng. Chem. Res. 2012, 51, 11821–11827. [Google Scholar] [CrossRef]
  4. Wærnhus, I.; Grande, T.; Wiik, K. Electronic properties of polycrystalline LaFeO3. Part II: Defect modelling including Schottky defects. Solid State Ion. 2005, 176, 2609–2616. [Google Scholar] [CrossRef]
  5. Hansmann, P.; Yang, X.; Toschi, A.; Khaliullin, G.; Andersen, O.K.; Held, K. Turning a nickelate Fermi surface into a cupratelike one through heterostructuring. Phys. Rev. Lett. 2009, 103, 016401. [Google Scholar] [CrossRef] [PubMed]
  6. Son, J.; Moetakef, P.; LeBeau, J.M.; Ouellette, D.; Balents, L.; Allen, S.J.; Stemmer, S. Low-dimensional Mott material: Transport in ultrathin epitaxial LaNiO3 films. Appl. Phys. Lett. 2010, 96, 062114. [Google Scholar] [CrossRef]
  7. Boris, A.V.; Matiks, Y.; Benckiser, E.; Frano, A.; Popovich, P.; Hinkov, V.; Wochner, P.; Castro-Colin, M.; Detemple, E.; Malik, V.K.; et al. Dimensionality control of electronic phase transitions in nickel-oxide superlattices. Science 2011, 332, 937–940. [Google Scholar] [CrossRef] [PubMed]
  8. Bao, D.; Mizutani, N.; Yao, X.; Zhang, L. Structural, dielectric, and ferroelectric properties of compositionally graded (Pb, La) TiO3 thin films with conductive LaNiO3 bottom electrodes. Appl. Phys. Lett. 2000, 77, 1041–1043. [Google Scholar] [CrossRef]
  9. Kleperis, J.; Wójcik, G.; Czerwinski, A.; Skowronski, J.; Kopczyk, M.; Beltowska-Brzezinska, M. Electrochemical behavior of metal hydrides. J. Solid State Electrochem. 2001, 5, 229–249. [Google Scholar] [CrossRef]
  10. Hsiao, C.; Qi, X. Substrate-dependant chemical stability and conductivity of LaNiO3-Χ thin films. Thin Solid Films 2013, 529, 356–359. [Google Scholar] [CrossRef]
  11. Kamble, R.B.; Tanty, N.; Patra, A.; Prasad, V. Field emission properties and strong localization effect in conduction mechanism of nanostructured perovskite LaNiO3. Appl. Phys. Lett. 2016, 109, 083102. [Google Scholar] [CrossRef]
  12. Tietz, F.; Raj, I.A.; Ma, Q.; Baumann, S.; Mahmoud, A.; Hermann, R.P. Material properties of perovskites in the Quasi-Ternary system LaFeO3–LaCoO3–LaNiO3. J. Sol. St. Chem. 2016, 237, 183–191. [Google Scholar] [CrossRef]
  13. Kohn, W.; Becke, A.D.; Parr, R.G. Density functional theory of electronic structure. J. Phys. Chem. 1996, 100, 12974–12980. [Google Scholar] [CrossRef]
  14. Guan, L.; Liu, B.; Jin, L.; Guo, J.; Zhao, Q.; Wang, Y.; Fu, G. Electronic structure and optical properties of LaNiO3: First-principles calculations. Solid State Commun. 2010, 150, 2011–2014. [Google Scholar] [CrossRef]
  15. Guan, L.; Zuo, J.; Jia, G.; Liu, Q.; Wei, W.; Guo, J.; Dai, X.; Liu, B.; Wang, Y.; Fu, G. Structural stability and electronic properties of LaO- and NiO2-terminated LaNiO3(001) surface. Appl. Surf. Sci. 2013, 264, 570–573. [Google Scholar] [CrossRef]
  16. Zhu, M.W.; Wang, H.L.; Lei, H.; Zhang, Y.J.; Jia, N.; Wang, Z.J. Strain-induced modification in microstructure and electrical properties of polycrystalline LaNiO3-δ films. Appl. Phys. A 2016, 122, 364. [Google Scholar] [CrossRef]
  17. Amoresi, R.A.C.; Felix, A.A.; Lustosa, G.M.M.M.; Gasparotto, G.; Simões, A.Z.; Zaghete, M.A. Role of morphological characteristics on the conductive behavior of LaNiO3 thin films. Ceram. Int. 2016, 42, 16242–16247. [Google Scholar] [CrossRef]
  18. Forslund, R.P.; Mefford, J.T.; Hardin, W.G.; Alexander, C.T.; Johnston, K.P.; Stevenson, K.J. Nanostructured LaNiO3 perovskite electrocatalyst for enhanced urea oxidation. ACS Catal. 2016, 6, 5044–5051. [Google Scholar] [CrossRef]
  19. Segall, M.D.; Lindan, P.J.D.; Probert, M.J.; Pickard, C.J.; Hasnip, P.J.; Clark, S.J.; Payne, M.C. First-principles simulation: Ideas, illustrations and the CASTEP code. J. Phys. Condens. Matter 2002, 14, 2717–2744. [Google Scholar] [CrossRef]
  20. Perdew, J.P.; Burke, K.; Ernzerhof, M. Generalized gradient approximation made simple. Phys. Rev. Lett. 1996, 77, 3865–3868. [Google Scholar] [CrossRef] [PubMed]
  21. Vanderbilt, D. Soft self-consistent pseudopotentials in a generalized eigenvalue formalism. Phys. Rev. B 1990, 41, 7892–7895. [Google Scholar] [CrossRef]
  22. Park, J.; Kim, D.; Byeon, S.; Kim, D. XANES study on Ruddlesden-Popper phase, Lan+1NinO3n+1(n = 1, 2 and ∞). J. Synchrotron Rad. 2001, 8, 704–706. [Google Scholar] [CrossRef]
  23. Chiou, W.C., Jr.; Carter, E.A. Structure and stability of Fe3C-cementite surfaces from first principles. Surf. Sci. 2003, 530, 87–100. [Google Scholar] [CrossRef]
  24. Choi, Y.; Mebane, D.S.; Lin, M.C.; Liu, M. Oxygen reduction on LaMnO3-based cathode materials in solid oxide fuel cells. Chem. Mater. 2007, 19, 1690–1699. [Google Scholar] [CrossRef]
  25. Evarestov, R.A.; Kotomin, E.A.; Mastrikov, Y.A.; Gryaznov, D.; Heifets, E.; Maier, J. Comparative density-functional LCAO and plane-wave calculations of LaMO3 surface. Phys. Rev. B 2005, 72, 214411. [Google Scholar] [CrossRef]
  26. Chen, Y.H.; Zhang, B.W.; Yang, L.; Zhang, M.L.; Zhang, C.R.; Kang, L.; Luo, Y.C. First-principle study of H2 adsorption on LaFeO3(110) surface. J. Nanomaterials 2014, 2014, 758985. [Google Scholar]
  27. Kresse, G.; Hafner, J. First-principles study of the adsorption of atomic H on Ni(111), (100) and (110). Surf. Sci. 2000, 459, 287–302. [Google Scholar] [CrossRef]
  28. Huda, M.N.; Ray, A.K. An Ab initio study of H2 interaction with the Pu(100) surface. Phys. B Condens. Matter 2005, 366, 95–109. [Google Scholar] [CrossRef]
  29. Lie, G.C.; Clementi, E. Molecular-dynamics simulation of liquid water with an Ab Initio flexible water-water interaction potential. Phys. Rev. A 1986, 33, 2679–2693. [Google Scholar] [CrossRef]
  30. Chen, Y.H.; Zhang, B.W.; Zhang, C.R.; Zhang, M.L.; Long, K.; Luo, Y.C. First-principle study of H2 adsorption on Mg3N2(110) surface. Phys. Lett. 2014, 31, 063101. (In Chinese) [Google Scholar]
  31. Kubas, A.; Berger, D.; Oberhofer, H.; Maganas, D.; Reuter, K.; Neese, F. Surface adsorption energetics studied with “Gold Standard” wave-function-based Ab initio methods: Small-molecule binding to TiO2(110). J. Phys. Chem. Lett. 2016, 7, 4207–4212. [Google Scholar] [CrossRef] [PubMed]
  32. Tamijani, A.A.; Salam, A.; de Lara-Castells, M.P. Adsorption of noble-gas atoms on the TiO2(110) surface: An Ab initio-assisted study with van der Waals-corrected DFT. J. Phys. Chem. C 2016, 120, 18126–18139. [Google Scholar] [CrossRef]
  33. Grimme, S.; Hansen, A.; Brandenburg, J.G.; Bannwarth, C. Dispersion-corrected mean-field electronic structure methods. Chem. Rev. 2016, 116, 5105–5154. [Google Scholar] [CrossRef] [PubMed]
  34. Lee, Y.L.; Morgan, D.; Kleis, J.; Rossmeisl, J. Ab initio defect energetics in LaBO3 perovskite solid oxide fuel cell materials. ECS Trans. 2009, 25, 2761–2767. [Google Scholar]
  35. Wang, L.; Maxisch, T.; Ceder, G. Oxidation energies of transition metal oxides within the GGA+U framework. Phys. Rev. B 2006, 73, 195107. [Google Scholar] [CrossRef]
  36. Rodriguez, J.A.; Hanson, J.C.; Frenkel, A.I.; Kim, J.Y.; Pérez, M. Experimental and theoretical studies on the reaction of H2 with NiO: Role of O vacancies and mechanism for oxide reduction. J. Am. Chem. Soc. 2002, 124, 346–354. [Google Scholar] [CrossRef] [PubMed]
  37. Li, B.; Bao, S.N.; Zhuang, Y.Y. The geometric structure of ethylene adsorption on Ni(110) surface. J. Phys. 2003, 52, 202–207. (In Chinese) [Google Scholar]
  38. Guo, X.J.; Li, L.; Liu, Z.Y.; Yu, D.L. Hardness of covalent compounds: Roles of metallic component and d valence electrons. J. Appl. Phys. 2008, 104, 023503. [Google Scholar] [CrossRef]
  39. Kong, X.P.; Wang, J. Copper(II) adsorption on the kaolinite(001) surface: Insights from first-principles calculations and molecular dynamics simulations. Appl. Surf. Sci. 2016, 389, 316–323. [Google Scholar] [CrossRef]
  40. Cao, Y.; Zhu, P.X.; Zhu, J.C.; Liu, Y. First-principles study of NiAl alloyed with Co. Comput. Mater. Sci. 2016, 111, 34–40. [Google Scholar] [CrossRef]
  41. Ding, S.S.; Huang, W.Q.; Yang, Y.C.; Zhou, B.X.; Hu, W.Y.; Long, M.Q. Dual role of monolayer MoS2 in enhanced photocatalytic performance of hybrid MoS2/SnO2 nanocomposite. J. Appl. Phys. 2016, 119, 205704. [Google Scholar] [CrossRef]
  42. Becke, A.D.; Edgecombe, K.E. A simple measure of electron localization in atomic and molecular systems. J. Chem. Phys. 1990, 92, 5397–5403. [Google Scholar] [CrossRef]
  43. Burdett, J.K.; McCormick, T.A. Electron localization in molecules and solids: The meaning of ELF. J. Phys. Chem. A 1998, 102, 6366–6372. [Google Scholar] [CrossRef]
  44. Lee, S.; Chen, R.; Balents, L. Metal-insulator transition in a two-band model for the perovskite nickelates. Phys. Rev. B 2011, 84, 165119. [Google Scholar] [CrossRef]
  45. Sarma, D.D.; Shanthi, N.; Barman, S.R.; Hamada, N.; Sawada, H.; Terakura, K. Band theory for ground-state properties and excitation spectra of perovskite LaMO3 (M = Mn, Fe, Co, Ni). Phys. Rev. Lett. 1995, 75, 1126–1129. [Google Scholar] [CrossRef] [PubMed]
  46. Hu, Z.G.; Li, W.W.; Li, Y.W.; Zhu, M.; Zhu, Z.Q.; Chu, J.H. Electronic properties of nanocrystalline LaNiO3 and La0.5Sr0.5CoO3 conductive films grown on silicon substrates determined by infrared to ultraviolet reflectance spectra. Appl. Phys. Lett. 2009, 94, 221104. [Google Scholar] [CrossRef]
  47. Lv, X.X. Hydrogen Storage Property Study of H2 Molecule Adsorption on LaFeO3 (100) Surfaces. Masters’ Dissertation, Lanzhou University of Technology, Lanzhou, China, 2012. [Google Scholar]
Figure 1. The models of the LaNiO3(001) surface. (a) The LaO-terminated LaNiO3(001) is Termination I; (b) The Ni-terminated LaNiO3(001) is Termination II; (c) The supercell of Termination I.
Materials 10 00036 g001
Figure 2. The initial adsorption positions for the LaNiO3(001)/H2 system in Termination I.
Materials 10 00036 g002
Figure 3. The optimized geometrical structure of LaNiO3(001)/H2 in Termination I.
Materials 10 00036 g003
Figure 4. Electron localization function of LaNiO3(001)/H2 on B3 after geometry optimization of the structure.
Materials 10 00036 g004
Figure 5. Total and partial densities of state of LaNiO3(001)/H2 on B3. (a) Density of states (DOS) before adsorption; (b) DOS after adsorption; (c) The theoretical calculation and experimental results [14,46]; (d) Comparison of total densities of state of LaNiO3 and LaFeO3 [47]. B3 represents the adsorption site of H2 molecule in the O–O Bridge.
Materials 10 00036 g005
Table 1. The calculated surface energies (eV/Å2) of different LaNiO3 surfaces.
Termination I (001)Termination II (001)(001) Ref. [15](110)(101)(011)(111)(100)(001)
1.971.842.034.232.255.046.616.106.67
Table 2. The calculated geometry and energy parameters of LaNiO3(001)/H2 after geometry optimization. The experimental values are also included [27,29].
TypeInitial Position (H2)rH–H (Å)rH–O (Å)rH–Ni (Å)rH–La (Å)Eads (eV)Edis (eV)
Model IT11.6781.0212.3684.367−1.4630.955
T21.6750.9952.2193.036−1.5170.965
T31.6360.9942.3592.919−2.0741.105
T40.7574.1535.3102.9510.0454.525
B13.1040.9822.2573.210−2.106−1.678
B22.9070.9832.6052.975−1.397−1.520
B33.0471.0033.0352.901−2.822−1.638
B42.8470.9922.9583.038−2.5930.017
V3.0610.9822.2503.225−2.816−1.648
Model IIT50.8783.2131.5866.482−0.3014.313
ExperimentH2O [29]1.5450.978----
H2 [27]0.752----4.48
Table 3. The calculated electron populations and bond populations of LaNiO3(001)/H2 on T3. T3 represents the adsorption site of H2 molecule in the O Top.
AtomElectron Population (e)BondBond Population (e)
Before AdsorptionAfter AdsorptionBefore AdsorptionAfter Adsorption
O1−0.64−0.72O3–Ni0.050.00
O2−0.64−0.72O3–La0.250.05
O3−0.64−0.81O1–O3−0.03−0.07
La1.471.34H1–O1-0.10
Ni0.560.40H2–O2-0.03
H1-0.37H2–O3-0.63
H2-0.34H1–O3-0.68
Table 4. Energy parameters of two types of chemical adsorption.
Adsorption SiteBarrier from Reactant (eV)Barrier from Product (eV)Energy of Reaction (eV)
T3−0.869−2.833−1.964
B3−1.282−3.789−2.507
Table 5. The calculated electron populations of LaNiO3(001)/H2 on B3.
AtomBefore Adsorption (e)After Adsorption (e)
spdChargespdCharge
O1.904.75-−0.641.874.91-−0.78
O1.904.75-−0.641.844.99-−0.83
La2.236.131.171.472.346.121.191.35
Ni0.400.688.570.300.400.668.660.28
H11.00---0.70--0.30
H21.00---0.67--0.33
Table 6. The calculated bond populations of LaNiO3(001)/H2 on B3 after adsorption.
BondPopulation (e)Length (Å)
Before AdsorptionAfter AdsorptionBefore AdsorptionAfter Adsorption
O1–Ni0.400.221.8322.168
O2–Ni0.410.311.8301.984
H2–O1-0.67-0.981
H1–O2-0.66-1.003
O1–La0.240.252.2472.504
O2–La0.250.252.7972.504
H2–Ni-–0.19-2.250

