Article

The Adsorption Capacity of GONs/CMC/Fe3O4 Magnetic Composite Microspheres and Applications for Purifying Dye Wastewater

1
College of Bioresources Chemical and Materials Engineering, Shaanxi University of Science and Technology, Xi’an 710021, China
2
College of Chemistry and Chemical Engineering, Shaanxi University of Science and Technology, Xi’an 710021, China
*
Author to whom correspondence should be addressed.
Materials 2017, 10(1), 58; https://doi.org/10.3390/ma10010058
Submission received: 7 December 2016 / Revised: 27 December 2016 / Accepted: 9 January 2017 / Published: 11 January 2017
(This article belongs to the Section Porous Materials)

Abstract

:
Graphene oxide nanosheets (GONs)/carboxymethyl chitosan (CMC)/Fe3O4 magnetic composite microspheres (MCMs) were prepared by enclosing Fe3O4 particles with CMC and GONs in turn. The microstructures of GONs and GONs/CMC/Fe3O4 MCMs were characterized by FTIR, XRD, TEM, and SEM. The effects of GON content, pH value, and adsorption time on the adsorption capacity of the MCMs were investigated. The results show that the GONs/CMC/Fe3O4 MCMs have a greater specific surface area and a strong adsorption capacity for dye wastewater. Meanwhile, the adsorption mechanism was investigated, and the results accorded with the pseudo-second-order kinetic model and the Freundlich isotherm model. The search results indicate that GONs/CMC/Fe3O4 MCMs can be used to purify dye wastewater and has an important potential use in the practical purification of dye wastewater.

Graphical Abstract

1. Introduction

Nowadays, the purification technology of wastewater containing dyes and metal ions has become a hot topic worldwide [1,2,3]. The reason is that the dyes and some metal ions such as Cr3+, Cr6+, Hg2+, and Pb2+ have high toxicity and are difficult to treat [4]. Several concurrent technologies are being developed for removing dyes and these metal ions from the wastewater: for example, adsorption, flocculation, membrane separation, biological degradation, reverse osmosis, and ion exchange [5,6,7,8,9]. Among these technologies, adsorption is the most suitable method for dye wastewater due to its high efficiency, low cost, and simple process technology [10]. Various traditional adsorbents, such as activated carbon [11], modified clay [12], kaolin [13], peanut hulls [14], and cashew nutshells [15], have been used previously for the removal of dyes from wastewater (Table 1). These adsorbents cannot be separated and recovered for recycling. Therefore, common drawbacks of these adsorbents include their low adsorption efficiency and non-recyclability, which limit their development and application. A fast removal rate and a greater adsorption capacity are required for treating dye wastewater. Therefore, the development of a new adsorbent with a high adsorption capacity and greater adaptability as well as extraordinary regenerative ability is urgent.
In recent years, carboxymethyl chitosan (CMC) has attracted extensive attention because of its potentially high adsorption capacity based on its positive amino groups and biodegradability [16,17,18,19]. However, the good degradation of CMC in water has limited its recyclability. Therefore, the key question is how to keep the best balance between adsorption capacity and recyclability. The usual way to do this is with different kinds of cross-linking agents. Formaldehyde [20], glutaraldehyde [21], epichlorohydrin [22], and adipic acid dihydrazide [23] have been used to form a crosslinking network with CMC to improve its water resistance and volume stability. However, this has not had a remarkable effect. Meanwhile, another problem is that these cross-linking agents themselves have toxicity and may produce new pollution in the use process. In order to significantly improve the adsorption and recyclability of CMC, we introduce here magnetic Fe3O4 particles and graphene oxide nanosheets (GONs) to form GONs/CMC/Fe3O4 magnetic composite microspheres (MCMs) to improve its adsorption capacity and regenerative ability. Magnetic Fe3O4 particles are introduced to easily separate the adsorbents from wastewater through its magnetic polarity. GONs are introduced to increase its adsorption capacity and volume stability by forming crosslinks on the surface of CMC/Fe3O4 MCMs as well as to improve its specific surface area and to provide more functional groups [24,25]. The research results indicate that GONs have a higher adsorption capacity for many materials such as dyes and the metal ions of Cu2+, Hg2+, Cr3+, Cr6+, and Pb2+ [26]. In this work, GONs/CMC/Fe3O4 MCMs were prepared and characterized. The main factors influencing the adsorption capacity of MCMs such as the GON content and pH value as well as the adsorption mechanism were investigated.

2. Experimental

2.1. Materials and Chemicals

Powdered graphite, concentrated sulfuric acid (H2SO4, 98%), potassium permanganate (KMnO4), hydrogen peroxide (H2O2, 30%), sodium hydroxide solution (40%), carboxymethyl chitosan (CMC), polyethylene glycol-400 (PEG), Fe3O4 particles, liquid paraffin, Span-80, Tween-80, glutaraldehyde, absolute ethyl alcohol, and acetone were all purchased from Xi’an Chemical Company Ltd. (Xi’an, China).

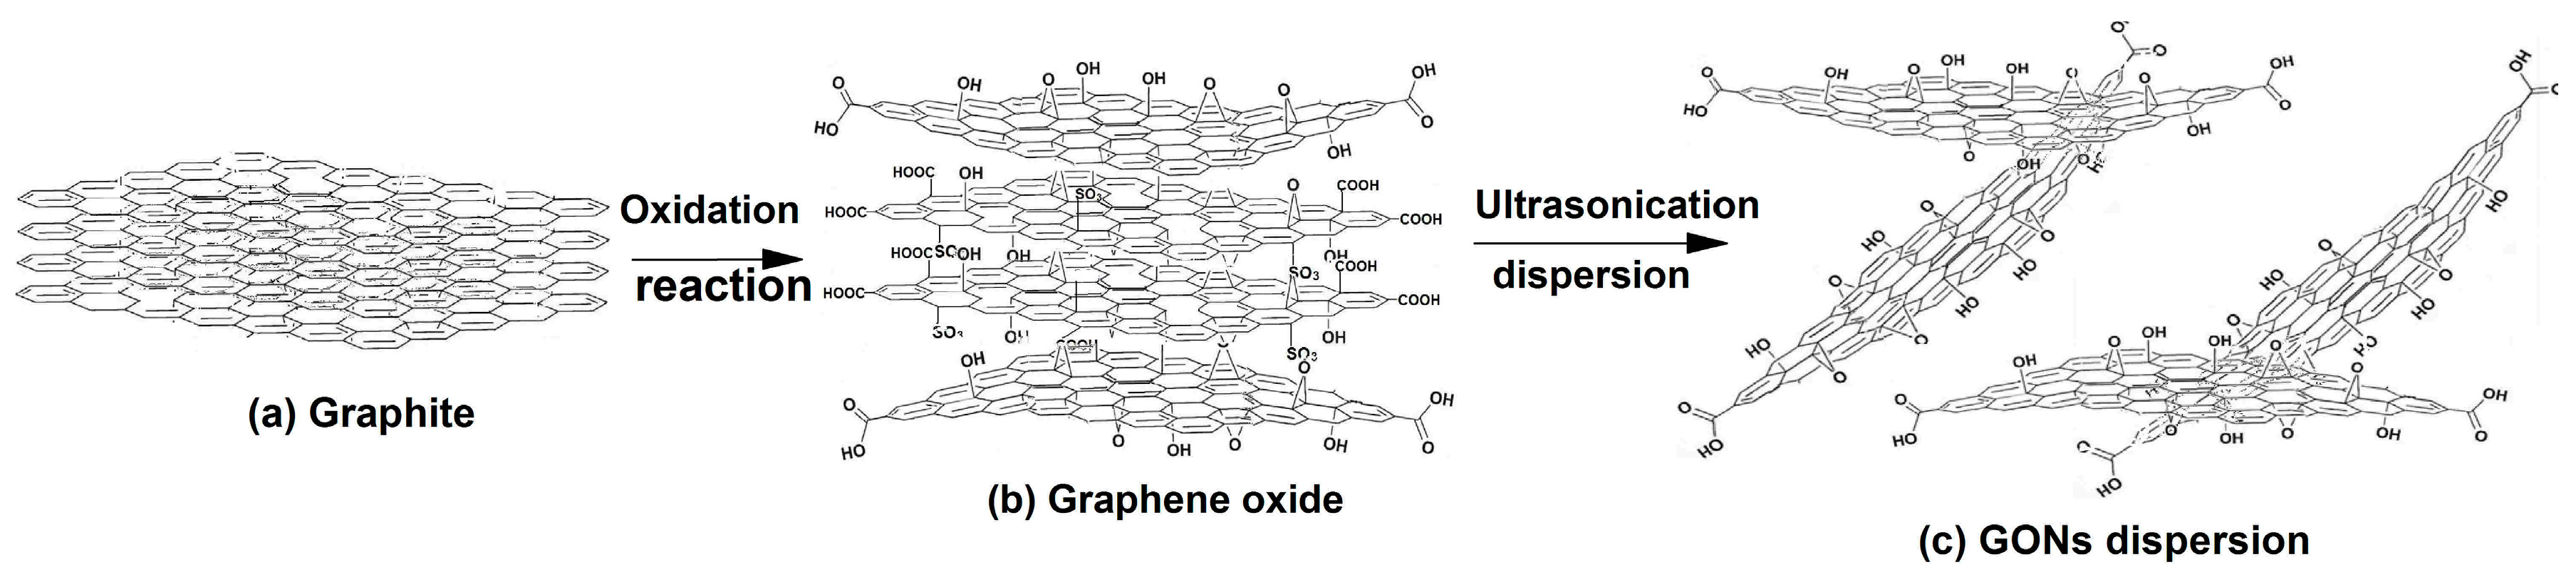
2.2. Preparation of GONs

Forty grams of H2SO4 and 1 g of graphite was placed into a 500 mL three-necked flask and kept at less than 5 °C. With continuous stirring, 6 g KMnO4 was slowly added to the flask within 1 h. After feeding KMnO4, the reaction was sequentially kept at 5 °C for 5 h, and 35 °C for 5 h in turn. Then, 120 g of deionized water was added to the flask and kept at 85 °C for 2 h. Then, about 200 mL of deionized water was added to the flask and kept at 40 °C, and then 7 g of H2O2 was added dropwise into the flask. At this moment, the color of the solution in the flask became bright yellow. The product was centrifuged and washed with deionized water repeatedly until the pH was about 6–7. Then, about 1000 mL of deionized water was added to the GO, which was then stirred and dispersed by ultrasonication at 1000 W for 1 h. A stable GON dispersion suspension was obtained. The GON concentration was adjusted as about 0.1% by controlling the water content. A schematic diagram of the preparation process of GONs is shown in Figure 1.

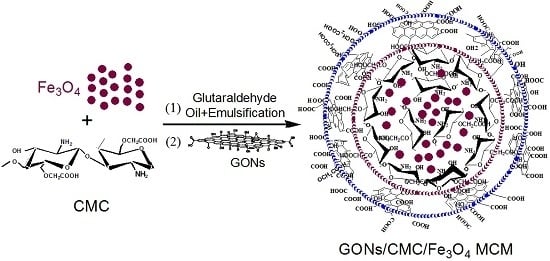
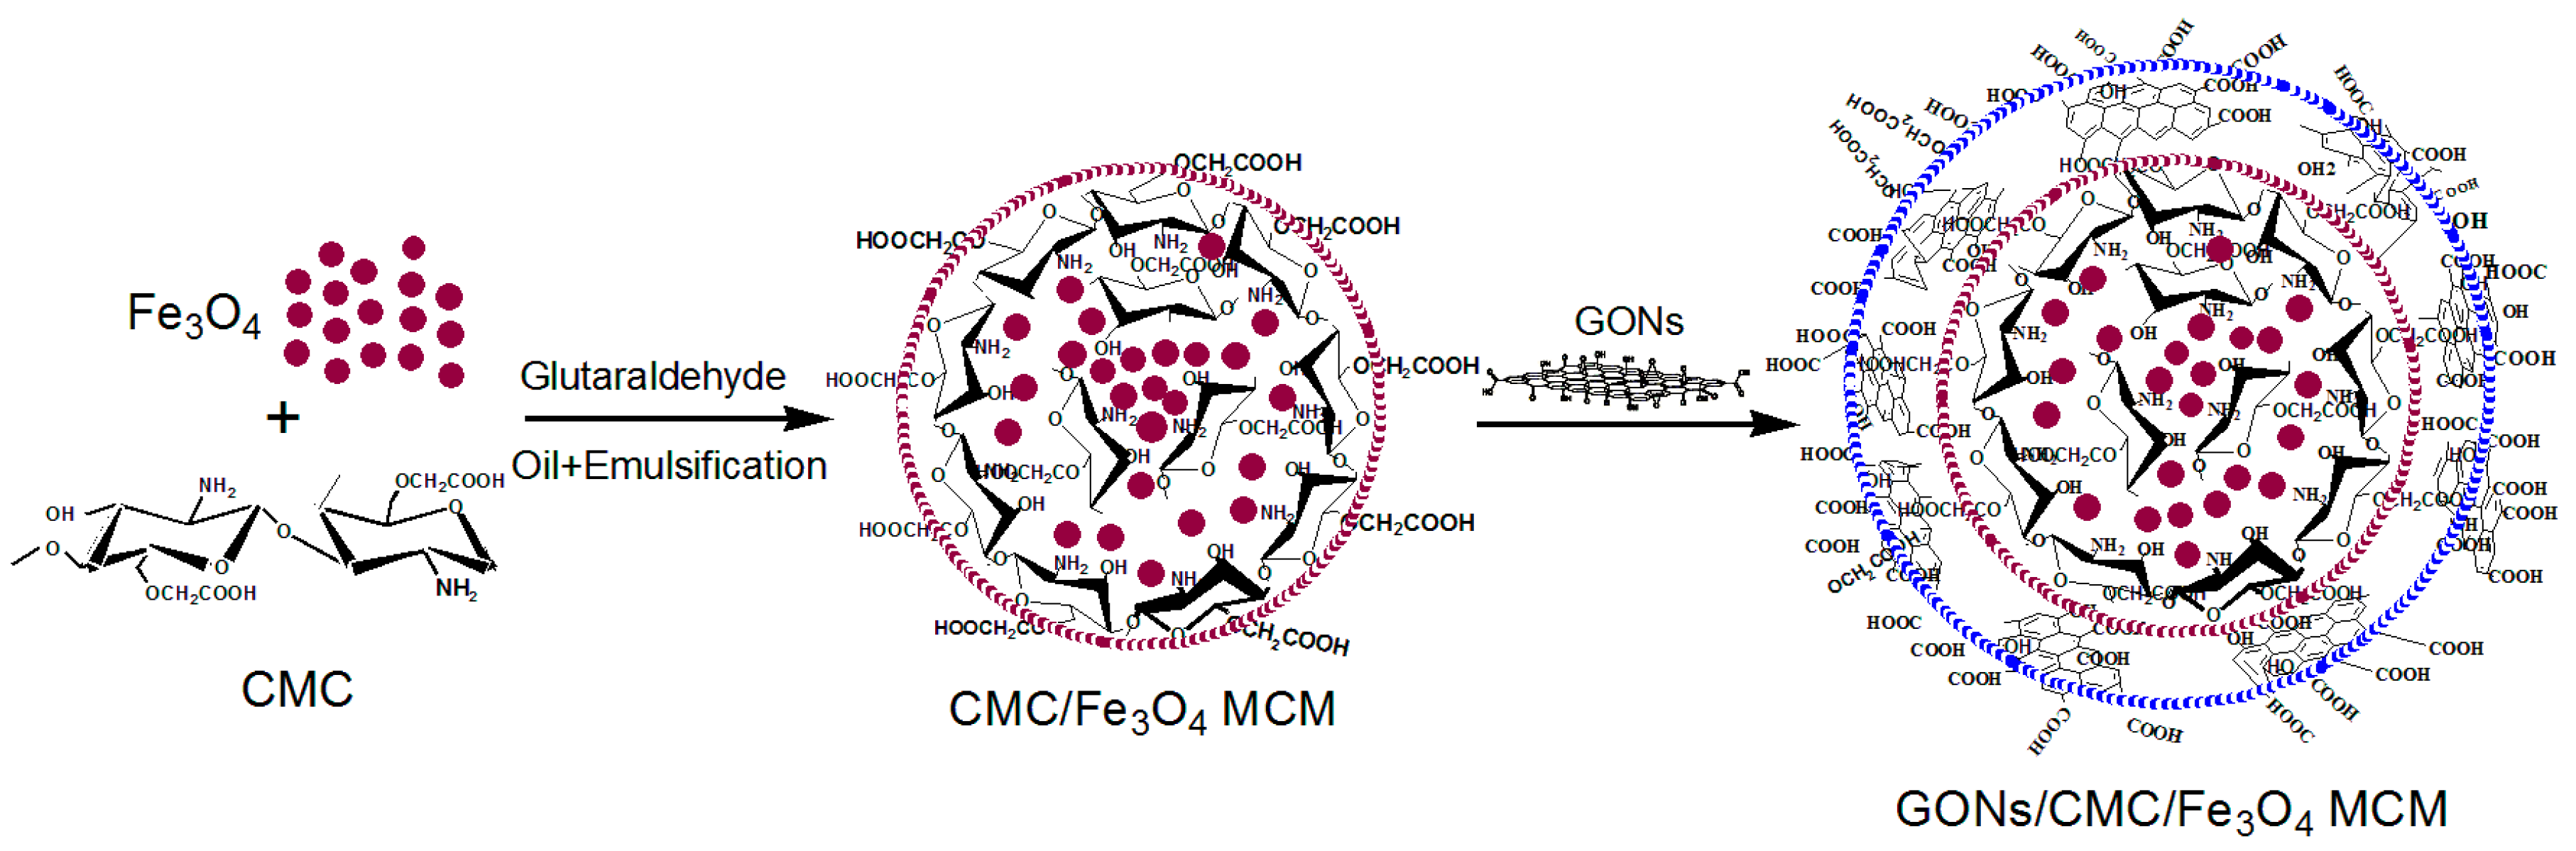
2.3. Preparation of GONs/CMC/Fe3O4 MCMs

We put 3 g of Fe3O4 particles and 3 g of PEG into 20 g of deionized water to achieve a uniform dispersion, which was then transferred under stirring into an oil phase that contained liquid paraffin, Span-80, and Tween-80. The controlled oil–water ratios were 1:1, 2:1, 3:1, 4:1, 5:1, and 6:1. The amount of oil phase consisted of liquid paraffin, Span-80, and Tween-80 with a mass ratio of 90:10. Then, 30 mL of 20% CMC solution (4 g of CMC solid content) was added and stirred for 30 min, and 2 g of glutaraldehyde was added at 40 °C and stirred for 2 h to prepare the CMC/Fe3O4 MCMs. Then, different amounts of GONs were added into the CMC/Fe3O4 MCMs. The GON solid dosages were 0.2 g, 0.4 g, 0.6 g, and 0.8 g. The final product was washed with ethanol and deionized water, and then dried in a vacuum oven at 60 °C. A schematic diagram of the preparation process of GONs/CMC/Fe3O4 MCMs is shown in Figure 2.

2.4. Investigation of Adsorption Capacity of GONs/CMC/Fe3O4 MCMs

2.4.1. Testing Data Processing Method

In this study, the experimental data were evaluated by the standard deviation. The standard deviation of tested data can be calculated by Equation (1).
S = ( x i x ¯ ) 2 N 1
where S is standard deviation (%), N is the total number of samples or all measurement times of each measurement point or sample, xi is a measurement of a sample, and x ¯ is the average value of all measurement of a texting point.

2.4.2. Adsorption Capacity and Affect Factors

The adsorption capacity is closely related to the adsorption conditions, such as adsorption time and pH value of the dye wastewater. For the research, the dye wastewater was replaced with a methyl orange aqueous solution at a concentration of 200 mg/L.
The effect of the pH value of the methyl orange solution on capacity was investigated by adjusting the pH values from 3 to 9 with 1 mol·L−1 HCl or NaOH dilute solution. The adsorption time was investigated by measuring the adsorption capacity at different times (from initial time to 270 min). The adsorption experiment was performed in an incubator shaker at an oscillation rate of 100 r/min. The methyl orange concentration was determined by a UV–Visible spectrophotometer at 464 nm before and after adsorption. The adsorption capacity was calculated based on Equation (2):
Q = ( C 0 C e ) V m
where Q (mg/g) is the adsorption capacity, C0 and Ce (mg/L) are the initial and final concentrations of methyl orange solution, respectively, V (L) is the volume of the aqueous solutions, and m (g) is the mass of the MCMs.

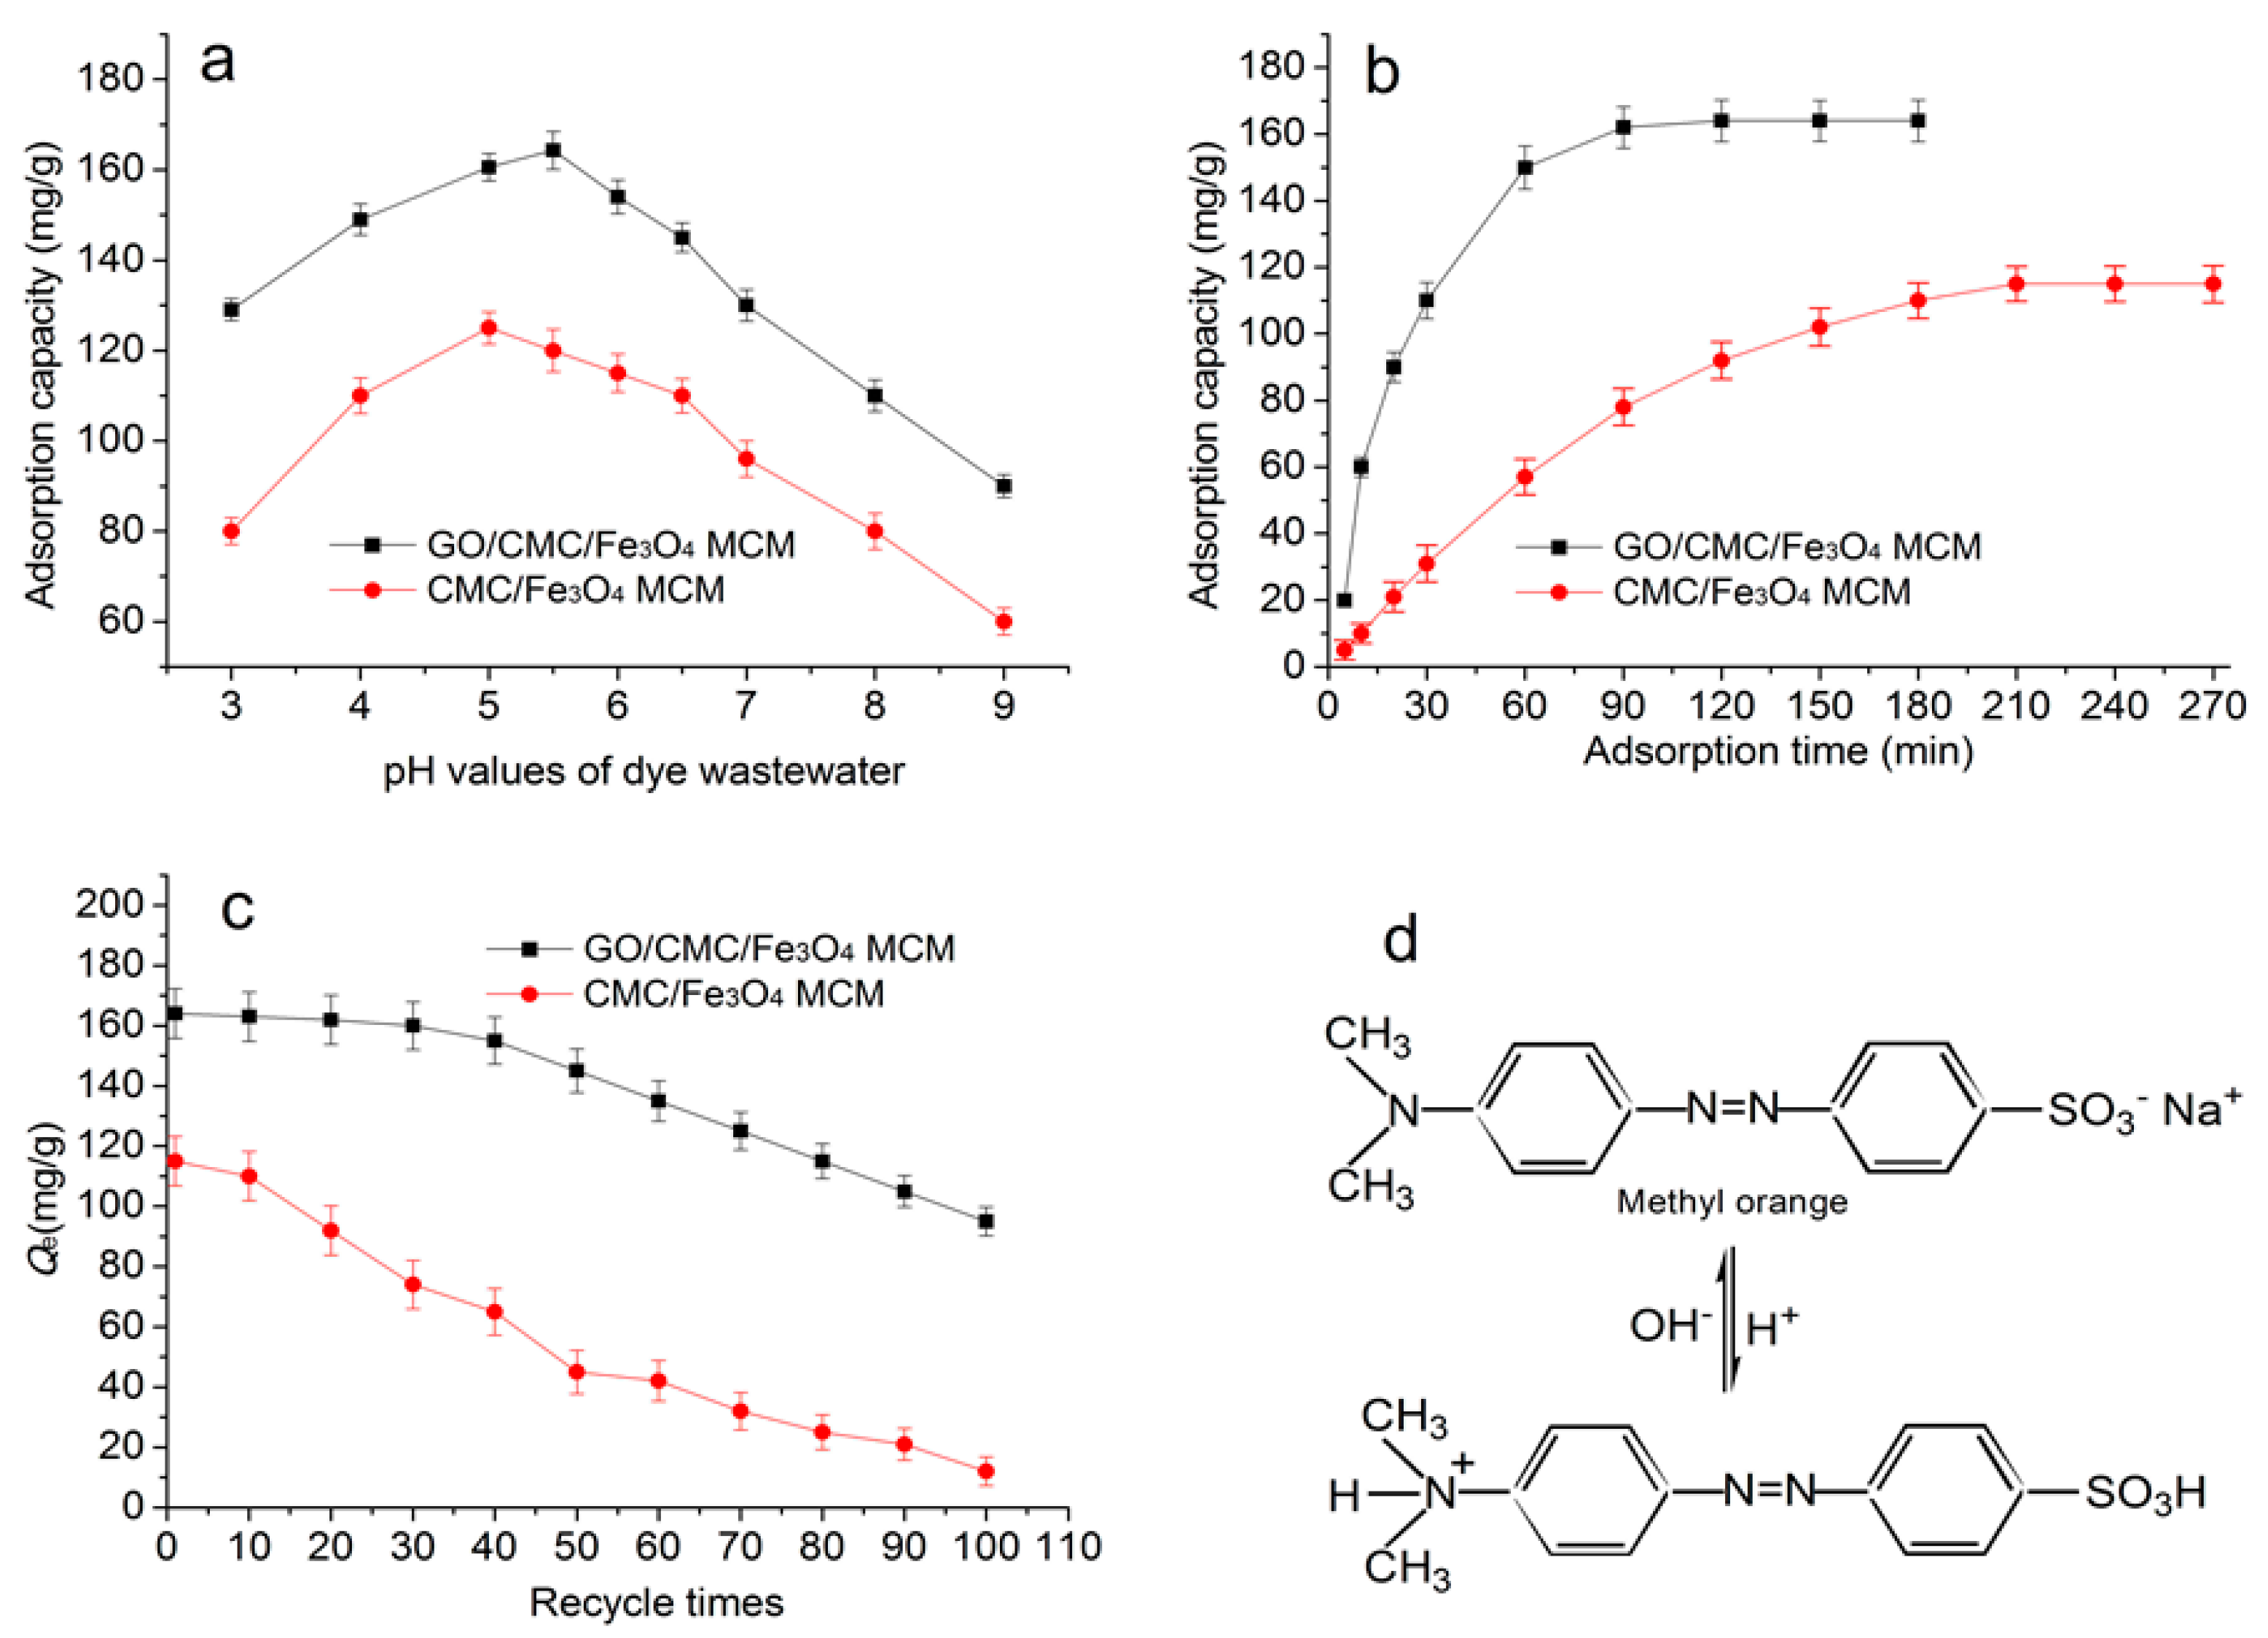
2.4.3. Regenerative Ability

The adsorption experiment was carried out under optimal adsorption process conditions. After the adsorption of dye saturated, the need for regeneration treatment for the MCMs. The regeneration process could be carried out by immersing the saturated MCMs in 6 mol·L−1 HCI solution until the adsorption capacity was restored. In fact, the adsorption capacity of MCMs are not likely to return to their original levels, and the decrease in adsorption capacity with regeneration times is inevitable. The cycle times is the regeneration times of the adsorption capacity decreased to about 100 mg/g, which can be used to characterize regenerative ability.

2.5. Investigation of Adsorption Mechanism

2.5.1. Adsorption Kinetics

Fifty milligrams of GONs/CMC/Fe3O4 MCMs were added to 50 mL of 200 mg/L methyl orange solution. The pH of the solution was adjusted to 5, and the adsorption process was conducted at 30 °C under stirring. The concentration of methyl orange was examined every half hour.

2.5.2. Adsorption Isotherms

Fifty milligrams of GONs/CMC/Fe3O4 MCMs were added to 50 mL of methyl orange solutions with initial concentration from 20 to 200 mg/L. The pH values of methyl orange solutions were adjusted to 5. The concentration of methyl orange was determined after 1 h.

2.6. Characterization Methods

The chemical structure of GONs was measured by Fourier-transform infrared spectroscopy (FTIR; EQUINOX-55, Bruker, Ettlingen, Germany) and X-ray photoelectron spectroscopy (XPS; XSAM 800, Kratos, Manchester, UK). The microstructure and the size of GONs were examined via atomic force microscopy (AFM; SPI3800N/SPA400, Seiko, Osaka, Japan) and with a laser particle analyzer (LPA; NANO-ZS90, Zetasizer, Worcestershire, UK). X-ray diffraction (XRD; D/max2200PC, Rigaku, Osaka, Japan) was used to examine the crystalline. The microstructures of the composites were determined with a scanning electron microscope (SEM; S-4800, Hitachi, Tokyo, Japan). The elemental compositions were determined with an energy-dispersive X-ray spectrometer (EDS) (EDAX, Cassatt, SC, USA), which was coupled with the S-4800 SEM. Hysteresis loops were acquired with a vibrating sample magnetometer (VSM, Lake Shore Cryotronics, Westerville, OH, USA). The pore structure of the MCMs was tested using an automatic mercury porosimeter (AMP; Autopore IV9500, Micromeritics, Norcross, GA, USA). The samples were weighed accurately, placed in an expansion joint and sealed, subjected to low pressure (0–30 MPa), reweighed, and then tested at high pressure (30–400 MPa).

3. Results and Discussion

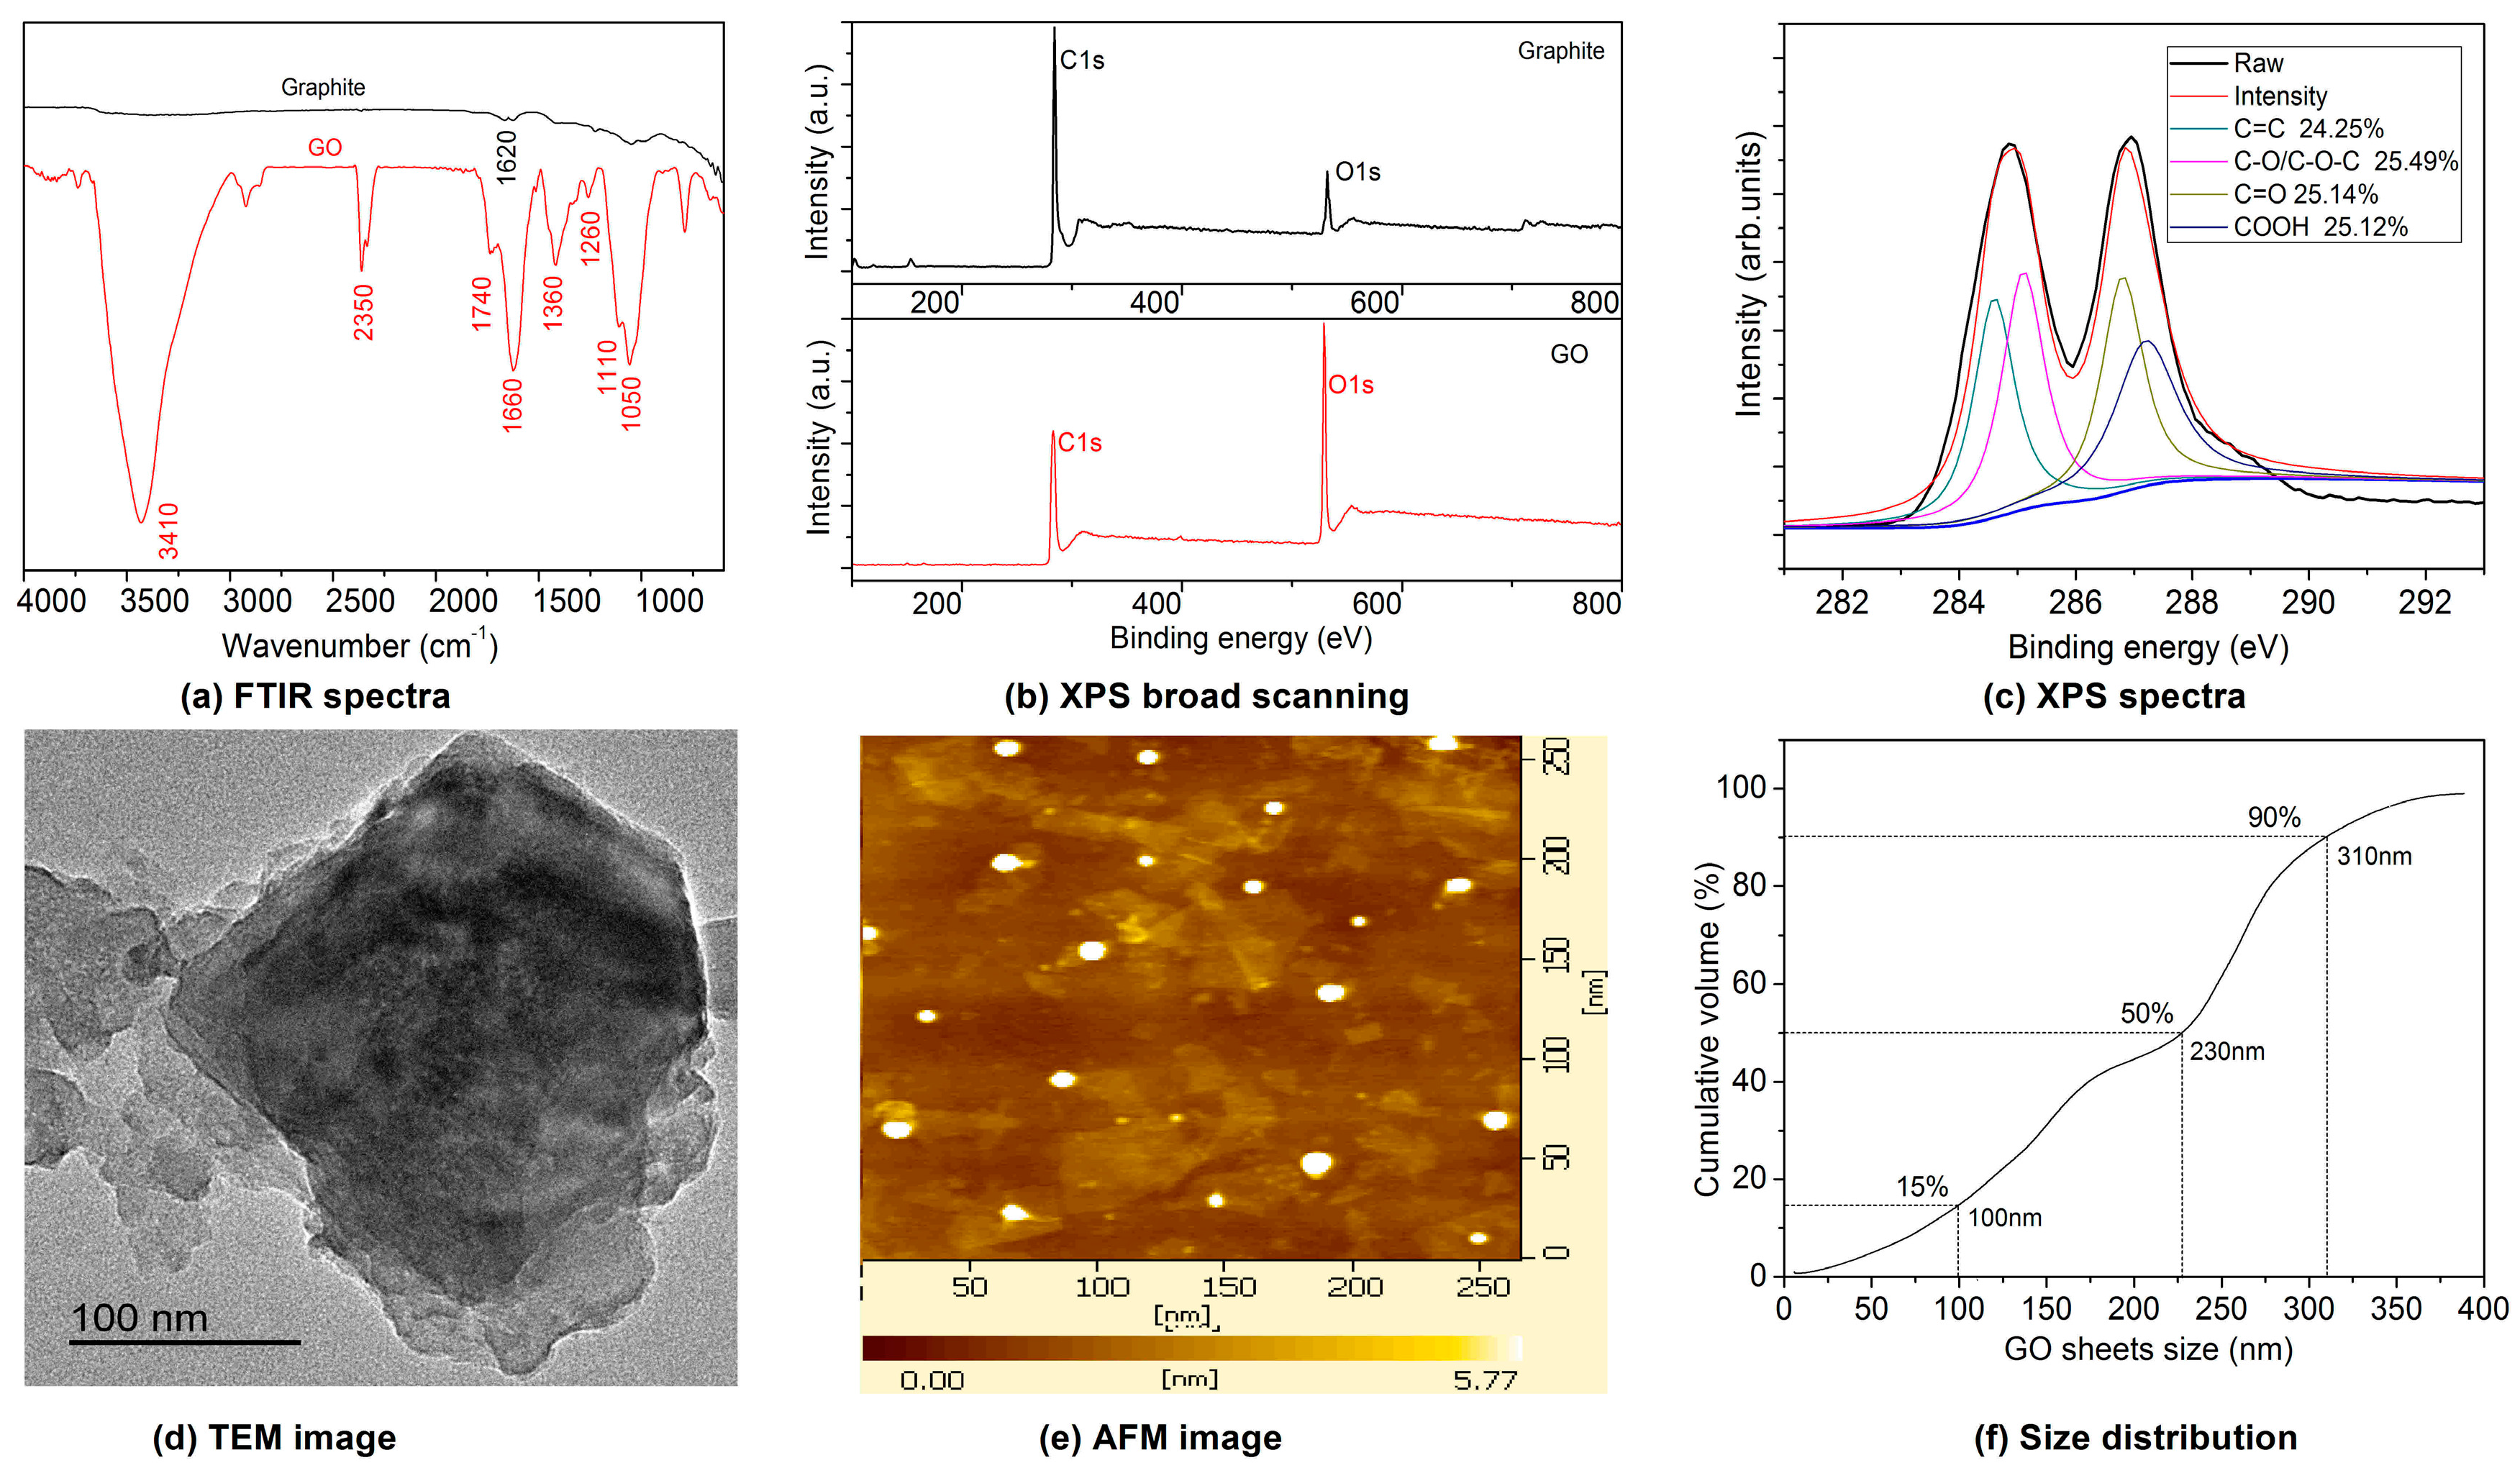
3.1. Structural Characterization of GONs

The structural of GONs were characterized by FTIR, XPS, TEM, AFM, and LPA, and the tested results are shown in Figure 3.
The FTIR spectra of GONs and graphite are shown in Figure 3a. The results indicate that the GONs contain hydroxyl groups (–OH, 3410 cm−1), carboxyl groups (COOH, 1740 cm−1), carbonyl groups (C=O, 1660 cm−1), and ether bonds (–C–O–C–, 1360, 1260, 1100, 1050 cm−1), which are not present on the FTIR spectra of graphite. The XPS spectra of GONs are shown in Figure 3b,c, indicating that the graphene oxide has a high oxygen content compared to graphite, and carbon bonds in GO were C=C, C–OH, C–O–C, C=O, and COOH with the proportion of 24.25%, 25.49%, 25.14%, and 25.12%, respectively. The results suggest that GONs contain hydroxyl, epoxy, carbonyl, and carboxyl groups compared with graphite. The TEM images of GONs are shown in Figure 3d, indicating that the GONs are subtransparent and suggesting that GONs are much thinner. AFM images of GONs are shown in Figure 3e. Statistical analysis shows that the average size of the GONs is in the range of 30–420 nm and the maximum thickness is 5.77 nm. The results show that GONs have reached nanometer sheets. Figure 3f shows the size distribution of GONs in an aqueous solution. The results show that the sizes of GONs are in the range of 10–380 nm. The results indicate that 90% of the GONs are smaller than 310 nm and 50% are smaller than 230 nm and 15% are less than 100 nm.

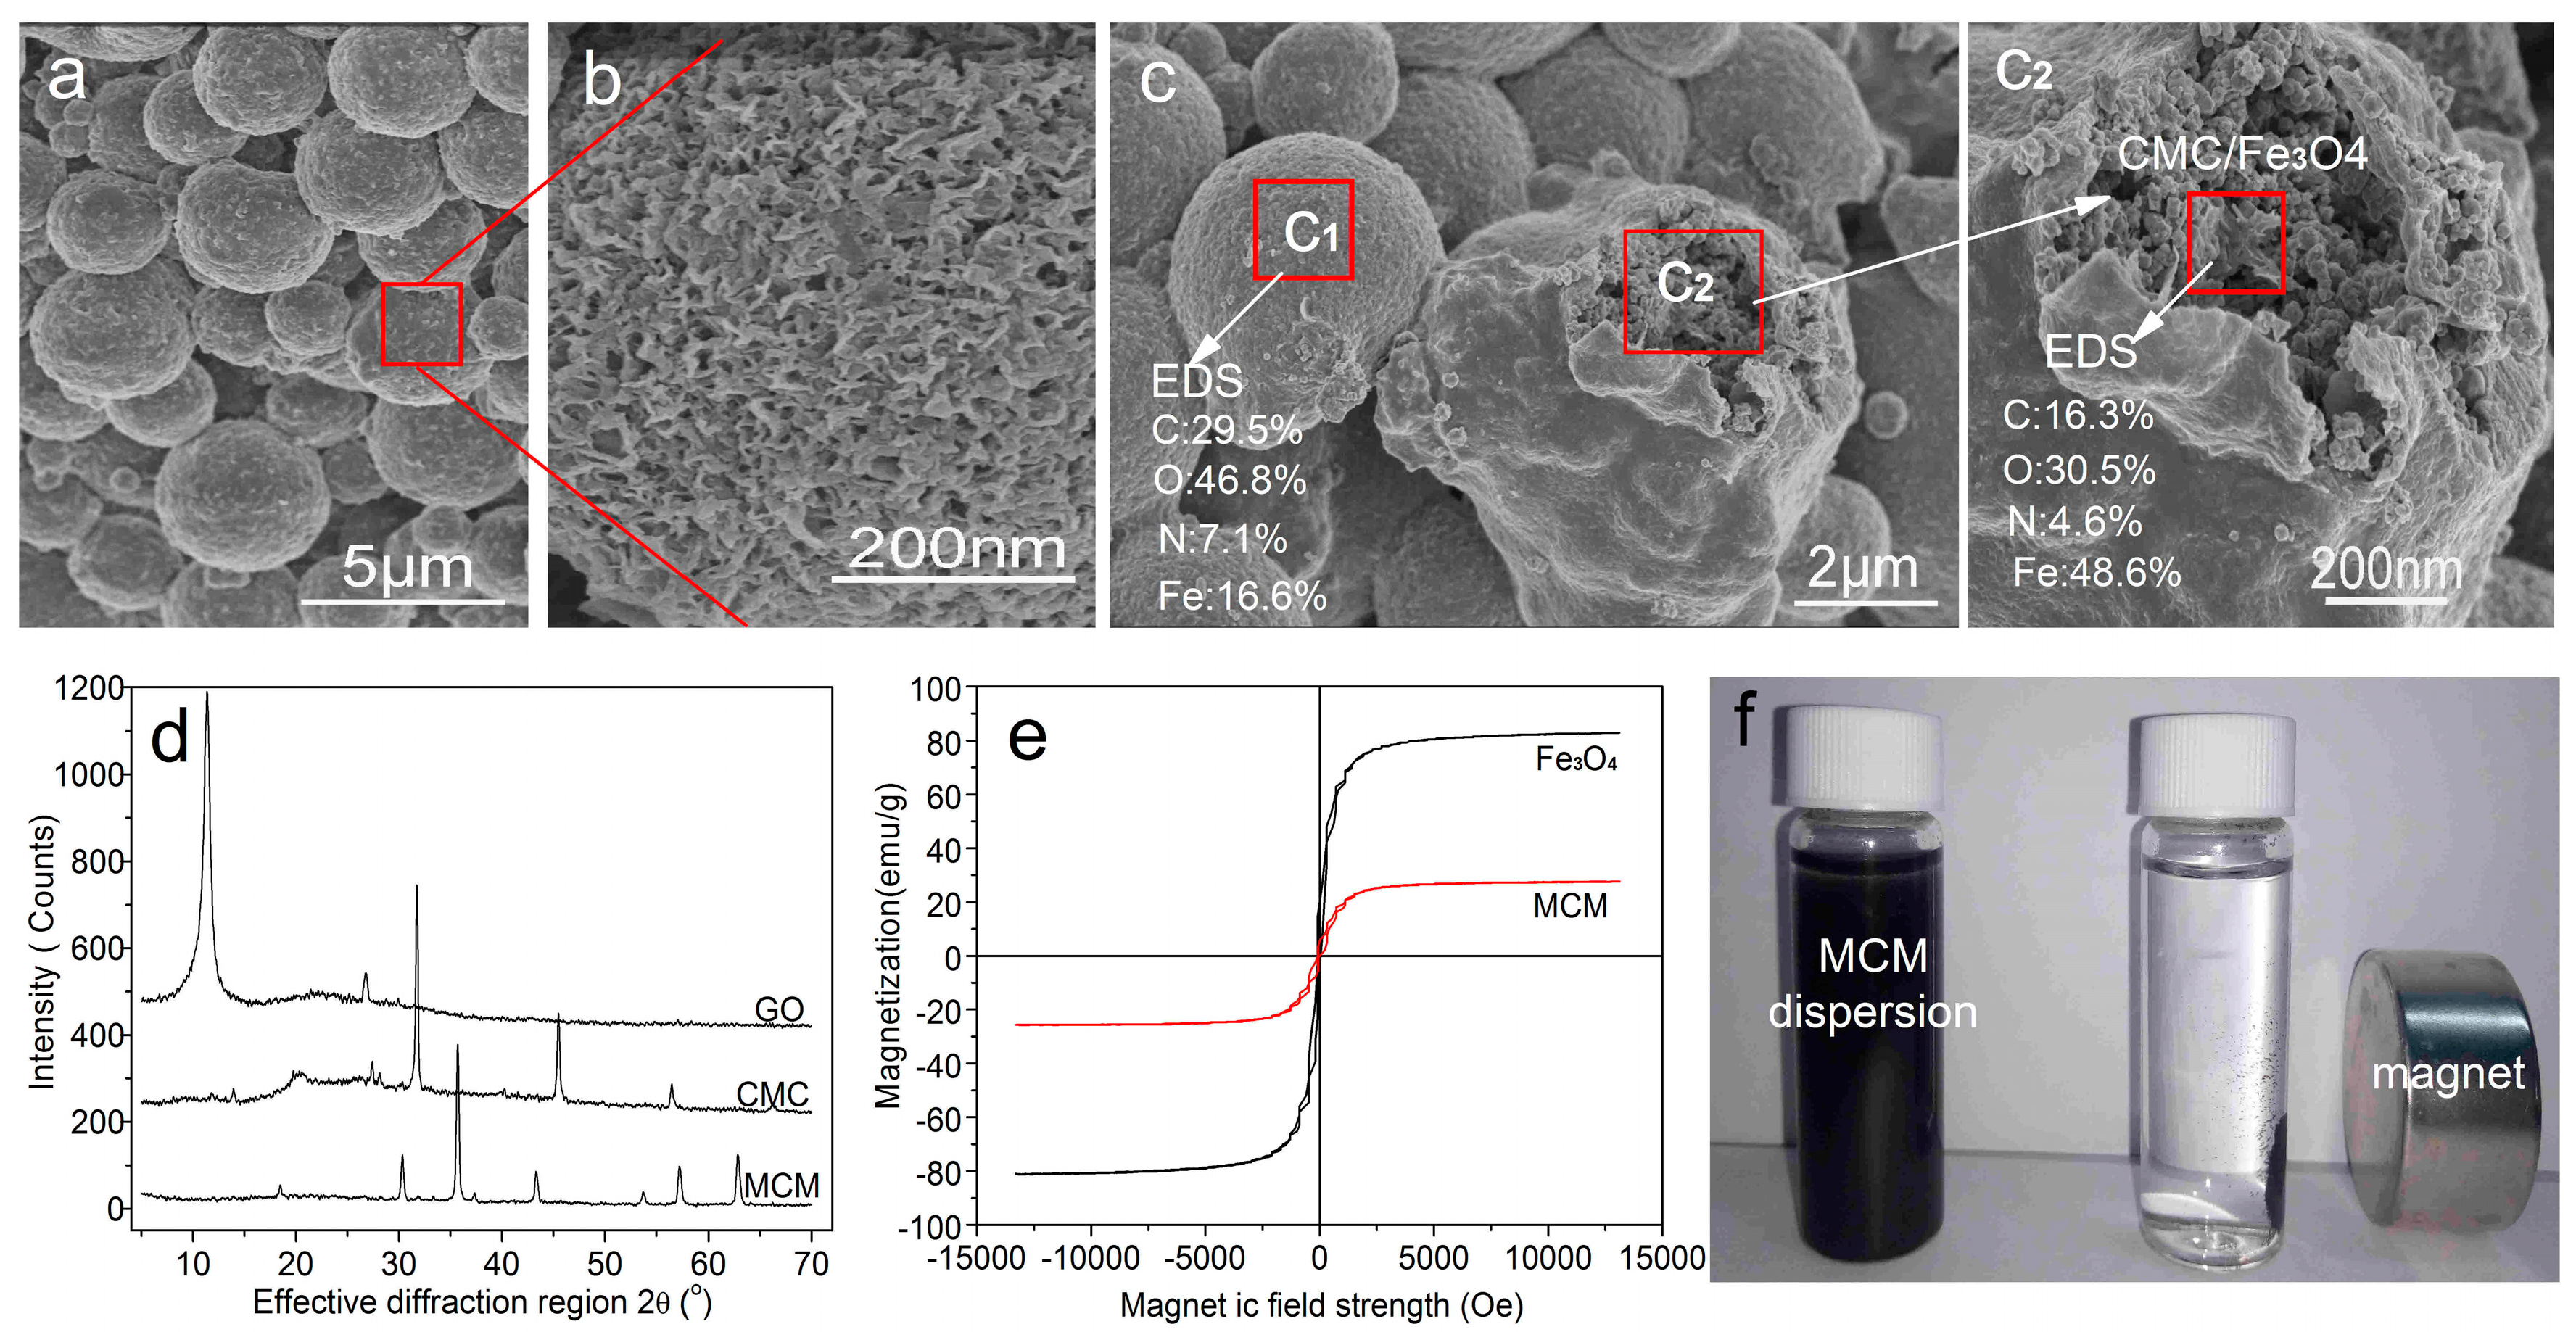
3.2. Structural Characterization of GONs/CMC/Fe3O4 MCMs

The structure of GONs/CMC/Fe3O4 MCMs was characterized by SEM, XRD, and a magnetic hysteresis loop, and the results are shown in Figure 4.
SEM images of the MCMs prepared with the optimal oil–water ratio of 5:1 are shown in Figure 4a. The results indicate a regular spherical shape and a diameter in the range of 1.3 to 3.3 μm. Figure 4b shows the MCMs with a rough surface formed by the interweaving of fine lamellae. Figure 4C1 shows that the surface consists mainly of elemental C and O, suggesting that there are many GONs in the MCM’s surface. Meanwhile, Figure 4C2 shows that the internal structure of the MCMs consists mainly of elemental Fe, O, and C. The results indicate that Fe3O4 particles intertwine with CMC and they are wrapped in shells made from GONs.
The XRD patterns of GONs/CMC/Fe3O4 MCMs are shown in Figure 4d. The XRD pattern of the GONs has a characteristic peak at 2θ = 11.36°. The characteristic XRD peaks of CMC are at 2θ = 31.74° and 2θ = 45.48°. The XRD peaks of MCMs are at 2θ = 18.46°, 30.34°, 35.7°, 43.32°, 53.72°, 57.22°, and 62.82°, indicating the existence of Fe3O4 in the MCMs. The results indicate that the XRD peaks of GONs have disappeared in the XRD patterns of MCMs, indicating that the GONs have been distributed uniformly in MCMs because of the intercalation of GONs and CMC.
Figure 4e shows the magnetic hysteresis loop of Fe3O4 and GONs/CMC/Fe3O4 MCMs at 30 °C. The results indicate that the saturation magnetizations Ms of Fe3O4 and GONs/CMC/Fe3O4 MCMs are 82.5 and 27.53 emu/g, respectively. The saturation magnetization of MCMs is lower than that of Fe3O4 nanoparticles because the Fe3O4 particles in the MCMs were surrounded by CMC and GONs. Figure 4f shows that dyes in wastewater adsorbed by MCMs can be separated rapidly from the wastewater in an external magnetic field.

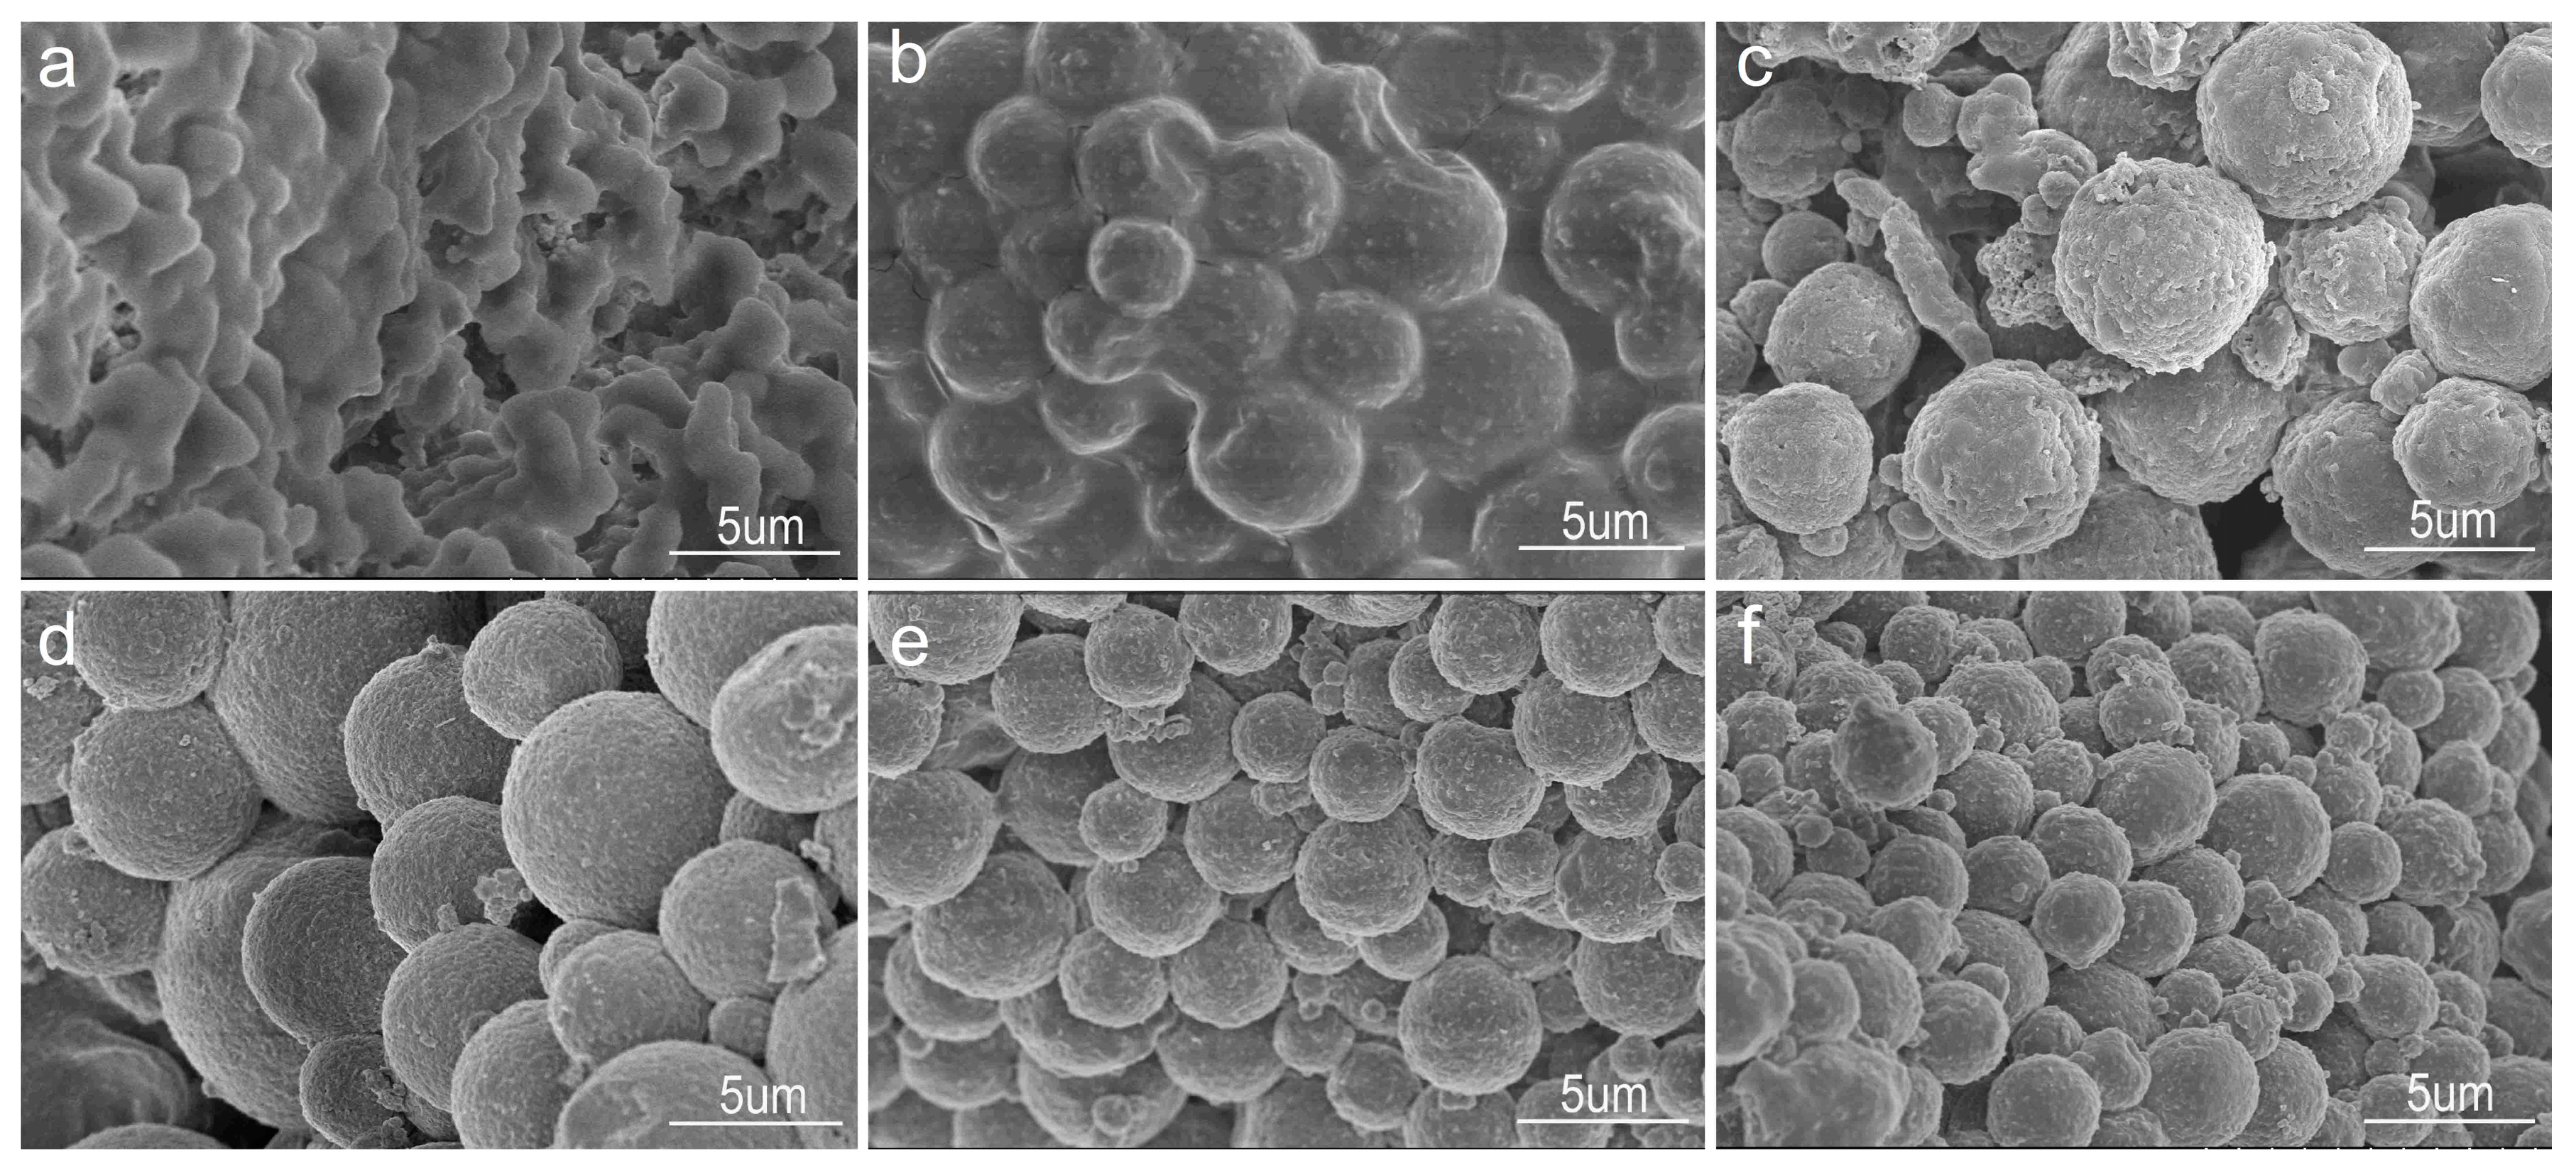
3.3. Effect of the Oil–Water Ratio on the Shape of GONs/CMC/Fe3O4 MCMs

The GONs/CMC/Fe3O4 MCMs were prepared by mixing 3 g of Fe3O4, 6 g of CMC, and 0.6 g of GONs at different oil–water ratios, and their SEM images are shown in Figure 5. Figure 5a is a SEM image of GONs/CMC/Fe3O4 composite with an oil–water ratio of 1:1, indicating that the composite cannot form a spherical shape because the oil–water proportion is unsuitable. Figure 5b shows the SEM images of the GONs/CMC/Fe3O4 MCMs with an oil–water ratio of 2:1, indicating that the spherical shape of the MCMs had appeared, but that they were bound together. Figure 5c is a SEM image of the MCMs with an oil–water ratio of 3:1, indicating that MCMs with a regular spherical shape had formed. Figure 5d–f are SEM images of MCMs with oil–water ratios of 4:1, 5:1, and 6:1, respectively, indicating that the regular spherical shapes of GONs/CMC/Fe3O4 MCMs had formed in these oil–water proportions. The results indicate that oil–water ratios of 5:1 and 6:1 are suitable for forming regular MCMs.

3.4. Effect of GON Content on Special Surface Area and Adsorption Capacity of GONs/CMC/Fe3O4 MCMs

Table 2 shows the effects of GON content on the special surface, average pore diameter, and adsorption capacity of GONs/CMC/Fe3O4 MCMs. The adsorption experiment was carried out using a methyl orange solution with an initial concentration of 200 mg/L at pH 5. The results indicated that doping GONs in the MCMs has a significant effect on the special surface area and adsorption capacity. The results show that the special surface area and adsorption capacity of MCMs obviously increase with an increase in GON dosage from 0.02 g to 0.06 g. When the GON content was 0.06 g, the special surface area and adsorption capacity reached their maximum. At this point, the special surface area and adsorption capacity of MCMs were 126.4 m2/g and 164.6 mg/g, respectively. With a further increase in GON content, the special surface area and adsorption capacity remained constant. The adsorption capacity at a GON dosage of 0.06 g increased by 42.3% compared with the control samples. This can be attributed to oversized GONs with a specific surface area and multiple chemical groups, which can significantly improve the adsorption capacity for dyes by increasing the contact area and electrostatic forces between the GONs and the dyes.

3.5. Factors Affecting the Adsorption Capacity of GONs/CMC/Fe3O4 MCMs

The main factors influencing the adsorption capacity of GONs/CMC/Fe3O4 MCMs for methyl orange are pH value, adsorption time, and the initial concentration of dye in the wastewater.
Figure 6a shows the effects of the pH values of the dye solution on the adsorption capacity of GONs/CMC/Fe3O4 MCMs. The results indicate that the adsorption capacity increases with an increase in pH value from 3 to 6; however, with a further increase in pH values from 6 to 9, the adsorption capacity will decrease. The maximal adsorption capacity is 163.2 mg/g when the pH value is 5.5. The reason could be that the amino groups of methyl orange are protonated to –NH3+ when the pH value is less than 5.5 (Figure 6d), and a greater electrostatic attraction is produced between methyl orange and GONs, resulting in an improved adsorption capacity. When pH values are less than 5.5, the adsorption capacity markedly decreases. The reason is that there are too many cationic particles in dyes that may delay penetration into the deep adsorption layer of the MCMs, because the cationic particles can preferentially combine on the MCM’s surface. When pH values are greater than 7, the dyes will produce many OH and –SO32− anions, and the adsorption capacity of the MCMs for methyl orange will radically decline.
Figure 6b shows the effect of adsorption time on the adsorption capacity of the MCMs. The results indicate that the adsorption capacity of the GONs/CMC/Fe3O4 MCMs for dye wastewater achieves equilibrium at 90 min. The equilibrium time for the control sample of CMC/Fe3O4 MCMs is about 240 min. The results suggest that the adsorption rate of GONs/CMC/Fe3O4 MCMs for dye wastewater is quick compared with that of CMC/Fe3O4 MCMs. The equilibrium adsorption capacity is about 164.6 mg/g. The reason is that GONs contribute many chemical groups and a greater special surface area on the MCMs. Therefore, GONs/CMC/Fe3O4 MCMs for dye wastewater has greater adsorption capacity compared with the traditional adsorbents.
The regenerative ability of the GONs/CMC/Fe3O4 MCMs was investigated by performing a consecutive adsorption–desorption process. Figure 6c shows the relationship between the recycle times and the adsorption capacity of the GONs/CMC/Fe3O4 MCMs for methyl orange. It can be seen that the adsorption performance of the GONs/CMC/Fe3O4 MCMs decreased by 17.7% and 56.2% after 50 and 100 adsorption–regeneration cycles, respectively, while the adsorption performance of the CMC/Fe3O4 MCMs decreased by 60.9% and 76.5% after 50 and 100 adsorption–regeneration cycles, respectively. This implies that the GONs/CMC/Fe3O4 MCMs has a greater regeneration capacity than the CMC/Fe3O4 MCMs and the traditional adsorbents.

3.6. Adsorption Mechanism of MCMs

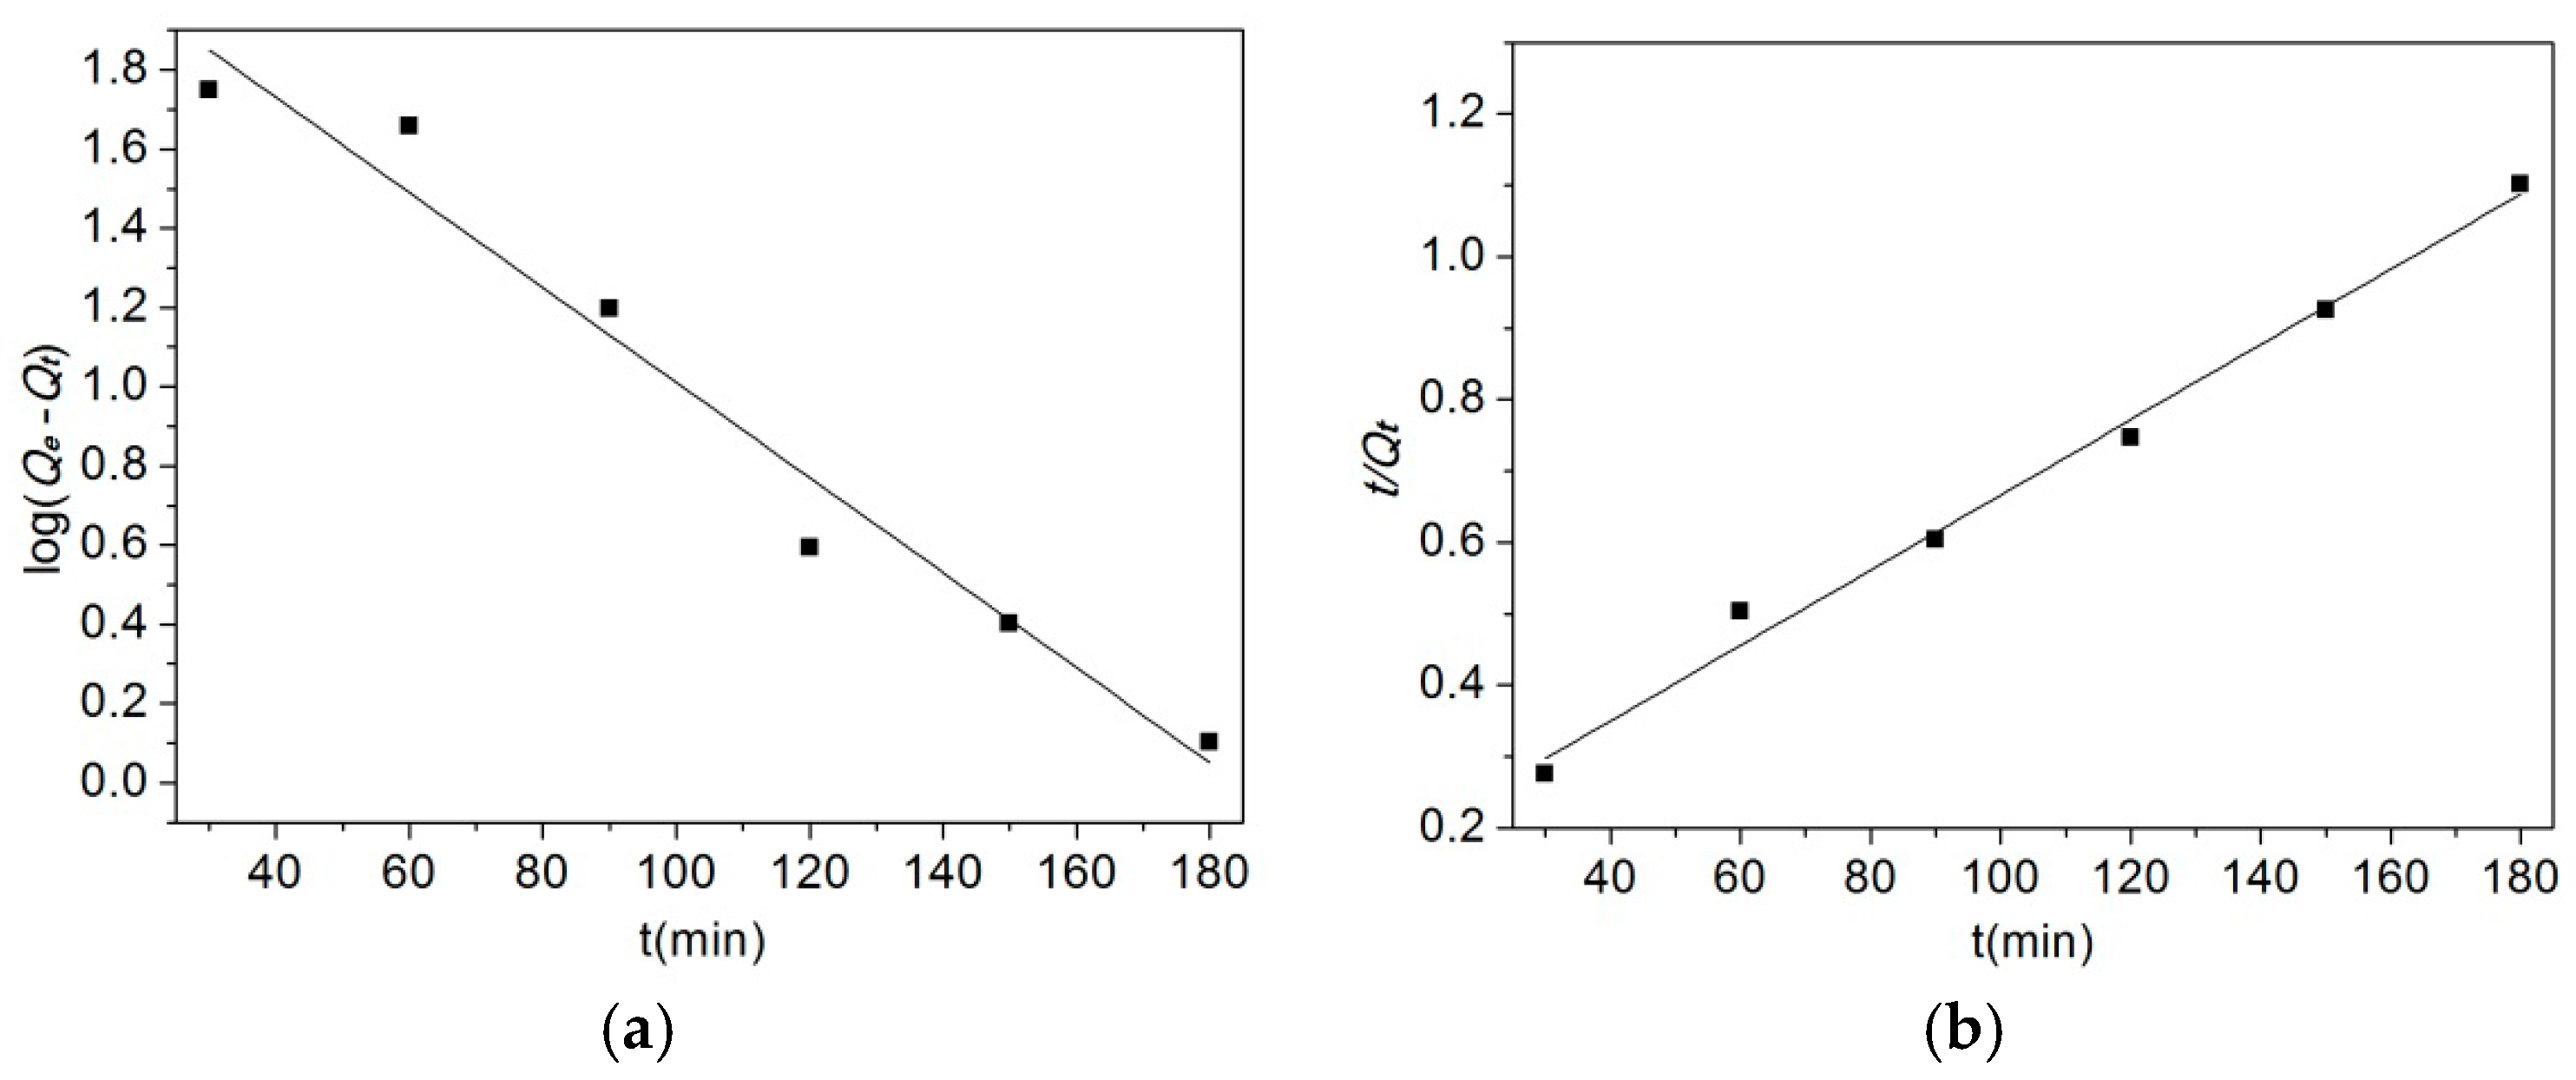
3.6.1. Adsorption Kinetics

To investigate the controlling mechanism of the adsorption processes, pseudo-first-order and pseudo-second-order kinetic models were used to fit the experimental data in this work. The pseudo-first-order kinetic model is generally represented as Equation (3). The pseudo-second-order kinetic model can be expressed as Equation (4).
l g ( Q e Q t ) = l g Q e k 1 2 . 303 t
t Q t = 1 k 2 Q e 2 + t Q e
where, Qe and Qt (mg/g) are the adsorption capacity of GONs/CMC/Fe3O4 MCMs for methyl orange at equilibrium and time t (min), respectively. k1 is the pseudo-first-order rate constant (min−1), and k2 is the pseudo-second-order rate constant (g/(mg·min)).
The values of k and Qe (Table 3) were evaluated from pseudo-first-order kinetic plots and pseudo-second-order kinetic plots (Figure 7). As shown in Table 3, according to the correlation coefficients (R2), the pseudo-second-order equation provided an excellent fit for the experimental data of methyl orange ( R 2 2 = 0.9917) compared with the data from the pseudo-first-order equation ( R 1 2 = 0.9671). This indicates that the pseudo-second-order adsorption mechanism is predominant.

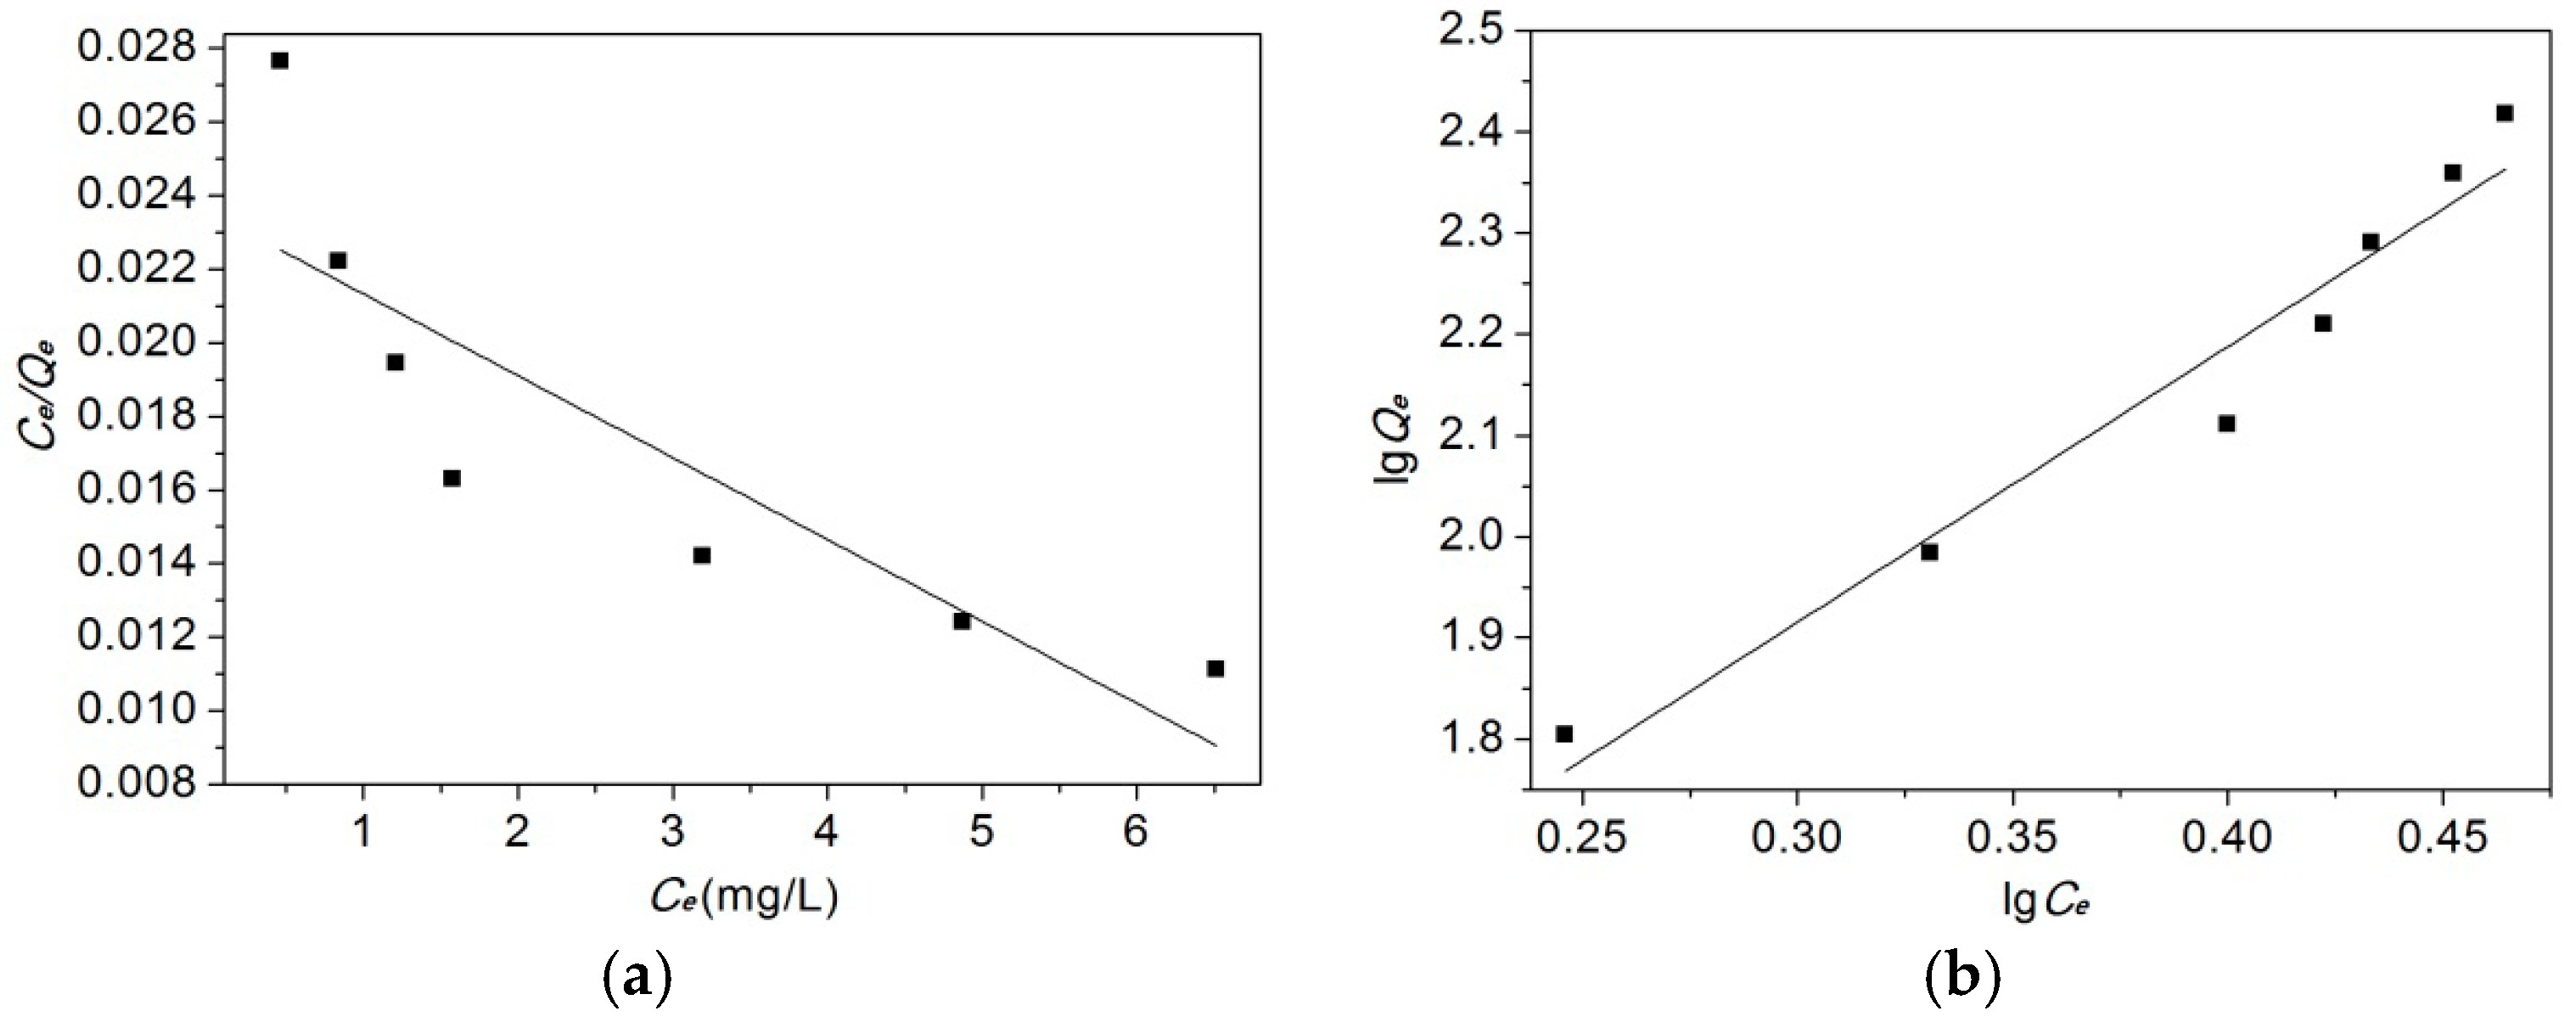
3.6.2. Adsorption Isotherm

In order to interpret the adsorption experimental data, the most frequently used equations are the Langmuir and Freundlich isotherm equations. The expression of the Langmuir isotherm equation is shown in Equation (5). The expression of the Freundlich isotherm equation is shown in Equation (6).
C e Q e = C e Q m + 1 Q m b
lg Q e = lg k F + lg C e n
where, Ce is the equilibrium concentration of methyl orange in solution (mg/L), Qe is the adsorption capacity of methyl orange at equilibrium (mg/g), Qm is the maximum adsorption capacity (mg/g), b is the Langmuir equilibrium constant (L/g), kF is the Freundlich equilibrium constant (L/g), and n is the strength factor.
The obtained parameters of the Langmuir and Freundlich isotherms (Table 4) were evaluated from the Langmuir isotherm plots and Freundlich isotherm plots (Figure 8). It should be noticed that the R2 values for the Freundlich isotherm models ( R 1 2 = 0.955) are higher than those for the Langmuir isotherm models ( R 2 2 = 0.7495), which suggests that the Freundlich isotherm fits the experimental data better than the Langmuir isotherm.

3.7. Adsorption Capacity of the MCMs for Other Dyes and Metal Ions

Adsorption capacities of the MCMs for dyes and metal ions are shown in Table 5. Nowadays, dyes used in textile, leather, and various other fields have thousands of varieties. According to their chemical structure and dyeing properties, the dyes generally include mainly acid dyes, basic dyes, direct dyes, reactive dyes, and sulfur dyes. These dyes mainly consist of benzene and benzene derivatives, and dyes usually have common chemical groups such as sulfuric groups and carboxyl groups. The adsorption results of Table 5 indicate that GONs/CMC/Fe3O4 MCMs have excellent adsorption for dyes and some metal ions compared with the modified chitosan in literature (Table 6). We will research the adsorption capacity of the MCMs in another manuscript.

4. Conclusions

GONs/CMC/Fe3O4 MCMs were prepared by inverse emulsion crosslinking to be used as a highly effective adsorbent for purifying dye wastewater. The MCMs had a rough surface of a spherical structure with a large special surface and multiple chemical groups. The MCMs had a higher adsorption capacity for methyl orange and other dye wastewater as well as metal ions due to the introduction of GONs. The results indicate that MCMs can be easily separated and regenerated. The adsorption mechanism was investigated by adsorption kinetics and adsorption isotherms. The research results indicate that the GONs/CMC/Fe3O4 MCMs have great potential in the purification of dye wastewater.

Acknowledgments

The research in this paper was partially supported by the National Natural Science Foundation of China (Grant No. 21276152) and the Innovational Industrialization Foundation of Shaanxi Province of China (No. 2016KTCL01-14).

Author Contributions

Shenghua Lv conceived of the research plan and wrote the paper. Ying Li performed the experiments and wrote the paper. Linlin Zhu, Chunmao Jia and Shiyu Sun performed the experiments and analyzed the data.

Conflicts of Interest

The authors declare no conflicts of interest.

References

  1. Liu, J.; Guo, D.H.; Zhou, Y.; Wu, Z.Y.; Li, W.Y.; Zhao, F.; Zheng, X.M. Identification of ancient textiles from Yingpan, Xinjiang, by multiple analytical techniques. J. Archaeol. Sci. 2011, 38, 1763–1770. [Google Scholar] [CrossRef]
  2. Homaeigohar, S.; Zillohu, A.U.; Abdelaziz, R.; Hedayati, M.K.; Elbahri, M. A novel nanohybrid nanofibrous adsorbent for water purification from dye pollutants. Materials 2016, 9, 848. [Google Scholar] [CrossRef]
  3. Fan, M.Y.; Li, T.J.; Hu, J.W.; Cao, R.S.; Wu, Q.; Wei, X.H.; Li, L.Y.; Shi, X.D.; Ruan, W.Q. Synthesis and characterization of reduced graphene oxide-supported nanoscale zero-valent iron (nZVI/rGO) composites used for Pb(II) Removal. Materials 2016, 9, 687. [Google Scholar] [CrossRef]
  4. Chu, H.C.; Chen, K.M. Reuse of activated sludge biomass: I. Removal of basic dyes from wastewater by biomass. Process Biochem. 2002, 37, 595–600. [Google Scholar] [CrossRef]
  5. Quinlan, P.J.; Tanvir, A.; Tam, K.C. Application of the central composite design to study the flocculation of an anionic azo dye using quaternized cellulose nanofibrils. Carbohyd. Polym. 2015, 133, 80–89. [Google Scholar] [CrossRef]
  6. Ou, W.S.; Zhang, G.Q.; Yuan, X.J.; Su, P. Experimental study on coupling photocatalytic oxidation process and membrane separation for the reuse of dye wastewater. J. Water Process Eng. 2015, 6, 120–128. [Google Scholar] [CrossRef]
  7. Wong, K.S.; Huang, Q.L.; Au, C.H.; Wang, J.; Kwan, H.S. Biodegradation of dyes and polyaromatic hydrocarbons by two allelic forms of Lentinula edodes laccase expressed from Pichia pastoris. Bioresour. Technol. 2012, 104, 157–164. [Google Scholar] [CrossRef] [PubMed]
  8. George, J.S.; Ramos, A.; Shipley, H.J. Tanning facility wastewater treatment: Analysis of physical–chemical and reverse osmosis methods. J. Environ. Chem. Eng. 2015, 3, 969–976. [Google Scholar] [CrossRef]
  9. Yang, C.; Li, L.; Shi, J.L.; Long, C.; Li, A.M. Advanced treatment of textile dyeing secondary effluent using magnetic anion exchange resin and its effect on organic fouling in subsequent RO membrane. J. Hazard. Mater. 2015, 284, 50–57. [Google Scholar] [CrossRef] [PubMed]
  10. Babel, S.; Kurniawan, T.A. Low-cost adsorbents for heavy metals uptake from contaminated water: A review. J. Hazard. Mater. 2003, 97, 219–243. [Google Scholar] [CrossRef]
  11. Iqbal, M.J.; Ashiq, M.N. Adsorption of dyes from aqueous solutions on activated charcoal. J. Hazard. Mater. B 2007, 139, 57–66. [Google Scholar] [CrossRef] [PubMed]
  12. Auta, M.; Hameed, B.H. Modified mesoporous clay adsorbent for adsorption isotherm and kinetics of methylene blue. Chem. Eng. J. 2012, 198, 219–227. [Google Scholar] [CrossRef]
  13. Vimonses, V.; Lei, S.M.; Jin, B.; Chow, C.W.K.; Saint, C. Kinetic study and equilibrium isotherm analysis of Congo Red adsorption by clay materials. Chem. Eng. J. 2009, 148, 354–364. [Google Scholar] [CrossRef]
  14. Gong, R.M.; Ding, Y.; Li, M.; Yang, C.; Liu, H.J.; Sun, Y.Z. Utilization of powdered peanut hull as biosorbent for removal of anionic dyes from aqueous solution. Dyes Pigments 2005, 64, 187–192. [Google Scholar] [CrossRef]
  15. Kumar, P.S.; Ramalingam, S.; Senthamarai, C.; Niranjanaa, M.; Vijayalakshmi, P.; Sivanesan, S. Adsorption of dye from aqueous solution by cashew nut shell: Studies on equilibrium isotherm, kinetics and thermodynamics of interactions. Desalination 2010, 261, 52–60. [Google Scholar] [CrossRef]
  16. Chen, X.G.; Wang, Z.; Liu, W.S.; Park, H.J. The effect of carboxymethyl-chitosan on proliferation and collagen secretion of normal and keloid skin fibroblasts. Biomaterials 2002, 23, 4609–4614. [Google Scholar] [CrossRef]
  17. Zhu, A.P.; Chan-Park, M.B.; Dai, S.; Li, L. The aggregation behavior of O-carboxymethylchitosan in dilute aqueous solution. Colloids Surf. B 2005, 43, 143–149. [Google Scholar] [CrossRef] [PubMed]
  18. Chen, X.G.; Park, H.J. Chemical characteristics of O-carboxymethyl chitosans related to the preparation conditions. Carbohyd. Polym. 2003, 53, 355–359. [Google Scholar] [CrossRef]
  19. Mi, F.L.; Wu, S.J.; Chen, Y.C. Combination of carboxymethyl chitosan-coated magnetic nanoparticles and chitosan-citrate complex gel beads as a novel magnetic adsorbent. Carbohyd. Polym. 2015, 131, 255–263. [Google Scholar] [CrossRef] [PubMed]
  20. Xu, Y.Y.; Dang, Q.F.; Liu, C.S.; Yan, J.Q.; Fan, B.; Cai, J.P.; Li, J.J. Preparation and characterization of carboxyl-functionalized chitosan magnetic microspheres and submicrospheres for Pb2+ removal. Colloids Surf. A 2015, 482, 353–364. [Google Scholar] [CrossRef]
  21. Kadam, A.A.; Lee, D.S. Glutaraldehyde cross-linked magnetic chitosan nanocomposites: Reduction precipitation synthesis, characterization, and application for removal of hazardous textile dyes. Bioresour. Technol. 2015, 193, 563–567. [Google Scholar] [CrossRef] [PubMed]
  22. Kim, T.Y.; Park, S.S.; Chao, S.Y. Adsorption characteristics of Reactive Black 5 onto chitosan beads cross-linked with epichlorohydrin. J. Ind. Eng. Chem. 2012, 18, 1458–1464. [Google Scholar] [CrossRef]
  23. Zheng, E.D.; Dang, Q.F.; Liu, C.S.; Fan, B.; Yan, J.Q.; Yu, Z.Z.; Zhang, H.F. Preparation and evaluation of adipic acid dihydrazide cross-linked carboxymethyl chitosan microspheres for copper ion adsorption. Colloids Surf. A 2016, 502, 34–43. [Google Scholar] [CrossRef]
  24. Li, F.; Jiang, X.; Zhao, J.J.; Zhang, S.B. Graphene oxide: A promising nanomaterial for energy and environmental applications. Nano Energy 2015, 16, 488–515. [Google Scholar] [CrossRef]
  25. Lv, S.H.; Ma, Y.J.; Qiu, C.C.; Sun, T.; Liu, J.J.; Zhou, Q.F. Effect of graphene oxide nanosheets of microstructure and mechanical properties of cement composites. Constr. Build. Mater. 2013, 49, 121–127. [Google Scholar] [CrossRef]
  26. Zhang, N.; Qiu, H.X.; Si, Y.M.; Wang, W.; Gao, J.P. Fabrication of highly porous biodegradable monoliths strengthened by graphene oxide and their adsorption of metal ions. Carbon 2011, 49, 827–837. [Google Scholar] [CrossRef]
  27. Wu, T.; Cai, X.; Tan, S.; Li, H.; Liu, J.; Yang, W.D. Adsorption characteristics of acrylonitrile, p-toluenesulfonic acid, 1-naphthalenesulfonic acid and methyl blue on graphene in aqueous solutions. Chem. Eng. J. 2011, 173, 144–149. [Google Scholar] [CrossRef]
  28. Fan, L.L.; Luo, C.N.; Li, X.J.; Lu, F.G.; Qiu, H.M.; Sun, M. Fabrication of novel magnetic chitosan grafted with graphene oxide to enhance adsorption properties for methyl blue. J. Hazard. Mater. 2012, 215, 272–279. [Google Scholar] [CrossRef] [PubMed]
  29. Li, L.L.; Fan, L.L.; Sun, M. Adsorbent for chromium removal based on graphene oxide functionalized with magnetic cyclodextrin–chitosan. Colloids Surf. B 2013, 107, 76–83. [Google Scholar] [CrossRef] [PubMed]
  30. Fan, L.L.; Luo, C.N.; Sun, M. Highly selective adsorption of lead ions by water-dispersible magnetic chitosan/grapheme oxide composites. Colloids Surf. B 2013, 103, 523–529. [Google Scholar] [CrossRef] [PubMed]
Figure 1. Schematic diagram of preparation process of GONs. (a) Compact aggregates of graphite; (b) Edge dilation state of graphite in initial oxidation stage; (c) Dispersed state of GONs.
Materials 10 00058 g001
Figure 2. Schematic diagram of preparation process of GONs/CMC/Fe3O4 MCMs.
Materials 10 00058 g002
Figure 3. Structural characterization of GONs. (a) FTIR spectra; (b) XPS broad spectra; (c) XPS spectra; (d) TEM images; (e) AFM images; (f) Size distribution.
Materials 10 00058 g003
Figure 4. Structural characterization of the MCMs, (a) SEM images of the MCMs; (b) Microstructure of the MCMs; (c) Microstructure and EDS results; (d) XRD patterns of the MCMs; (e) Magnetic hysteresis loop curves of the MCMs; (f) Magnetic separation testing.
Materials 10 00058 g004
Figure 5. SEM images of GONs/CMC/Fe3O4 MCMs at different oil–water ratios. (a) 1:1; (b) 2:1; (c) 3:1; (d) 4:1; (e) 5:1; (f) 6:1.
Materials 10 00058 g005
Figure 6. Effects of different factors on the adsorption of the MCMs, (a) pH values of dye solution; (b) Adsorption time; (c) Regenerative ability; (d) Methyl orange structure.
Materials 10 00058 g006
Figure 7. Pseudo-first-order kinetic plots and pseudo-second-order kinetic plots for the adsorption of methyl orange (pH: 5, T: 303 K). (a) Pseudo-first order kinetic fitting curve; (b) Pseudo-second kinetic fitting curve.
Materials 10 00058 g007
Figure 8. Langmuir isotherm plots and Freundlich isotherm plots for the adsorption of methyl orange. (a) Langmuir isotherm adsorption curve; (b) Freundlich isotherm adsorption curve.
Materials 10 00058 g008
Table 1. Adsorption capacity of traditional adsorbents for dye wastewater.
Ref.AdsorbentsAdsorbatesAdsorption ConditionsAdsorption Capacity (mg/g)
[11]Activated carbonMethylene blueC* = 600 mg/L, m = 0.2 g/L, pH = 7.4, t = 35 min25.3
[12]Modified clayMethylene blueC = 100 mg/L, m = 0.2 g/L, pH = 12, t = 750 min34.6
[13]KaolinCongo redC = 150 mg/L, m = 0.5 g/L, pH = 7.5, t = 500 min5.6
[14]Peanut hullAmaranthC = 50 mg/L, m = 0.5 g/L, pH = 2, t = 15 h14.9
[15]Cashew nutshellsCongo redC = 50 mg/L, m = 0.2 g/L, pH = 2, t = 2 h5.2
C*: dye wastewater concentration; m: adsorbent dosage; t: adsorption time.
Table 2. Pore structure of GONs/CMC/Fe3O4 MCMs.
GONs Content (g)Specific Surface Area (m2/g)Average Pore Diameter (nm)Adsorption Capacity (mg/g)
046.3552.5115.5 ± 0.4
0.0262.631.4146.3 ± 0.6
0.0495.229.5156.7 ± 0.7
0.06126.428.3164.6 ± 0.7
0.08125.628.5164.4 ± 0.6
0.10126.428.2164.3 ± 0.8
Compositions of CMC and Fe3O4 in the GONs/CMC/Fe3O4 MCMs are 6 g and 3 g, respectively.
Table 3. The parameters of the two kinds of dynamic adsorption model.
Pseudo-First-Order KineticPseudo-Second-Order Kinetic
k1 (min−1) R 1 2 Q’e (mg/g)k2 (L/g) R 2 2 Q’e (mg/g)
0.02760.9671162.1440.0002020.9917188.68
Note: Qe is the equilibrium adsorption from the theoretical calculation.
Table 4. The parameters of the two adsorption model.
Langmuir IsothermFreundlich Isotherm
Qm (mg/g)B (L/g) R 1 2 kF (L/g)n R 2 2
454.550.09320.749512.5170.3670.955
Table 5. Adsorption capacity of the MCMs for dyes and some metal ions.
AdsorbateAdsorption ConditionsAdsorption Capacity (mg/g)
Temperature (°C)pHAdsorption Time (min)CMC/Fe3O4 MCMsGONs/CMC/Fe3O4 MCMs
Acid red (14720) *305.590115.3 ± 0.5168.6 ± 0.7
Based black (20470)305.590108.6 ± 0.5166.5 ± 0.7
Direct black (35255)306.090121.4 ± 0.6174.2 ± 0.8
Reactive black 8 (2050)306.590118.9 ± 0.5166.3 ± 0.6
Cr3+ 306.59021.4 ± 0.471.6 ± 0.5
Hg2+306.59017.7 ± 0.465.3 ± 0.5
Pb2+306.59018.6 ± 0.458.7 ± 0.4
Cu2+306.59015.4 ± 0.446.4 ± 0.4
* Color index number, and the initial concentration is 200 mg/L; Initial concentration of the metals ions is 100 mg/L.
Table 6. Adsorption capacity of modified chitosan adsorbents.
Refs.AdsorbentsAdsorbatesAdsorption Capacity (mg/g)Cycle Times
[27]GOMethylene blue43.5
[28]Natural chitosan membraneMethylene blue46.23<5
[27]Magnetic chitosanMethylene blue60.45–10
[27]GO/Magnetic chitosan compositeMethylene blue95.165–10
[29]GO/magnetic cyclodextrin–chitosanCr6+67.665–10
[30]GO/magnetic chitosan compositesPb2+76.945–10

