The Effect of a Two-Stage Heat-Treatment on the Microstructural and Mechanical Properties of a Maraging Steel

 , , , ,
Abstract
:
1. Introduction
2. Materials and Methods
3. Results
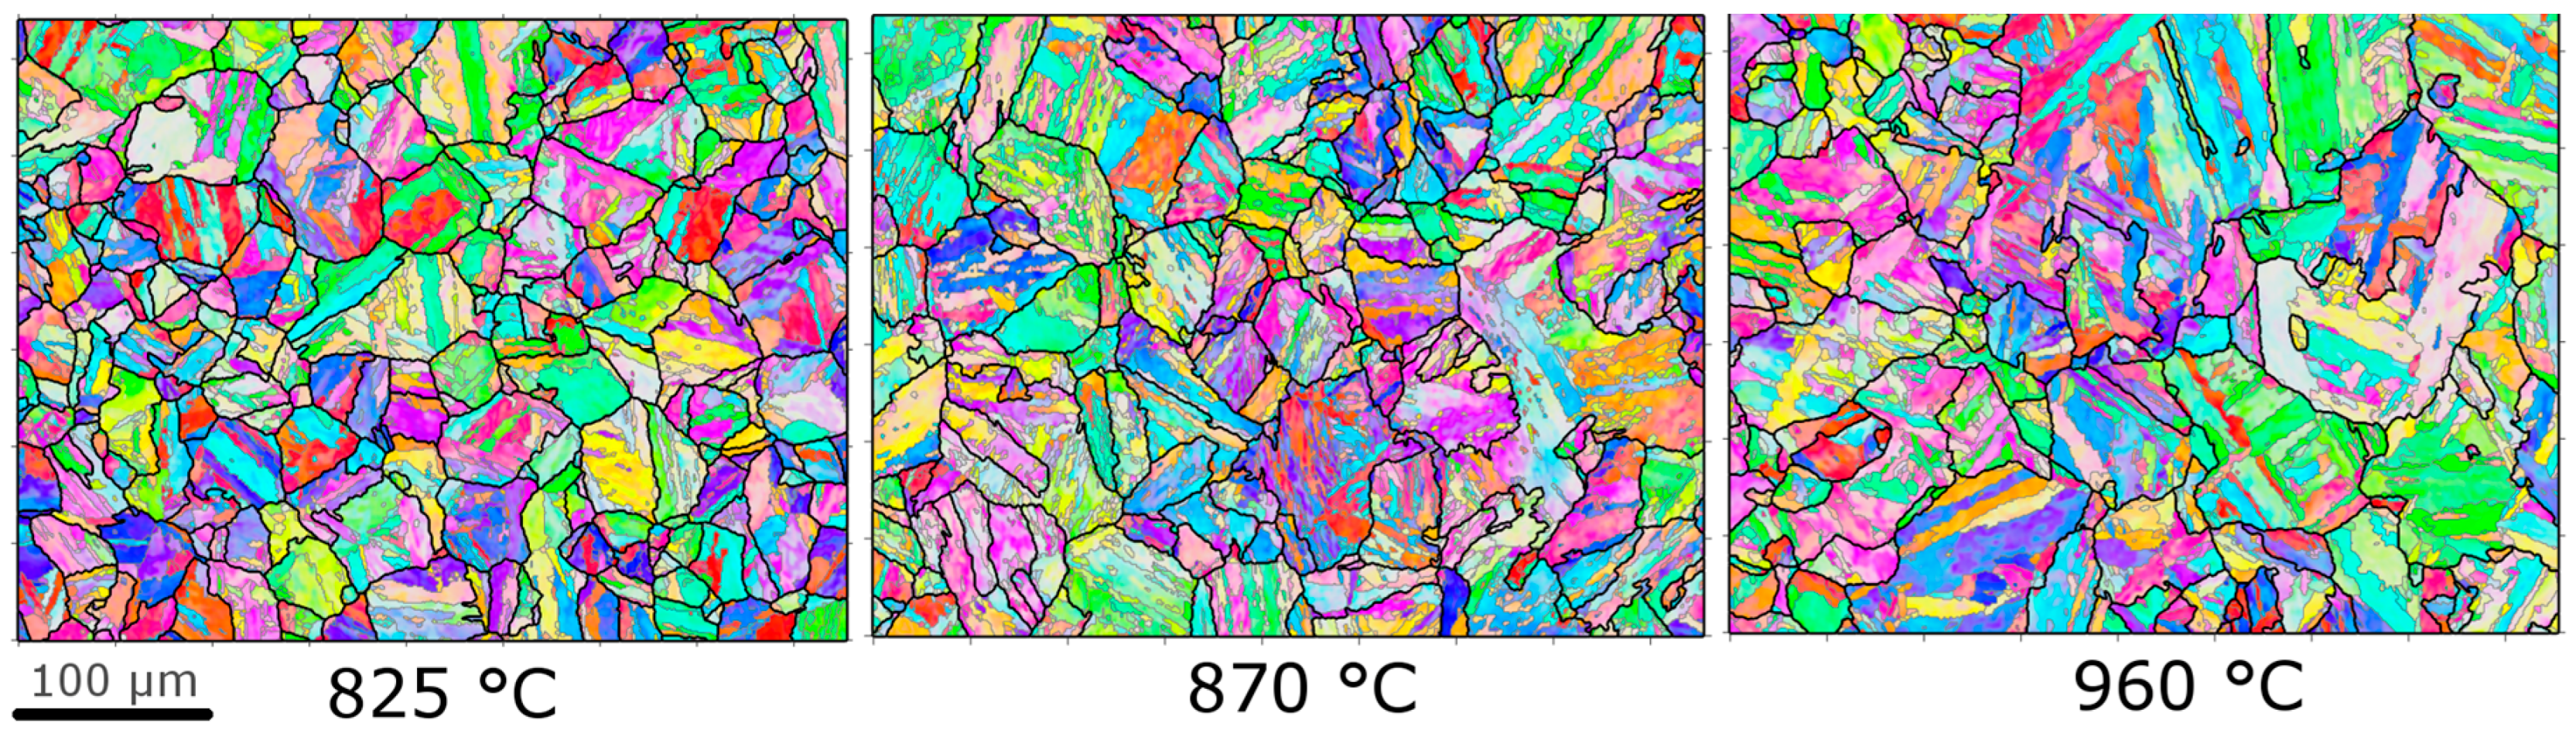
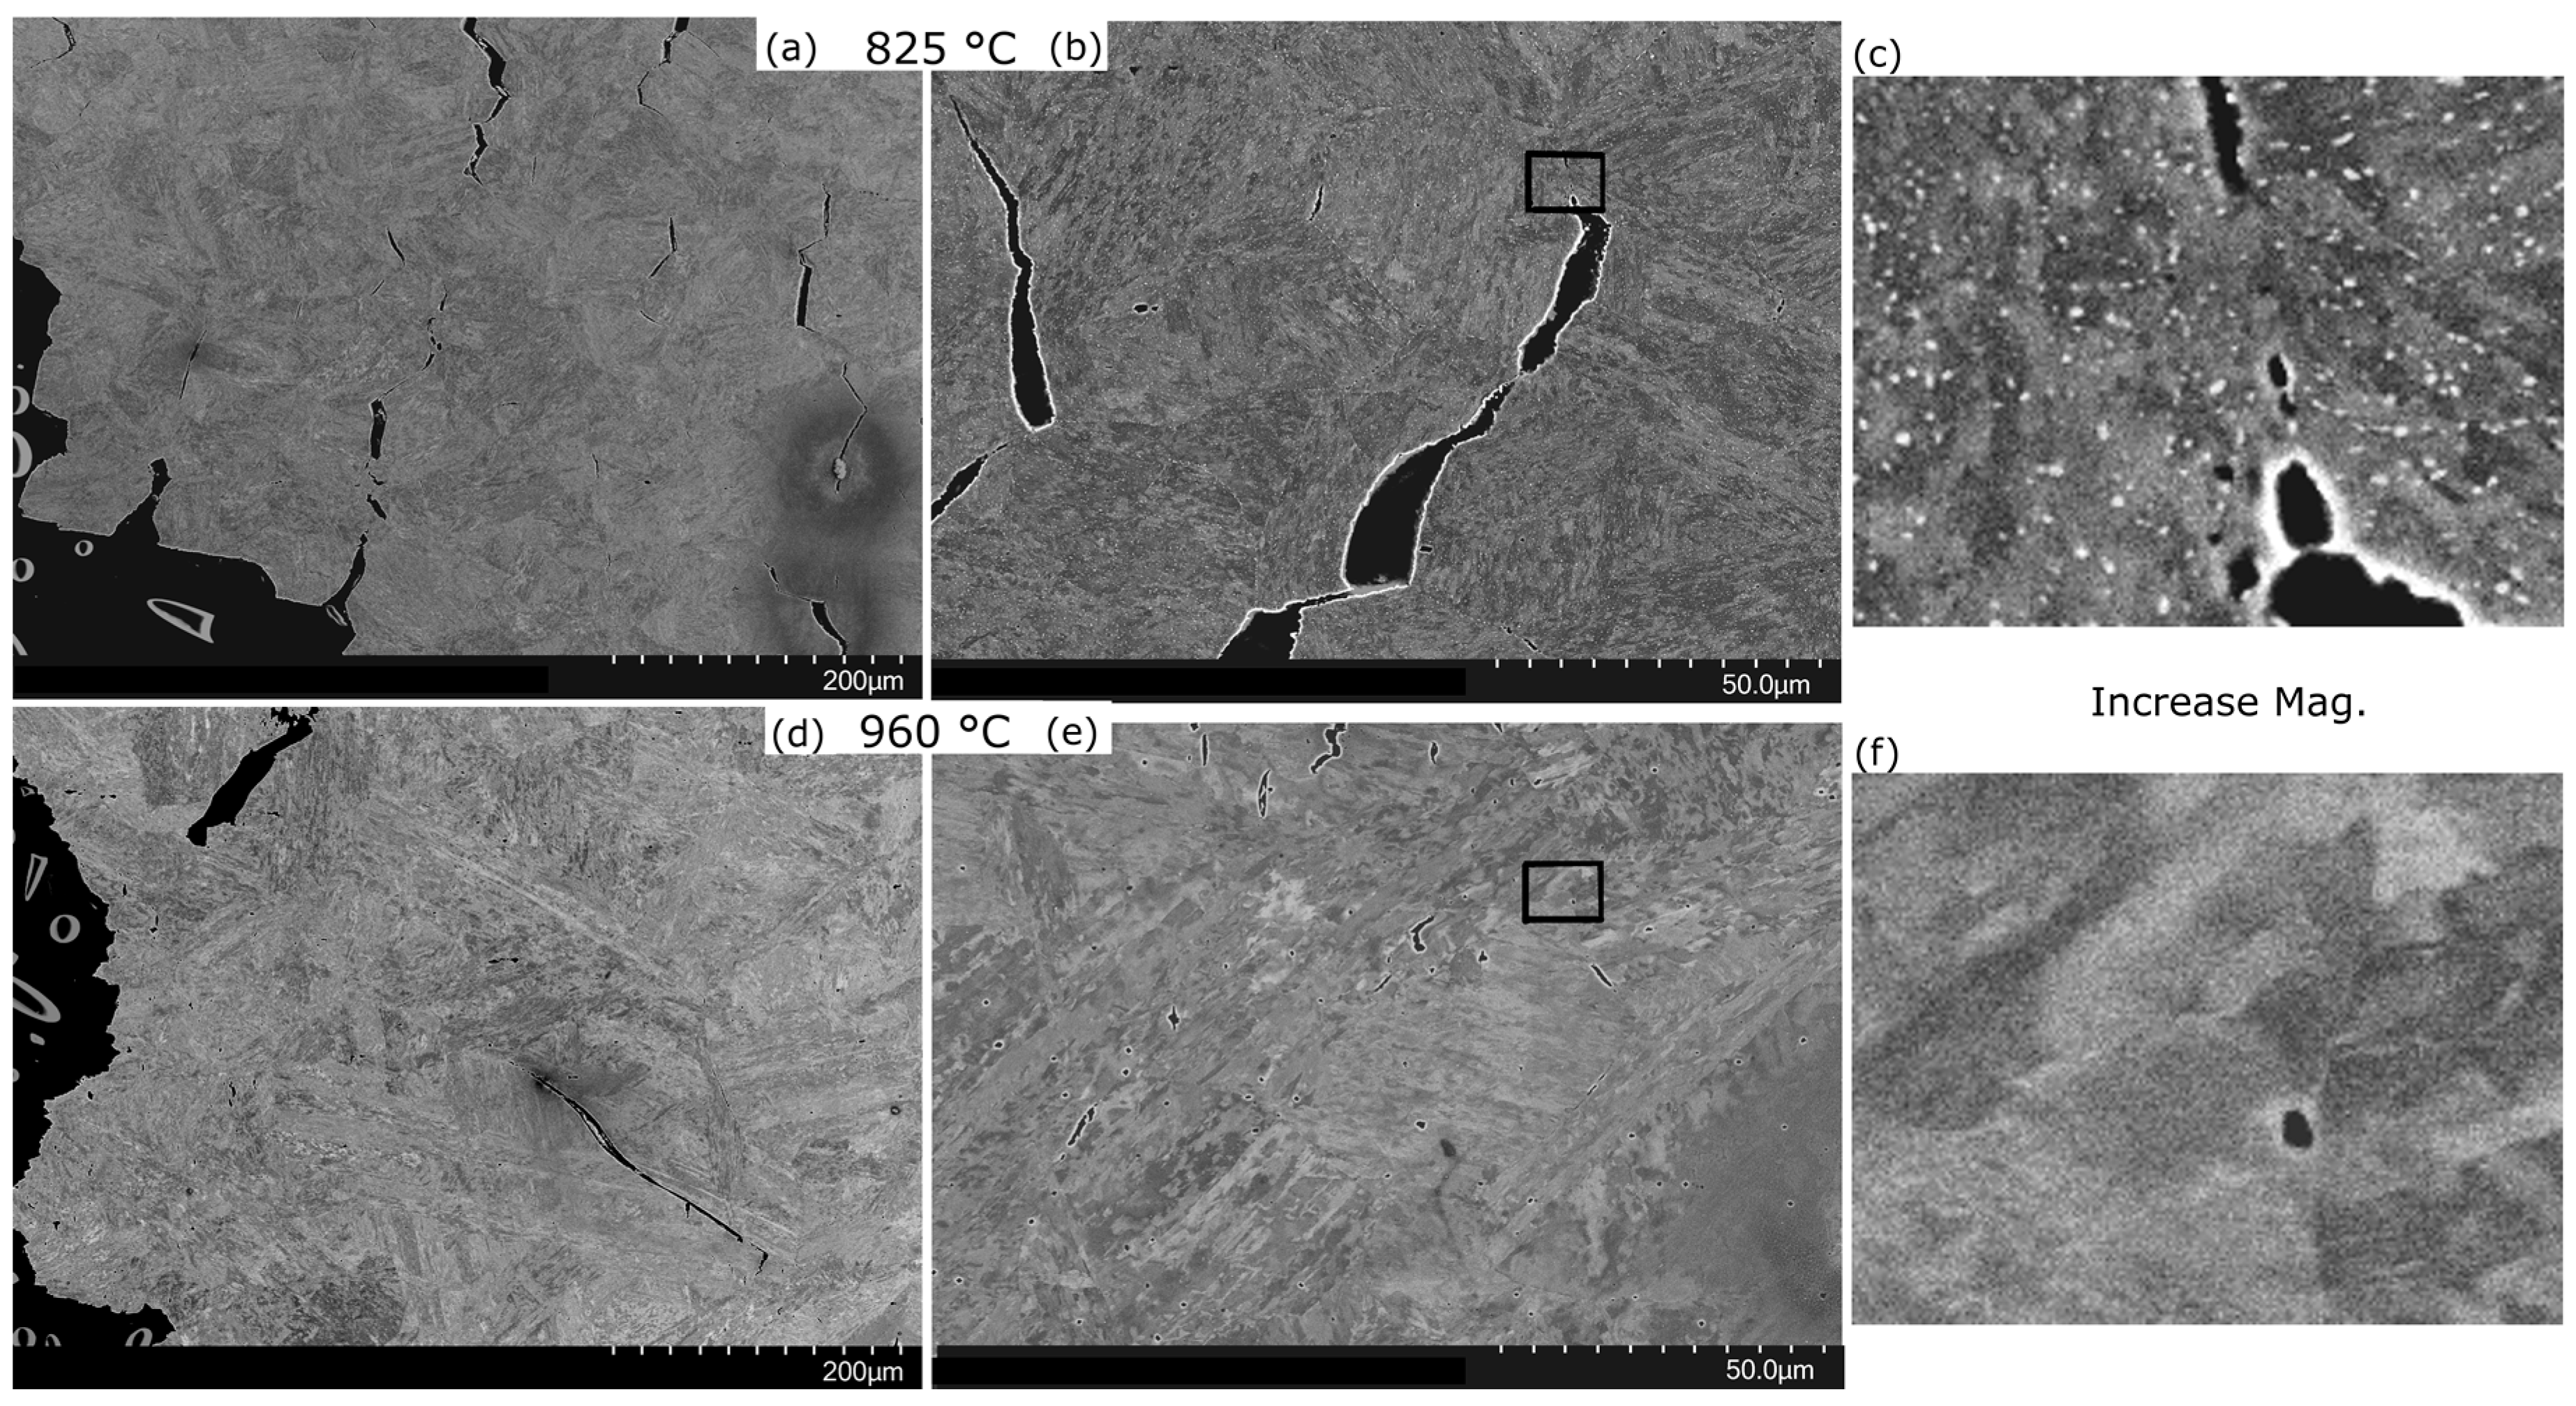
3.1. Martensite Microstructure
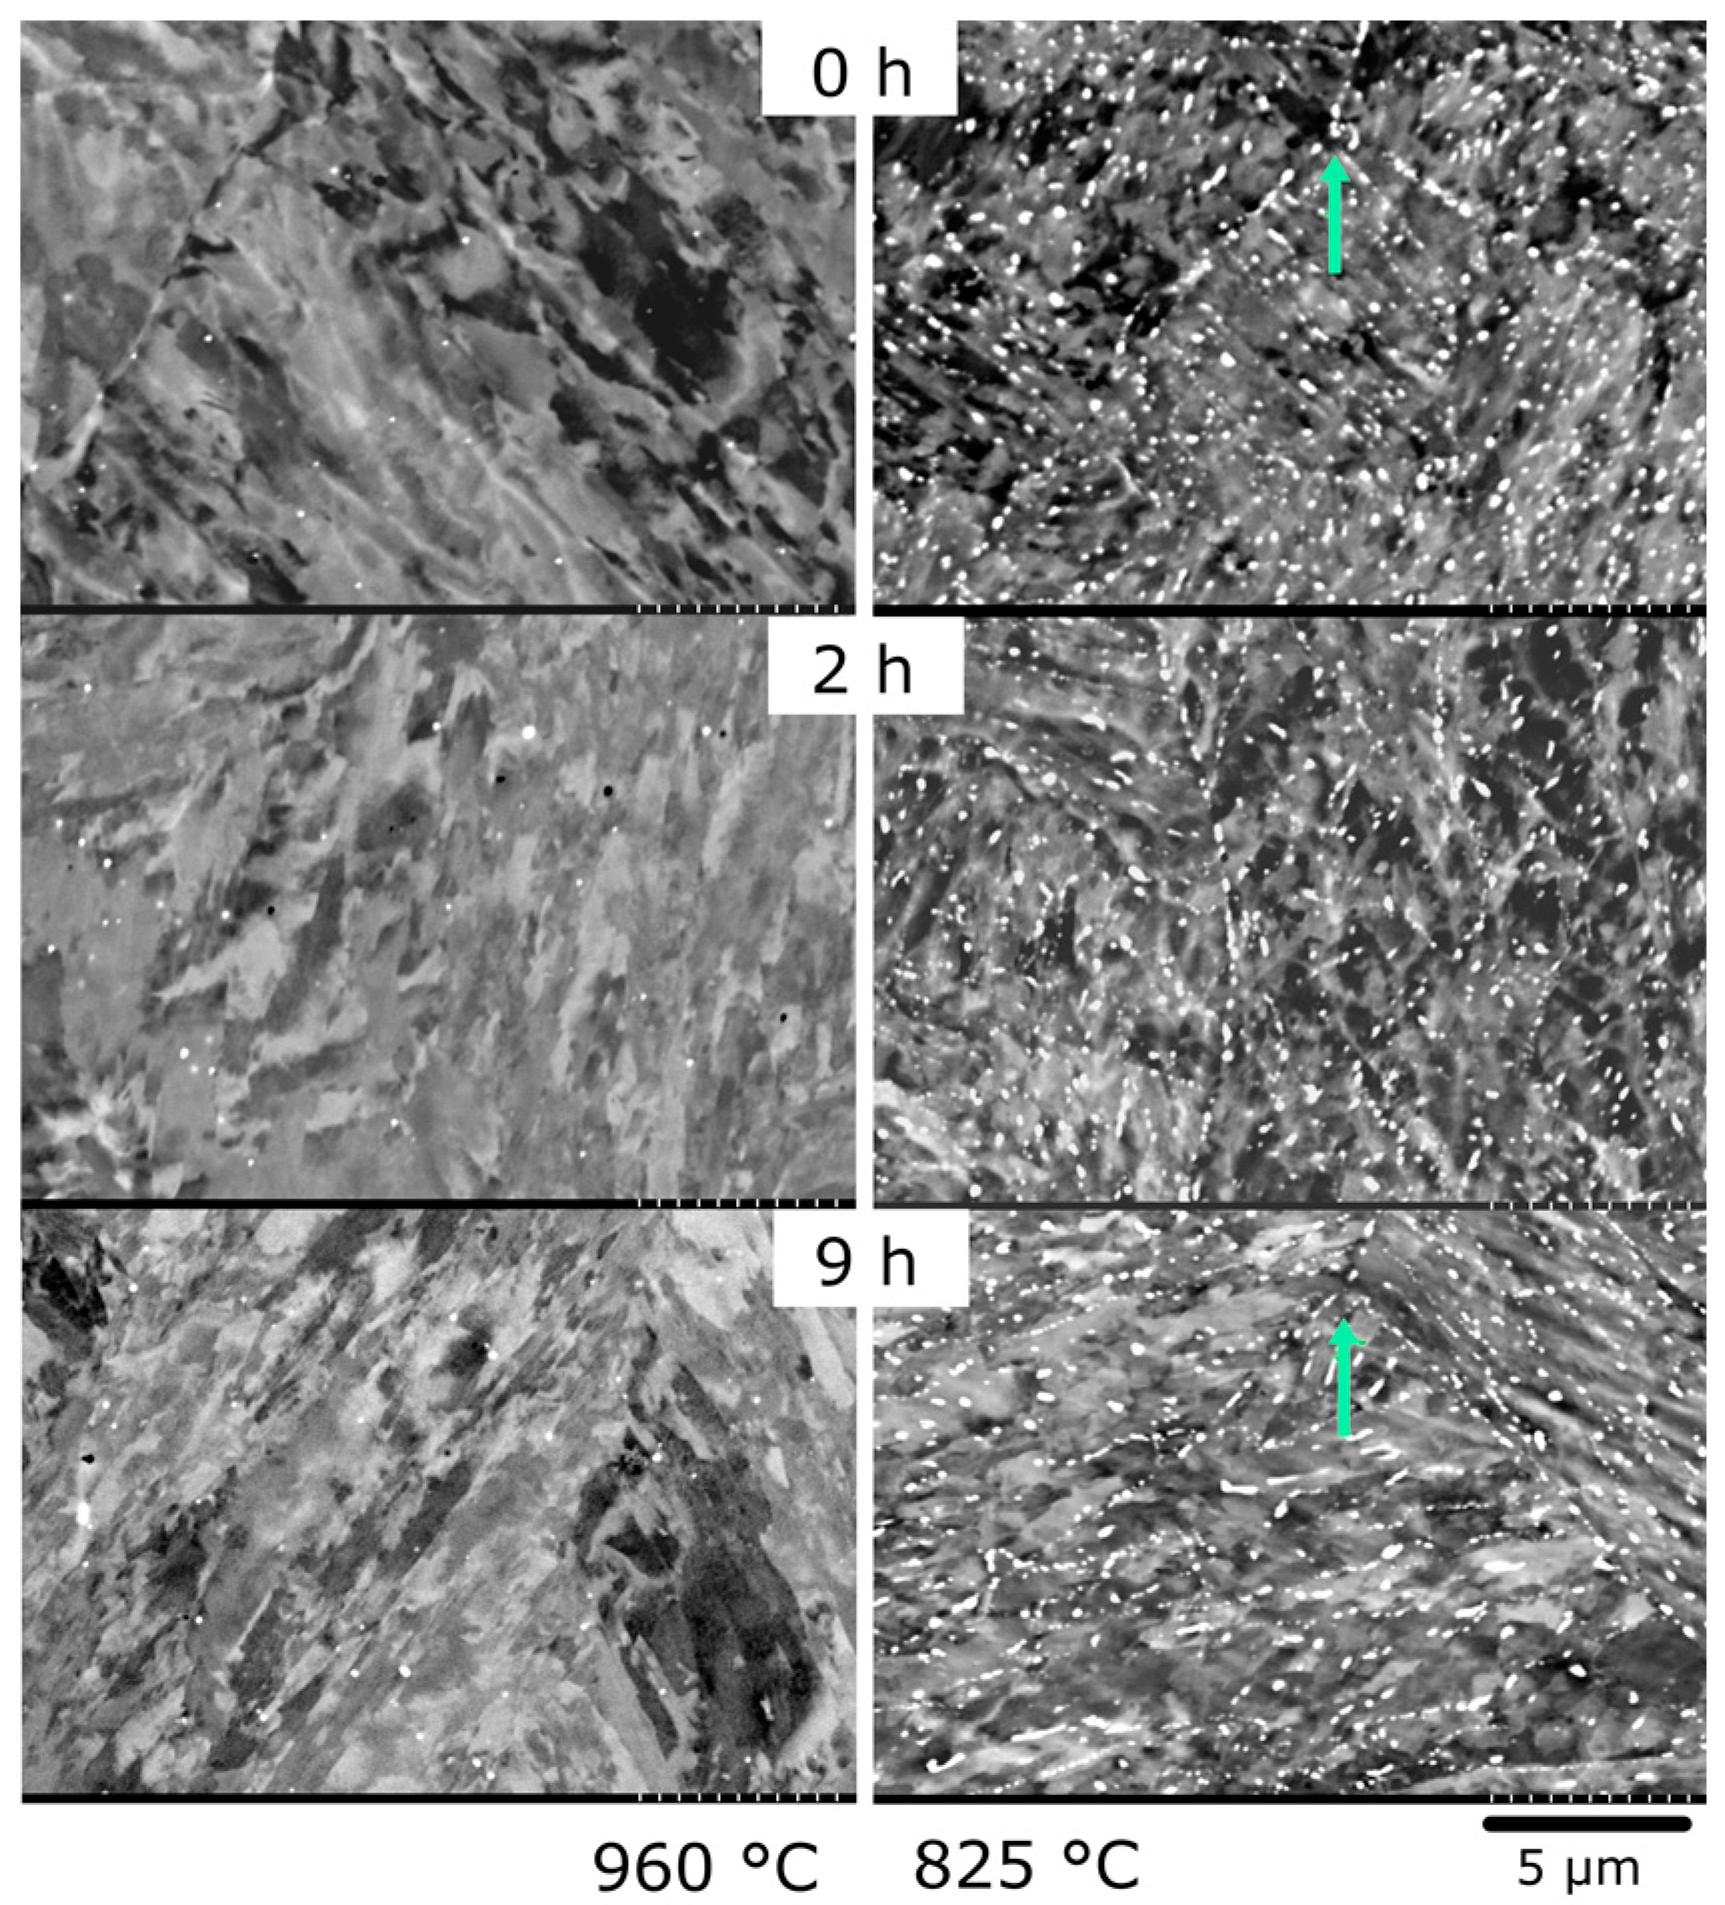
3.2. Precipitation
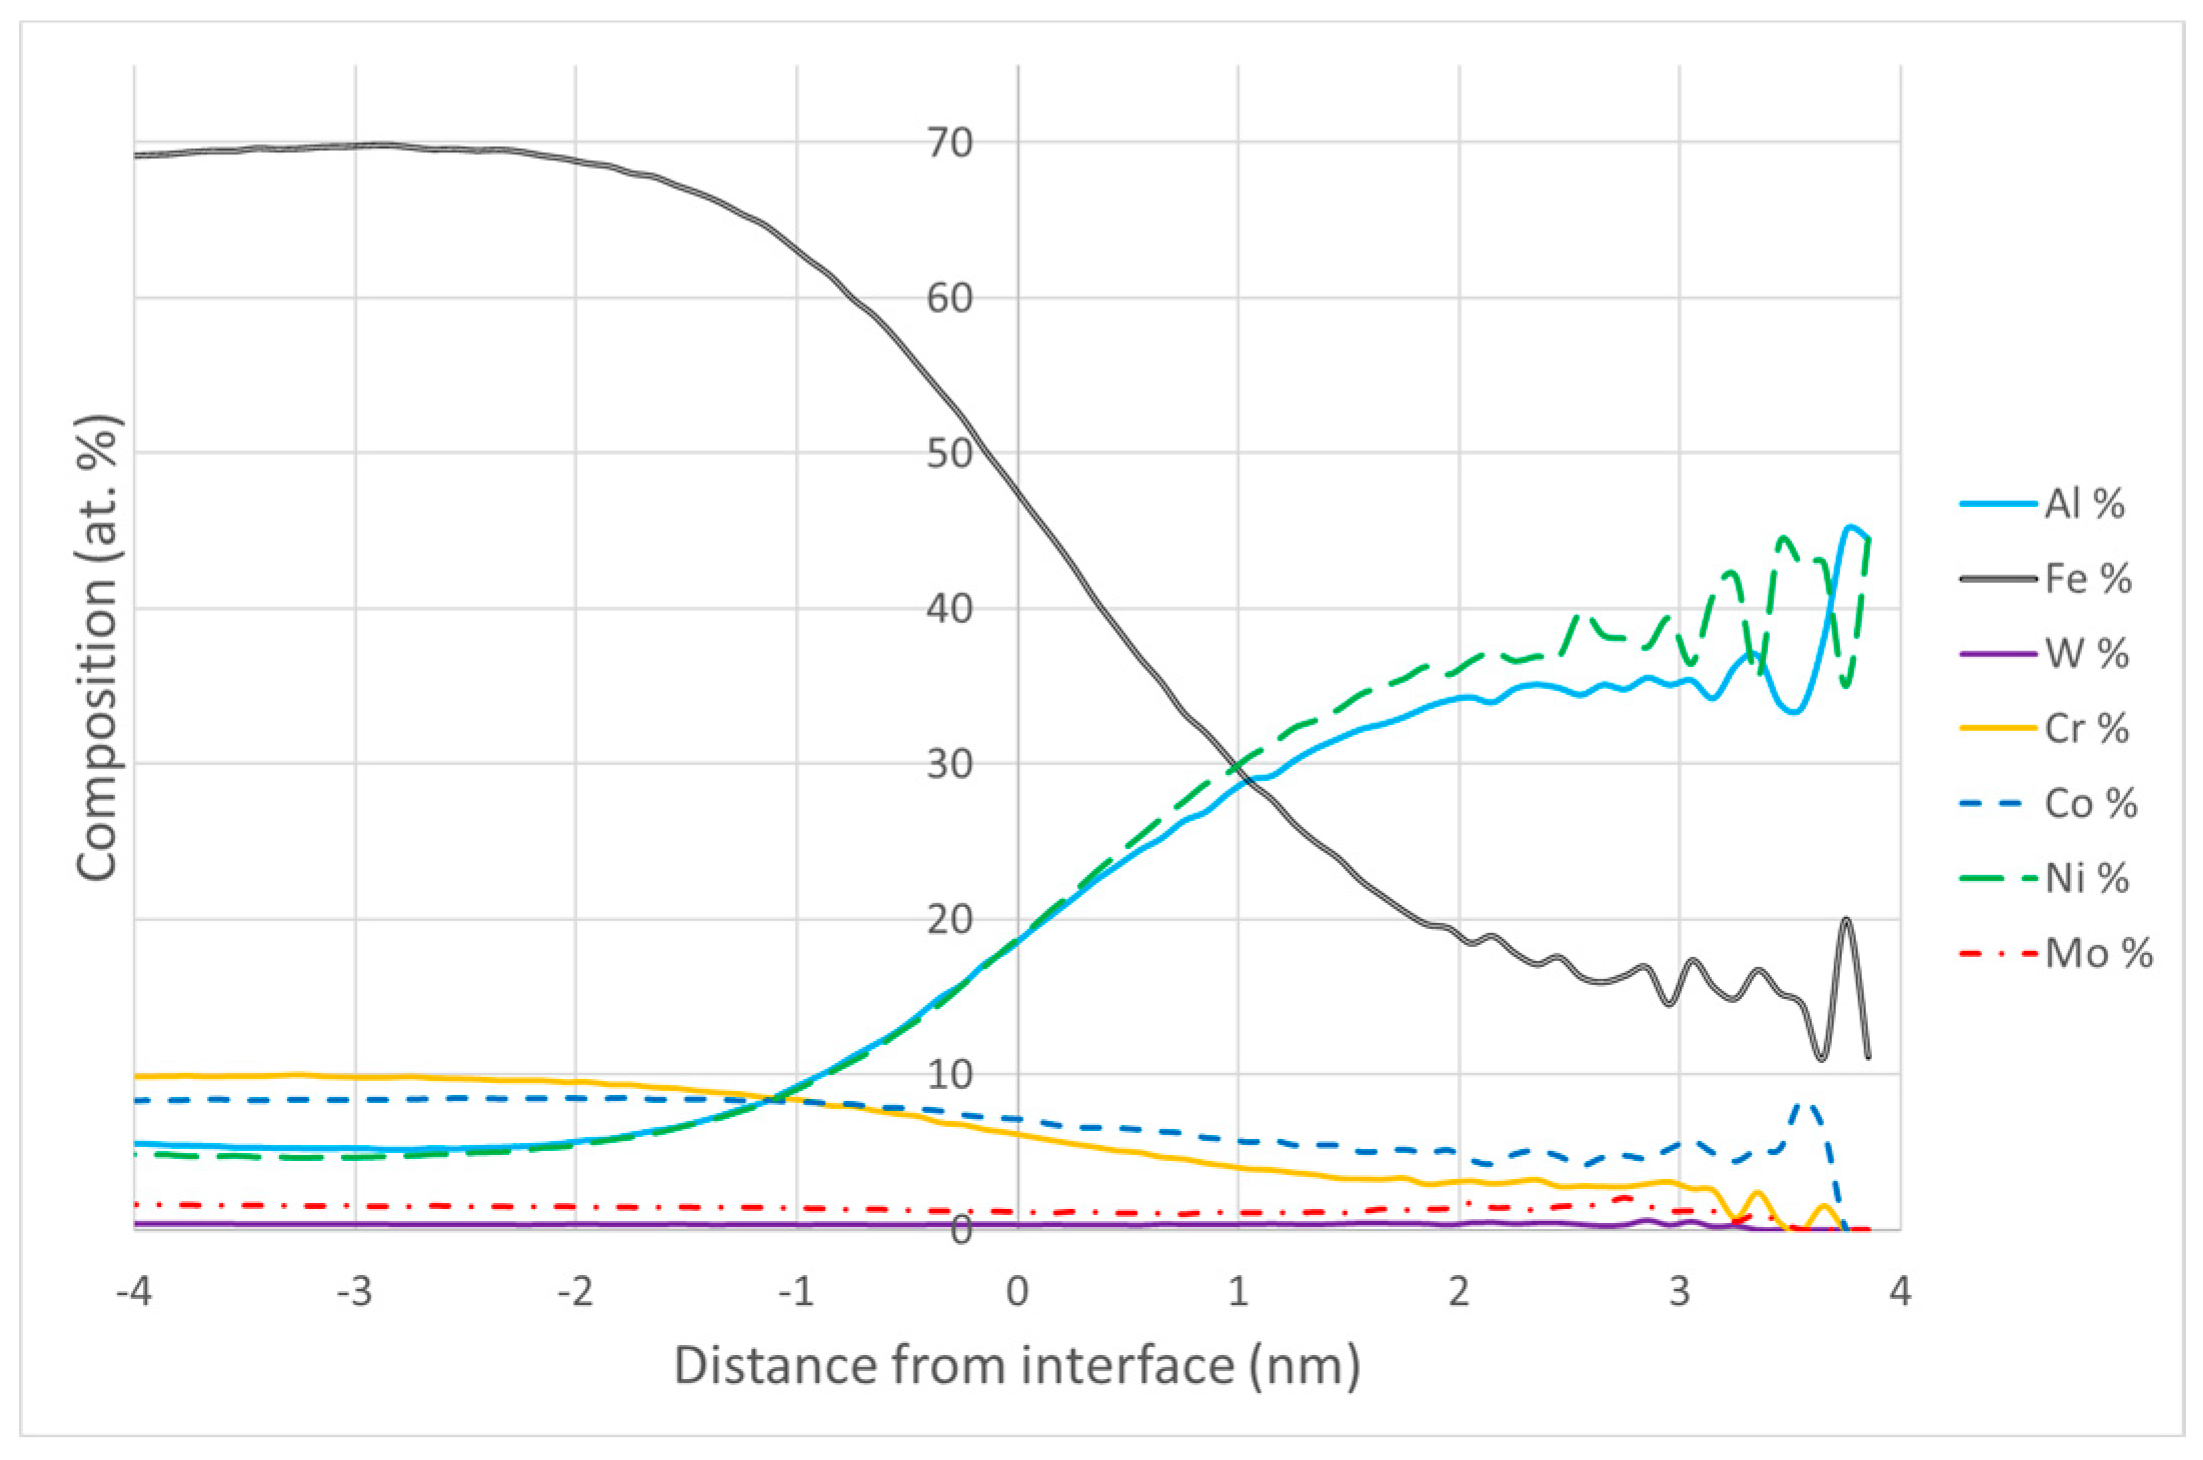
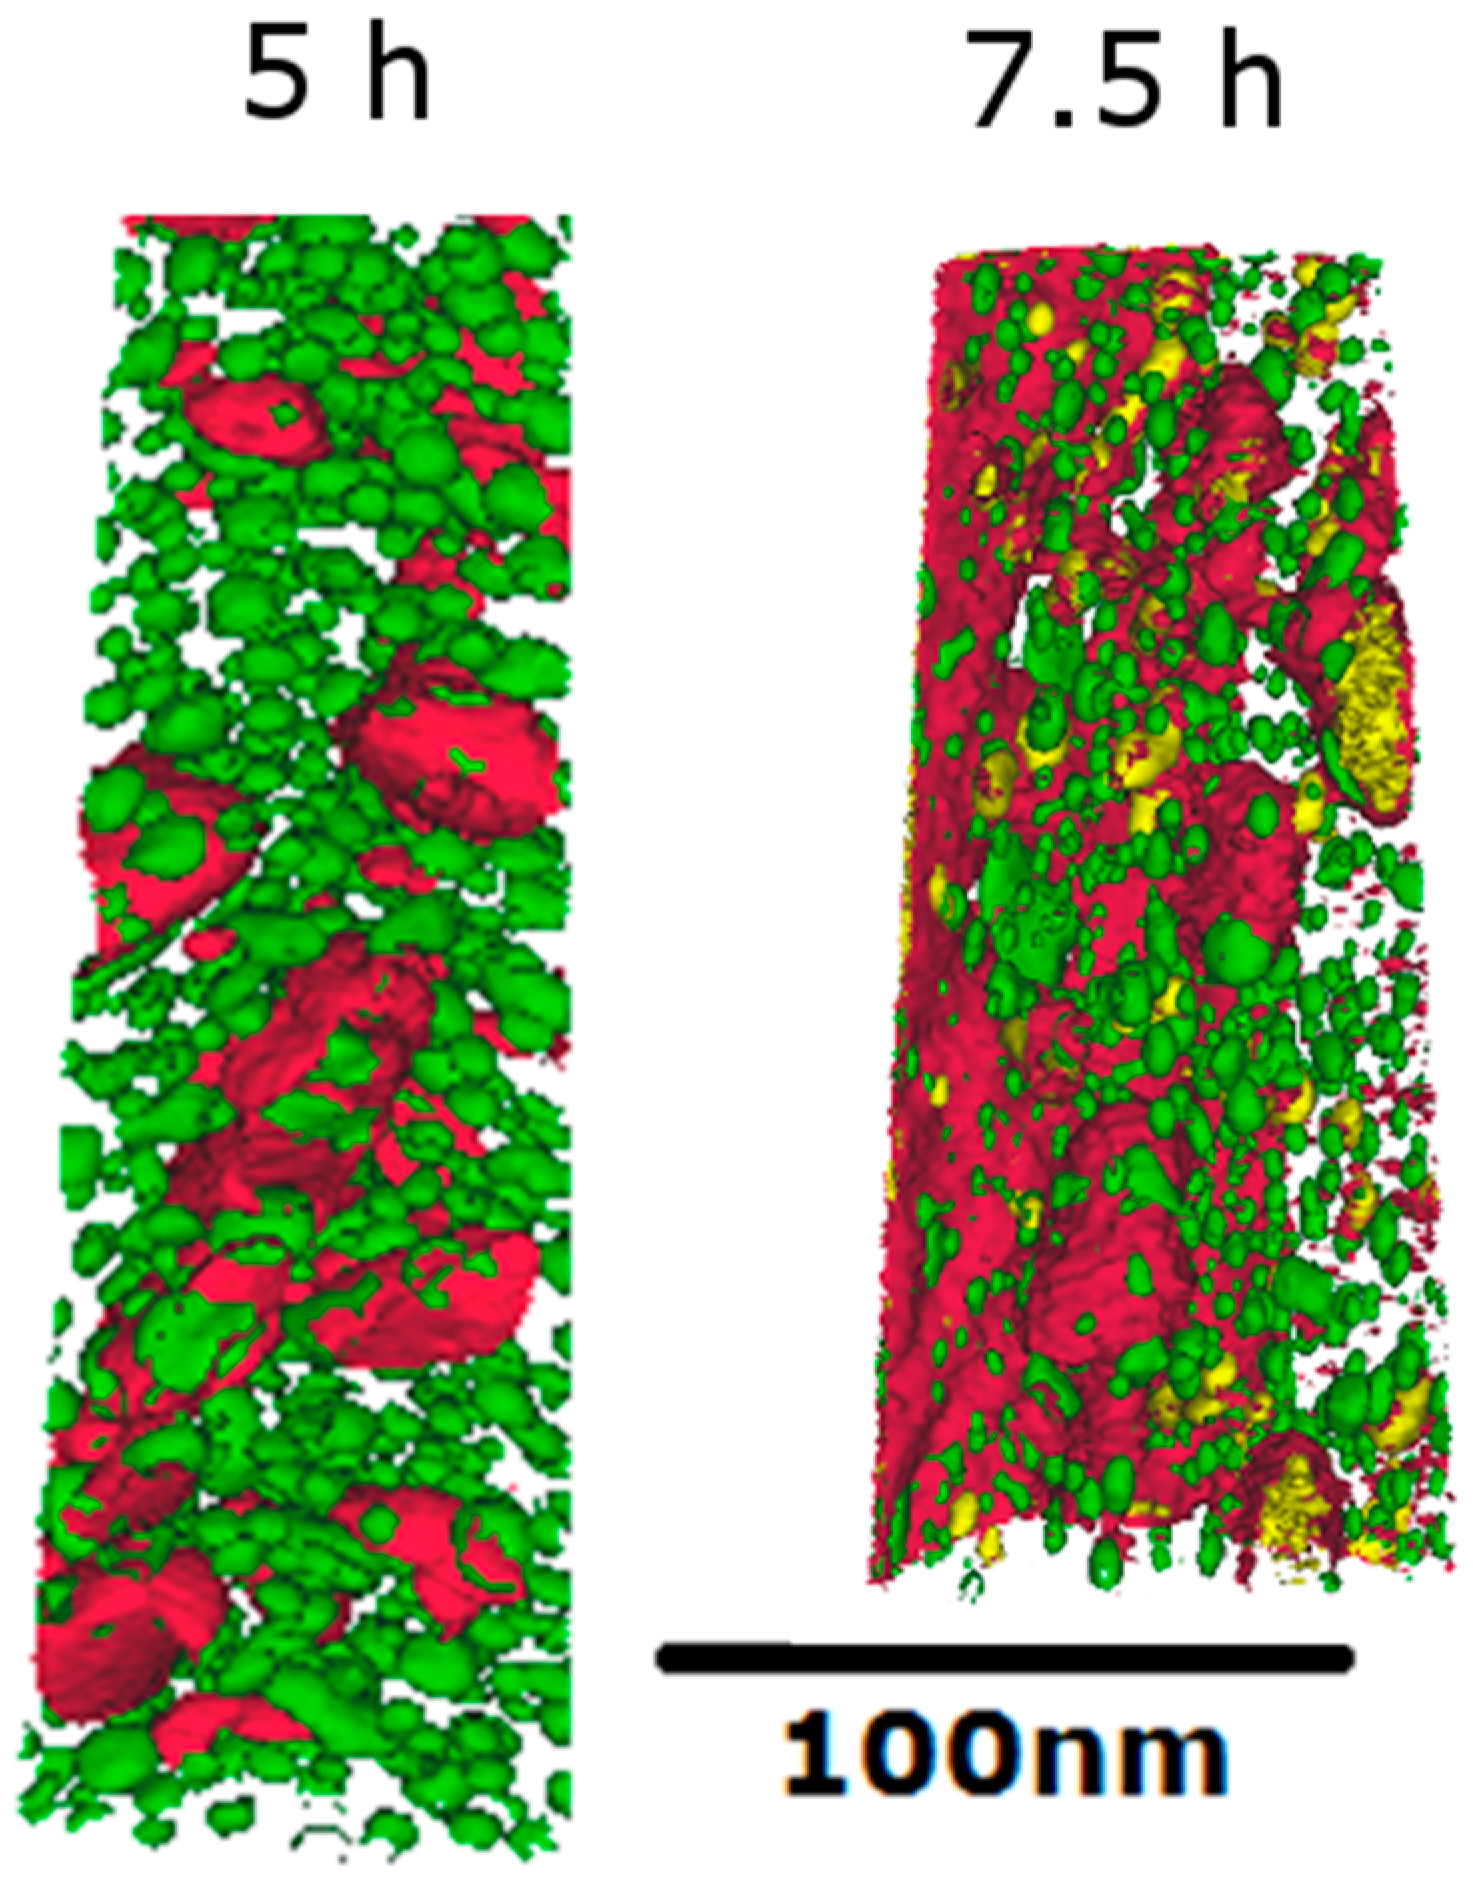
3.2.1. SEM and APT
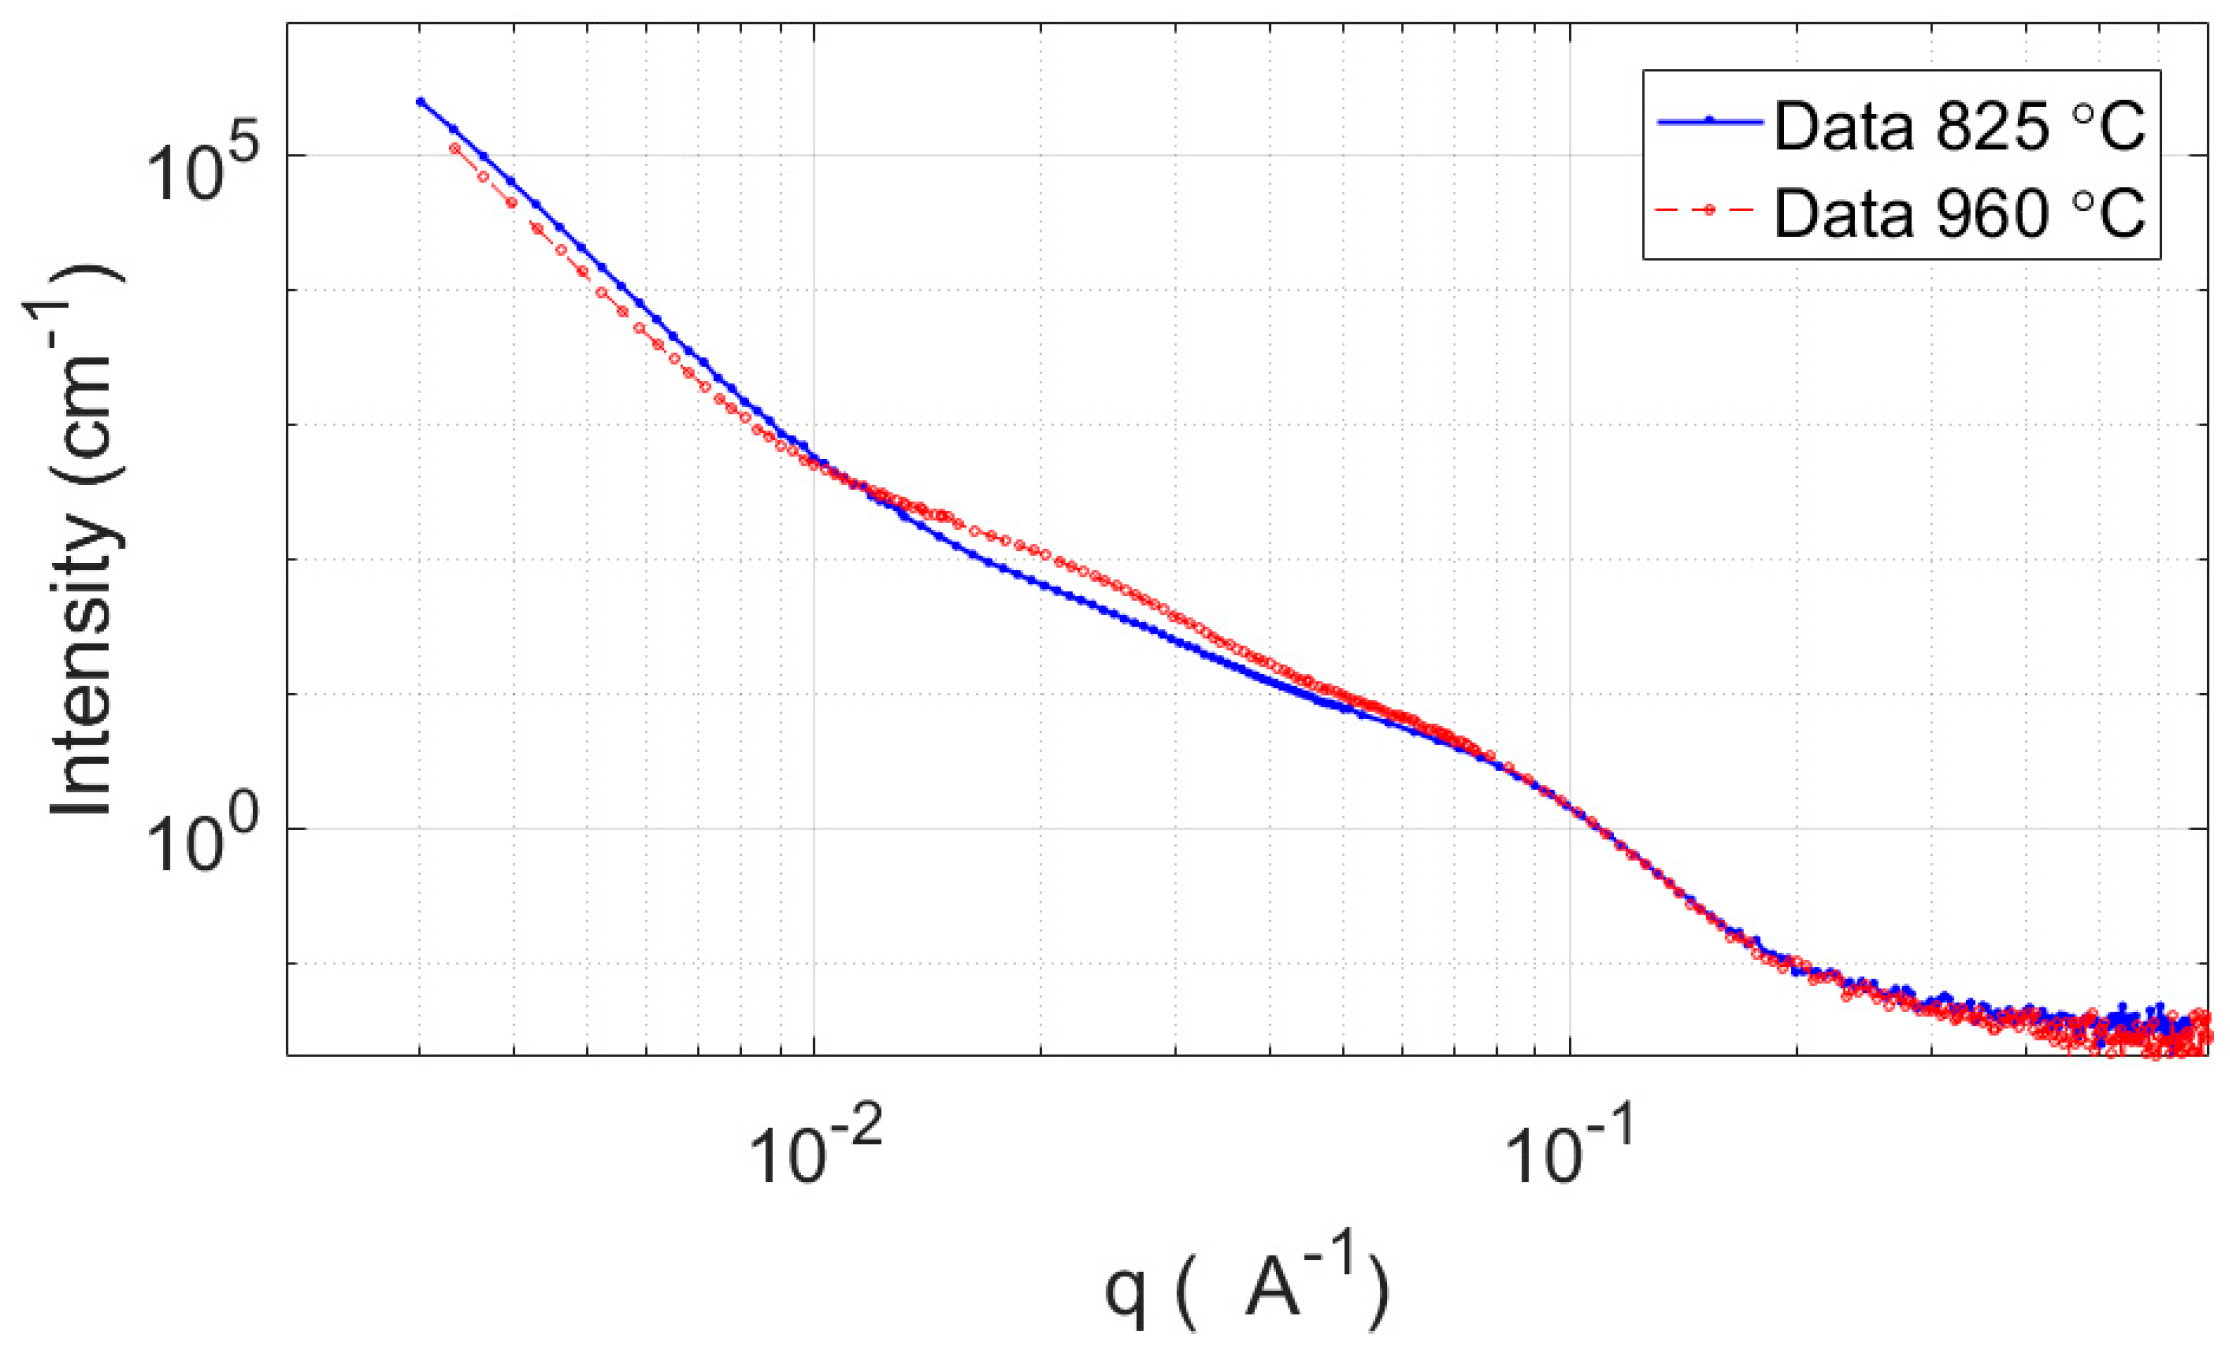
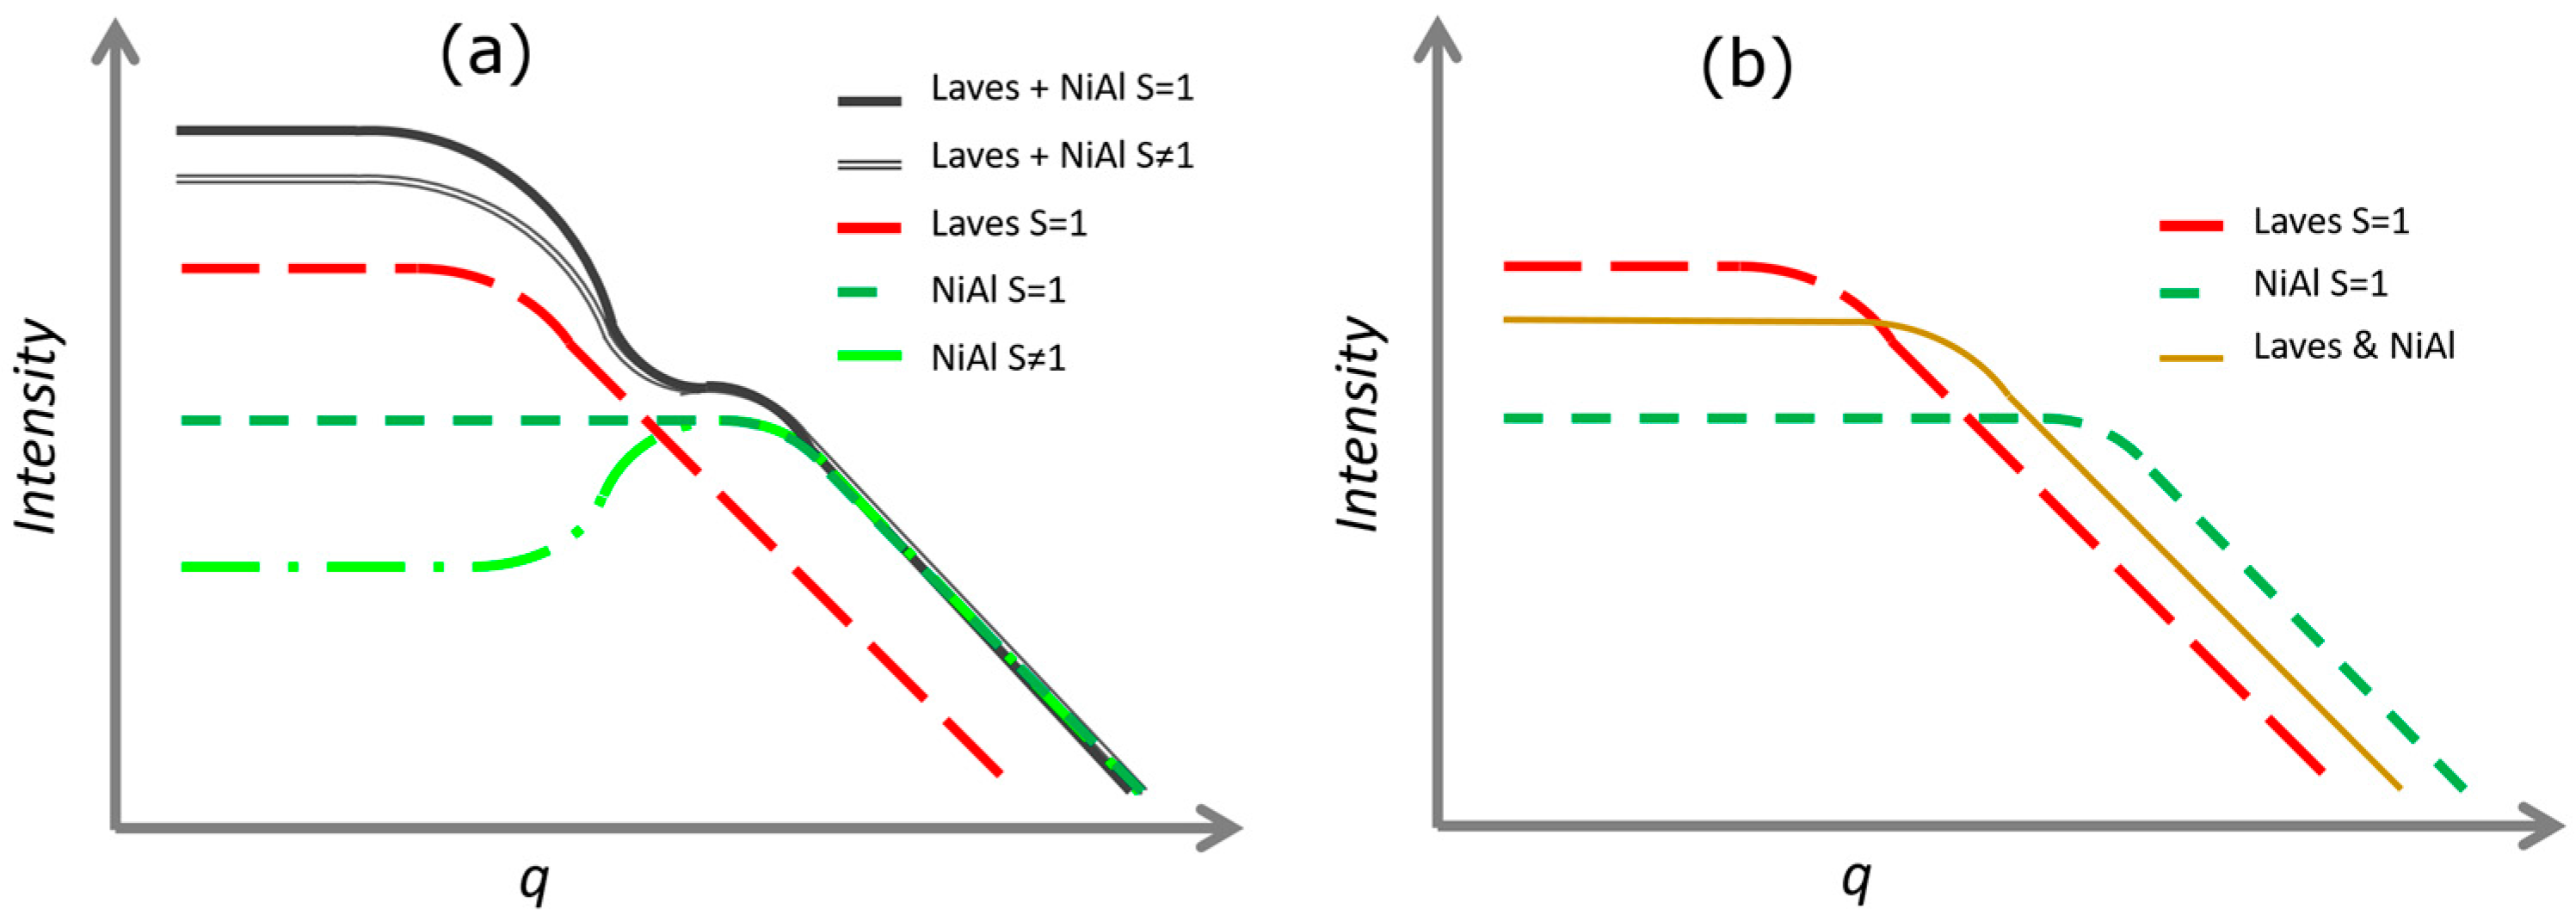
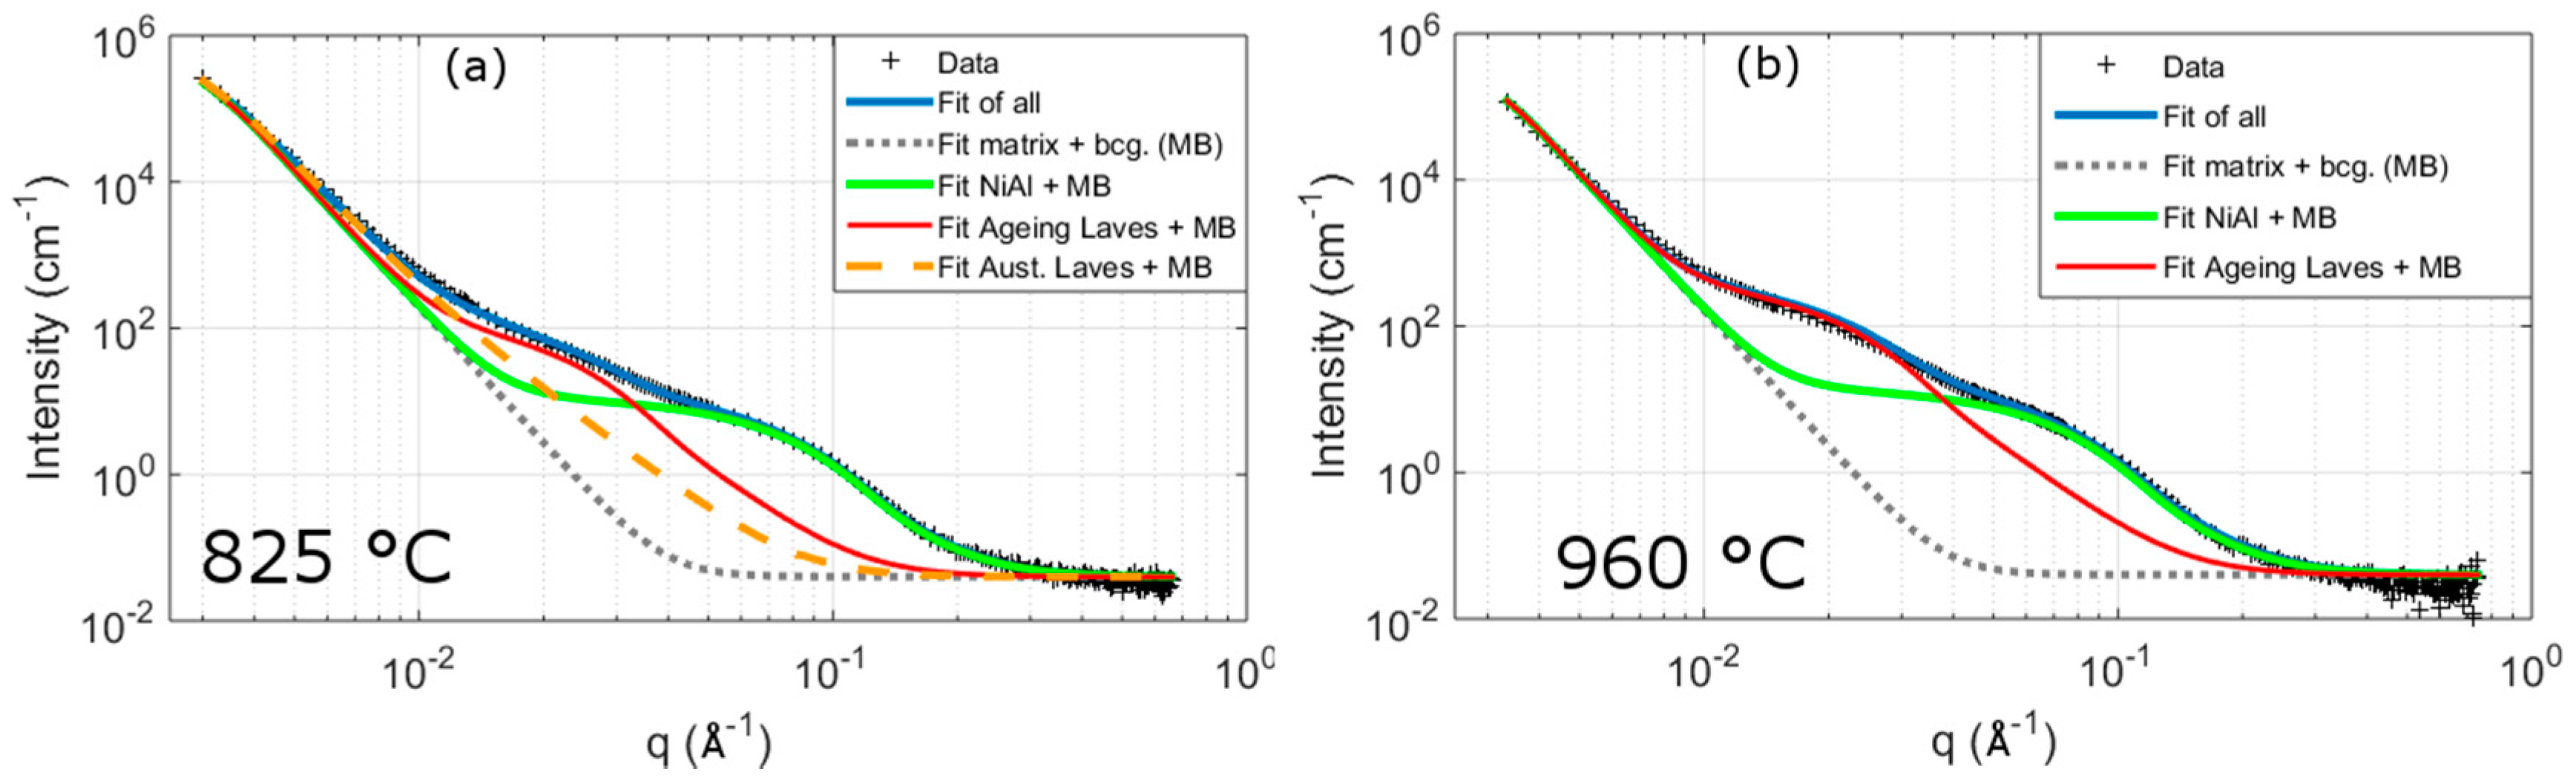
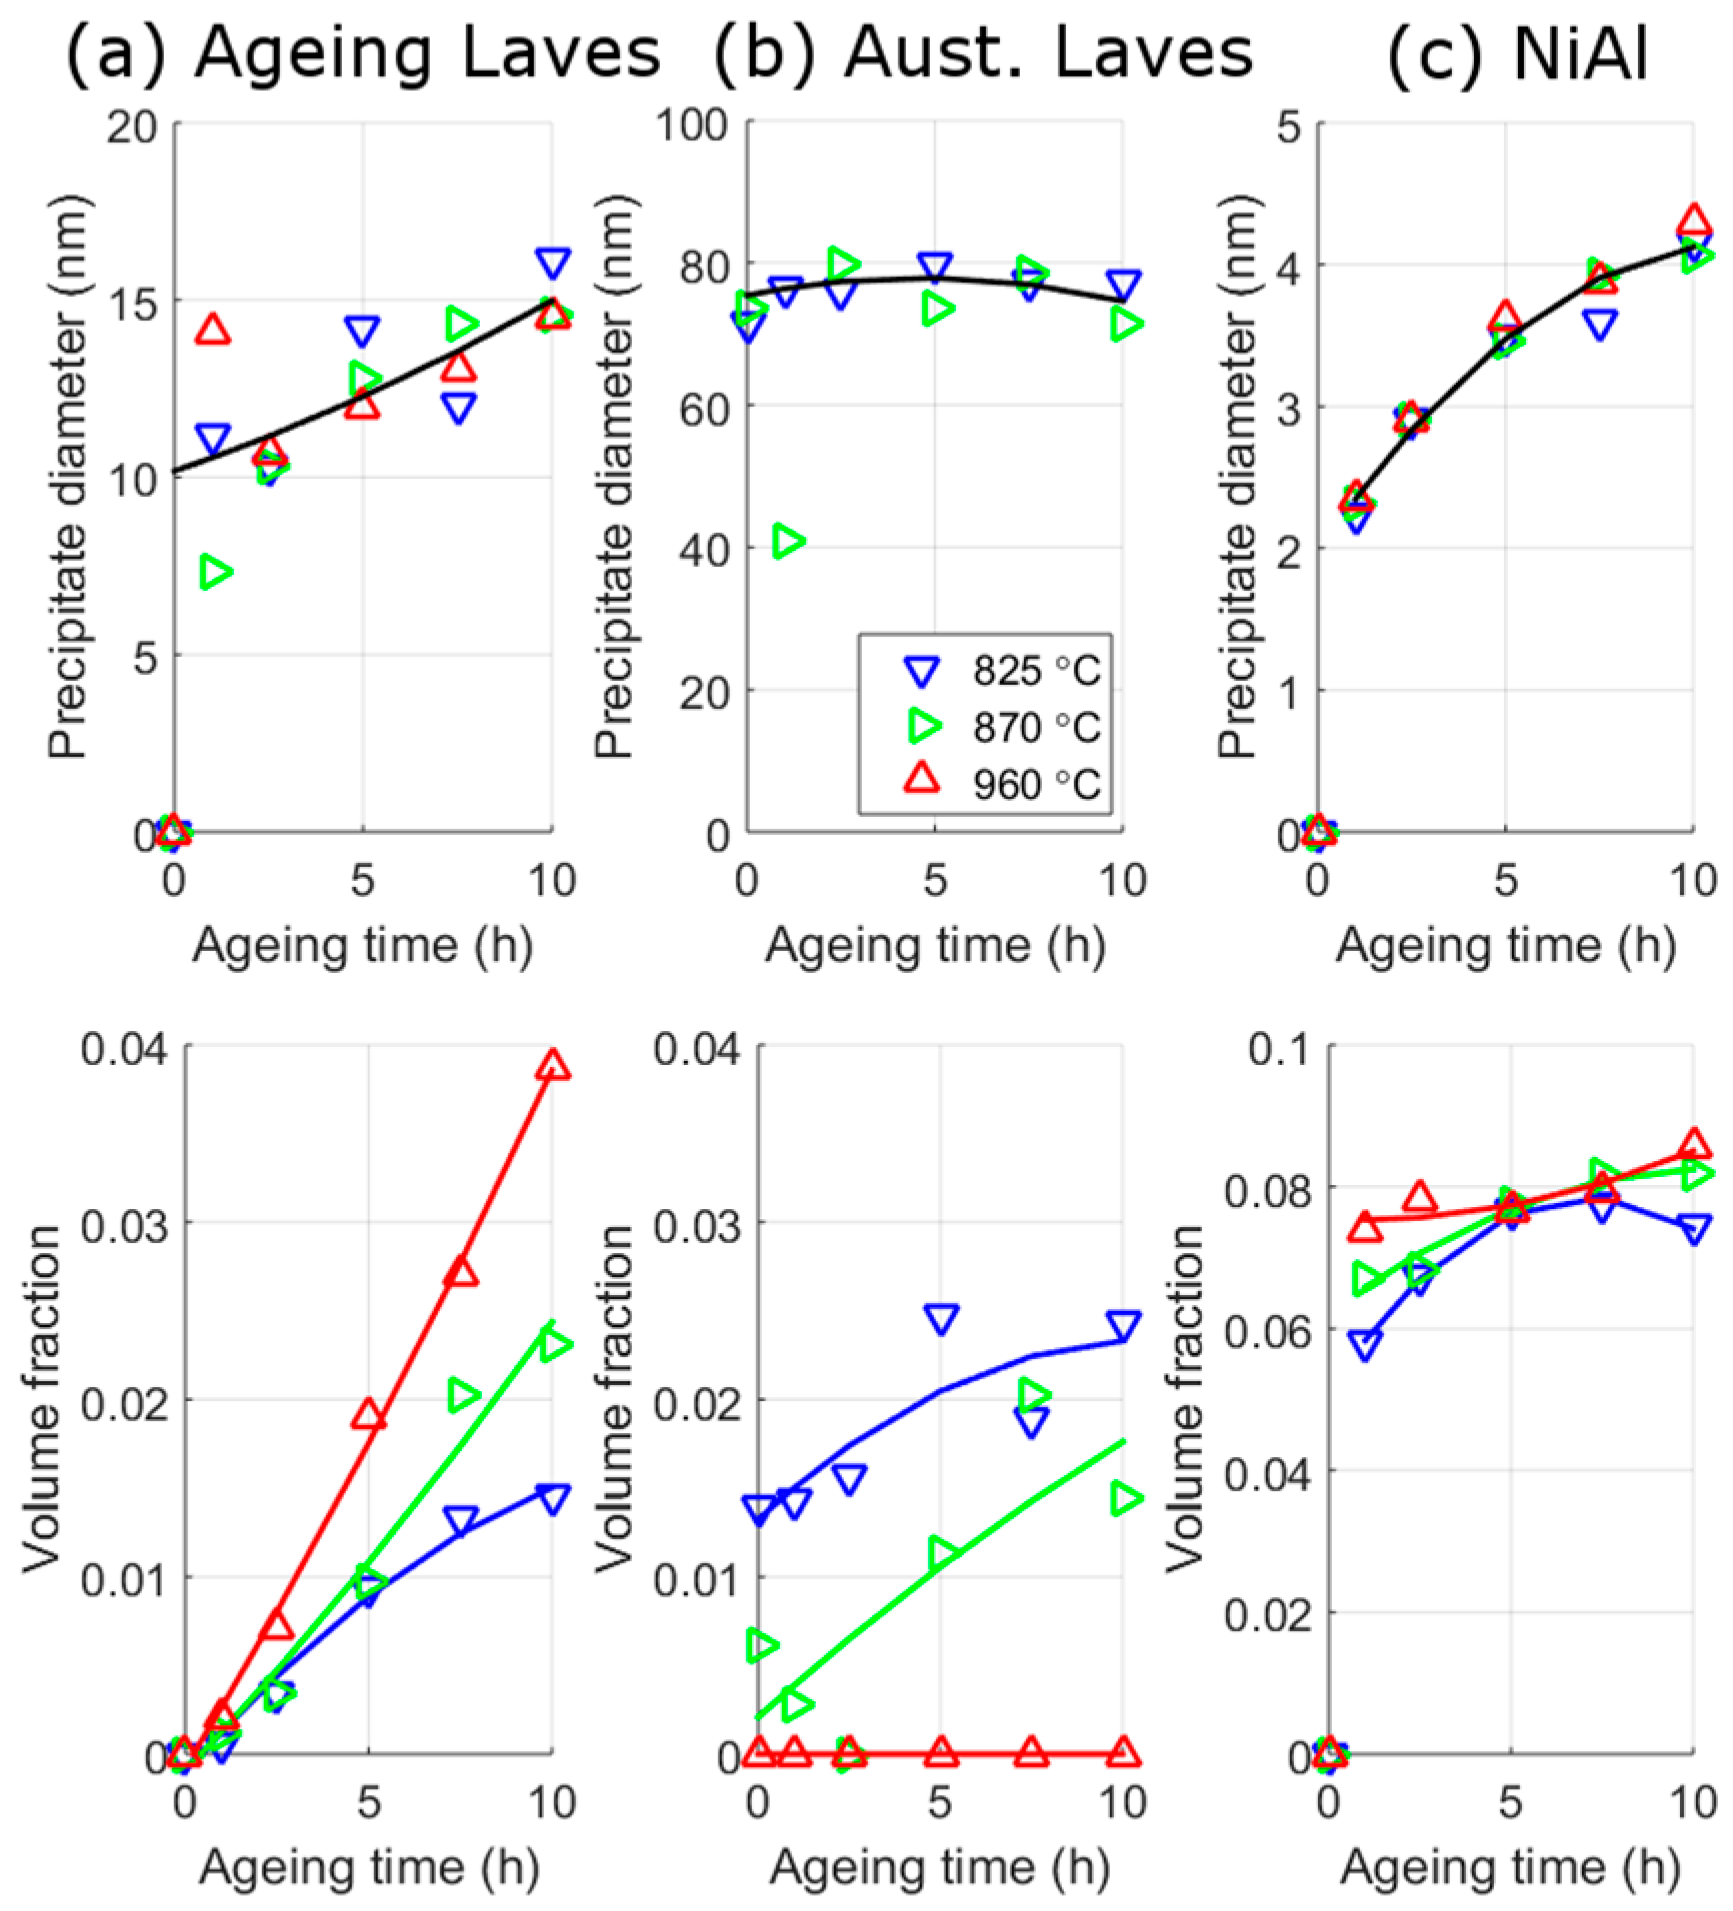
3.2.2. SANS
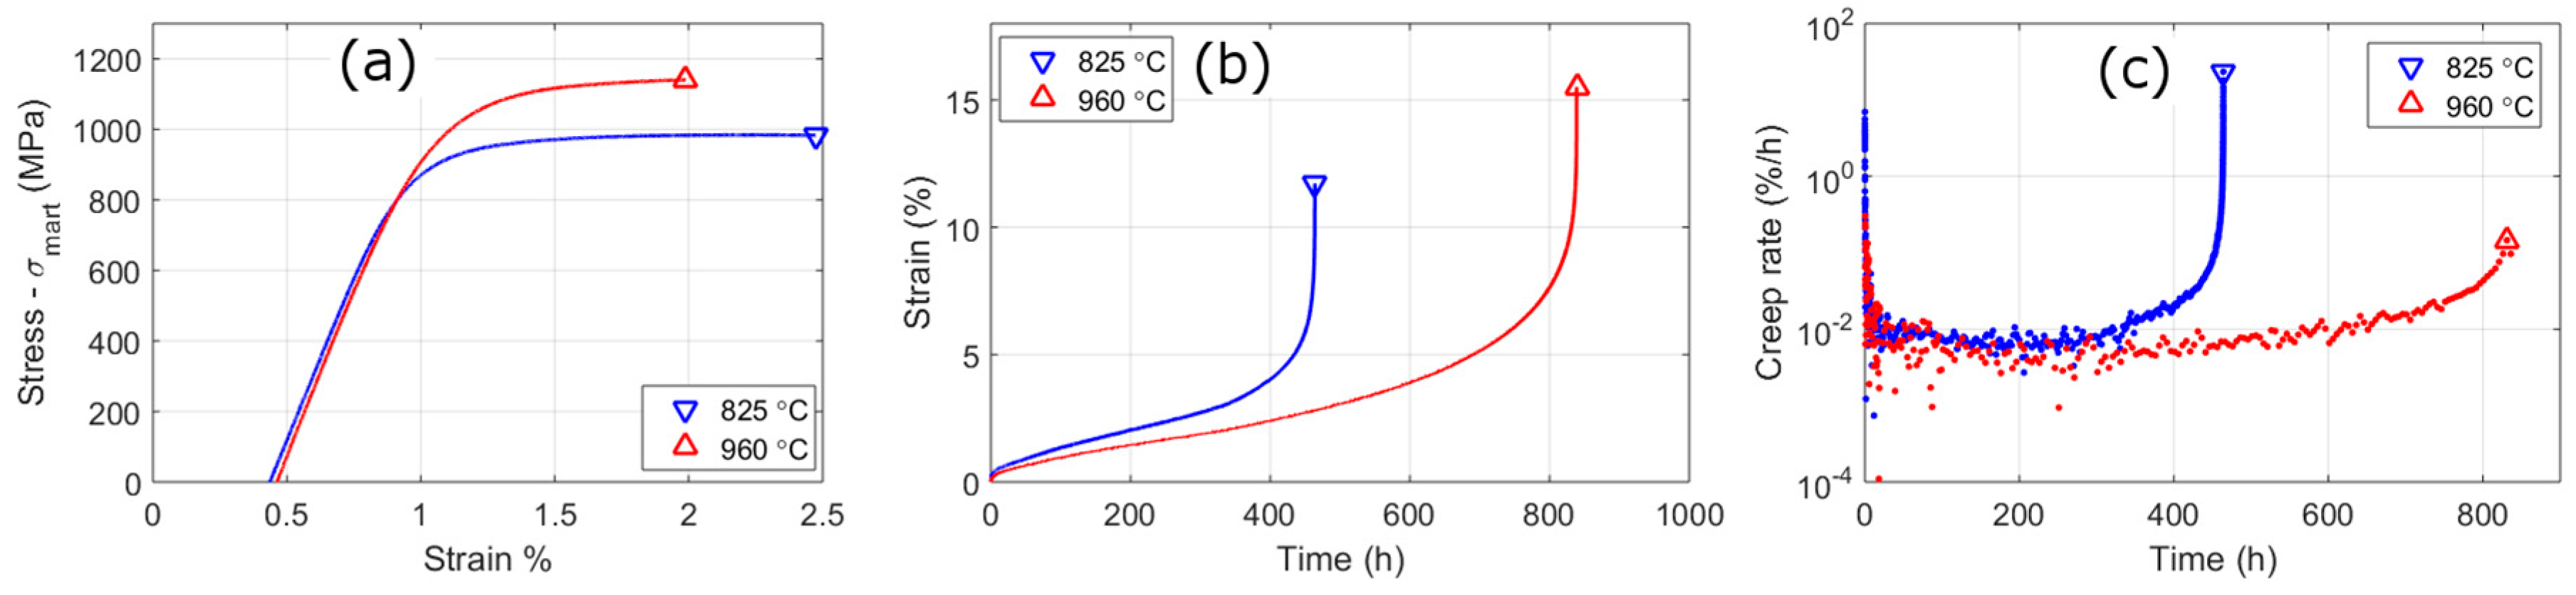
3.3. Mechanical Tests
4. Discussion
4.1. SANS Analysis
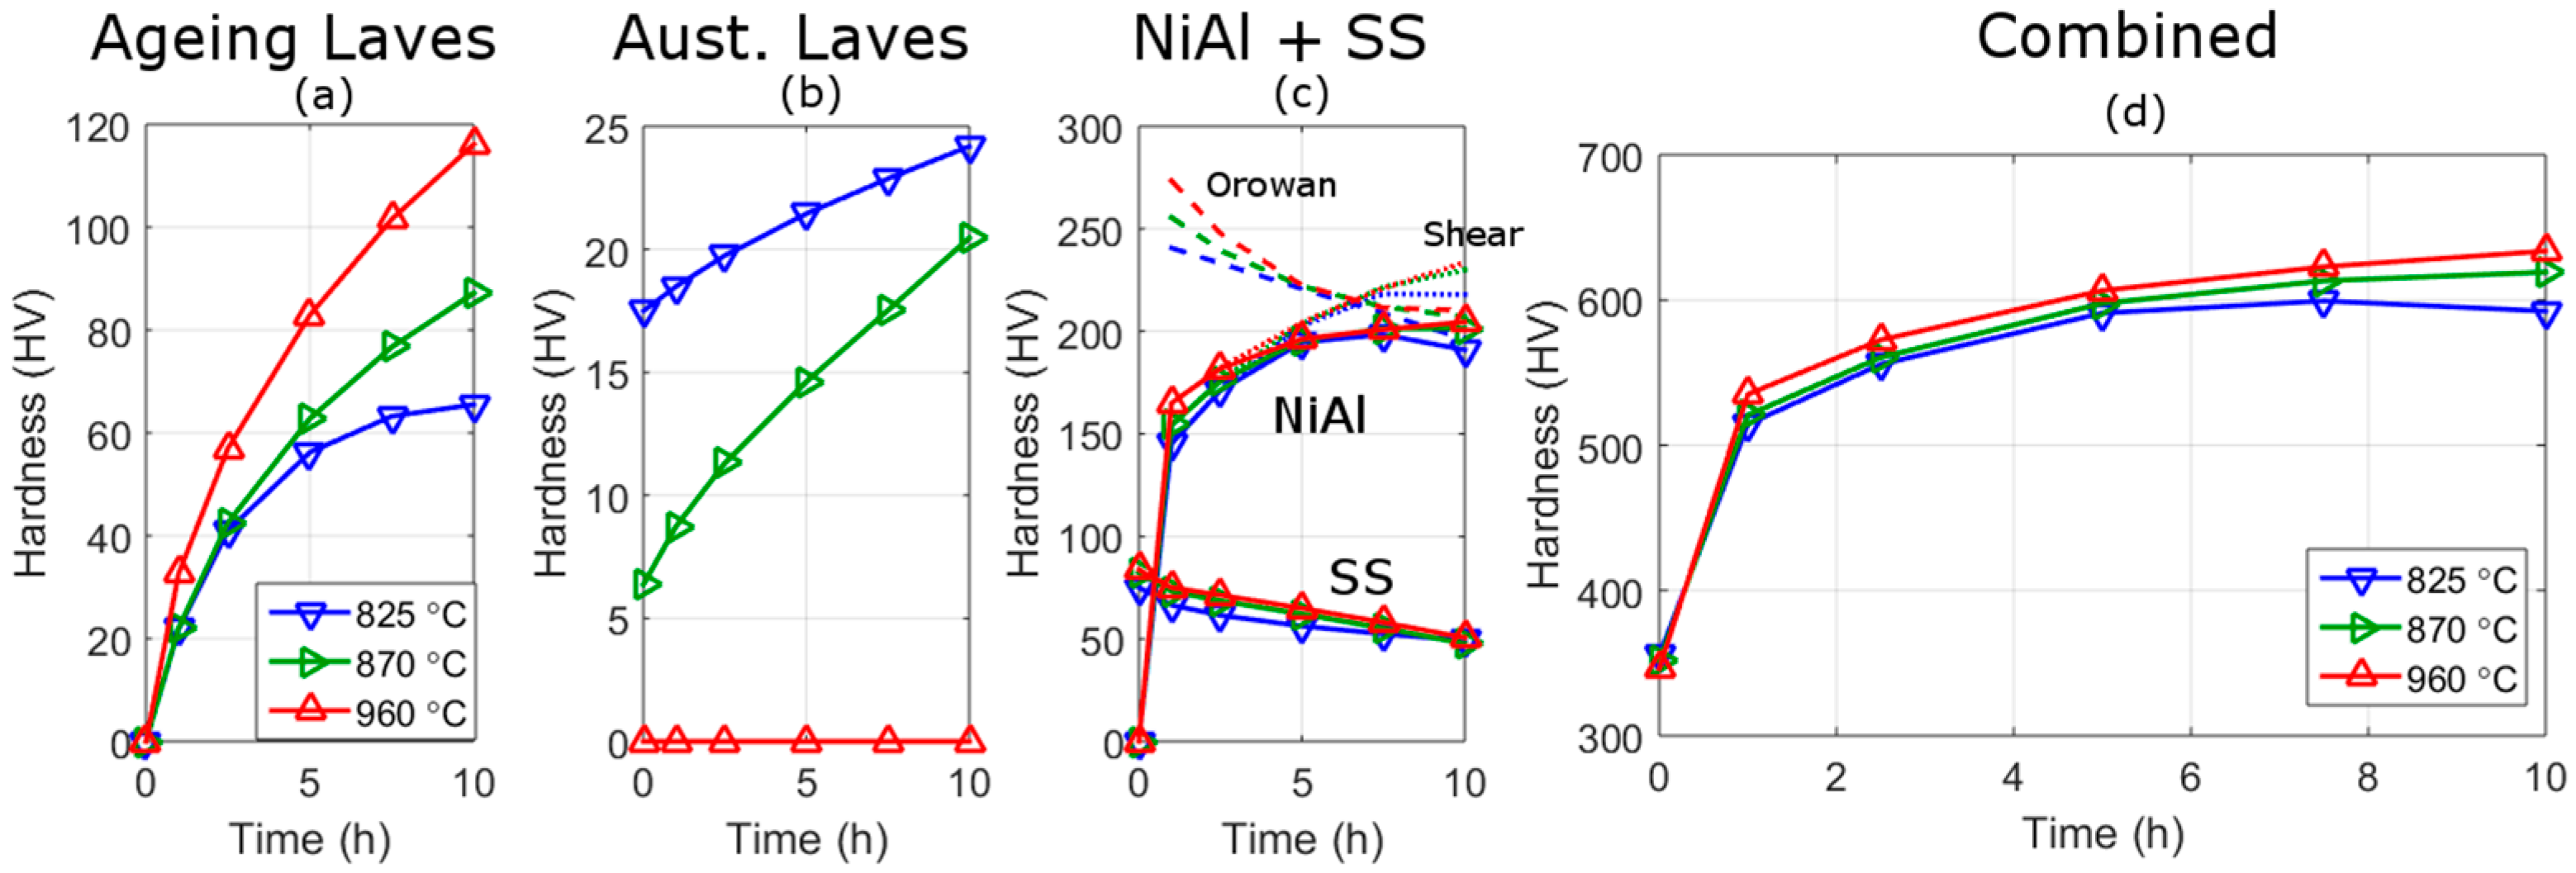
4.2. Strengthening Mechanisms
4.3. Failure Mechanisms
4.4. Martensitic Microstructure
4.5. Characterisation of Maraging Steels
5. Conclusions
- Quantification of precipitates from several nanometres to several 100 nanometres during processing.
- ○
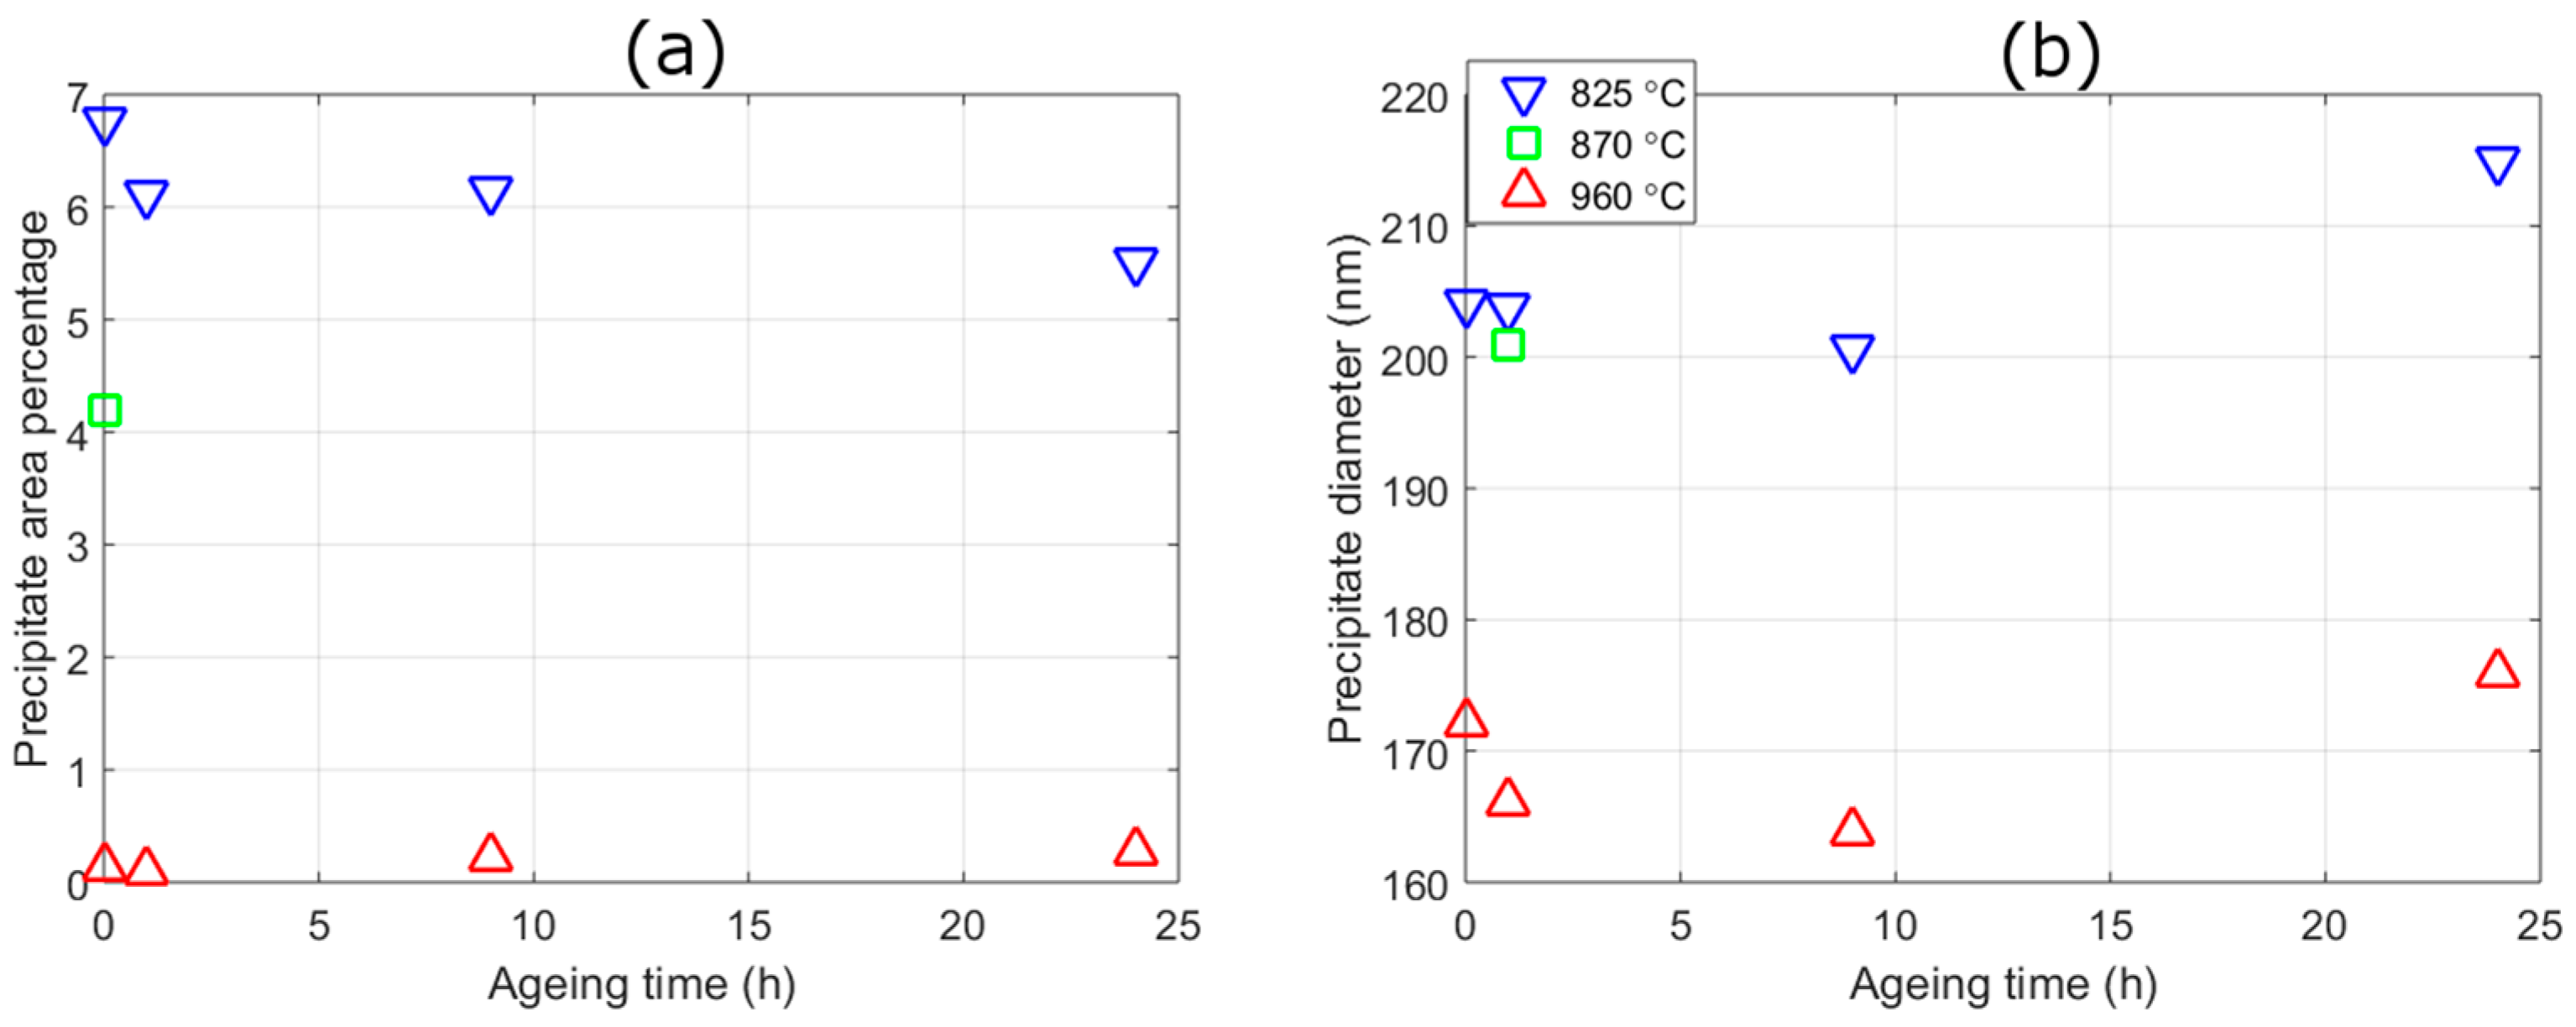
- It was shown that during austenitisation at the lower two temperatures, large Laves phase precipitates were precipitated on and within the prior austenite grain boundaries. As a result, the volume fraction of fine Laves precipitates that form during ageing was reduced. Although, the absolute volume fraction of Laves phase was relatively constant, the choice of austenitisation temperatures allows for the ratio of small and large Laves to be changed.
- Quantification of the martensitic microstructure of the austenitisation heat-treatments.
- ○
- It was shown that the highest austenitisation temperatures had larger prior austenite grain sizes and block sizes, than the lowest.
- The changes in microstructure were related to changes in hardness, tensile and creep properties using strengthening models.
- ○
- It was shown that the production of austenitisation Laves phase is detrimental to strength and creep properties, because ageing Laves have a greater contribution to strengthening. Conversely, the ageing Laves precipitates were found to be detrimental to elongation because they raise the ductile to brittle transition temperature.
- ○
- The difference in martensitic microstructure from the initial austenitisation treatment will add additional strengthening to lower austenitisation treatment as well as reduce the ductile to brittle transition temperature. This highlights how the influence of a heat-treatment regime often results in changes, sometimes rather complex, on many microstructural parameters and hence mechanical properties.
Acknowledgments
Author Contributions
Conflicts of Interest
Appendix A. Small Angle Scattering Analysis

| Element | Matrix (7.5 h) | NiAl (5 h) | NiAl (7.5 h) | |
|---|---|---|---|---|
| bi (×10−6 Å) | xi | xi | xi | |
| Fe | 94.5 | 74.8% | 15.6% | 14.0% |
| Cr | 36.4 | 11.7% | 2.7% | 1.4% |
| Co | 24.9 | 8.2% | 4.9% | 2.7% |
| Ni | 103.0 | 3.5% | 42.0% | 48.0% |
| Al | 34.5 | 0.2% | 34.2% | 32.2% |
| Mo | 67.2 | 1.0% | 1.2% | 1.2% |
| W | 48.6 | 0.5% | 0.5% | 0.5% |
| ρ (×10−6 Å−2) | 6.87 | 6.15 | 6.39 | |
| Δρ (×10−6 Å−2) | 0.72 | 0.47 |
References
- Martin, J.W. Concise Encyclopedia of the Structure of Materials. 2007. Available online: http://books.google.com/books?id=xv420pEC2qMC&pgis=1 (accessed on 21 November 2017).
- Haettestrand, M.; Andre, H.-O. Evaluation of particle size distributions of precipitates in a 9% chromium steel using energy® ltered transmission electron microscopy. Micron 2001, 32, 789–797. [Google Scholar] [CrossRef]
- Abe, F. Precipitate design for creep strengthening of 9% Cr tempered martensitic steel for ultra-supercritical power plants. Sci. Technol. Adv. Mater. 2008, 9, 13002. [Google Scholar] [CrossRef] [PubMed]
- Klueh, R.L. Elevated temperature ferritic and martensitic steels and their application to future nuclear reactors. Int. Mater. Rev. 2005, 50, 287–310. [Google Scholar] [CrossRef]
- Klotz, U.E.; Solenthaler, C.; Uggowitzer, P.J. Martensitic-austenitic 9–12% Cr steels-Alloy design, microstructural stability and mechanical properties. Mater. Sci. Eng. A 2008, 476, 186–194. [Google Scholar] [CrossRef]
- Abouzari, S. Solid Solution Strengthening Effect on Creep Strength of Austenitic Stainless Steel. Ph.D. Thesis, Royal Institute of Technology, Stockholm, Sweden, 2012. [Google Scholar]
- Hald, J. Metallurgy and creep properties of new 9–12% Cr steels. Steel Res. 1996, 67, 369–374. [Google Scholar] [CrossRef]
- Sun, L.; Simm, T.H.; Martin, T.L.; Ooi, S.W.; McAdam, S.; Galvin, D.; Perkins, K.M.; Bhadeshia, H.K.D.H. A novel ultra-high strength maraging steel with balanced ductility and creep resistance achieved by nanoscale β-NiAl and Laves phase precipitates. Unpublished work. 2017. [Google Scholar]
- Simm, T.H.; Sun, L.; Galvin, D.R.; Gilbert, E.P.; Venero, D.A.; Li, Y.; Martin, T.L.; Bagot, P.A.J.; Moody, M.P.; Hill, P.; et al. A SANS and APT study of precipitate evolution and strengthening in a maraging steel. Mater. Sci. Eng. A 2017, 702. [Google Scholar] [CrossRef]
- Leitner, H.; Schober, M.; Schnitzer, R. Splitting phenomenon in the precipitation evolution in an Fe-Ni-Al-Ti-Cr stainless steel. Acta Mater. 2010, 58, 1261–1269. [Google Scholar] [CrossRef]
- Sun, Z.; Liebscher, C.H.; Huang, S.; Teng, Z.; Song, G.; Wang, G.; Asta, M.; Rawlings, M.; Fine, M.E.; Liaw, P.K. New design aspects of creep-resistant NiAl-strengthened ferritic alloys. Scr. Mater. 2013, 68, 384–388. [Google Scholar] [CrossRef]
- Teng, Z.K.; Miller, M.K.; Ghosh, G.; Liu, C.T.; Huang, S.; Russell, K.F.; Fine, M.E.; Liaw, P.K. Characterization of nanoscale NiAl-type precipitates in a ferritic steel by electron microscopy and atom probe tomography. Scr. Mater. 2010, 63, 61–64. [Google Scholar] [CrossRef]
- Jiao, Z.B.; Luan, J.H.; Zhang, Z.W.; Miller, M.K.; Liu, C.T. High-strength steels hardened mainly by nanoscale NiAl precipitates. Scr. Mater. 2014, 87, 45–48. [Google Scholar] [CrossRef]
- Miracle, D.B. Overview No. 104 The physical and mechanical properties of NiAl. Acta Metall. Mater. 1993, 41, 649–684. [Google Scholar] [CrossRef]
- Teng, Z.K.; Ghosh, G.; Miller, M.K.; Huang, S.; Clausen, B.; Brown, D.W.; Liaw, P.K. Neutron-diffraction study and modeling of the lattice parameters of a NiAl-precipitate-strengthened Fe-based alloy. Acta Mater. 2012, 60, 5362–5369. [Google Scholar] [CrossRef]
- Seetharaman, V.; Sundararaman, M.; Krishnan, R. Precipitation hardening in a PH 13–8 Mo stainless steel. Mater. Sci. Eng. 1981, 47, 1–11. [Google Scholar] [CrossRef]
- Teng, Z.K.; Zhang, F.; Miller, M.K.; Liu, C.T.; Huang, S.; Chou, Y.T.; Tien, R.H.; Chang, Y.A.; Liaw, P.K. New NiAl-strengthened ferritic steels with balanced creep resistance and ductility designed by coupling thermodynamic calculations with focused experiments. Intermetallics 2012, 29, 110–115. [Google Scholar] [CrossRef]
- Schnitzer, R.; Radis, R.; Nöhrer, M.; Schober, M.; Hochfellner, R.; Zinner, S.; Povoden-Karadeniz, E.; Kozeschnik, E.; Leitner, H. Reverted austenite in PH 13–8 Mo maraging steels. Mater. Chem. Phys. 2010, 122, 138–145. [Google Scholar] [CrossRef]
- Simm, T.H.; Sun, L.; McAdam, S.; Hill, P.; Rawson, M.; Perkins, K. The Influence of Lath, Block and Prior Austenite Grain (PAG) Size on the Tensile, Creep and Fatigue Properties of Novel Maraging Steel. Materials 2017, 10, 730. [Google Scholar] [CrossRef] [PubMed]
- Nekouei, R.K.; Akhaghi, R.; Tahmasebi, R.; Ravanbakhsh, A.; Moghaddam, A.J. Two-stage heat treatment of steel 30CrMnSi. Met. Sci. Heat Treat. 2016, 58, 362–368. [Google Scholar] [CrossRef]
- Ranganatha, R.; Kumar, V.A.; Nandi, V.S.; Bhat, R.R.; Muralidhara, B.K. Multi-stage heat treatment of aluminum alloy AA7049. Trans. Nonferrous Met. Soc. China 2013, 23, 1570–1575. [Google Scholar] [CrossRef]
- Martin, T.L.L.; Radecka, A.; Sun, L.; Simm, T.H.; Dye, D.; Perkins, K.; Gault, B.; Moody, M.P.P.; Bagot, P.A.J.A.J. Insights into microstructural interfaces in aerospace alloys characterised by atom probe tomography. Mater. Sci. Technol. 2016, 32, 232–241. [Google Scholar] [CrossRef]
- Gilbert, E.P.; Schulz, J.C.; Noakes, T.J. “QUOKKA”-the small-angle neutron scattering instrument at OPAL. Phys. B Condens. Matter. 2006, 385–386, 1180–1182. [Google Scholar] [CrossRef]
- SasView. 2017. Available online: http://www.sasview.org/ (accessed on 21 November 2017).
- Bachmann, F.; Hielscher, R.; Schaeben, H. Grain detection from 2d and 3d EBSD data-Specification of the MTEX algorithm. Ultramicroscopy 2011, 111, 1720–1733. [Google Scholar] [CrossRef] [PubMed]
- Nyyssonen, T.; Isakov, M.; Peura, P.; Kuokkala, V. Iterative Determination of the Orientation Relationship Between Austenite and Martensite from a Large Amount of Grain Pair Misorientations. Metall. Mater. Trans. A Phys. Metall. Mater. Sci. 2016, 47, 2587–2590. [Google Scholar] [CrossRef]
- Han, J.; Lee, S.J.; Lee, C.Y.; Lee, S.; Jo, S.Y.; Lee, Y.K. The size effect of initial martensite constituents on the microstructure and tensile properties of intercritically annealed Fe-9Mn-0.05C steel. Mater. Sci. Eng. A 2015, 633, 9–16. [Google Scholar] [CrossRef]
- Morito, S.; Adachi, Y.; Ohba, T. Morphology and Crystallography of Sub-Blocks in Ultra-Low Carbon Lath Martensite Steel. Mater. Trans. 2009, 50, 1919–1923. [Google Scholar] [CrossRef]
- Guo, Z.; Sha, W. Quantification of precipitation kinetics and age hardening of Fe–1 2Ni–6Mn alloy during overaging. Mater. Sci. Technol. 2002, 18, 377–382. [Google Scholar] [CrossRef]
- Dorin, T.; Wood, K.; Taylor, A.; Hodgson, P.; Stanford, N. Quantitative examination of carbide and sulphide precipitates in chemically complex steels processed by direct strip casting. Mater. Charact. 2016, 112, 259–268. [Google Scholar] [CrossRef]
- Seong, B.S.; Shin, E.; Choi, S.H.; Choi, Y.; Han, Y.S.; Lee, K.H.; Tomota, Y. Quantitative analysis of fine nano-sized precipitates in low-carbon steels by small angle neutron scattering. Appl. Phys. A-Mater. Sci. Process. 2010, 99, 613–620. [Google Scholar] [CrossRef]
- Tasan, C.C.; Hoefnagels, J.P.M.; Diehl, M.; Yan, D.; Roters, F.; Raabe, D. Strain localization and damage in dual phase steels investigated by coupled in-situ deformation experiments and crystal plasticity simulations. Int. J. Plast. 2014, 63, 198–210. [Google Scholar] [CrossRef]
- Strunz, P.; Gilles, R.; Mukherji, D.; Wiedenmann, A. Evaluation of anisotropic small-angle neutron scattering data; a faster approach. J. Appl. Crystallogr. 2003, 36, 854–859. [Google Scholar] [CrossRef]
- Kostorz, G. Metallurgical applications of small-angle scattering. Hyperfine Interact. 1989, 45, 91–92. [Google Scholar] [CrossRef]
- Kostorz, G. Defects in metals and alloys studied by neutron small-angle scattering. Acta Crystallogr. Sect. A Found. Crystallogr. 1981, 37, C254. [Google Scholar] [CrossRef]
- Collins, D.M.; Heenan, R.K.; Stone, H.J. Characterization of Gamma Prime (γ’) Precipitates in a Polycrystalline Nickel-Base Superalloy Using Small-Angle Neutron Scattering. Metall. Mater. Trans. A 2011, 42, 49–59. [Google Scholar] [CrossRef]
- Jazaeri, H.; Bouchard, P.J.; Hutchings, M.T.; Mamun, A.; Heenan, R. Application of small angle neutron scattering to study creep cavitation in stainless steel weldments. Mater. Sci. Technol. 2015, 31. [Google Scholar] [CrossRef]
- Jazaeri, H.; Bouchard, P.J.; Hutchings, M.T.; Mamun, A.A.; Heenan, R.K. Study of cavities in a creep crack growth test specimen. Procedia Struct. Integr. 2016, 2, 942–949. [Google Scholar] [CrossRef]
- Dorin, T.; Taylor, A.; Wood, K.; Wang, J.; Hodgson, P.D.; Stanford, N. Complex precipitation phenomena in strip cast steels with high sulfur and copper contents. J. Appl. Crystallogr. 2016, 49, 1777–1785. [Google Scholar] [CrossRef]
- Gladman, T. Precipitation hardening in metals. Mater. Sci. Technol. 1999, 15, 30–36. [Google Scholar] [CrossRef]
- Melander, A.; Persson, P.Å. The strength of a precipitation hardened AlZnMg alloy. Acta Metall. 1978, 26, 267–278. [Google Scholar] [CrossRef]
- Smith, I.O.; White, M.G. The origin of the shear stress increment in aged ferritic Fe-Ni-Ti-Al alloys. Metall. Trans. A 1976, 7, 293–298. [Google Scholar] [CrossRef]
- Martin, J.W. Precipitation Hardening, 2nd ed.; Butterworth-Heinemann: Oxford, UK, 1998. [Google Scholar] [CrossRef]
- Orowan, E. Symposium on Internal Stress in Metals and Alloys; Institute of Metals: London, UK, 1948; p. 451. [Google Scholar]
- Busby, J.T.; Hash, M.C.; Was, G.S. The relationship between hardness and yield stress in irradiated austenitic and ferritic steels. J. Nucl. Mater. 2005, 336, 267–278. [Google Scholar] [CrossRef]
- Pavlina, E.J.; van Tyne, C.J. Correlation of Yield strength and Tensile strength with hardness for steels. J. Mater. Eng. Perform. 2008, 17, 888–893. [Google Scholar] [CrossRef]
- Bhadeshia, R.W.K.; Honeycombe, H.K.D.H. Steels: Microstructure and Properties, 3rd ed.; Butterworth-Heinemann, Elsevier Ltd.: Oxford, UK, 2006. [Google Scholar]
- Allen, H.R.; Rees, N.P.; Hopkins, W.P.; Tipler, B.E. Tensile and impact properties of high-purity iron-carbon-manganese alloys of low carbon content. J. Iron Steel Inst. 1953, 174, 108. [Google Scholar]
- Petch, N.J. Fracture: Proceedings of an International Conference on the Atomic Mechanisms of Fracture, Swampscott, MA, USA, 12–16 April 1959; Technology Press of Massachusetts Institute of Technology: Cambridge, MA, USA, 1959. [Google Scholar]
- Honeycombe, R.W.K. The Plastic Deformation of Metals; Edward Arnold: Maidenhead, UK, 1984. [Google Scholar]
- Hall, E.O. The deformation and ageing of mild steel: III Discussion of results. Proc. Phys. Soc. 1951, 64, 747. [Google Scholar] [CrossRef]
- Petch, N.J. The Cleavage Strength of Polycrystals. J. Iron Steel Inst. 1953, 174, 25–27. [Google Scholar]
- Dingley, D.J.J.; McLean, D. Components of the flow stress of iron. Acta Metall. 1967, 15, 885–901. [Google Scholar] [CrossRef]
- Sun, X.; Li, Z.; Yong, Q.; Yang, Z.; Dong, H.; Weng, Y. Third generation high strength low alloy steels with improved toughness. Sci. China Technol. Sci. 2012, 55, 1797–1805. [Google Scholar] [CrossRef]
- Guo, Z.; Sha, W.; Vaumousse, D. Microstructural evolution in a PH13–8 stainless steel after ageing. Acta Mater. 2003, 51, 101–116. [Google Scholar] [CrossRef]
- Ping, D.H.; Ohnuma, M.; Hirakawa, Y.; Kadoya, Y.; Hono, K. Microstructural evolution in 13Cr–8Ni–2.5Mo–2Al martensitic precipitation-hardened stainless steel. Mater. Sci. Eng. A 2005, 394, 285–295. [Google Scholar] [CrossRef]
- Zhang, S.; Schut, H.; Čížek, J.; Tichelaar, F.D.; Brück, E.; van der Zwaag, S.; van Dijk, N.H. Positron annihilation study on deformation-induced Au precipitation in Fe-Au and Fe-Au-B-N alloys. J. Mater. Sci. 2014, 49, 2509–2518. [Google Scholar] [CrossRef]
- Sha, G.; Marceau, R.K.W.; Ringer, S.P. Precipitation and solute clustering in aluminium: advanced characterisation techniques. In Fundamentals of Aluminium Metallurgy: Production, Processing and Applications; Woodhead Publishing Limited: Cambridge, UK, 2011. [Google Scholar] [CrossRef]
- Dupasquier, A.; Kögel, G.; Somoza, A. Studies of light alloys by positron annihilation techniques. Acta Mater. 2004, 52, 4707–4726. [Google Scholar] [CrossRef]
- Warren, B.E. X-ray studies of deformed metals. Prog. Met. Phys. 1959, 8, 147–202. [Google Scholar] [CrossRef]
- Cullity, B.D. Elements of X-ray Diffraction; Addison-Wesley Publishing Co.: Reading, MA, USA, 1978; Available online: http://www.archive.org/details/elementsofxraydi030864mbp (accessed on 21 November 2017).
- Wang, C.; Wang, M.; Shi, J.; Hui, W.; Dong, H. Effect of Microstructure Refinement on the Strength and Toughness of Low Alloy Martensitic Steel. J. Mater. Sci. Technol. 2007, 23, 659–664. [Google Scholar]
- Williams, D.B.; Carter, C.B. Transmission Electron Microscopy; Plenum Press: New York, NY, USA, 1996. [Google Scholar]
- Hajyakbary, F.; Sietsma, J.; Böttger, A.J.; Santofimia, M.J. An improved X-ray diffraction analysis method to characterize dislocation density in lath martensitic structures. Mater. Sci. Eng. A 2015, 639, 208–218. [Google Scholar] [CrossRef]
- Čížek, J.; Janeček, M.; Krajňák, T.; Stráská, J.; Hruška, P.; Gubicza, J.; Kim, H.S. Structural characterization of ultrafine-grained interstitial-free steel prepared by severe plastic deformation. Acta Mater. 2016, 105, 258–272. [Google Scholar] [CrossRef]
- Bartošová, I.; Čížek, J.; Lukáč, F.; Slugeň, V. Vickers hardness and positron annihilation study of Eurofer97 and ODS Eurofer. Acta Phys. Pol. A 2014, 125, 702–705. [Google Scholar] [CrossRef]
- Eddahbi, M.; Domínguez-Reyes, R.; Monge, M.A.; Muñoz, A.; Pareja, R. Grain boundary misorientation and positron annihilation characteristics in steel Eurofer processed by equal channel angular pressing. J. Mater. Sci. 2014, 49, 6722–6733. [Google Scholar] [CrossRef]
- Čížek, J.; Neslušan, M.; Čilliková, M.; Mičietová, A.; Melikhova, O. Modification of steel surfaces induced by turning: non-destructive characterization using Barkhausen noise and positron annihilation. J. Phys. D Appl. Phys. 2014, 47, 445301. [Google Scholar] [CrossRef]
- Sears, V.F. Neutron scattering lengths and cross sections. Neutron News 1992, 3, 26–37. [Google Scholar] [CrossRef]
- Feigin, L.A.; Svergun, D.I. Structure Analysis by Small-Angle X-ray and Neutron Scattering; Springer: Berlin, Germany, 1987; p. 335. [Google Scholar] [CrossRef]
- Guinier, A.; Fournet, G. Small-Angle Scattering of X-rays; Wiley: Hoboken, NJ, USA, 1955. [Google Scholar]
- Briggs, S.A.; Edmondson, P.D.; Littrell, K.C.; Yamamoto, Y.; Howard, R.H.; Daily, C.R.; Terrani, K.A.; Sridharan, K.; Field, K.G. A combined APT and SANS investigation of α’ phase precipitation in neutron-irradiated model FeCrAl alloys. Acta Mater. 2017, 129, 217–228. [Google Scholar] [CrossRef]


| C | Cr | Mo | Ni | Al | Co | W | B | Fe |
|---|---|---|---|---|---|---|---|---|
| 0.003 | 10 | 2.75 | 7 | 1.8 | 8.3 | 2.45 | 0.002 | Balance |
| Austenitisation Temperature (°C) | Area Fraction (%) after Different Ageing Times in h | Precipitate Equivalent Circular Diameter (nm) after Different Ageing Times in h | ||||||
|---|---|---|---|---|---|---|---|---|
| 0 | 1 | 9 | 24 | 0 | 1 | 9 | 24 | |
| 825 | 6.77 (1.23) | 6.12 (1.73) | 6.14 (1.14) | 5.51 (1.21) | 204.1 (16.8) | 203.7 (16.2) | 200.6 (14.4) | 215.0 (20.7) |
| 870 | 4.19 (1.23) | - | - | - | 201.0 (16.0) | - | - | - |
| 960 | 0.14 (0.05) | 0.09 (0.07) | 0.22 (0.10) | 0.28 (0.06) | 172.1 (4.5) | 166.1 (18.7) | 163.8 (10.6) | 175.9 (24.3) |
© 2017 by the authors. Licensee MDPI, Basel, Switzerland. This article is an open access article distributed under the terms and conditions of the Creative Commons Attribution (CC BY) license (http://creativecommons.org/licenses/by/4.0/).
Share and Cite
Simm, T.H.; Sun, L.; Galvin, D.R.; Hill, P.; Rawson, M.; Birosca, S.; Gilbert, E.P.; Bhadeshia, H.; Perkins, K. The Effect of a Two-Stage Heat-Treatment on the Microstructural and Mechanical Properties of a Maraging Steel. Materials 2017, 10, 1346. https://doi.org/10.3390/ma10121346
Simm TH, Sun L, Galvin DR, Hill P, Rawson M, Birosca S, Gilbert EP, Bhadeshia H, Perkins K. The Effect of a Two-Stage Heat-Treatment on the Microstructural and Mechanical Properties of a Maraging Steel. Materials. 2017; 10(12):1346. https://doi.org/10.3390/ma10121346
Chicago/Turabian StyleSimm, Thomas Hadfield, Lin Sun, Deri Rhys Galvin, Paul Hill, Martin Rawson, Soran Birosca, Elliot Paul Gilbert, Harshad Bhadeshia, and Karen Perkins. 2017. "The Effect of a Two-Stage Heat-Treatment on the Microstructural and Mechanical Properties of a Maraging Steel" Materials 10, no. 12: 1346. https://doi.org/10.3390/ma10121346