Effect of Anisotropy on the Resilient Behaviour of a Granular Material in Low Traffic Pavement

ICube, UMR7357, CNRS, Université de Strasbourg, INSA de Strasbourg, 24 Boulevard de la Victoire, 67084 Strasbourg CEDEX, France
*
Author to whom correspondence should be addressed.
Materials 2017, 10(12), 1382; https://doi.org/10.3390/ma10121382
Submission received: 30 October 2017
/
Revised: 30 November 2017
/
Accepted: 1 December 2017
/
Published: 3 December 2017
Abstract
:Granular materials are often used in pavement structures. The influence of anisotropy on the mechanical behaviour of granular materials is very important. The coupled effects of water content and fine content usually lead to more complex anisotropic behaviour. With a repeated load triaxial test (RLTT), it is possible to measure the anisotropic deformation behaviour of granular materials. This article initially presents an experimental study of the resilient repeated load response of a compacted clayey natural sand with three fine contents and different water contents. Based on anisotropic behaviour, the non-linear resilient model (Boyce model) is improved by the radial anisotropy coefficient γ3 instead of the axial anisotropy coefficient γ1. The results from both approaches (γ1 and γ3) are compared with the measured volumetric and deviatoric responses. These results confirm the capacity of the improved model to capture the general trend of the experiments. Finally, finite element calculations are performed with CAST3M in order to validate the improvement of the modified Boyce model (from γ1 to γ3). The modelling results indicate that the modified Boyce model with γ3 is more widely available in different water contents and different fine contents for this granular material. Besides, based on the results, the coupled effects of water content and fine content on the deflection of the structures can also be observed.
1. Introduction
Low traffic pavements with a thin bituminous surfacing, granular base, and sub-base layers represent approximately 60% of the road network in France.
In these pavements, granular layers play an important role in the overall performance of the structure, especially in deformation behaviours, which are characterized by a long-term mechanical process and a short-term mechanical process. The short-term behaviour concerns the instantaneous deformation of the granular layers, as excited during the repeated traffic loading. The long-term behaviour concerns the accumulation of permanent deformations, which is not studied in this work.
The mechanical behaviour of granular materials is generally investigated with repeated load triaxial tests (RLTT). These tests are used to simulate the loading conditions to describe either resilient behaviour [1,2,3,4] or permanent deformation [5,6,7,8].
In pavements, the granular layers are compacted to achieve maximum dry density. During the compaction process, these layers become anisotropic due to the vertical loads applied. As a result, the granular layers become more rigid vertically than horizontally.
Several studies [9,10,11,12,13,14,15,16,17] have been carried out to study anisotropy in granular materials:
Casagrande and Carillo [9] have made a distinction for granular materials between initial anisotropy and the anisotropy induced by applied stress. The latter was defined as the ratio between axial and radial deformation under isotropic loading [12]. The initial anisotropy is mainly due to the shape and disposition of the grains, and the geometrical arrangement. Karasahin and Dawson [17] stated that it was possible to measure the anisotropy of resilient deformation of unbound granular material with a repeated load triaxial test.
Oda and Sudoo [13] indicated that anisotropy induced by applied stress was mainly due to the development of plastic deformation. The plastic deformation, meantime, can be influenced by the coupled effects of water content and fine content or suction [18]. As a result, anisotropy induced in granular layers becomes more complex.
Besides, the granular materials usually exhibit a complex non-linear response under repeated loading. A reliable description of resilient behaviour using experimental methods with or without soil suction control is time-consuming, and needs sophisticated equipment as well as trained personnel [19]. Hence, in recent years, various elasticity models have been proposed to predict the resilient behaviour based on resilient modulus and Poisson’s ratio [20,21,22] or volumetric and shear stress–strain relationships [23,24]. A comparison of the most widely used elasticity models in pavement design can be found in the following Ref. [25].
Among these models, the Boyce model [23] presents the advantage of being simple (three parameters), and correctly simulating the effect of the stress on the resilient behaviour (dilatancy for high values of ∆q/∆p). As mentioned above, the anisotropy of the granular materials is increasingly being recognized as a property that must be modelled to adequately describe the pavement’s mechanical behaviour. Hence, Hornych et al. [24] improved the Boyce model to include the anisotropy, and the new model showed a good agreement between measured and modelling results. However, the effects of water content and fine content on the anisotropy were not considered in this improvement.
In this context, this paper initially presents the resilient behaviour of a clayey sand (Missillac sand) with different water contents and three fine contents through the RLTT results. The results allow us to improve the Boyce model by considering the effects of water content and fine content on the anisotropic behaviour of the granular materials. A finite element modelling will be additionally performed by taking into account the proposed approach to calculate the deflection of a low traffic pavement constituted of granular materials with three different fine contents at different water contents.
2. Experimental Program
2.1. Material Studied
The studied material is Missillac fine sand. It is an alluvium sand that comes from the quarry of Missillac in France. This soil is used as subgrade soil in low traffic pavements for full-scale pavement tests at IFSTTAR (Institut Français des Sciences et Technologies des Transports, de l’Aménagement et des Réseaux) in Nantes, France.
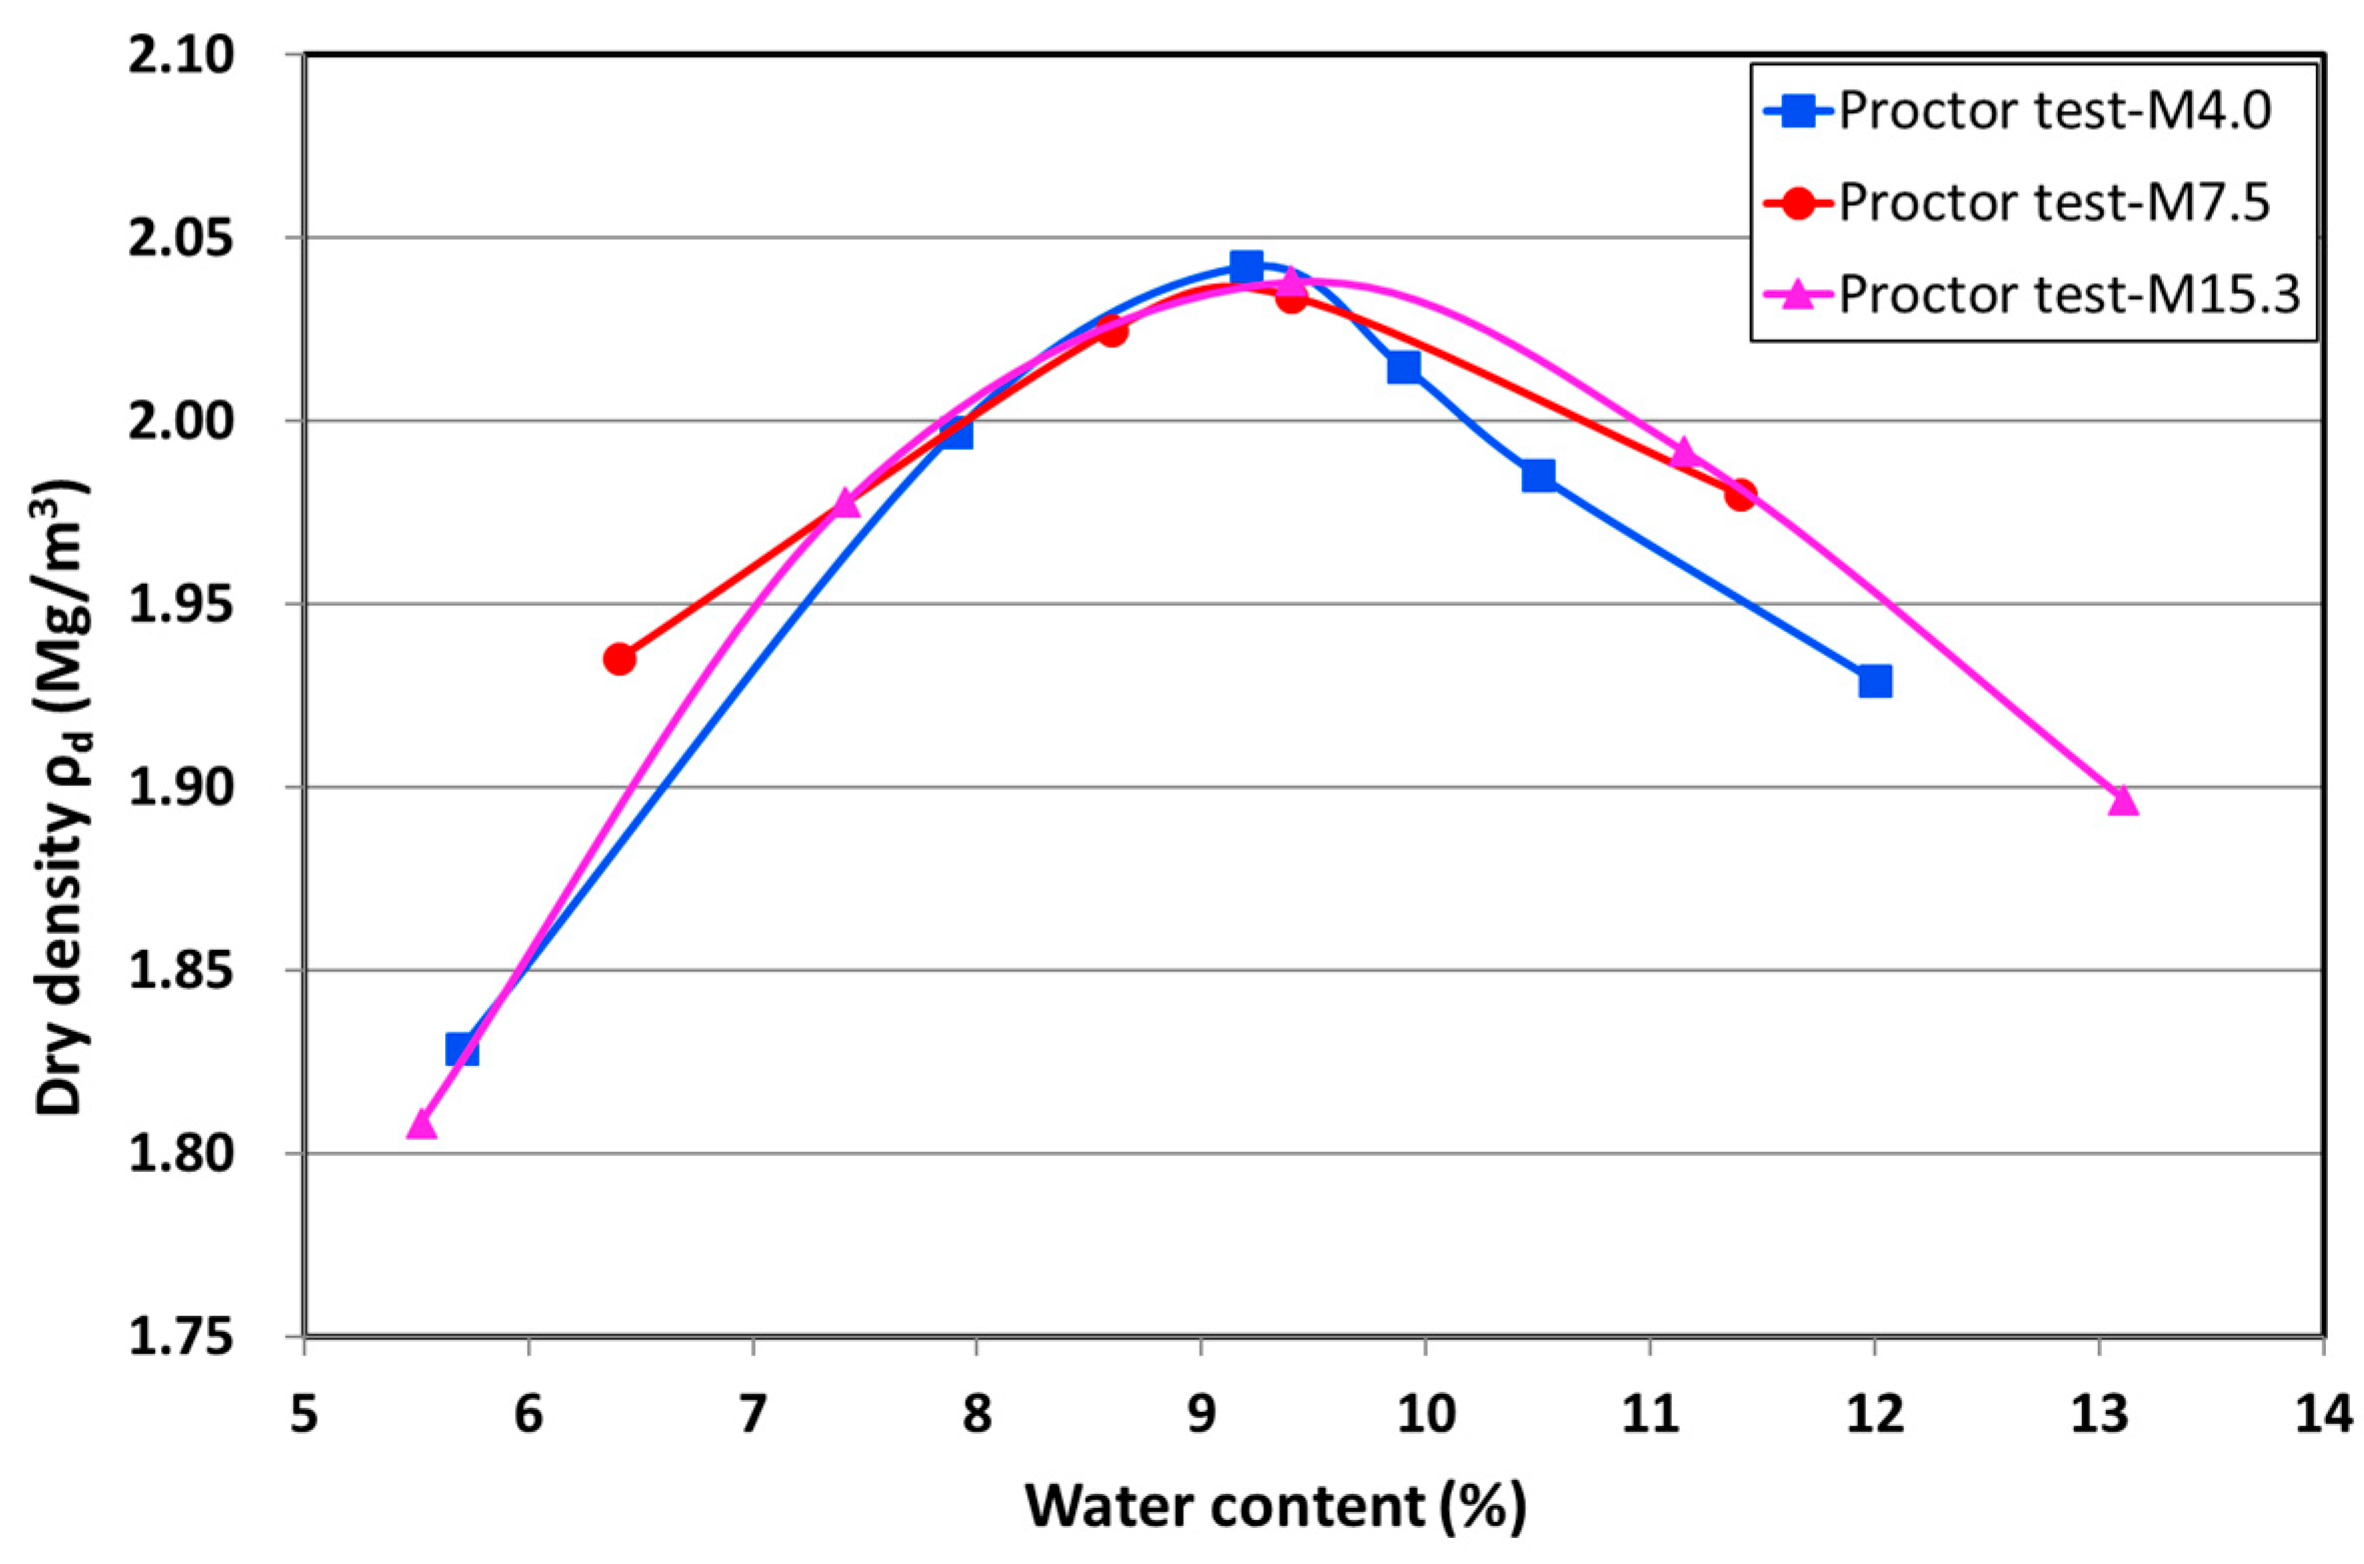
In this study, the natural samples have a maximum particle size of approximately 10 mm and contain three different fine contents (4.0%, 7.5%, and 15.3%, passing through the sieve 80 μm), which are named M4.0, M7.5, and M15.3. Figure 1 shows the particle size distribution for the three materials. Table 1 presents all of the characteristic parameters of these curves and the methylene blue values. Soils can also be classified based on these parameters [26,27], as reported in Table 1.
2.2. Repeated Load Triaxial Tests (RLTT)
Repeated load triaxial tests are performed on all three materials (M4.0, M7.5, and M15.3) with the water contents ranging between 7% and 11%, as shown in Table 2. The samples are compacted to the same dry density of 2 ± 0.06 Mg/m3 with two different methods (vibrocompression method and vibrating hammer method), as shown in Table 2. The size of the sample is large enough to avoid the particle size effect: it has a diameter of 150 mm/160 mm, and a height of 285 mm/320 mm (Table 2).
In this study, the RLTTs are conducted with a variable confining pressure (VCP), where both the axial load and the confining pressure are cycled in phase [29]. As a result, the sample under the cyclic stress (confining pressure σ3 and axial stress σ1) can be used to simulate the pavement solicitation and measure the vertical strain (ε1) and the radial strain (ε3). To determine the resilient behaviour of the materials, the sample is first subjected to a conditioning phase that consists of applying 104 loading cycles to stabilize the permanent deformation:
- For the soil M4.0 and M15.3, the cyclic stresses applied during the conditioning were (∆p, ∆q) = (23.33 kPa, 70 kPa) from an initial stress state of (p0, q0) = (10 kPa, 0 kPa) at the frequency of 0.5 Hz;
- For the soil M7.5, the cyclic stresses applied during the conditioning were (∆p, ∆q) = (40 kPa, 80 kPa) from an initial stress state of (p0, q0) = (10 kPa, 5 kPa) at the frequency of 1 Hz. (The different loading method for M7.5 is used because this material is tested in Nantes with another machine).
p is the mean normal stress and q is the deviatoric stress. For a triaxial test, the p and q are defined as:
where σ1 and σ3 are the major and minor principal stresses, respectively.
In this context, the permanent axial deformation achieves the equilibrium state after 104 loading cycles. As a result, the study of resilient behaviour can be continued: after the conditioning phase, the samples (M4.0, M7.5, and M15.3) are subjected to a series of loads with different stress paths of ∆q/∆p = 0; 0.5; 1; 2; 3 [29,30], as shown in Table 3. Each stress path contains 100 loading and unloading cycles. The last cycle in each load sequence is used to determine the resilient behaviour. The soil resilient behaviour is generally presented by the volumetric strain (εv) and the shear or deviatoric strain (εq) varying with the mean normal stress (p). These deformations can be related to the axial strain (ε1) and the radial strain (ε3):
2.3. Cyclic Resilient Behaviour and Anisotropy
2.3.1. Resilient Volumetric and Deviatoric Deformation
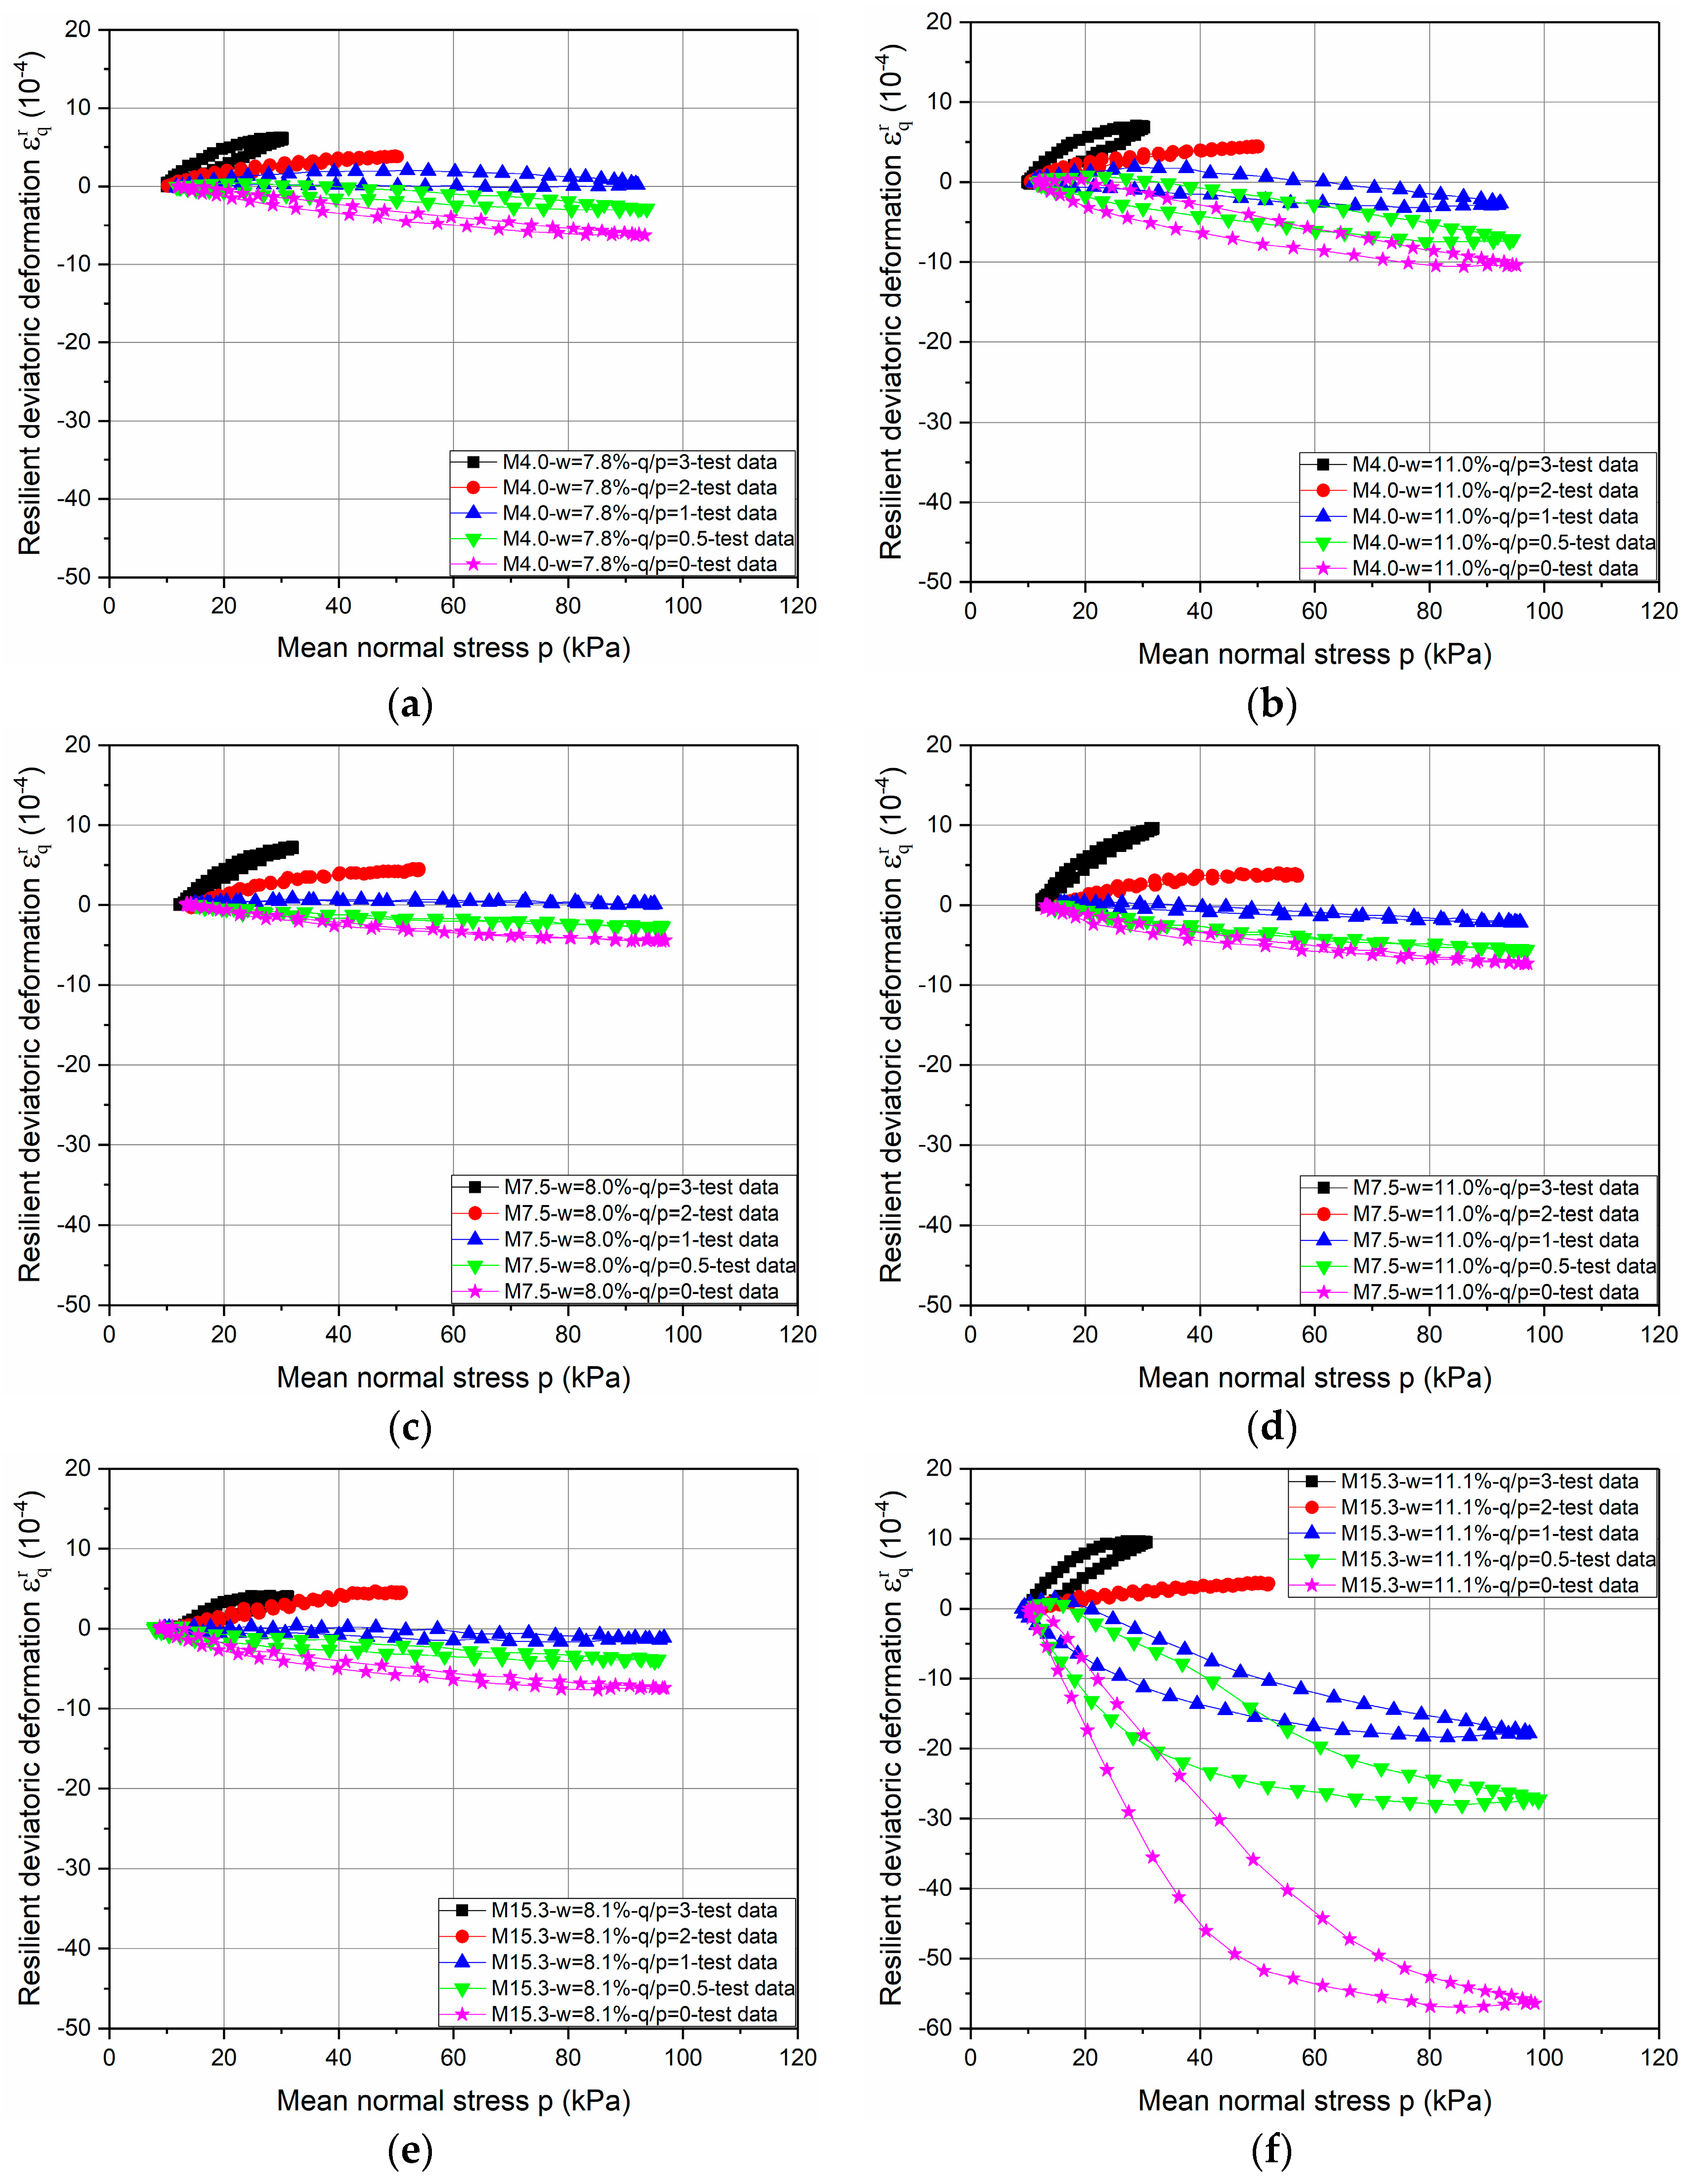
Figure 3 and Figure 4 present respectively the resilient volumetric deformation εvr and the resilient deviatoric deformation εqr that are obtained for the different stress paths for the tests with water contents of 8% and 11% (approximately) for three different Missillac sands (M4.0, M7.5, and M15.3).
Based on the test results, it can be stated that the resilient behaviour of the soil is obviously non-linear, and depends on the mean stress p and the stress path ∆q/∆p. The coupled effects of water content and fine content on resilient behaviour are evident: when the water content is higher, the εvr and the εqr are then higher in each stress path for each material. However, the effect of fine content on resilient deformation is related to the soil saturation state. Besides, large increments of the values of εvr and εqr and open loops can be observed for M15.3 samples at water contents of 11.1% in the stress paths of ∆q/∆p = 0; 0.5; and 1. (The same phenomenon is obtained in M15.3 samples at water contents of 10.2%, 11.0%, and 11.3%).
2.3.2. Anisotropy
Figure 5 presents the final deformations ε1 and ε3 of M15.3 samples with different water contents after an isotropic consolidation phase (∆q/∆p = 0, p = 10 kPa) before conditioning. It can be stated that there is an inherent anisotropy in these samples caused by compaction. The difference between ε1 and ε3 obviously decreases as water content for the samples increases, with a high degree of saturation (w >10.5%). The results of M4.0 and M7.5 are lost in the tests.
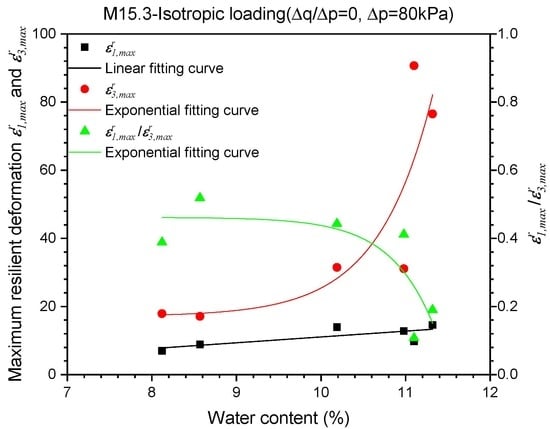
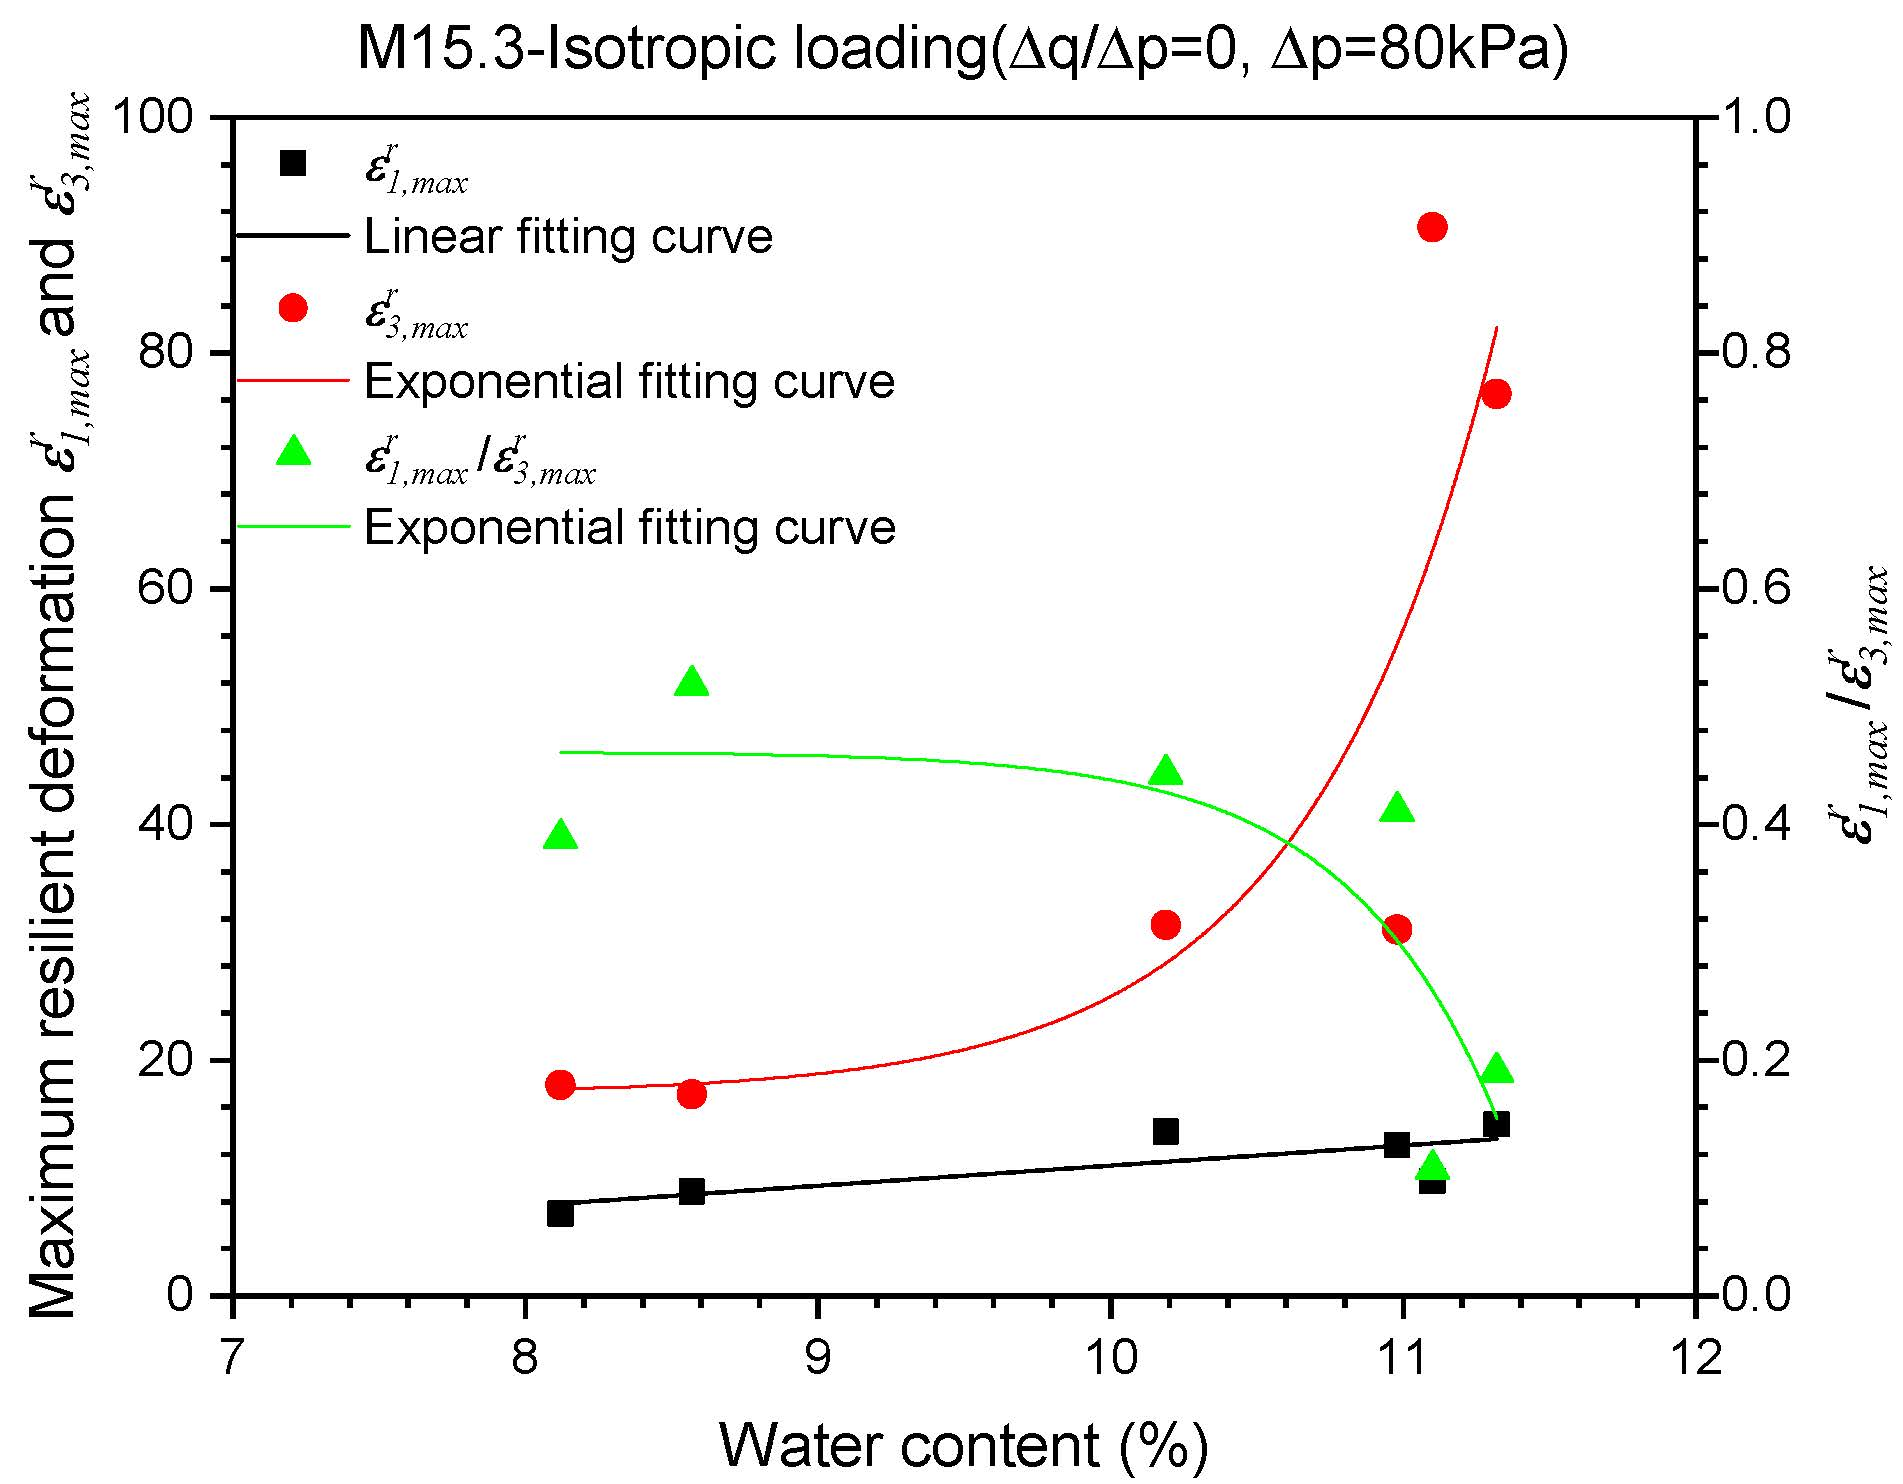
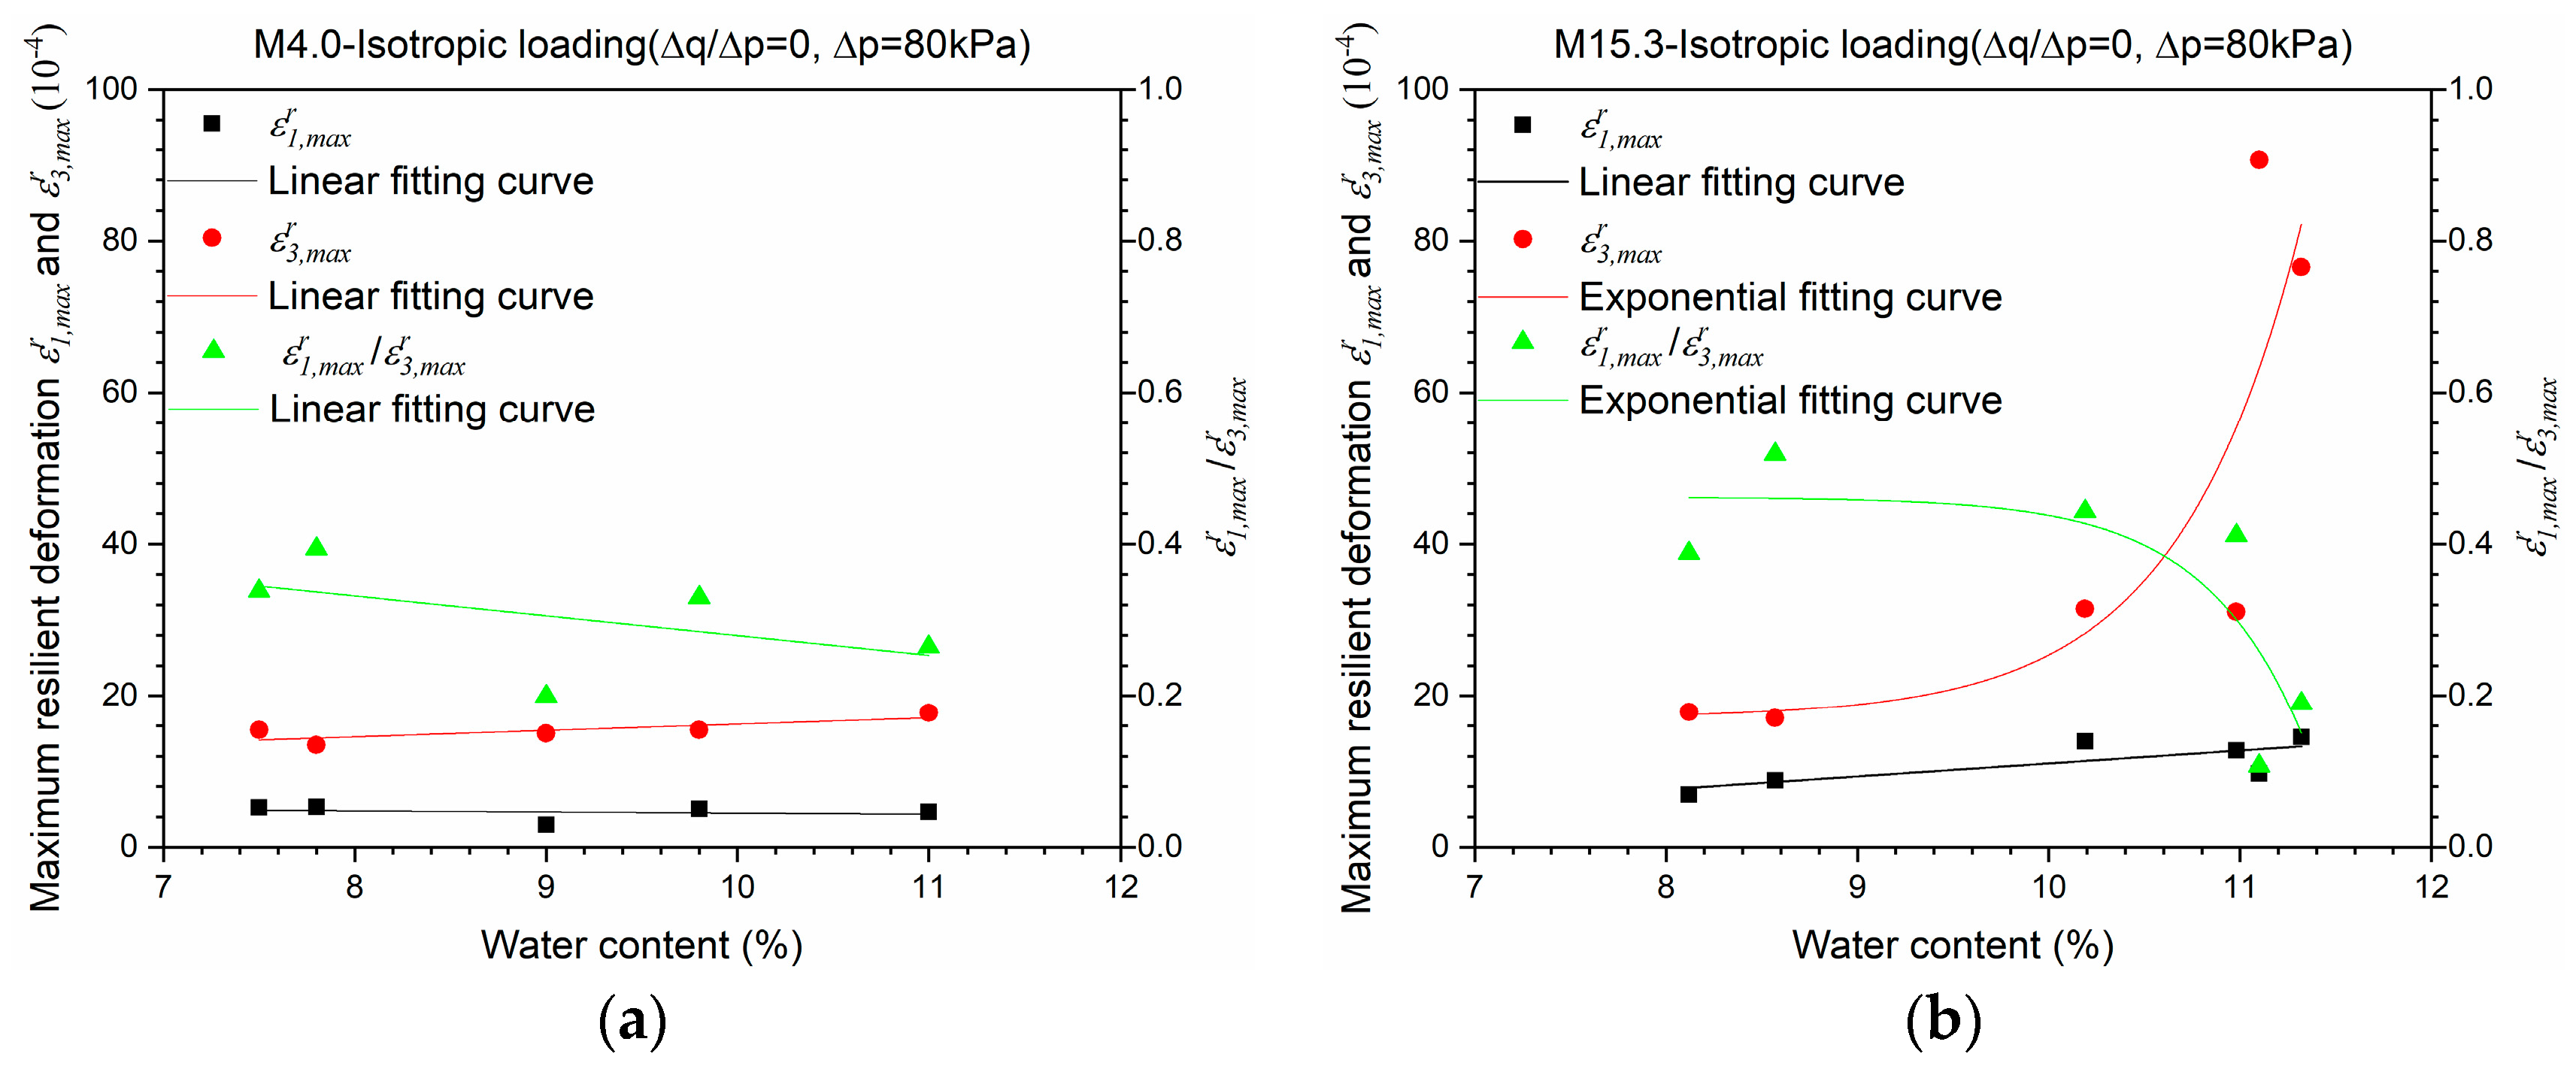
Figure 6 shows the maximum resilient deformations ε1,maxr and ε3,maxr for Missillac sand M4.0 and M15.3 in the isotropic loading stress path (∆q/∆p = 0, ∆p = 80 kPa) for the resilient phase. The anisotropy induced can be also observed obviously: the difference between ε1,maxr and ε3,maxr increases with water content for both materials, especially for M15.3.
Comparing the ratio value of ε1 to ε3 in Figure 5, and the ratio value of ε1,maxr to ε3,maxr in Figure 6b, it can be stated that the anisotropic behaviour of the granular material is very complicated and is strongly influenced by the stress history and the stress level applied. In the meantime, the comparison of the ratio value of ε1,maxr to ε3,maxr within Figure 6a,b shows that the anisotropic behaviour of M15.3 increases faster than M4.0 with an increase of water content from 7% to 11%.
Based on these results, it can be stated that the obvious inherent and developing anisotropic behaviour during loading phases shouldn’t be ignored.
3. Modelling
In this section, the modified Boyce model based on anisotropy coefficients γ1 and γ3 will be compared in order to describe the resilient behaviour of Missillac sand.
3.1. Modified Boyce Model
Boyce [23] proposed an isotropic non-linear model for predicting the resilient volumetric deformation and resilient deviatoric deformation of granular materials, which was expressed as:
where β = (1 − n)·Ka/(6Ga); Ka and Ga are the reference bulk and shear moduli, respectively; and n is the nonlinear coefficient.
Hornych et al. [24] introduced the anisotropic response of granular materials into the Boyce model through multiplying the axial stress by an anisotropy coefficient γ1. Thus, the new mean normal stress p* and the new deviator stress q* could be re-expressed as follows:
where γ1 is the axial anisotropy coefficient.
Then, the potential function can be modified as:
The new equations of resilient volumetric and deviatoric deformation could be proposed by taking the derivative of the potential function as:
In fact, the anisotropy coefficient γ1 is used to decrease the axial stress σ1 to fit with the radial stiffness in the elastic range. However, as presented in Figure 5 and Figure 6, the anisotropy behaviour changes sharply with water content for samples with a high fine content where the radial deformation ε3 is dominant, and the two-time relation for ε3 in Equation (3), should be also taken into account. As a result, we think that γ1 could be no longer applicable for these results, and the radial anisotropy coefficient γ3 is recommended with a broader scope. In other words, with the large difference between ε1 and ε3, it is supposed that there is no longer such a relationship where γ3 = 1/γ1, and the model for γ3 is more general.
Thus, p* and q* can be redefined as follows:
Similar to the above mentioned, the new resilient volumetric deformation εvr and new resilient deviatoric deformation εqr with anisotropy coefficient γ3 can be also proposed by taking the derivative of the potential function as:
3.2. Modelling Based on Two Approaches (γ1 and γ3)
In this section, the modified Boyce model based on anisotropy coefficients γ1 and γ3 will be applied to describe the resilient behaviour of Missillac sand to demonstrate the improvement with γ3.
•Parameter optimization for stress paths of ∆q/∆p = 0.5, 1, 2 and 3
According to Equations (10) and (11) and Equations (14) and (15), the least square method is used to optimize the model parameters, Ka, Ga, n, and γ1 (γ3) for a given water content on stress paths of ∆q/∆p = 0.5, 1, 2 and 3.
•Parameter optimization for stress path of ∆q/∆p = 0
The resilient deformations of M15.3 samples at high water contents in the stress path of ∆q/∆p = 0 are obviously larger than other slopes (0.5, 1, 2 and 3), as shown in Figure 3f and Figure 4f. To obtain the good correlation coefficients for these samples, a different anisotropy coefficient γ3* is used for the stress path of Δq/Δp = 0 with the approach γ3 for all three materials. In the meantime, to keep things consistent, γ1* is also required for the stress path of ∆q/∆p = 0 with the approach γ1.
The model parameters, as well as the correlation coefficients, are presented in Table 4 for M4.0 samples, Table 5 for M7.5 samples, and Table 6 for M15.3 samples with different water contents.
Based on the results, it can be stated that almost the same correlation coefficient values (close or higher than 0.8) can be found for M4.0 samples with both methods (Table 4). The better correlation coefficient values (higher than 0.9) are observed and almost the same for M7.5 samples with both methods (Table 5). However, a significant improvement of correlation coefficients for M15.3 samples at the high water contents (10.2%, 11.0%, 11.1%, and 11.3%) can be observed from γ1(γ1*) to γ3(γ3*) (Table 6).
Besides, it can be noticed that the γ1 and γ1* values, as well as the γ3 and γ3* values, are almost constant or scatter slightly for M4.0 and M7.5 with all of the water contents (from 7.0% to 11.0%), as shown in Table 4 and Table 5. For the M15.3 samples, the γ1 and γ1* values, decrease and the γ3 and γ3* values obviously increase as the water content increases, as shown in Table 6.
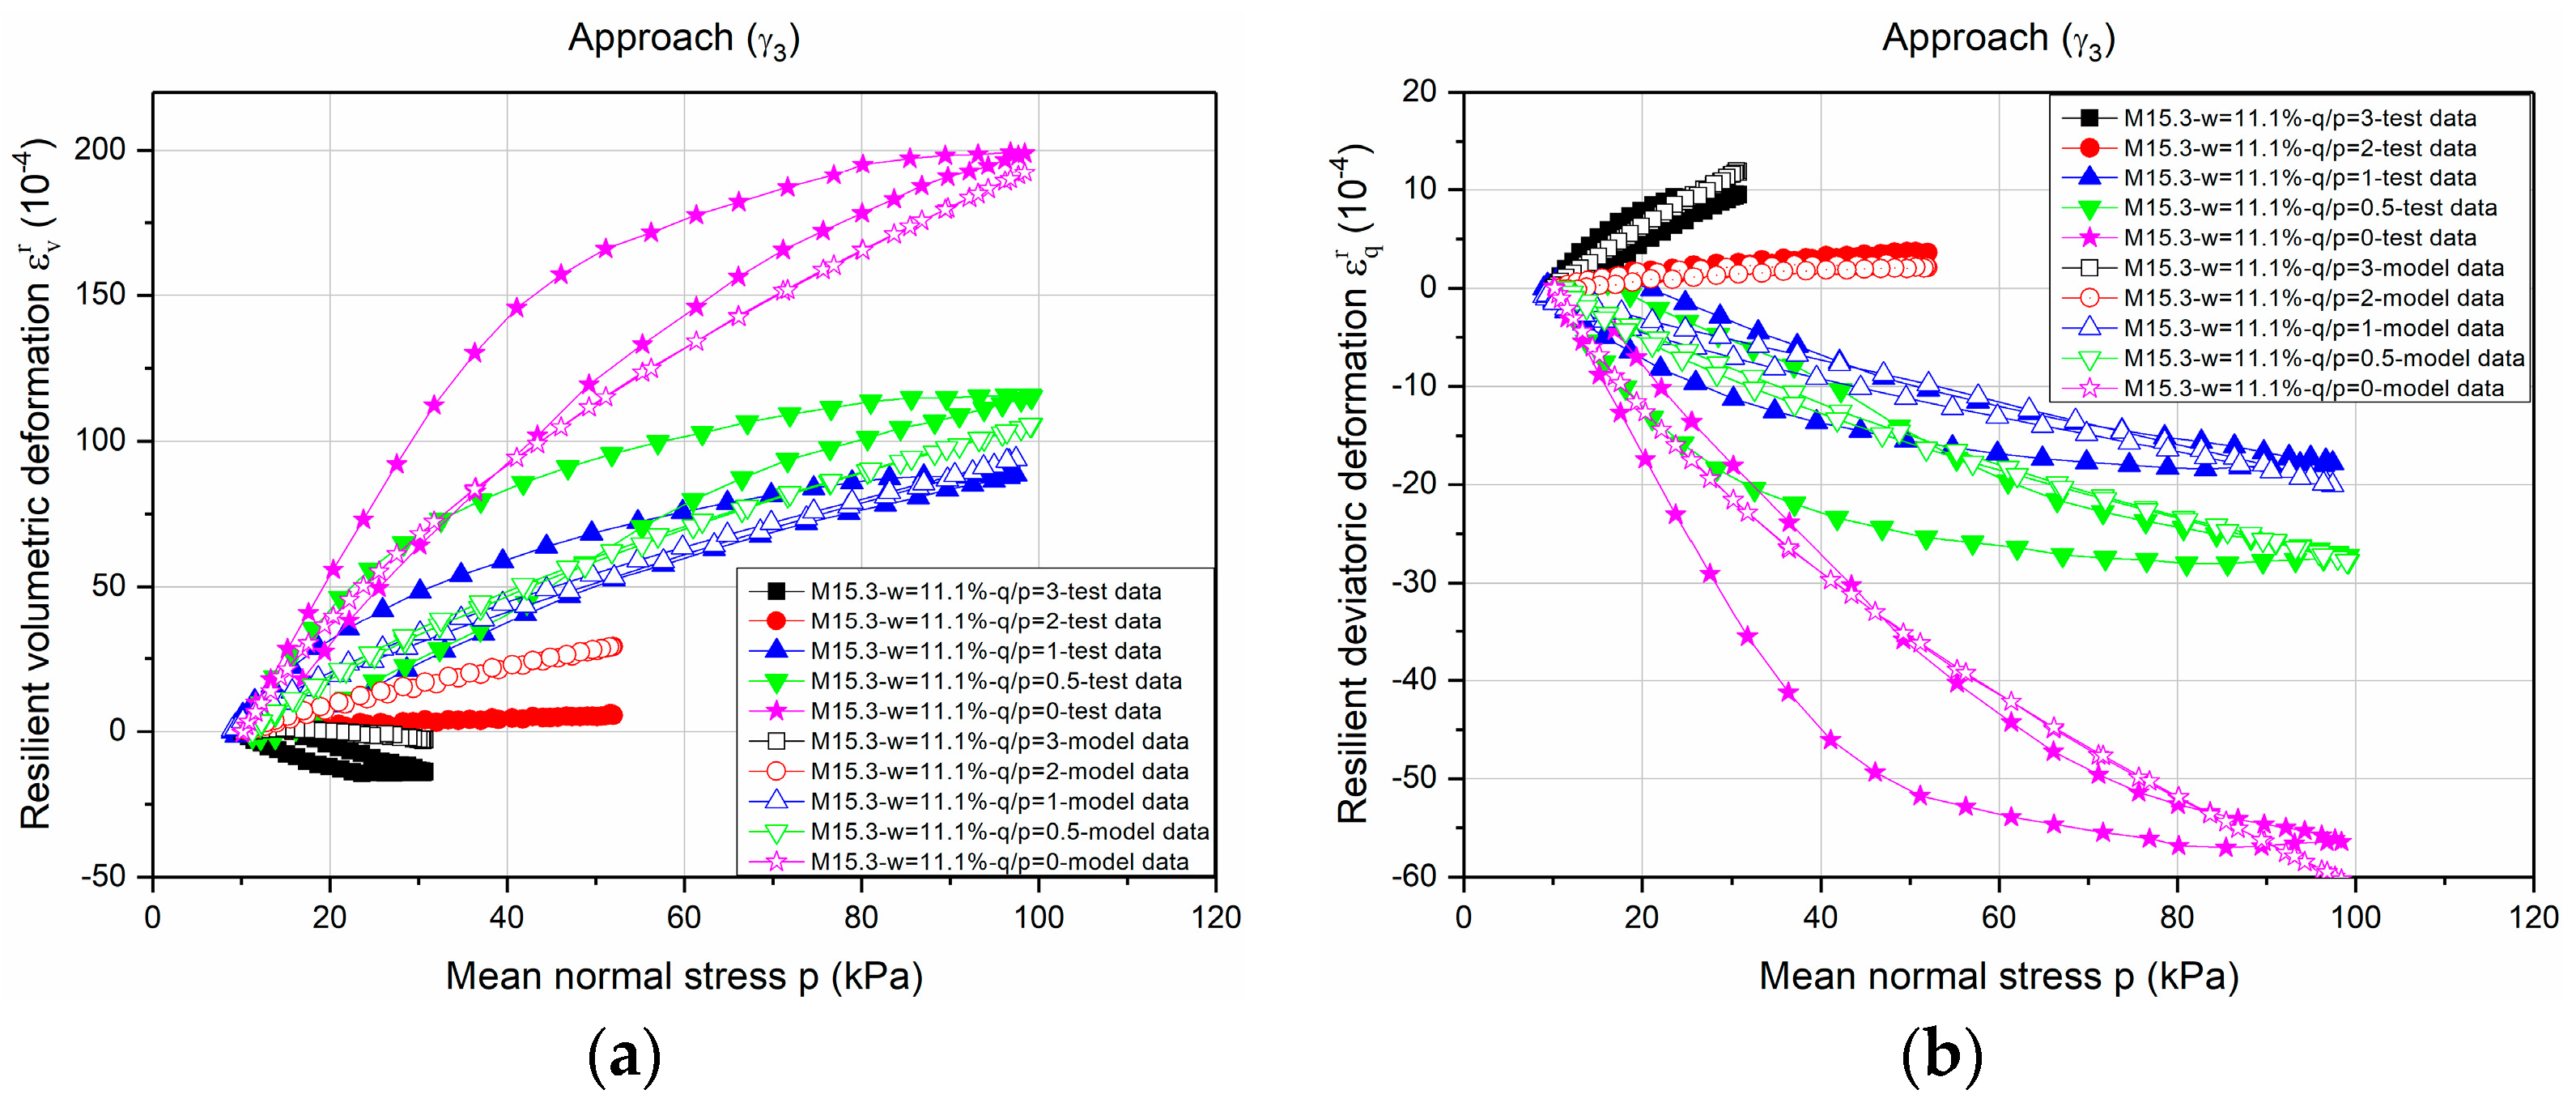
Figure 7 and Figure 8 show the example of modelling the εvr and εqr values for Missillac sand M15.3 at water content of w = 11.1% based on γ1(γ1*) and γ3(γ3*), respectively. As described by the correlation coefficients above, an obvious improvement of the estimated results (both εvr and εqr) can be obtained.
Consequently, it can be stated that the radial anisotropy coefficient γ3, compared with the axial anisotropy coefficient γ1, can improve the prediction of the modified Boyce model for the granular materials with a high water content and a high fine content.
3.3. Relationship between γ1 and γ3 (γ1* and γ3*)
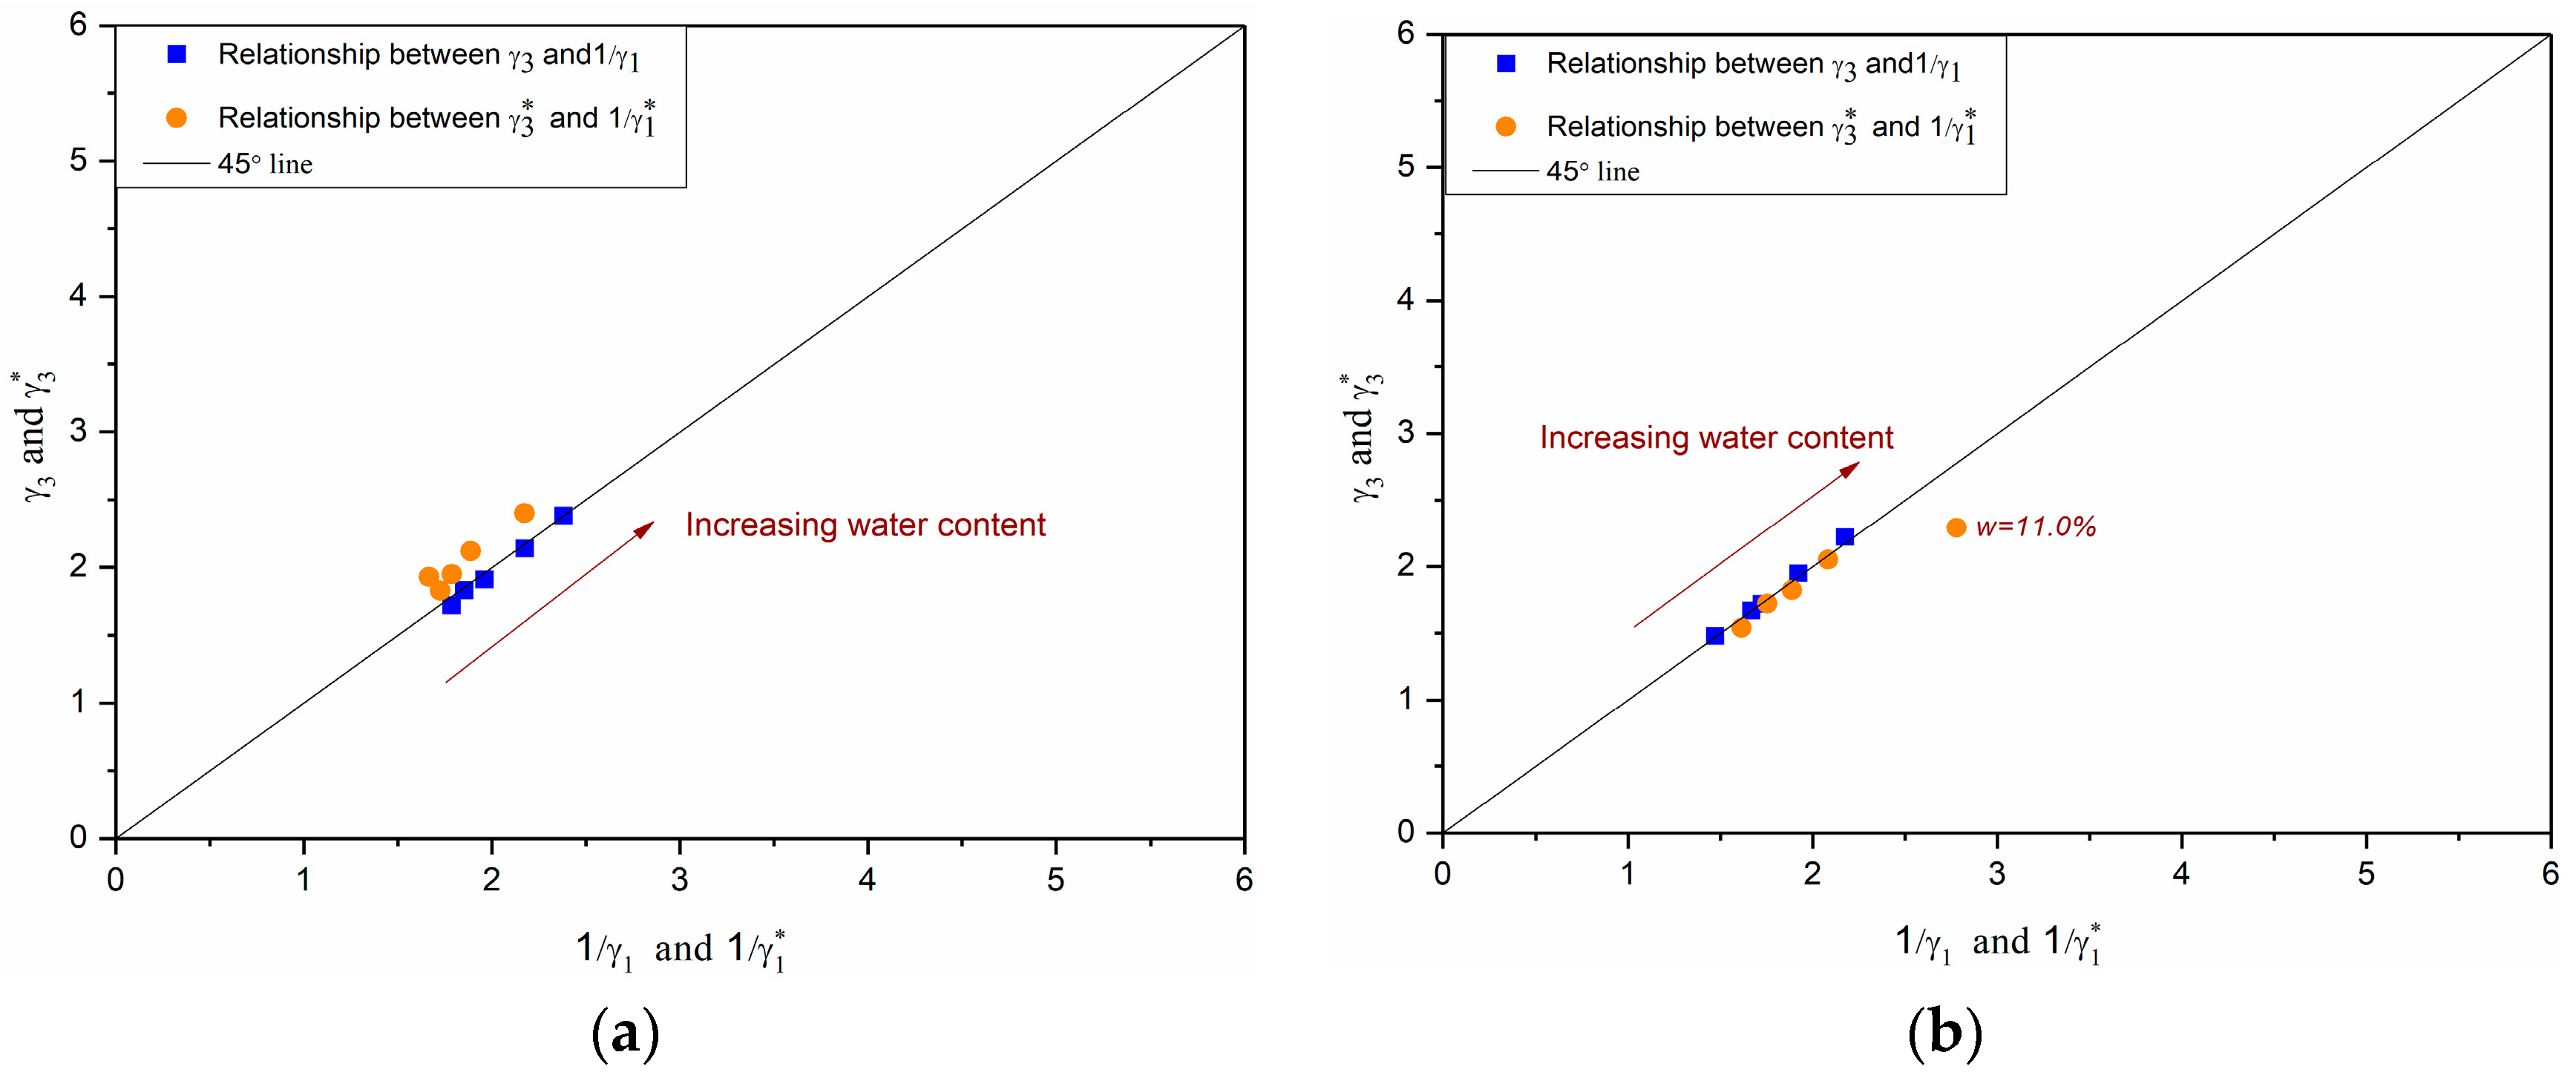
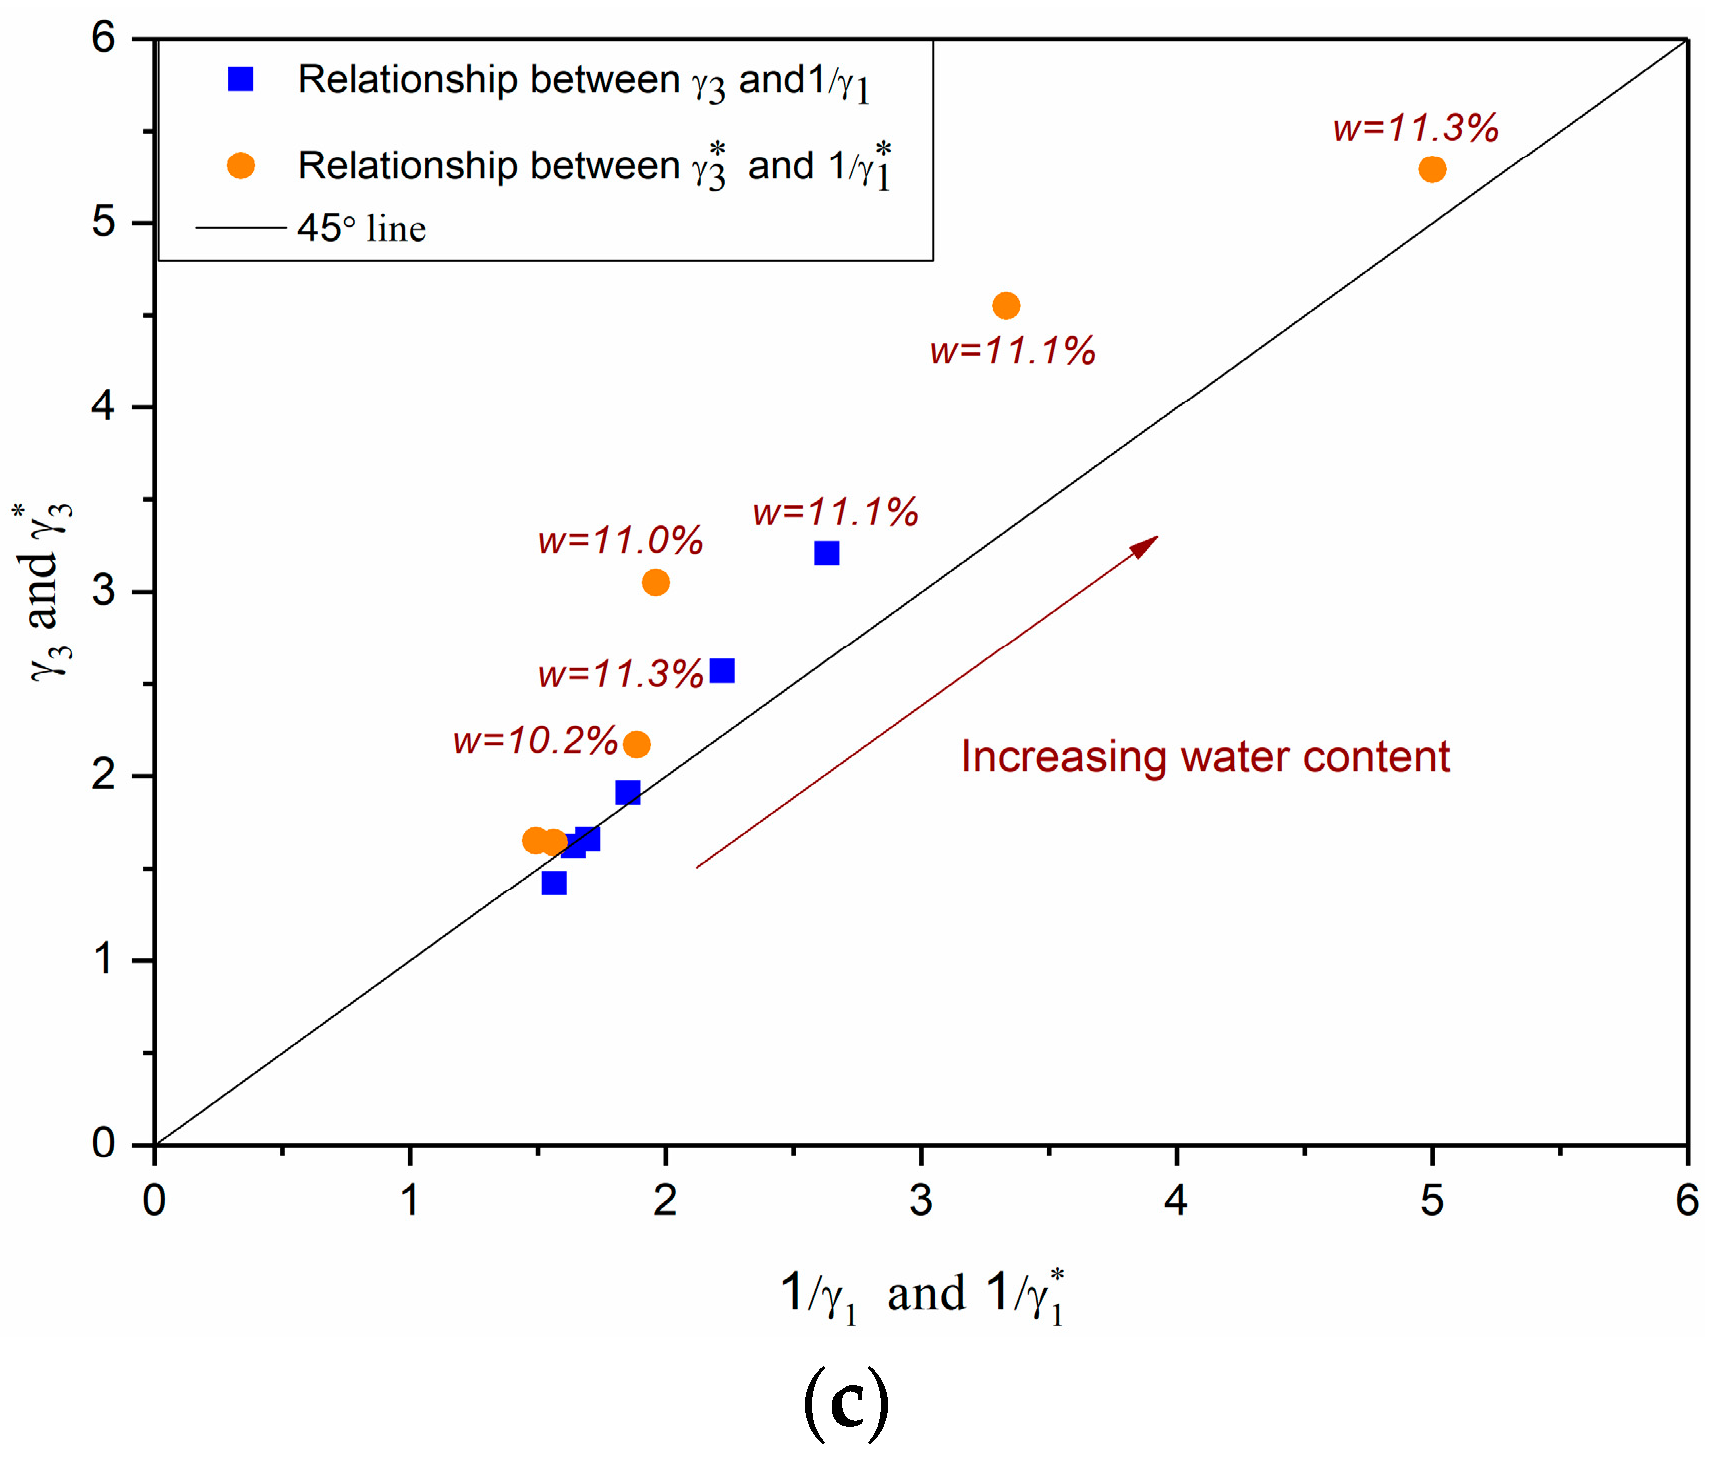
The values of γ3 and 1/γ1 and the values of γ3* and 1/γ1* are presented in Figure 9 for M4.0, M7.5, and M15.3 samples. Generally, the results show that the relations of γ3 = 1/ γ1 and γ3* = 1/γ1* can be obtained approximately in all of the samples of M4.0 and M7.5. For M15.3 samples, the relation of γ3 = 1/ γ1 fits well, except for samples at water contents of 11.1% and 11.3%. The relation of γ3* = 1/γ1* fits only with samples in two low water contents of 8.1% and 8.6%.
The results confirm that the reciprocal relationship between the axial anisotropy coefficient and the radial anisotropy coefficient can change with the ratio of ε1r to ε3r after a threshold. The increase of this ratio or anisotropic behaviour is caused by the coupled effects of water content and fine content in this study. In fact, there are some other influences, such as the shape and disposition of the grains or the loading history, that can induce the anisotropic behaviour of granular materials. As a result, for more general behaviours for granular materials, it is necessary to take into account the variation of anisotropic behaviour as well.
3.4. Numerical Modelling of a Flexible Pavement Structure
The objective of this section is to compare the effects of two anisotropy coefficients, γ1 and γ3, on the deflection of a low traffic pavement structure. Finite elements modelling is performed with the finite elements code CAST3M.
The pavement structure [33] consists of a 66mm of asphalt surface layer placed on 500 mm of unbound granular base over 2.22 m of clayey sand (Missillac) subgrade (Figure 10a). Due to the symmetry, the 3D calculation is carried out on a quarter of the structure (Figure 10b). The pavement is discretized into 2200 cubical elements with 20 nodes. The applied load is a 65 kN dual wheel load, corresponding to the standard axle load used in France for pavement design. The loading area is rectangular, with a length of 0.30 m and a width of 0.18 m. The gravity and lateral stresses are first applied to the pavement structure to establish the initial in situ stress states.
The following materials are used for the calculation:
- The asphalt concrete is used in the surface of pavement. The material behavior is assumed to be linear elastic. The Young elastic modulus (E) is equal to 6110 MPa, and its Poisson ratio is taken as equal to 0.35.
- For the subgrade layer, the Missillac sands (M4.0, M7.5, and M15.3) are used with different water contents (from 7% to 11%). The elastic behaviour is described by the modified Boyce model with anisotropy coefficients γ1 and γ3, respectively. The model parameters in Table 4, Table 5 and Table 6 are used for the calculation.
- For the unbound base layer, the material parameters of Missillac sand are used in the calculation instead of the parameters of unbound granular material in order to avoid the influence of dual variables on the comparison of γ1 and γ3.
Figure 11 shows the deflections of the structures calculated by two different methods (γ1 and γ3) with three Missillac sands (M4.0, M7.5, and M15.3) at different water contents. It can be observed that the deflection values are identical with the two methods (γ1 and γ3) for all three materials at different water contents, except for the structures with M15.3 at water contents (10.2% and 11.1%, where γ1 ≠ 1/γ3). The difference of deflection between the two methods at a water content of 10.2% can be explained by the poor calculation with γ1 (Correl = 0.631). For the water content of 11.1%, the convergence cannot even reach with γ1. The simulation results show that the new proposed approach with anisotropy coefficient γ3 for the granular material has improved the modelling, especially for the case with large resilient deformation (at high water contents and high fine contents).
Besides, the coupled effect of water content and fine content on the deflection of the structures can be observed (Figure 11b): the deflections of the pavement will be obviously higher when the fine content increases from 4% to 7.5%. For the pavement with a high fine content of 15.3%, the matric suction is significantly higher in the unsaturated part because of more fine particles, which leads to a lower resilient deformation. As for the saturated part, the suction is very small, and more fine particles lead to decreasing the resistance of the resilient deformation because of the combination with water.
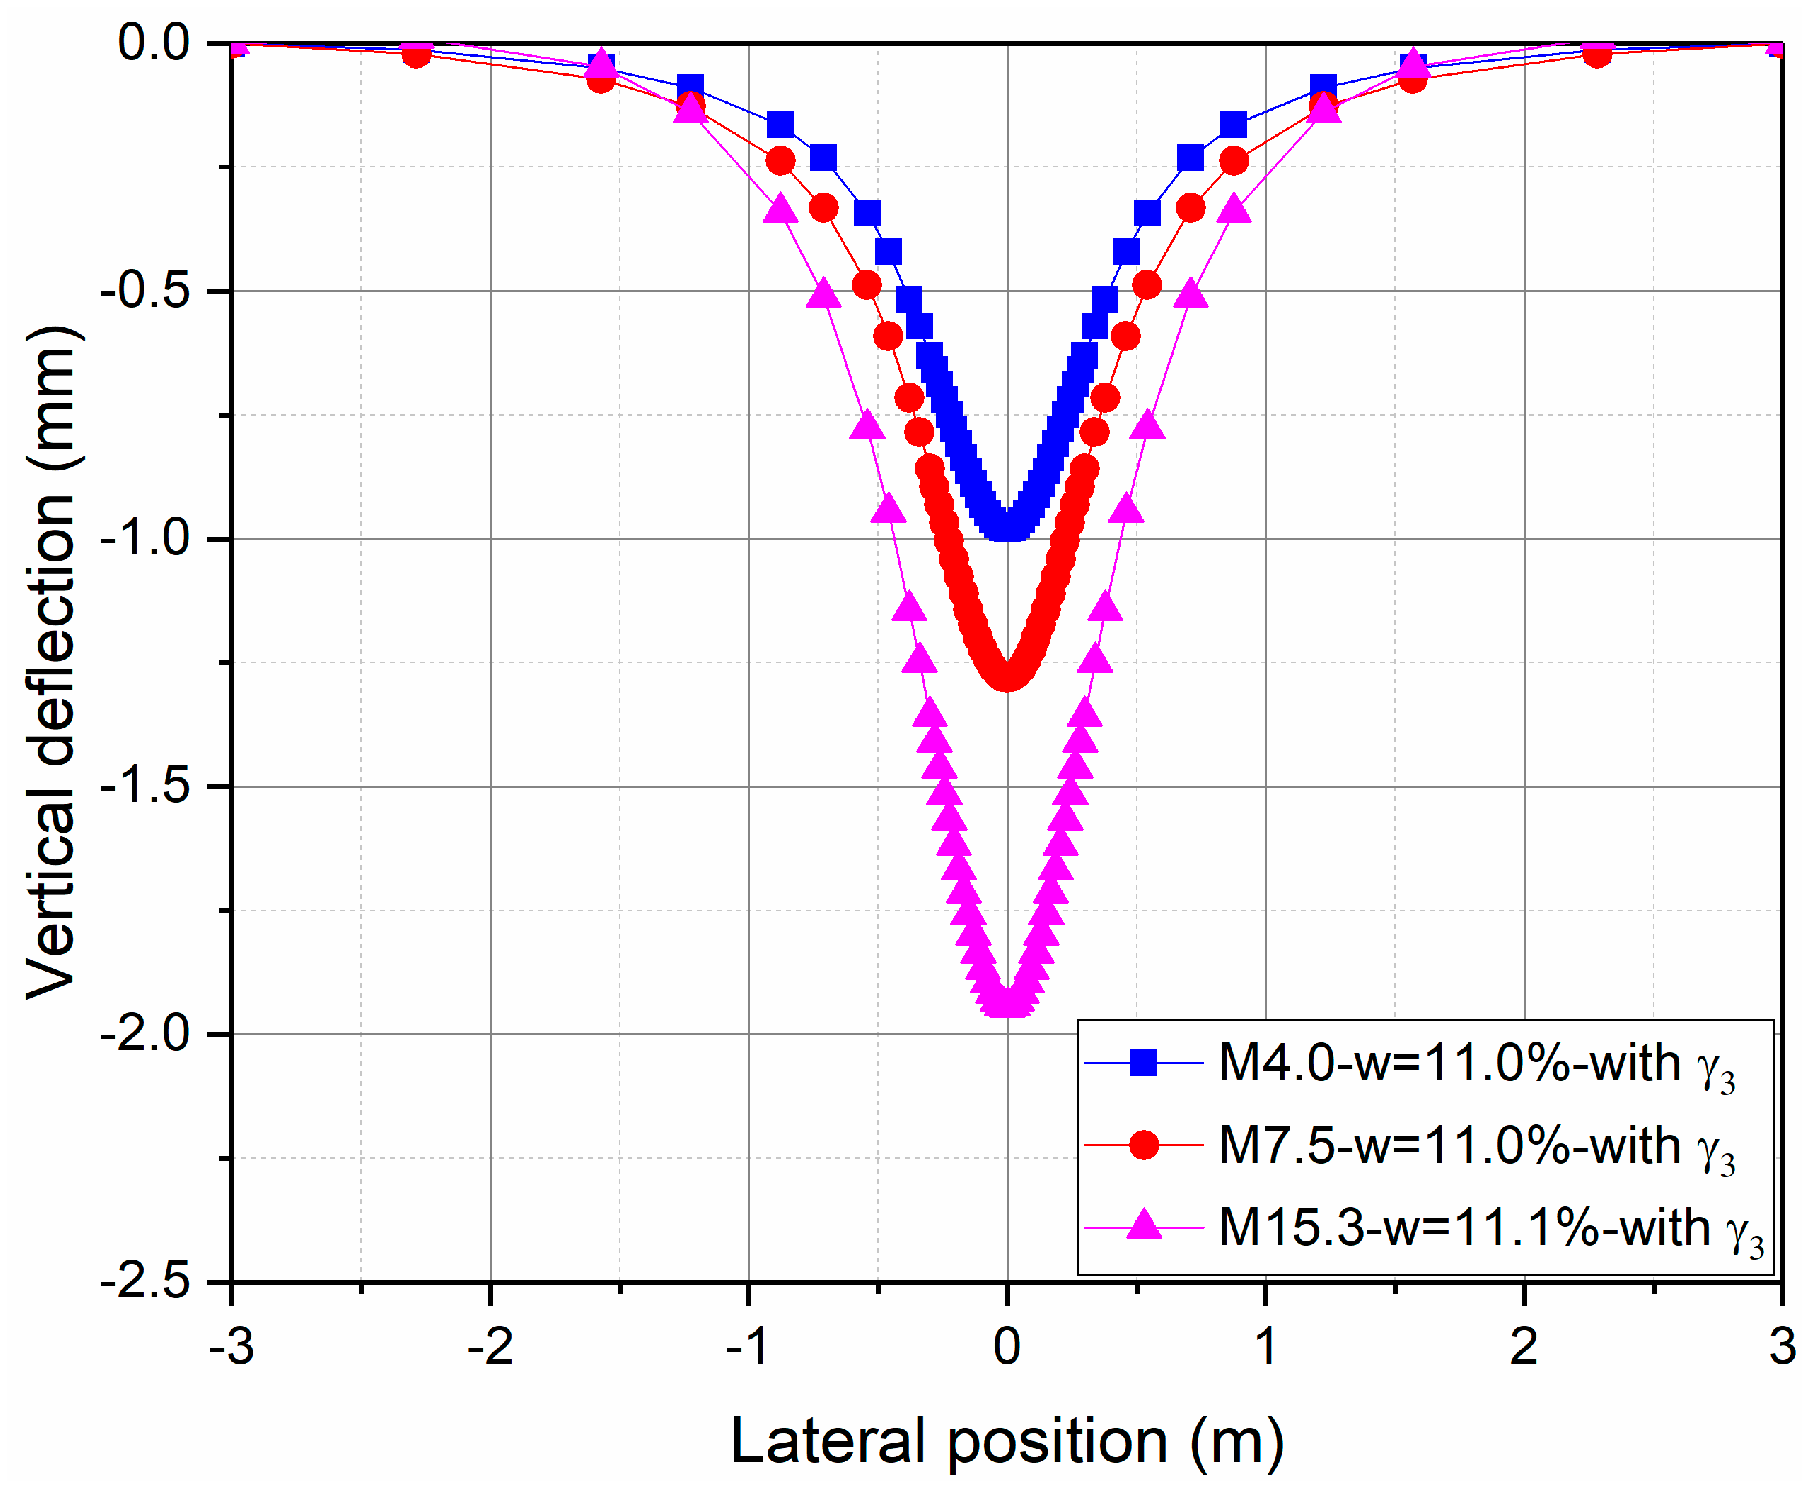
Figure 12 also shows the deflections of the structures with three fine contents at the water content of 11% using the new proposed approach (γ3 parameter). It can be seen that the evolution of deflection varies along the lateral position, and the effect of fine content is important.
4. Conclusions
This article initially presents the resilient behaviour of a natural compacted sand (Missillac sand), which is studied with RLTTs at different water contents and five stress paths varying from zero to three. The inherent anisotropy caused by compaction, and the anisotropy induced by loading stress, can be observed. The anisotropy is strongly influenced by the coupled effects of water content and fine content, which has a large increase as the water content increases (close to saturated state) for a high fine content sample.
Next, the radial anisotropy coefficient is suggested to replace the axial anisotropy coefficient in the non-linear model proposed by Boyce (1980), in order to determine the resilient behaviour of Missillac sand at three different fine contents and different water contents from 7% to 11%. The modelling of the results indicates that the radial anisotropy coefficient γ3, compared with the axial anisotropy coefficient γ3, show more general results, and thus obviously improves the accuracy of the modelling of this granular material with a high fine content close to saturated state. It also confirms the capacity of the improved model to capture the general trend of the experiments.
Finally, the finite elements modelling of a flexible pavement is performed with CAST3M to validate the improvement of the modified Boyce model (from γ1 to γ3). The modelling results present that the modified Boyce model with γ3 is more widely available in different water contents and different fine contents for this granular material. Besides, based on the results, the coupled effects of water content and fine content on the deflection of the structures can be observed apparently.
Consequently, the influence of the anisotropy on the resilient behaviour of granular materials has been seldom taken into account in modelling work. Furthermore, there is a strong link between the anisotropy behaviour and the coupled effects of water content and fine content. Understanding the complex mechanism of the anisotropic resilient deformation is helpful to propose more general resilient models or improve the existing models. This suggests that the number of tests used to predict the resilient behaviour for different moisture conditions or different fine contents can be reduced.
For the future work, this finding will be verified with different granular materials and even higher fine contents.
Acknowledgments
This work is supported by the China Scholarship Council and French national project Durée de Vie des Chaussées. Acknowledgments to the previous work of Pierre Hornych (IFSTTAR) and Xuan Nam Ho (INSA-Strasbourg).
Author Contributions
Peng Jing performed the experimental work; Peng Jing, Cyrille Chazallon and Hossein Nowamooz established the modelling framework together. All authors contributed to the writing of the paper.
Conflicts of Interest
The authors declare no conflict of interest.
References
- Caicedo, B.; Coronado, O.; Fleureau, J.M.; Correia, A.G. Resilient Behaviour of Non Standard Unbound Granular Materials. Road Mater. Pavement Des. 2009, 10, 287–312. [Google Scholar] [CrossRef]
- Nowamooz, H.; Chazallon, C.; Arsenie, M.I.; Hornych, P.; Masrouri, F. Unsaturated Resilient Behavior of a Natural Compacted Sand. Comput. Geotech. 2011, 38, 491–503. [Google Scholar] [CrossRef]
- Bilodeau, J.P.; Doré, G. Water Sensitivity of Resilient Modulus of Compacted Unbound Granular Materials Used as Pavement Base. Int. J. Pavement Eng. 2012, 13, 459–471. [Google Scholar] [CrossRef]
- Salour, F.; Erlingsson, S. Resilient Modulus Modelling of Unsaturated Subgrade Soils: Laboratory Investigation of Silty Sand Subgrade. Road Mater. Pavement Des. 2015, 16, 553–568. [Google Scholar] [CrossRef]
- Hornych, P.; Corte, J.F.; Paute, J.L. Etude des Déformations Permanentes sous Chargements Répétés de Trois Graves Non Traitées. Bull. Liaison Lab. Ponts Chaussées 1993, 184, 45–55. [Google Scholar]
- Werkmeister, S.; Dawson, A.R.; Wellner, F. Pavement Design Model for Unbound Granular Materials. J. Transp. Eng. 2004, 130, 665–674. [Google Scholar] [CrossRef]
- Duong, T.V.; Tang, A.M.; Cui, Y.J.; Trinh, V.N.; Dupla, J.C.; Calon, N.; Canou, J.; Robinet, A. Effects of Fines and Water Contents on the Mechanical Behavior of Interlayer Soil in Ancient Railway Sub-structure. Soils Found. 2013, 53, 868–878. [Google Scholar] [CrossRef]
- Salour, F.; Erlingsson, S. Permanent Deformation Characteristics of Silty Sand Subgrades from Multistage RLT Tests. Int. J. Pavement Eng. 2017, 18, 236–246. [Google Scholar] [CrossRef]
- Casagrande, A.; Carillo, N. Shear Failure of Anisotropic Materials. Proc. Boston Soc. Civ. Eng. 1944, 31, 74–87. [Google Scholar]
- Gerrard, C.M.; Mulholland, P. Stress Strain and Displacement Distributions in Cross-anisotropic and two Layer Isotropic Elastic Systems. In Proceedings of the Australian Road Research Board (ARRB) Conference, Sydney, Australia, 5–9 September 1966; pp. 1123–1158. [Google Scholar]
- Arthur, J.R.K.; Menzies, B.K. Inherent Anisotropy in a Sand. Geotechnique 1972, 22, 115–128. [Google Scholar] [CrossRef]
- Biarez, J.; Hicher, P.Y. Simplified hypotheses on mechanical properties equally applicable to sands and clays. In Proceedings of the International Workshop on Constitutive Equations for Granular Non-Cohesive Soils, Cleveland, OH, USA, 22–24 July 1987; pp. 19–31. [Google Scholar]
- Oda, M.; Sudoo, T. Fabric tensor showing anisotropy of granular soils and its application to soil plasticity in Powders and Grains. In Proceedings of the 1st International Conference on Micromechanics of Granular Media, Clermont-Ferrand, France, 4–8 September 1989; pp. 155–162. [Google Scholar]
- Hoque, E. Elastic Deformation of Sands in Triaxial Tests. Ph.D. Thesis, University of Tokyo, Tokyo, Japan, 1996. [Google Scholar]
- Kohata, Y.; Tatsuoka, F.; Wang, L.; Jiang, G.J.; Hoque, E.; Kodaka, T. Modelling the Non-linear Deformation Properties of Stiff Geomaterials. Geotechnique 1997, 47, 563–580. [Google Scholar] [CrossRef]
- Tutumluer, E.; Seyhan, U. Laboratory Determination of Anisotropic Aggregate Resilient Moduli Using a New Innovative Test Device. Transp. Res. Rec. 1999, 1687, 13–21. [Google Scholar] [CrossRef]
- Karasahin, M.; Dawson, A.R. Anisotropic characteristics of granular materials. In Unbound Aggregates in Road Construction; Dawson, A.R., Ed.; Balkema: Rotterdam, The Netherlands, 2000; pp. 139–144. ISBN 90 5809 1473. [Google Scholar]
- Jing, P.; Nowamooz, H.; Chazallon, C. Permanent Deformation Behaviour of a Granular Material Used in Low Traffic Pavements. Road Mater. Pavement Des. 2018, in press. [Google Scholar] [CrossRef]
- Han, Z.; Vanapalli, S.K. State-of-the-Art: Prediction of Resilient Modulus of Unsaturated Subgrade Soils. Int. J. Geomech. 2016, 16, 04015104. [Google Scholar] [CrossRef]
- Uzan, J. Characterization of Granular Material. Transp. Res. Rec. 1985, 1022, 52–59. [Google Scholar]
- Thom, N.H.; Brown, S.F. The Effect of Grading and Density on the Mechanical Properties of a Crushed Dolomitic Limestone. In Proceedings of the 14th Australian Road Research Board (ARRB) International Conference, Canberra, Australia, 28 August–2 September 1988; pp. 94–100. [Google Scholar]
- Han, Z.; Vanapalli, S.K. Model for Predicting Resilient Modulus of Unsaturated Subgrade Soil Using Soil-Water Characteristic Curve. Can. Geotech. J. 2015, 52, 1605–1619. [Google Scholar] [CrossRef]
- Boyce, H.R. A Non-linear Model for the Elastic Behaviour of Granular Materials under Repeated Loading. In Proceedings of the International Symposium on Soils under Cyclic and Transient Loading, Swansea, UK, 7–11 January 1980; pp. 285–294. [Google Scholar]
- Hornych, P.; Kazai, A.; Piau, J.M. Study of the Resilient Behavior of Unbound Granular Material. In Proceedings of the 5th Conference on Bearing Capacity of Roads and Airfields, Trondheim, Norway, 6–8 July 1998; pp. 1277–1287. [Google Scholar]
- Laloui, L.; Charlier, R.; Chazallon, C.; Erlingsson, S.; Hornych, P.; Pavsic, P.; Srsen, M. Water Influence on Mechanical Behaviour of Pavements: Constitutive Modelling. In Water in Road Structures: Movement, Drainage and Effects, 1st ed.; Dawson, A., Ed.; Springer: Berlin, Germany, 2009; pp. 198–202. ISBN 978-1-4020-8561-1. [Google Scholar]
- Association Française de Normalisation (AFNOR). Exécution des Terrassements—Classification des Matériaux Utilisables Dans la Construction des Remblais et des Couches de Forme D’infrastructures Routières; NF P11-300; AFNOR: Saint-Denis La Plaine, France, 1992. [Google Scholar]
- American Society for Testing and Materials (ASTM). Standard Practice for Classification of Soils for Engineering Purposes (Unified Soil Classification System); ASTM D2487-11; ASTM International: West Conshohocken, PA, USA, 2011. [Google Scholar]
- Association Française de Normalisation (AFNOR). Sols: Reconnaissance et Essais—Détermination des Références de Compactage d’un Matériau—Essai Proctor Normal. Essai Proctor Modifié; NF P94-093; AFNOR: Saint-Denis La Plaine, France, 2014. [Google Scholar]
- Association Française de Normalisation (AFNOR). Melanges Avec ou Sans Liant Hydraulique Essai Triaxial Sous Charge Cyclique Pour Melanges Sans Liant Hydraulique; NF EN 13286-7; AFNOR: Saint-Denis La Plaine, France, 2004. [Google Scholar]
- American Association of State and Highway Transportation Officials (AASHTO). Standard Method of Test for Determining the Resilient Modulus of Soils and Aggregate Materials; AASHTO T 307-99; AASHTO: Washington, DC, USA, 2012. [Google Scholar]
- Association Française de Normalisation (AFNOR). Mélanges Traités et Mélanges non Traités aux Liants hydrauliques. Méthodes L’essai Pour la Masse Volumique de Référence et la Teneur en Eau en Laboratoire—Marteau vibrant; NF EN 13286-4; AFNOR: Saint-Denis La Plaine, France, 2003. [Google Scholar]
- Association Française de Normalisation (AFNOR). Préparation des Matériaux Traités aux Liants Hydrauliques ou non Traités. Fabrication des Eprouvettes par Vibrocompression; NF P98-230-1; AFNOR: Saint-Denis La Plaine, France, 1992. [Google Scholar]
- Chazallon, C.; Allou, F.; Hornych, P.; Mouhoubi, S. Finite Elements Modelling of the Long-term Behaviour of a Full-scale Flexible Pavement with the Shakedown Theory. Int. J. Numer. Anal. Methods Geomech. 2009, 33, 45–70. [Google Scholar] [CrossRef]
Figure 1.
Particle size distribution curves of Missillac sand (M4.0, M7.5 and M15.3).
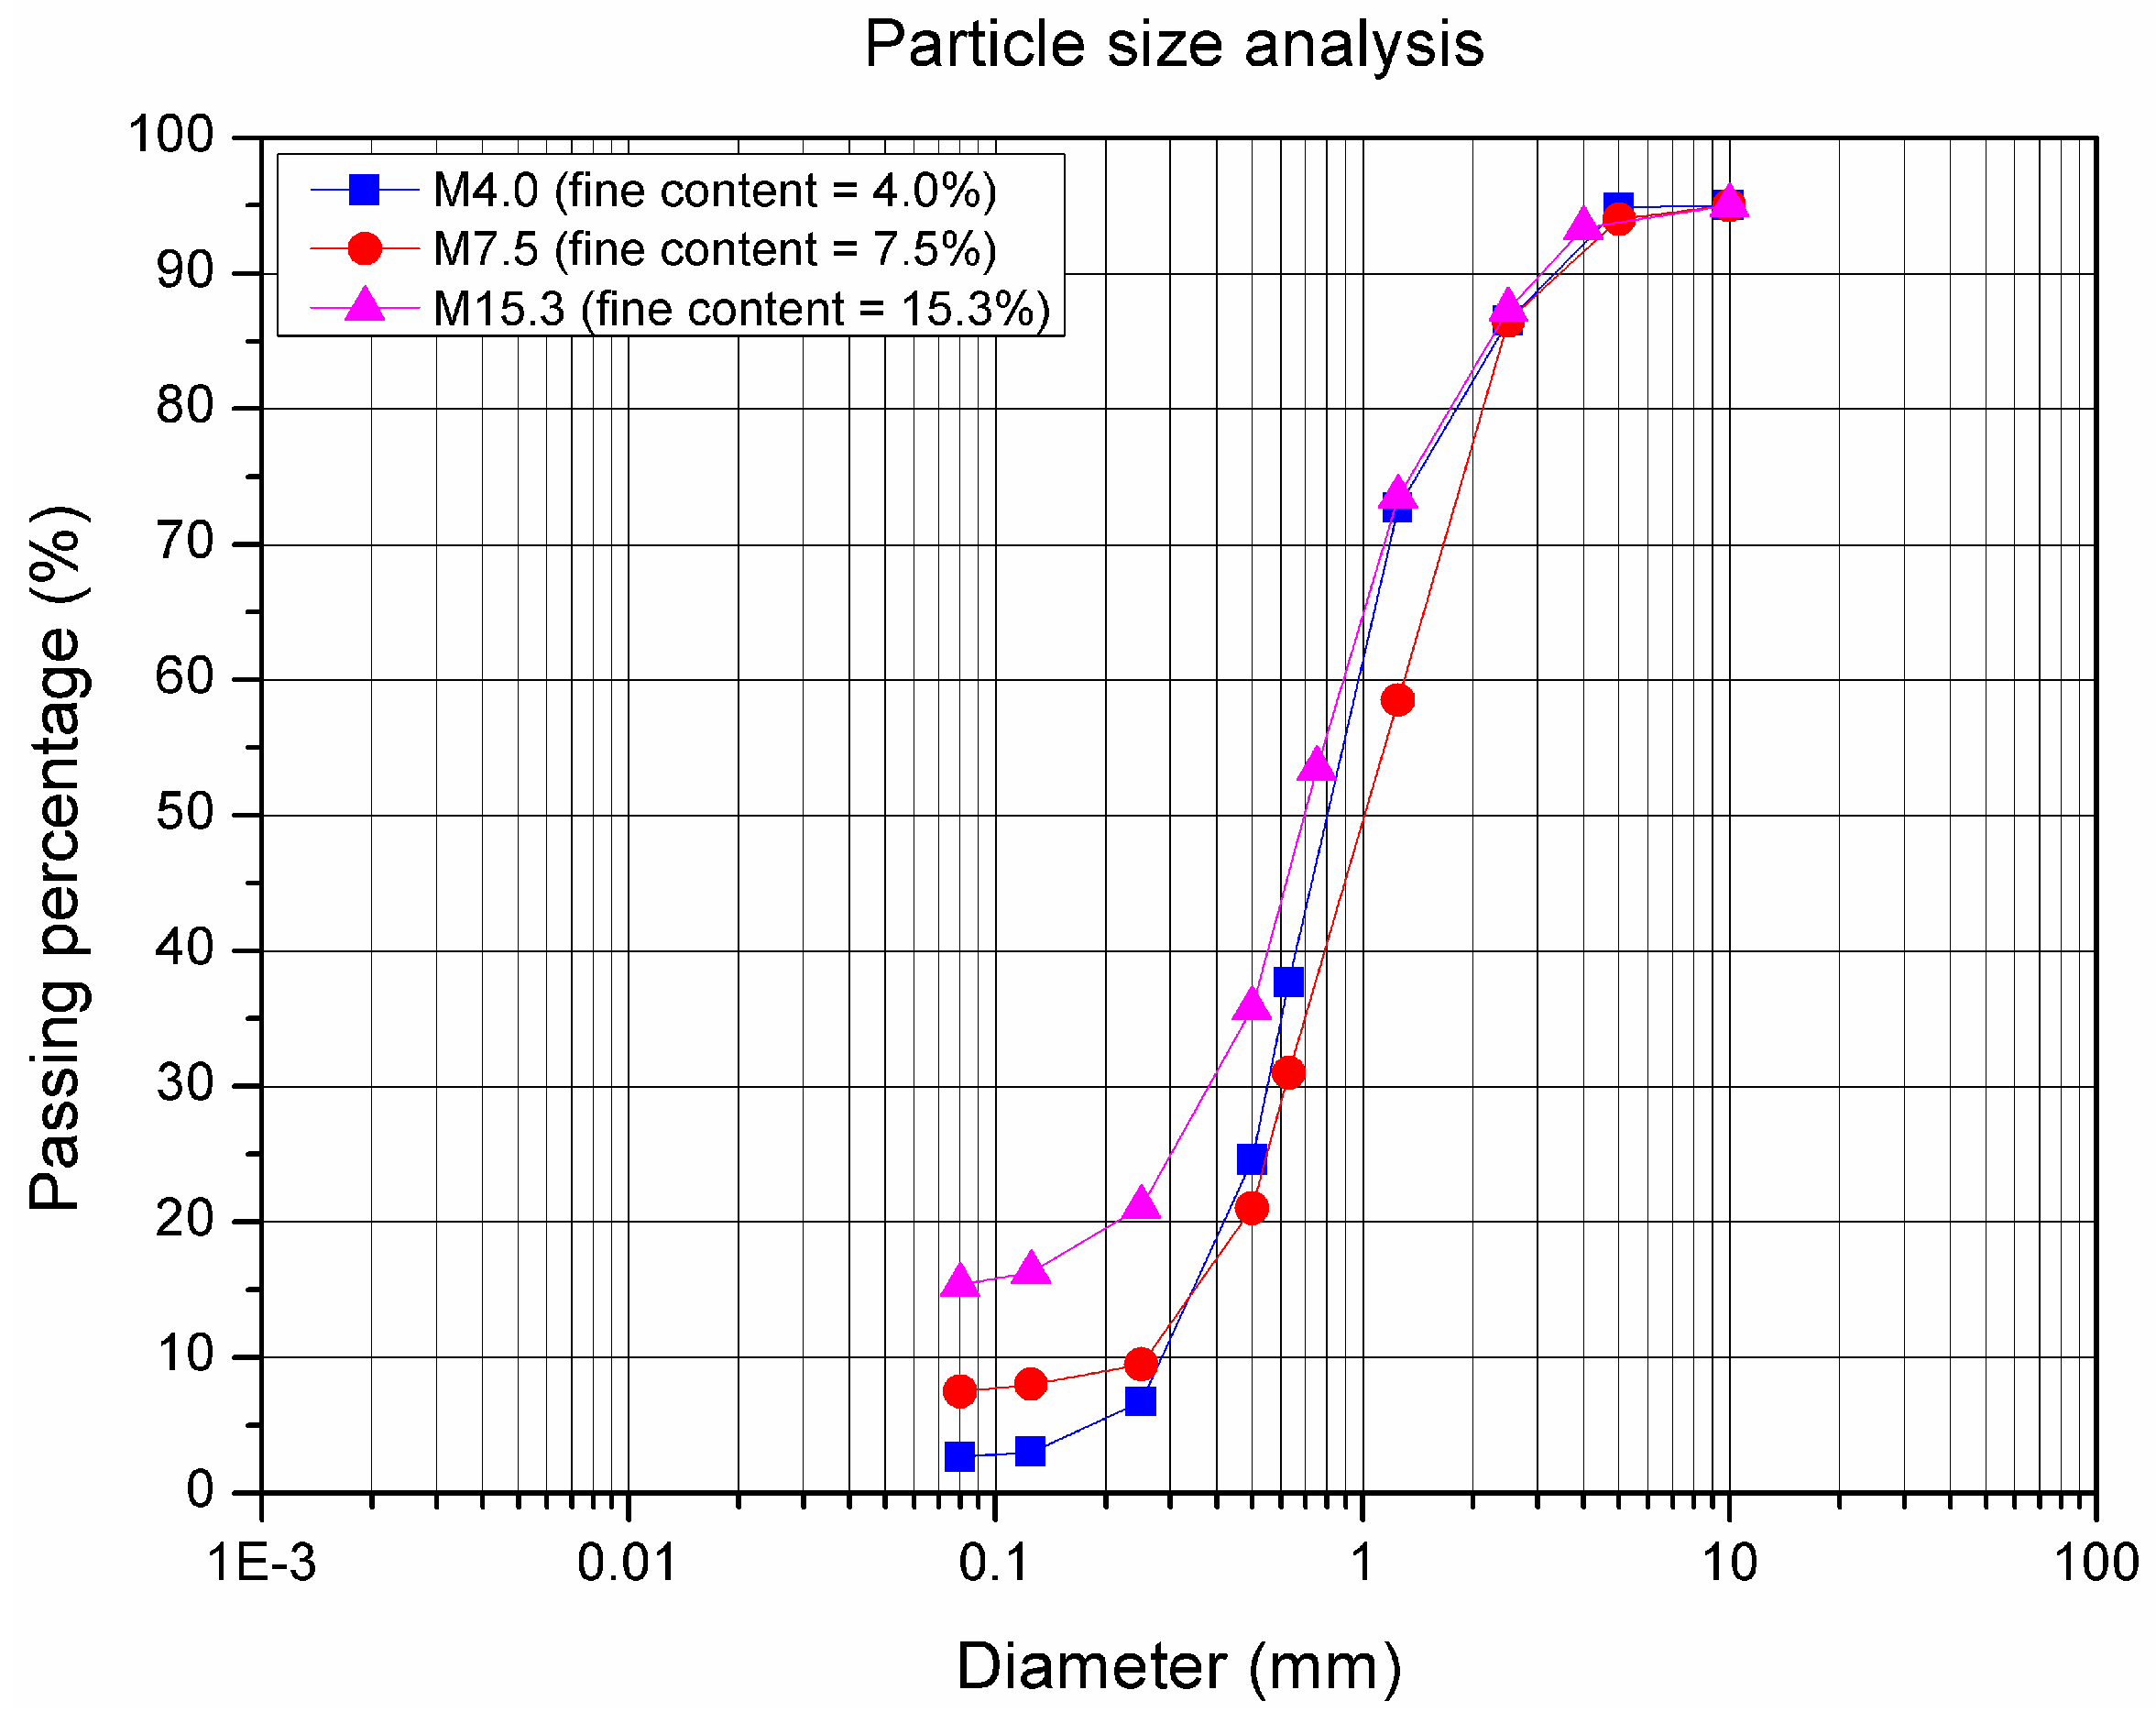
Figure 2.
Standard Proctor compaction (M4.0, M7.5, and M15.3).

Figure 3.
Evolution of resilient volumetric deformation εvr for three different Missillac sands—M4.0, M7.5, and M15.3—with water contents of w = 8% and w = 11%. (a) M4.0-w = 7.8%; (b) M4.0-w = 11.0%; (c) M7.5-w = 8.0%; (d) M7.5-w = 11.0%; (e) M15.3-w = 8.1%; (f) M15.3-w = 11.1%.
Figure 3.
Evolution of resilient volumetric deformation εvr for three different Missillac sands—M4.0, M7.5, and M15.3—with water contents of w = 8% and w = 11%. (a) M4.0-w = 7.8%; (b) M4.0-w = 11.0%; (c) M7.5-w = 8.0%; (d) M7.5-w = 11.0%; (e) M15.3-w = 8.1%; (f) M15.3-w = 11.1%.
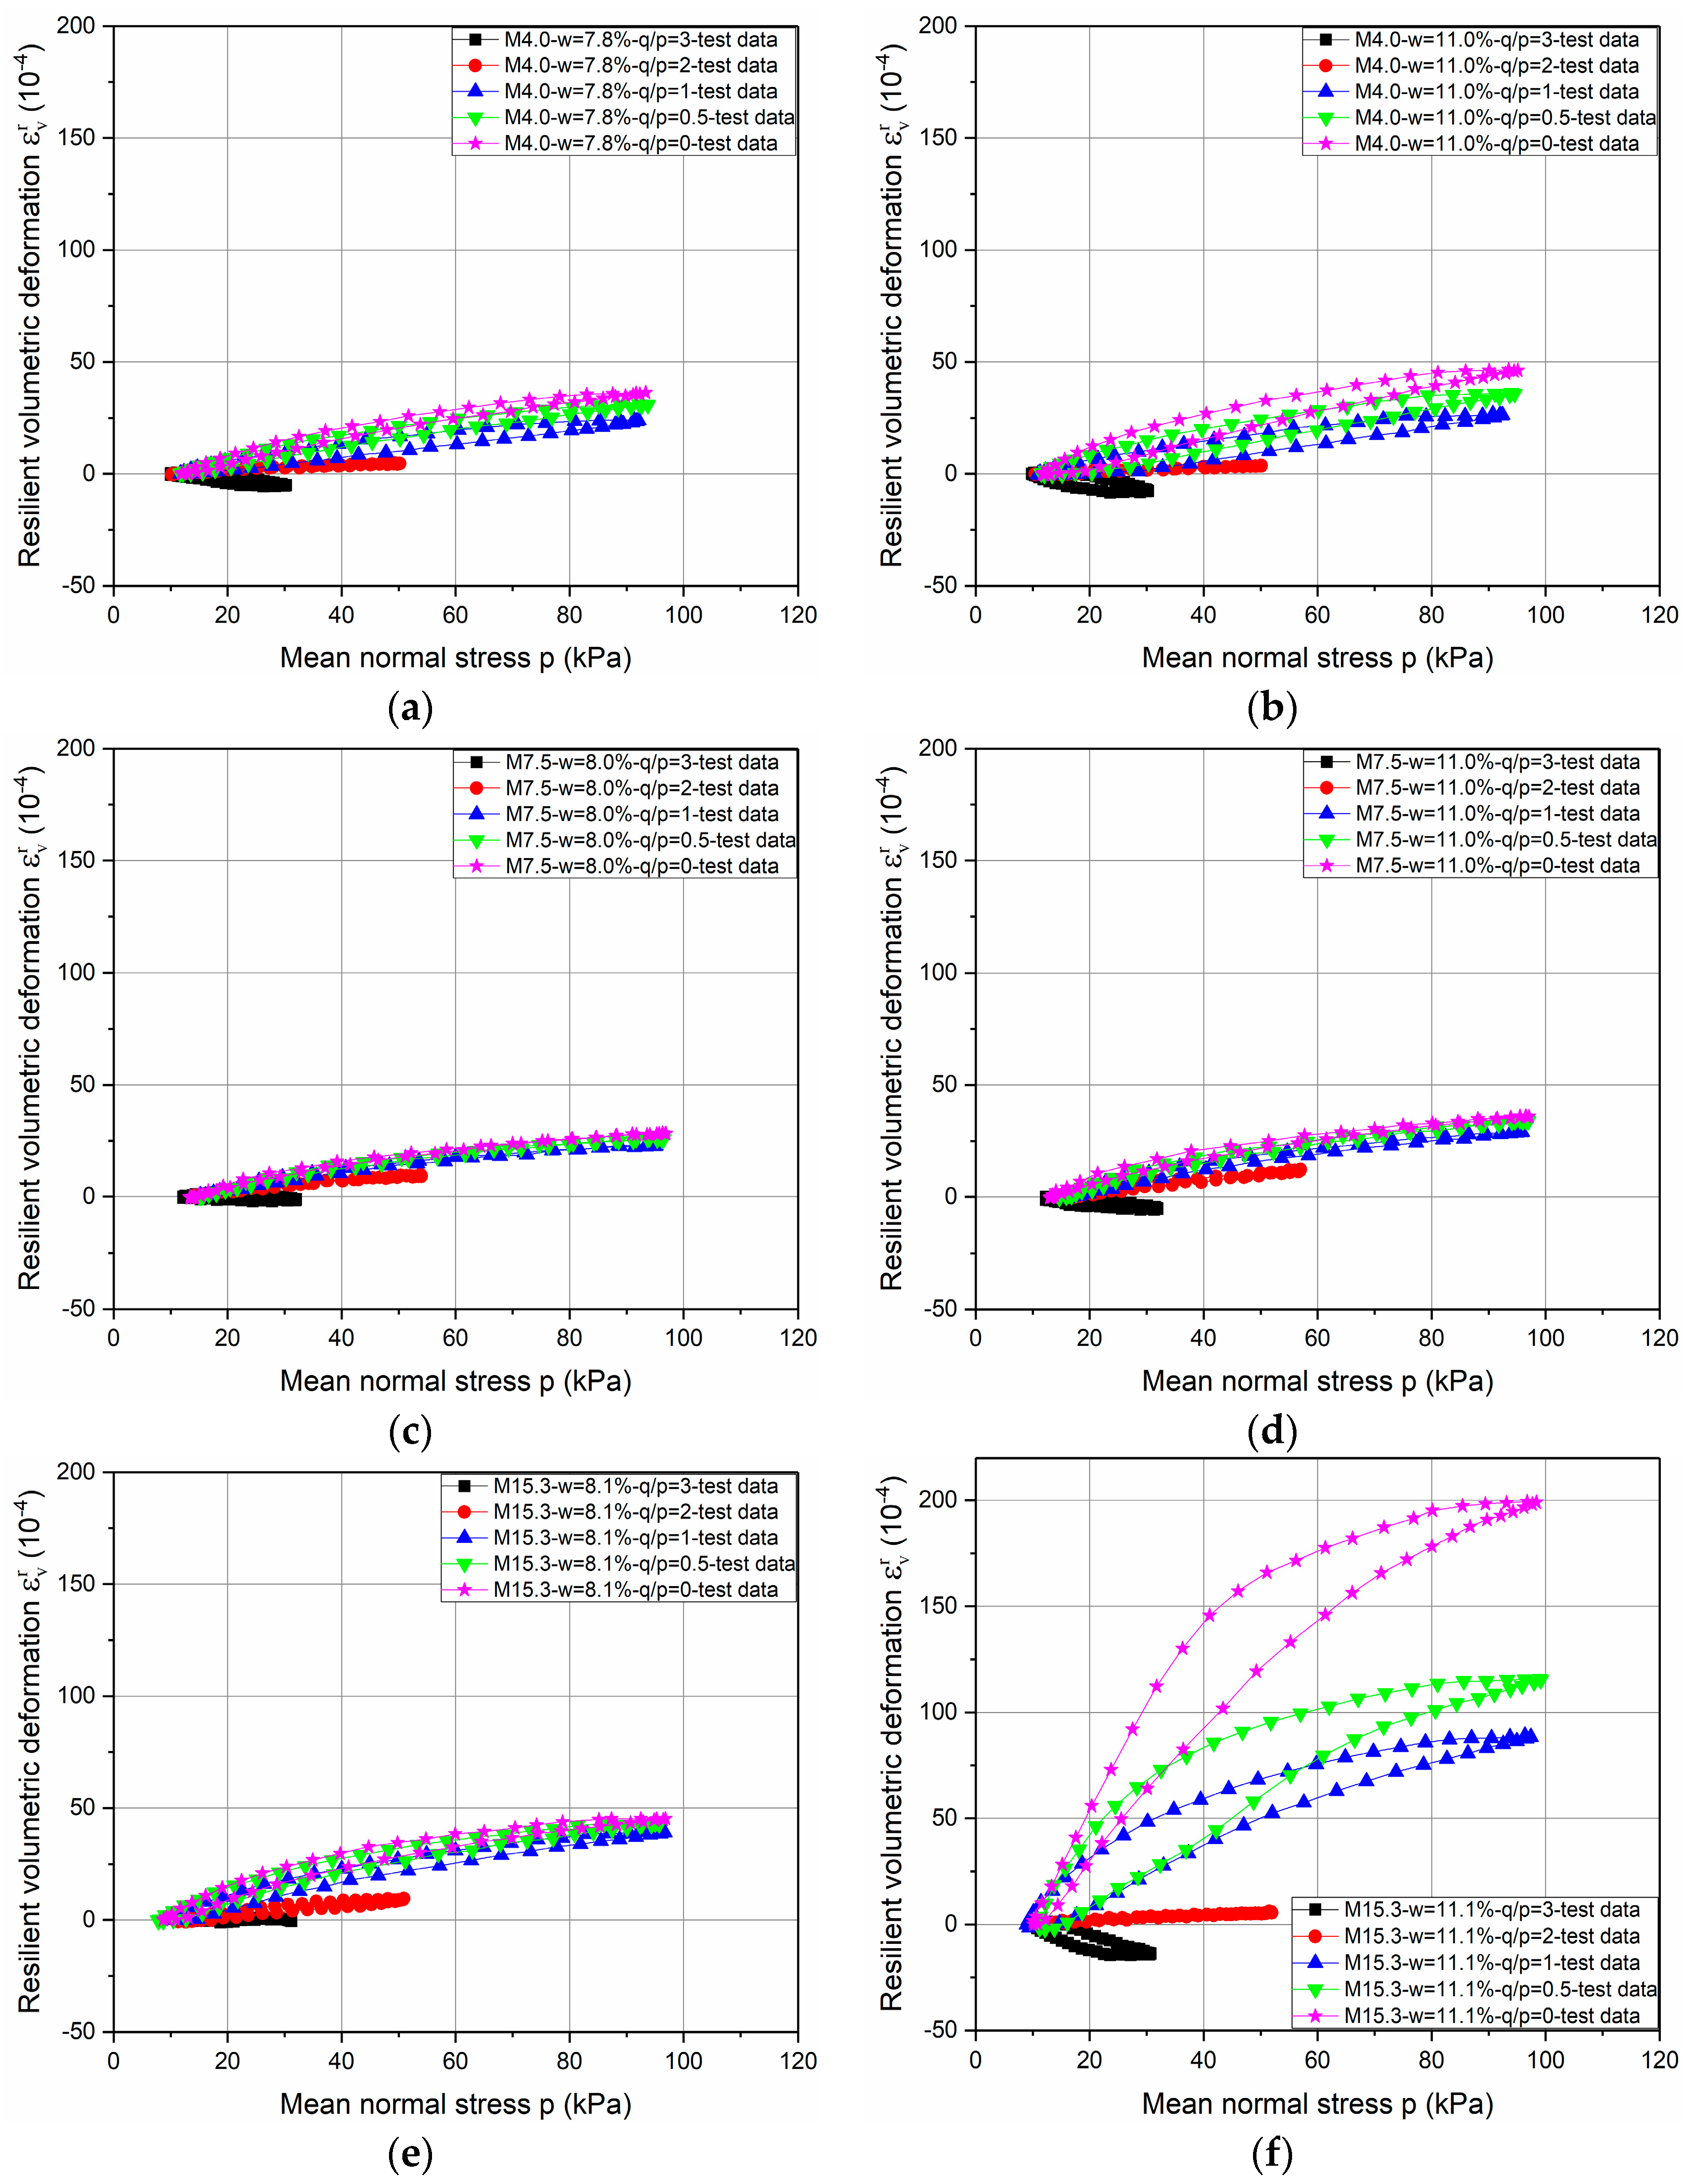
Figure 4.
Evolution of resilient deviatoric deformation εqr for three Missillac sands—M4.0, M7.5, and M15.3—with water contents of w = 8% and w = 11%. (a) M4.0-w = 7.8%; (b) M4.0-w = 11.0%; (c) M7.5-w = 8.0%; (d) M7.5-w = 11.0%; (e) M15.3-w = 8.1%; (f) M15.3-w = 11.1%.
Figure 4.
Evolution of resilient deviatoric deformation εqr for three Missillac sands—M4.0, M7.5, and M15.3—with water contents of w = 8% and w = 11%. (a) M4.0-w = 7.8%; (b) M4.0-w = 11.0%; (c) M7.5-w = 8.0%; (d) M7.5-w = 11.0%; (e) M15.3-w = 8.1%; (f) M15.3-w = 11.1%.

Figure 5.
Final deformations ε1 and ε3 for Missillac sand M15.3 in an isotropic consolidation phase before conditioning.
Figure 5.
Final deformations ε1 and ε3 for Missillac sand M15.3 in an isotropic consolidation phase before conditioning.
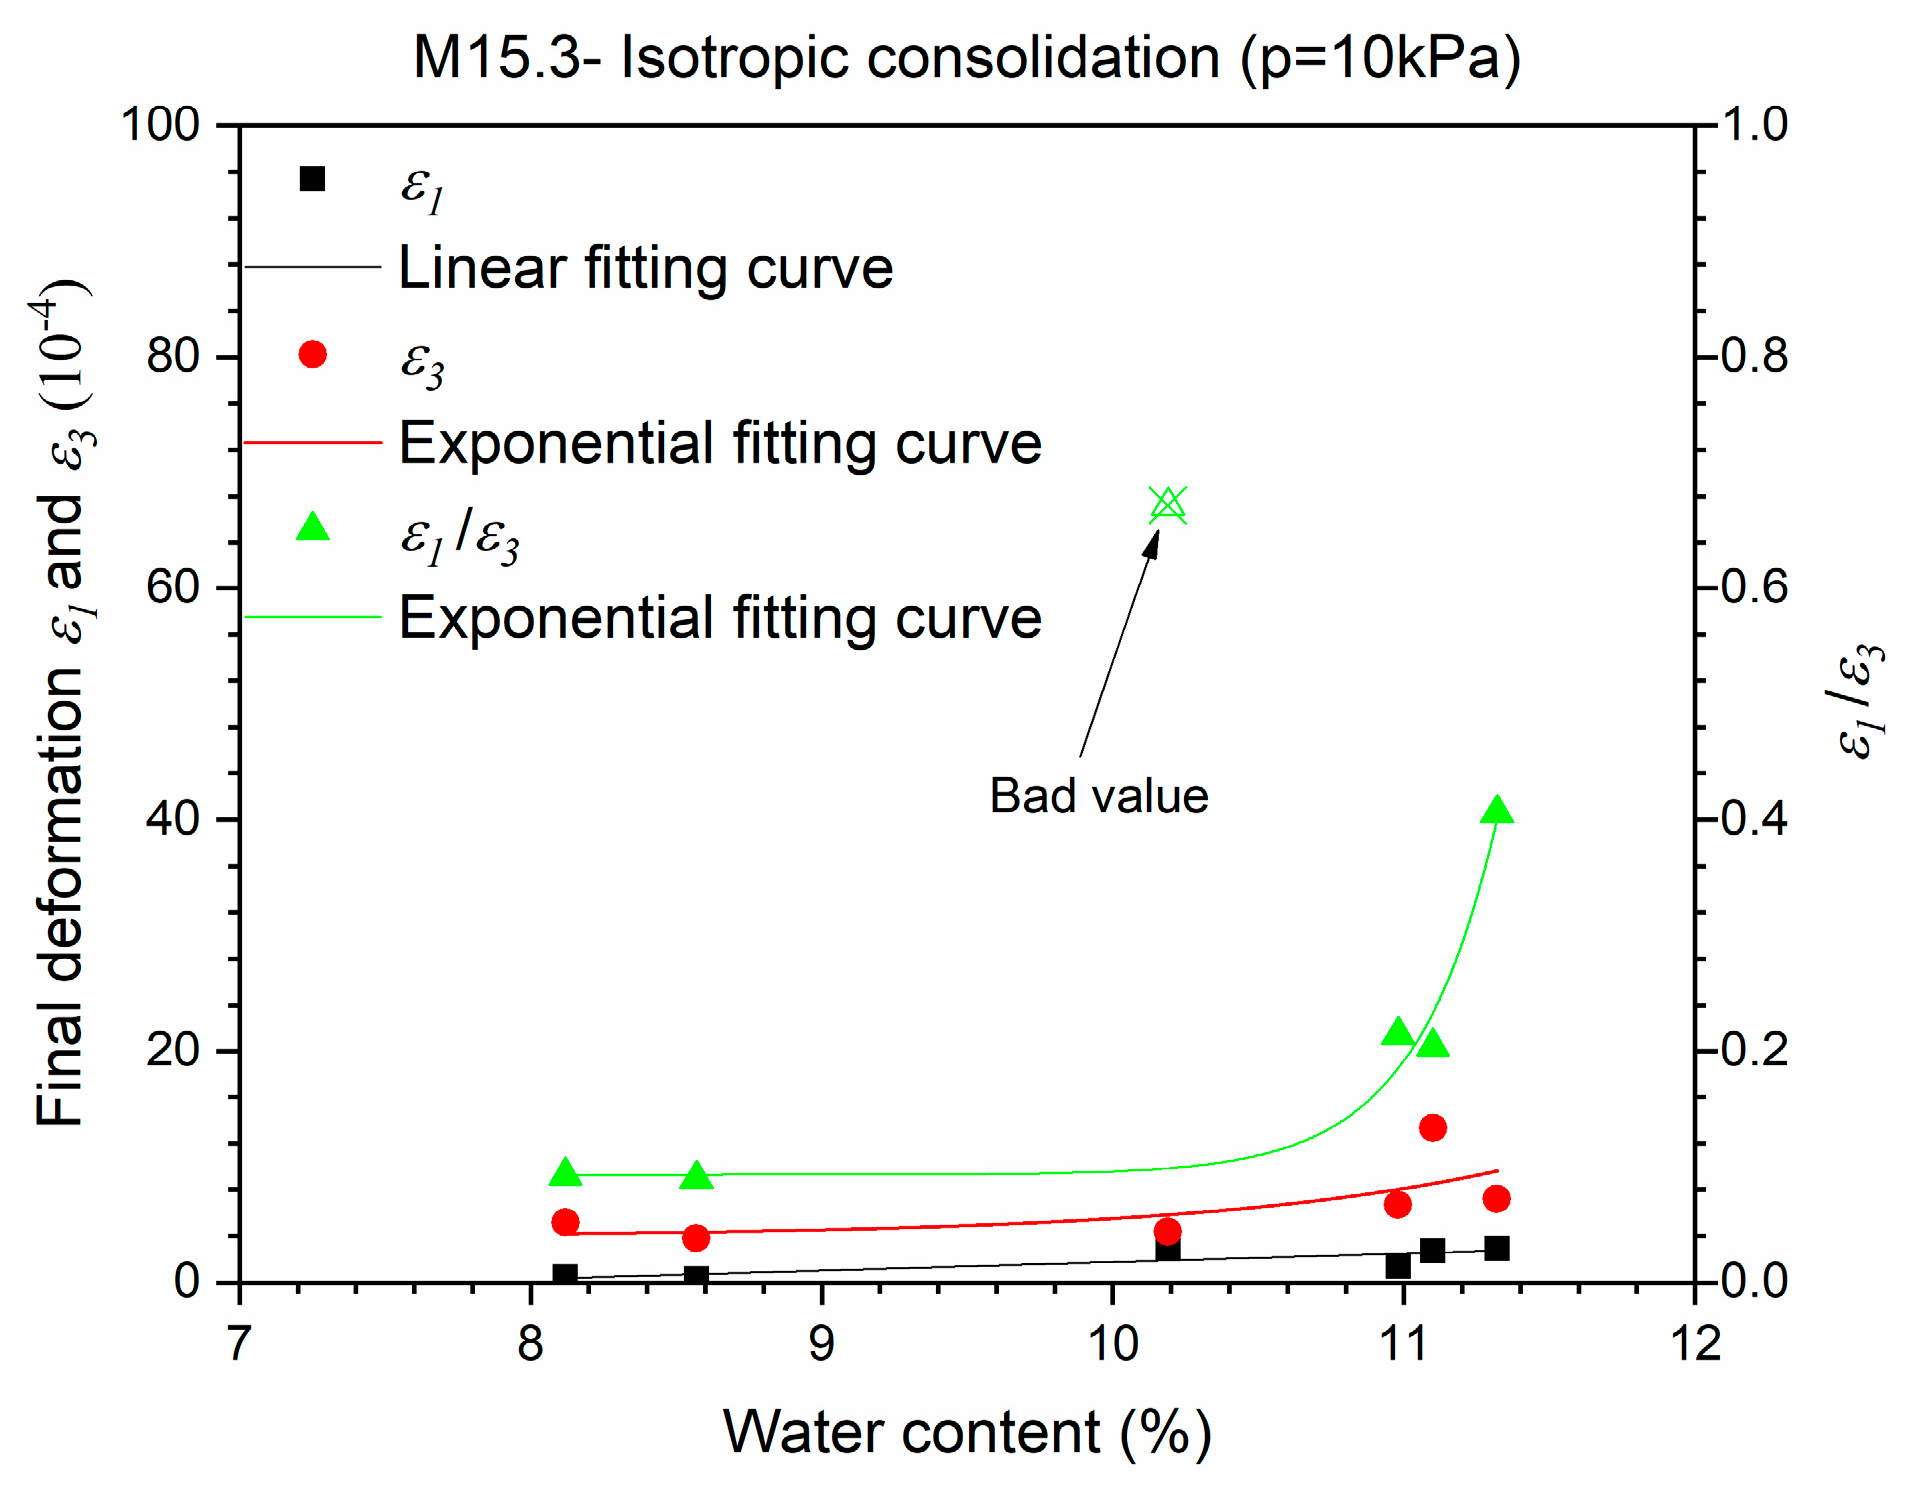
Figure 6.
Maximum resilient deformations ε1,maxr and ε3,maxr for Missillac sands M4.0 and M15.3 in the isotropic loading stress path (∆q/∆p = 0) for the resilient test phase. (a) M4.0; (b) M15.3.
Figure 6.
Maximum resilient deformations ε1,maxr and ε3,maxr for Missillac sands M4.0 and M15.3 in the isotropic loading stress path (∆q/∆p = 0) for the resilient test phase. (a) M4.0; (b) M15.3.

Figure 7.
Modelling of εvr and εqr based on γ1 and γ1* for Missillac sand M15.3 at water content of w = 11.1%. (a) εvr; and (b) εqr.
Figure 7.
Modelling of εvr and εqr based on γ1 and γ1* for Missillac sand M15.3 at water content of w = 11.1%. (a) εvr; and (b) εqr.
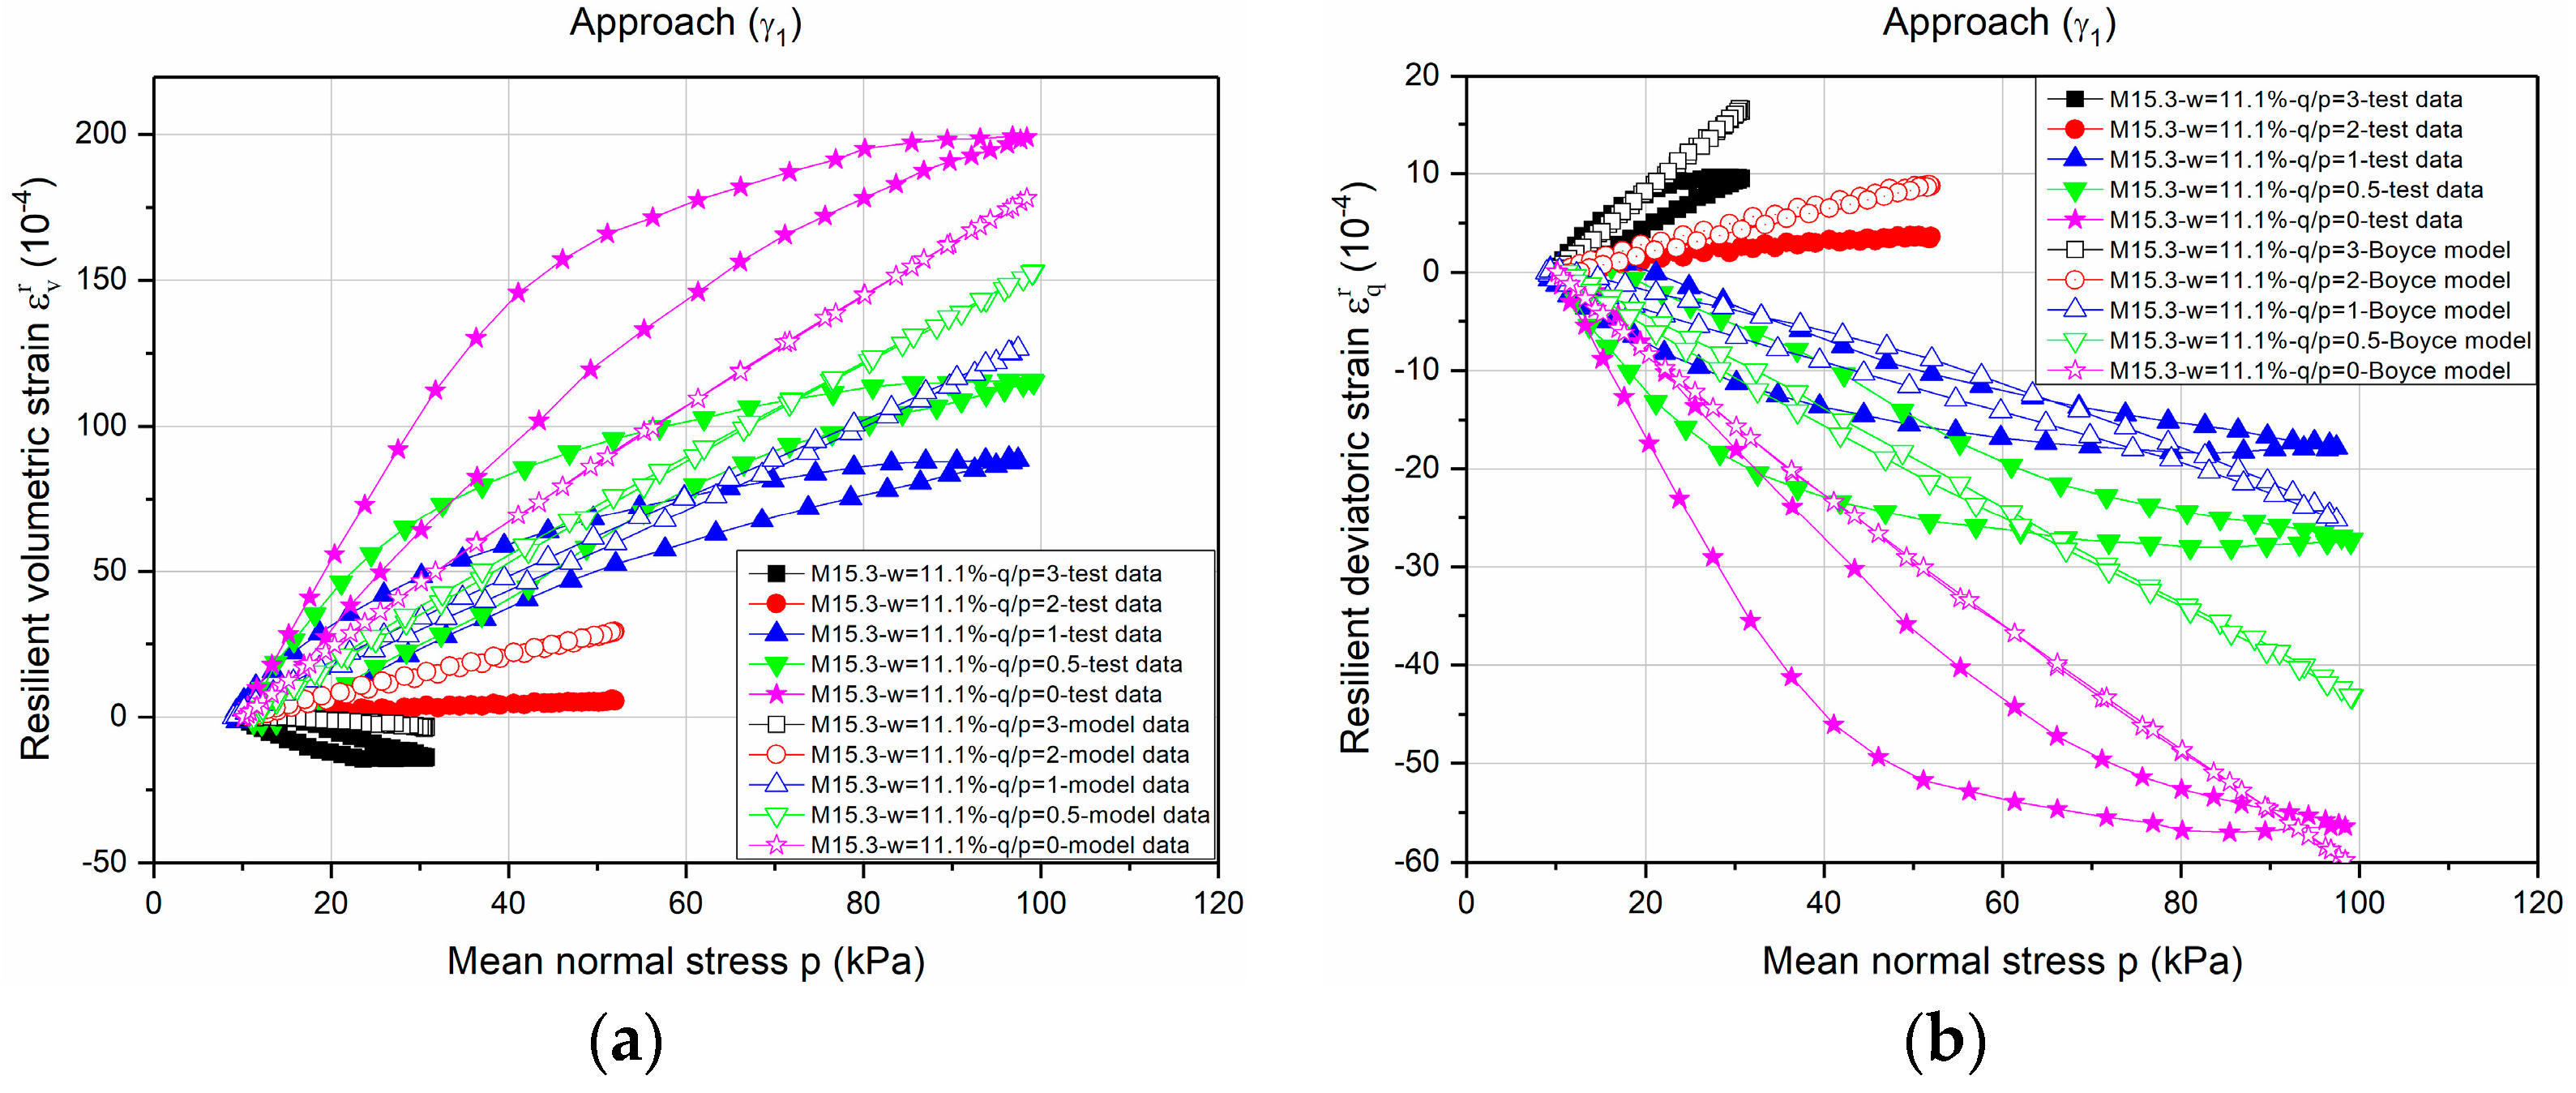
Figure 8.
Modelling of εvr and εqr based on γ3 and γ3* for Missillac sand M15.3 at water content of w = 11.1%. (a) εvr; and (b) εqr.
Figure 8.
Modelling of εvr and εqr based on γ3 and γ3* for Missillac sand M15.3 at water content of w = 11.1%. (a) εvr; and (b) εqr.

Figure 9.
Relationships between γ3 and 1/γ1 and γ3* and 1/γ1* at water contents from 7% to 11%: (a) M4.0; (b) M7.5; (c) M15.3.
Figure 9.
Relationships between γ3 and 1/γ1 and γ3* and 1/γ1* at water contents from 7% to 11%: (a) M4.0; (b) M7.5; (c) M15.3.


Figure 10.
(a) Low-traffic pavement studied; (b) 3D finite element mesh for pavement simulation.
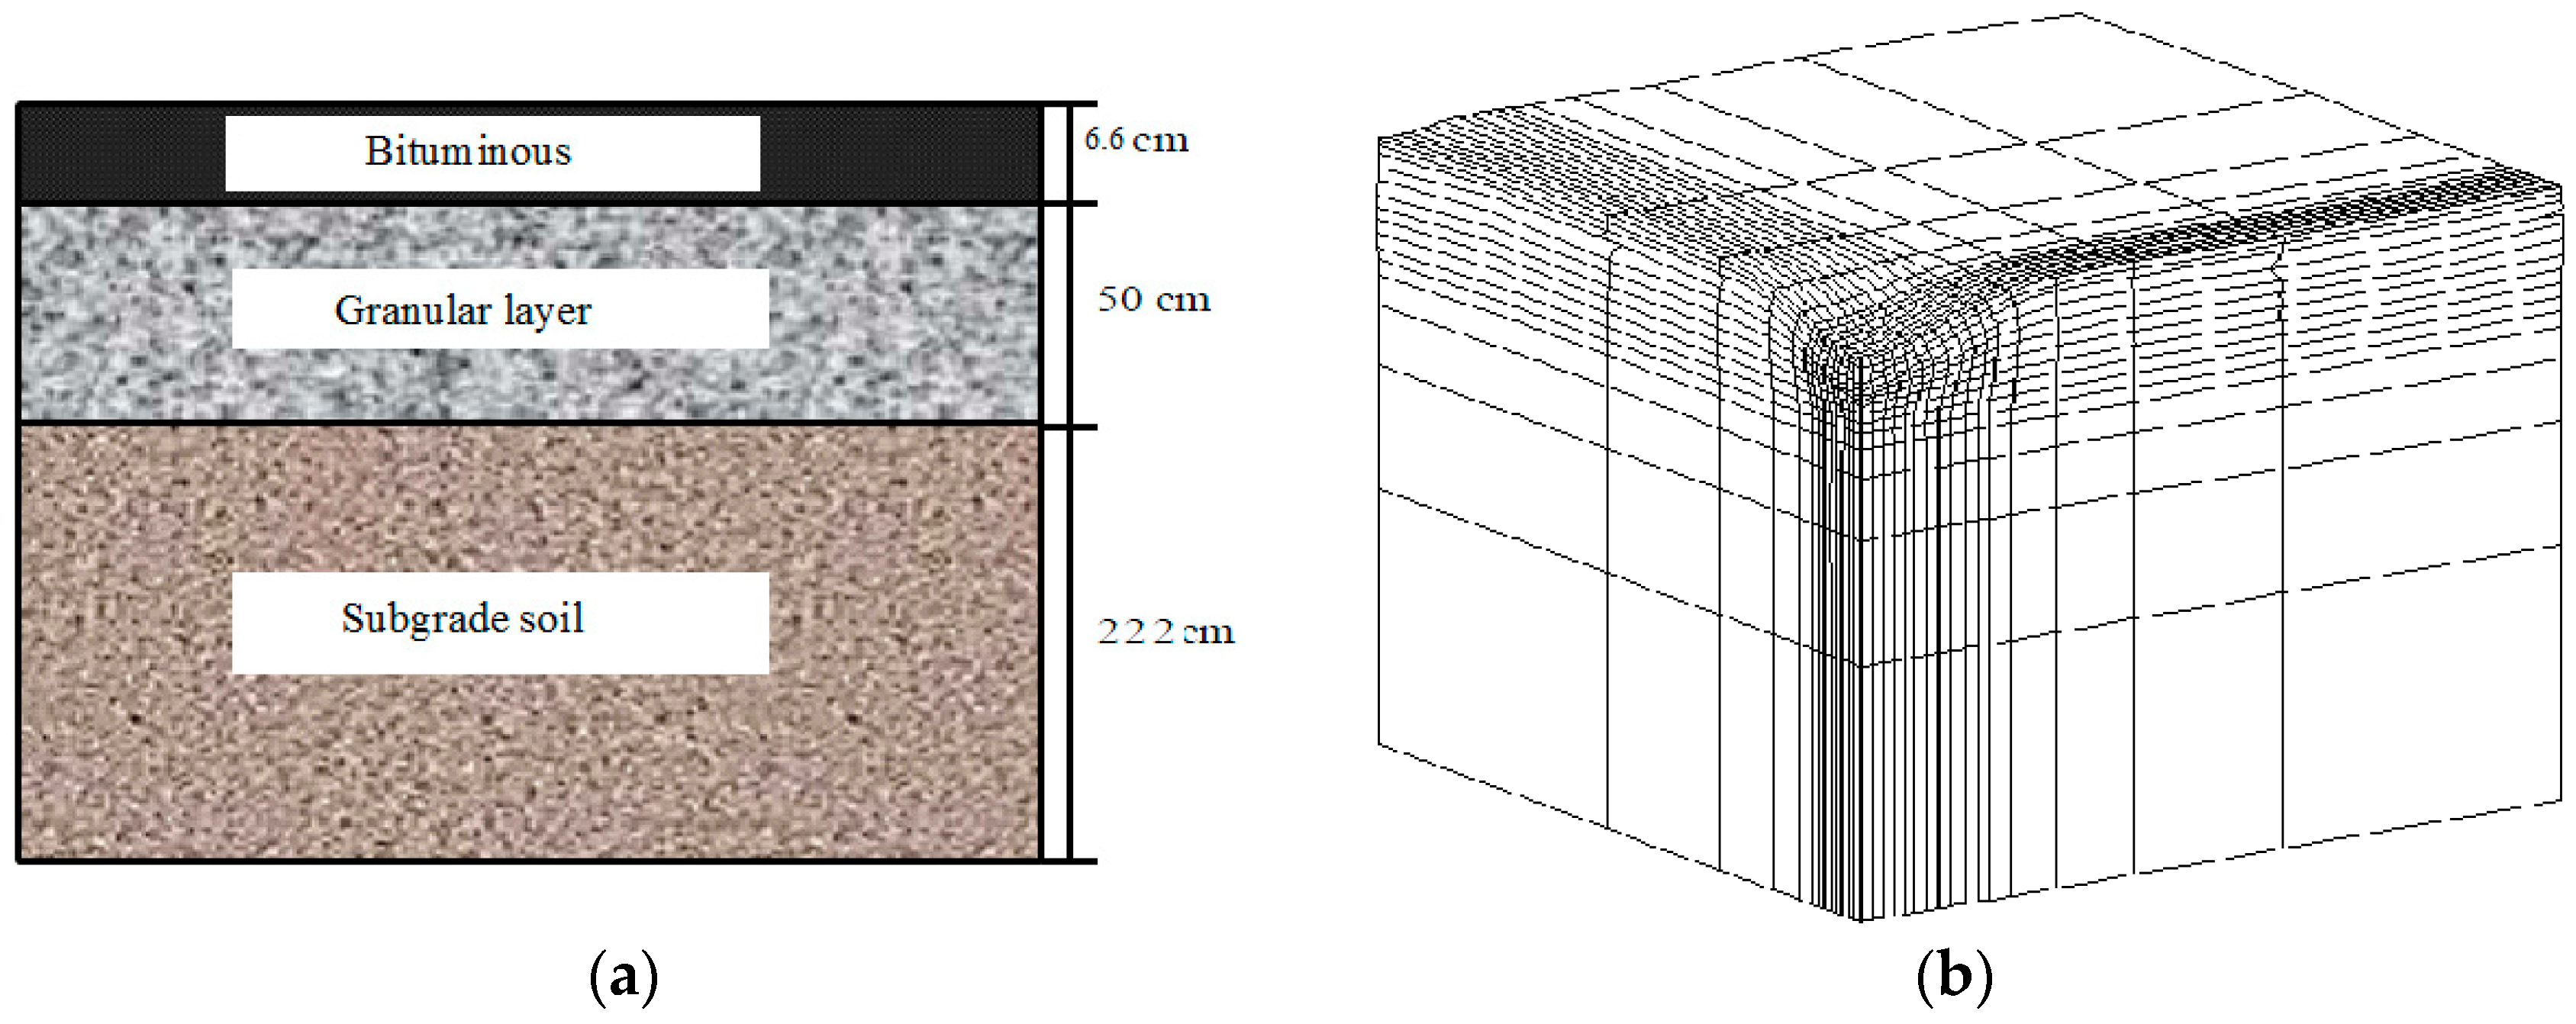
Figure 11.
Calculation of the vertical deflection, (a) with γ1; (b) with γ3.
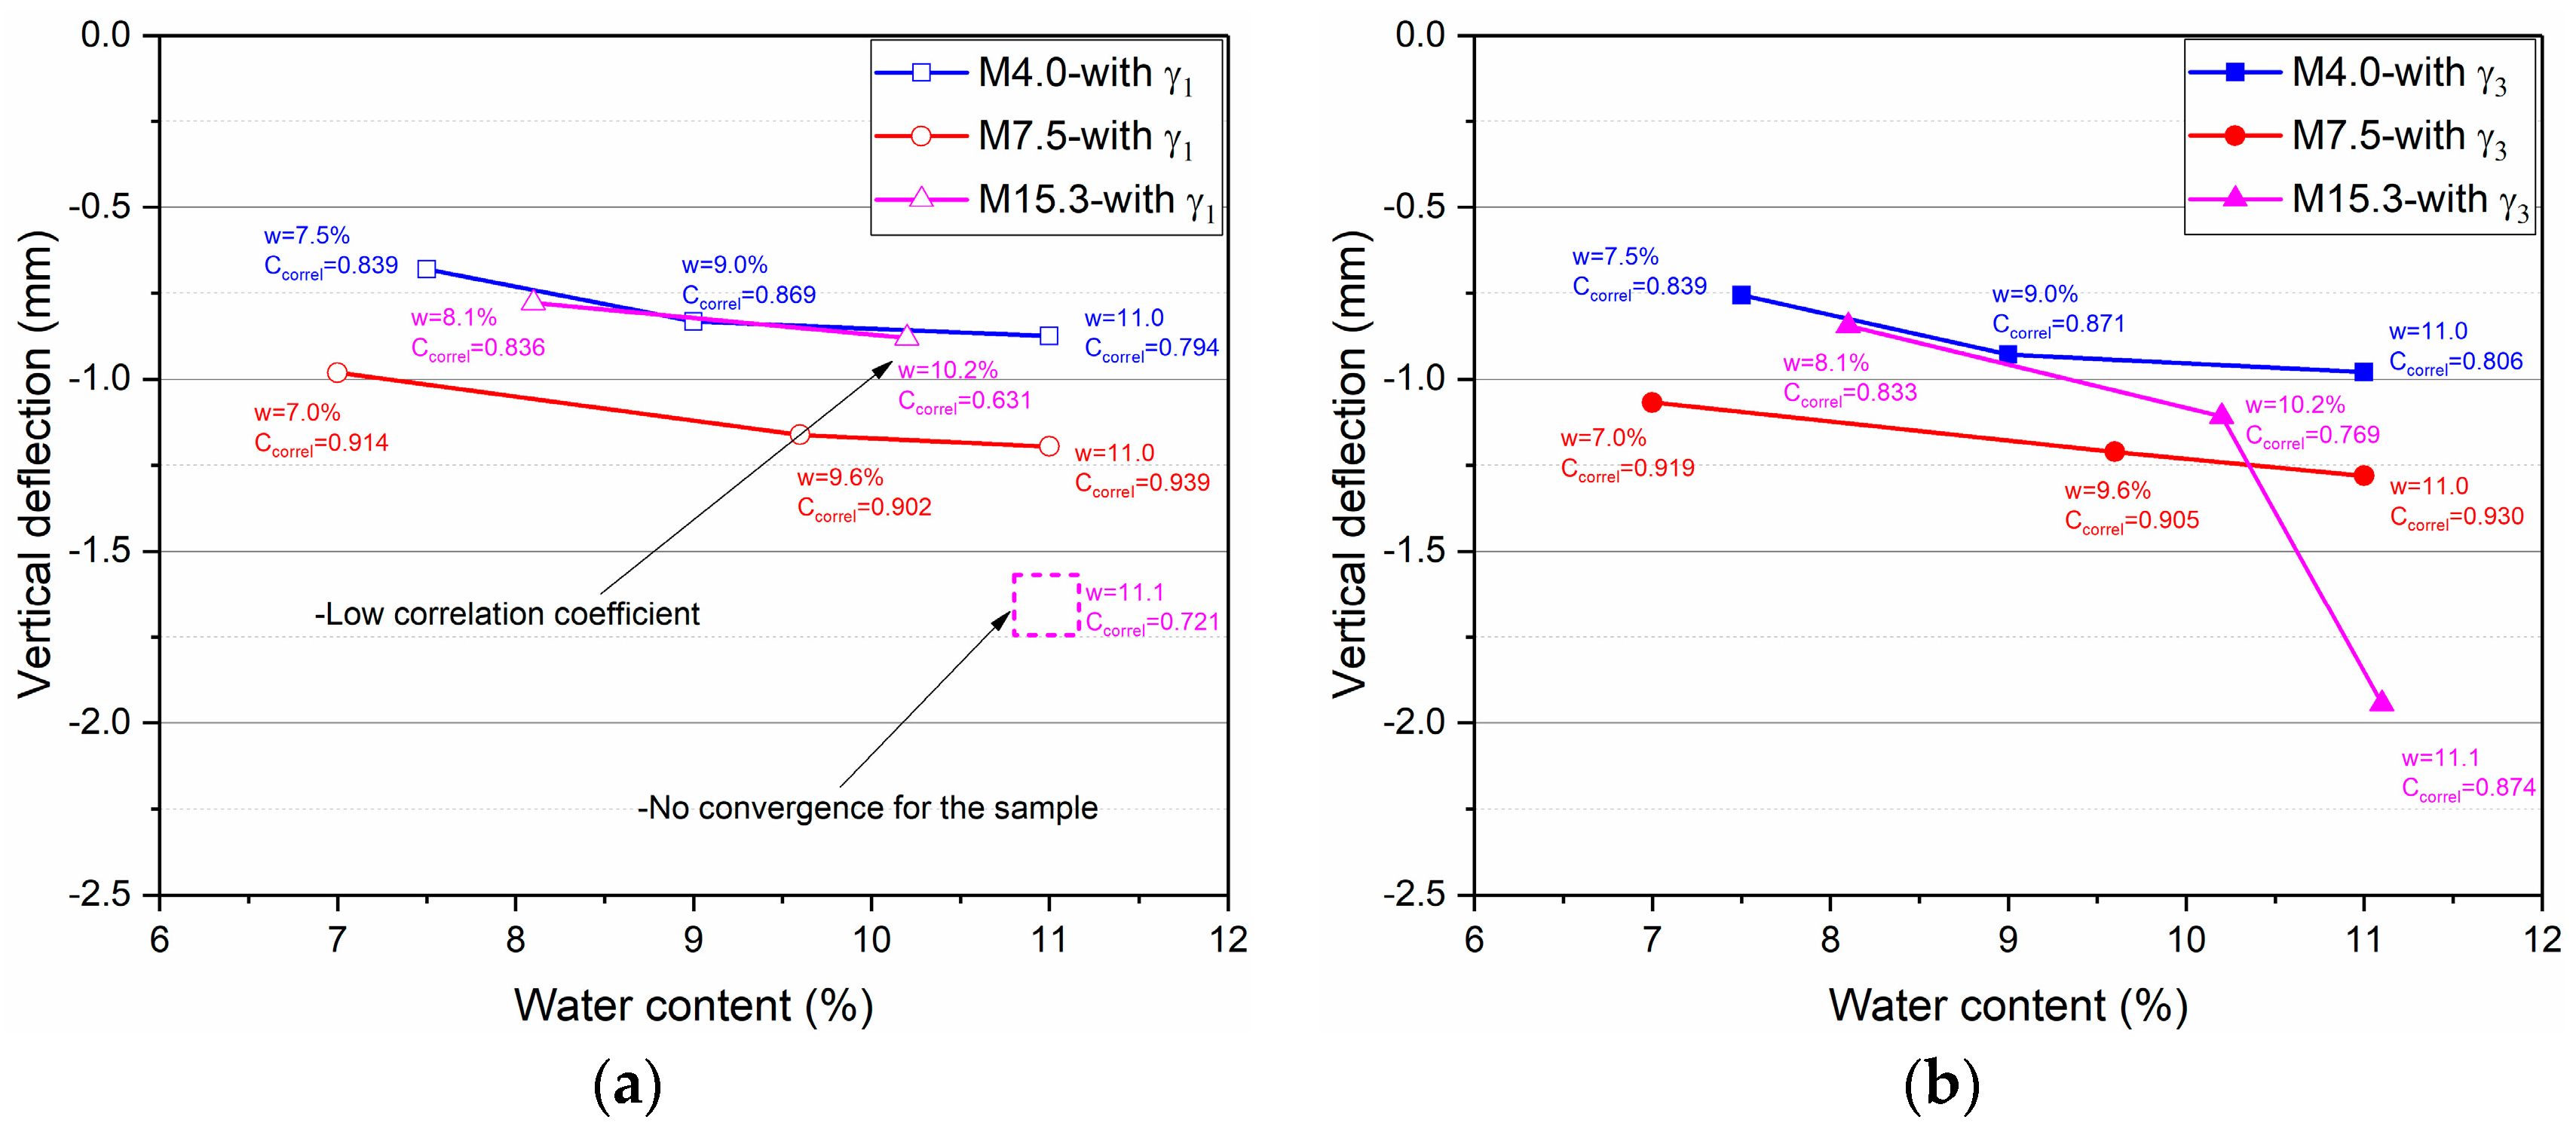
Figure 12.
Calculation of the vertical deflection at w = 11% with γ3.

Table 1.
Characteristics of the studied materials.
| Material | Dry Density (Mg/m3) | Fraction (%) | Particle Size | Blue Value | Classification | ||||||||
|---|---|---|---|---|---|---|---|---|---|---|---|---|---|
| 0/80 μm | 0.08/0.4 mm | 0.4/2 mm | 2/5 mm | d60 | d30 | d10 | Cu | Cc | |||||
| NF | USCS | ||||||||||||
| M4.0 | 2.00 | 4 | 10 | 76 | 5 | 0.95 | 0.55 | 0.30 | 3.17 | 1.06 | --- | B2 | SP |
| M7.5 | 2.00 | 7.5 | 6.5 | 76 | 5 | 1.40 | 0.60 | 0.25 | 5.60 | 1.03 | 0.56 | B2 | SP-SC |
| M15.3 | 2.00 | 15.3 | 14.7 | 55 | 10 | 0.85 | 0.40 | --- | 8.50 | 1.88 | 0.85 | B5 | SC |
Table 2.
Characteristics of the samples.
| Material | Water Content (%) | Dry Density (Mg/m3) | Cylindrical Sample | Method of Compaction | Standard |
|---|---|---|---|---|---|
| M4.0 | 7.5; 7.8; 9.0; 9.8; 11.0 | 2 ± 0.06 | 150 mm × 285 mm | Vibrating hammer | NF EN 13286-4 [31] |
| M7.5 | 7.0; 8.0; 9.6; 10.0; 11.0 | 2 ± 0.06 | 160 mm × 320 mm | Vibrocompression | NF P 98-230-1 [32] |
| M15.3 | 8.1; 8.6; 10.2; 11.0; 11.1; 11.3 | 2 ± 0.06 | 150 mm × 285 mm | Vibrating hammer | NF EN 13286-4 [31] |
Table 3.
Stress paths applied in the resilient test phase.
| Material | ∆q/∆p | ∆p (kPa) | ∆q (kPa) |
|---|---|---|---|
| M4.0; M7.5; M15.3 | 0 | 80 | 0 |
| 0.5 | 80 | 40 | |
| 1 | 80 | 80 | |
| 2 | 40 | 80 | |
| 3 | 20 | 60 |
Table 4.
Parameter optimization of the modified Boyce model for M4.0.
| w (%) | Δq/Δp | Parameters (Missillac Sand, M4.0) with γ1 and γ1* | Correl | ||||
| Ka | Ga | n | γ1 | γ1* (q/p = 0) | |||
| 7.5 | 0; 0.5; 1; 2; 3 | 17.88 | 18.95 | 0.77 | 0.51 | 0.56 | 0.839 |
| 7.8 | 0; 0.5; 1; 2; 3 | 20.01 | 27.52 | 0.56 | 0.56 | 0.58 | 0.767 |
| 9.0 | 0; 0.5; 1; 2; 3 | 16.30 | 15.48 | 0.62 | 0.42 | 0.46 | 0.869 |
| 9.8 | 0; 0.5; 1; 2; 3 | 17.87 | 16.00 | 0.74 | 0.54 | 0.60 | 0.841 |
| 11.0 | 0; 0.5; 1; 2; 3 | 16.48 | 10.60 | 0.88 | 0.46 | 0.53 | 0.794 |
| Average values | 17.71 | 17.71 | 0.72 | 0.50 | 0.55 | 0.822 | |
| w (%) | Δq/Δp | Parameters (Missillac Sand, M4.0) with γ3 and γ3* | Correl | ||||
| Ka | Ga | n | γ3 | γ3* (q/p = 0) | |||
| 7.5 | 0; 0.5; 1; 2; 3 | 51.38 | 69.74 | 0.66 | 1.91 | 1.95 | 0.839 |
| 7.8 | 0; 0.5; 1; 2; 3 | 44.87 | 64.84 | 0.59 | 1.72 | 1.83 | 0.802 |
| 9.0 | 0; 0.5; 1; 2; 3 | 58.67 | 68.92 | 0.53 | 2.38 | 2.40 | 0.871 |
| 9.8 | 0; 0.5; 1; 2; 3 | 47.46 | 52.80 | 0.63 | 1.83 | 1.93 | 0.843 |
| 11.0 | 0; 0.5; 1; 2; 3 | 59.54 | 51.77 | 0.73 | 2.14 | 2.12 | 0.806 |
| Average values | 52.38 | 61.61 | 0.63 | 2.00 | 2.05 | 0.832 | |
Table 5.
Parameter optimization of the modified Boyce model for M7.5.
| w (%) | Δq/Δp | Parameters (Missillac Sand, M7.5) with γ1 and γ1* | Correl | ||||
| Ka | Ga | n | γ1 | γ1* (q/p = 0) | |||
| 7.0 | 0; 0.5; 1; 2; 3 | 8.49 | 31.91 | 0.23 | 0.52 | 0.48 | 0.914 |
| 8.0 | 0; 0.5; 1; 2; 3 | 11.97 | 35.47 | 0.27 | 0.60 | 0.57 | 0.931 |
| 9.6 | 0; 0.5; 1; 2; 3 | 9.29 | 30.15 | 0.22 | 0.58 | 0.53 | 0.902 |
| 10.0 | 0; 0.5; 1; 2; 3 | 12.77 | 45.25 | 0.22 | 0.68 | 0.62 | 0.942 |
| 11.0 | 0; 0.5; 1; 2; 3 | 4.15 | 27.10 | 0.11 | 0.46 | 0.36 | 0.939 |
| Average values | 9.33 | 33.98 | 0.21 | 0.57 | 0.51 | 0.926 | |
| w (%) | Δq/Δp | Parameters (Missillac Sand, M7.5) with γ3 and γ3* | Correl | ||||
| Ka | Ga | n | γ3 | γ3* (q/p = 0) | |||
| 7.0 | 0; 0.5; 1; 2; 3 | 16.92 | 74.72 | 0.19 | 1.95 | 2.05 | 0.919 |
| 8.0 | 0; 0.5; 1; 2; 3 | 22.62 | 68.30 | 0.26 | 1.67 | 1.72 | 0.932 |
| 9.6 | 0; 0.5; 1; 2; 3 | 17.24 | 59.73 | 0.20 | 1.72 | 1.82 | 0.905 |
| 10.0 | 0; 0.5; 1; 2; 3 | 21.57 | 72.87 | 0.23 | 1.48 | 1.54 | 0.941 |
| 11.0 | 0; 0.5; 1; 2; 3 | 13.58 | 62.74 | 0.14 | 2.22 | 2.29 | 0.930 |
| Average values | 18.38 | 67.67 | 0.20 | 1.81 | 1.89 | 0.925 | |
Table 6.
Parameter optimization of the modified Boyce model for M15.3.
| w (%) | Δq/Δp | Parameters (Missillac Sand, M15.3) with γ1 and γ1* | Correl | ||||
| Ka | Ga | n | γ1 | γ1* (q/p = 0) | |||
| 8.1 | 0; 0.5; 1; 2; 3 | 14.46 | 22.01 | 0.74 | 0.59 | 0.64 | 0.836 |
| 8.6 | 0; 0.5; 1; 2; 3 | 15.78 | 25.78 | 0.66 | 0.61 | 0.67 | 0.838 |
| 10.2 | 0; 0.5; 1; 2; 3 | 10.90 | 13.51 | 0.99 | 0.64 | 0.53 | 0.631 |
| 11.0 | 0; 0.5; 1; 2; 3 | 11.03 | 10.13 | 0.91 | 0.54 | 0.51 | 0.645 |
| 11.1 | 0; 0.5; 1; 2; 3 | 4.90 | 2.95 | 1.00 | 0.38 | 0.30 | 0.721 |
| 11.3 | 0; 0.5; 1; 2; 3 | 7.86 | 3.03 | 1.17 | 0.45 | 0.20 | 0.606 |
| Average values | 10.82 | 12.90 | 0.91 | 0.54 | 0.48 | 0.713 | |
| w (%) | Δq/Δp | Parameters (Missillac Sand, M15.3) with γ3 and γ3* | Correl | ||||
| Ka | Ga | n | γ3 | γ3* (q/p = 0) | |||
| 8.1 | 0; 0.5; 1; 2; 3 | 34.39 | 55.37 | 0.72 | 1.66 | 1.64 | 0.833 |
| 8.6 | 0; 0.5; 1; 2; 3 | 33.31 | 64.86 | 0.59 | 1.62 | 1.65 | 0.833 |
| 10.2 | 0; 0.5; 1; 2; 3 | 21.36 | 61.19 | 0.49 | 1.42 | 2.17 | 0.769 |
| 11.0 | 0; 0.5; 1; 2; 3 | 15.06 | 69.36 | 0.19 | 1.91 | 3.05 | 0.747 |
| 11.1 | 0; 0.5; 1; 2; 3 | 24.86 | 40.10 | 0.48 | 3.21 | 4.55 | 0.874 |
| 11.3 | 0; 0.5; 1; 2; 3 | 18.30 | 48.88 | 0.28 | 2.57 | 5.29 | 0.810 |
| Average values | 24.55 | 56.63 | 0.46 | 2.07 | 3.06 | 0.811 | |
© 2017 by the authors. Licensee MDPI, Basel, Switzerland. This article is an open access article distributed under the terms and conditions of the Creative Commons Attribution (CC BY) license (http://creativecommons.org/licenses/by/4.0/).
Share and Cite
MDPI and ACS Style
Jing, P.; Nowamooz, H.; Chazallon, C. Effect of Anisotropy on the Resilient Behaviour of a Granular Material in Low Traffic Pavement. Materials 2017, 10, 1382. https://doi.org/10.3390/ma10121382
AMA Style
Jing P, Nowamooz H, Chazallon C. Effect of Anisotropy on the Resilient Behaviour of a Granular Material in Low Traffic Pavement. Materials. 2017; 10(12):1382. https://doi.org/10.3390/ma10121382
Chicago/Turabian StyleJing, Peng, Hossein Nowamooz, and Cyrille Chazallon. 2017. "Effect of Anisotropy on the Resilient Behaviour of a Granular Material in Low Traffic Pavement" Materials 10, no. 12: 1382. https://doi.org/10.3390/ma10121382
Note that from the first issue of 2016, this journal uses article numbers instead of page numbers. See further details here.