Modeling of Hydration, Compressive Strength, and Carbonation of Portland-Limestone Cement (PLC) Concrete


Abstract
:1. Introduction
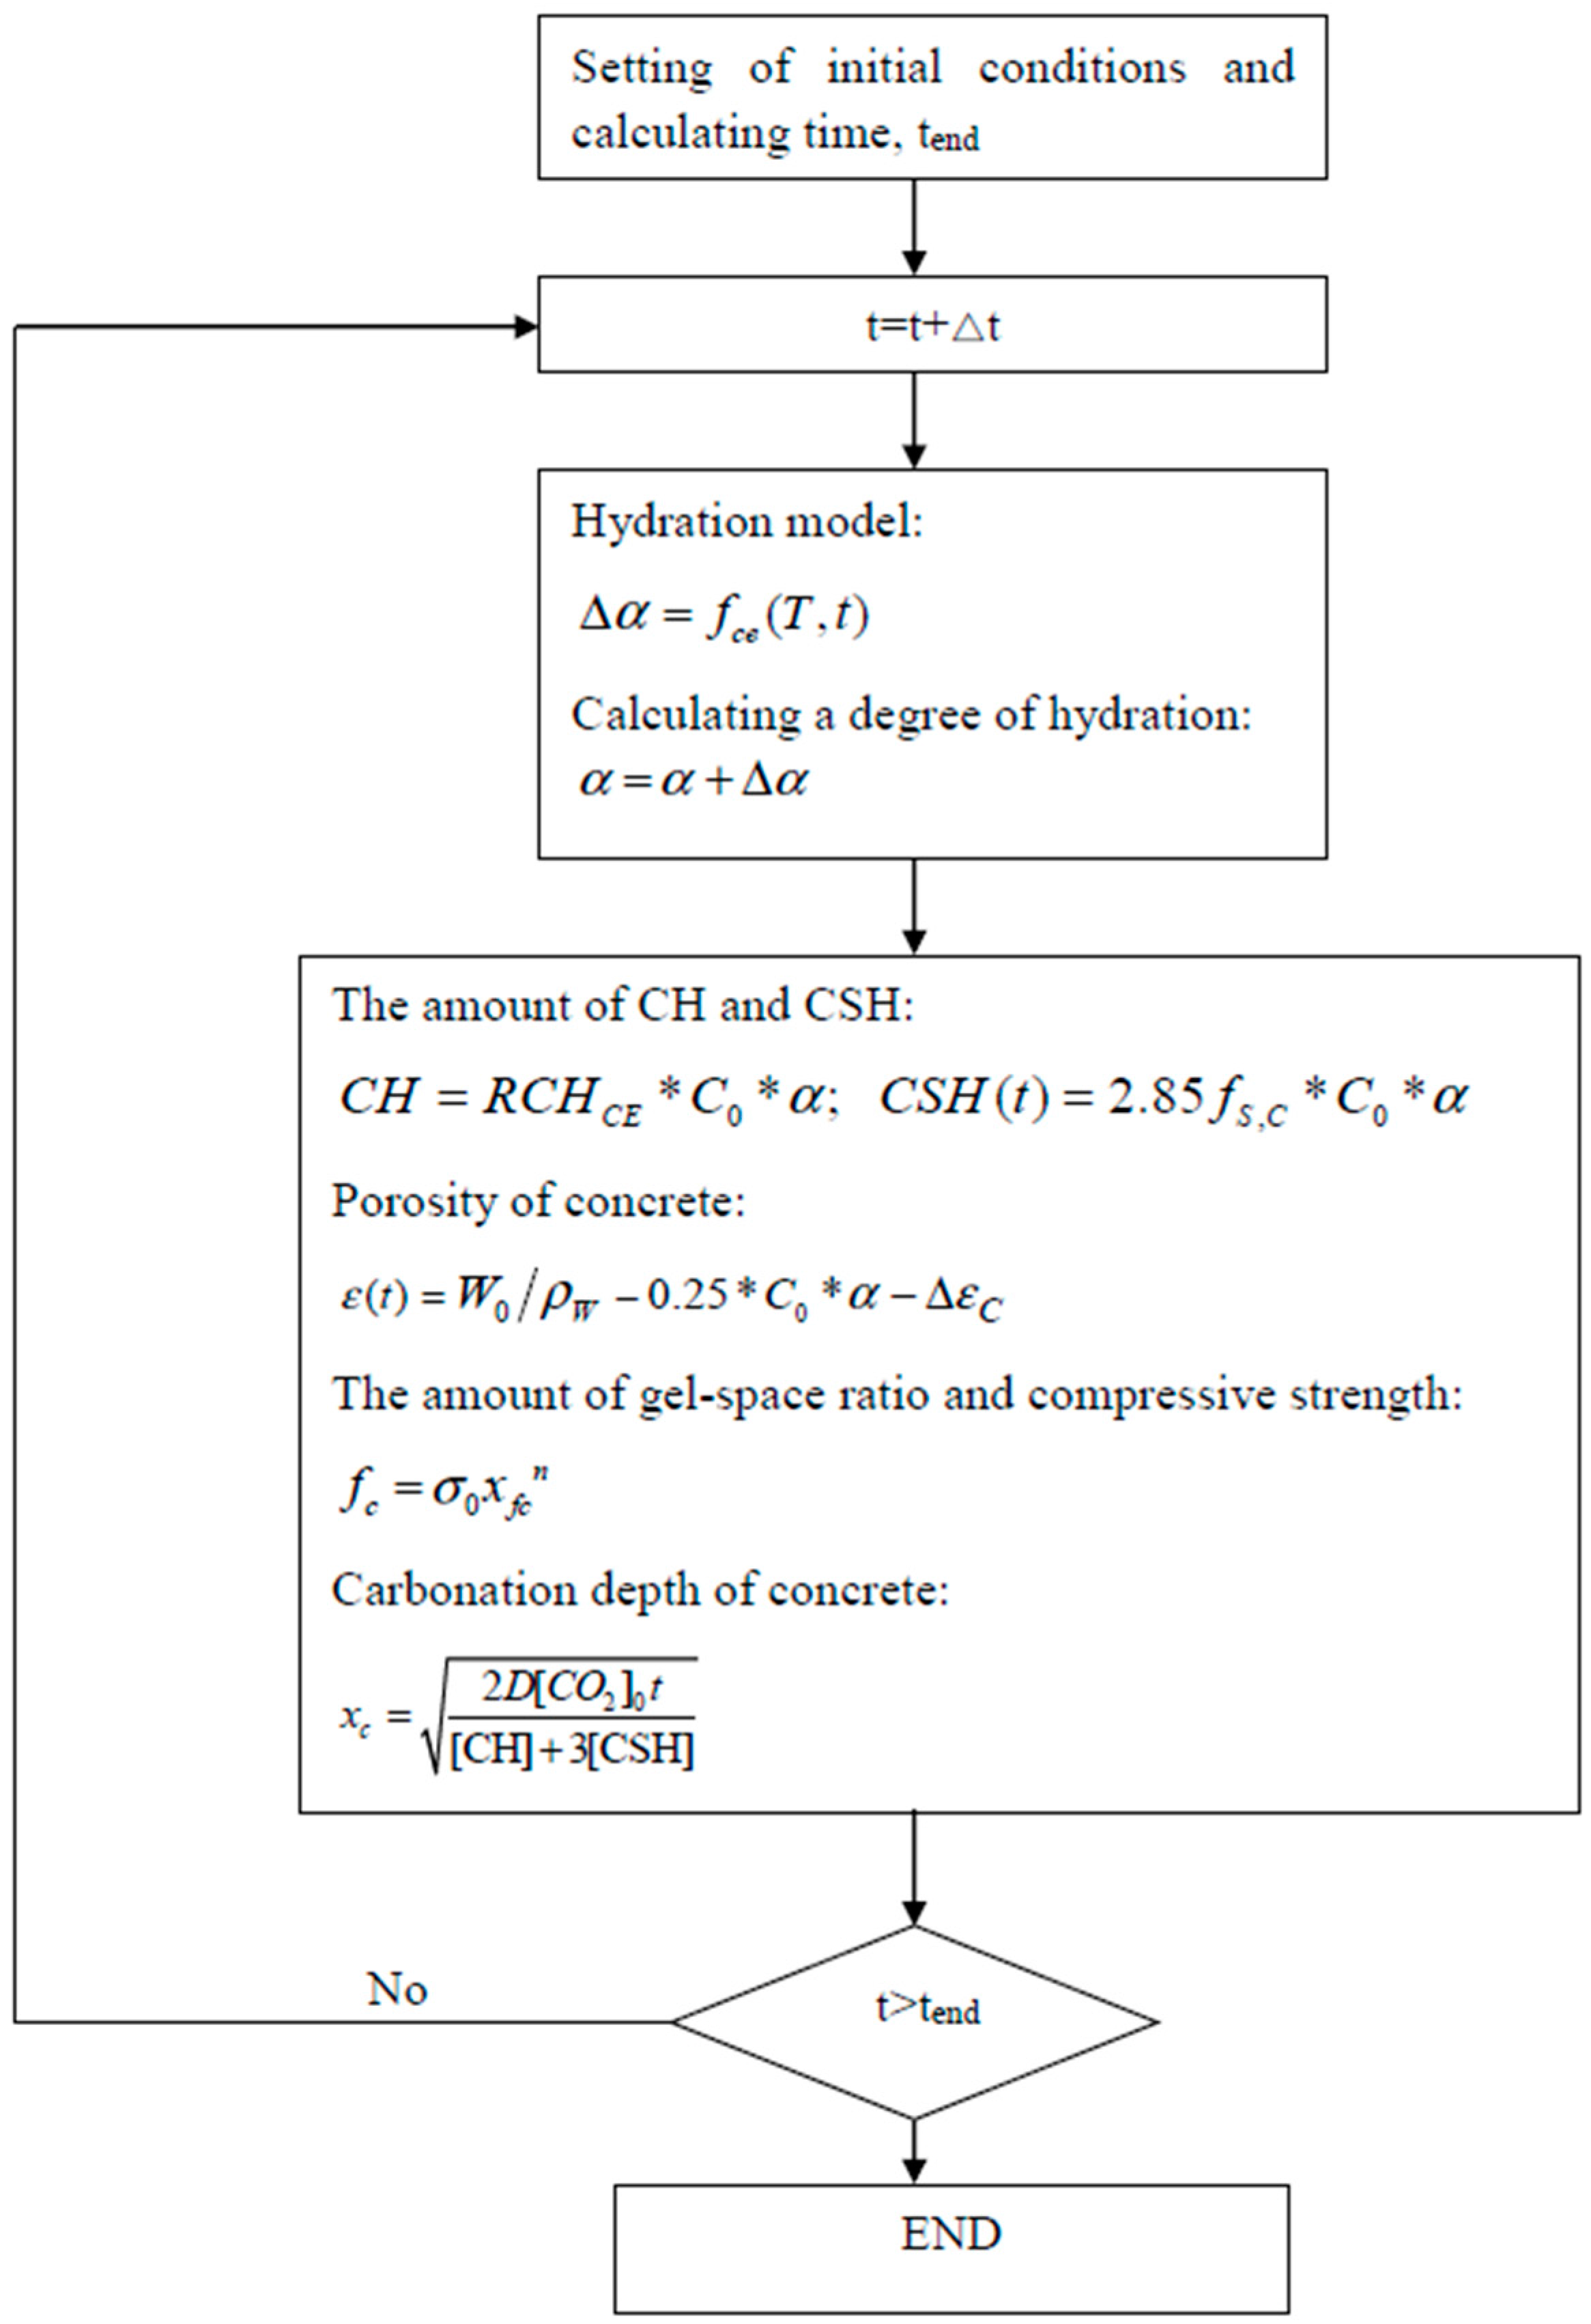
2. Hydration Model
2.1. Hydration Model for Cement
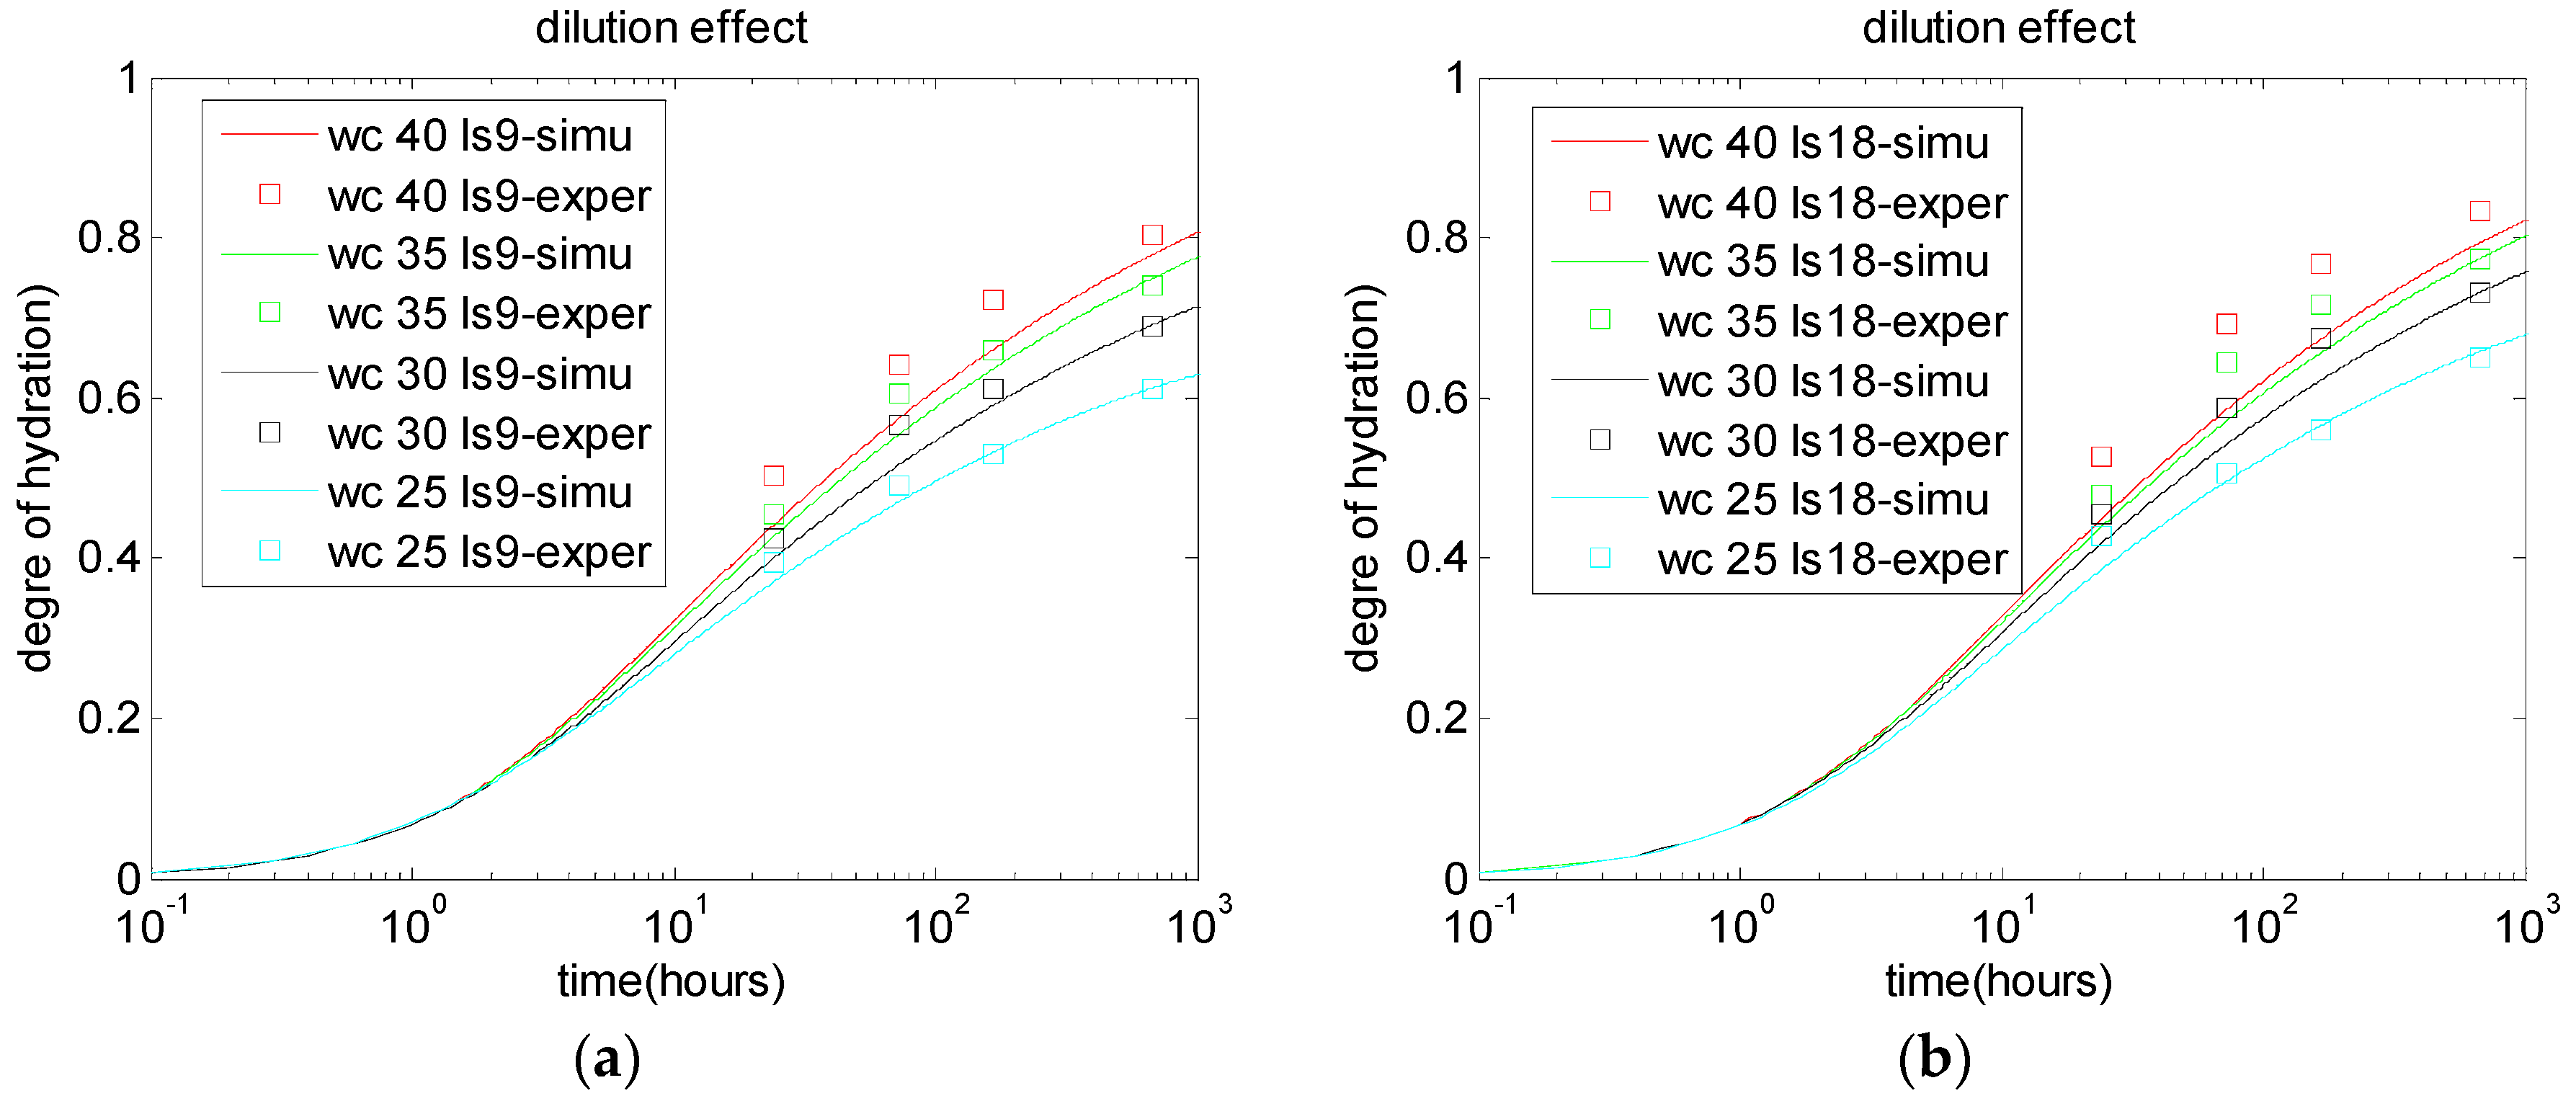
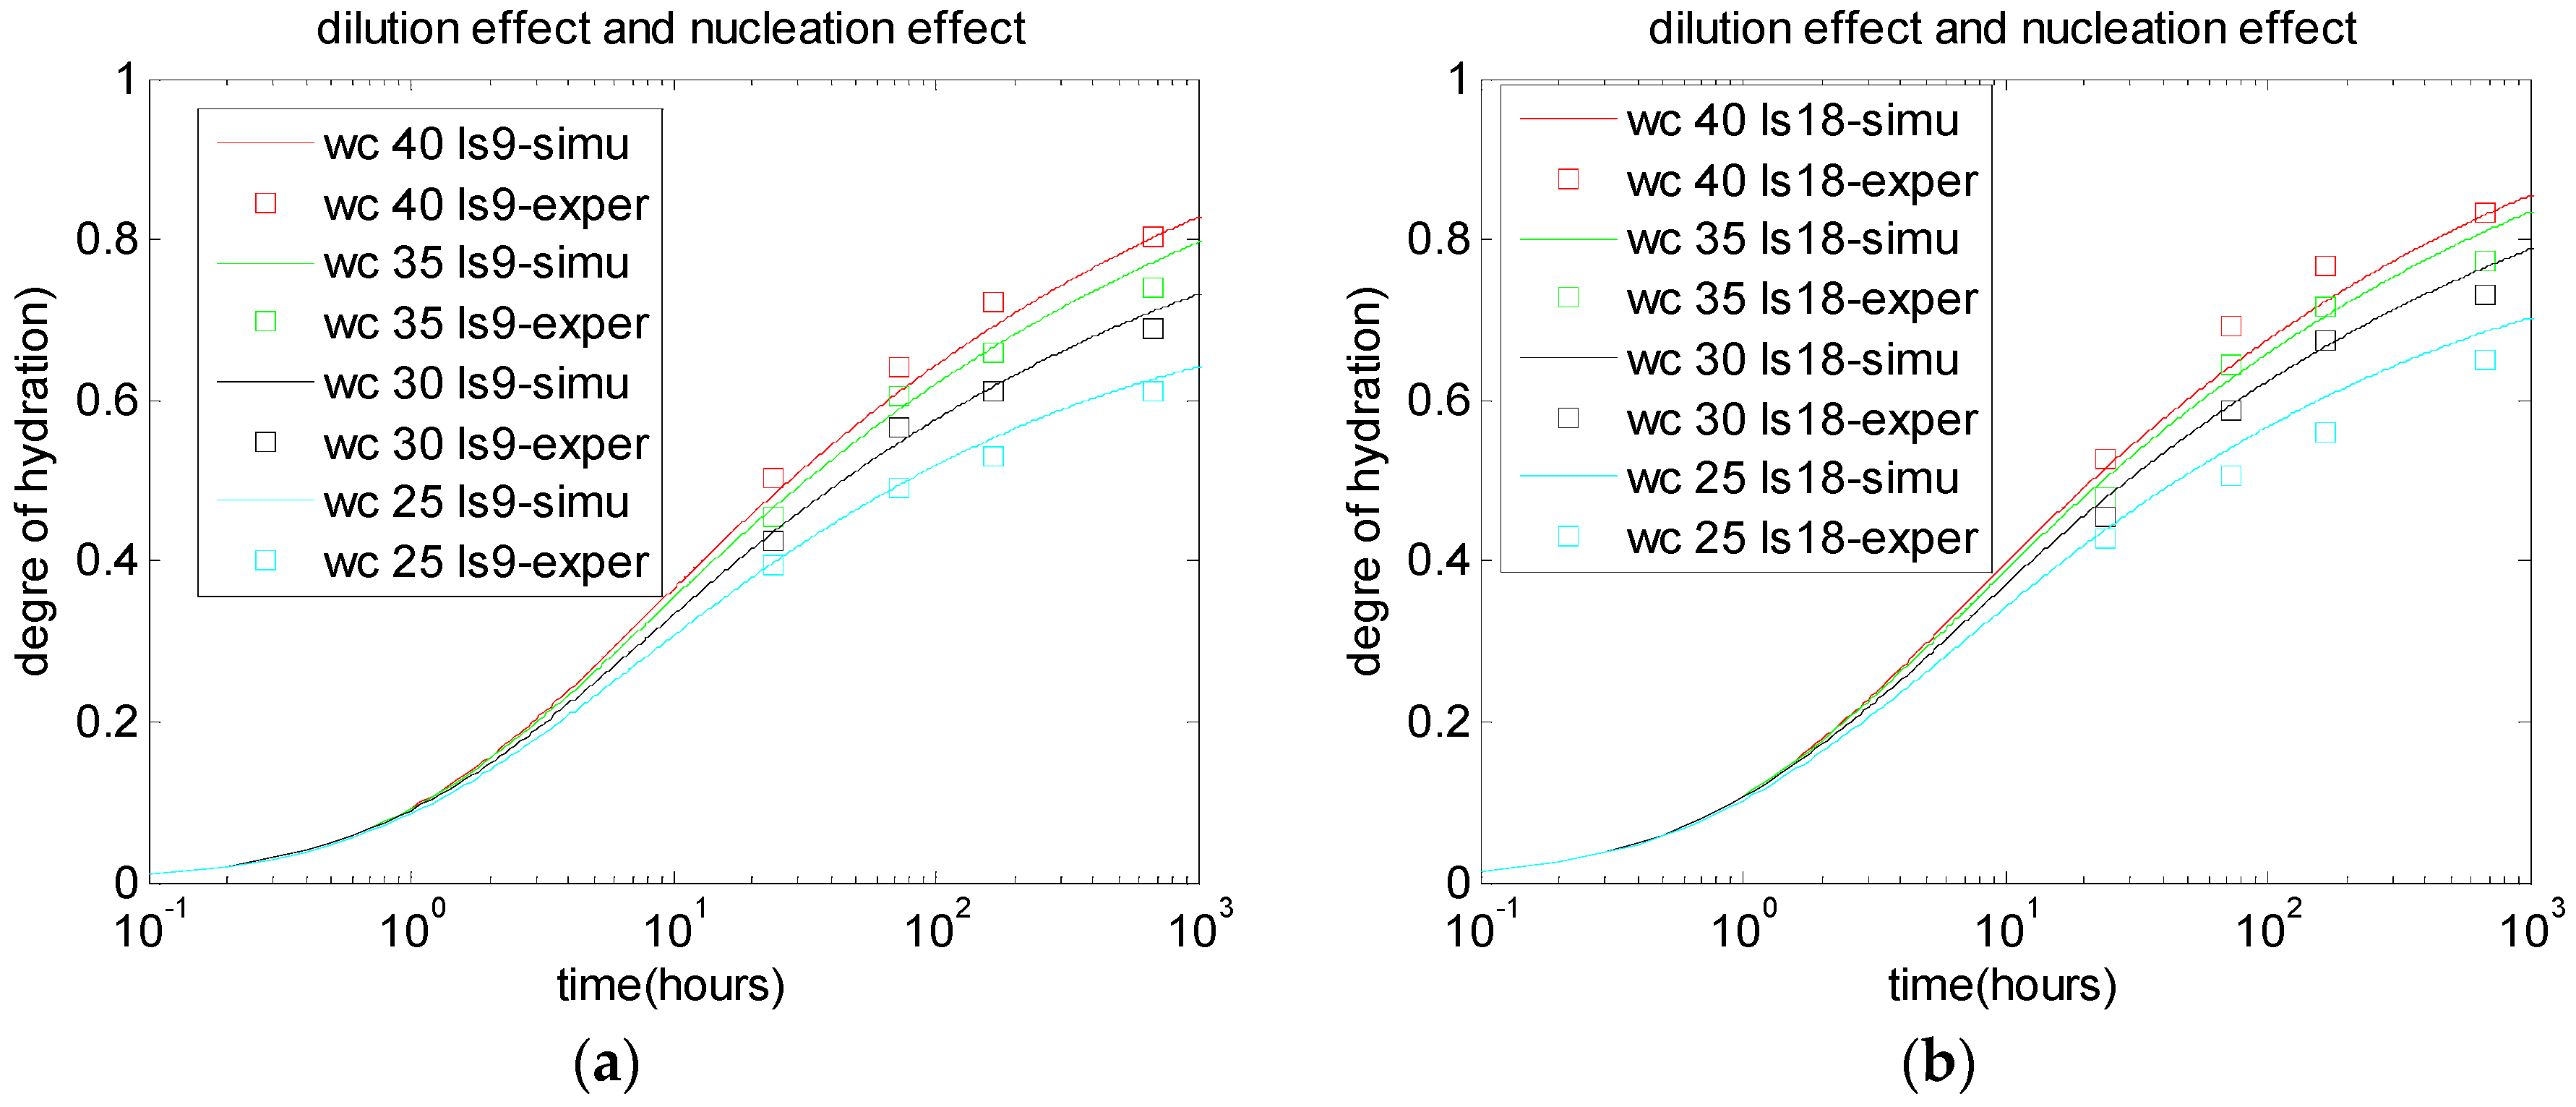
2.2. Dilution Effect, Nucleation Effect, and Chemical Effect of Limestone Particles
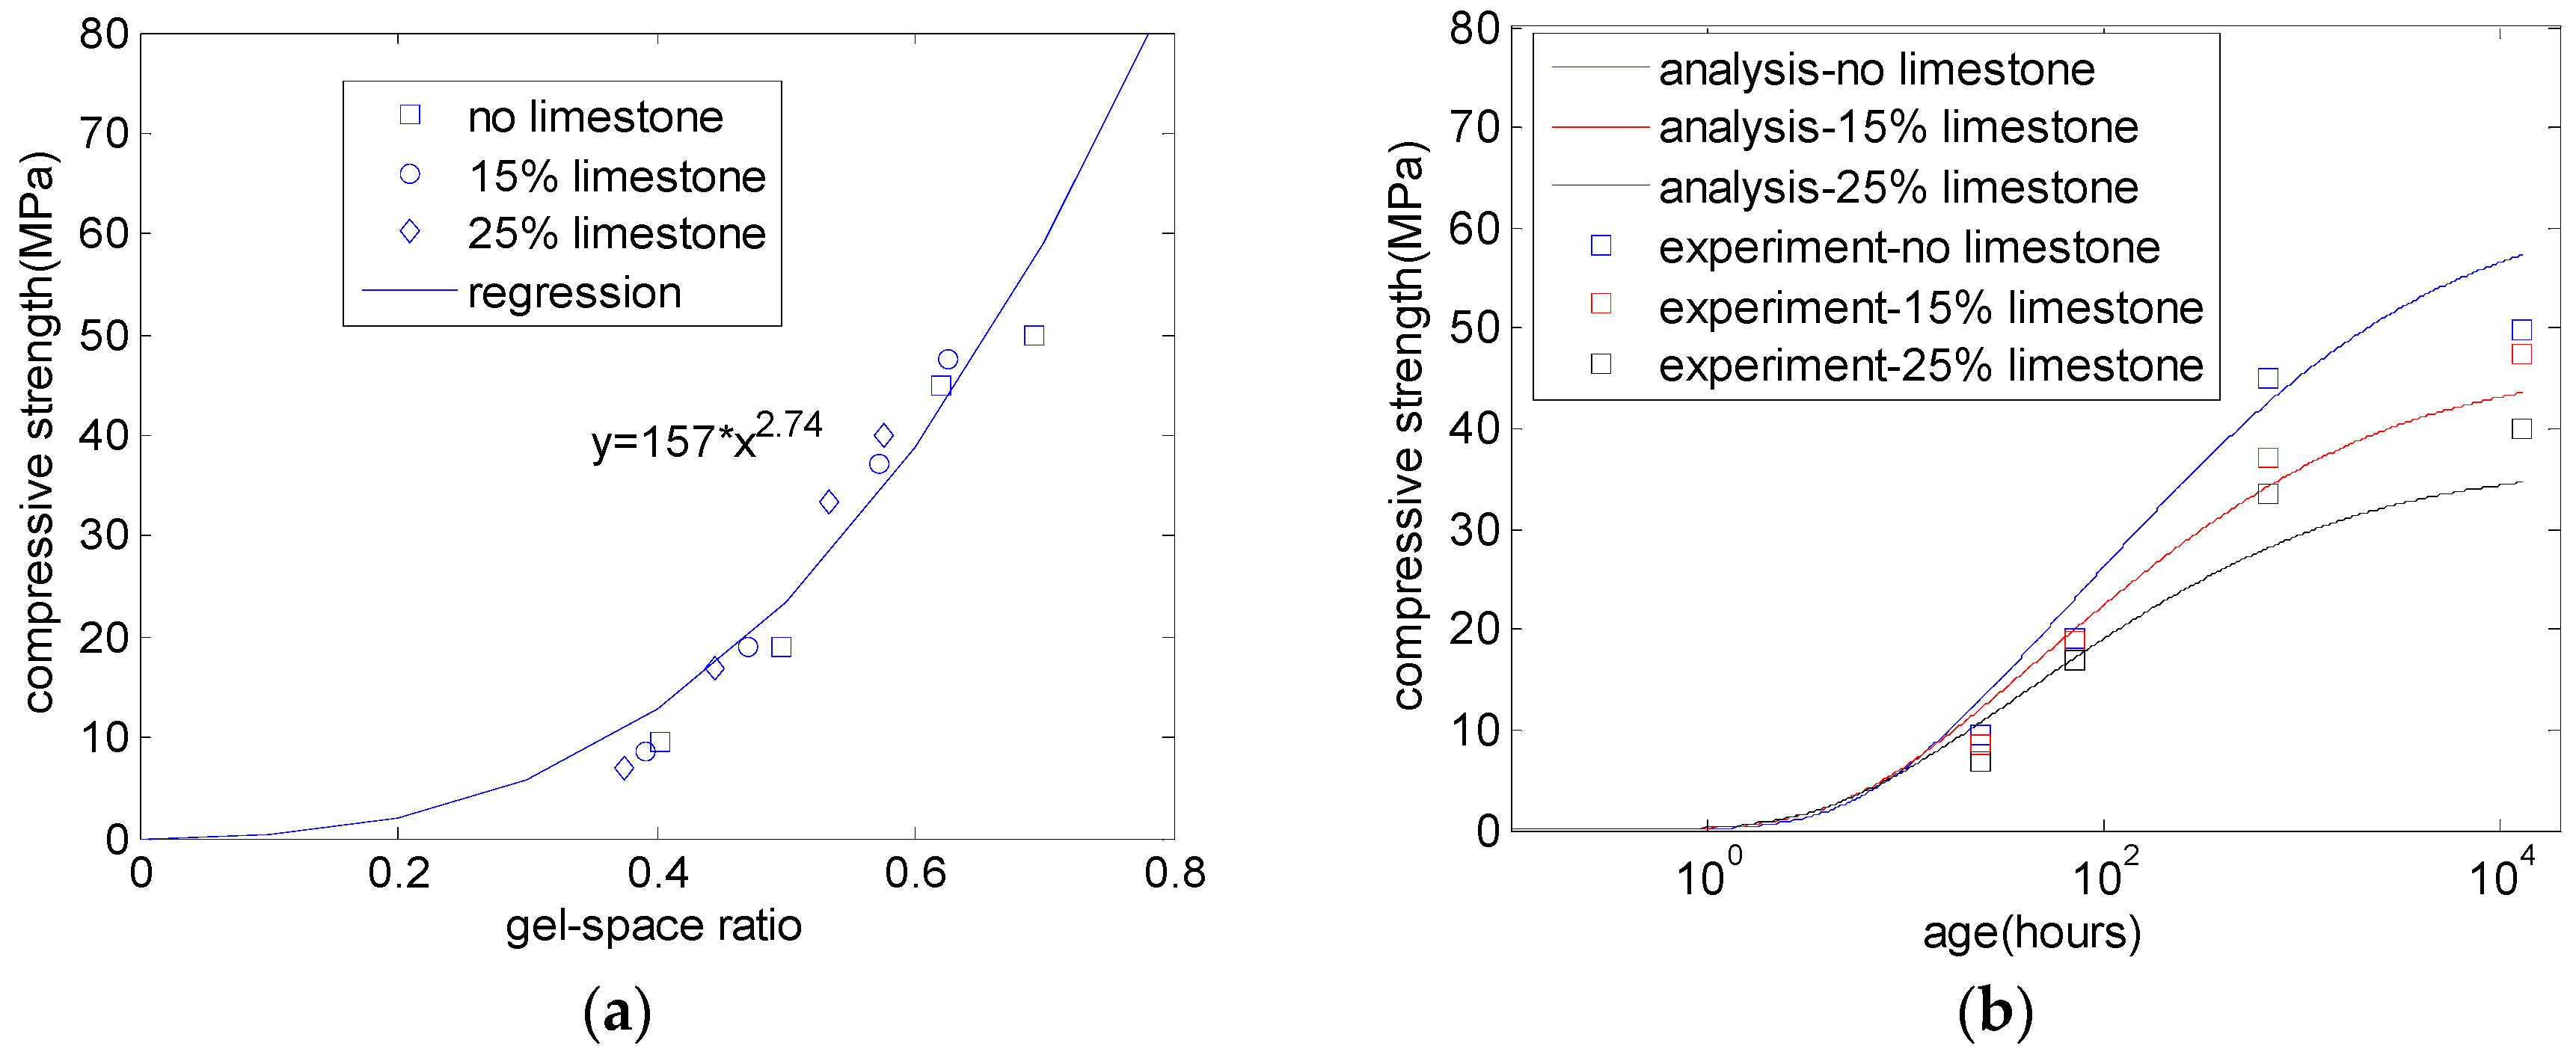
3. Gel–Space Ratio and Compressive Strength
4. Carbonation Model of Concrete
5. Verification of the Proposed Model
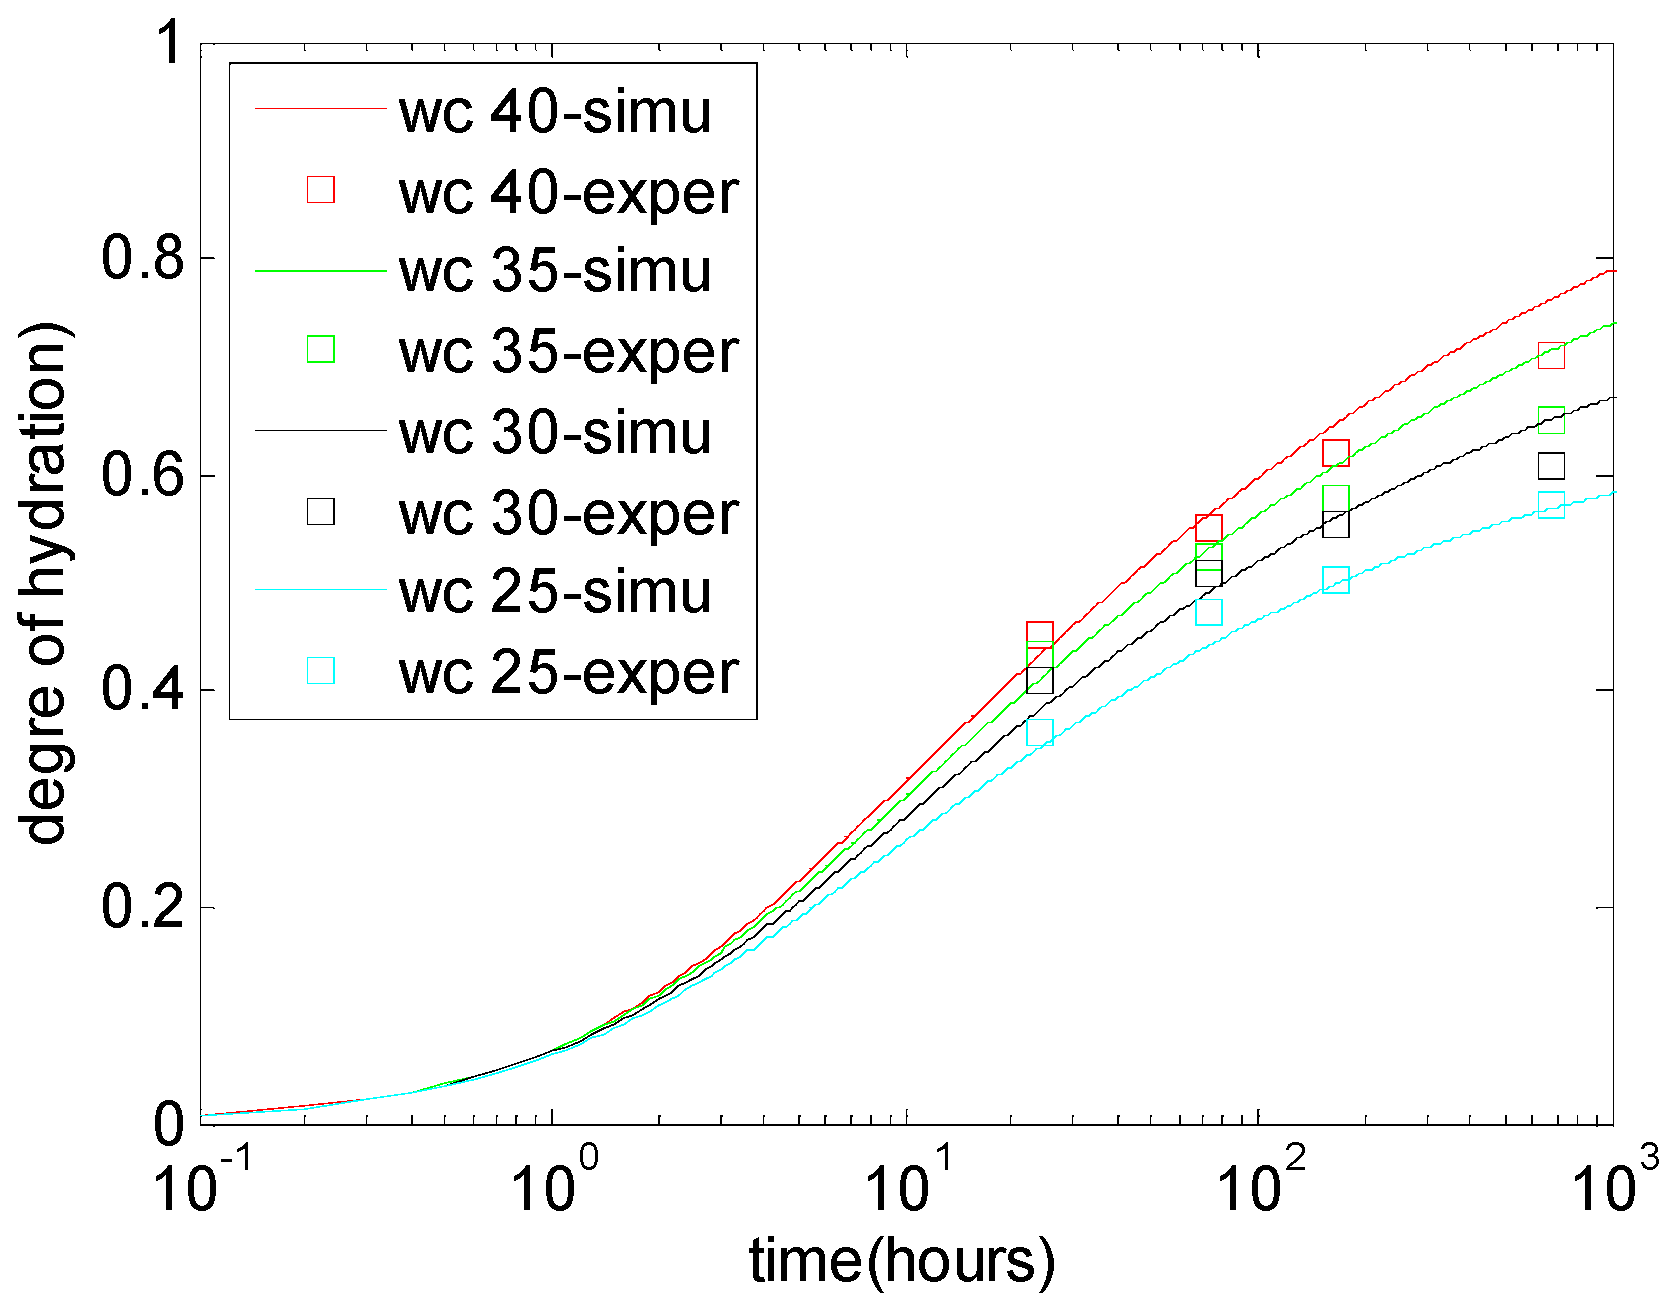
5.1. Degree of Cement Hydration in Cement-Limestone Blends
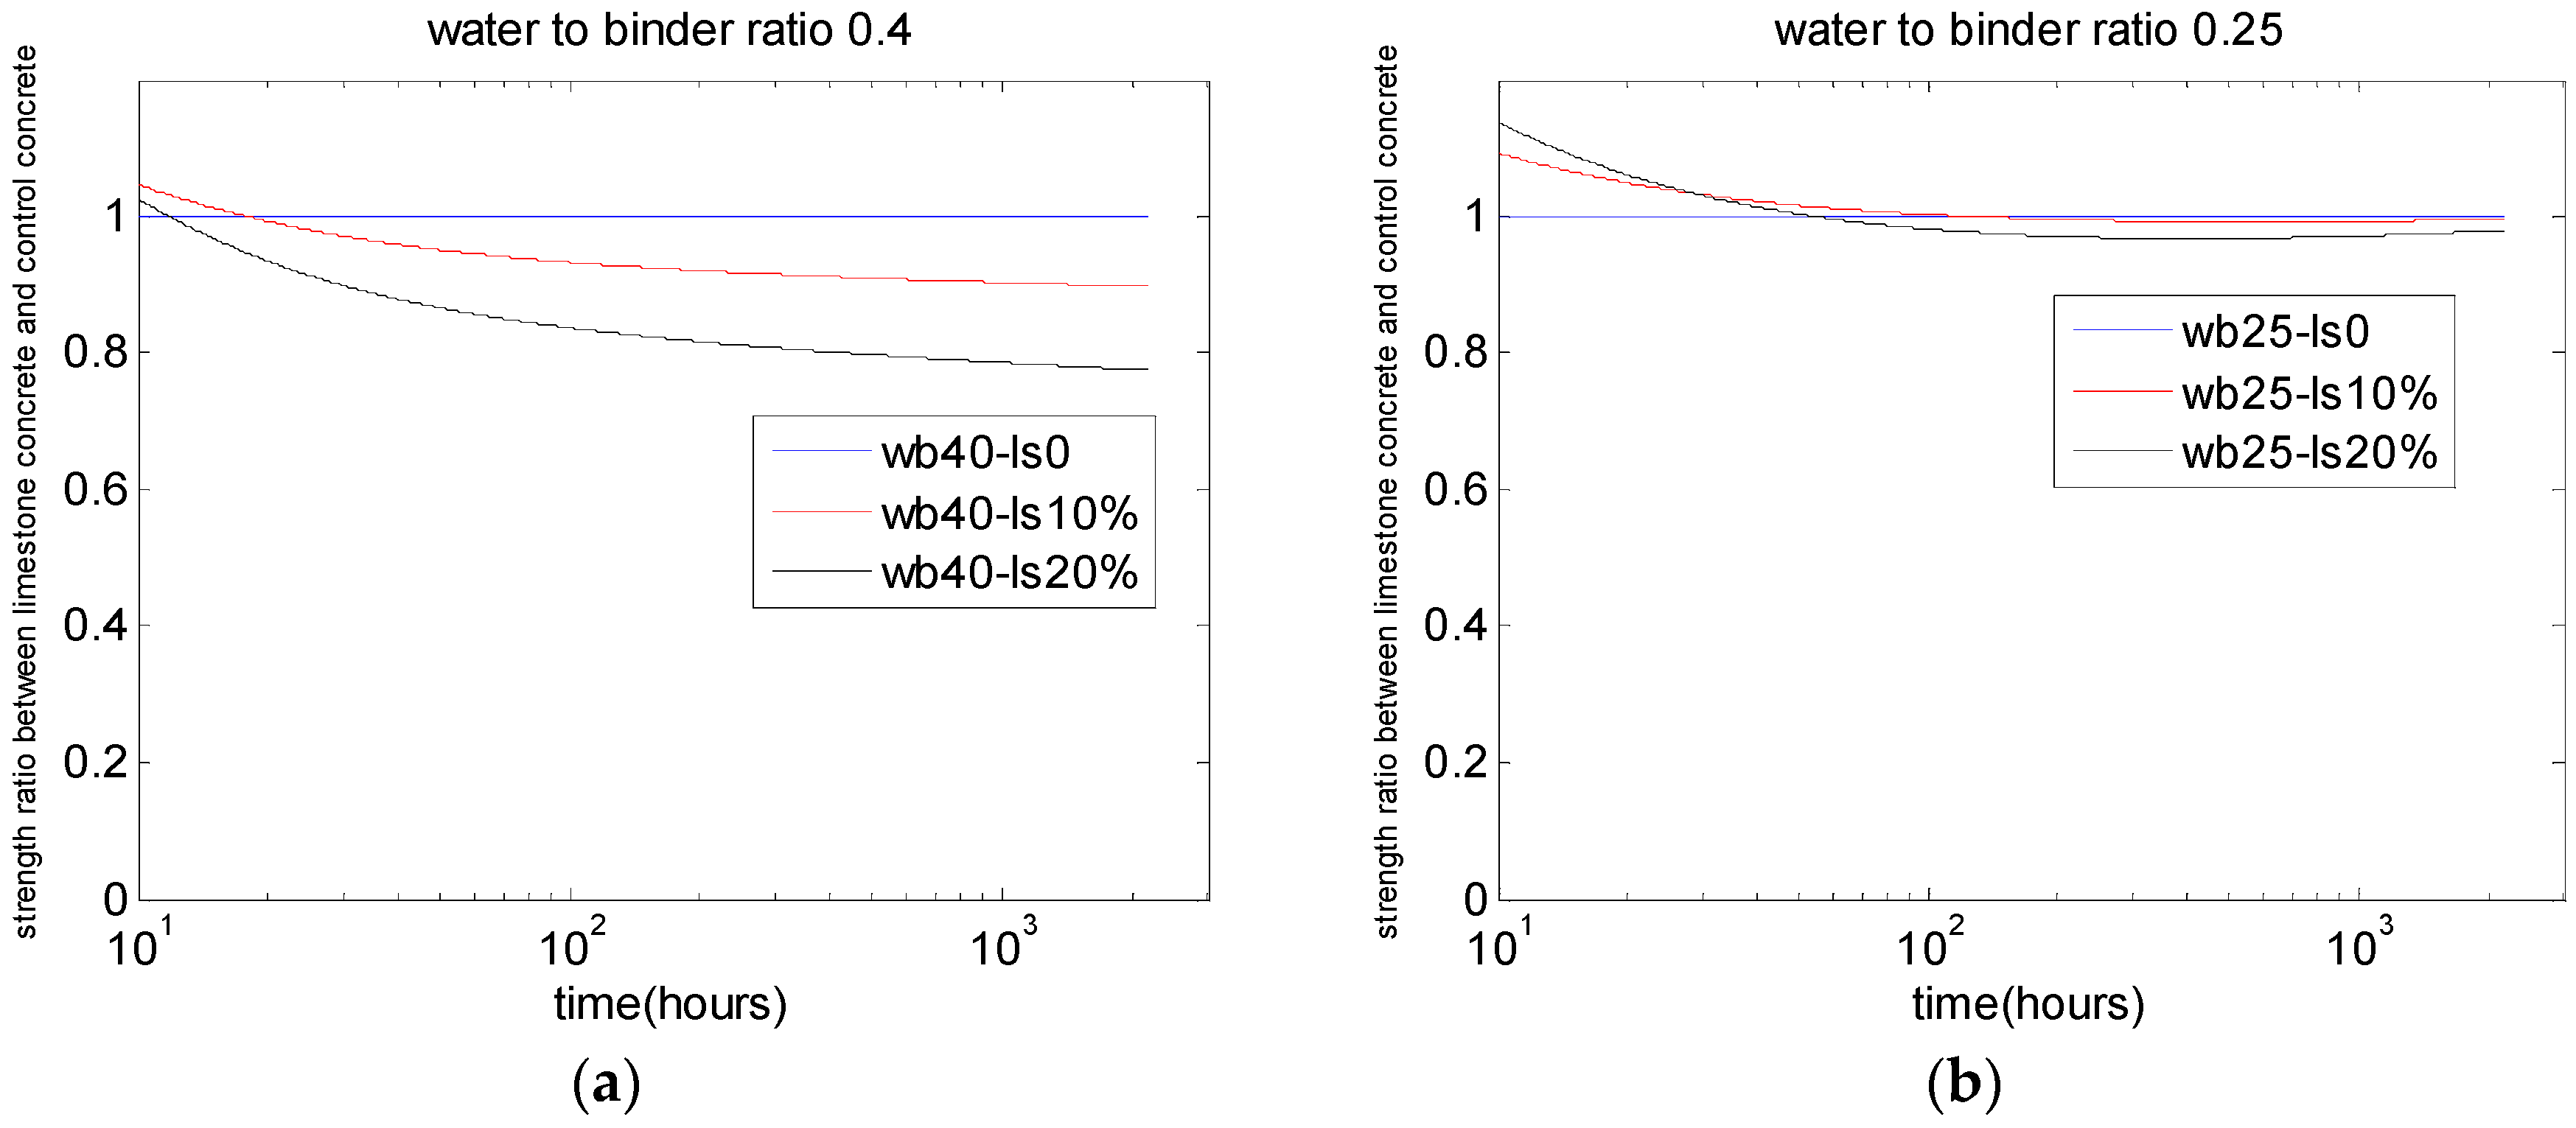
5.2. Compressive Strength of Concrete
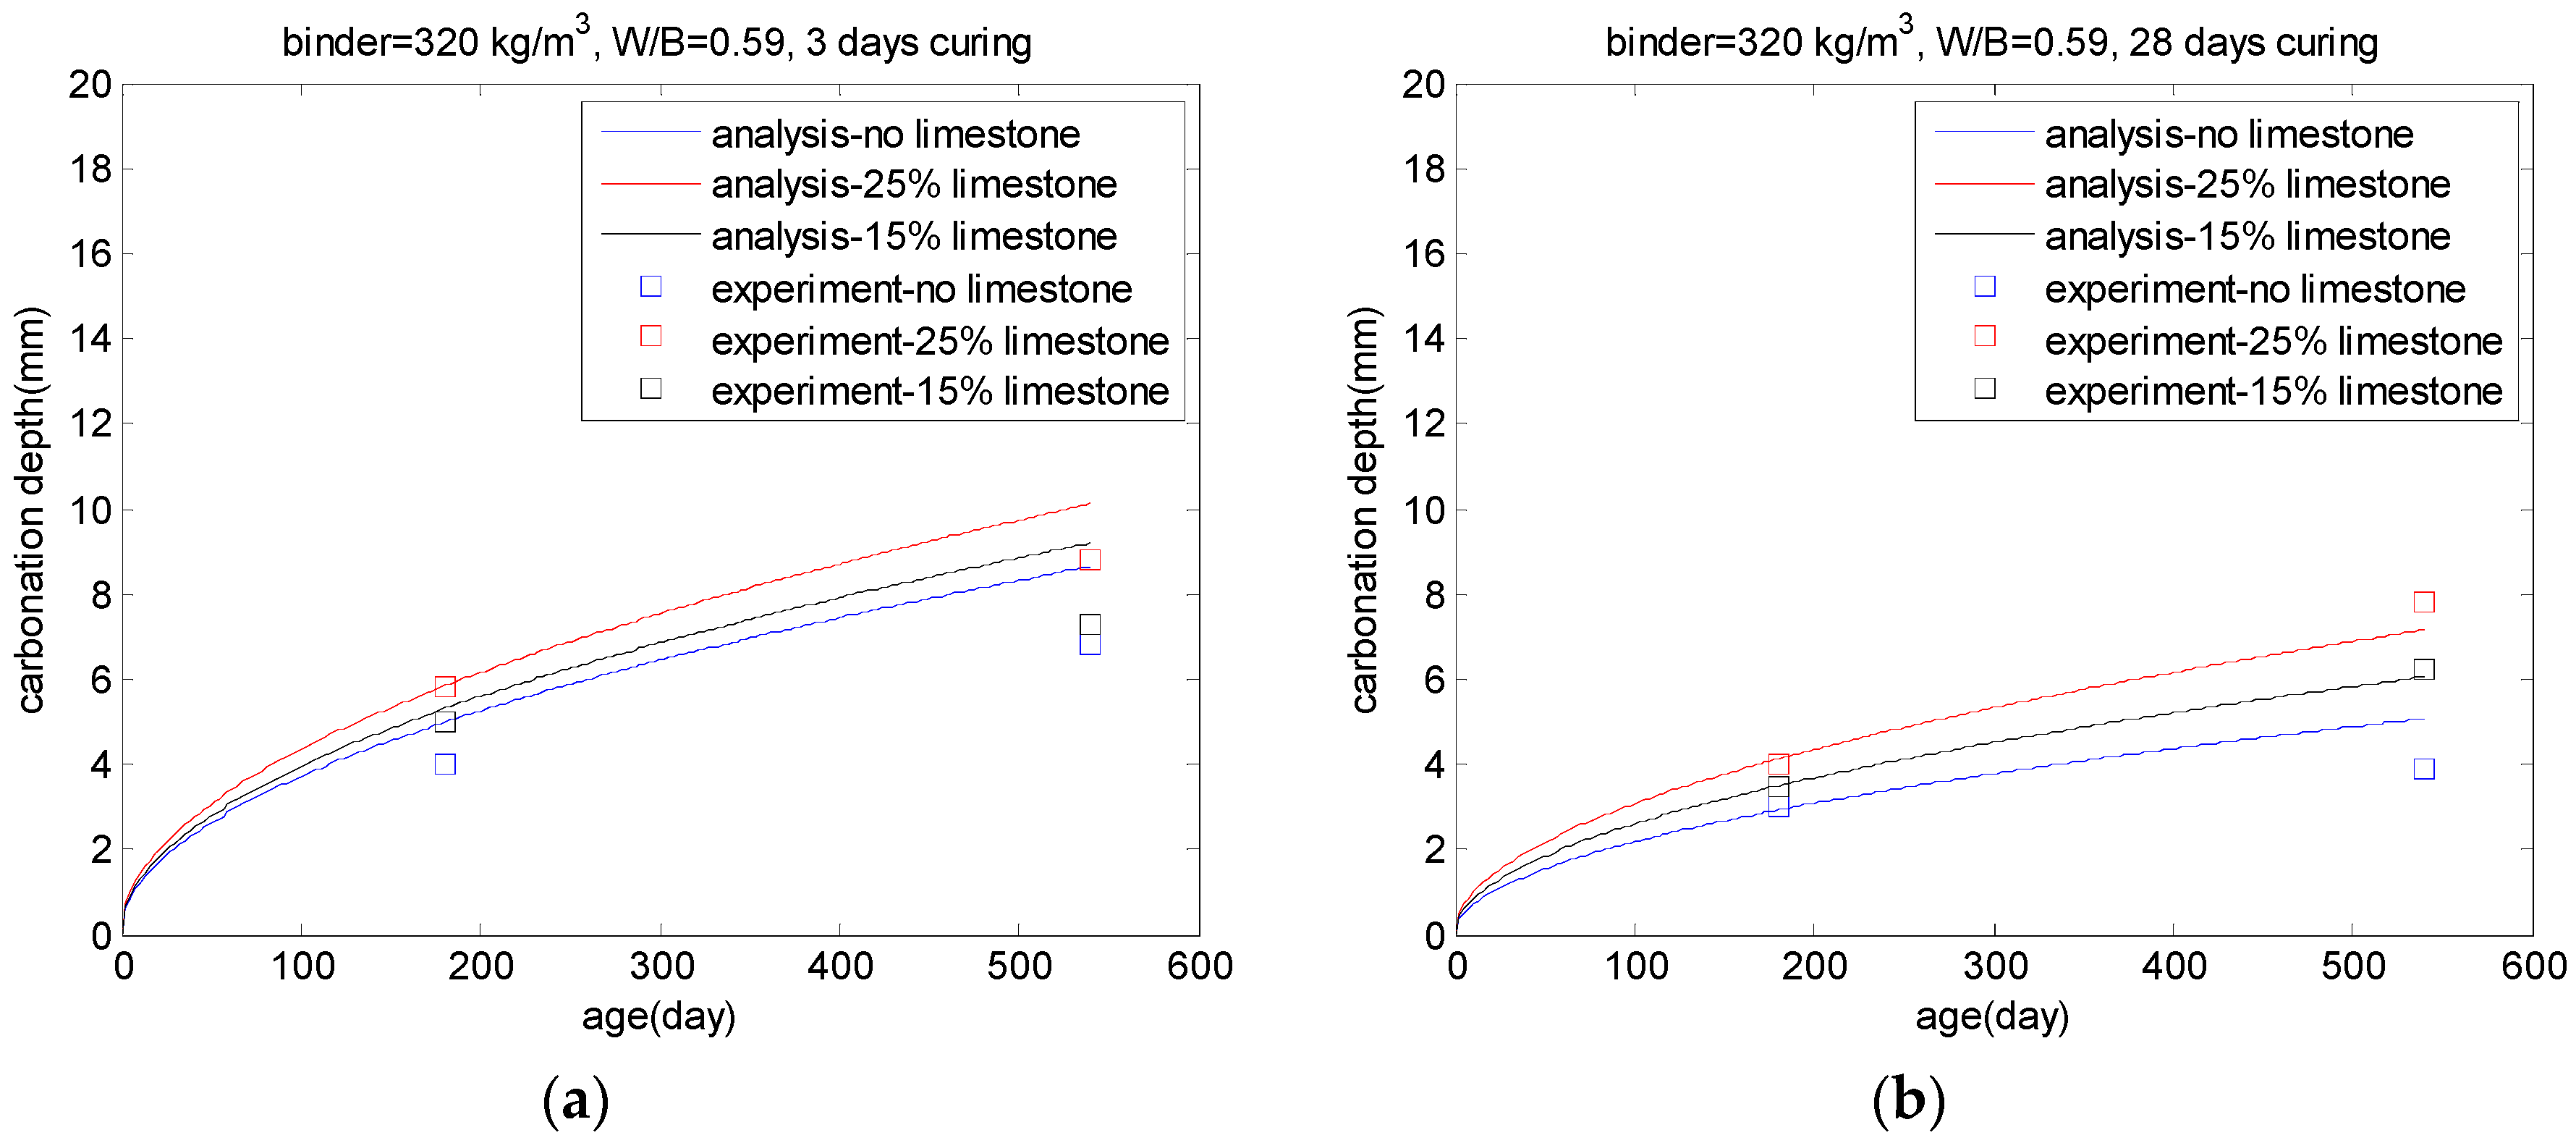
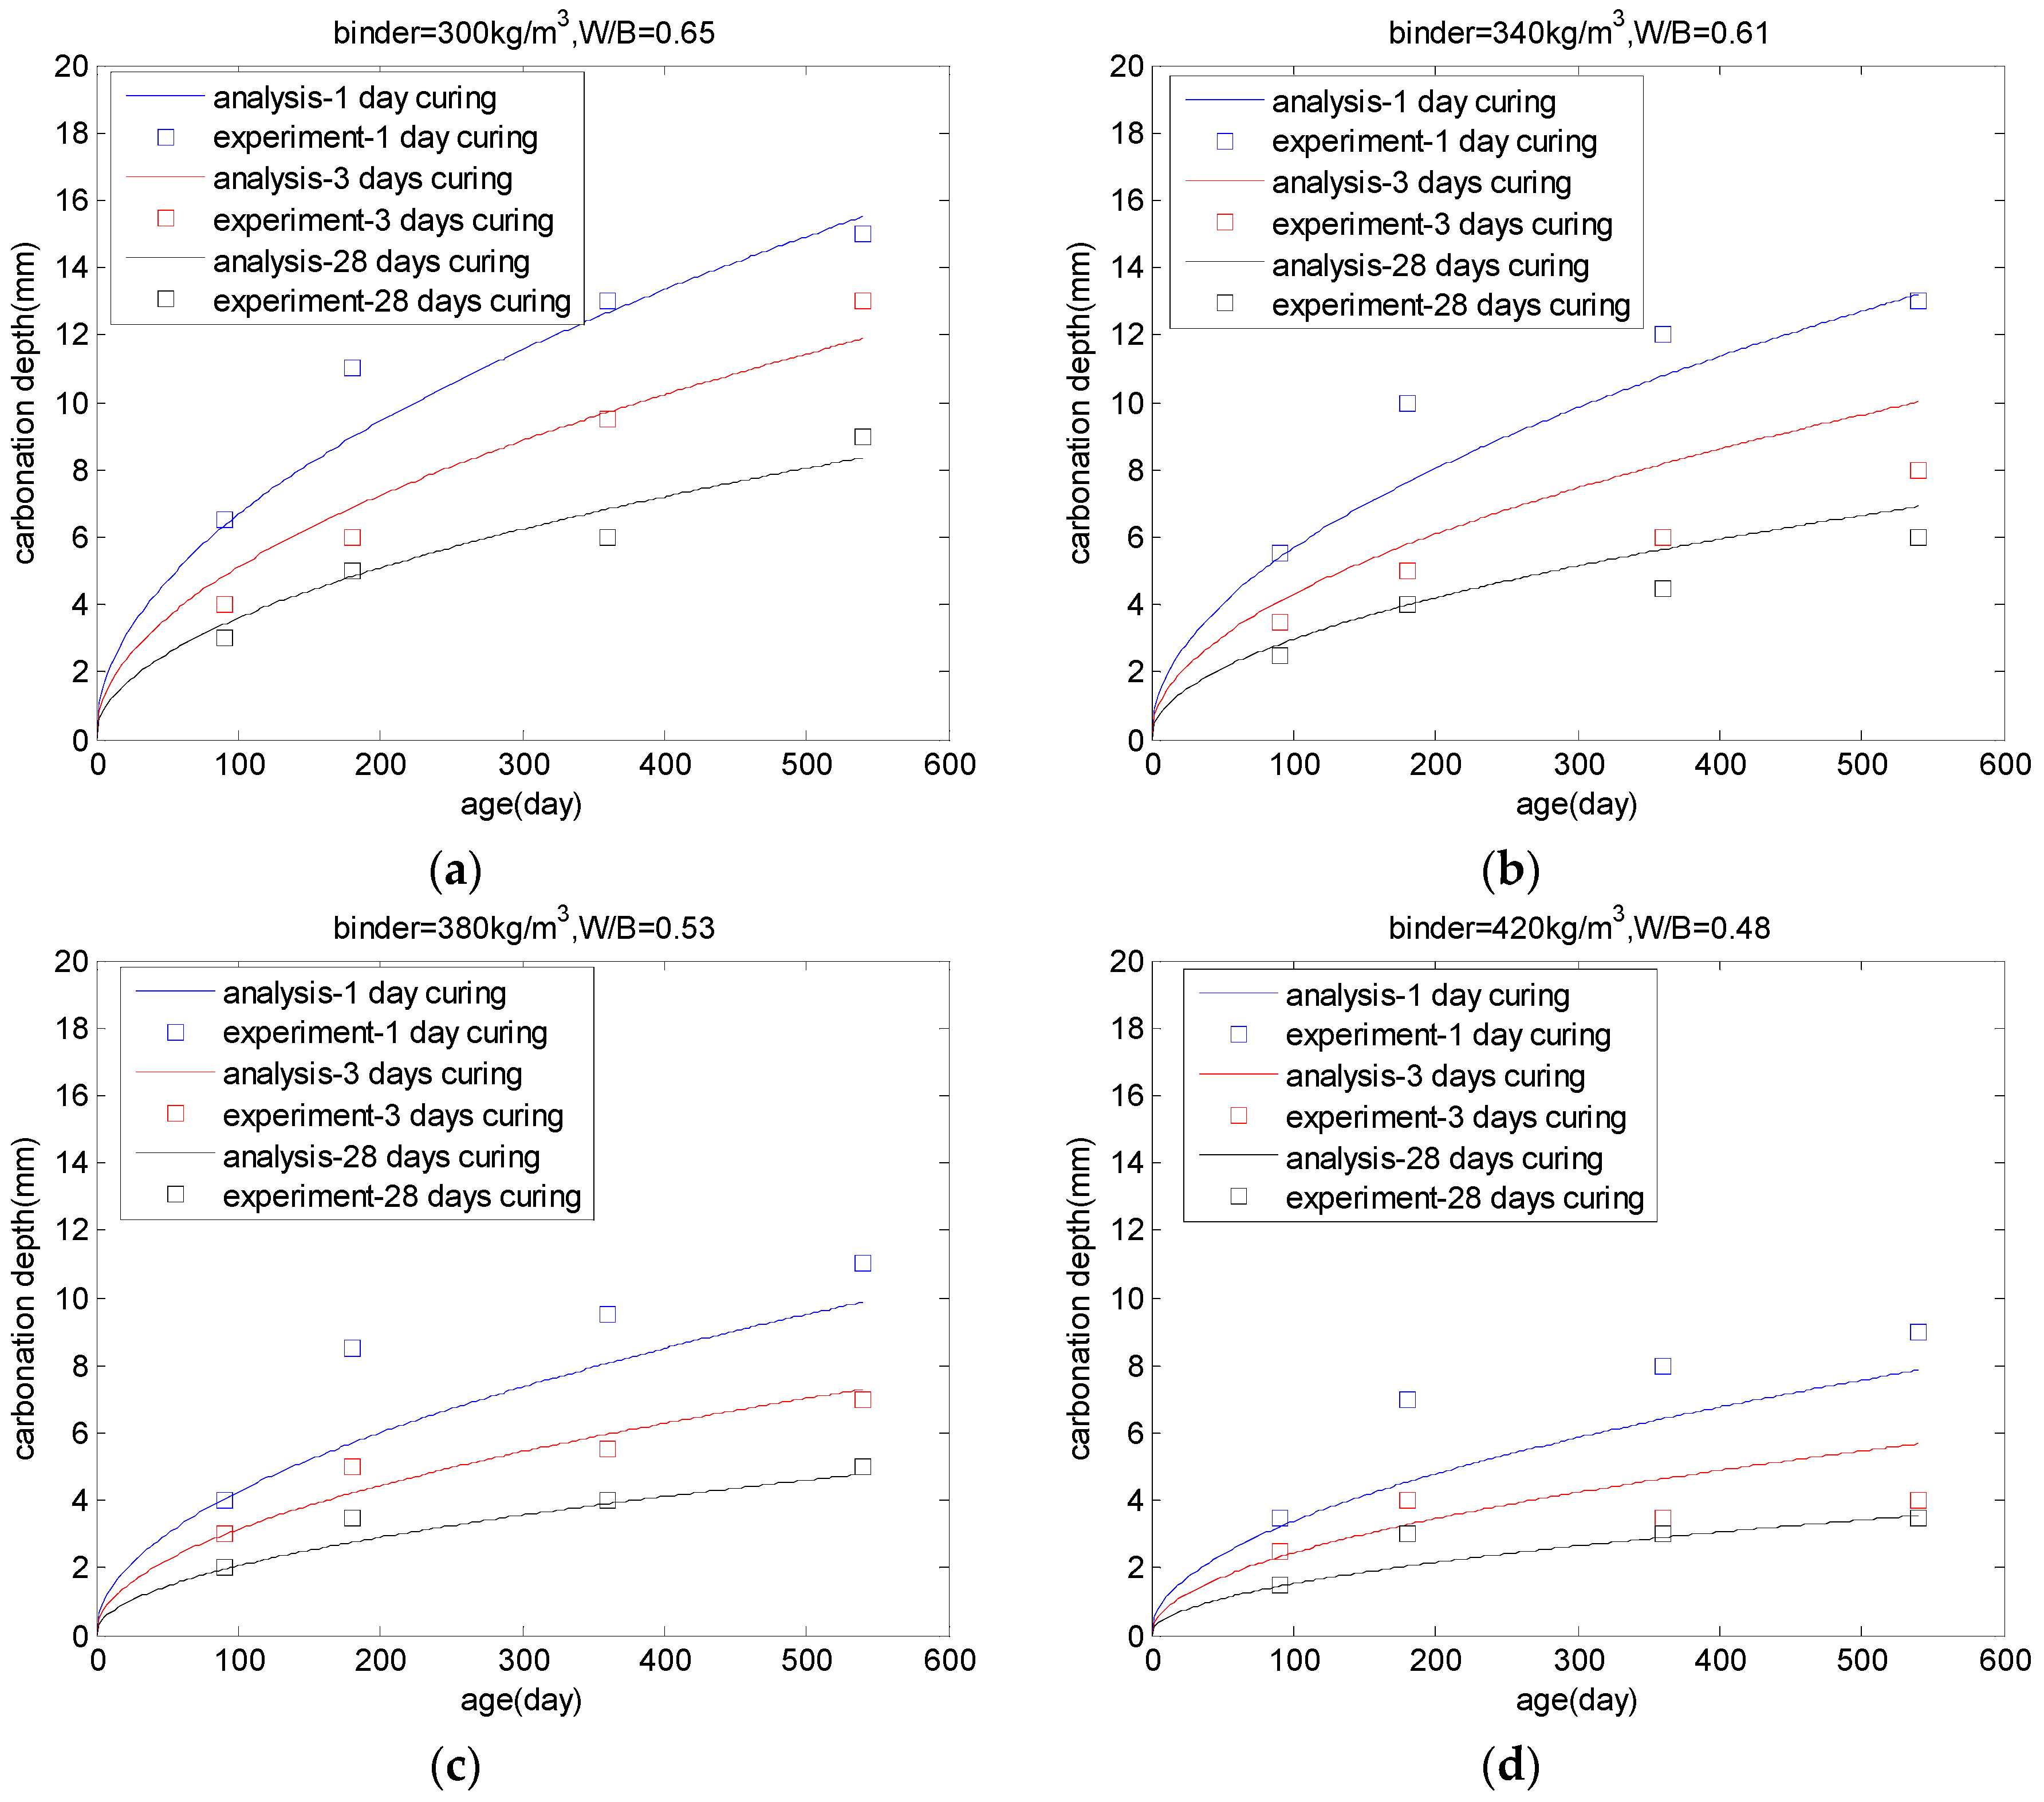
5.3. Carbonation of PLC Concrete
6. Conclusions
Acknowledgments
Conflicts of Interest
References
- Tennis, P.D.; Thomas, M.D.A.; Weiss, W.J. State-of-the-Art Report on Use of Limestone in Cements at Levels of Up to 15%; Portland Cement Association: Skokie, IL, USA, 2011. [Google Scholar]
- Hooton, R.D.; Nokken, M.; Thomas, M.D.A. Portland-Limestone Cement: State-of-the-Art Report and Gap Analysis for CSA A 3000; University of Toronto: Toronto, ON, Canada, 2007. [Google Scholar]
- Bonavetti, V.; Donza, H.; Menendez, G.; Cabrera, O.; Irassar, E.F. Limestone filler cement in low w/c concrete: A rational use of energy. Cem. Concr. Res. 2003, 33, 865–871. [Google Scholar] [CrossRef]
- Elgalhud, A.A.; Dhir, R.K.; Ghataora, G. Limestone addition effects on concrete porosity. Cem. Concr. Compos. 2016, 72, 222–234. [Google Scholar] [CrossRef]
- Bentz, D.P.; Irassar, E.F.; Bucher, B.E.; Wesis, W.J. Limestone fillers conserve cement, Part 1: An analysis based on Powers’ model. Concr. Int. 2009, 31, 41–46. [Google Scholar]
- Parrott, L.J. Some effects of cement and curing upon carbonation and reinforcement corrosion in concrete. Mater. Struct. 1996, 29, 164–173. [Google Scholar] [CrossRef]
- Balayssac, J.P.; Detriche, C.H.; Grandet, J. Effects of curing upon carbonation of concrete. Constr. Build. Mater. 1995, 9, 91–95. [Google Scholar] [CrossRef]
- Toshiharu, K.; Saruul, D. Hydration heat modeling for cement with limestone powder. Iabse Colloq. Phuket 1999, 81, 133–138. [Google Scholar]
- Maekawa, K.; Ishida, T.; Kishi, T. Multi-Scale Modeling of Structural Concrete; Taylor & Francis: New York, NY, USA, 2009. [Google Scholar]
- Poppe, A.; de Schutter, G. Cement hydration in the presence of high filler contents. Cem. Concr. Res. 2005, 35, 2290–2299. [Google Scholar] [CrossRef]
- Ye, G.; Liu, X.; Poppe, A.M.; de Schutter, G.; van Breugel, K. Numerical simulation of the hydration process and the development of microstructure of self-compacting cement paste containing limestone as filler. Mater. Struct. 2007, 40, 865–875. [Google Scholar] [CrossRef]
- Cyr, M.; Lawrence, P.; Ringot, E. Mineral admixtures in mortars: Quantification of the physical effects of inert materials on short-term hydration. Cem. Concr. Res. 2005, 35, 719–730. [Google Scholar]
- Zeng, Q.; Li, K.; Fen-chong, T.; Dangla, P. Determination of cement hydration and pozzolanic reaction extents for fly-ash cement pastes. Constr. Build. Mater. 2012, 27, 560–569. [Google Scholar] [CrossRef]
- Bentz, D.P. Influence of water-to-cement ratio on hydration kinetics: Simple models based on spatial considerations. Cem. Concr. Res. 2006, 36, 238–244. [Google Scholar] [CrossRef]
- Bentz, D.P. Modeling the influence of limestone filler on cement hydration using CEMHYD3D. Cem. Concr. Compos. 2006, 28, 124–129. [Google Scholar] [CrossRef]
- Lothenbach, B.; le Saout, G.; Gallucci, E.; Scrivener, K. Influence of limestone on the hydration of Portland cements. Cem. Concr. Res. 2008, 38, 848–860. [Google Scholar] [CrossRef]
- Demis, S.; Efstathiou, M.P.; Papadakis, V.G. Computer-aided modeling of concrete service life. Cem. Concr. Compos. 2014, 47, 9–18. [Google Scholar] [CrossRef]
- Kwon, S.; Na, U. Prediction of durability for RC columns with crack and joint under carbonation based on probabilistic approach. Int. J. Concr. Struct. Mater. 2011, 5, 11–18. [Google Scholar] [CrossRef]
- Ann, K.Y.; Pack, S.-W.; Hwang, J.-P.; Song, H.-W.; Kim, S.-H. Service life prediction of a concrete bridge structure subjected to carbonation. Constr. Build. Mater. 2010, 24, 1494–1501. [Google Scholar] [CrossRef]
- Marques, P.F.; Chastre, C.; Nunes, A. Carbonation service life modelling of RC structures for concrete with Portland and blended cements. Cem. Concr. Compos. 2013, 37, 171–184. [Google Scholar] [CrossRef]
- Marques, P.F.; Costa, A. Service life of RC structures: Carbonation induced corrosion. Prescriptive vs. performance-based methodologies. Constr. Build. Mater. 2010, 24, 258–265. [Google Scholar] [CrossRef]
- Wang, X.-Y.; Lee, H.-S. Modeling the hydration of concrete incorporating fly ash or slag. Cem. Concr. Res. 2010, 40, 984–996. [Google Scholar] [CrossRef]
- Wang, X.-Y. Simulation of temperature rises in hardening Portland cement concrete and fly ash blended concrete. Mag. Concr. Res. 2013, 65, 930–941. [Google Scholar] [CrossRef]
- Ye, G.; Liu, X.; de Schutter, G.; Poppe, A.-M.; Taerwe, L. Influence of limestone powder used as filler in SCC on hydration and microstructure of cement pastes. Cem. Concr. Compos. 2007, 29, 94–102. [Google Scholar] [CrossRef]
- Hasholt, M.T.; Jensen, O.M.; Kovler, K.; Zhutovsky, S. Can superabsorent polymers mitigate autogenous shrinkage of internally cured concrete without compromising the strength? Constr. Build. Mater. 2012, 31, 226–230. [Google Scholar] [CrossRef]
- Demis, S.; Papadakis, V.G. A software-assisted comparative assessment of the effect of cement type on concrete carbonation and chloride ingress. Comput. Concr. 2012, 4, 373–389. [Google Scholar] [CrossRef]
- Papadakis, V.G. Effect of supplementary cementing materials on concrete resistance against carbonation and chloride ingress. Cem. Concr. Res. 2000, 30, 291–299. [Google Scholar] [CrossRef]
- Yoon, I.-S.; Çopuroglu, O.; Park, K.-B. Effect of global climatic change on carbonation progress of concrete. Atmos. Environ. 2007, 41, 7274–7285. [Google Scholar] [CrossRef]
- Talukdar, S.; Banthia, N.; Grace, J.R. Carbonation in concrete infrastructure in the context of global climate change—Part 1: Experimental results and model development. Cem. Concr. Compos. 2012, 34, 924–930. [Google Scholar] [CrossRef]
- Talukdar, S.; Banthia, N.; Grace, J.R.; Cohen, S. Carbonation in concrete infrastructure in the context of global climate change: Part 2—Canadian urban simulations. Cem. Concr. Compos. 2012, 34, 931–935. [Google Scholar] [CrossRef]
- Bouasker, M.; Khalifa, N.E.H.; Mounanga, P.; Kahla, N.B. Early-age deformation and autogenous cracking risk of slag–limestone filler-cement blended binders. Constr. Build. Mater. 2014, 55, 158–167. [Google Scholar] [CrossRef]
- Vance, K.; Aguayo, M.; Oey, T.; Sant, G.; Neithalath, N. Hydration and strength development in ternary portland cement blends containing limestone and fly ash or metakaolin. Cem. Concr. Compos. 2013, 39, 93–103. [Google Scholar] [CrossRef]
- Carette, J.; Staquet, S. Monitoring and modelling the early age and hardening behaviour of eco-concrete through continuous non-destructive measurements: Part II. Mechanical behavior. Cem. Concr. Compos. 2016, 73, 1–9. [Google Scholar] [CrossRef]
- Carette, J.; Staquet, S. Monitoring and modelling the early age and hardening behaviour of eco-concrete through continuous non-destructive measurements: Part I. Hydration and apparent activation energy. Cem. Concr. Compos. 2016, 73, 10–18. [Google Scholar] [CrossRef]
- Aqel, M.; Panesar, D.K. Hydration kinetics and compressive strength of steam-cured cement pastes and mortars containing limestone filler. Constr. Build. Mater. 2016, 113, 359–368. [Google Scholar] [CrossRef]
- Bentz, D.P.; Ardani, A.; Barrett, T.; Jones, S.Z.; Lootens, D.; Peltz, M.A.; Sato, T.; Stutzman, P.E.; Tanesi, J.; Weiss, W.J. Multi-scale investigation of the performance of limestone in concrete. Constr. Build. Mater. 2015, 75, 1–10. [Google Scholar] [CrossRef]


| Binder (kg/m3) | Water-to-Binder Ratio | Gravel/Sand | 28 Days Compressive Strength (MPa) |
|---|---|---|---|
| 300 | 0.65 | 1 | 25.1 |
| 340 | 0.61 | 1.13 | 32.6 |
| 380 | 0.53 | 1.13 | 37.8 |
| 420 | 0.48 | 1.15 | 43.5 |
© 2017 by the author. Licensee MDPI, Basel, Switzerland. This article is an open access article distributed under the terms and conditions of the Creative Commons Attribution (CC BY) license ( http://creativecommons.org/licenses/by/4.0/).
Share and Cite
Wang, X.-Y. Modeling of Hydration, Compressive Strength, and Carbonation of Portland-Limestone Cement (PLC) Concrete. Materials 2017, 10, 115. https://doi.org/10.3390/ma10020115
Wang X-Y. Modeling of Hydration, Compressive Strength, and Carbonation of Portland-Limestone Cement (PLC) Concrete. Materials. 2017; 10(2):115. https://doi.org/10.3390/ma10020115
Chicago/Turabian StyleWang, Xiao-Yong. 2017. "Modeling of Hydration, Compressive Strength, and Carbonation of Portland-Limestone Cement (PLC) Concrete" Materials 10, no. 2: 115. https://doi.org/10.3390/ma10020115