Preparation and Optimization of Fluorescent Thin Films of Rosamine-SiO2/TiO2 Composites for NO2 Sensing

 , , , and
Abstract
:1. Introduction
2. Results and discussion
2.1. Spectroscopic Characterization of RosB/MO Composites: Molecular Aggregation
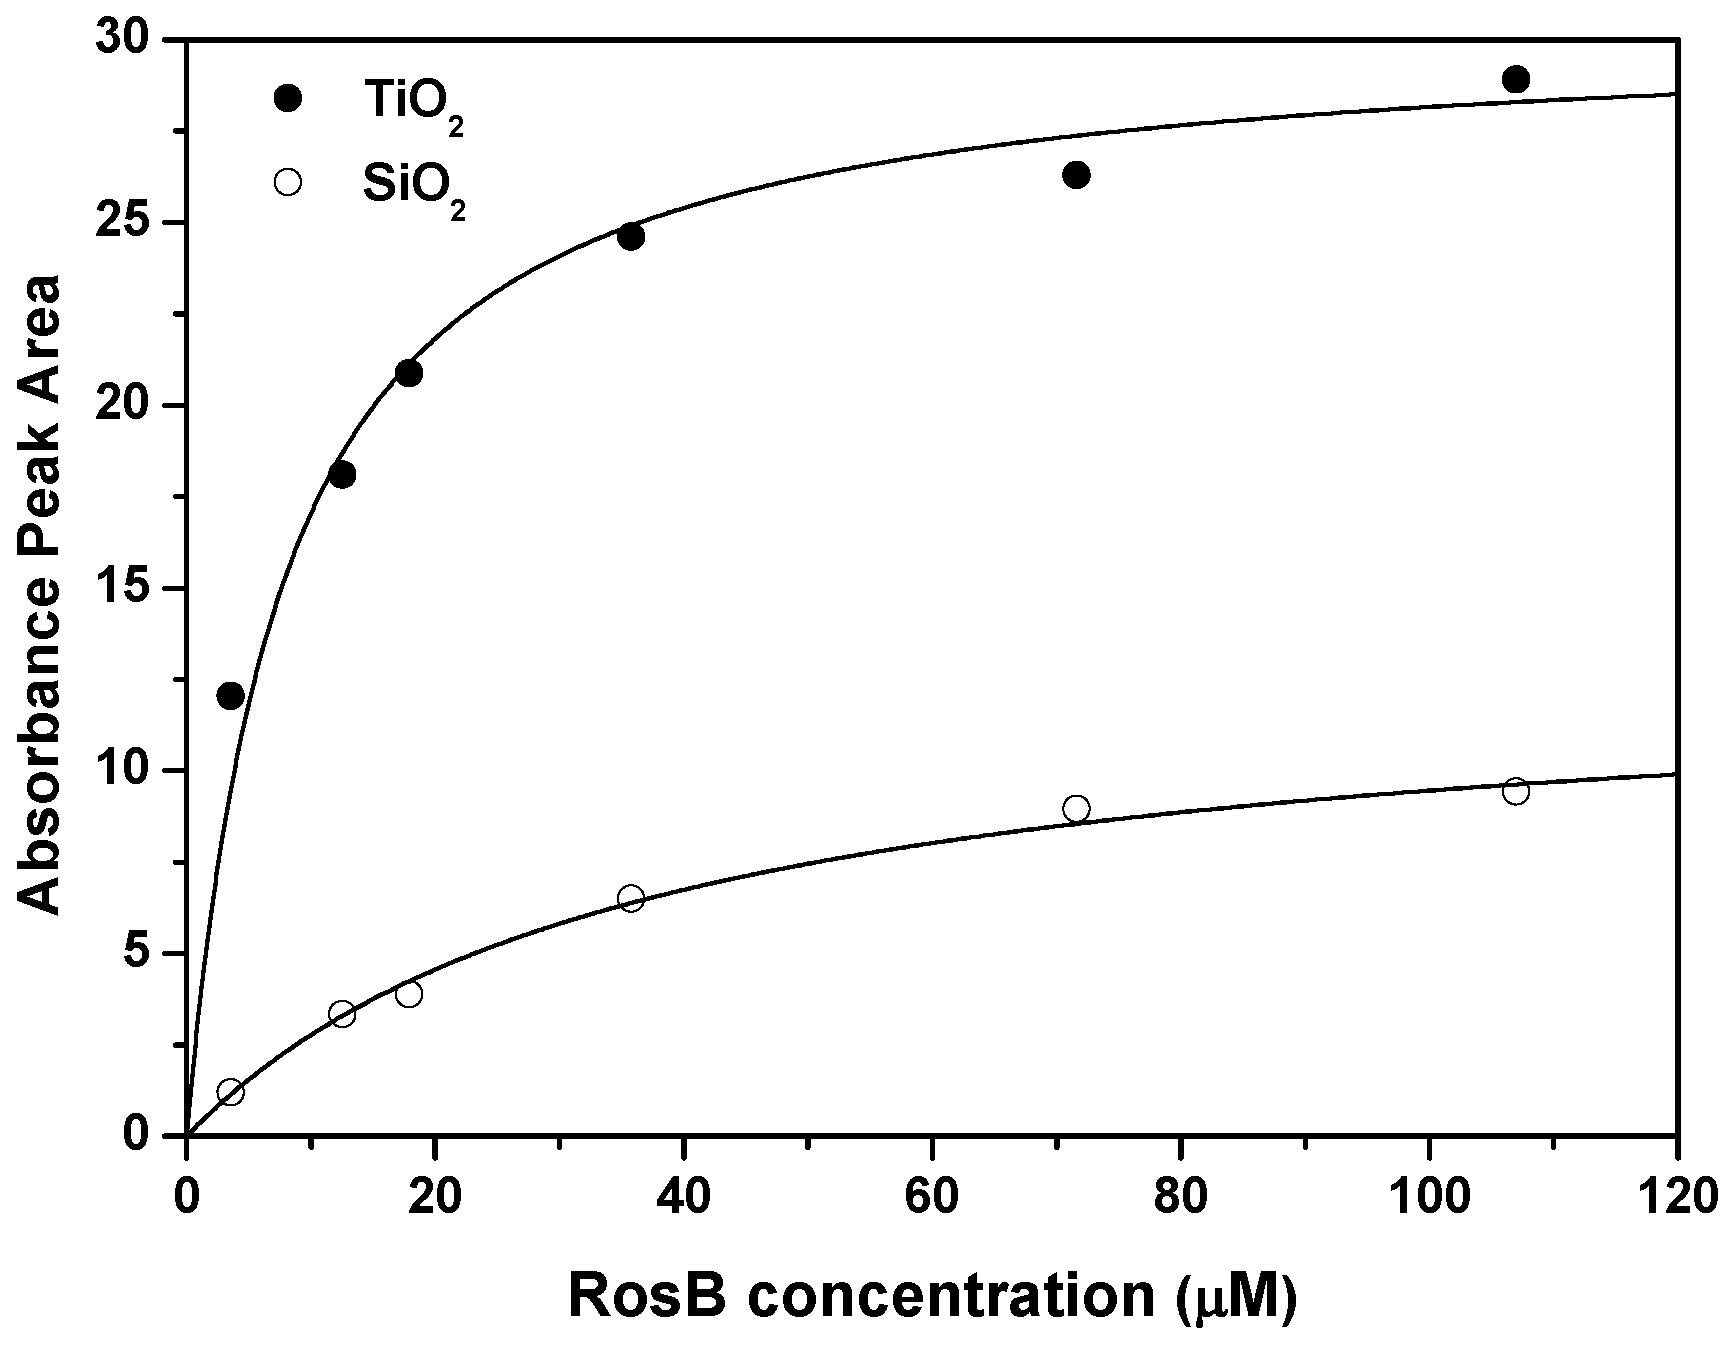
2.2. Spectroscopic Characterization of RosB/MO Composites: Adsorption Equilibrium and Kinetics
2.3. Spectroscopic Characterization of RosB/MO Composites: Anchoring
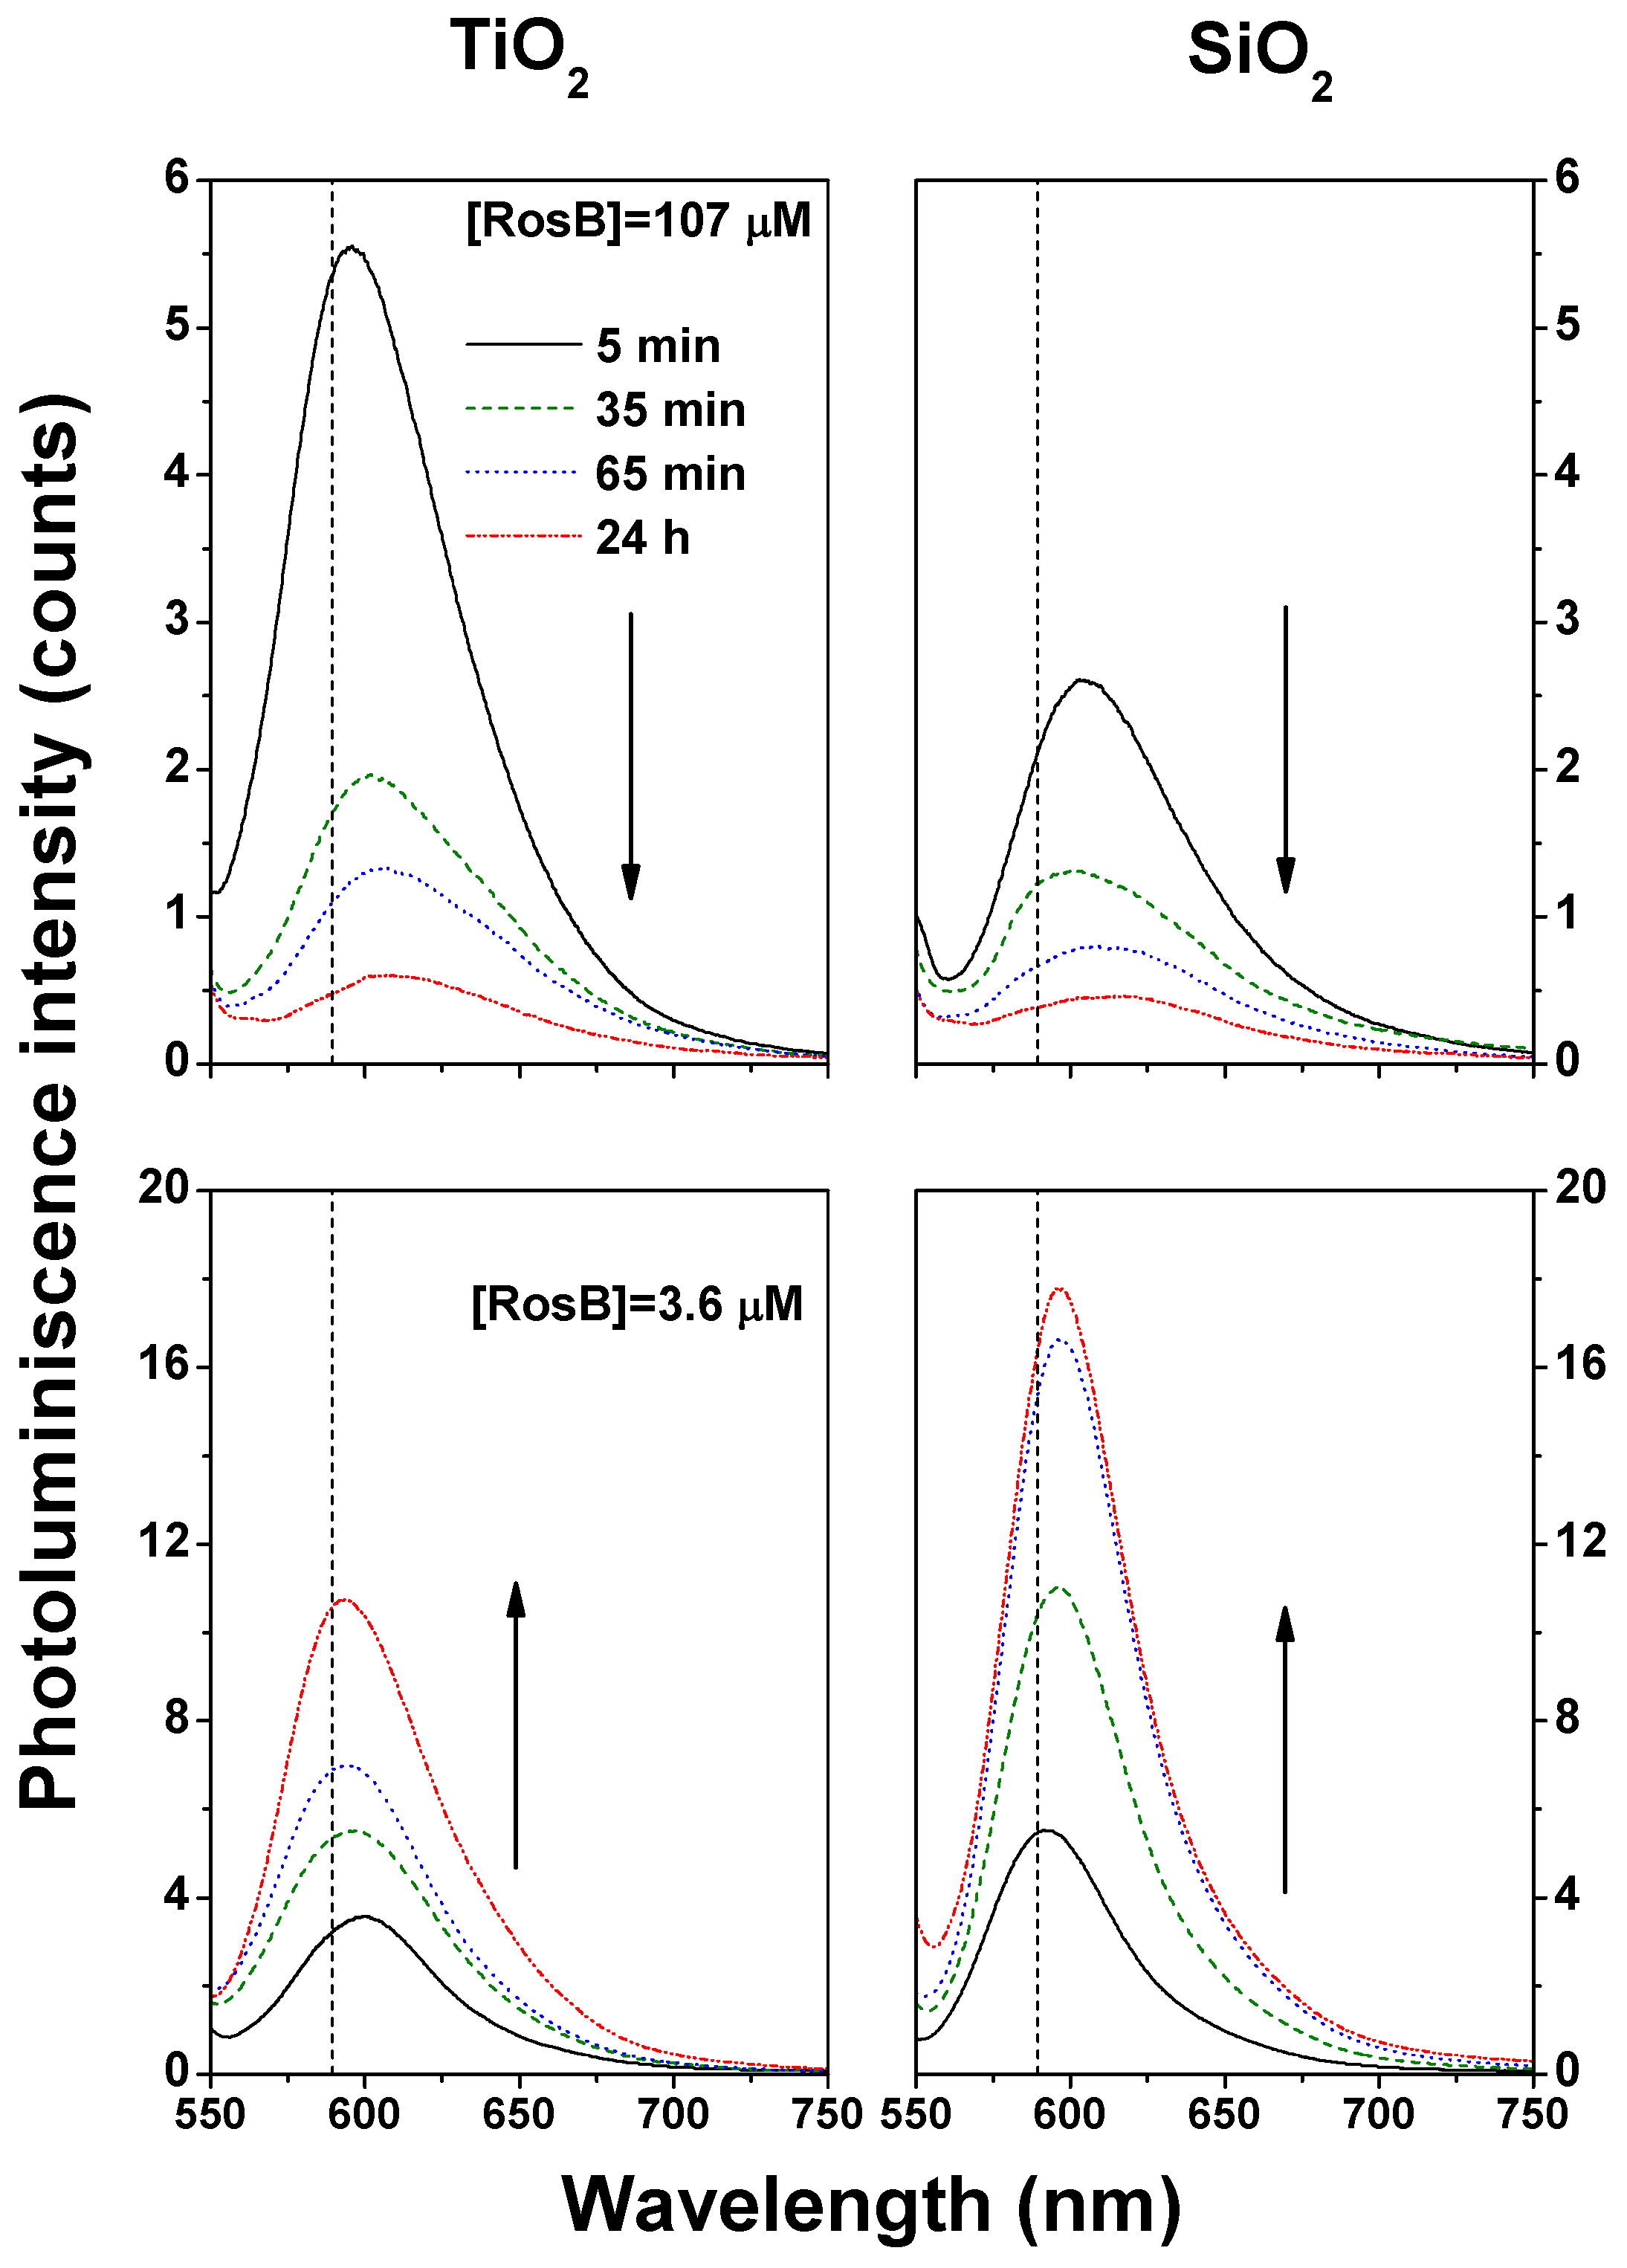
2.4. Photoluminescence of RosB/MO Composites: Choosing the Optimal Preparation Conditions for Enhancing the Fluorescence Signal
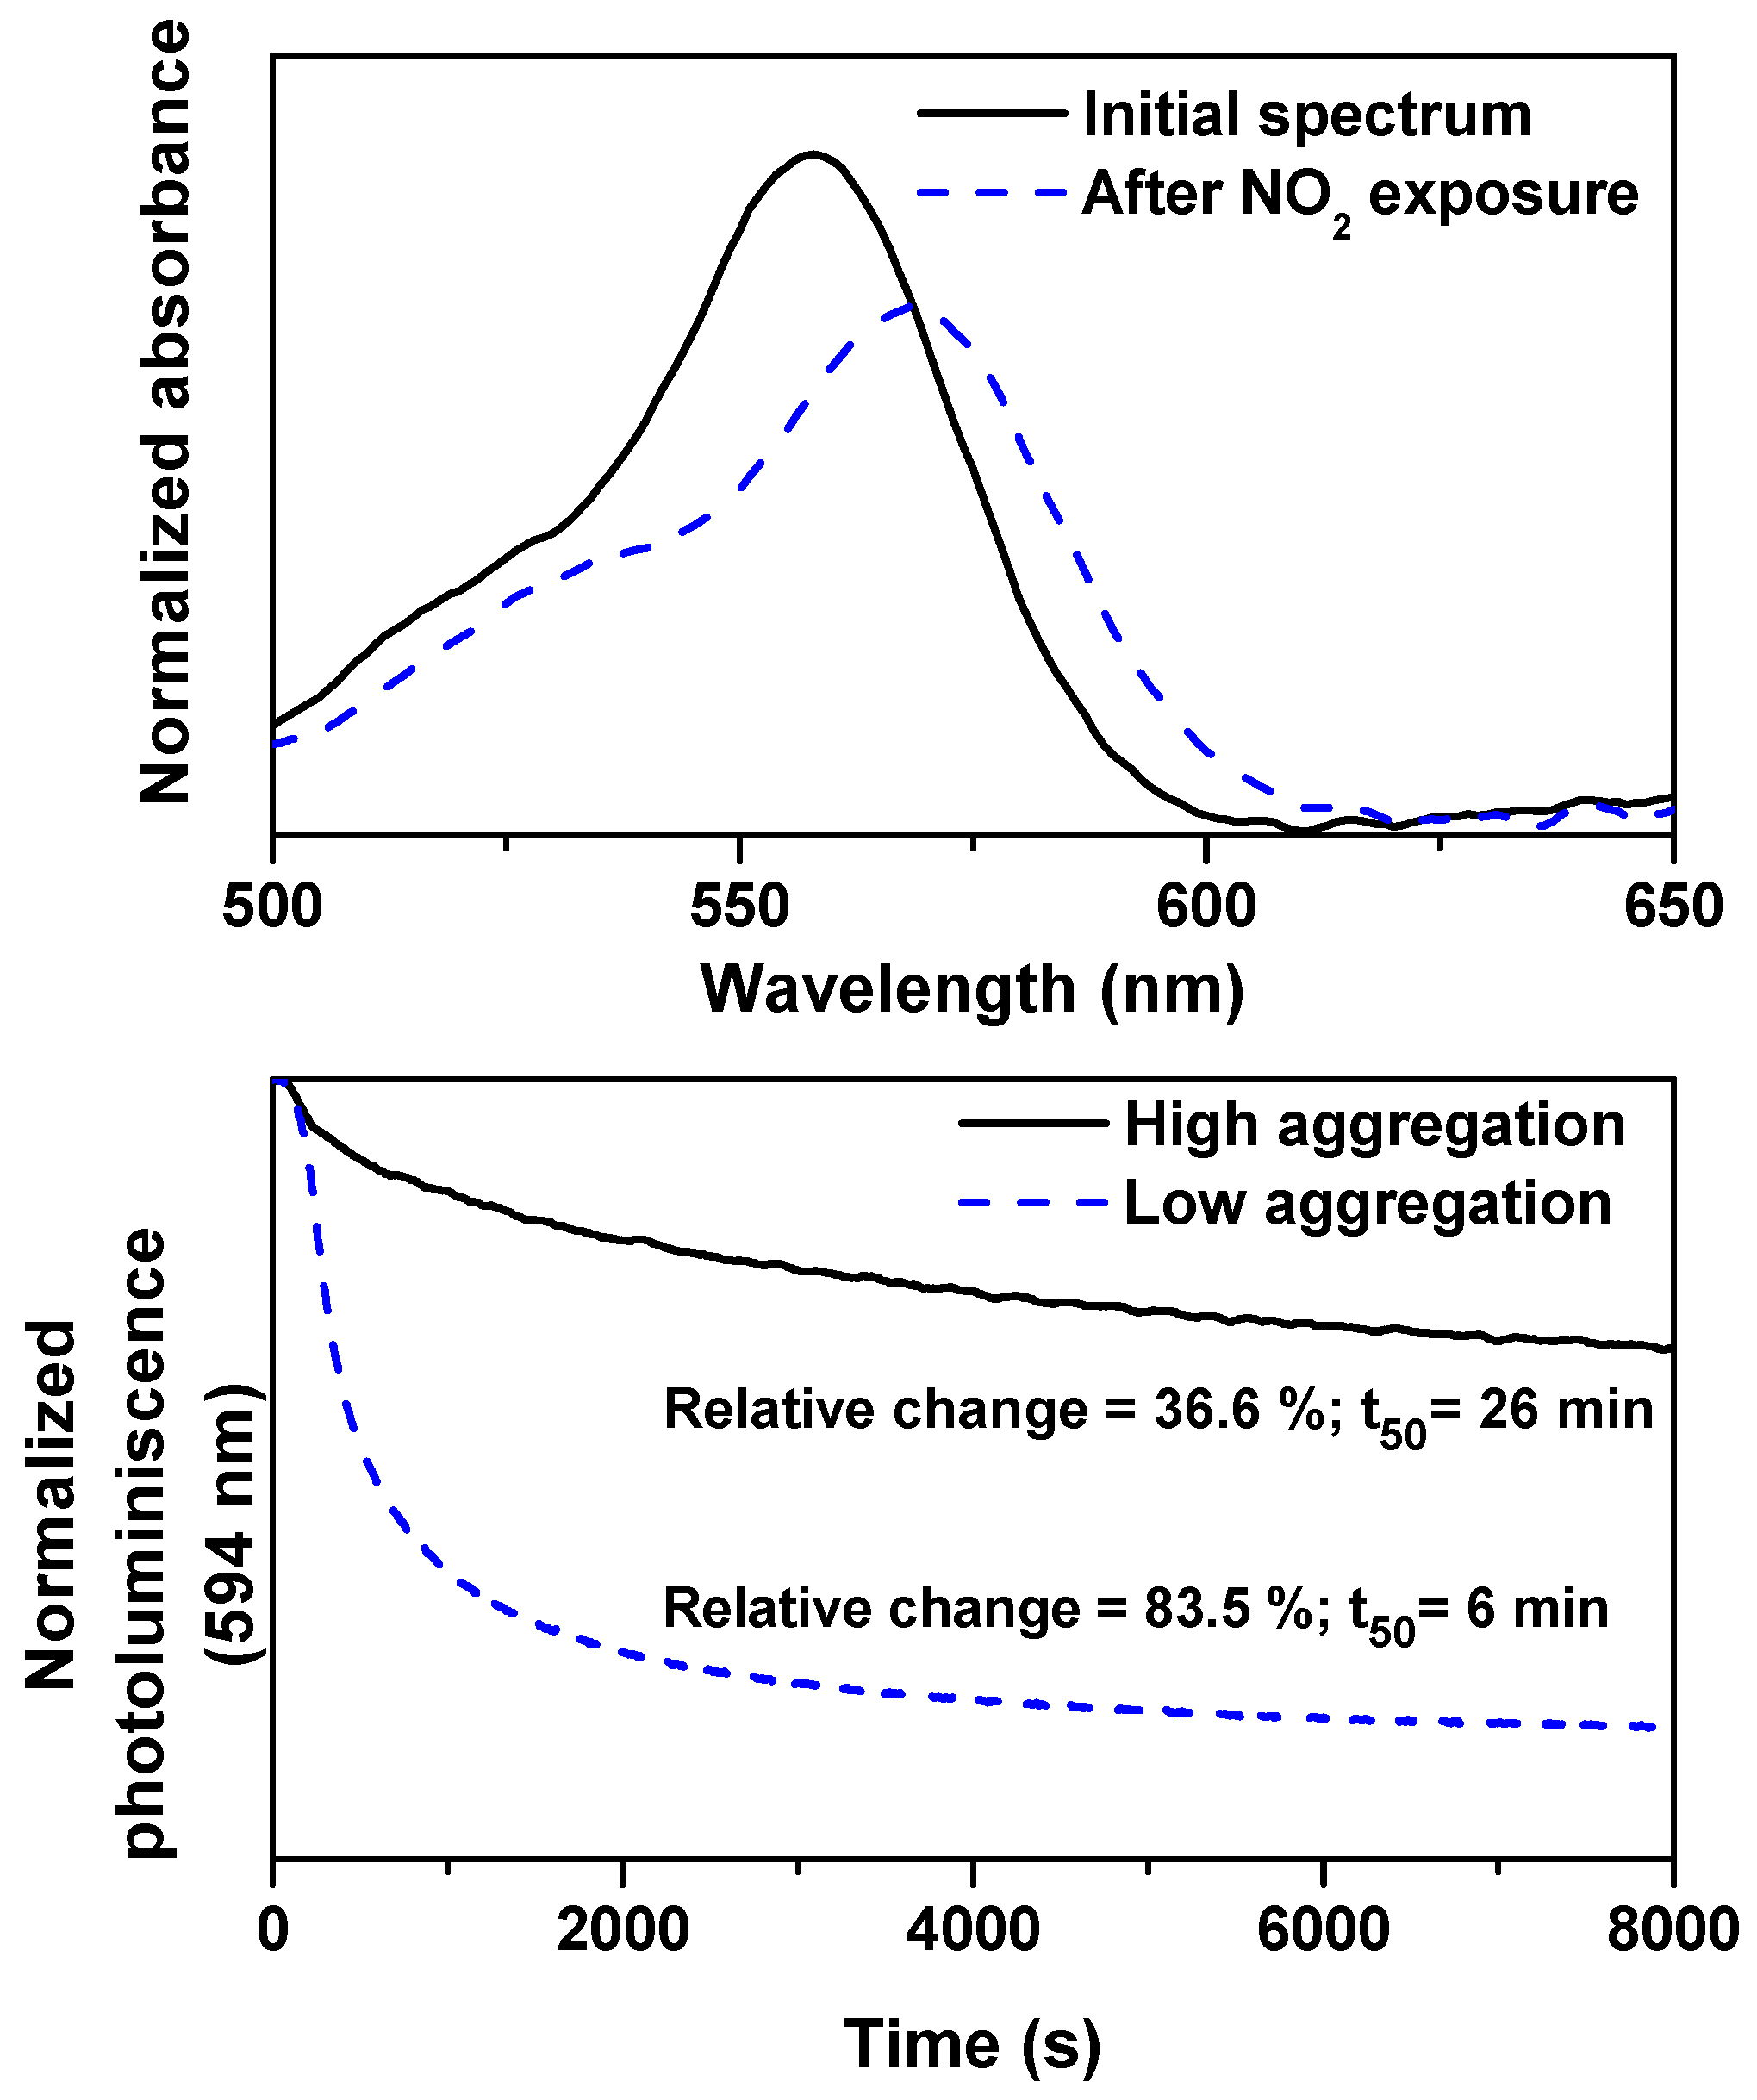
2.5. Sensing Response to NO Gas
3. Conclusions
4. Materials and Methods
4.1. Chemicals
4.2. Fabrication of MO Films and RosB Infiltration
4.3. Instrumentation
Supplementary Materials
Acknowledgments
Author Contributions
Conflicts of Interest
References
- Chen, X.; Pradhan, T.; Wang, F.; Kim, J.S.; Yoon, J. Fluorescent Chemosensors Based on Spiroring-Opening of Xanthenes and Related Derivatives. Chem. Rev. 2012, 112, 1910–1956. [Google Scholar] [CrossRef] [PubMed]
- Yang, P.; Wirnsberger, G.; Huanng, H.C.; Cordero, S.R.; McGehee, M.D.; Scott, B.; Deng, T.; Whitesides, G.M.; Cmelka, G.F.; Buratto, S.K.; et al. Mirrorless Lasing from Mesostructured Waveguides Patterned by Soft Lithography. Science 2000, 287, 465–467. [Google Scholar] [CrossRef] [PubMed]
- Sasai, R.; Iyi, N.; Fujita, T.; Arbeloa, F.L.; Martínez, V.M.; Takagi, K.; Itoh, H. Luminescence Properties of Rhodamine 6G Intercalated in Surfactant/Clay Hybrid Thin Solid Films. Langmuir 2004, 20, 4715–4719. [Google Scholar] [CrossRef] [PubMed]
- Marlow, F.; McGehee, M.D.; Zhao, D.; Chmelka, B.F.; Stucky, G.D. Doped Mesoporous Silica Fibers: A New Laser Material. Adv. Mater. 1999, 11, 632–636. [Google Scholar] [CrossRef]
- Tleugabulova, D.; Zhang, Z.; Chen, Y.; Brook, M.A.; Brennan, J.D. Fluorescence Anisotropy in Studies of Solute Interactions with Covalently Modified Colloidal Silica Nanoparticles. Langmuir 2004, 20, 848–854. [Google Scholar] [CrossRef]
- Bahadur, L.; Srivastava, P. Efficient Photon-to-Electron Conversion with Rhodamine 6G-sensitized Nanocrystalline n-ZnO Thin Film Electrodes in Acetonitrile Solution. Sol. Energy Mater. Sol. Cells 2003, 79, 235–248. [Google Scholar] [CrossRef]
- Aragay, G.; Pons, J.; Merkoçi, A. Recent Trends in Macro-, Micro-, and Nanomaterial-Based Tools and Strategies for Heavy-Metal Detection. Chem. Rev. 2011, 111, 3433–3458. [Google Scholar] [CrossRef] [PubMed]
- Kim, H.N.; Lee, M.H.; Kim, H.J.; Kim, J.S.; Yoon, J. A New Trend in Rhodamine-Based Chemosensors: Application of Spirolactam Ring-Opening to Sensing Ions. Chem. Soc. Rev. 2008, 37, 1465–1472. [Google Scholar] [CrossRef] [PubMed]
- Sánchez-Valencia, J.R.; Toudert, J.; González-García, L.; González-Elipe, A.R.; Barranco, A. Excitation Transfer Mechanism Along the Visible to the Near-IR in Rhodamine J-Heteroaggregates. Chem. Commun. 2010, 46, 4372–4374. [Google Scholar] [CrossRef] [PubMed]
- Sánchez-Valencia, J.R.; Blaszczyk-Lezak, I.; Espinós, J.P.; Hamad, S.; González-Elipe, A.R.; Barranco, A. Incorporation and Thermal Evolution of Rhodamine 6G Dye Molecules Adsorbed in Porous Columnar Optical SiO2 Thin Films. Langmuir 2009, 25, 9140–9148. [Google Scholar] [CrossRef]
- Sánchez-Valencia, J.R.; Borrás, A.; Barranco, A.; Rico, V.J.; Espinós, J.P.; González-Elipe, A.R. Preillumination of TiO2 and Ta2O5 Photoactive Thin Films As a Tool to Tailor the Synthesis of Composite Materials. Langmuir 2008, 24, 9460–9469. [Google Scholar] [CrossRef] [PubMed]
- Drexhage, K. Fluorescence Efficiency of Laser Dyes. J. Res. Natl. Bur. Stand. A Phys. Chem. 1976, 80, 421–428. [Google Scholar] [CrossRef]
- Beija, M.; Alfonso, C.A.M.; Martinho, J.M.G. Synthesis and Applications of Rhodamine Derivatives as Fluorescent Probes. Chem. Soc. Rev. 2009, 38, 2410–2433. [Google Scholar] [CrossRef] [PubMed]
- Sun, Y.Q.; Liu, J.; Lv, X.; Liu, Y.; Zhao, Y.; Guo, W. Rhodamine-inspired Far-red to Near-infrared Dyes and their Application as Fluorescence Probes. Angew. Chem. Int. Ed. 2012, 51, 7634–7636. [Google Scholar] [CrossRef] [PubMed]
- Koide, Y.; Kawaguchi, M.; Urano, Y.; Hanaoka, K.; Komatsu, T.; Abo, M.; Terai, T.; Nagano, T. A Reversible Near-infrared Fluorescence Probe for Reactive Oxygen Species based on Te-rhodamine. Chem. Comm. 2012, 48, 3091–3093. [Google Scholar] [CrossRef] [PubMed]
- Choi, J.Y.; Kim, W.; Yoon, J. Rhodamine Based Fluorescent Chemosensors for Hg2+ and its Biological Application. Bull. Korean Chem. Soc. 2012, 33, 2359–2364. [Google Scholar] [CrossRef]
- Niu, G.; Liu, W.; Zhou, B.; Xiao, H.; Zhang, H.; Wu, J.; Ge, J.; Wang, P. Deep-Red and Near-Infrared Xanthene Dyes for Rapid Live Cell Imaging. J. Org. Chem. 2016, 81, 7393–7399. [Google Scholar] [CrossRef] [PubMed]
- Jeong, Y.; Yoon, J. Recent Progress on Fluorescent Chemosensors for Metal Ions. Inorg. Chim. Acta 2012, 381, 2–14. [Google Scholar] [CrossRef]
- Sivaraman, G.; Chellappa, D. Rhodamine Based Sensor for Naked-Eye Detection and Live Cell Imaging of Fluoride Ions. J. Mater. Chem. B 2013, 1, 5768–5772. [Google Scholar] [CrossRef]
- Corma, A.; Garcia, H. Silica-Bound Homogenous Catalysts as Recoverable and Reusable Catalysts in Organic Synthesis. Adv. Synth. Catal. 2006, 348, 1391–1412. [Google Scholar] [CrossRef]
- Taguchi, A.; Schuth, F. Ordered Mesoporous Materials in Catalysis. Microporous Mesoporous Mater. 2005, 77, 1–45. [Google Scholar] [CrossRef]
- Hartmann, M. Ordered Mesoporous Materials for Bioadsorption and Biocatalysis. Chem. Mat. 2005, 17, 4577–4593. [Google Scholar] [CrossRef]
- Germain, J.; Fréchet, J.M.J.; Svec, F. Nanoporous Polymers for Hydrogen Storage. Small 2009, 5, 1098–1111. [Google Scholar] [CrossRef] [PubMed]
- Czaja, A.U.; Trukhan, N.; Muller, U. Industrial Applications of Metal-Organic Frameworks. Chem. Soc. Rev. 2009, 38, 1284–1293. [Google Scholar] [CrossRef] [PubMed]
- Baskaran, S.; Liu, J.; Domansky, K.; Kohler, N.; Li, X.; Coyle, C.; Fryxell, G.E.; Thevuthasan, S.; Williford, R.E. Low Dielectric Constant Mesoporous Silica Films Through Molecularly Templated Synthesis. Adv. Mater. 2000, 12, 291–294. [Google Scholar] [CrossRef]
- Scott, B.J.; Wirnsberger, G.; Stucky, G.D. Mesoporous and Mesostructured Materials for Optical Applications. Chem. Mater. 2001, 13, 3140–3150. [Google Scholar] [CrossRef]
- Tam-Chang, S.W.; Huang, L. Chromonic Liquid Crystals: Properties and Applications as Functional Materials. Chem. Commun. 2008, 17, 1957–1967. [Google Scholar] [CrossRef] [PubMed]
- Van Esch, J.H.; Feringa, B.L. New Functional Materials Based on Self–Assembling Organogels: From Serendipity towards Design. Angew. Chem. Int. Ed. 2000, 39, 2263–2266. [Google Scholar] [CrossRef]
- Liu, X.D.; Esker, A.R.; Häußler, M.; Kim, C.; Lucas, P.; Matsunaga, M.; Nishi, N.; Robin, J.-J.; Tang, B.Z.; Wang, D.-A.; et al. Functional Materials and Biomaterials; Springer: Berlin/Heidelberg, Germany, 2007; pp. 149–178. [Google Scholar]
- Abou Neel, E.A.; Pickup, D.M.; Valappil, S.P.; Newport, R.J.; Knowles, J.C. Bioactive Functional Materials: A Perspective on Phosphate-Based Glasses. J. Mater. Chem. 2009, 19, 690–701. [Google Scholar] [CrossRef]
- Bockstaller, M.R.; Mickiewicz, R.A.; Thomas, E.L. Block Copolymer Nanocomposites: Perspectives for Tailored Functional Materials. Adv. Mater. 2005, 17, 1331–1349. [Google Scholar] [CrossRef]
- Cohen, R.E. Block Copolymers as Templates for Functional Materials. Curr. Opin. Solid State Mater. Sci. 1999, 4, 587–590. [Google Scholar] [CrossRef]
- Matsukawa, K. Development of Photo-functional Materials from Organic/Inorganic Nano-Hybrids. J. Photopolym. Sci. Technol. 2005, 18, 203–210. [Google Scholar] [CrossRef]
- Yoon, K.B. Organization of Zeolite Microcrystals for Production of Functional Materials. Acc. Chem. Res. 2006, 40, 29–40. [Google Scholar] [CrossRef] [PubMed]
- Schöllhorn, R. Intercalation Systems as Nanostructured Functional Materials. Chem. Mater. 1996, 8, 1747–1757. [Google Scholar] [CrossRef]
- Fryxell, G.E. The Synthesis of Functional Mesoporous Materials. Inorg. Chem. Commun. 2006, 9, 1141–1150. [Google Scholar] [CrossRef]
- Yao, W.T.; Yu, S.H. Synthesis of Semiconducting Functional Materials in Solution: From II-VI Semiconductor to Inorganic–Organic Hybrid Semiconductor Nanomaterials. Adv. Funct. Mater. 2008, 18, 3357–3366. [Google Scholar] [CrossRef]
- Liu, P.S.; Liang, K.M. Review Functional Materials of Porous Metals Made by P/M, Electroplating and Some Other Techniques. J. Mater. Sci. 2001, 36, 5059–5072. [Google Scholar] [CrossRef]
- Powell, C.F.; Oxley, J.H.; Blocher, J.M. Vapor Deposition; John Wiley & Sons: New York, NY, USA, 1966. [Google Scholar]
- Robbic, K.; Brett, M.J. Sculptured Thin Films and Glancing Angle Deposition: Growth Mechanics and Applications. J. Vac. Sci. Technol. A 1997, 15, 1460–1465. [Google Scholar] [CrossRef]
- Wang, S.; Xia, G.; He, H.; Yi, K.; Shao, J.; Fan, Z. First-Principles Study of Shear Deformation in TiAl Alloys. J. Alloys Compd. 2007, 431, 287–291. [Google Scholar] [CrossRef]
- Brett, M.J.; Hawkeye, M.M. New Materials at a Glance. Science 2008, 319, 1192–1193. [Google Scholar] [CrossRef] [PubMed]
- Kosmulski, M. Chemical Properties of Material Surfaces; Marcel Dekker: New York, NY, USA, 2001. [Google Scholar]
- Hinckley, D.A.; Seybold, P.G. A Spectroscopic/Thermodynamic Study of the Rhodamine B Lactone ↔ Zwitterion Equilibrium. Spectrochim. Acta 1998, 44A, 1053–1059. [Google Scholar] [CrossRef]
- Cardoso, I.C.S.; Amorim, A.L.; Queirós, C.; Lopes, S.C.; Gameiro, P.; de Castro, B.; Rangel, M.; Silva, A.M.G. Microwave-Assisted Synthesis and Spectroscopic Properties of 4′-Substituted Rosamine Fluorophores and Naphthyl Analogues. Eur. J. Org. Chem. 2012, 29, 5810–5817. [Google Scholar] [CrossRef]
- U.S. Environmental Protection Agency. Air Trends Summary Report. Available online: http://www.epa.gov/oar/aqtrnd95/no2.html (accessed on 26 January 2017).
- Mchedlov-Petrosyan, N.; Kholin, Y.V. Aggregation of Rhodamine B in Water. Russ. J. Appl. Chem. 2004, 77, 414–422. [Google Scholar] [CrossRef]
- Setiawan, D.; Kazaryan, A.; Martoprawirob, M.A.; Filatov, M. A First Principles Study of Fluorescence Quenching in Rhodamine B Dimers: How Can Quenching Occur in Dimeric Species? Phys. Chem. Chem. Phys. 2010, 12, 11238–11244. [Google Scholar] [CrossRef] [PubMed]
- Würth, C.; Grabolle, M.; Pauli, J.; Spieles, M.; Resch-Genger, U. Relative and Absolute Determination of Fluorescence Quantum Yields of Transparent Samples. Nature 2013, 8, 1535–1550. [Google Scholar] [CrossRef] [PubMed]
- Kasnavia, T.N.; Vu, D.; Sabatini, D.A. Fluorescent Dye and Media Properties Affecting Sorption and Tracer Selection. Groundwater 1999, 37, 376–381. [Google Scholar] [CrossRef]
- Hiemenz, P.C.; Rajagopalan, R. Principles of Colloids and Surface Chemistry; Marcel Dekker: New York, NY, USA, 1997. [Google Scholar]
- Yariv, S.; Nasser, A.; Bar-On, P. Metachromasy in clay minerals. Spectroscopy study of the adsorption of crystal violet by Laponite. J. Chem. Soc. Faraday Trans. 1990, 86, 1593–1598. [Google Scholar] [CrossRef]
- Fujii, T.; Ishii, A.; Anpo, M. Absorption and Fluorescence Spectra of Rhodamine B molecules Encapsulated in Silica Gel Networks and their Thermal Stability. J. Photochem. Photobiol. A Chem. 1990, 54, 231–237. [Google Scholar] [CrossRef]
- Adamovich, L.P.; Mel’nik, V.V.; Mchedlov-Petrosyan, N.O. Rhodamine Equilibria in Water-Salt Solutions. Zhurnal Fiz. Khimii 1979, 53, 356–359. [Google Scholar]
- De Miguel, G.; Pérez-Moales, M.; Martín-Romero, M.T.; Muñoz, E.; Richardson, T.H.; Camacho, L. Aggregation of a Water-Soluble Tetracationic Porphyrin in Mixed LB Films with a Calix[8]arene Carboxylic Acid Derivative. Langmuir 2007, 23, 3794–3801. [Google Scholar] [CrossRef] [PubMed]
- Özacar, M.; Senglil, I.A. Adsorption of Acid Dyes from Aqueous Solutions by Calcined Alunite and Granular Activated Carbon. Adsorption 2002, 8, 301–308. [Google Scholar] [CrossRef]
- Ho, Y.S. Adsorption of Heavy Metals from Waste Streams by Peat. Ph.D. Thesis, University of Brimmingham, Brimmingham, UK, 1995. [Google Scholar]
- Watanabe, H.; Hayazawa, N.; Inouye, Y.; Kawata, S. DFT Vibrational Calculations of Rhodamine 6G Adsorbed on Silver: Analysis of Tip-Enhanced Raman Spectroscopy. J. Phys. Chem. B 2005, 109, 5012–5020. [Google Scholar] [CrossRef] [PubMed]
- Morterra, C. An Infrared Spectroscopic Study of Anatase Properties. Part 6—Surface Hydration and Strong Lewis Acidity of Pure and Sulphate-Doped Preparations. Faraday Trans. 1988, 84, 1617–1637. [Google Scholar] [CrossRef]
- Maira, A.J.; Coronado, J.M.; Augugliaro, V.; Yeung, K.L.; Conesa, J.C.; Soria, J. Fourier Transform Infrared Study of the Performance of Nanostructured TiO2 Particles for the Photocatalytic Oxidation of Gaseous Toluene. J. Catal. 2001, 202, 413–420. [Google Scholar] [CrossRef]
- Isaienko, O.; Nihonyanagi, S.; Sil, D.; Borguet, E. Observation of the Bending Mode of Interfacial Water at Silica Surfaces by Near-Infrared Vibrational Sum-Frequency Generation Spectroscopy of the [Stretch+ Bend] Combination Bands. J. Phys. Chem. Lett. 2013, 4, 531–535. [Google Scholar] [CrossRef] [PubMed]
- López-Arbeloa, F.; Tapia-Estévez, M.J.; López-Arbeloa, T.; López-Arbeloa, I. Spectroscopic Study of the Adsorption of Rhodamine 6G on Clay Minerals in Aqueous Suspensions. Clay Miner. 1997, 32, 97–106. [Google Scholar] [CrossRef]
- Arbeloa, F.L.; Martínez, V.M.; López, T.A.; Arbeloa, I.L. Photoresponse and anisotropy of rhodamine dye intercalated in ordered layered films. J. Photochem. Photobiol. C 2007, 8, 85–108. [Google Scholar]
- Tapia-Estévez, M.J.; López-Arbeloa, F.; López-Arbeloa, T.; López-Arbeloa, I.; Schoonheydt, R.A. Spectroscopic Study of the Adsorption of Rhodamine 6G on Laponite B for Low Loadings. Clay Miner. 1994, 29, 105–113. [Google Scholar] [CrossRef]
- Pedrosa, J.M.; Dooling, C.M.; Richardson, T.H.; Hyde, R.K.; Hunter, C.A.; Martín, M.T.; Camacho, L. The Optical Gas-Sensing Properties of an Asymmetrically Substituted Porphyrin. J. Mater. Chem. 2002, 12, 2659–2664. [Google Scholar] [CrossRef]
- Gulino, A.; Mineo, P.; Scamporrino, E.; Vitalini, D.; Fragalà, I.; Fragalà, I. Molecularly engineered silica surfaces with an assembled porphyrin monolayer as optical NO2 molecular recognizers. Chem. Mater. 2004, 16, 1838–1840. [Google Scholar] [CrossRef]
- Gulino, A.; Bazzano, S.; Mineo, P.; Scamporrino, E.; Vitalini, D.; Fragalà, I.; Fragalà, I. Characterization, optical recognition behavior, sensitivity, and selectivity of silica surfaces functionalized with a porphyrin monolayer. Chem. Mater. 2005, 17, 521–526. [Google Scholar] [CrossRef]
- Pedrosa, J.M.; Dooling, C.M.; Richardson, T.H.; Hyde, R.K.; Hunter, C.A.; Martín, M.T.; Camacho, L. Influence of Molecular Organization of Asymmetrically Substituted Porphyrins on Their Response to NO2 Gas. Langmuir 2002, 18, 7594–7601. [Google Scholar] [CrossRef]
- Roales, J.; Pedrosa, J.M.; Guillén, M.G.; Lopes-Costa, T.; Castillero, P.; Barranco, A.; González-Elipe, A.R. Free-Base Carboxyphenyl Porphyrin Films Using a TiO2 Columnar Matrix: Characterization and Application as NO2 Sensors. Sensors 2015, 15, 11118–11132. [Google Scholar] [CrossRef] [PubMed]
- Grauer, Z.; Avnir, D.; Yariv, S. Adsorption Characteristics of Rhodamine 6G on Montmorillonite and Laponite, Elucidated from Electronic Absorption and Emission Spectra. Can. J. Chem. 1984, 62, 1889–1984. [Google Scholar] [CrossRef]
- Castillero, P.; Sánchez-Valencia, J.R.; Cano, M.; Pedrosa, J.M.; Roales, J.; Barranco, A.; González-Elipe, A.R. Active and Optically Transparent Tetracationic Porphyrin/TiO2 Composite Thin Films. ACS Appl. Mater. Interfaces 2010, 2, 712–721. [Google Scholar] [CrossRef] [PubMed]
- Roales, J.; Pedrosa, J.M.; Castillero, P.; Cano, M.; Richardson, T.H.; Barranco, Á.; González-Elipe, A.R. Selective Detection of Volatile Organic Compounds by Spectral Imaging of Porphyrin Derivatives Bound to TiO2 Porous Films. ACS Appl. Mater. Interfaces 2012, 4, 5147–5154. [Google Scholar] [CrossRef] [PubMed]


© 2017 by the authors. Licensee MDPI, Basel, Switzerland. This article is an open access article distributed under the terms and conditions of the Creative Commons Attribution (CC BY) license ( http://creativecommons.org/licenses/by/4.0/).
Share and Cite
Guillén, M.G.; Gámez, F.; Suárez, B.; Queirós, C.; Silva, A.M.G.; Barranco, Á.; Sánchez-Valencia, J.R.; Pedrosa, J.M.; Lopes-Costa, T. Preparation and Optimization of Fluorescent Thin Films of Rosamine-SiO2/TiO2 Composites for NO2 Sensing. Materials 2017, 10, 124. https://doi.org/10.3390/ma10020124
Guillén MG, Gámez F, Suárez B, Queirós C, Silva AMG, Barranco Á, Sánchez-Valencia JR, Pedrosa JM, Lopes-Costa T. Preparation and Optimization of Fluorescent Thin Films of Rosamine-SiO2/TiO2 Composites for NO2 Sensing. Materials. 2017; 10(2):124. https://doi.org/10.3390/ma10020124
Chicago/Turabian StyleGuillén, María G., Francisco Gámez, Belén Suárez, Carla Queirós, Ana M. G. Silva, Ángel Barranco, Juan Ramón Sánchez-Valencia, José María Pedrosa, and Tânia Lopes-Costa. 2017. "Preparation and Optimization of Fluorescent Thin Films of Rosamine-SiO2/TiO2 Composites for NO2 Sensing" Materials 10, no. 2: 124. https://doi.org/10.3390/ma10020124