1. Introduction
Titanium aluminides (γ-TiAl or TiAl) alloys are considered to be promising for usage as materials at high-temperature (700 °C–900 °C); they have aerospace and automotive applications due to their low density combined with excellent creep and high-temperature corrosion resistance [
1,
2,
3,
4]. Currently, TiAl alloy products are applied as materials for the rotating blades of high pressure compressors (PW1100G engine, 2014) and low pressure turbines (PW1100G engine, 2014; GEnx™ engine, 2006) in commercial aircraft engines [
5,
6]. At room and service temperature, TiAl alloys are entirely composed of ordered, stable intermetallic phases, mainly of the γ-TiAl phase (face-centered tetragonal of the L1
0 type), α
2-Ti
3Al phase (ordered hexagonal of the D0
19 type) and a slight or inexistent presence of the β
0 (B2 structure) phase. Recently, the β solidified γ-TiAl (β/γ-TiAl) alloys have been developed widely, due to a good hot deformability [
7,
8,
9].
Generally, under a moderate cooling rate, the common solidification pathway from the liquid to the stable solid state for the β/γ-TiAl alloy is L → L + β → β → β + α → β + α + γ → β
0 + α + γ → β
0 + α
2 + γ [
10]. The lowest transformation temperature for the main phases in TiAl alloys was the eutectoid reaction temperature (
Te, 1150 °C–1200 °C), where the order–disorder transformation β
0 + α + γ → β
0 + α
2 + γ occurred. As the cooling rate increased, the solidification pathway was severely changed, and the composition-invariant massive transformation phenomenon was observed, where a heterogeneous microstructure was left in the components [
11,
12,
13]. The liquid metal quenching would induce the creation of the supersaturated phases and even the existence of amorphous microstructures at room temperature. Compared to the stable phases of TiAl alloys mentioned above, the supersaturated phases have significantly higher densities of antisite defects, such as the Ti
Al defects (the Al sub-lattice replaced by Ti atoms) [
14,
15]. In Ti-rich multiphase alloys, the low temperature diffusion is probably supported by a significant chemical disorder but this is not the case in self-diffusion [
15]. Moreover, the transformation of the supersaturated phase which was lacking in rate actually occurred at a temperature significantly lower than the
Te. Therefore, certain phase transformations during the solidification pathway were partly compared by transformations of the supersaturated phases during annealing at a low temperature. Furthermore, the low temperature phase transformations were somewhat easier to control, offering improved methods for the research of metastable phases and transformation mechanisms. The quenching with a subsequently low annealing temperature was the common method for the phase transformation study in many metallic materials and also in TiAl alloys [
10,
16].
Several metastable phases, which might have played an important role in the improvement of certain TiAl alloy properties were detected in these TiAl alloys, such as the ϖ, B19 and B19’ phases [
17,
18,
19,
20]. Recently, the excellent comprehensive property of high Nb containing TiAl alloys led to an evolution in the research of the ϖ phase [
17,
21,
22]. The B19 phase (oC16, Cmcm) was firstly discovered in the modulated α
2 phase with a high degree of super-saturation of Al in Ti-48Al alloy. The modulated microstructure was validated, exhibiting an outstanding balance of strength, creep resistance and tensile ductility [
23]. The study of the transformation conditions between the stable and metastable phases would also benefit the microstructural control significantly. However, the metastable phases in TiAl alloys are currently required to be studied in-depth.
In this paper, a rapid-cooling specimen of Ti-44.5Al-8Nb-2.5V alloy was obtained from the melting and centrifugal casting process to a copper mold. Next, the specimen was annealed at 850 °C; the metastable L12-Ti3Al phase was firstly observed by transmission electron microscopy (TEM). The transformation between the metastable phases and main phases were observed and consequently analyzed through crystallography.
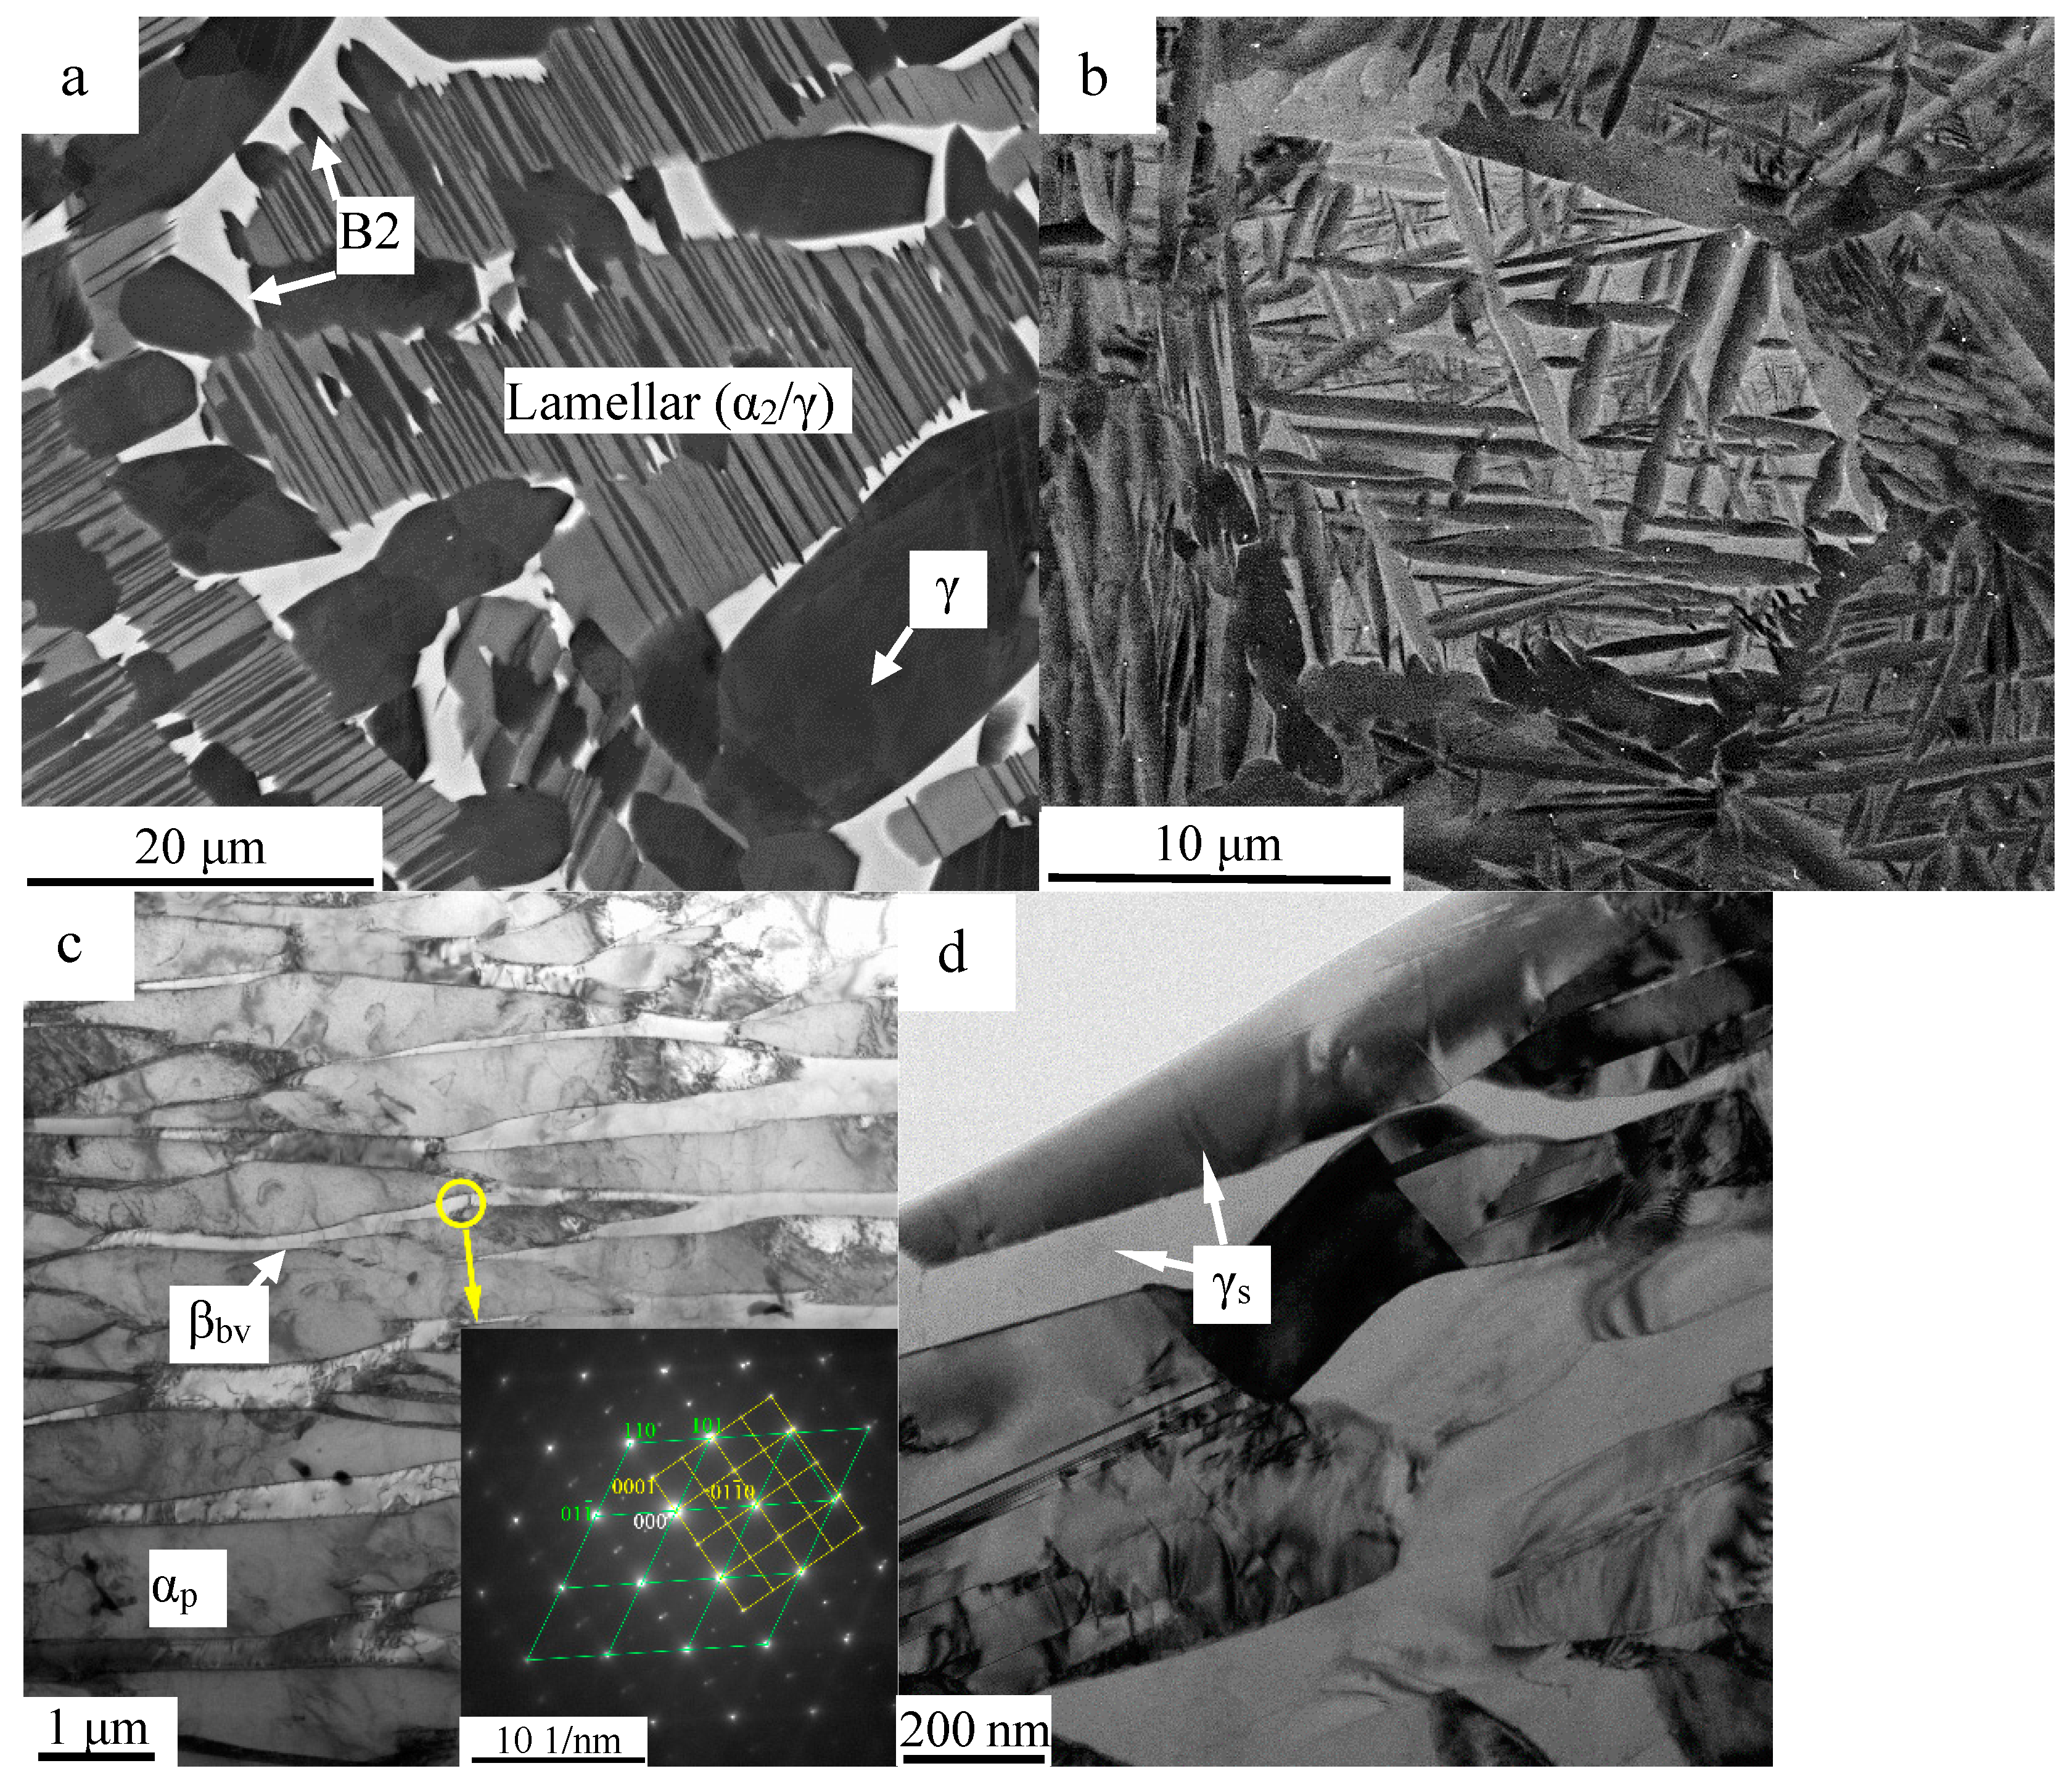
3. Results and Discussion
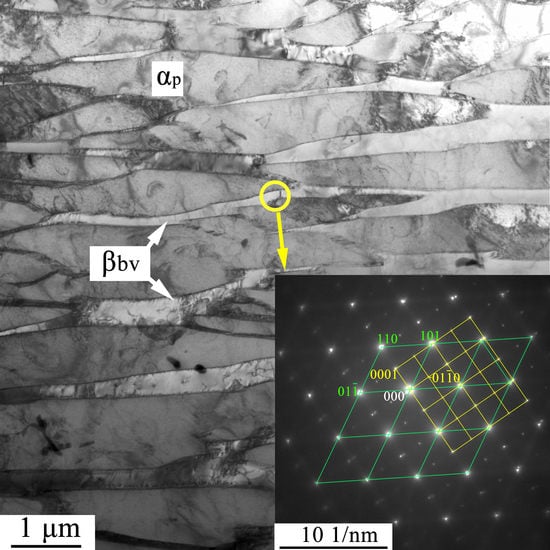
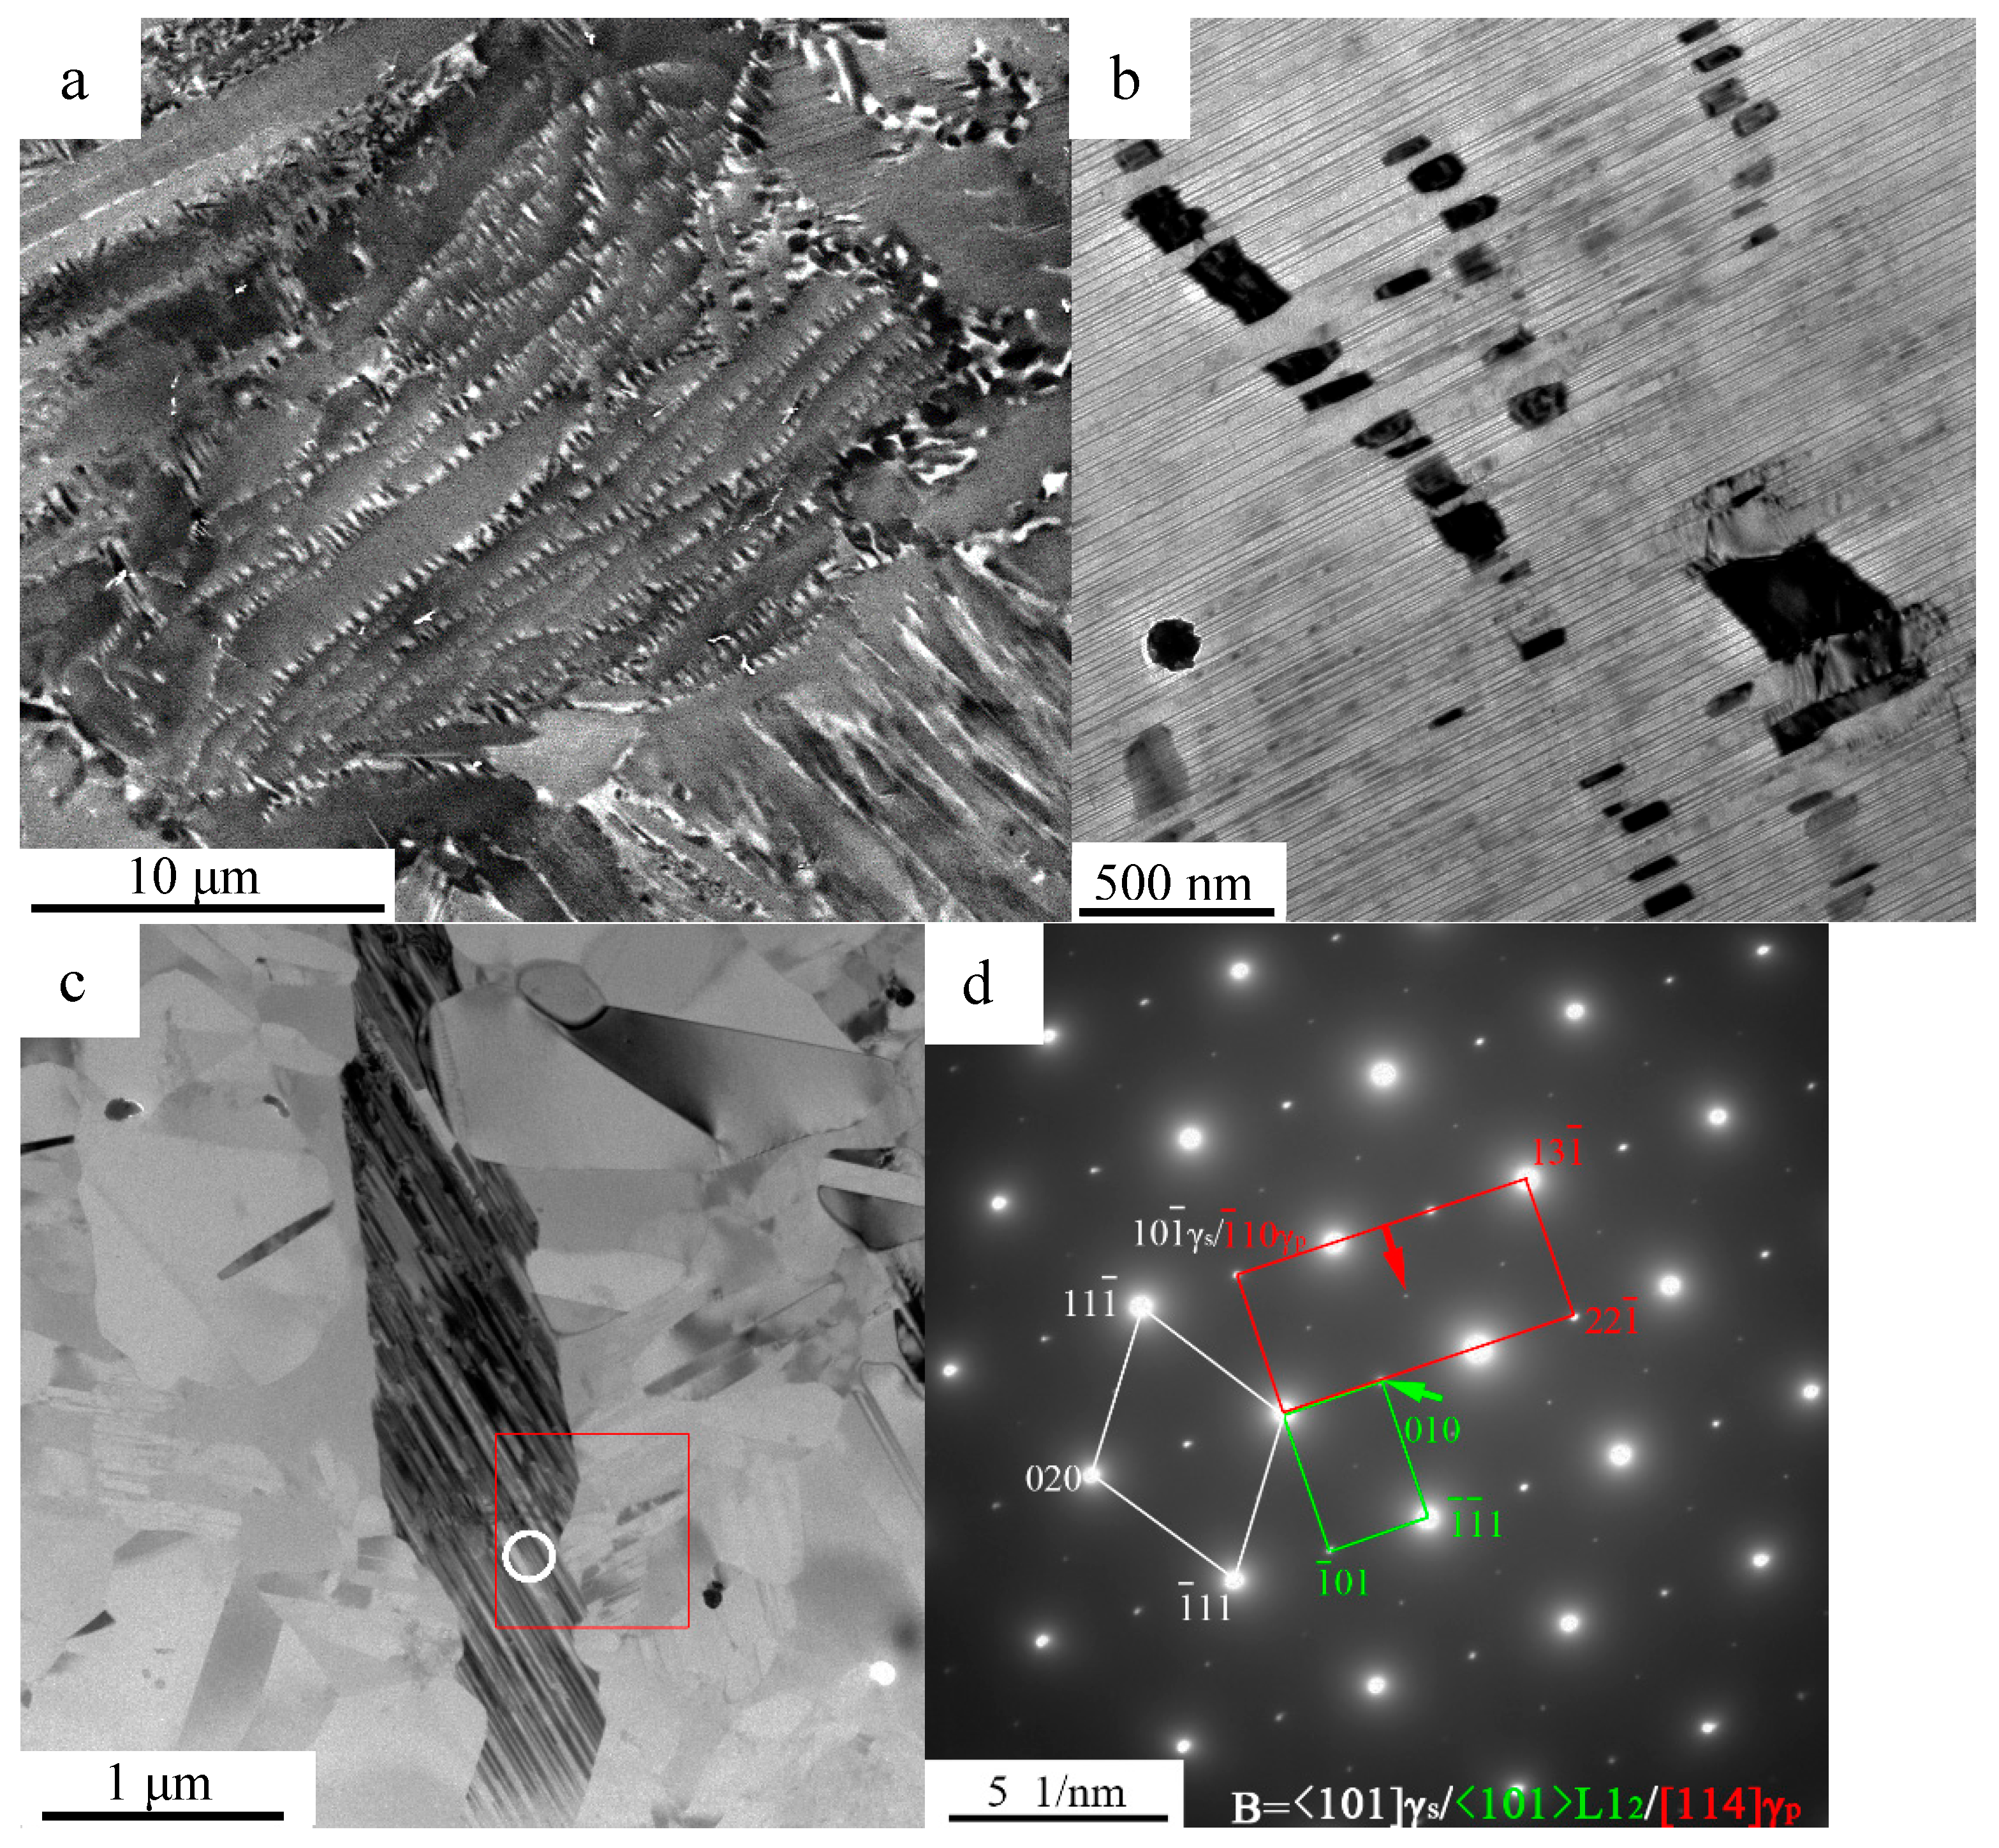
Ti-44.5Al-8Nb-2.5V alloy is a typical β/γ-TiAl alloy, and the white contrast B2 phase included in the as-cast microstructure is depicted in
Figure 1a. In this micrograph, a lamellar (α
2 + γ) colony is spaced by several (β
0 + γ) domains, whereas all major constituent phases are visible and are labeled accordingly. No evident micro-segregation of the alloying elements occurred during the solidification processing. However, the copper-quenched alloy displays a microstructure similarity to the conventional titanium alloys (
Figure 1b–d), being different from the quenched microstructure of conventional γ-TiAl alloys [
24,
25,
26]. The comprehensive analysis of the TEM images in
Figure 1c,d, within the microstructure of the copper-quenched Ti-44.5Al-8Nb-2.5V alloy, demonstrating the plate-like α
2 (α
p) phase surrounded by a basket-weave β
0 (β
bv) phase and the distributed stripe-like γ (γ
s) phase, is presented. In order for the phases in the as-cast microstructure to be differentiated, the phases obtained by massive transformation during quenching are marked as α
p and γ
s. The β
bv parent phase and α
p phase have an orientation relationship of <111>β
bv//<11
0>α
p and {110}β
bv//(0001)α
p (
Figure 1c) correspondingly, indicating the transformation method of the solid-state transformation β → α. Besides, an apparent misfit at approximately 4.74% of the <01
0>α
p//[1
2]β
bv is displayed in the selected area diffraction pattern (SADP). No orientation relationship of the γ
s phase is observed with the α
p or β
bv phase, which is in accordance with studies of massive transformation [
25,
26].
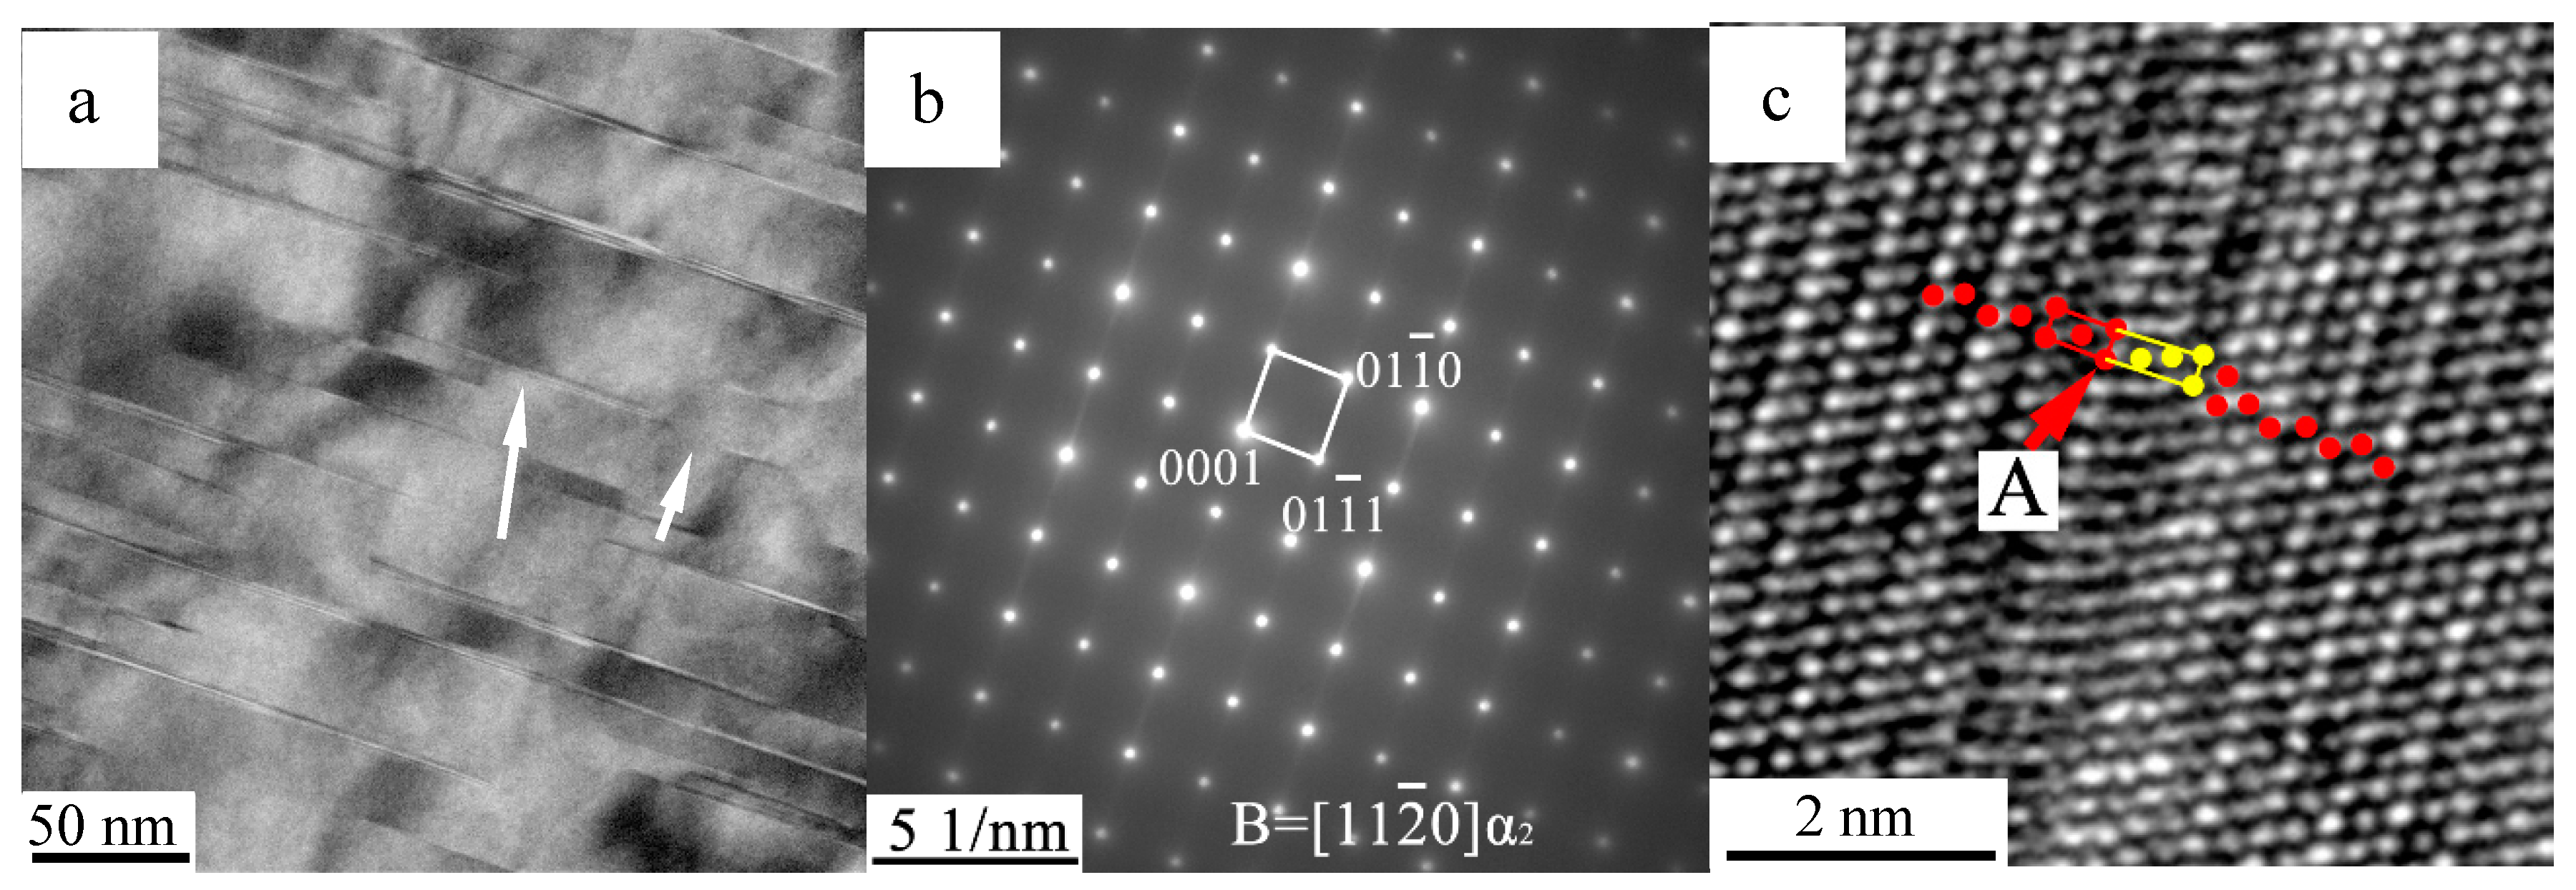
Following annealing at 850 °C (service temperature) for 10 min, no evident phenomena occurred in the quenched samples except the transformation of the α
p phase. As presented in
Figure 2a, a high amount of thin stripes precipitated in the α
p phase, in parallel to the (0001)α
p plane. The lengths of these stripes ranged from the nanoscale to the micrometer scale, whereas the widths are all within a few nanometers. The SADP of the matrix with a stripe demonstrated a streak diffraction along the [0001]α
p direction (
Figure 2b), indicating the intense planar defects, whereas no new phases were demonstrated in the αp phase of the matrix. The HRTEM image of the α
p phase with a stripe is presented in
Figure 2c. As marked in
Figure 2c, the stacking sequence of the α
p phase is of the …ABABAB… sequence, whereas the stripe is a …AB
ABCAB… stacking fault. According to the work of Denquin, the stacking faults in the α
p phase are the pre-nucleation stage of the formation of γ lamellae [
27]. The stacking faults do not represent the γ lamella nuclei, but an embryonic platelet of a metastable face-centered cubic (FCC) phase, as the latter have neither the composition nor the chemical ordering of the γ phase. The stacking fault in the α
p phase was formed by the splitting of a 1/3<11
0> whole dislocation into two Shockley partials with
b = 1/3<01
0> and 1/3<10
0>, as described by Blackburn [
28].
When the samples are heat treated at 850 °C for 5 h, a series of phase transformations occur in the quenched microstructure (
Figure 3a). The most obvious appearance is that the fine lamellar (α
2 + γ) colony is spaced by the basket-weave (β
0 + γ) domains (
Figure 3a,b). The α
p phase transforms to a lamellar structure with an alternate α
2/γ or γ/γ interface, and the average interlamellar spacing is less than 20 nm (
Figure 3b). As mentioned previously, the metastable FCC phases, such as the stacking faults formed by the movement of the Shockley partial dislocations, are the pre-nucleation of γ lamellae. As the annealing duration increased, the chemical composition change by atomic transformations and the ordering reaction of the FCC phase to the γ-L1
0 phase occur, accompanied by the growth of γ lamellae and therefore the gradual fine lamellar (α
2 + γ) colony formation. Generally, twelve different directions of the α
p phases precipitate in the parent β phase corresponding to the orientation relationship. However, the kinetics of the β → β + α phase transformation is quite affected by the heat-flow caused by rapid cooling, i.e., only one direction of the αp dendrite being increased along the [0001]α
p alignment parallel to the heat-flow direction. The subsequent formation of the γ lamellae during the annealing process accords to the Blackburn-orientation relationship (0001)α
p//{111}γ and <11
0>α
p//<1
0]γ, which describes the crystallographic alignment of the γ lamellae with respect to the α
2 lamellae in one parent α
p grain. In summary, the kinetics of the β
bv/α
p transformation determine the grain size of the α
p phase and thus, the size of the final (α
2 + γ) lamellar colonies. Therefore, only one orientation of (α
2 + γ) lamellae occurs in such a prior β
bv and α
p phase domain (
Figure 3b). In reality,
Figure 3b, as presented, can be regarded as a scaled-down version of
Figure 1a. Furthermore, the initial microstructure of the β + α → β + α + γ solid transformation during solidification is quite similar to the initial microstructure of
Figure 1c. Moreover, the microstructure evolutions of the β + α → β + α + γ transformations are quite similar to the phase transformations in
Figure 1c during annealing, because both of the transformations of β + α → β + α + γ and β
bv + α
p → β
0 + α
2 + γ accord to the same orientation relationships. As previously described, the chemical disorder of the α
p and β
bv phases—caused by rapid cooling—supports a major driving force of transformations in the experiments and it is somewhat easier to control of the transforming degrees by the regulation of the annealing parameters.
More complicated phase transformations occur in the γ
s phase. As presented in
Figure 3c, the γ
s phase transforms to a similar microstructure (BD = <10
]γ) as the α
2/γ lamellar structure with nano-scale spacing. This microstructure also displays a similar appearance to the modulated structure of γ/B19 phases [
20]. However, the SADP with BD≤10
]γ (
Figure 3d) demonstrates that the precipitation phases are neither the α
2 phase nor the B19 phase.
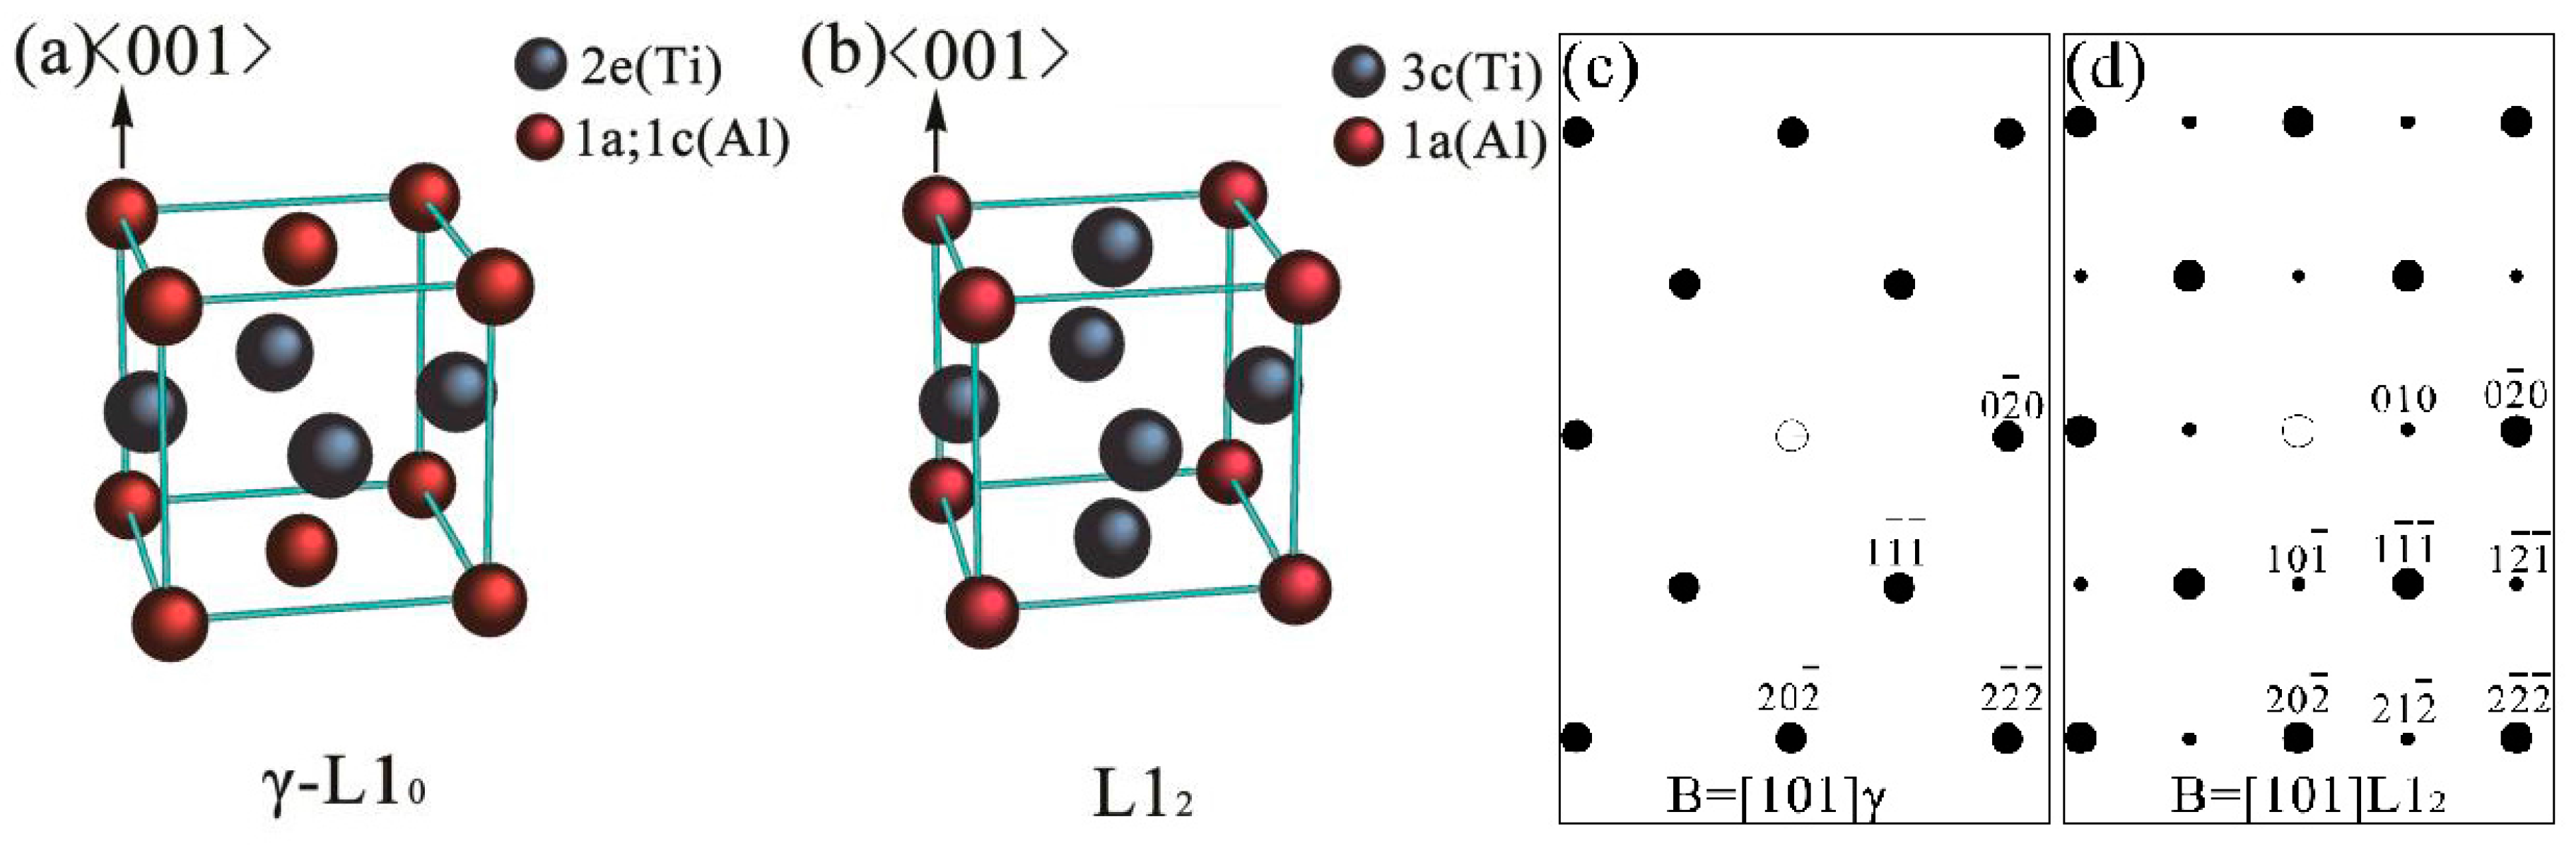
The existence of the metastable L1
2-Ti
3Al phase can be determined through the superlattice analysis and composition distribution. As the HRTEM image of the BD≤10
]γ is presented in
Figure 4c, the BD of the γ phase should be one of the [101], [10
], [011] and [01
] crystal directions but not the [110] or [1
0] according to crystallography analysis. Therefore, the superlattice patterns marked by the green arrow (
Figure 3d) should be the diffraction spots of the L1
2 structural phases. In the ordered L1
2 phase, the Wykoff positions 1a and 3c are occupied by Al and Ti atoms, differentiating the Wykoff positions in the γ phase, as presented in
Figure 5a,b. The schematic SADPs of the L1
2 and γ phases with B = [1
0] are presented in
Figure 5c,d corresponding to the aforementioned analysis.
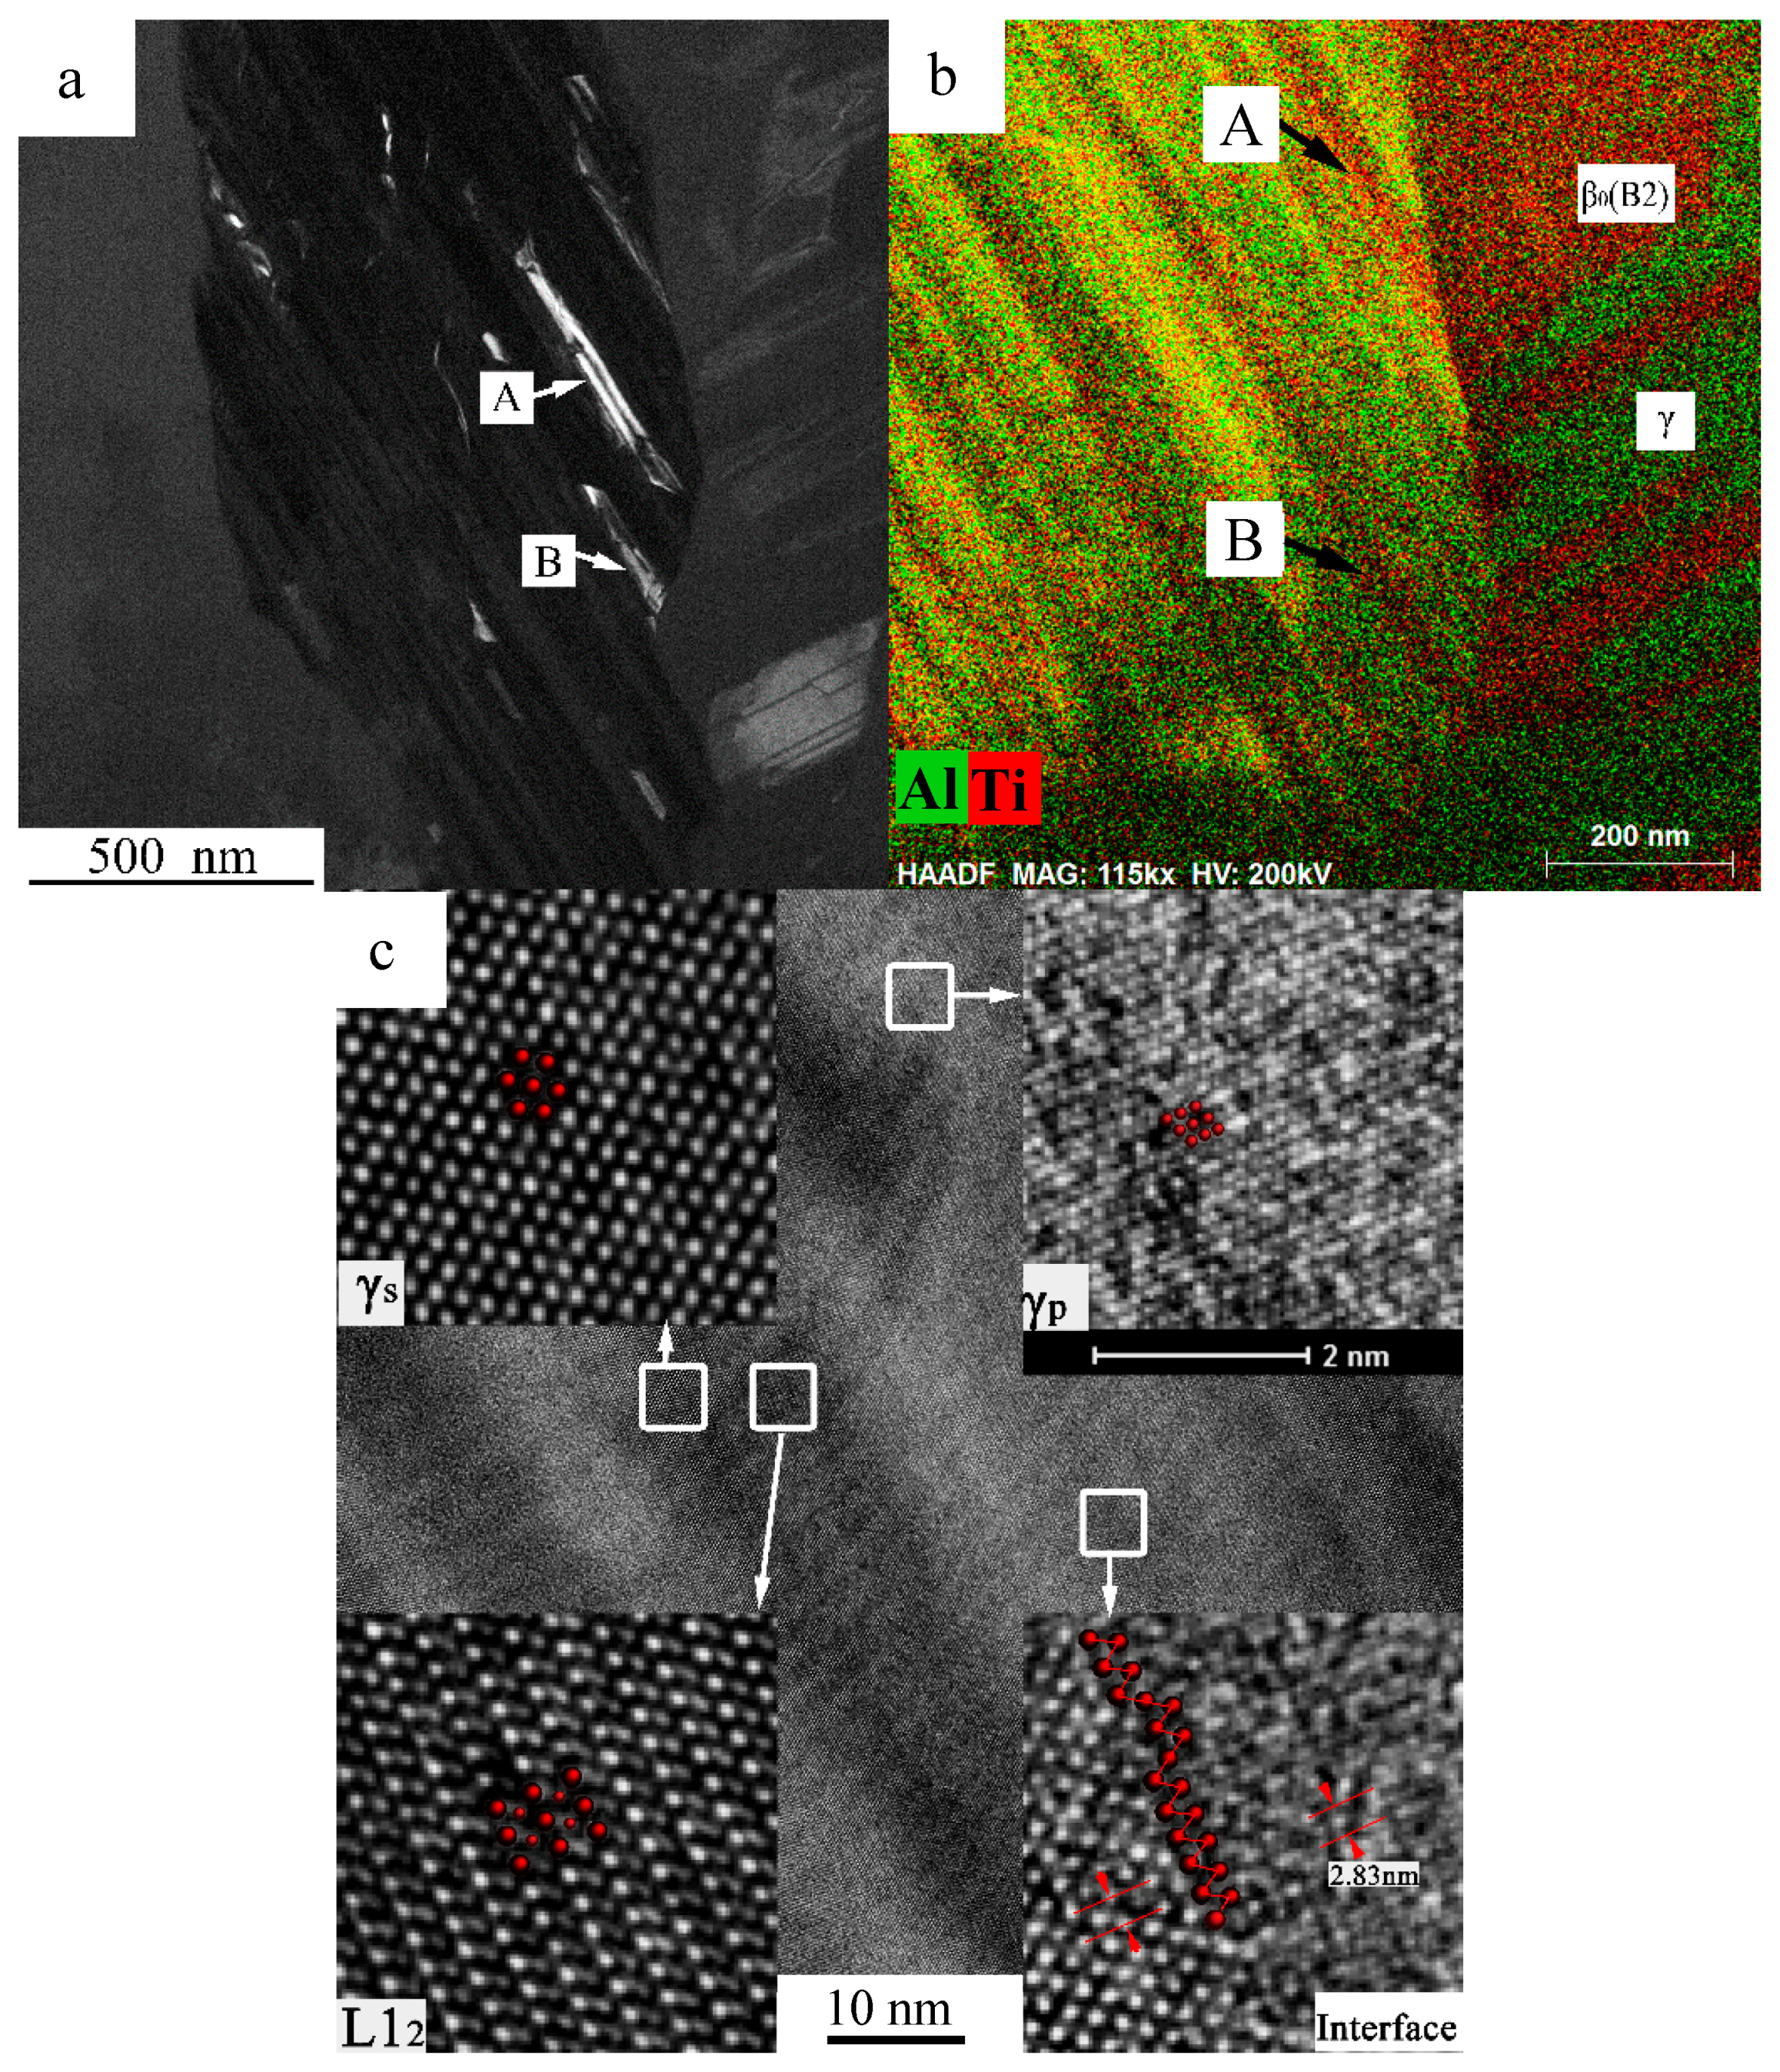
The dark field image regarding the (010)L1
2 superlattice spot (marked by the green arrow in (
Figure 3d)) is conducted inside the red square region in
Figure 3c and the result is displayed in
Figure 4a. The distribution of the L1
2 phase inside the matrix γ
s phase is displayed by the white contrast regions in
Figure 4a. It is observed that two types of the L1
2 phase precipitate with the type I parallel towards the lamellae direction and type II shows a kinked morphology. An area scan image (BD ≤10
]γ
s) was conducted at the same region with the dark field image, as presented in
Figure 4b. The L1
2 phases marked A and B have fine matching correspondences in
Figure 4a,b.
The substance of the γ
s → L1
2 phase transformation is the Al atoms at 1/2 <110] locations being replaced by Ti atoms. Following the transformation, the crystal structure is changed from the face-centered tetragonal to the face-centered cubic according to the orientation relationship of (001)γ//(001)L1
2, [010]γ//[010]L1
2, [100]γ//[100]L1
2 [
29,
30,
31], along with the lattice parameters changed from a = b = 0.3976 nm, c = 0.4049 nm to a = b = c = 0.3994 nm. The lattice misfit induced by the variance of the lattice parameters between the γ and L1
2 phases has an important effect on the precipitation morphology of the L1
2 phase. The lattice misfits are calculated approximately at 0.45% along the [100] and [010] directions, and approximately at 1.37% along the [001] direction. Therefore, the precipitation of the L1
2 phase is restricted along the [001] direction, whereas it rapidly grows along the [100] and [010] directions, acquiring a plate-like shape in morphology parallel to the (001) plane of the γ phase. The aspect ratio of the L1
2 phase changes along with the growth change, resulting in a coherency stress increase. W. H. Tian and H. Nemoto proved that if the coherency stress energy reaches a certain degree, the habit plane of the γ/L1
2 interface will change into another plane to reduce the stress energy [
30], describing the morphology of the type II L1
2 phase clearly. In a similar way, the hyperstructure of the L1
2 phase is presented clearly in the HRTEM image of
Figure 4c. According to the crystallographic analysis of the close-packed plane, the L1
2 phase is of the …ABCABC… (or …ACBACB…) stacking of the α
2 phase, corresponding nicely to the metastable FCC phases in
Figure 2a. In summary, the metastable L1
2 phase is deduced to be an interim phase during the α/α
2↔γ phase transformations.
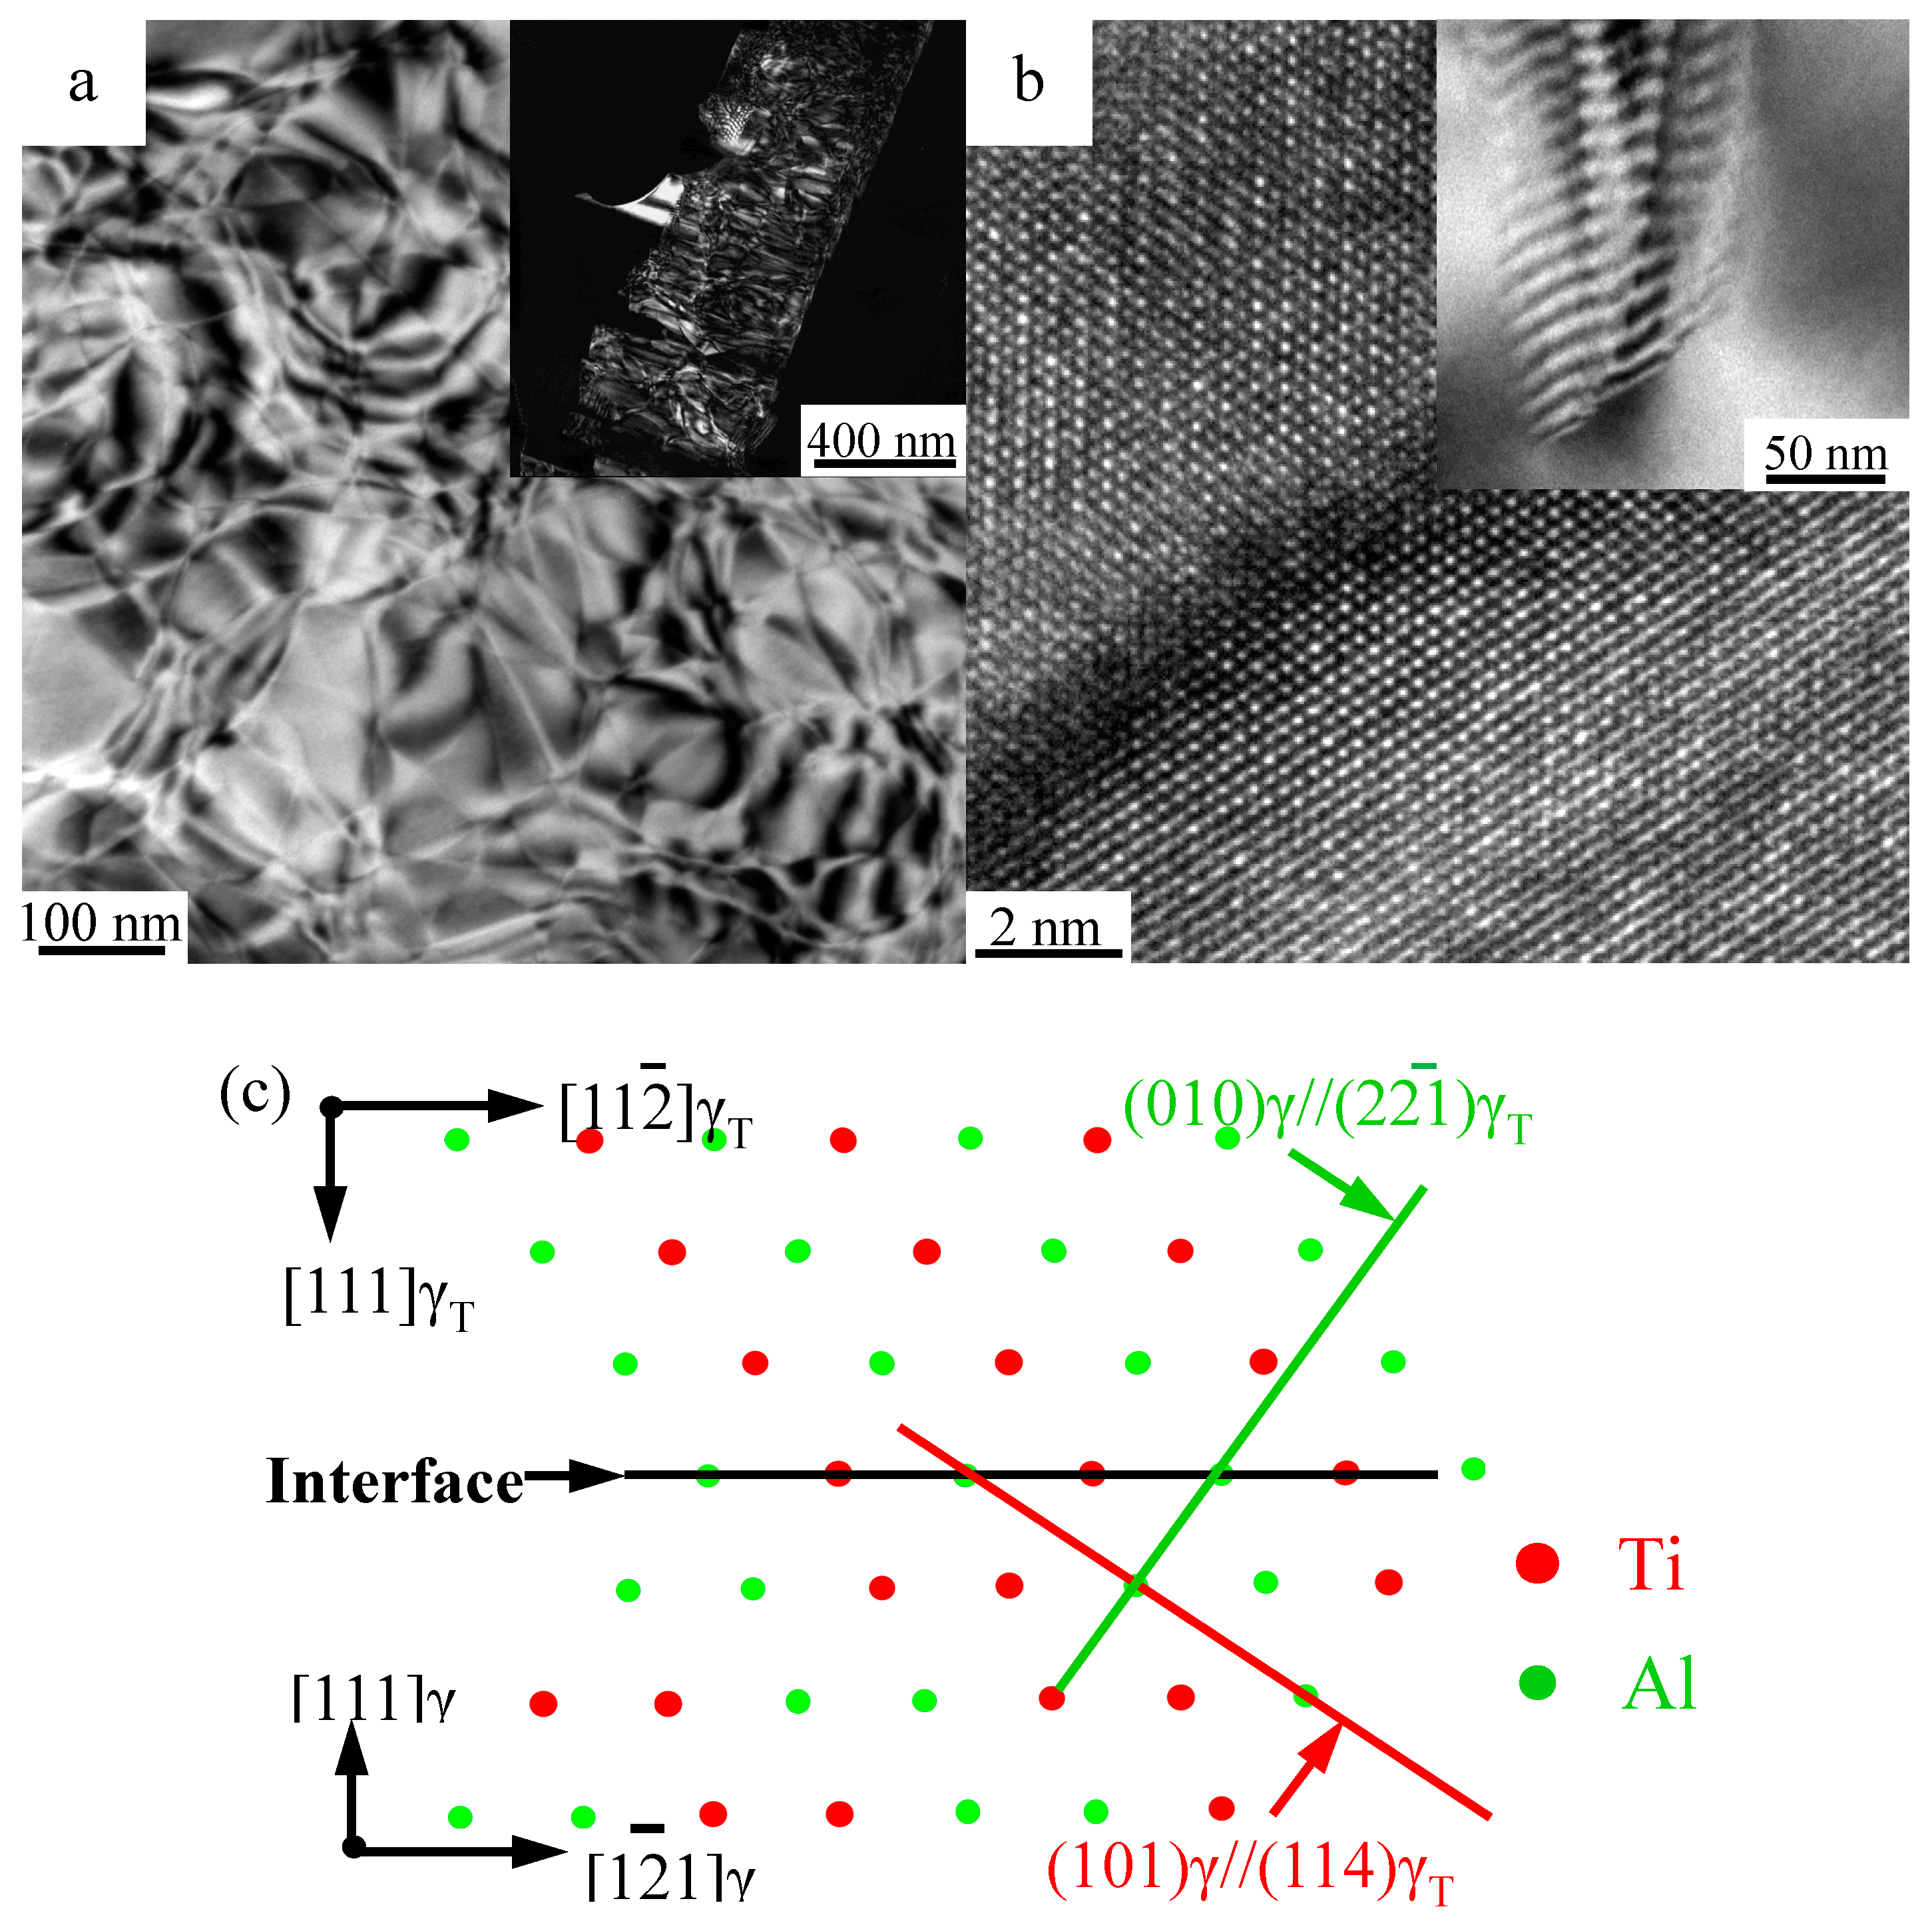
Besides, the superlattice patterns marked by the red arrow in
Figure 3d were rarely mentioned. In the samples, the same SADPs were also obtained in the microstructures transformed from the γ
s phase, as shown in
Figure 6a,b. Differing from the L1
2 phase, the uncertain phase in the lamellae retains a similar composition with the γ
s phase of the matrix (
Figure 3b). The probable methods of the non-diffusion transformation should be the effect of a simplex move of the dislocation or of the martensitic shear transformation. However, the splitting of a 1/3<1
0> perfect dislocation into two Shockley partial dislocations with
b = 1/6<
11> and 1/6<
2
> in the γ phase, i.e., the transforming of stacking sequence …ABCABC… (or …ACBACB….) to …ABABAB…, would induce the γ→B19 transformation [
19]. The α
2 and B19 phases are excluded as previously discussed (
Figure 3d). Similarly, phases martensitically transformed from the γ phase were rarely mentioned.
Another possibility is that the unknown phase is still the γ phase, but it merely has a different orientation, such as the true twin (180°), the pseudotwin (60°) or the 120° order fault domain with an anti-phase boundary (APB), and it is generally termed as the γ twin (γ
T) [
32].
Figure 3d,
Figure 4c present the lattice parameters of the uncertain phase, matching exactly the SADP and HRTEM results of the [114]γ. The orientation relationships between the γ
s matrix and the precipitated γ phase (γ
p) are described as <101]γ
s//<114]γ
p, (10
)γ
s//(
10)γ
p and (0
0)γ
s//(22
)γ
p,, as calibrated in
Figure 3d.
The orientation relationships between the γ/γ
T were usually observed along the close-packed direction of the γ/γ
T interface ({111}<10
> direction), such as the schematic 120° order fault domain model presented in (
Figure 6c). In this model, the common orientation relationships [10
]γ//[1
0]γ
T, (111)γ//(111)γ
T and (1
1)γ//(11
)γ
T are visually presented. Besides, the (101)γ plane marked by the red line has an included angle with the (111)γ/γ
T interface and the angle is calculated as follows:
angle([101]γ, [111]γ) = angle([114]γT, [111]γT) = arccos(√2/√3);
Likewise,
angle([010]γ, [111]γ) = angle([22]γT, [111]γT) = arccos(1/√3);
([101], [010])γ⊥[10]γ; ([114], [22])γT⊥[10]γT.
Consequently if BD = [101]γs//[114]γ
p, the calculated results have good correspondences with the SADP information in
Figure 3d. However, according to the morphology analysis of both the γ
s and γ
p phases, the twin-relationships are still not built up, because of the curved interfaces (
Figure 4c and
Figure 6a,b). According to the work of Denquin, if the migrating velocity of the APB of the γ phase was high enough, the APB would lie at the γ/γ
T interface, and could not be observed [
27]. Therefore, the γ
p phase in this experiment is the pre-twin phase of the matrix γ
s, i.e., the order domains of the γ
s phase. The formation of the γ
s phase is accompanied by a partial composition change, shaping the long range order lattice structure and offering a high chemical energy for low temperature phase transformation. The substance of the γ
s → γ
p phase transformation is an ordering process accompanied by the changing of the
c-axis direction of the γ phase. The low temperature phase transformation is also affected by the comprehensive stress supported by the surrounding phases. According to the phenomena observation, the formation of the γ
p phase and the APBs in a certain γ
s phase are directional. Ultimately, the APBs would partially or completely transform into a superlattice intrinsic stacking fault (SISF), forming the lamellar (γ/γ
T) microstructure. The atomic arrangement and energies across the γ/γ
T interfaces have been systematically studied. The energies of the true twin boundary, the 120° order fault and the pseudotwin are
Γ(180°) = 1/2Γ(SISF)
Γ(120°) = 1/2Γ(APB)
Γ(60°) = Γ(180°) + Γ(120°) [
33].


 ,
, 