
Kinetic Analysis of the Uptake and Release of Fluorescein by Metal-Organic Framework Nanoparticles

Abstract
:
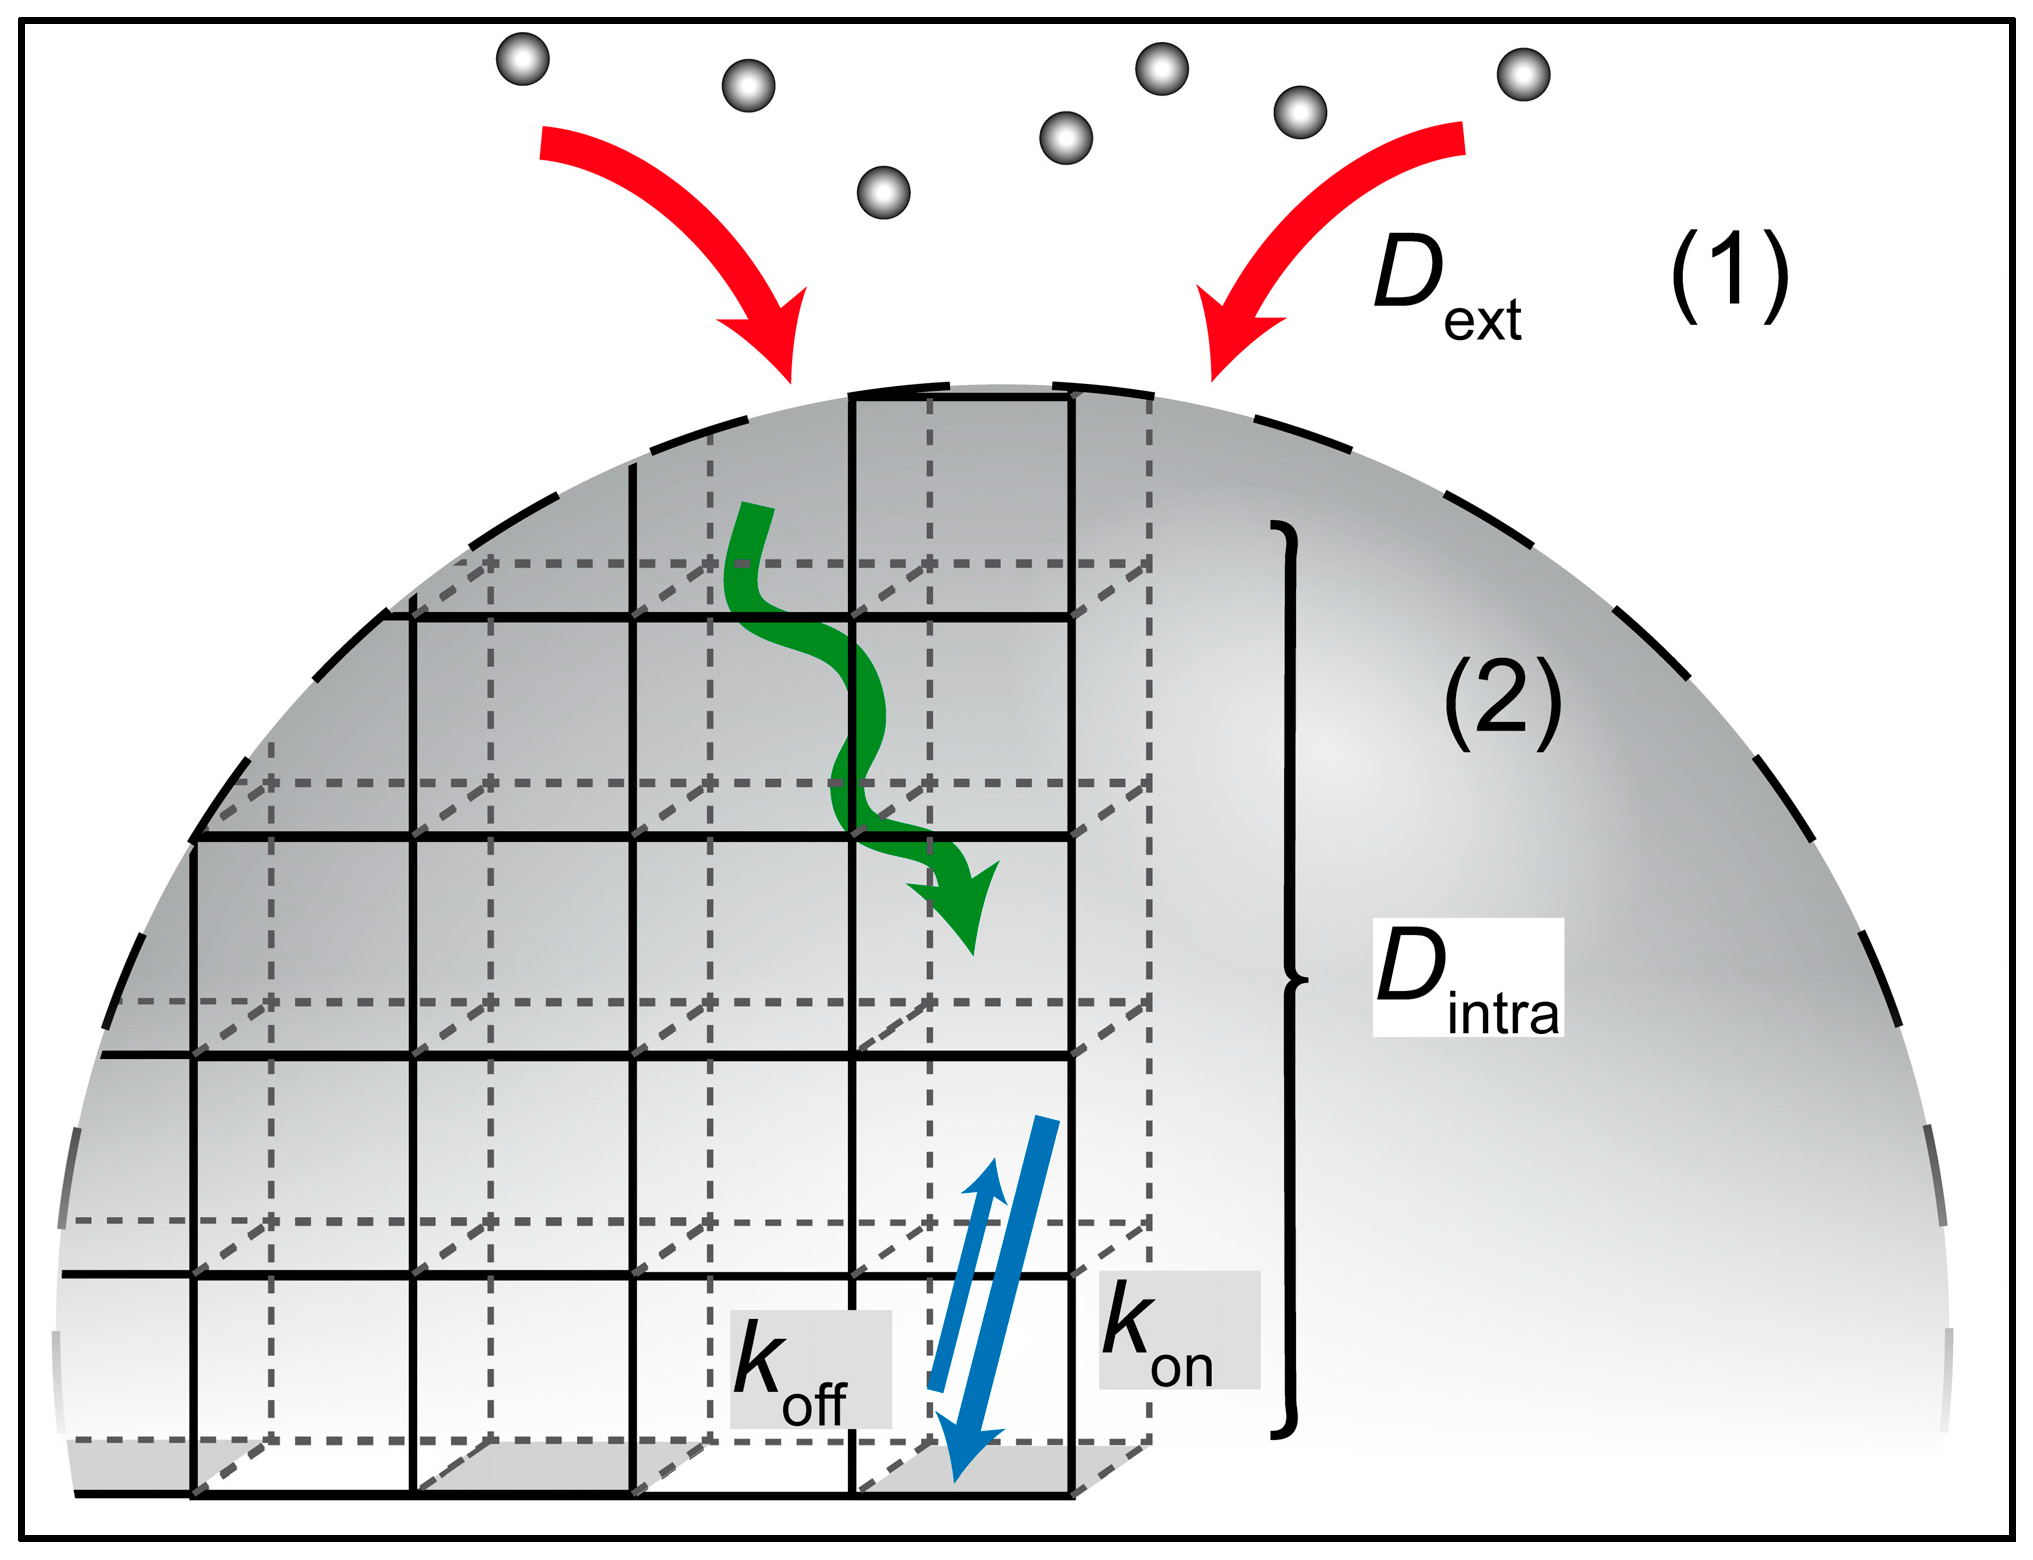
1. Introduction
2. Results and Discussion
3. Materials and Methods
3.1. Equilibrium Measurements
3.2. Kinetics of Loading/Release
4. Conclusions
Supplementary Materials
Acknowledgments
Author Contributions
Conflicts of Interest
References
- Zhou, H.C.; Long, J.R.; Yaghi, O.M. Introduction to Metal-Organic Frameworks. Chem. Rev. 2012, 112, 673–674. [Google Scholar] [CrossRef] [PubMed]
- Zhou, H.-C.; Kitagawa, S. Metal–organic Frameworks (MOFs). Chem. Soc. Rev. 2014, 43, 5415–5418. [Google Scholar] [CrossRef] [PubMed]
- Férey, G. Hybrid Porous Solids: Past, Present, Future. Chem. Soc. Rev. 2008, 37, 191–214. [Google Scholar] [CrossRef] [PubMed]
- Inokuma, Y.; Yoshioka, S.; Ariyoshi, J.; Arai, T.; Hitora, Y.; Takada, K.; Matsunaga, S.; Rissanen, K.; Fujita, M. X-Ray Analysis on the Nanogram to Microgram Scale Using Porous Complexes. Nature 2013, 495, 461–466. [Google Scholar] [CrossRef] [PubMed]
- Furukawa, H.; Cordova, K.; O’Keeffe, M.; Yaghi, O.M. The Chemistry and Applications of Metal-Organic Frameworks. Science 2013, 341, 974–990. [Google Scholar] [CrossRef] [PubMed]
- He, Y.; Zhou, W.; Qian, G.; Chen, B. Methane Storage in Metal–organic Frameworks. Chem. Soc. Rev. 2014, 43, 5657–5678. [Google Scholar] [CrossRef] [PubMed]
- Van de Voorde, B.; Bueken, B.; Denayer, J.; de Vos, D. Adsorptive Separation on Metal-Organic Frameworks in the Liquid Phase. Chem. Soc. Rev. 2014, 43, 5766–5788. [Google Scholar] [CrossRef] [PubMed]
- Corma, A.; García, H.; Llabrés i Xamena, F.X. Engineering Metal Organic Frameworks for Heterogeneous Catalysis. Chem. Rev. 2010, 110, 4606–4655. [Google Scholar] [CrossRef] [PubMed]
- Dhakshinamoorthy, A.; Garcia, H. Metal–organic Frameworks as Solid Catalysts for the Synthesis of Nitrogen-Containing Heterocycles. Chem. Soc. Rev. 2014, 5750, 5750–5765. [Google Scholar] [CrossRef] [PubMed]
- Lee, J.; Farha, O.K.; Roberts, J.; Scheidt, K.A.; Nguyen, S.T.; Hupp, J.T. Metal-Organic Framework Materials as Catalysts. Chem. Soc. Rev. 2009, 38, 1450–1459. [Google Scholar] [CrossRef] [PubMed]
- Kreno, L.E.; Leong, K.; Farha, O.K.; Allendorf, M.; van Duyne, R.P.; Hupp, J.T. Metal–Organic Framework Materials as Chemical Sensors. Chem. Rev. 2012, 112, 1105–1125. [Google Scholar] [CrossRef] [PubMed]
- Falcaro, P.; Ricco, R.; Doherty, C.M.; Liang, K.; Hill, A.J.; Styles, M.J. MOF Positioning Technology and Device Fabrication. Chem. Soc. Rev. 2014, 43, 5513–5560. [Google Scholar] [CrossRef] [PubMed]
- Stavila, V.; Talin, A.A.; Allendorf, M.D. MOF-Based Electronic and Opto-Electronic Devices. Chem. Soc. Rev. 2014, 43, 5994–6010. [Google Scholar] [CrossRef] [PubMed]
- Horcajada, P.; Gref, R.; Baati, T.; Allan, P.K.; Maurin, G.; Couvreur, P.; Férey, G.; Morris, R.E.; Serre, C. Metal–Organic Frameworks in Biomedicine. Chem. Rev. 2012, 112, 1232–1268. [Google Scholar] [CrossRef] [PubMed]
- Giménez-Marqués, M.; Hidalgo, T.; Serre, C.; Horcajada, P. Nanostructured Metal-Organic Frameworks and Their Bio-Related Applications. Coord. Chem. Rev. 2015, 307, 342–360. [Google Scholar] [CrossRef]
- He, C.; Liu, D.; Lin, W. Nanomedicine Applications of Hybrid Nanomaterials Built from Metal–Ligand Coordination Bonds: Nanoscale Metal–Organic Frameworks and Nanoscale Coordination Polymers. Chem. Rev. 2015, 115, 11079–11108. [Google Scholar] [CrossRef] [PubMed]
- Lismont, M.; Dreesen, L. Wuttke, S Metal-Organic Framework Nanoparticles in Photodynamic Therapy: Current Status and Perspectives. Adv. Funct. Mater. 2017. [Google Scholar] [CrossRef]
- Wuttke, S.; Lismont, M.; Escudero, A.; Rungtaweevoranit, B.; Parak, W.J. Positioning Metal-Organic Framework Nanoparticles within the Context of Drug Delivery–A Comparison with Mesoporous Silica Nanoparticles and Dendrimers. Biomaterials 2017. [Google Scholar] [CrossRef] [PubMed]
- Lee, S.; Kapustin, E.A.; Yaghi, O.M. Coordinative Alignment of Molecules in Chiral Metal-Organic Frameworks. Science 2016, 353, 808–811. [Google Scholar] [CrossRef] [PubMed]
- Rungtaweevoranit, B.; Zhao, Y.; Choi, K.M.; Yaghi, O.M. Cooperative Effects at the Interface of Nanocrystalline Metal–organic Frameworks. Nano Res. 2016, 9, 47–58. [Google Scholar] [CrossRef]
- Furukawa, S.; Reboul, J.; Diring, S.; Sumida, K.; Kitagawa, S. Structuring of Metal-Organic Frameworks at the Mesoscopic/macroscopic Scale. Chem. Soc. Rev. 2014, 43, 5700–5734. [Google Scholar] [CrossRef] [PubMed]
- McGuire, C.V.; Forgan, R.S. The Surface Chemistry of Metal-Organic Frameworks. Chem. Commun. 2015, 51, 5199–5217. [Google Scholar] [CrossRef] [PubMed]
- Kundu, T.; Mitra, S.; Patra, P.; Goswami, A.; Díaz Díaz, D.; Banerjee, R. Mechanical Downsizing of a Gadolinium(III)-Based Metal-Organic Framework for Anticancer Drug Delivery. Chem. A Eur. J. 2014, 20, 10514–10518. [Google Scholar] [CrossRef] [PubMed]
- Wuttke, S.; Zimpel, A.; Bein, T.; Braig, S.; Stoiber, K.; Vollmar, A.; Müller, D.; Haastert-Talini, K.; Schaeske, J.; Stiesch, M.; et al. Nanosafety: Validating Metal-Organic Framework Nanoparticles for Their Nanosafety in Diverse Biomedical Applications (Adv. Healthcare Mater. 2/2017). Adv. Healthc. Mater. 2017, 6, 1600818. [Google Scholar] [CrossRef] [PubMed]
- Röder, R.; Preiß, T.; Hirschle, P.; Steinborn, B.; Zimpel, A.; Hoehn, M.; Rädler, J.O.; Bein, T.; Wagner, E.; Wuttke, S.; et al. Multifunctional Nanoparticles by Coordinative Self- Assembly of His-Tagged Units with Metal-Organic Frameworks. J. Am. Chem. Soc. 2017. [Google Scholar] [CrossRef] [PubMed]
- Huxford, R.C.; Della Rocca, J.; Lin, W. Metal-Organic Frameworks as Potential Drug Carriers. Curr. Opin. Chem. Biol. 2010, 14, 262–268. [Google Scholar] [CrossRef] [PubMed]
- Wang, J.; Jin, J.; Li, F.; Li, B.; Liu, J.; Jin, J.; Wang, C.; Zeng, Y.; Wang, Y. Combined Experimental and Theoretical Insight into the Drug Delivery of Nanoporous Metal-Organic Frameworks. RCS Adv. 2015, 5, 85606–85612. [Google Scholar] [CrossRef]
- Bernini, M.C.; Fairen-Jimenez, D.; Pasinetti, M.; Ramirez-Pastor, A.J.; Snurr, R.Q. Screening of Bio-Compatible Metal-Organic Frameworks as Potential Drug Carriers Using Monte Carlo Simulations. J. Mater. Chem. B 2014, 2, 766–774. [Google Scholar] [CrossRef]
- Horcajada, P.; Chalati, T.; Serre, C.; Gillet, B.; Sebrie, C.; Baati, T.; Eubank, J.F.; Heurtaux, D.; Clayette, P.; Kreuz, C.; et al. Porous Metal-Organic-Framework Nanoscale Carriers as a Potential Platform for Drug Delivery and Imaging. Nat. Mater. 2010, 9, 172–178. [Google Scholar] [CrossRef] [PubMed]
- Horcajada, P.; Surblé, S.; Serre, C.; Hong, D.-Y.; Seo, Y.-K.; Chang, J.-S.; Grenèche, J.-M.; Margiolaki, I.; Férey, G. Synthesis and Catalytic Properties of MIL-100(Fe), an iron(III) Carboxylate with Large Pores. Chem. Commun. 2007, 100, 2820–2822. [Google Scholar] [CrossRef] [PubMed]
- Férey, G.; Mellot-Draznieks, C.; Serre, C.; Millange, F.; Dutour, J.; Surblé, S.; Margiolaki, I. A Chromium Terephthalate-Based Solid with Unusually Large Pore Volumes and Surface Area. Science 2005, 309, 2040–2042. [Google Scholar] [CrossRef] [PubMed]
- Llewellyn, P.L.; Bourrelly, S.; Serre, C.; Vimont, A.; Daturi, M.; Hamon, L.; de Weireld, G.; Chang, J.S.; Hong, D.-Y.; Hwang, Y.K.; et al. High Uptakes of CO2 and CH4 in Mesoporous Metal-Organic Frameworks MIL-100 and MIL-101. Langmuir 2008, 24, 7245–7250. [Google Scholar] [CrossRef] [PubMed]
- Walton, K.S.; Snurr, R.Q. Applicability of the BET Method for Determining Surface Areas of Microporous Metal-Organic Frameworks. J. Am. Chem. Soc. 2007, 129, 8552–8556. [Google Scholar] [CrossRef] [PubMed]
- Jhung, S.H.; Lee, J.H.; Yoon, J.W.; Serre, C.; Férey, G.; Chang, J.S. Microwave Synthesis of Chromium Terephthalate MIL-101 and Its Benzene Sorption Ability. Adv. Mater. 2007, 19, 121–124. [Google Scholar] [CrossRef]
- García Márquez, A.; Demessence, A.; Platero-Prats, A.E.; Heurtaux, D.; Horcajada, P.; Serre, C.; Chang, J.S.; Férey, G.; de La Peña-O’Shea, V.A.; Boissière, C.; et al. Green Microwave Synthesis of MIL-100(Al, Cr, Fe) Nanoparticles for Thin-Film Elaboration. Eur. J. Inorg. Chem. 2012, 100, 5165–5174. [Google Scholar] [CrossRef]
- Zimpel, A.; Preiß, T.; Röder, R.; Engelke, H.; Ingrisch, M.; Peller, M.; Rädler, J.O.; Wagner, E.; Bein, T.; Lächelt, U.; et al. Imparting Functionality to MOF Nanoparticles by External Surface Selective Covalent Attachment of Polymers. Chem. Mater. 2016, 28, 3318–3326. [Google Scholar] [CrossRef]
- Kim, B.; Han, G.; Toley, B.J.; Kim, C.; Rotello, V.M.; Forbes, N.S. Tuning Payload Delivery in Tumour Cylindroids Using Gold Nanoparticles. Nat. Nanotechnol. 2010, 5, 465–472. [Google Scholar] [CrossRef] [PubMed]
- Andersson, J.; Rosenholm, J.; Areva, S.; Lindén, M. Influences of Material Characteristics on Ibuprofen Drug Loading and Release Profiles from Ordered Micro-and Mesoporous Silica Matrices. Chem. Mater. 2004, 16, 4160–4167. [Google Scholar] [CrossRef]
- Goesmann, H.; Feldmann, C. Nanoparticulate Functional Materials. Angew. Chem. Int. Ed. 2010, 49, 1362–1395. [Google Scholar] [CrossRef] [PubMed]
- Mura, S.; Nicolas, J.; Couvreur, P. Stimuli-Responsive Nanocarriers for Drug Delivery. Nat. Mater. 2013, 12, 991–1003. [Google Scholar] [CrossRef] [PubMed]
- Farokhzad, O.C.; Langer, R. Impact of Nanotechnology on Drug Delivery. ACS Nano 2009, 3, 16–20. [Google Scholar] [CrossRef] [PubMed]
- Li, Z.; Barnes, J.C.; Bosoy, A.; Stoddart, J.F.; Zink, J.I. Mesoporous Silica Nanoparticles in Biomedical Applications. Chem. Soc. Rev. 2012, 41, 2590–2605. [Google Scholar] [CrossRef] [PubMed]
- Chou, L.Y.T.; Ming, K.; Chan, W.C.W.; Smith, A.M.; Nie, S.M.; Eustis, S.; El-Sayed, M.A.; Lu, A.H.; Salabas, E.L.; Schuth, F.; et al. Strategies for the Intracellular Delivery of Nanoparticles. Chem. Soc. Rev. 2011, 40, 233–245. [Google Scholar] [CrossRef] [PubMed]
- Zhao, Y.; Ren, W.; Zhong, T.; Zhang, S.; Huang, D.; Guo, Y.; Yao, X.; Wang, C.; Zhang, W.-Q.; Zhang, X.; et al. Tumor-Specific pH-Responsive Peptide-Modified pH-Sensitive Liposomes Containing Doxorubicin for Enhancing Glioma Targeting and Anti-Tumor Activity. J. Control. Release 2016, 222, 56–66. [Google Scholar] [CrossRef] [PubMed]
- Kamarudin, N.H.N.; Jalil, A.A.; Triwahyono, S.; Artika, V.; Salleh, N.F.M.; Karim, A.H.; Jaafar, N.F.; Sazegar, M.R.; Mukti, R.R.; Hameed, B.H.; et al. Variation of the Crystal Growth of Mesoporous Silica Nanoparticles and the Evaluation to Ibuprofen Loading and Release. J. Colloid Interface Sci. 2014, 421, 6–13. [Google Scholar] [CrossRef] [PubMed]
- Xiao, X.; Liu, Y.; Guo, M.; Fei, W.; Zheng, H.; Zhang, R.; Zhang, Y.; Wei, Y.; Zheng, G.; Li, F. pH-Triggered Sustained Release of Arsenic Trioxide by Polyacrylic Acid Capped Mesoporous Silica Nanoparticles for Solid Tumor Treatment in Vitro and in Vivo. J. Biomater. Appl. 2016, 31, 23–25. [Google Scholar] [CrossRef] [PubMed]
- Zürner, A.; Kirstein, J.; Döblinger, M.; Bräuchle, C.; Bein, T. Visualizing Single-Molecule Diffusion in Mesoporous Materials. Nature 2007, 450, 705–708. [Google Scholar] [CrossRef] [PubMed]
- Medved, I.; Cerny, R. Surface Diffusion in Porous Media: A Critical Review. Microporous Mesoporous Mater. 2011, 142, 405–422. [Google Scholar] [CrossRef]
- Han, S.; Hermans, T.M.; Fuller, P.E.; Wei, Y.; Grzybowski, B.A. Transport into Metal-Organic Frameworks from Solution Is Not Purely Diffusive. Angew. Chem. Int. Ed. 2012, 51, 2662–2666. [Google Scholar] [CrossRef] [PubMed]
- Titze, T.; Lauerer, A.; Heinke, L.; Chmelik, C.; Zimmermann, N.E.R.; Keil, F.J.; Ruthven, D.M.; Kärger, J. Transport in Nanoporous Materials Including MOFs: The Applicability of Fick’s Laws. Angew. Chem. Int. Ed. 2015, 54, 14580–14583. [Google Scholar] [CrossRef] [PubMed]
- Wuttke, S.; Braig, S.; Preiß, T.; Zimpel, A.; Sicklinger, J.; Bellomo, C.; Rädler, J.O.; Vollmar, A.M.; Bein, T. MOF Nanoparticles Coated by Lipid Bilayers and Their Uptake by Cancer Cells. Chem. Commun. 2015, 51, 15752–15755. [Google Scholar] [CrossRef] [PubMed]
- Hirschle, P.; Preiß, T.; Auras, F.; Pick, A.; Völkner, J.; Valdepérez, D.; Witte, G.; Parak, W.J.; Rädler, J.O.; Wuttke, S. Exploration of MOF Nanoparticle Sizes Using Various Physical Characterization Methods—Is What You Measure What You Get? CrystEngComm 2016, 18, 4359–4368. [Google Scholar] [CrossRef]
- Sun, S. Monodisperse FePt Nanoparticles and Ferromagnetic FePt Nanocrystal Superlattices. Science 2000, 287, 1989–1992. [Google Scholar] [CrossRef] [PubMed]
- Park, J.; Lee, E.; Hwang, N.-M.; Kang, M.; Kim, S.C.; Hwang, Y.; Park, J.-G.; Noh, H.-J.; Kim, J.-Y.; Park, J.-H.; et al. One-Nanometer-Scale Size-Controlled Synthesis of Monodisperse Magnetic Iron Oxide Nanoparticles. Angew. Chem. Int. Ed. 2005, 44, 2873–2877. [Google Scholar] [CrossRef] [PubMed]
- Anand, R.; Borghi, F.; Manoli, F.; Manet, I.; Agostoni, V.; Reschiglian, P.; Gref, R.; Monti, S. Host-Guest Interactions in Fe(III)-Trimesate MOF Nanoparticles Loaded with Doxorubicin. J. Phys. Chem. B 2014, 118, 8532–8539. [Google Scholar] [CrossRef] [PubMed]
- Tay, C.Y.; Setyawati, M.I.; Xie, J.; Parak, W.J.; Leong, D.T. Back to Basics: Exploiting the Innate Physico-Chemical Characteristics of Nanomaterials for Biomedical Applications. Adv. Funct. Mater. 2014, 24, 5936–5955. [Google Scholar] [CrossRef]
- Agostoni, V.; Horcajada, P.; Noiray, M.; Malanga, M.; Aykaç, A.; Jicsinszky, L.; Vargas-Berenguel, A.; Semiramoth, N.; Daoud-Mahammed, S.; Nicolas, V.; et al. A “green” Strategy to Construct Non-Covalent, Stable and Bioactive Coatings on Porous MOF Nanoparticles. Sci. Rep. 2015, 5, 7925. [Google Scholar] [CrossRef] [PubMed]
- Geisow, M.J.; Evans, W.H. pH in the Endosome. Measurements during Pinocytosis and Receptor-Mediated Endocytosis. Exp. Cell Res. 1984, 150, 36–46. [Google Scholar] [CrossRef]
- Adam, G.; Delbrueck, M. Reduction of Dimensionality in Biological Diffusive Processes. In Structural Chemistry and Molecular Biology; Rich, A., Davidson, N., Eds.; Freeman: San Francisco, CA, USA, 1968; pp. 198–215. [Google Scholar]
- Heinke, L.; Gu, Z.; Wöll, C. The Surface Barrier Phenomenon at the Loading of Metal-Organic Frameworks. Nat. Commun. 2014, 5, 4562. [Google Scholar] [CrossRef] [PubMed]


| pH | Rates of Decay (10–3·s–1) (from Exponential Fit) | Characteristic TIME Scales (s) |
|---|---|---|
| Water | 13 ± 10 | 74.5 ± |
| 4.1 | 10 ± 4 | 103.6 ± |
| 5.1 | 10 ± 2 | 98.5 ± |
| 6.2 | 6 ± 2 | 169.9 ± |
| 7.1 | - | - |
| 7.4 | - | - |
| 8.4 | - | - |
© 2017 by the authors. Licensee MDPI, Basel, Switzerland. This article is an open access article distributed under the terms and conditions of the Creative Commons Attribution (CC BY) license ( http://creativecommons.org/licenses/by/4.0/).
Share and Cite
Preiß, T.; Zimpel, A.; Wuttke, S.; Rädler, J.O. Kinetic Analysis of the Uptake and Release of Fluorescein by Metal-Organic Framework Nanoparticles. Materials 2017, 10, 216. https://doi.org/10.3390/ma10020216
Preiß T, Zimpel A, Wuttke S, Rädler JO. Kinetic Analysis of the Uptake and Release of Fluorescein by Metal-Organic Framework Nanoparticles. Materials. 2017; 10(2):216. https://doi.org/10.3390/ma10020216
Chicago/Turabian StylePreiß, Tobias, Andreas Zimpel, Stefan Wuttke, and Joachim O. Rädler. 2017. "Kinetic Analysis of the Uptake and Release of Fluorescein by Metal-Organic Framework Nanoparticles" Materials 10, no. 2: 216. https://doi.org/10.3390/ma10020216