
SCC of 2304 Duplex Stainless Steel—Microstructure, Residual Stress and Surface Grinding Effects

Abstract
:1. Introduction
2. Experimental
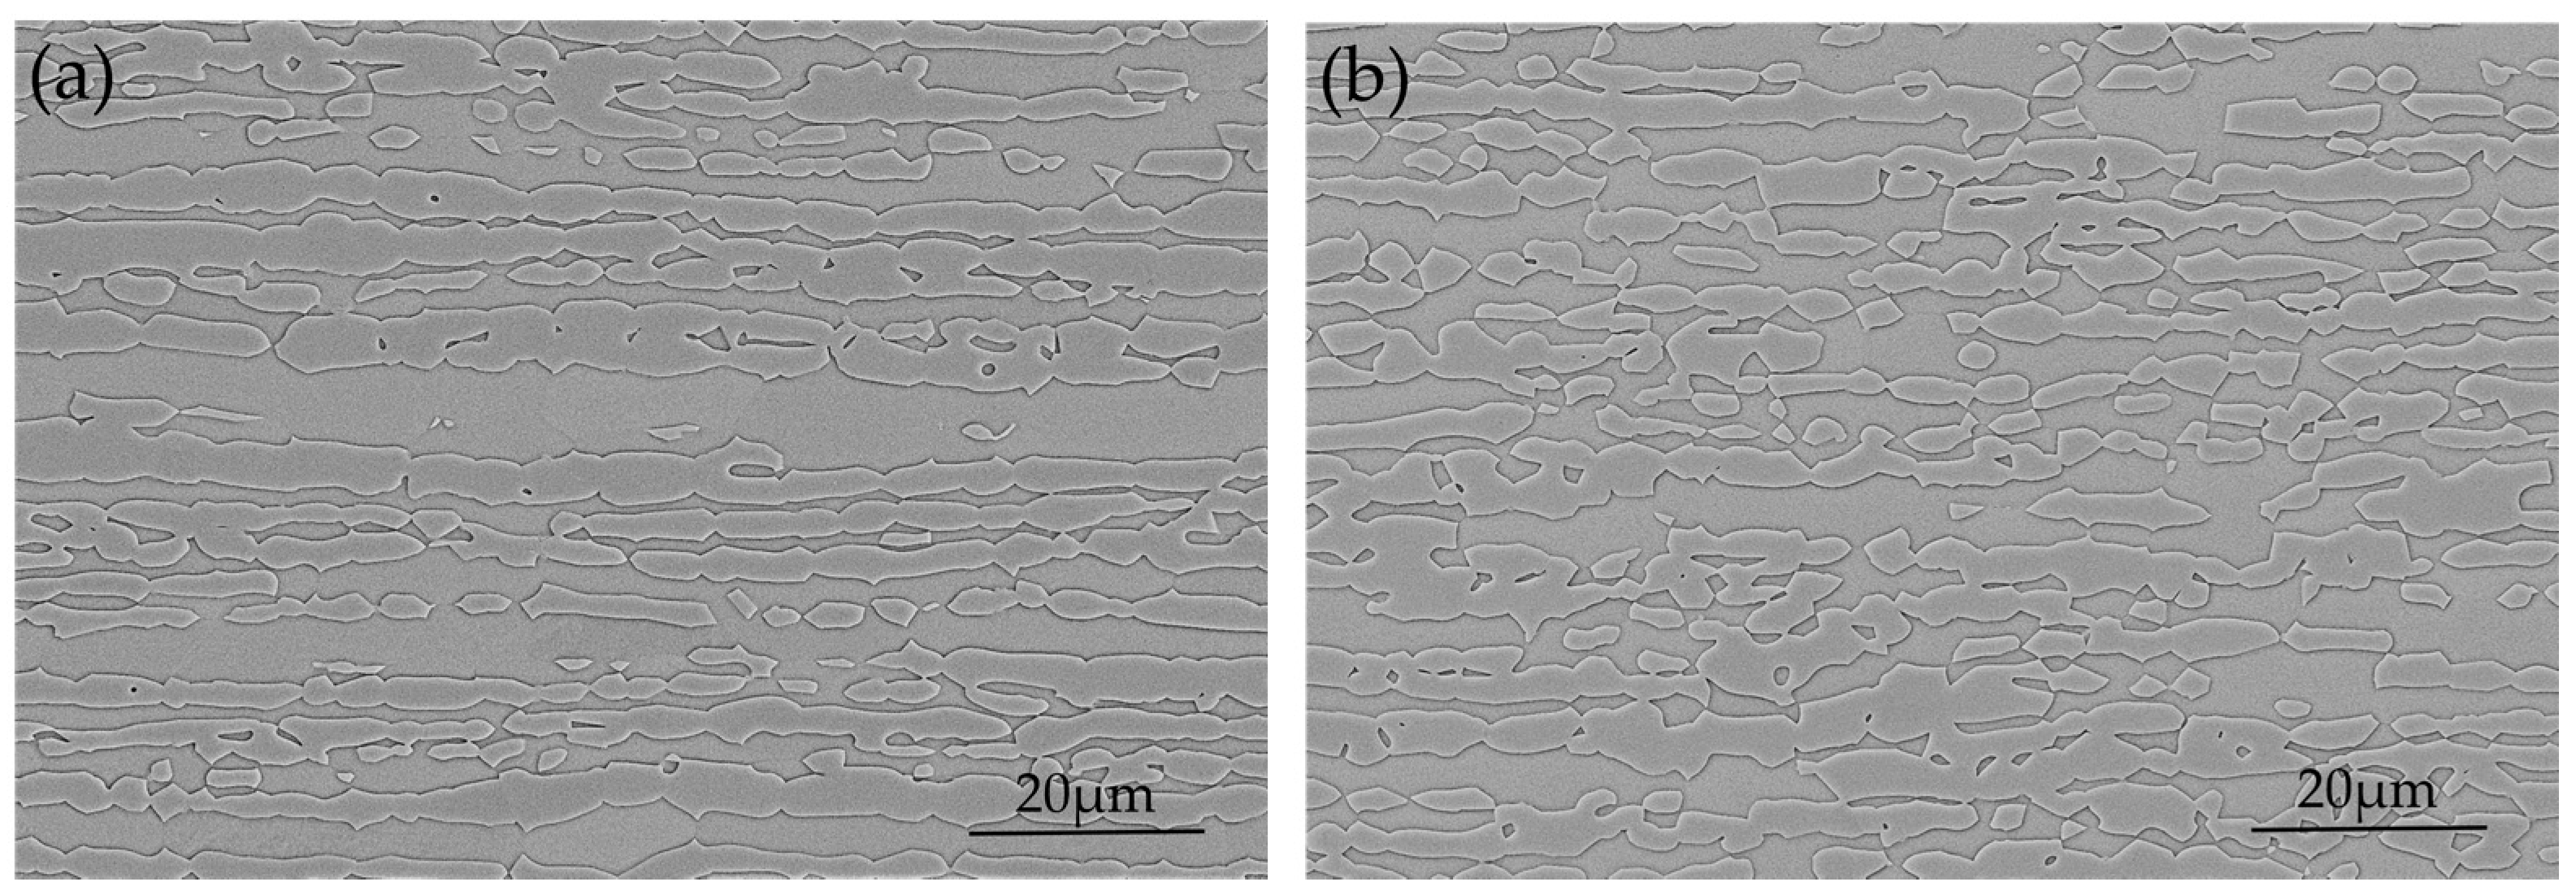
2.1. Material
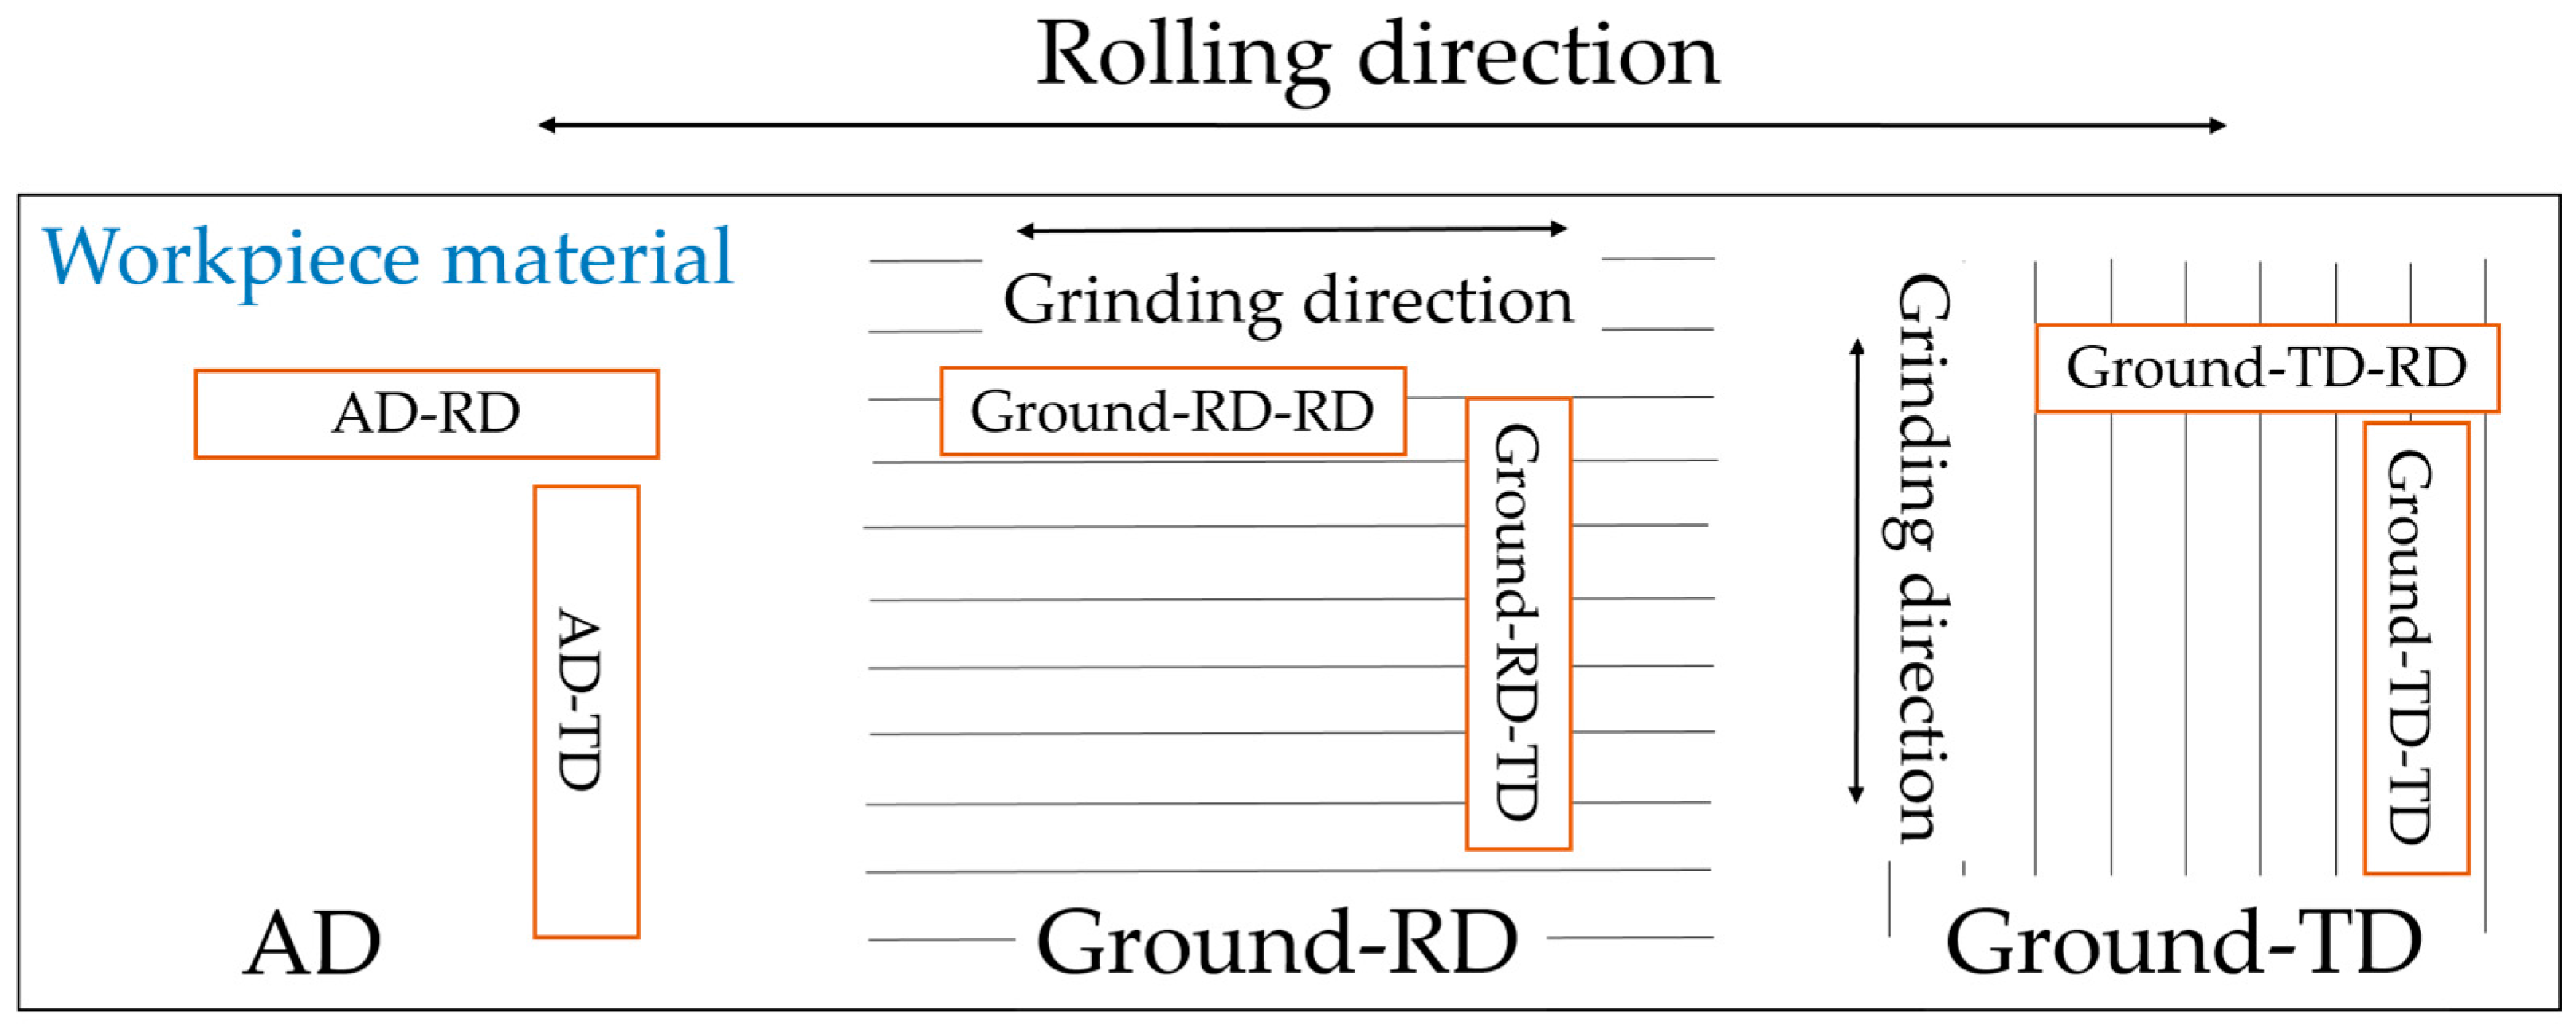
2.2. Grinding Operation
2.3. Corrosion Tests
2.4. Material Characterization
3. Results
3.1. Pre-Corrosion Characterization
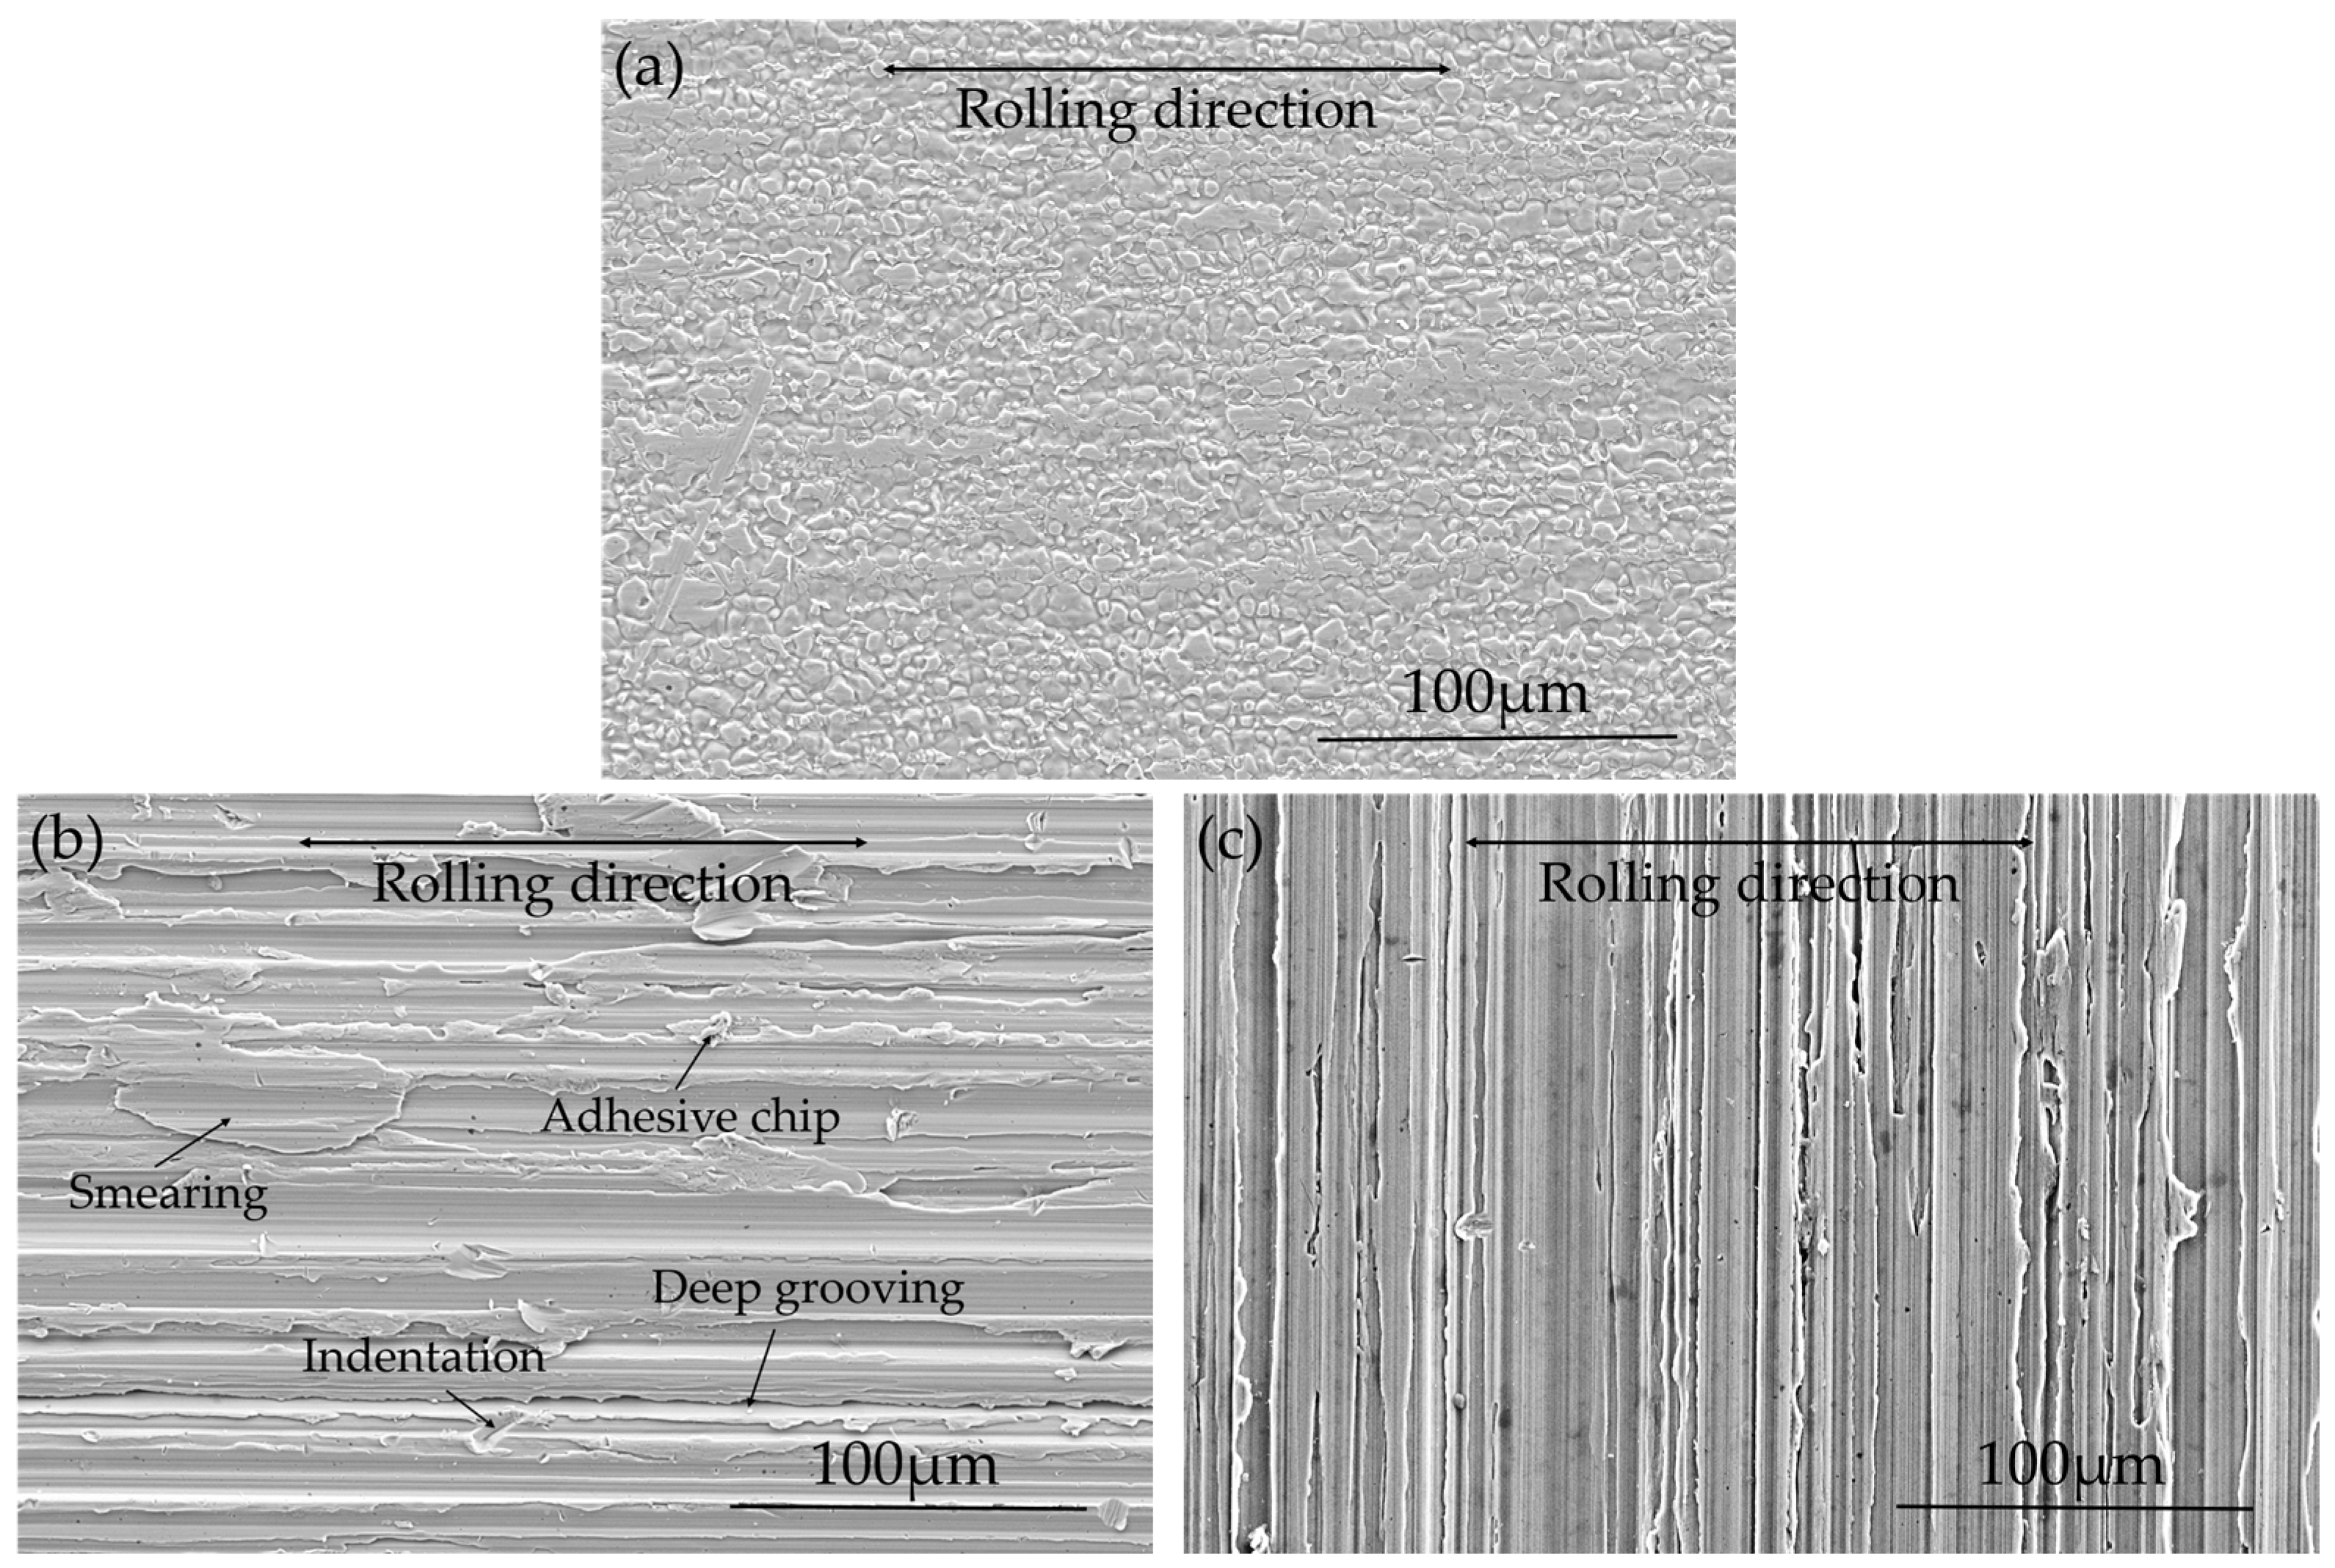
3.1.1. Surface Topography and Surface Roughness
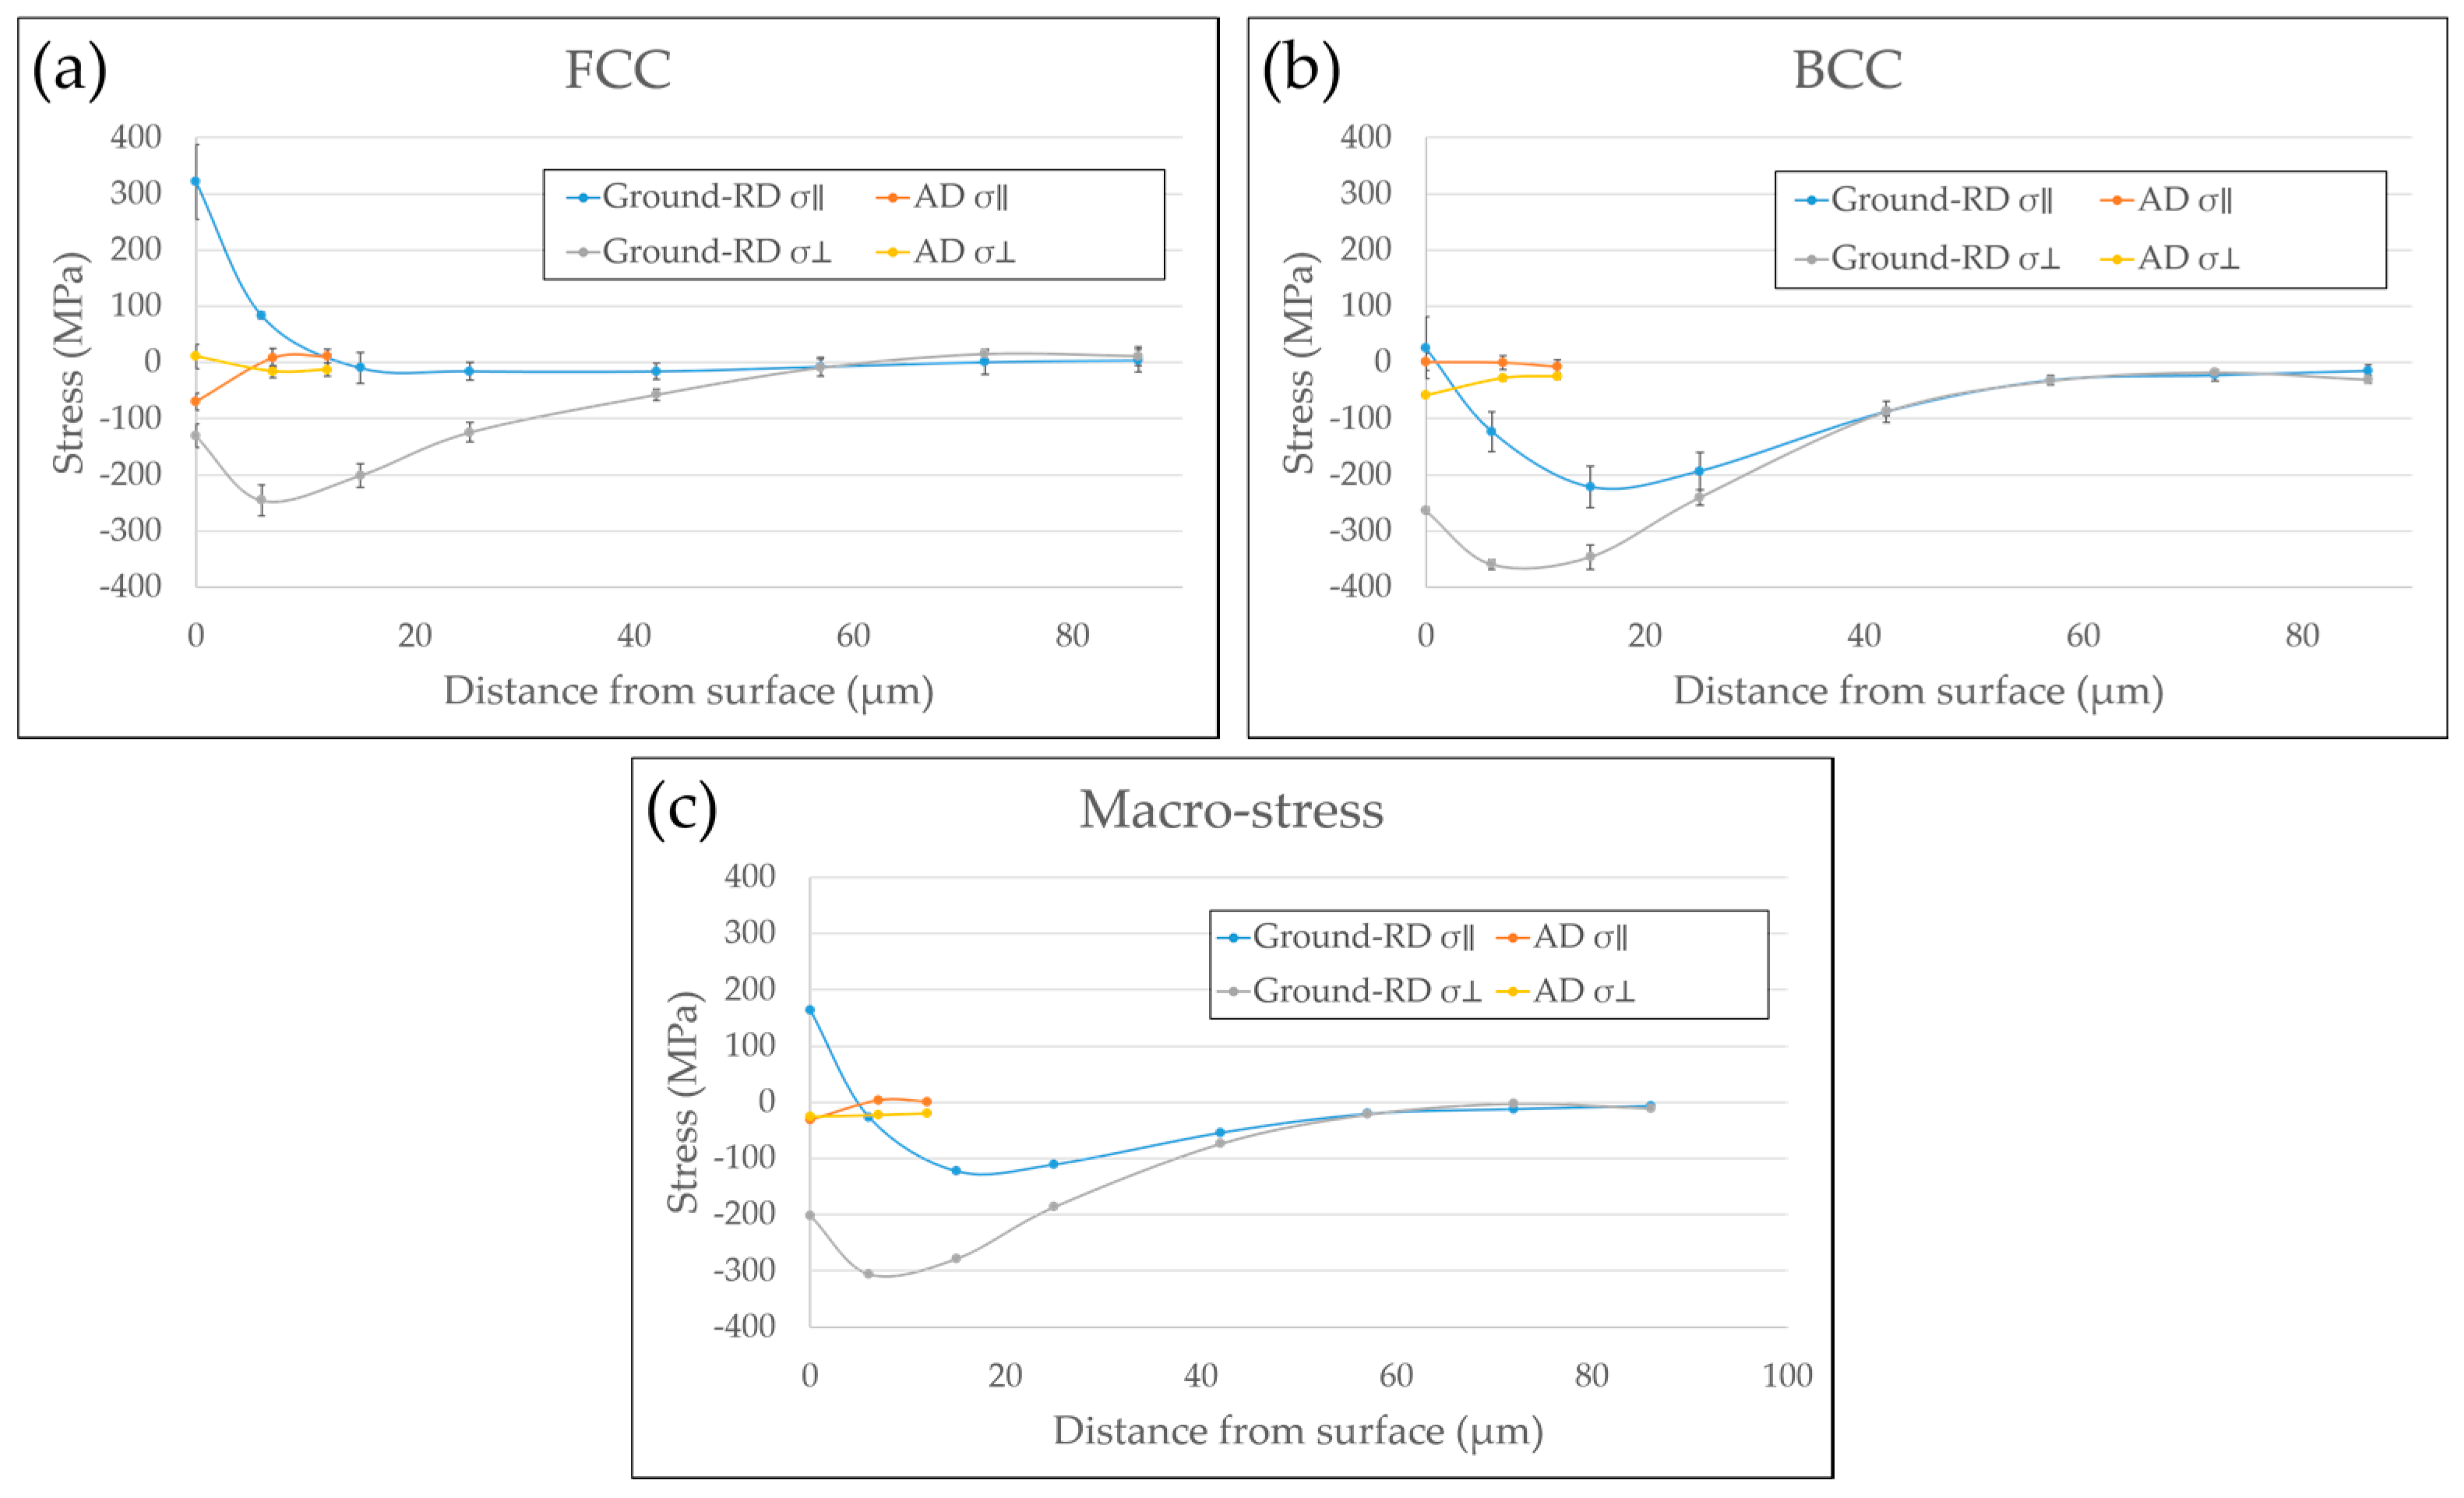
3.1.2. In-Depth Residual Stresses
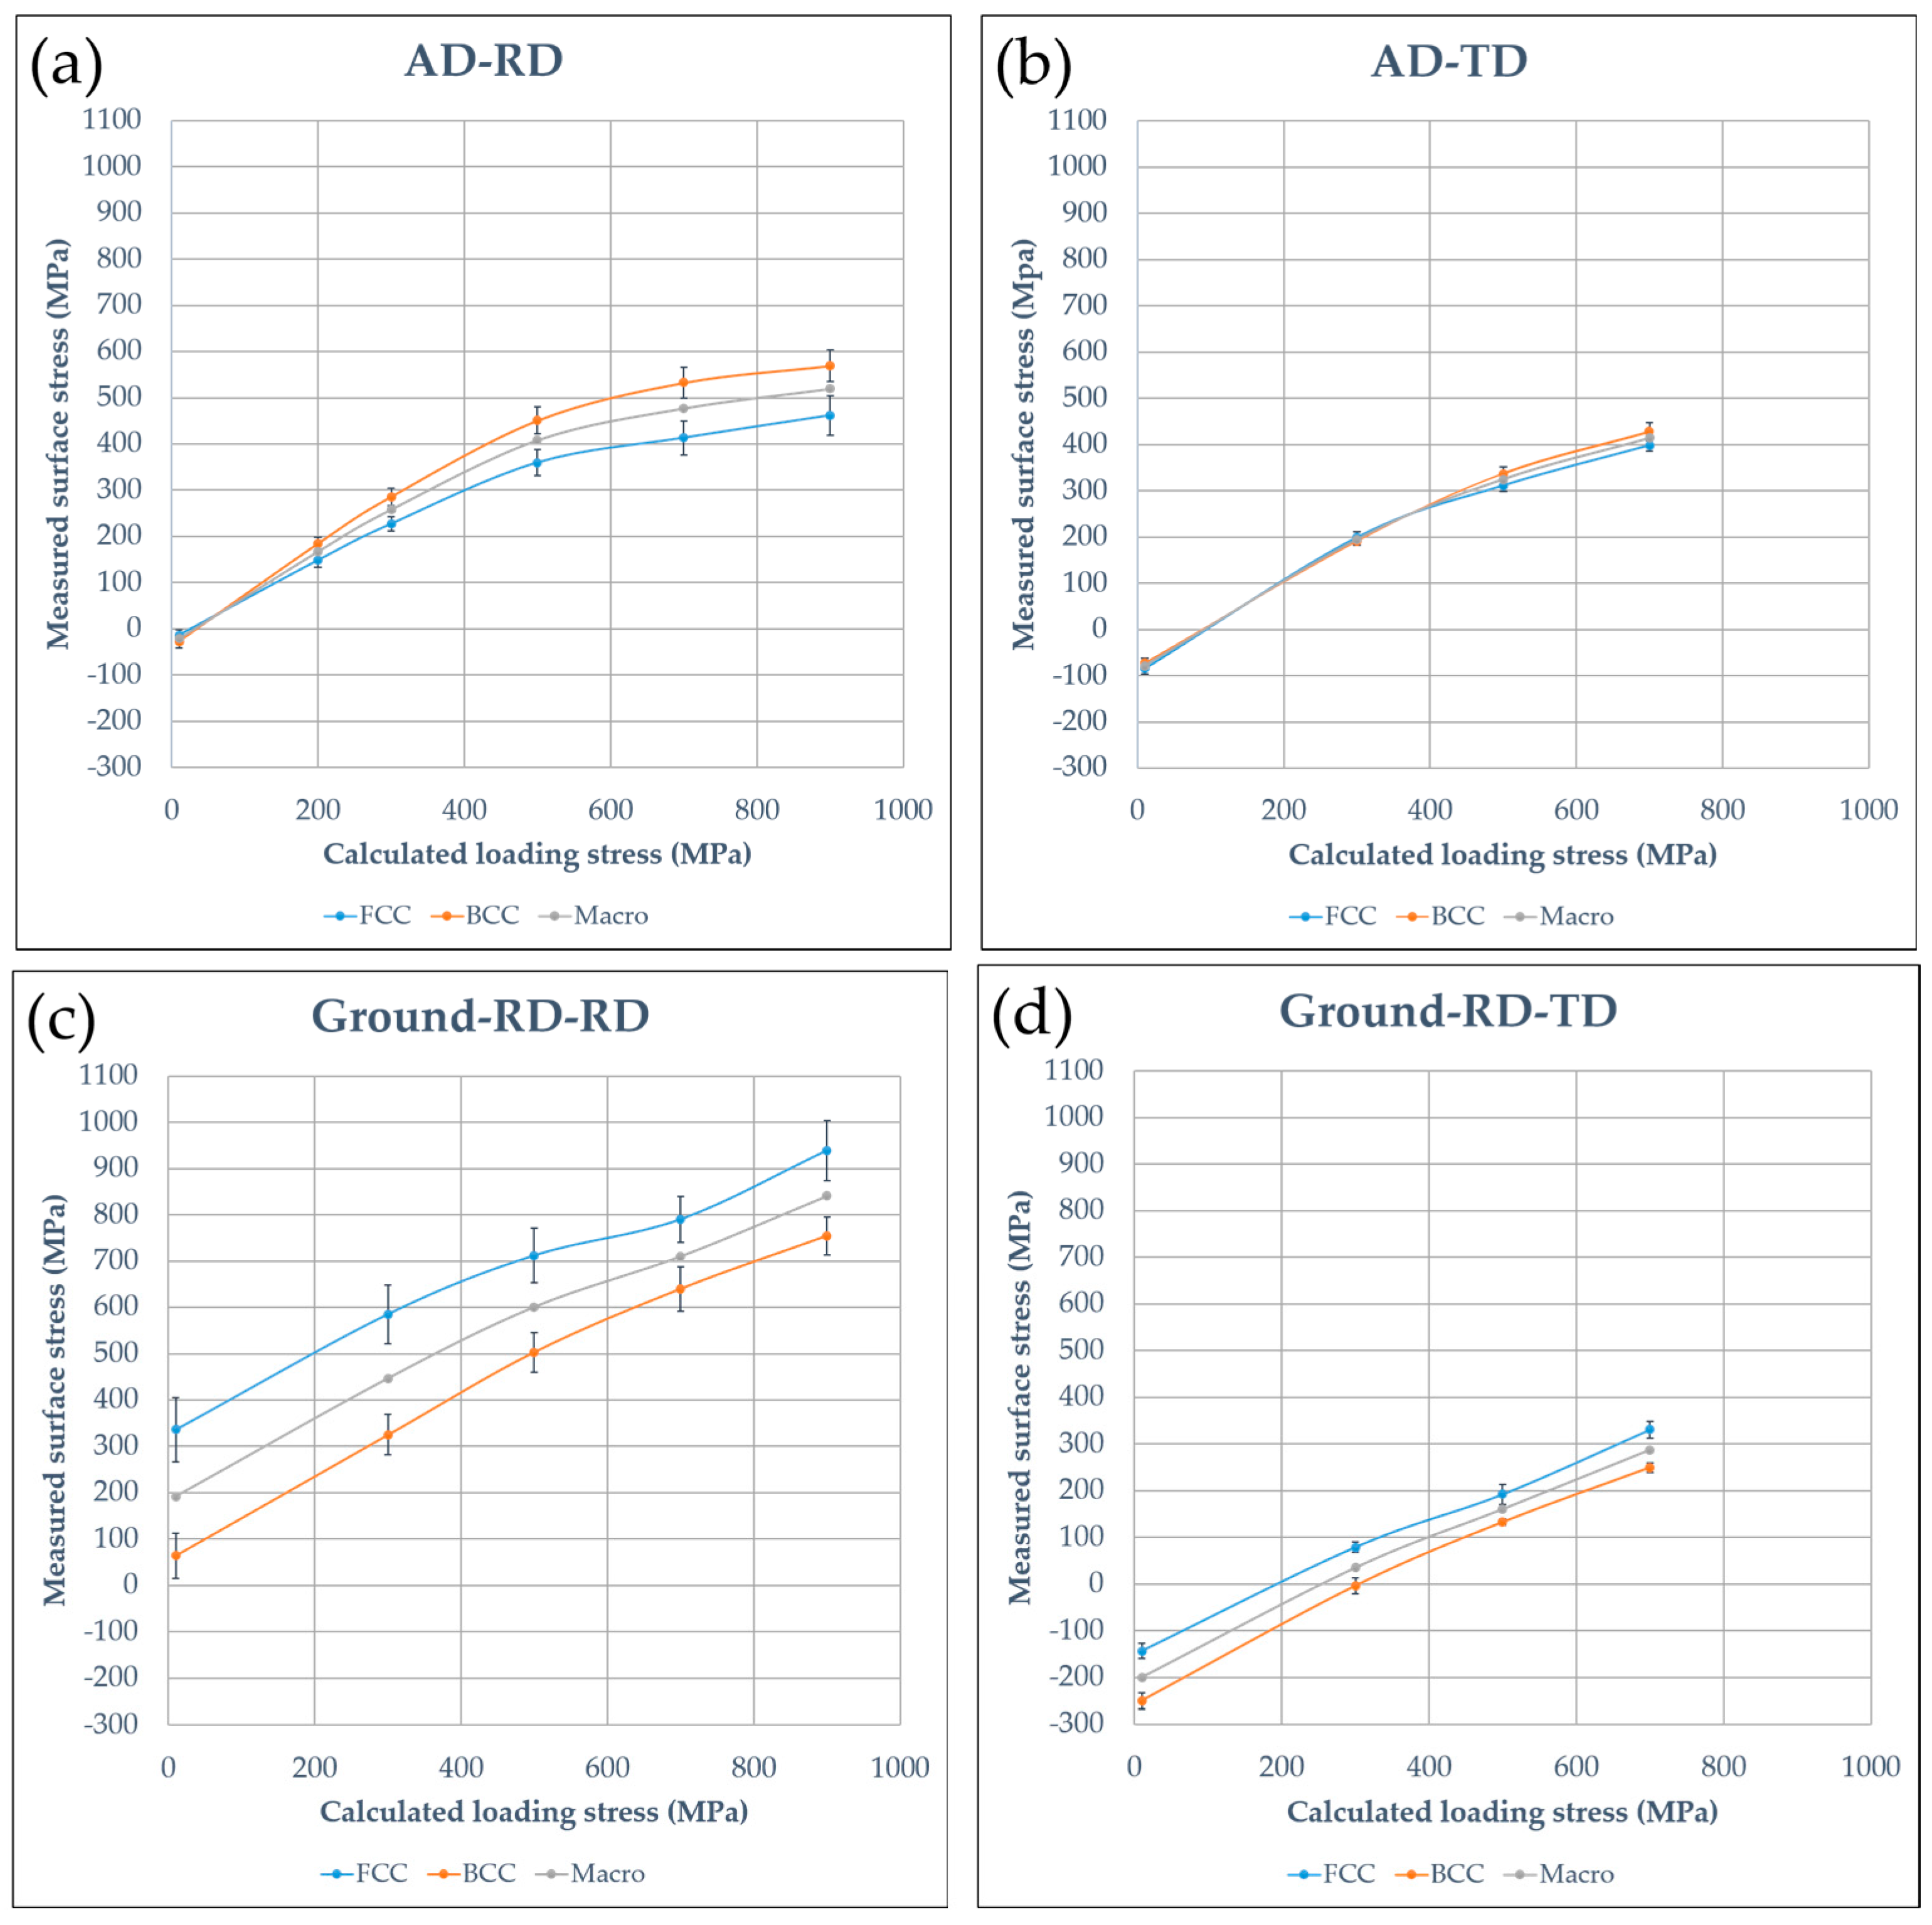
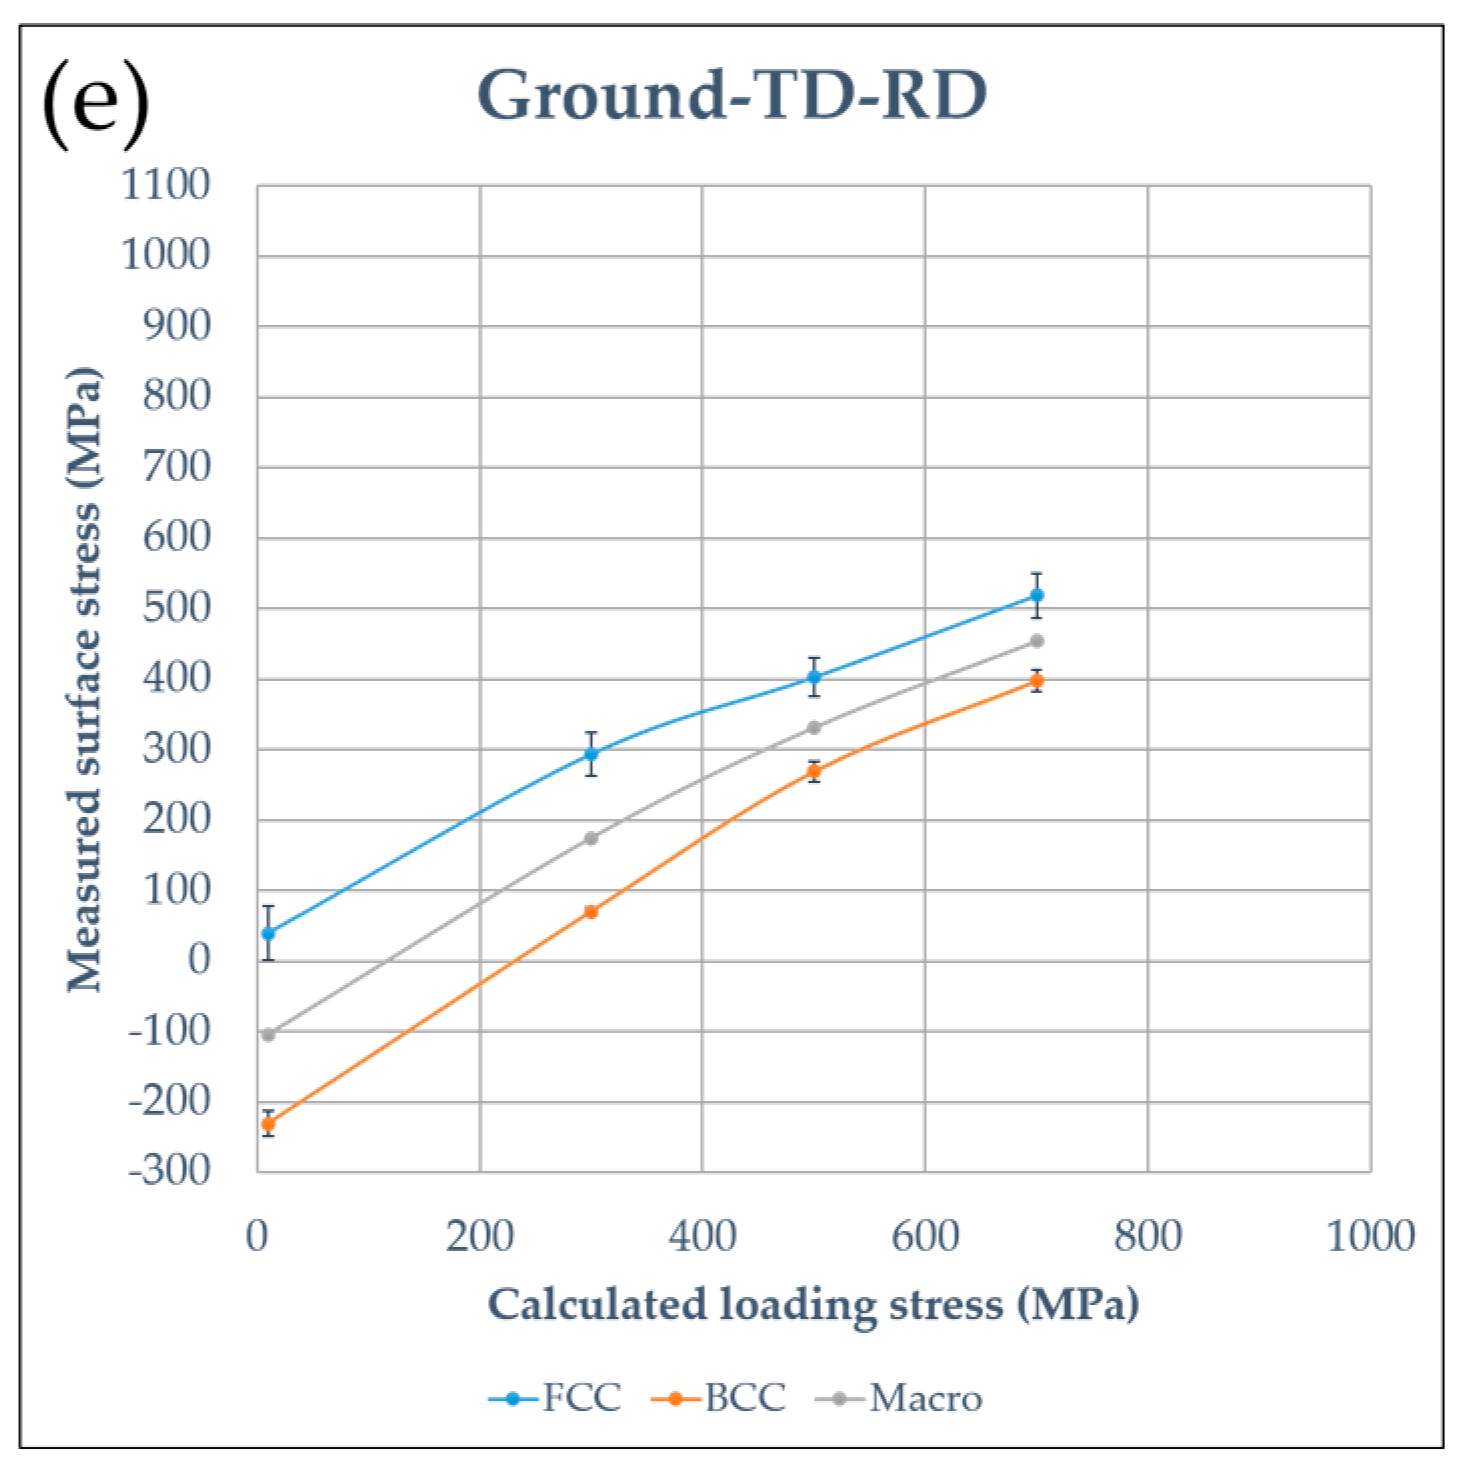
3.1.3. In-Situ Measured Surface Stresses under Four-Point Bend Loading
3.2. Corrosion Behavior without External Loading
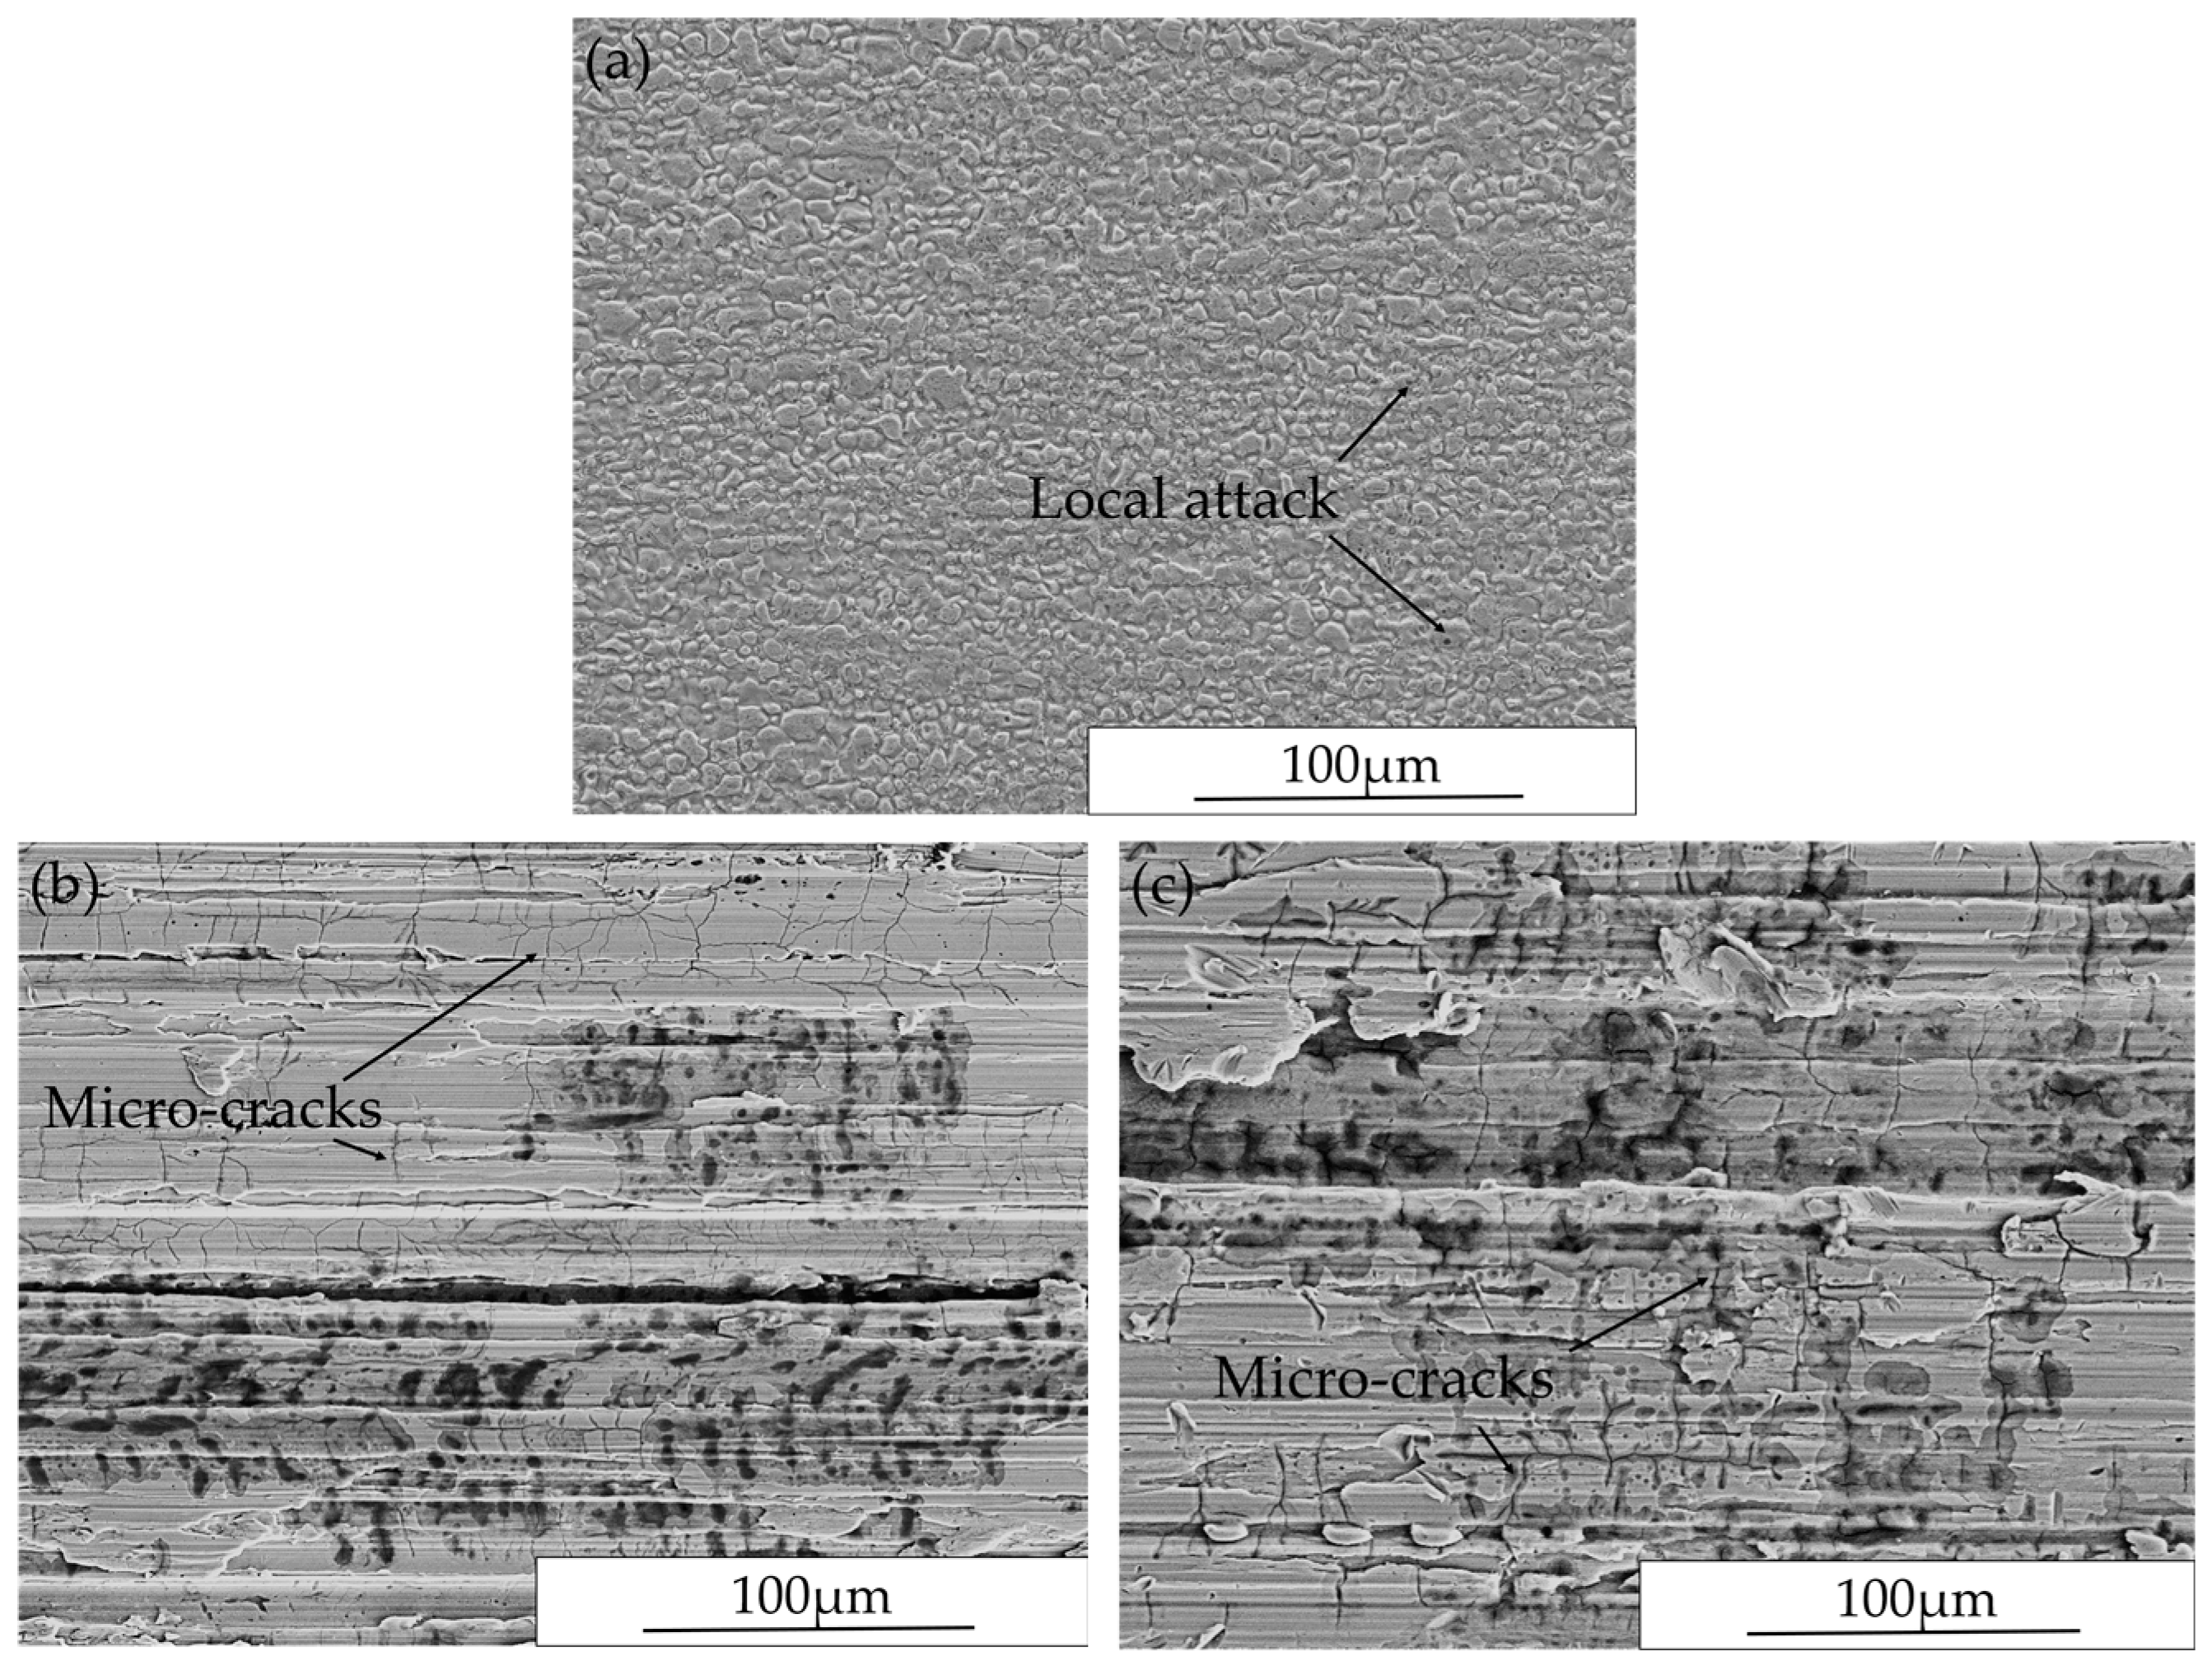
3.2.1. Surface Morphology after Exposure
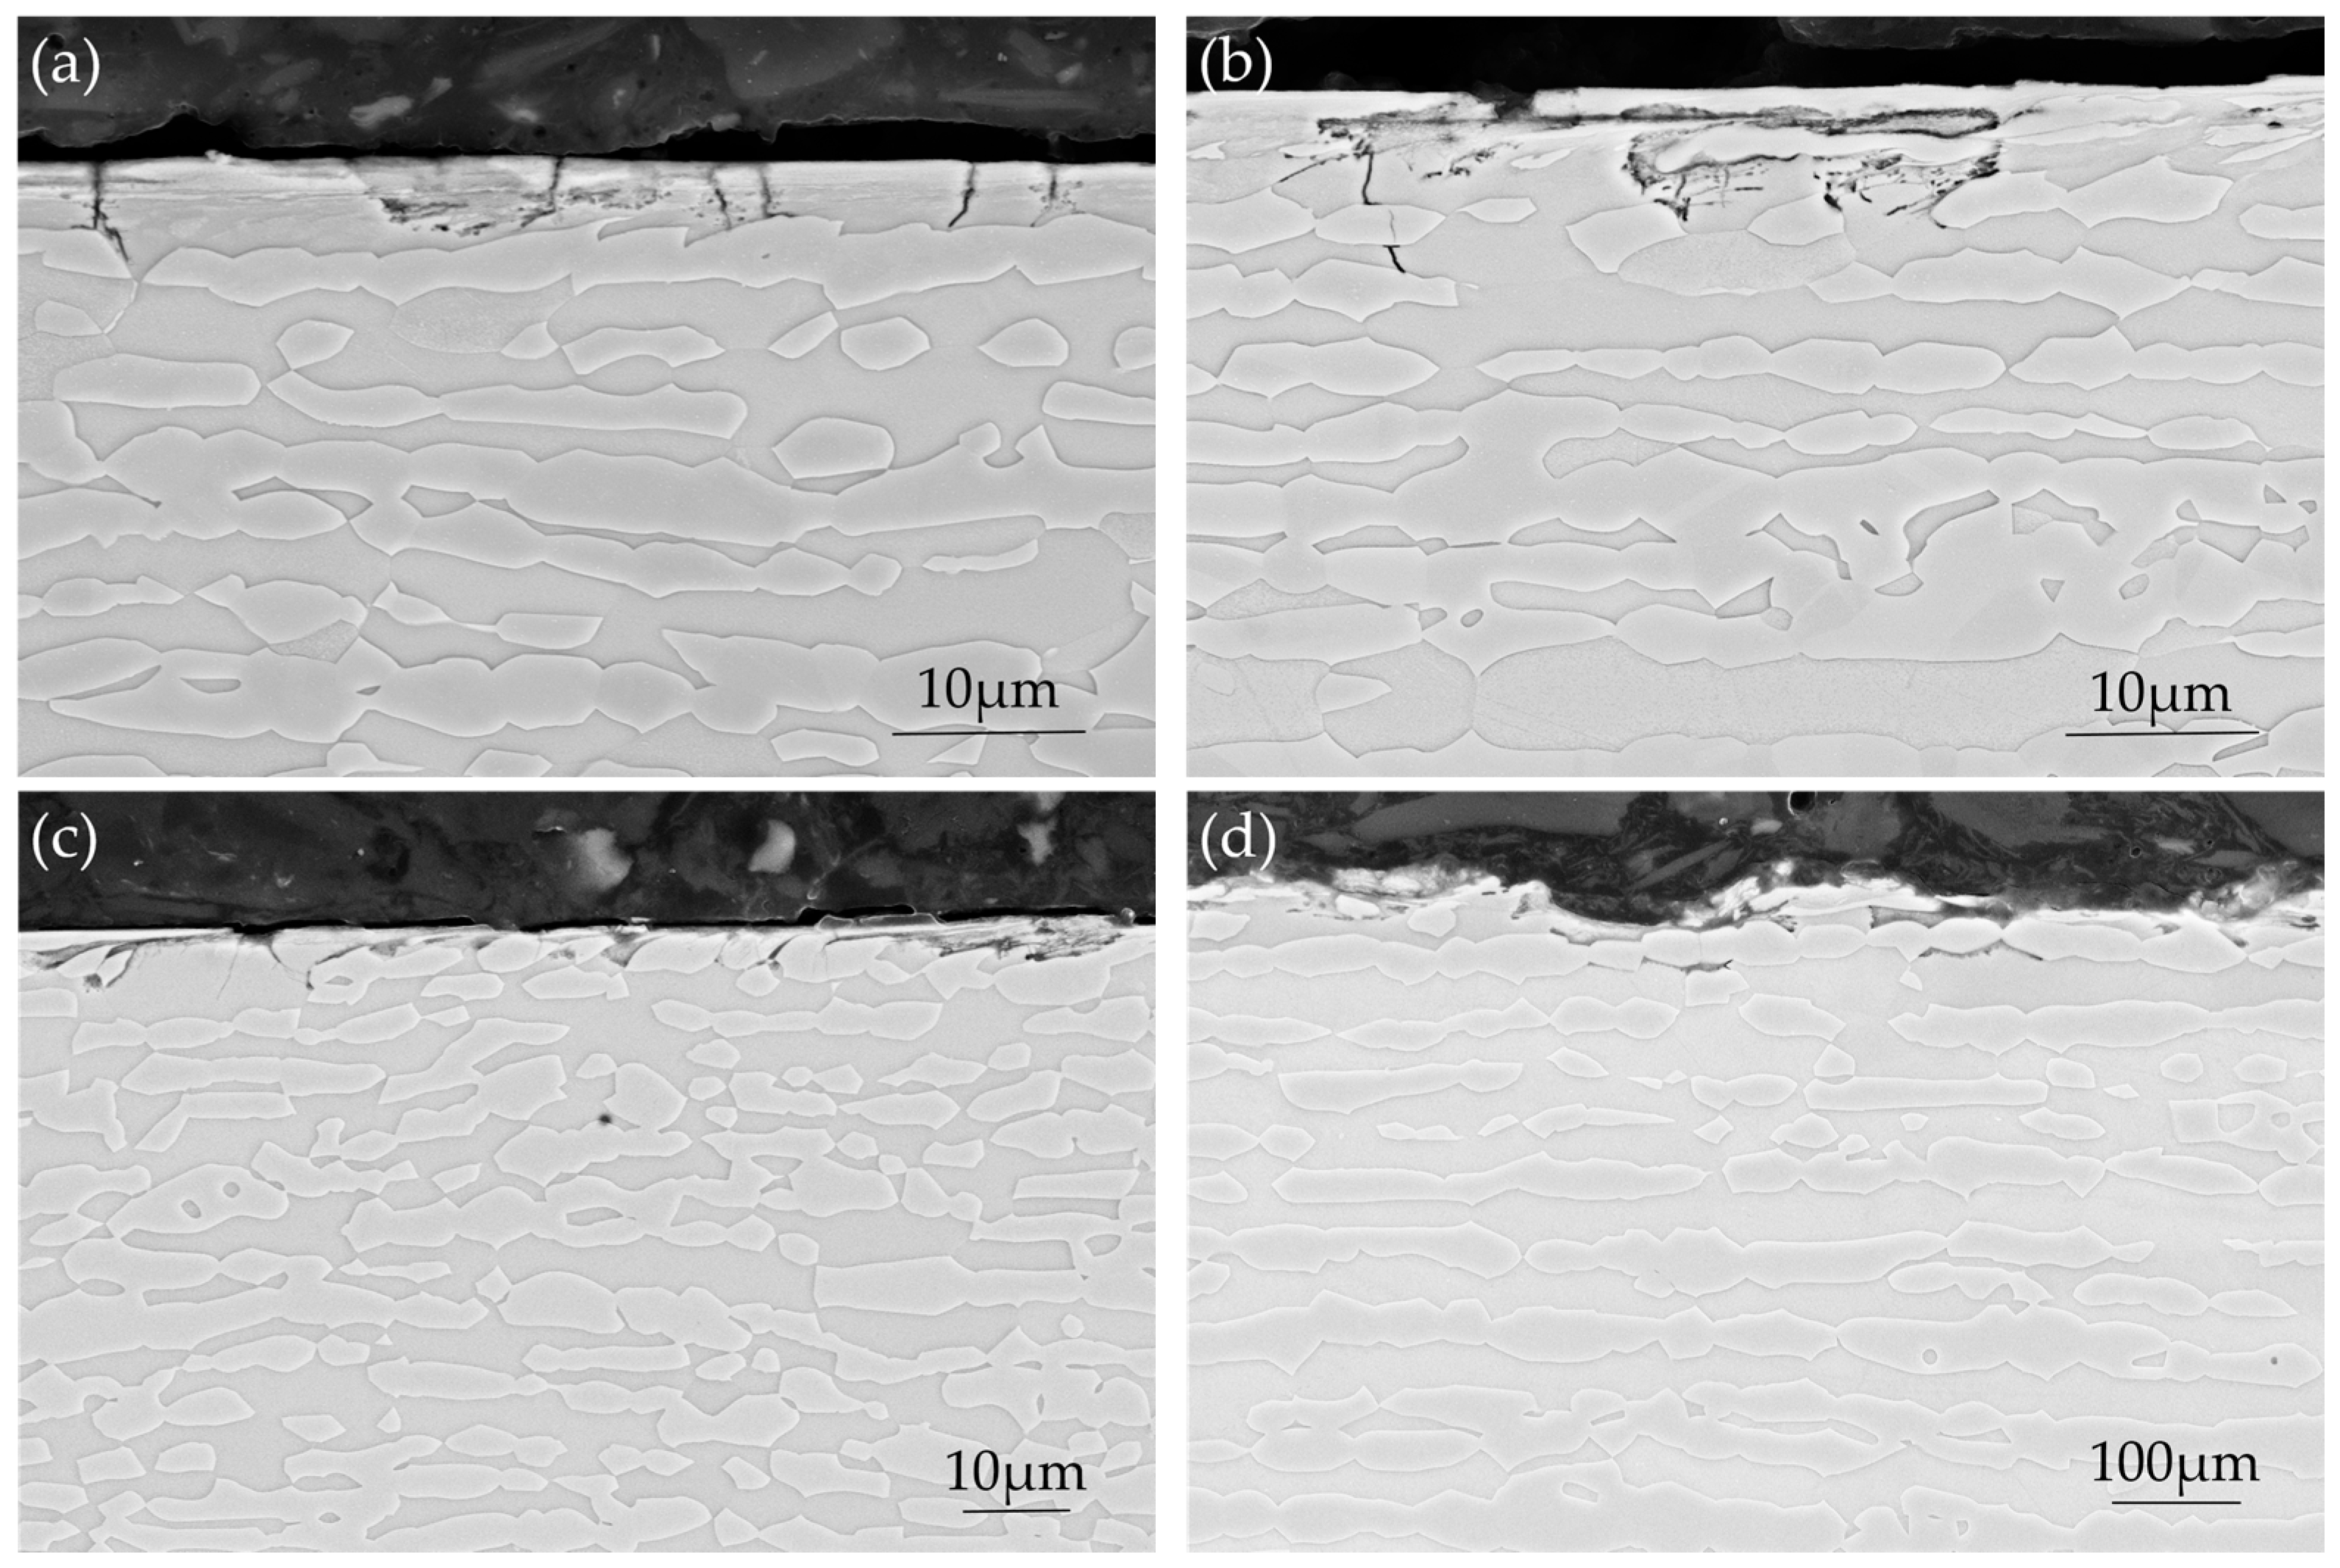
3.2.2. Cross-Section Investigation after Exposure
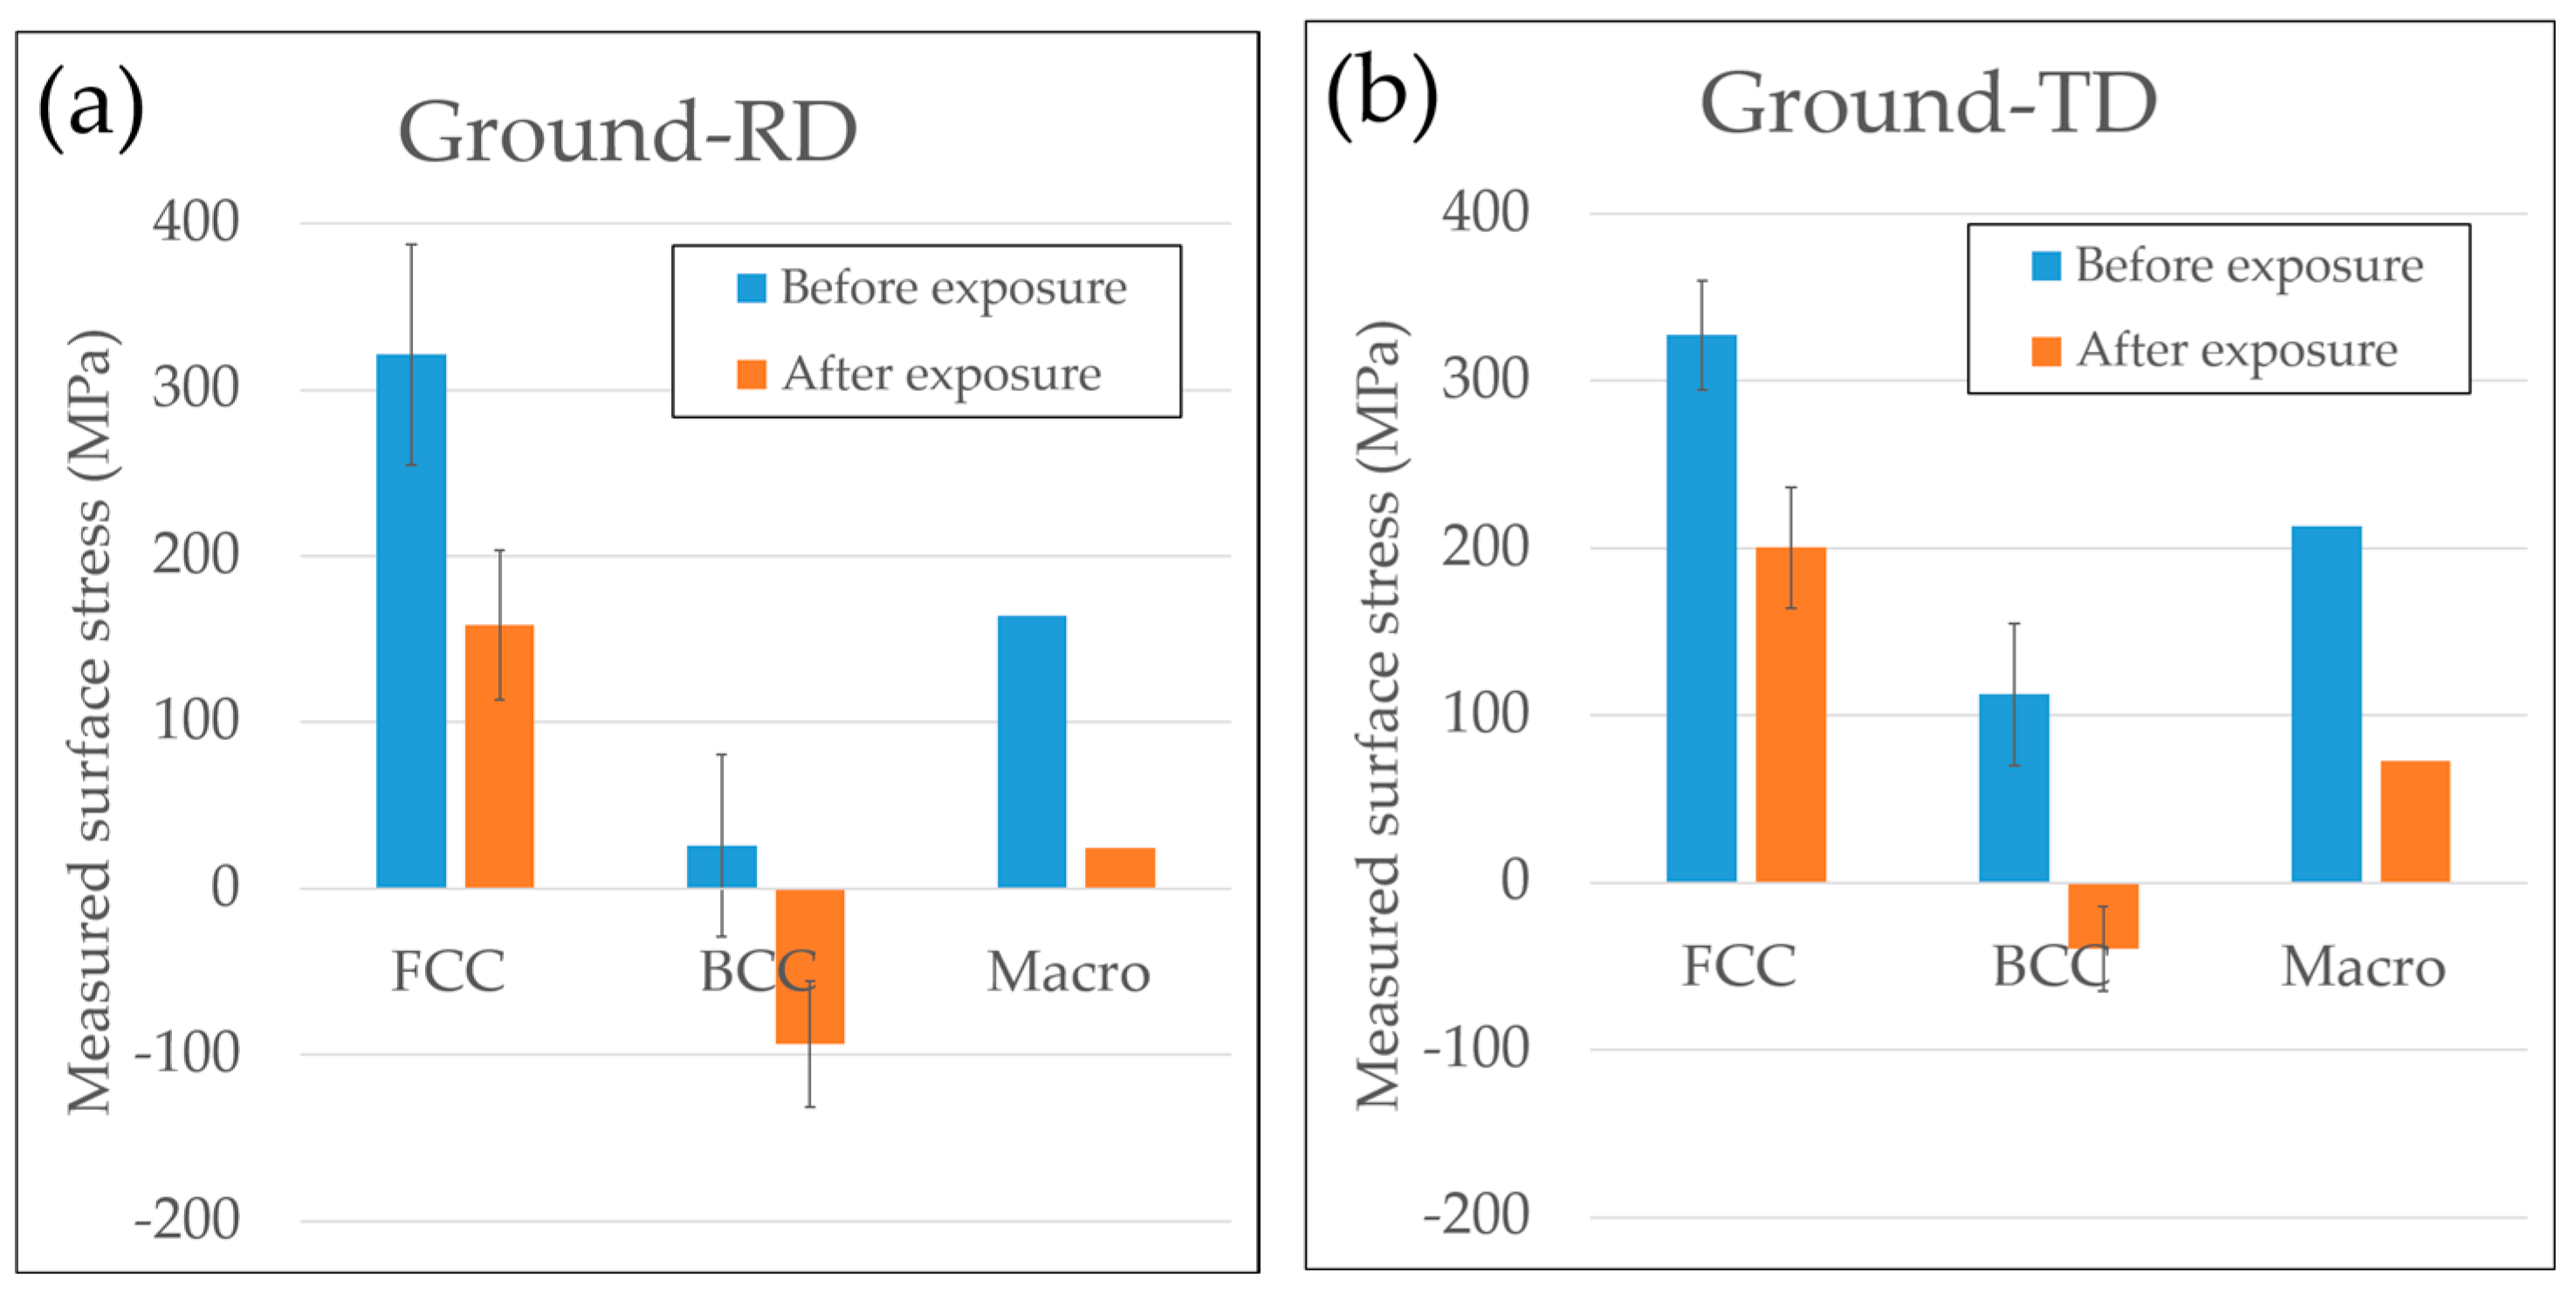
3.2.3. Stress Release after Exposure
3.3. Corrosion Behavior with Four-Point Bend Loading
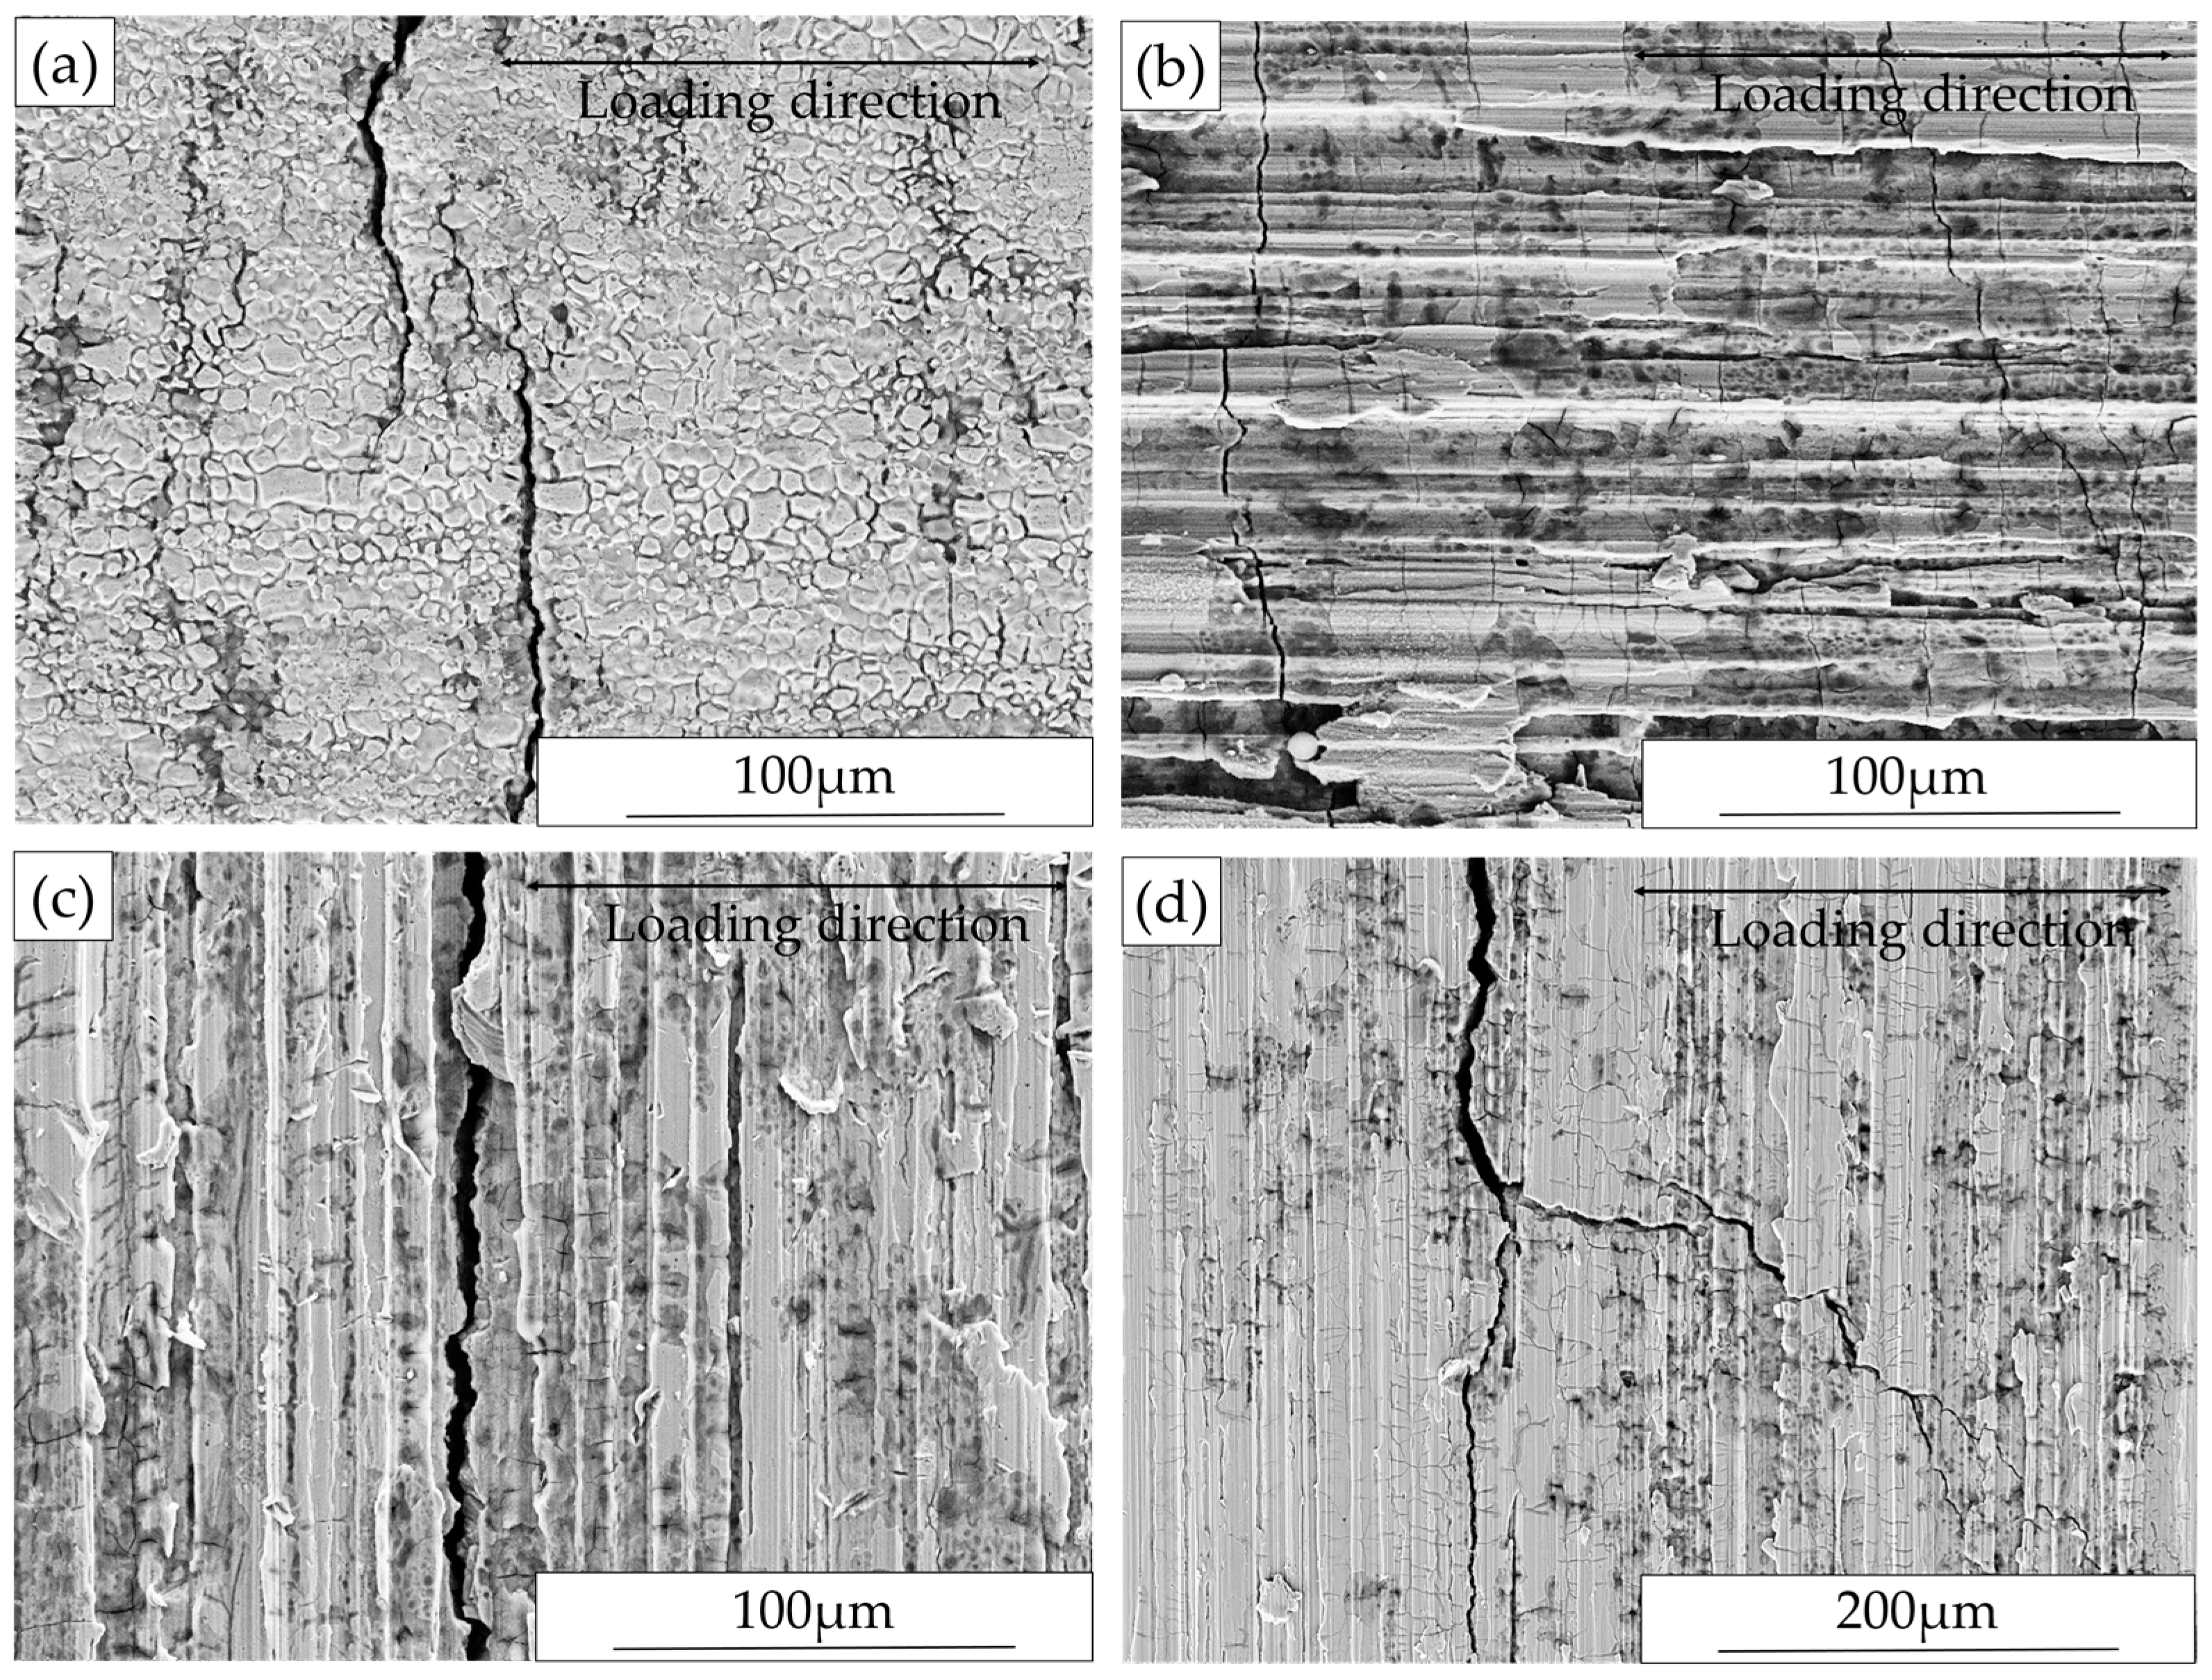
3.3.1. Macro-Crack Examination
3.3.2. Surface Morphology after Exposure
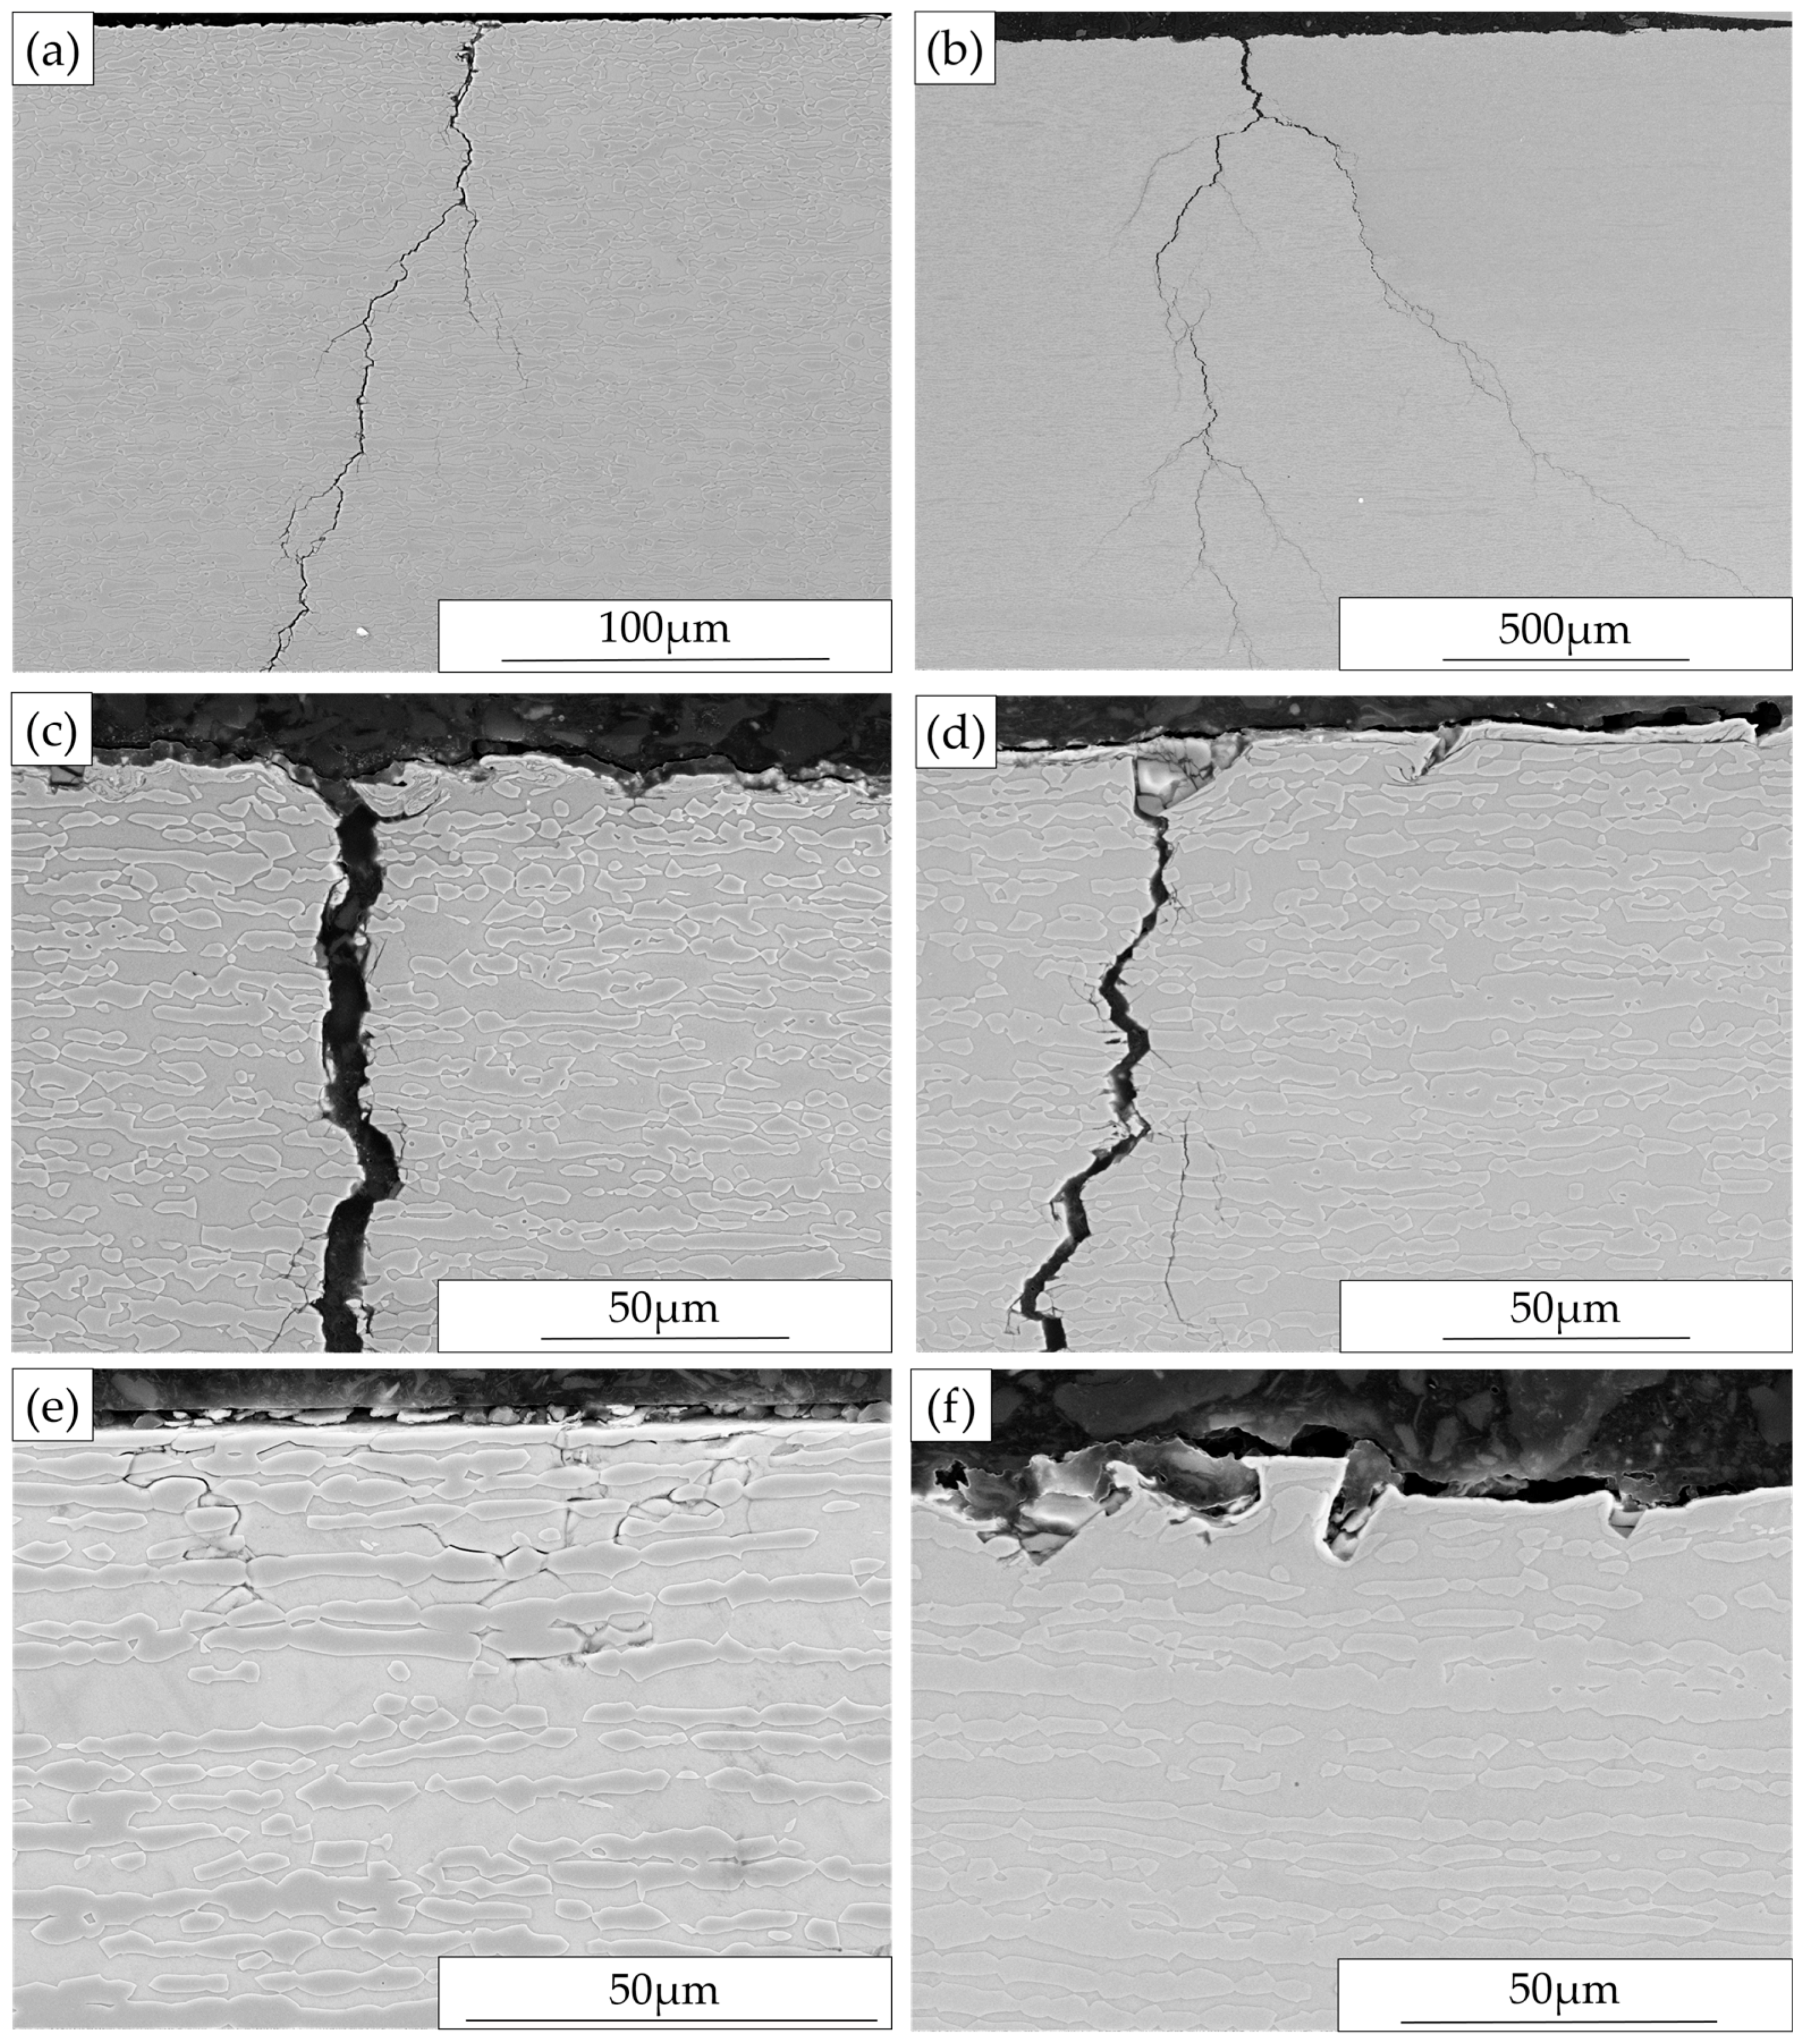
3.3.3. Cross-Section Investigation after Exposure
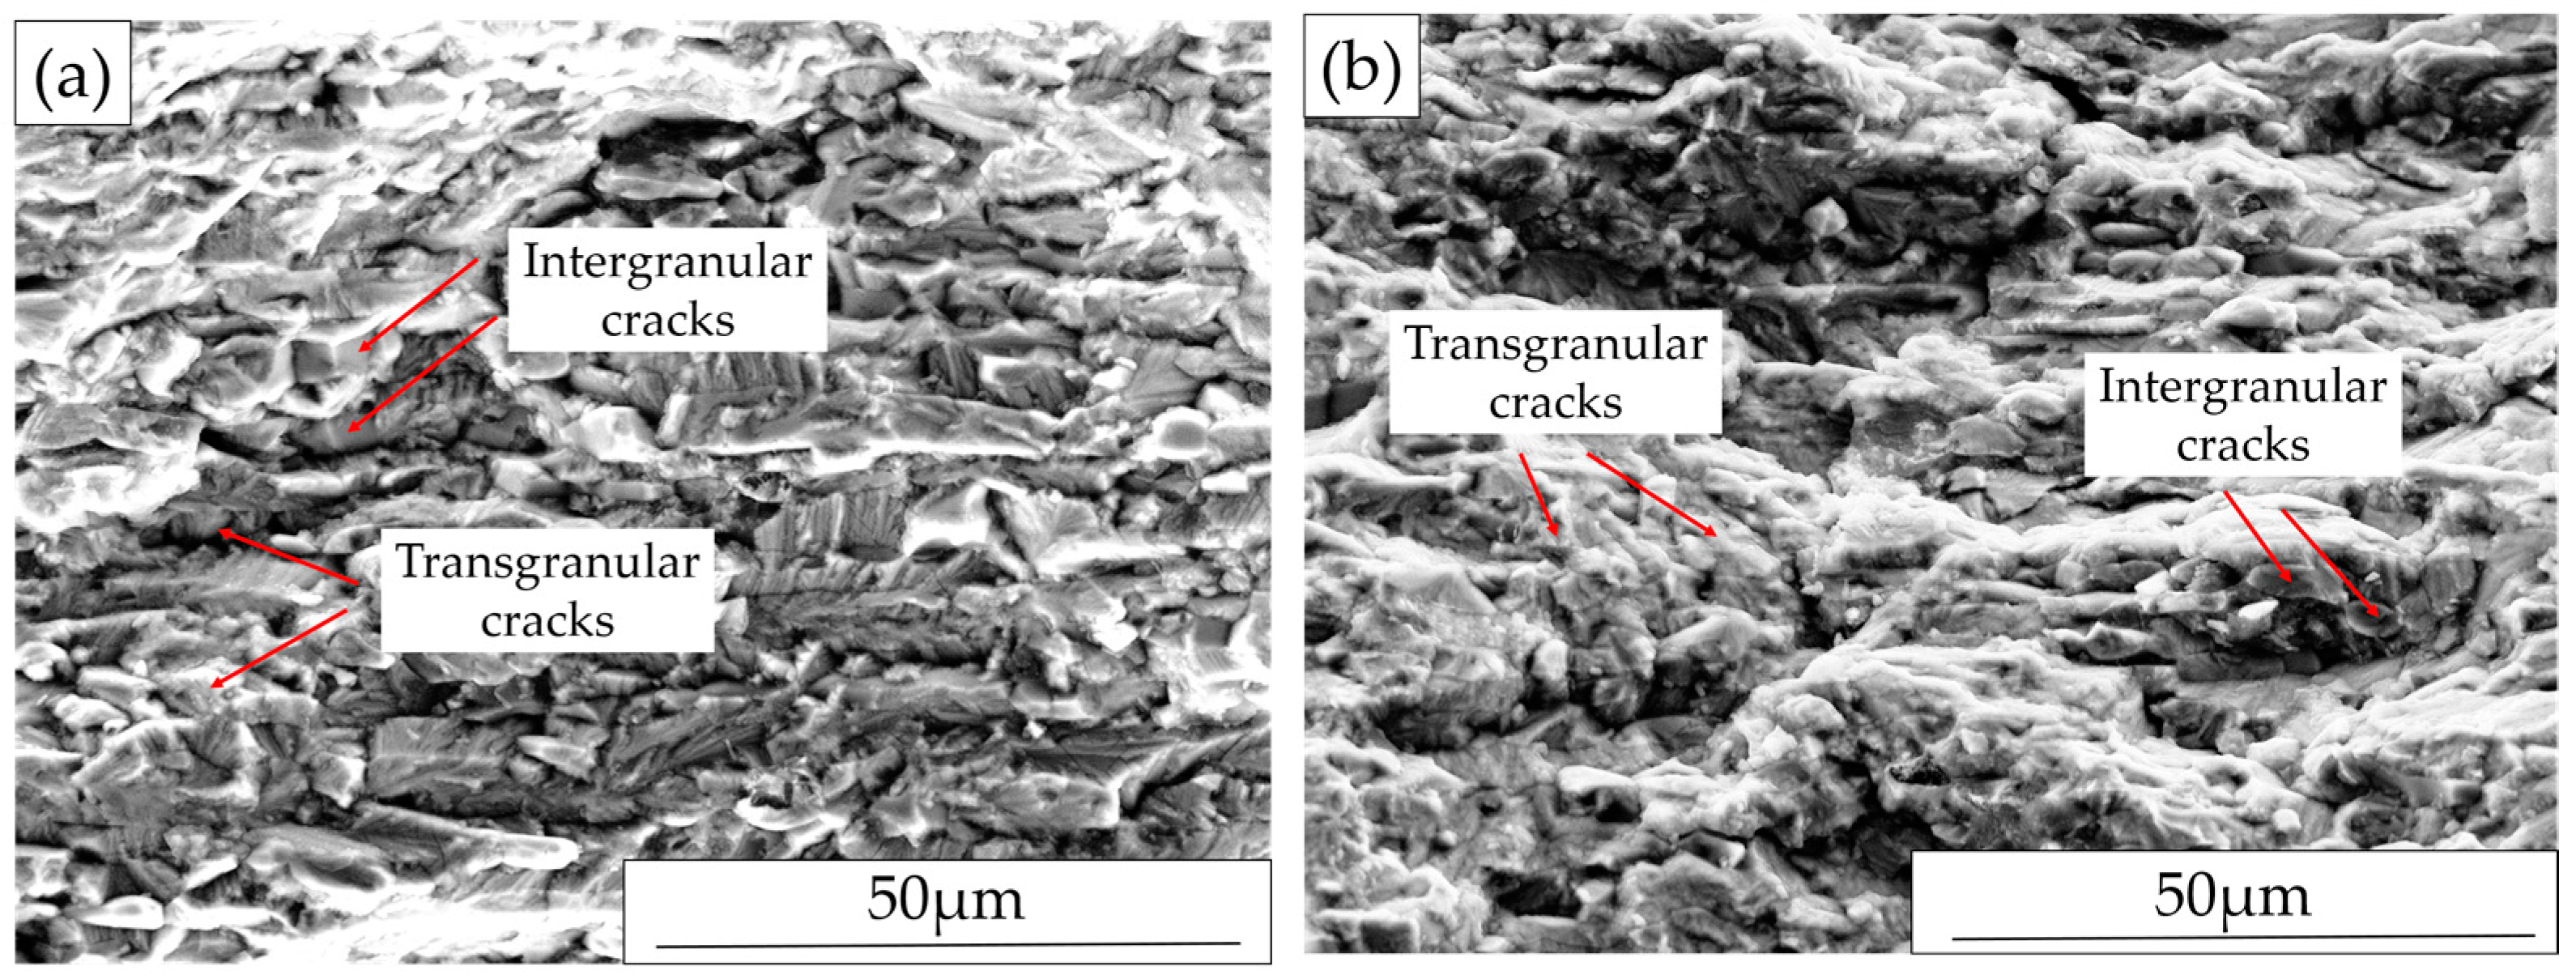
3.3.4. Fracture Surface Investigation
4. Discussion
4.1. Corrosion Behavior without External Loading
4.2. Measured Surface Stresses during In-Situ Four-Point Bend Loading
4.3. Corrosion Behavior with Four-Point Bend Loading
5. Conclusions
- Grinding induced surface tensile residual stresses were found to be the main factor causing the formation of micro-cracks on ground surfaces during exposure with or without external loading. The micro-cracks arrested in the region with low or no tensile macro stresses, tended to stop at phase boundaries and caused some release of the surface stresses. Selective dissolution of ferrite tended to initiate at micro-cracks on the surface.
- The in-situ surface stress measurements on four-point bend loaded specimens demonstrated that the actual surface stresses may differ between the two phases and may deviate from the calculated values according to the formula in ASTM G39. For as-delivered material with low residual stresses, the formula gave a reasonable estimation in the elastic regime. For ground specimens, the actual surface stress depends on the interaction between the applied and the residual stresses as well as the strength gradient under the ground surface.
- Macroscopic cracking leading to final failure only appeared under an applied load. The stress corrosion macro-cracks mainly propagated transgranularly through both the austenitic and ferritic phases perpendicular to the loading direction. Along the loading direction, where the applied stress was low, they mainly propagated in the continuous ferritic phase and tended to bypass the austenite by following the austenitic-ferritic phase boundaries.
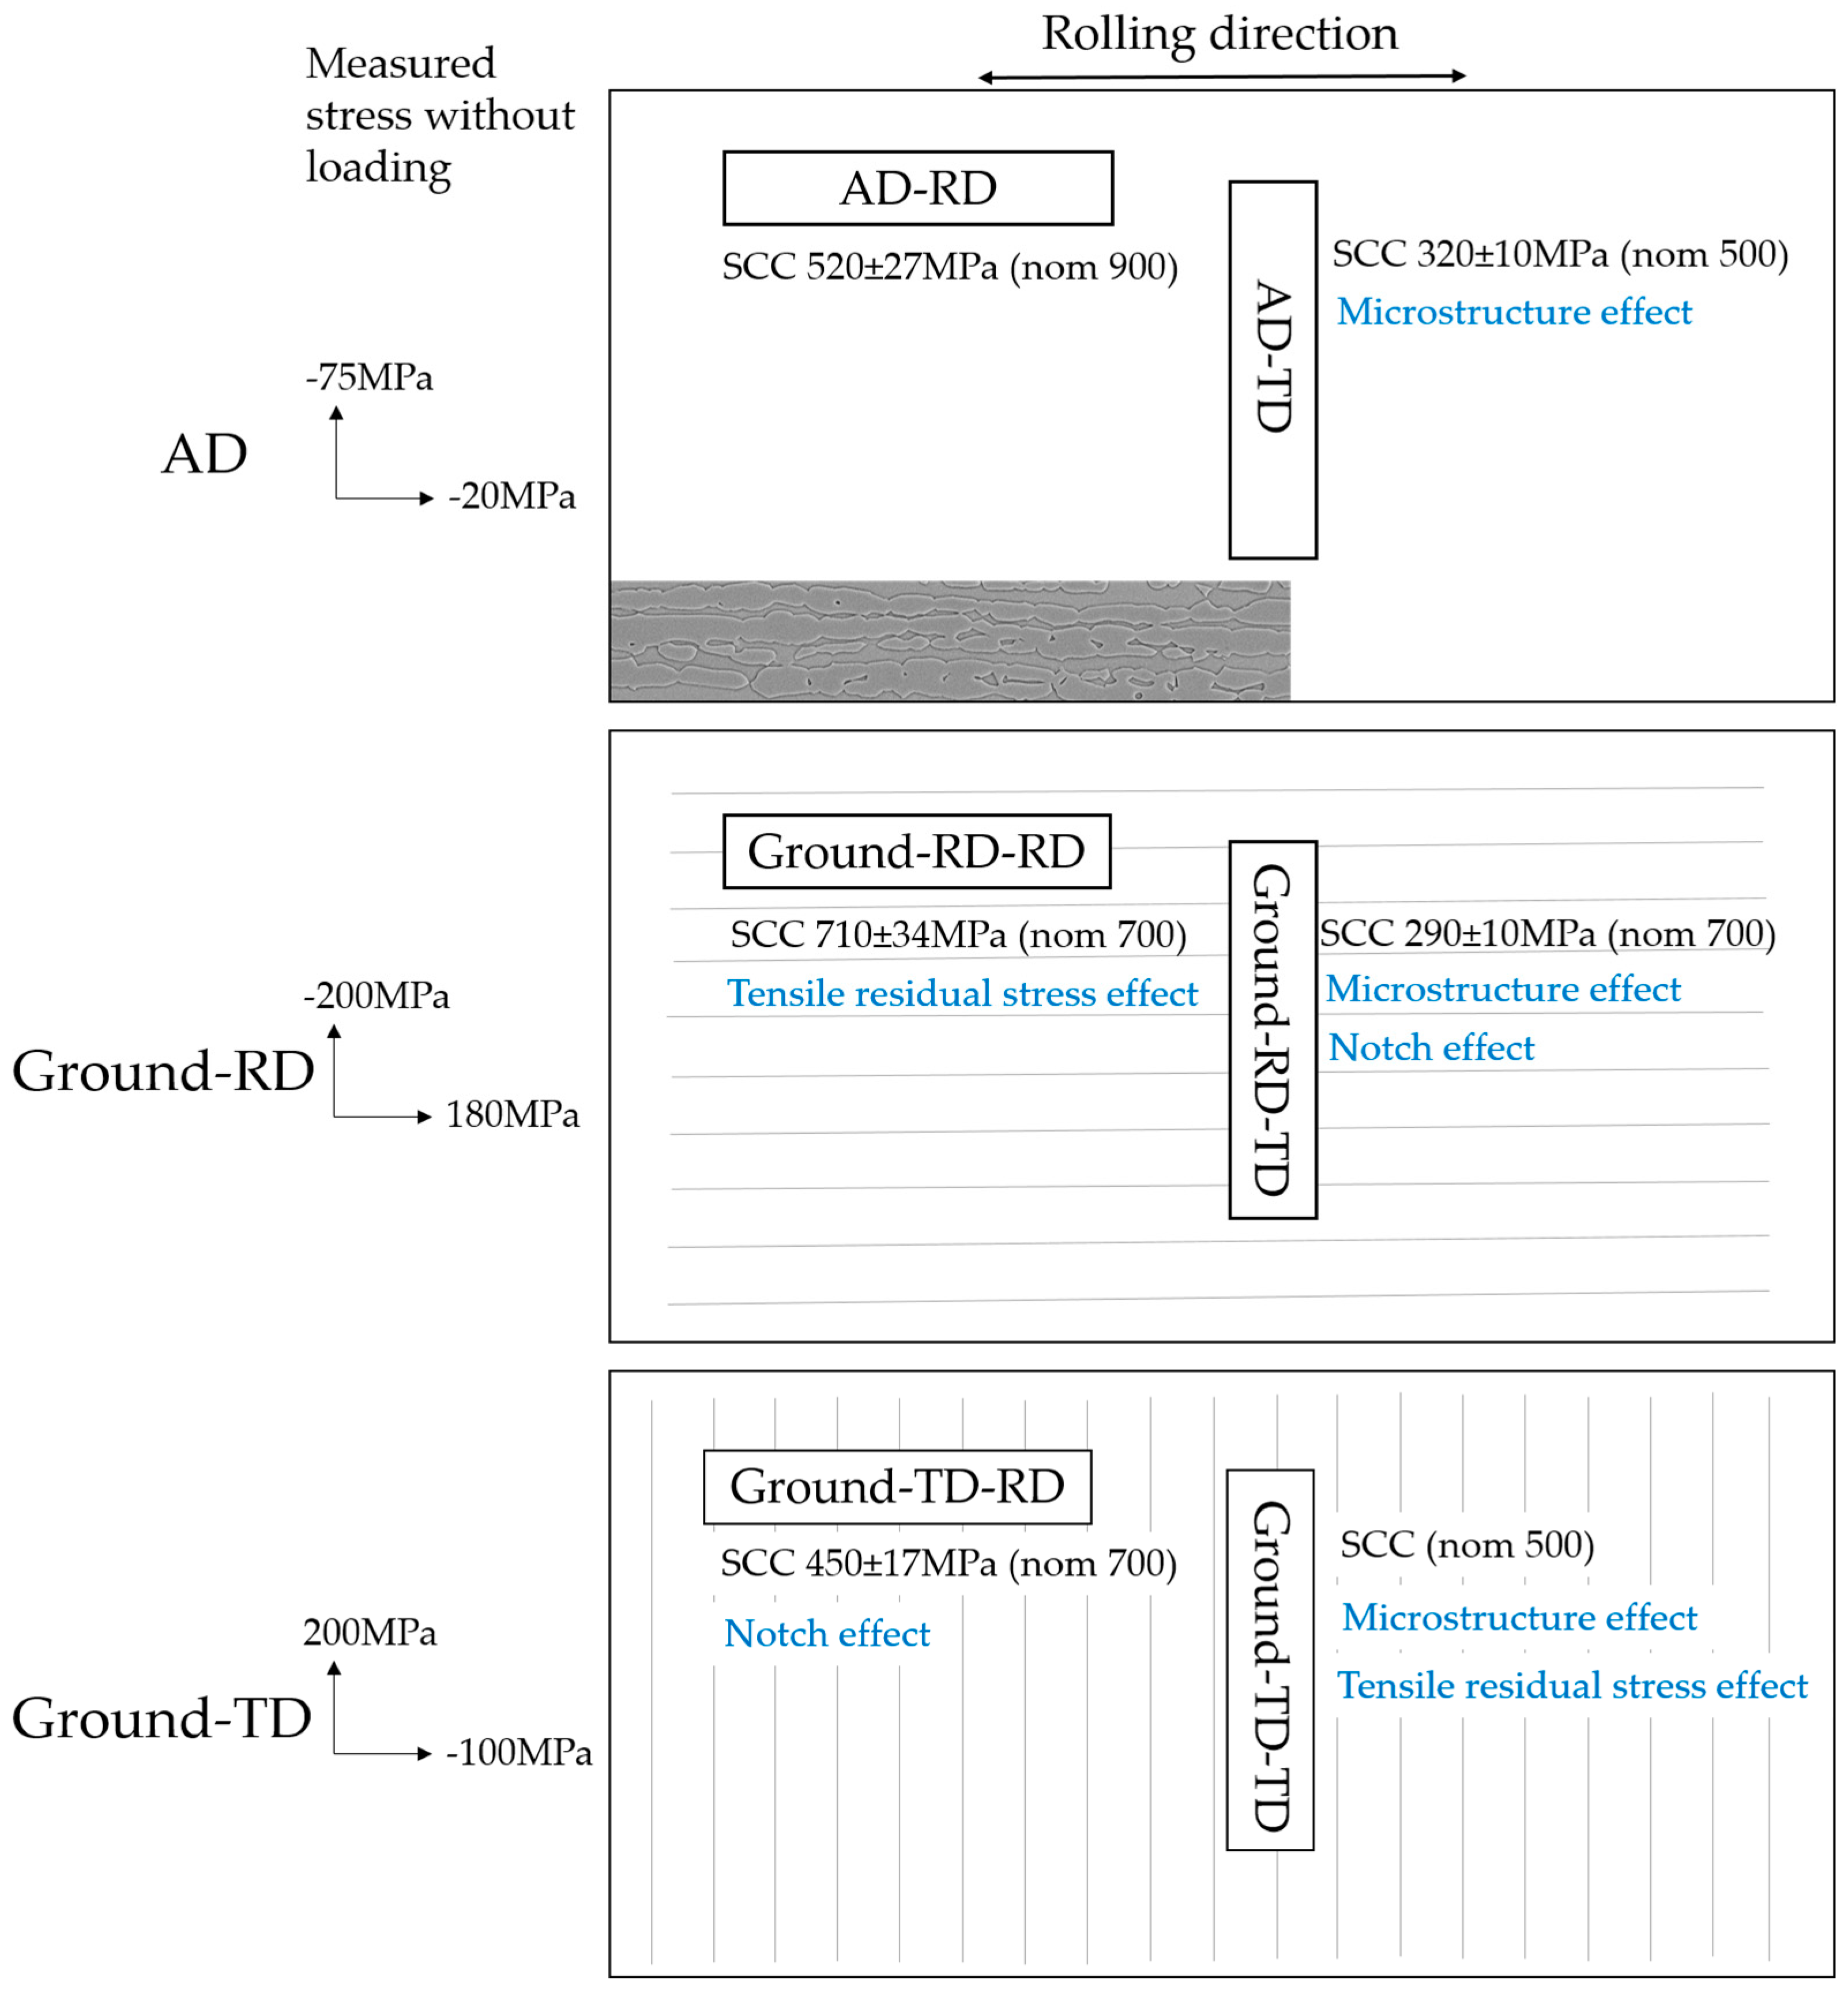
- Microstructure has a strong influence on the SCC behavior; applying loading perpendicular to the rolling direction of the material significantly increased the susceptibility to SCC. Grinding induced tensile residual stresses and micro-notches from grinding also have a detrimental effect.
Acknowledgments
Author Contributions
Conflicts of Interest
References
- Outokumpu. Handbook of Stainless Steels; Outokumpu Oyj: Helsinki, Finland, 2013. [Google Scholar]
- Jones, D. Principles and Prevention of Corrosion; Pearson Education: Upper Saddle River, NJ, USA, 1996. [Google Scholar]
- Pettersson, R.; Johansson, E. Stress corrosion resistance of duplex grades. In Proceedings of the Duplex Stainless Steel World Conference, Beaune, France, 13–15 October 2010.
- Shimodaira, S.; Takano, M.; Takizawa, Y.; Kamide, H. Stress Corrosion Cracking and Hydrogen Embrittlement of Iron Base Alloys; NACE International: Houston, TX, USA, 1977. [Google Scholar]
- Kwon, H.-S.; Kim, H.-S. Investigation of stress corrosion susceptibility of duplex (α + γ) stainless steel in a hot chloride solution. Mater. Sci. Eng. A 1993, 172, 159–165. [Google Scholar] [CrossRef]
- Symniotis, E. Galvanic Effects on the Active Dissolution of Duplex Stainless Steels. Corrosion 1990, 46, 2–12. [Google Scholar] [CrossRef]
- Tsai, W.-T.; Lo, I.-H. Selective dissolution and corrosion fatigure behaviors of 2205 duplex stainlelss steel. Adv. Mater. Sci. 2007, 7, 70–76. [Google Scholar]
- Zanotto, F.; Grassi, V.; Balbo, A.; Monticelli, C.; Zucchi, F. Stress corrosion cracking of LDX 2101® duplex stainless steel in chloride solutions in the presence of thiosulphate. Corros. Sci. 2014, 80, 205–212. [Google Scholar] [CrossRef]
- Kahram, M.; Asnavandi, M.; Koshy, P.; Sorrell, C.C. Corrosion Investigation of Duplex Stainless Steels in Chlorinated Solutions. Steel Res. Int. 2015, 86, 9, 1022–1027. [Google Scholar] [CrossRef]
- Örnek, C.; Engelberg, D. Towards understanding the effect of deformation mode on stress corrosion cracking susceptibility of grade 2205 duplex stainless steel. Mater. Sci. Eng. A 2016, 666, 269–279. [Google Scholar] [CrossRef]
- Johansson, J.; Oden, M.; Zheng, X. Evolution of the residual stress state in a duplex stainless steel during loading. Acta Mater. 1999, 47, 2669–2684. [Google Scholar] [CrossRef]
- Moverare, J.J. Microstresses and Anisotropic Mechanical Behavior of Duplex Stainless Steels; UniTryck: Linköping, Sweden, 2001. [Google Scholar]
- Zhou, N.; Lin, R.P.; Pettersson, R. Surface Integrity of 2304 Duplex Stainless Steel after Different Grinding Operations. J. Mater. Process. Technol. 2016, 229, 294–304. [Google Scholar] [CrossRef]
- ASTM International. Standard Practice for Preparation and Use of Bent-Beam Stress-Corrosion Test Specimens; ASTM International: West Conshohocken, PA, USA, 2011. [Google Scholar]
- International Organization for Standardization. Corrosion of Metals and Alloys-Stress Corrosion Testing; ISO: Geneva, Switzerland, 1995. [Google Scholar]
- Zhou, N.; Pettersson, R.; Peng, R.L.; Schönning, M. Effect of Surface Grinding on Chloride Induced SCC of 304L. Mater. Sci. Eng. A 2016, 658, 50–59. [Google Scholar] [CrossRef]
- Bautista, A.; Alvarez, S.M.; Velasco, F. Selective corrosion of duplex stainless steel bars in acid. Part 2: Effect of the surface strain and numerical analysis. Mater. Corros. 2015, 64, 357–365. [Google Scholar] [CrossRef]
- Al-Obaid, Y. The effect of shot peening on stress corrosion cracking behaviour of 2205-duplex stainless steel. Eng. Fract. Mech. 1995, 51, 19–25. [Google Scholar] [CrossRef]
- Łabanowski, J.; Ossowska, A. Influence of burnishing on stress corrosion cracking susceptibility of duplex steel. J. Achiev. Mater. Manuf. Eng. 2006, 19, 46–52. [Google Scholar]
- Wickström, L.; Mingard, K.; Hinds, G.; Turnbull, A. Microcrack clustering in stress corrosion cracking of 22Cr and 25Cr duplex stainless steels. Corros. Sci. 2016, 109, 86–93. [Google Scholar] [CrossRef]
- ASTM International. Standard Practice for Evaluation Stress-Corrosion-Cracking Resistance of Metals and Alloys in a Boiling Magnesium Chloride Solution; ASTM International: West Conshohocken, PA, USA, 2006. [Google Scholar]
- Noyan, I.; Cohen, J. Residual Stress Measurement by Diffraction and Interpretation; Springer: Berlin, Germany, 1987. [Google Scholar]
- Lyon, K.; Marrow, T.; Lyon, S. Influence of milling on the development of stress corrosion cracks in austenitic stainless steel. J. Mater. Process. Technol. 2015, 218, 32–37. [Google Scholar] [CrossRef]
- Lu, J.; Luo, K.; Yang, D.; Cheng, X.; Hu, J.; Dai, F.; Qi, H.; Zhang, L.; Zhong, J.; Wang, Q.; Zhang, Y. Effects of laser peening on stress corrosion cracking (SCC) of ANSI 304 austenitic stainless steel. Corros. Sci. 2012, 60, 145–152. [Google Scholar] [CrossRef]
- Moverare, J.; Odén, M. Influence of elastic and plastic anisotropy on the flow behavior in a duplex stainless steel. Metall. Mater. Trans. A 2003, 33, 57–71. [Google Scholar] [CrossRef]
- Peng, R.; Wang, Y.D.; Chai, G.C.; Jia, N.; Johansson, S.; Wang, G. On the development of grain-orientation-dependent and inter-phase stresses in a super duplex stainless steel under uniaxial loading. Mater. Sci. Forum 2006, 524–525, 917–922. [Google Scholar] [CrossRef]
- Liu, B.; Feng, X.; Zhang, S.-M. The effective Young’s modulus of composites beyond the Voigt estimation due to the Poisson effect. Compos. Sci. Technol. 2009, 69, 2198–2204. [Google Scholar] [CrossRef]
- Peng, R.L.; Gibmeier, J.; Chai, G.; Johansson, S. Load partitioning in a duplex strainless steel with surface strength gradient and residual stresses. In Proceedings of the 57th Annual Conference on Applications of X-ray Analysis and the 8th International Conference on Residual Stresses, Advances in X-Ray Analysis, Denver, CO, USA, 6–8 August 2008; Volume 52.
- NACE International. Four-Point Bend Testing of Materials for Oil and Gas Applications; NACE International: Houston, TX, USA, 2016. [Google Scholar]
- International Organization for Standardization. Corrosion of Metals and Alloys—Methodology for Determining the Resistance of Metals to Stress Corrosion Cracking Using the Four-Point Bend Method; ISO: Geneva, Switzerland, 2015. [Google Scholar]
- Turnbull, A.; Mingard, K.; Lord, J.; Roebuck, B.; Tice, D.; Mottershead, K.; Fairweather, N.; Bradbury, A. Sensitivity of stress corrosion cracking of stainless steel to surface machining and grinding procedure. Corros. Sci. 2011, 53, 3398–3415. [Google Scholar] [CrossRef]


| C | Si | Mn | P | S | Cr | Ni | Mo | N | Cu | Ti |
|---|---|---|---|---|---|---|---|---|---|---|
| 0.019 | 0.39 | 1.48 | 0.028 | 0.001 | 23.35 | 4.84 | 0.36 | 0.125 | 0.22 | 0.006 |
| Rp0.2 (MPa) | Rm (MPa) | Elongation (%) | Hardness (HB) |
|---|---|---|---|
| 590 | 739 | 30 | 228 |
| Specimen | Ra (μm) | Rz (μm) |
|---|---|---|
| AD | 0.316 ± 0.0038 | 8.09 ± 0.56 |
| Ground-RD | 1.45 ± 0.0826 | 15.84 ± 2.48 |
| Ground-TD | 1.41 ± 0.0911 | 15.03 ± 1.98 |
| Specimen | Nominal Load (MPa) | Measured Surface Stress Parallel to Loading Direction (MPa) | No. of Specimens Tested | No. of Exposed Specimens with Macro-Cracks | Presence of Micro-Cracks | ||
|---|---|---|---|---|---|---|---|
| FCC | BCC | Macro | |||||
| AD-RD | 700 | 415 ± 37 | 530 ± 33 | 475 ± 25 | 3 | 0 | No |
| 900 | 460 ± 43 | 570 ± 34 | 520 ± 27 | 3 | 1 | No | |
| AD-TD | 300 | 200 ± 11 | 190 ± 8 | 195 ± 7 | 3 | 0 | No |
| 500 | 310 ± 13 | 335 ± 14 | 320 ± 10 | 3 | 1 | No | |
| 700 | 400 ± 12 | 430 ± 19 | 415 ± 11 | 3 | 3 | No | |
| Ground-RD-RD | 700 | 790 ± 49 | 640 ± 48 | 710 ± 34 | 3 | 1 | Yes |
| 900 | 940 ± 66 | 755 ± 41 | 840 ± 38 | 3 | 3 | Yes | |
| Ground-RD-TD | 500 | 190 ± 5 | 130 ± 7 | 160 ± 11 | 3 | 0 | Yes |
| 700 | 330 ± 18 | 250 ± 10 | 290 ± 10 | 3 | 3 | Yes | |
| Ground-TD-TD | 300 | 3 | 0 | Yes | |||
| 500 | 3 | 2 | Yes | ||||
| Ground-TD-RD | 500 | 400 ± 28 | 270 ± 14 | 330 ± 15 | 3 | 0 | Yes |
| 700 | 520 ± 32 | 400 ± 15 | 450 ± 17 | 3 | 1 | Yes | |
© 2017 by the authors. Licensee MDPI, Basel, Switzerland. This article is an open access article distributed under the terms and conditions of the Creative Commons Attribution (CC BY) license ( http://creativecommons.org/licenses/by/4.0/).
Share and Cite
Zhou, N.; Peng, R.L.; Schönning, M.; Pettersson, R. SCC of 2304 Duplex Stainless Steel—Microstructure, Residual Stress and Surface Grinding Effects. Materials 2017, 10, 221. https://doi.org/10.3390/ma10030221
Zhou N, Peng RL, Schönning M, Pettersson R. SCC of 2304 Duplex Stainless Steel—Microstructure, Residual Stress and Surface Grinding Effects. Materials. 2017; 10(3):221. https://doi.org/10.3390/ma10030221
Chicago/Turabian StyleZhou, Nian, Ru Lin Peng, Mikael Schönning, and Rachel Pettersson. 2017. "SCC of 2304 Duplex Stainless Steel—Microstructure, Residual Stress and Surface Grinding Effects" Materials 10, no. 3: 221. https://doi.org/10.3390/ma10030221