3.1. Phase Formation
Figure 1 summarizes the results of the XRD measurements at different annealing temperatures between 600 and 900
C in air or under high vacuum conditions.
For the as-prepared state (
Figure 1a), mainly (100) RuAl reflexes at a
position of 34.8
are visible. The highest intensity is reached for the Ru
Al
sample. In contrast to this, the Ru
Al
sample only shows a very small broad peak indicating amorphous phases. The RuAl (110) reflex is tiny for all samples and also not visible for the Ru
Al
film.
Annealing under high vacuum conditions (
Figure 1b,c) leads to a strong increase in the RuAl (100) intensity (a zoom-in of the RuAl (100) peak is shown in the inset). It can be seen that the reflex shifts to higher angles and that the intensity strongly depends on the composition. The lower the Al content, the higher is the intensity of the RuAl (100) reflex. Annealing at 900
C leads to higher RuAl (100) intensities than the annealing at 800
C. For the Ru
Al
sample, only a very small RuAl (100) peak is visible for both temperatures. A small RuAl (110) reflex appears at 800
C for this sample, whereas at 900
C, this reflex is only visible for the Ru
Al
film.
In addition to the RuAl reflexes, after the heat treatment, small Ru (101) reflexes also appear at a position of 51.7 for the RuAl and RuAl samples.
Figure 1d–f presents the results of the XRD measurements after the heat treatment in air. Annealing at 600
C in air leads to a decrease of the RuAl (100) peak of the Ru
Al
film. There is no change in intensity for the Ru
Al
sample, but a clear increase of the peak intensity of the Ru
Al
film is observed. In the case of Ru
Al
, there is a slight increase of the broad peak. An Ru (002) peak evolves for the Ru
Al
sample and an Ru (101) peak for Ru
Al
.
The diffraction pattern changes clearly after the heat treatment at 800 C in air. The RuAl reflexes disappear for all samples and new phases appear. At of 32.4, the RuO (110) reflex formed, which is strongest for the RuAl sample and nearly the same for the other samples. The small peak at of 41 can be ascribed to RuO or AlO. A strong Ru reflex appears for RuAl and RuAl, which is much smaller for the other two samples.
Finally, after the heat treatment at 900 C in air, only for the RuAl sample is an RuO (110) reflex present besides some very tiny RuO/AlO peaks.
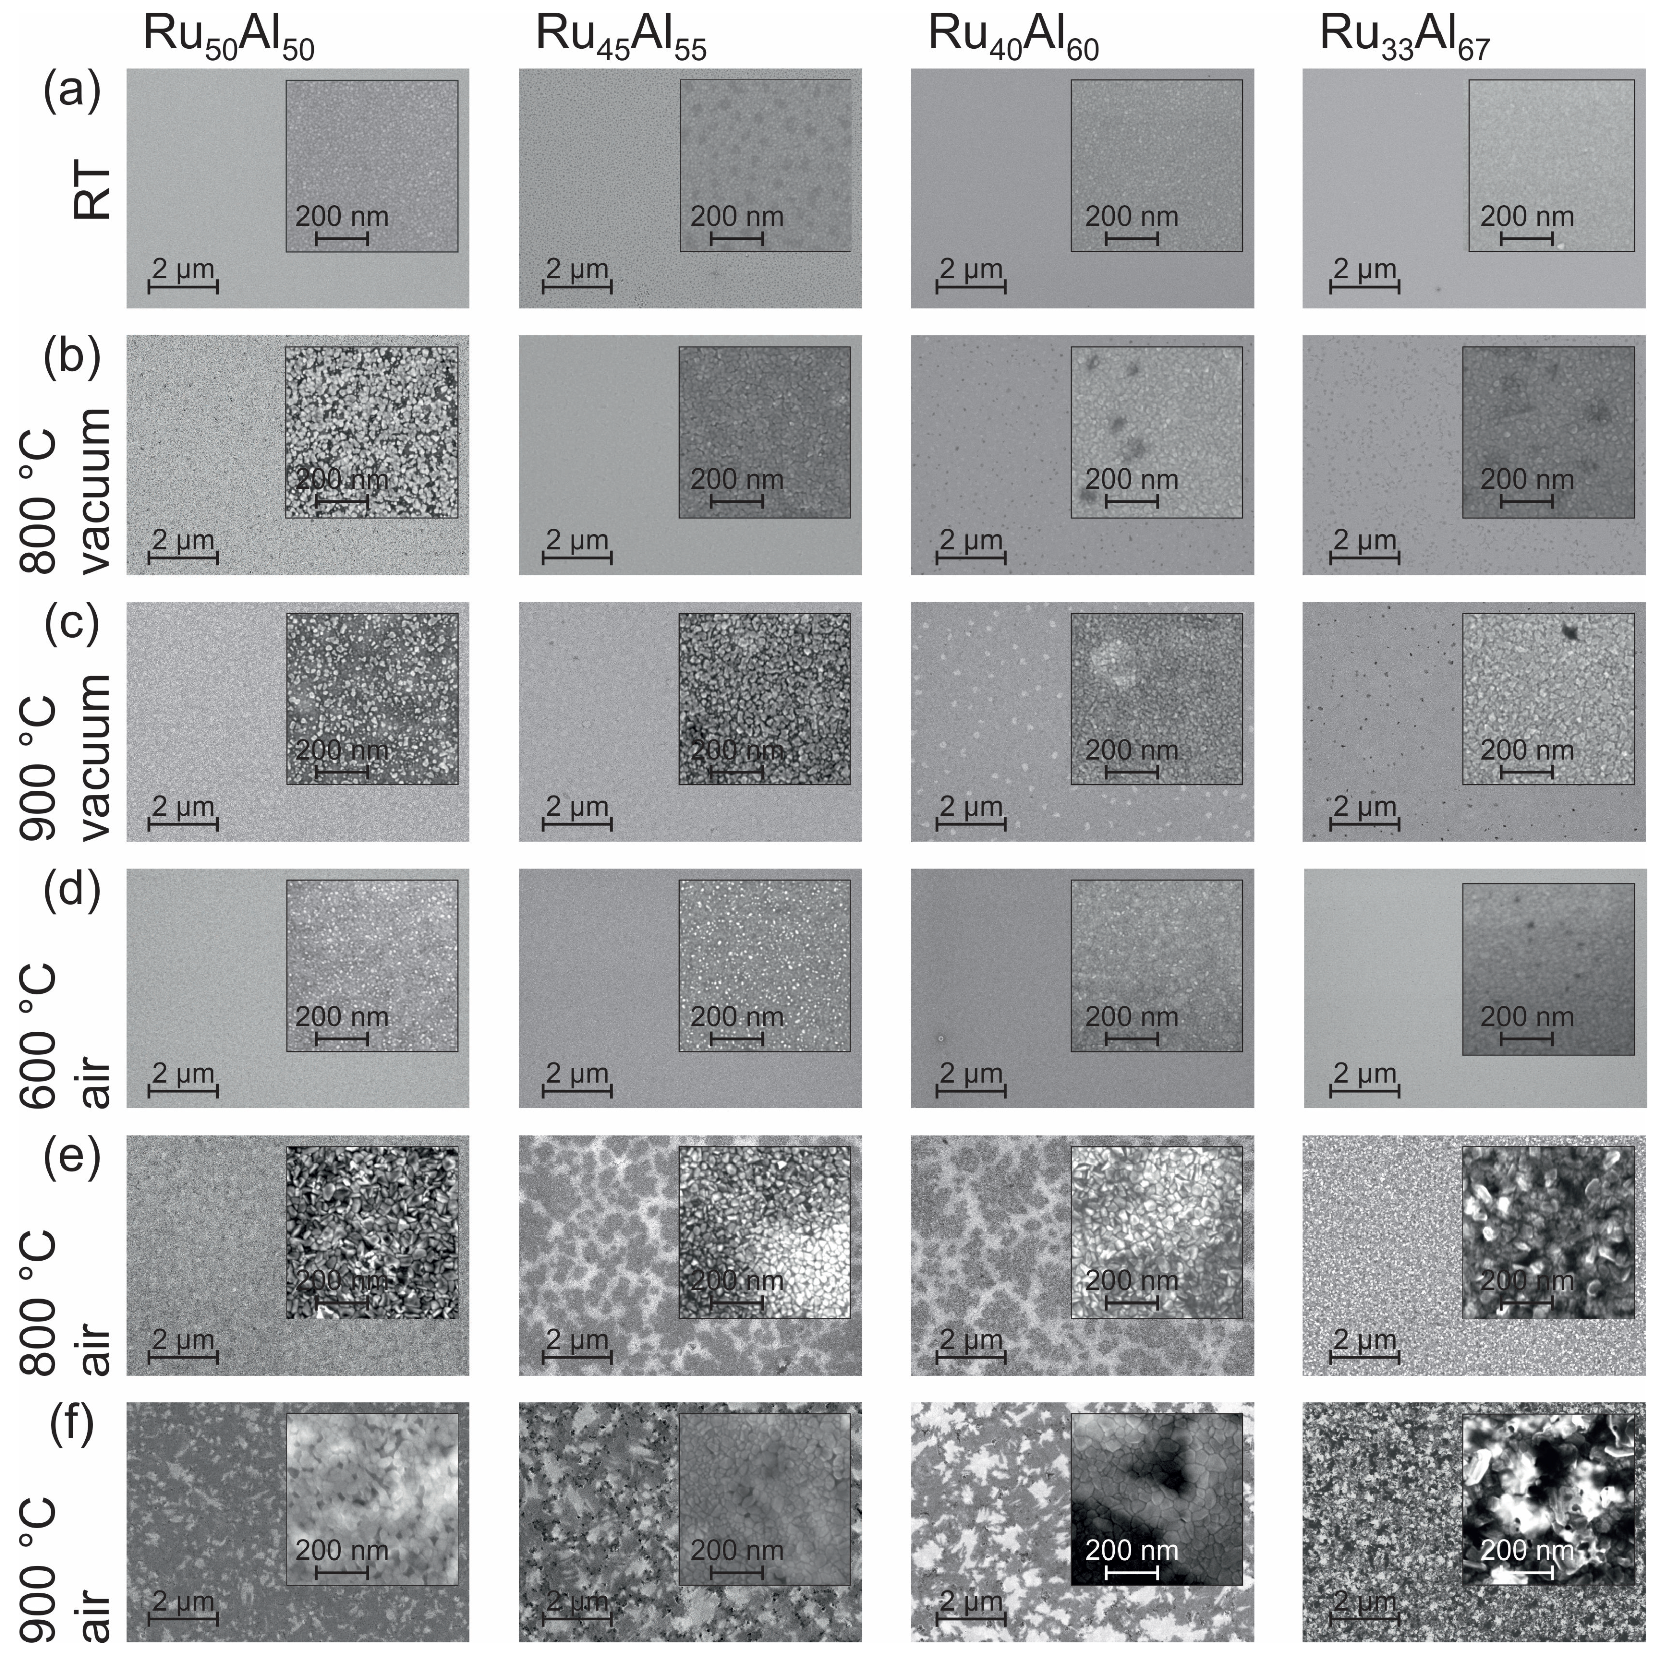
3.2. Morphology
The surface morphology can be seen in the SEM images (inLens detector at 20 kV) summarized in
Figure 2. At room temperature (RT) (
Figure 2a), all samples appear homogeneous. Only in the case of Ru
Al
is the surface a little bit spotted.
Annealing the samples at 800
C under high vacuum conditions (
Figure 2b) only leads to minor changes. In the case of Ru
Al
, we find bright separated features in a darker matrix. For Ru
Al
and Ru
Al
, darker areas are present.
The heat treatment at 900
C in high vacuum (
Figure 2c) results in a further separation of the bright structures in the Ru
Al
film and a starting separation of the features in the Ru
Al
sample. Bright areas are formed in the Ru
Al
film while the dark spots in Ru
Al
become clearer.
The annealing procedure at 600
C under air conditions (
Figure 2d) leads to the formation of very small bright spots at the sample surface. The density of those spots decreases with increasing Al content and becomes zero for the Ru
Al
film.
The film morphology after the heat treatment at 800
C in air (
Figure 2e) is completely different as compared to the previous samples. Larger structures with a high roughness have formed. In contrast to the films with a composition of Ru
Al
and Ru
Al
, those with Ru
Al
and Ru
Al
possess large dark areas embedded in a brighter matrix.
The 900
C annealing under air (
Figure 2f) shows a further modification of the morphology found for the 800
C air annealed samples. A patchy pattern is now also clearly visible for the Ru
Al
sample. The surface appears smoother than after the 800
C air annealing. The samples Ru
Al
and Ru
Al
show also a pattern consisting of irregular bright and dark areas. Within these areas, there are also larger structures that appear very smooth. The most irregular surface structure with a strong contrast is found for the Ru
Al
film.
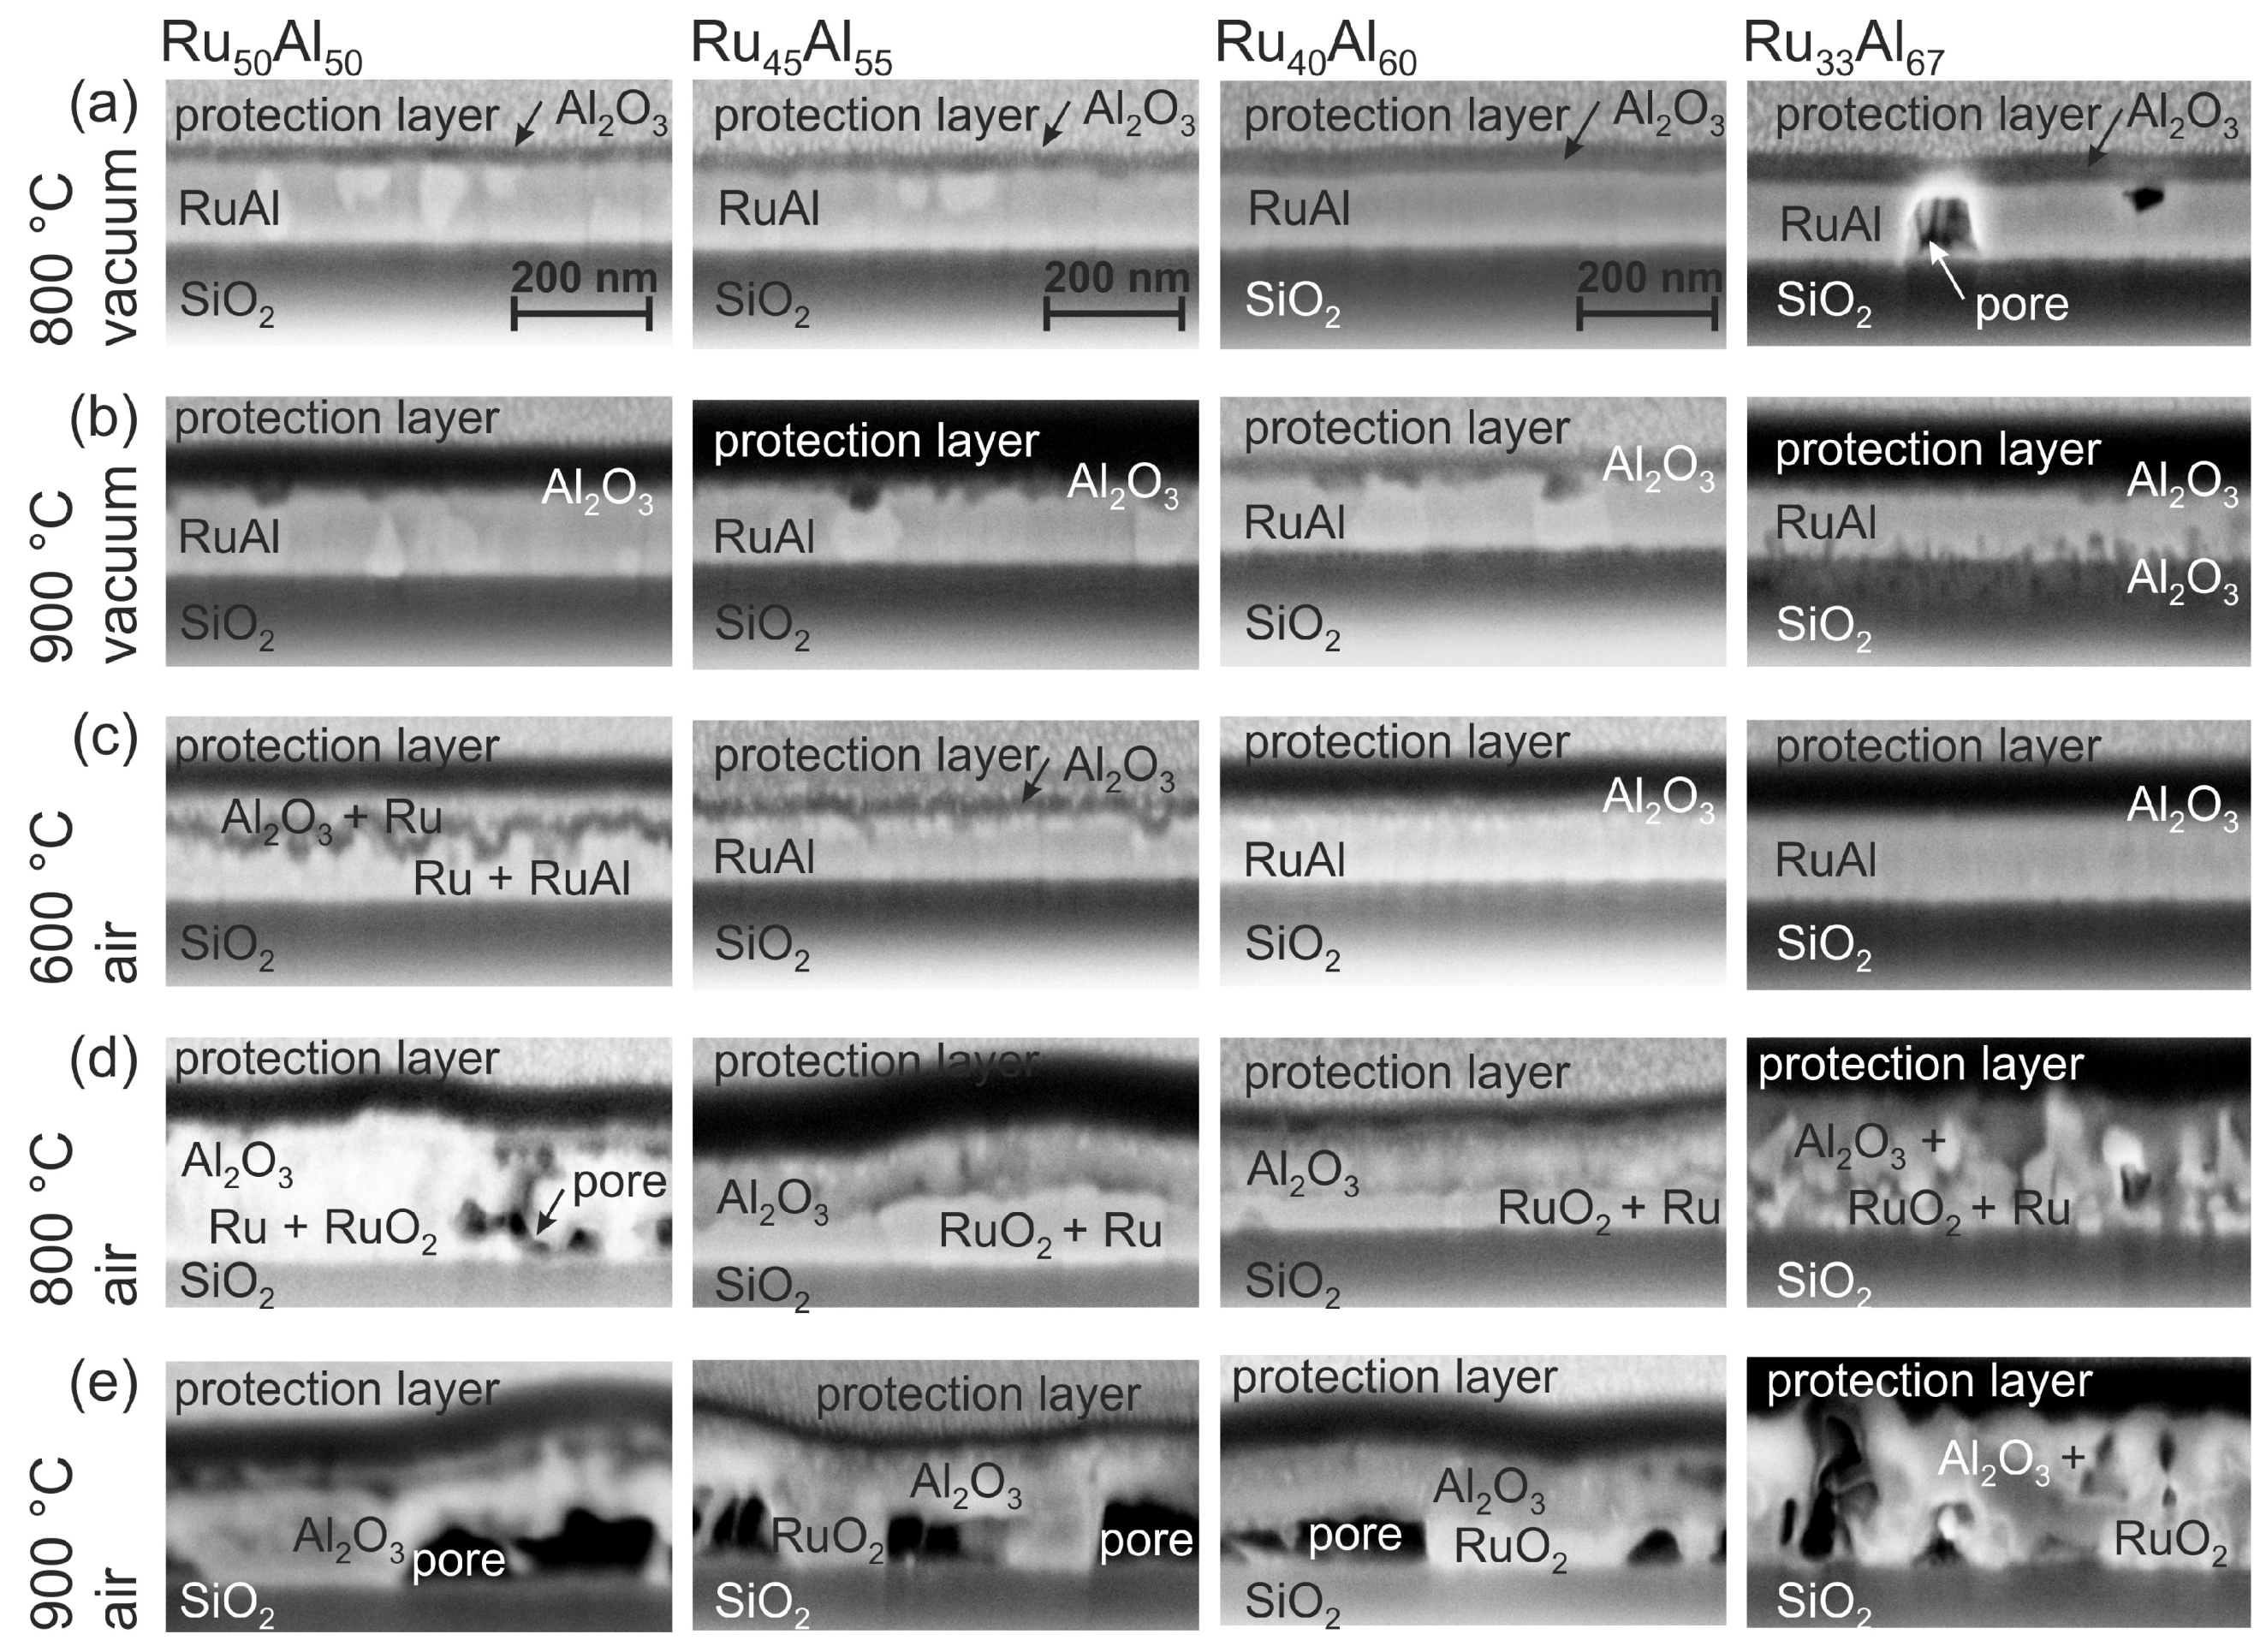
3.3. Film Architecture
SEM images of the cross sections of the films are presented in
Figure 3. The labeling of the different layers was done according to the results of the AES and TEM/EDX measurements, which are discussed in the following sections. Clear differences between the various samples and annealing conditions are visible.
The cross section images of the samples annealed at 800
C under high vacuum (HV) conditions (
Figure 3a) show randomly distributed bright grains in a matrix for the Ru
Al
sample. The number of those grains is reduced for Ru
Al
. No grain structure is visible in case of Ru
Al
and Ru
Al
; however, pores are formed in the latter film. These pores might be the origin of the dark spots that are visible in the SEM surface images.
After the heat treatment at 900
C under high vacuum (
Figure 3b), still bright grains are present in the case of Ru
Al
and Ru
Al
. A grain structure is now also visible in the Ru
Al
sample. For these three films, small dark areas appear in the upper region of the film. In the case of the Ru
Al
film, dark features have developed at the interface to the substrate. A cross section image of a more extended sample region of the Ru
Al
film confirms pores also in this sample, which explain the dark spots in the surface images.
Annealing at 600
C under air conditions (
Figure 3c) results in the case of Ru
Al
and Ru
Al
in a multilayer structure. There is a very irregular dark layer in the upper region of the film. This layer is much smoother in case of Ru
Al
. An additional thin bright layer is visible below the darker one. Such interlayers are not distinguishable in the other two systems. For Ru
Al
, the images reveal a thin layer of bright grains at the sample surface, while the sample with the highest Al content appears completely homogeneous.
The heat treatment at 800
C in air (
Figure 3d) leads to pores in the lower region of the Ru
Al
film. In contrast to this, the Ru
Al
and Ru
Al
samples are continuous with a two-layer structure. There are larger bright grains in the lower part of the film covered by a darker, more heterogeneous layer. The thickness of the lower layer changes laterally, which might also explain the differences in brightness in the SEM surface images. A completely inhomogeneous morphology has formed for the film with the Ru
Al
composition. The large surface roughness that results from these grains confirms the roughness visible in the surface images.
The annealing process at 900
C in air (
Figure 3e) results in the growth of the pores in the lower part of the Ru
Al
, Ru
Al
and Ru
Al
sample. These pores are covered by a continuous thick layer. The presence of these large pores also in this case explains the different structures, which are visible in the images taken of the sample surface. The Ru
Al
sample behaves differently. In contrast to the other samples, this film is still quite compact with only small pores distributed randomly over the whole film thickness.
3.4. Film Chemistry
In the following, the results of the AES measurements concerning the film chemistry will be discussed. It has to be remarked that the AES results show mean values of the composition, since the layers are not homogeneous, e.g., Ru-rich grains and the RuAl-matrix as well as AlO and Ru or RuO grains after annealing in air are measured simultaneously. Therefore, the AES results have to be interpreted with support of the XRD results and cross-section images.
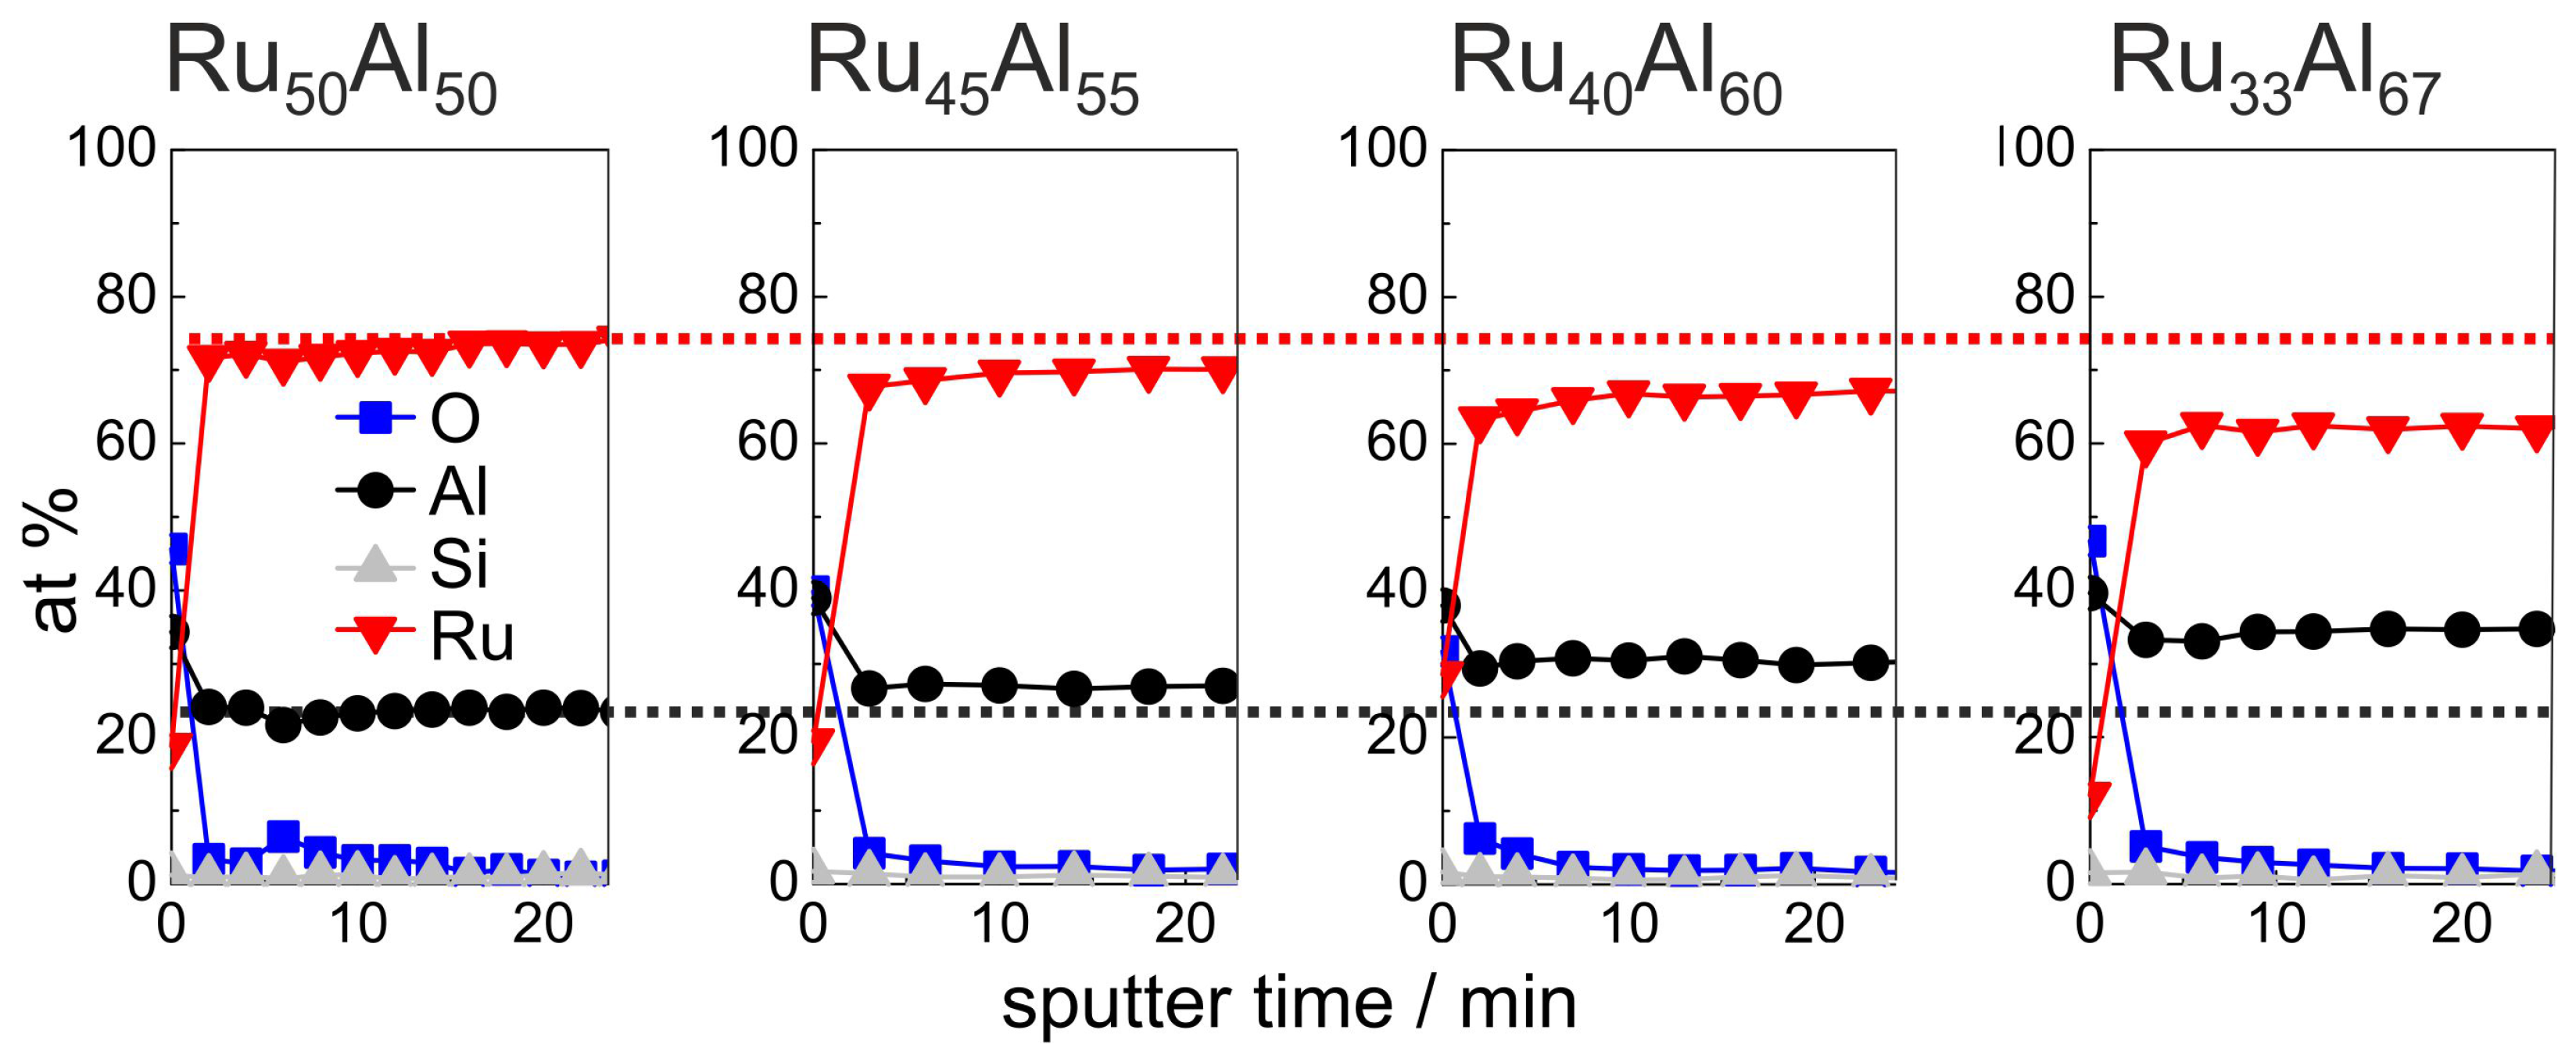
Figure 4 summarizes the initial 24 min of the AES measurements (for complete measurements, see Figure 7a) of the as-deposited samples, which verify the increasing Al and decreasing Ru content in the sample series, which was intended by the deposition. Additionally, the existence of a very thin Al
O
oxide layer at the film surface is proven. However, the measured ratio between Ru and Al differs clearly from the deposited one, i.e., the absolute at % values that are derived from the AES measurements do not depict the actual composition. Further AES and XPS (X-ray photoelectron spectroscopy) investigations have shown that this is caused mainly by strong preferential sputtering effects in the Ru-Al-sytem [
17], so that quantitative conclusions are not possible. However, the results allow a qualitative comparison between the samples.
The development of the sample chemistry after the various annealing procedures will be discussed based on the reference Ru
Al
and exemplary Ru
Al
samples. The overview image Figure 7, which summarizes the AES measurements of all samples and for all annealing procedures, shows that the behavior of the Ru
Al
sample is between these two films. For the sample with the highest Al content, additional effects are visible which will be discussed subsequently.
Figure 5 presents the measurements of the as-deposited and vacuum annealed state of the Ru
Al
and Ru
Al
samples. The results of the as-deposited films are repeated since they serve as a reference for the annealed samples.
Annealing at 800
C under HV conditions (
Figure 5b) leads to the formation of an Al
O
layer on top of the film. This layer is much thicker for the film with higher Al content (16 min of sputtering Al
O
compared to 8 min). As a consequence of this oxide layer formation, the mean value of the measured Ru content increased slightly. In the case of the Ru
Al
sample, the mean Ru content results from Ru-rich grains and a Ru-Al matrix (see
Figure 3a), while such an inhomogeneity is not visible for the Ru
Al
film.
Annealing at 900
C under HV conditions (
Figure 5c) results in a broader transition between the Al
O
layer on top of the film and the Ru-Al matrix in the case of the Ru
Al
sample. In contrast to this, in the case of the Ru
Al
film, the Al
O
cover layer is thinner as compared to the 800
C case. Here, a different oxidation kinetics at 800
C as compared to 900
C has to be assumed, which leads to a more stable and more protective and with this thinner Al
O
layer.
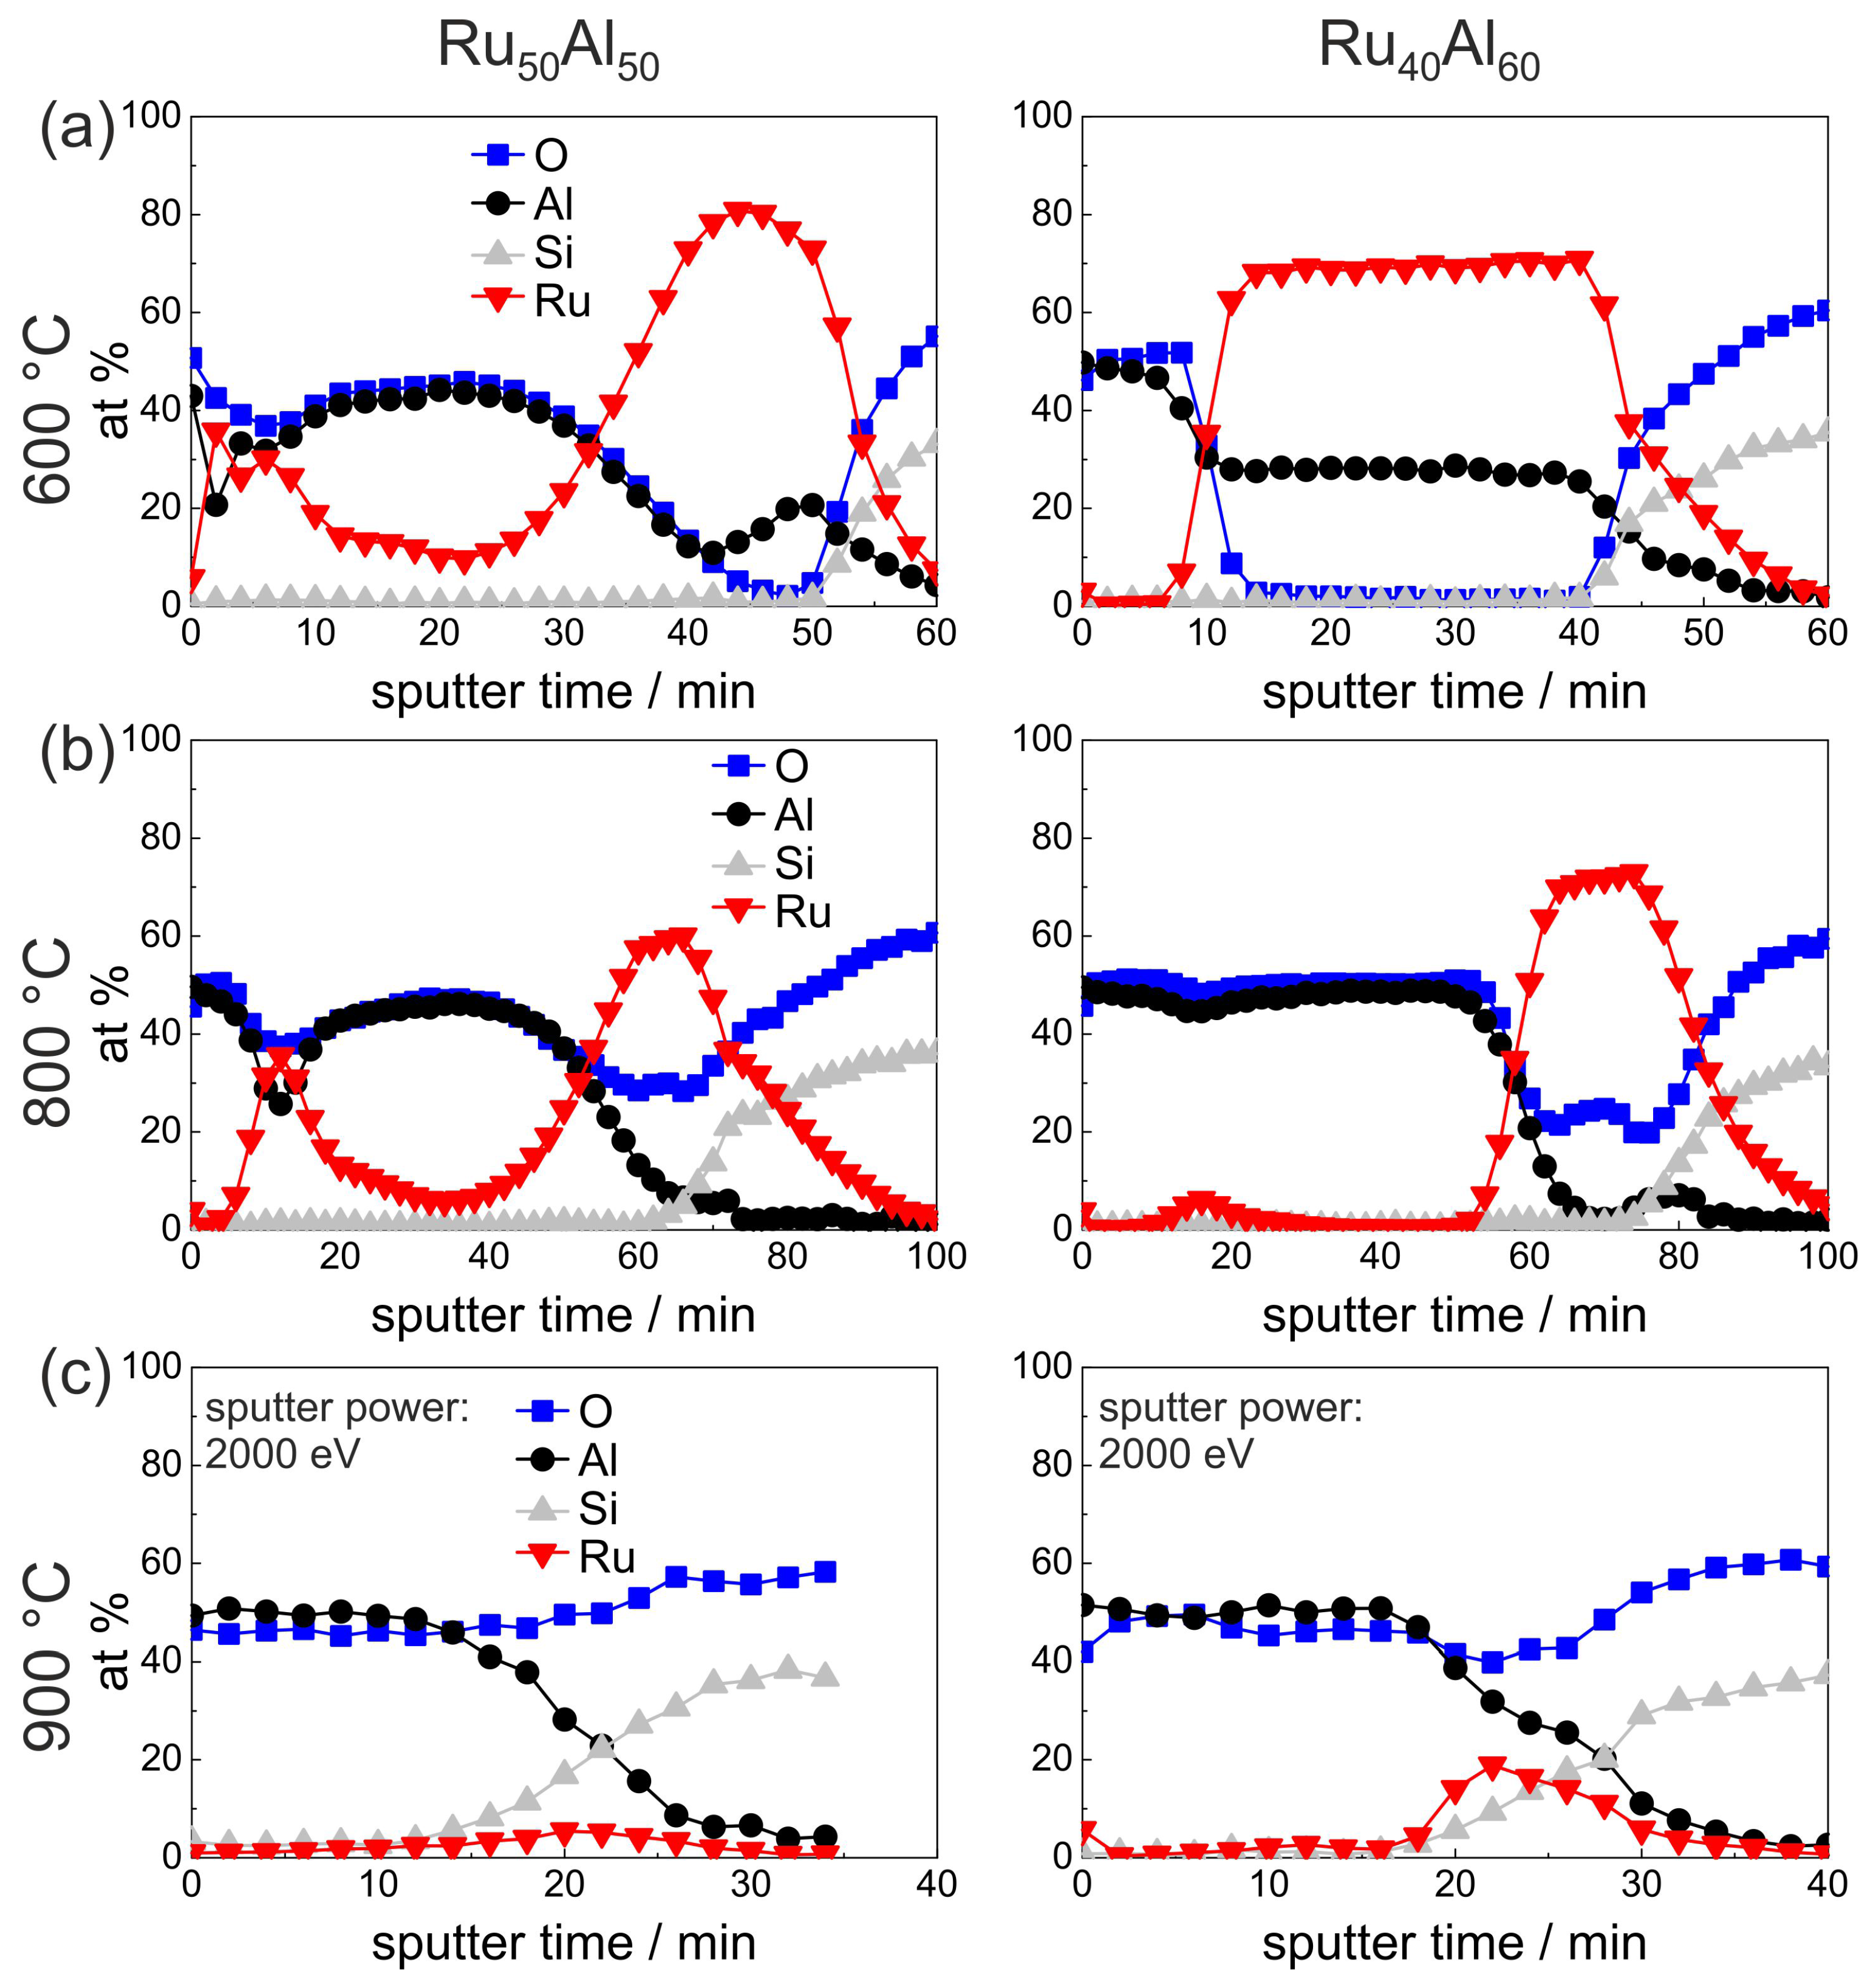
The AES results of the air-annealed Ru
Al
and Ru
Al
films are presented in
Figure 6. A clear difference is visible after annealing at 600
C in air between both samples. While the Ru
Al
film retains the bilayer Al
O
/Ru-Al/substrate architecture, the structure of the Ru
Al
sample is completely different. Together with the cross section image (
Figure 3c), the film architecture can be assumed as a multilayer structure. There is an Al
O
layer at the surface, which also contains Ru. As can be seen from the cross section image, the layers on top of the film are very rough, so that, especially in this case, AES measures a mixture between the individual layers. Below the Al
O
, there is an Ru-rich and an Ru-Al layer, which are thinner than the remaining Ru-Al layer of the Ru
Al
film. It has to be remarked that a quantitative relation between the sputter time and the film thickness of layers of different material is hardly possible due to the different sputter yields and the co-sputtering of several layers.
Also after annealing at 800
C in air, both samples differ strongly (
Figure 6b). The sputter time necessary to reach the substrate has increased as compared to the measurements discussed above, especially for the Ru
Al
film. The increase in sputter time can be attributed to the lower sputter yield of Al
O
as compared to the metallic Ru-Al. The cross section images (
Figure 3d) show a completely inhomogeneous film for the Ru
Al
sample and the formation of pores near to the interface with the substrate. The AES measurements indicate the formation of a thick Al
O
layer on top, which contains an accumulation of Ru near to the surface. Between the Al
O
layer and the substrate there is a RuO
layer. According to the XRD measurements (
Figure 1), a small amount of metallic Ru is still present.
In contrast to this, the RuAl film has a much more homogeneous architecture with a thick AlO layer on top, which does not contain any Ru besides a small accumulation at a sputter time of around 18 min. Below, there is a layer consisting of Ru and RuO.
The measurement of the 900
C air annealed samples (
Figure 6c) was performed with a higher ion beam energy, which was necessary due to charging of the sample surface due to the completely oxidic character of the remaining films. For the Ru
Al
sample, the AES measurement showed hardly any remaining Ru within the film. A higher amount of Ru remains in the case of the Ru
Al
sample, but the total amount of Ru has also decreased drastically. In both cases, the cross section images (
Figure 3e) show the presence of large pores. However, for the Ru
Al
film, RuO
grains are also present. The decrease of the Ru content and the formation of cavities can both be ascribed to the further oxidation of RuO
to gaseous RuO
or RuO
species.
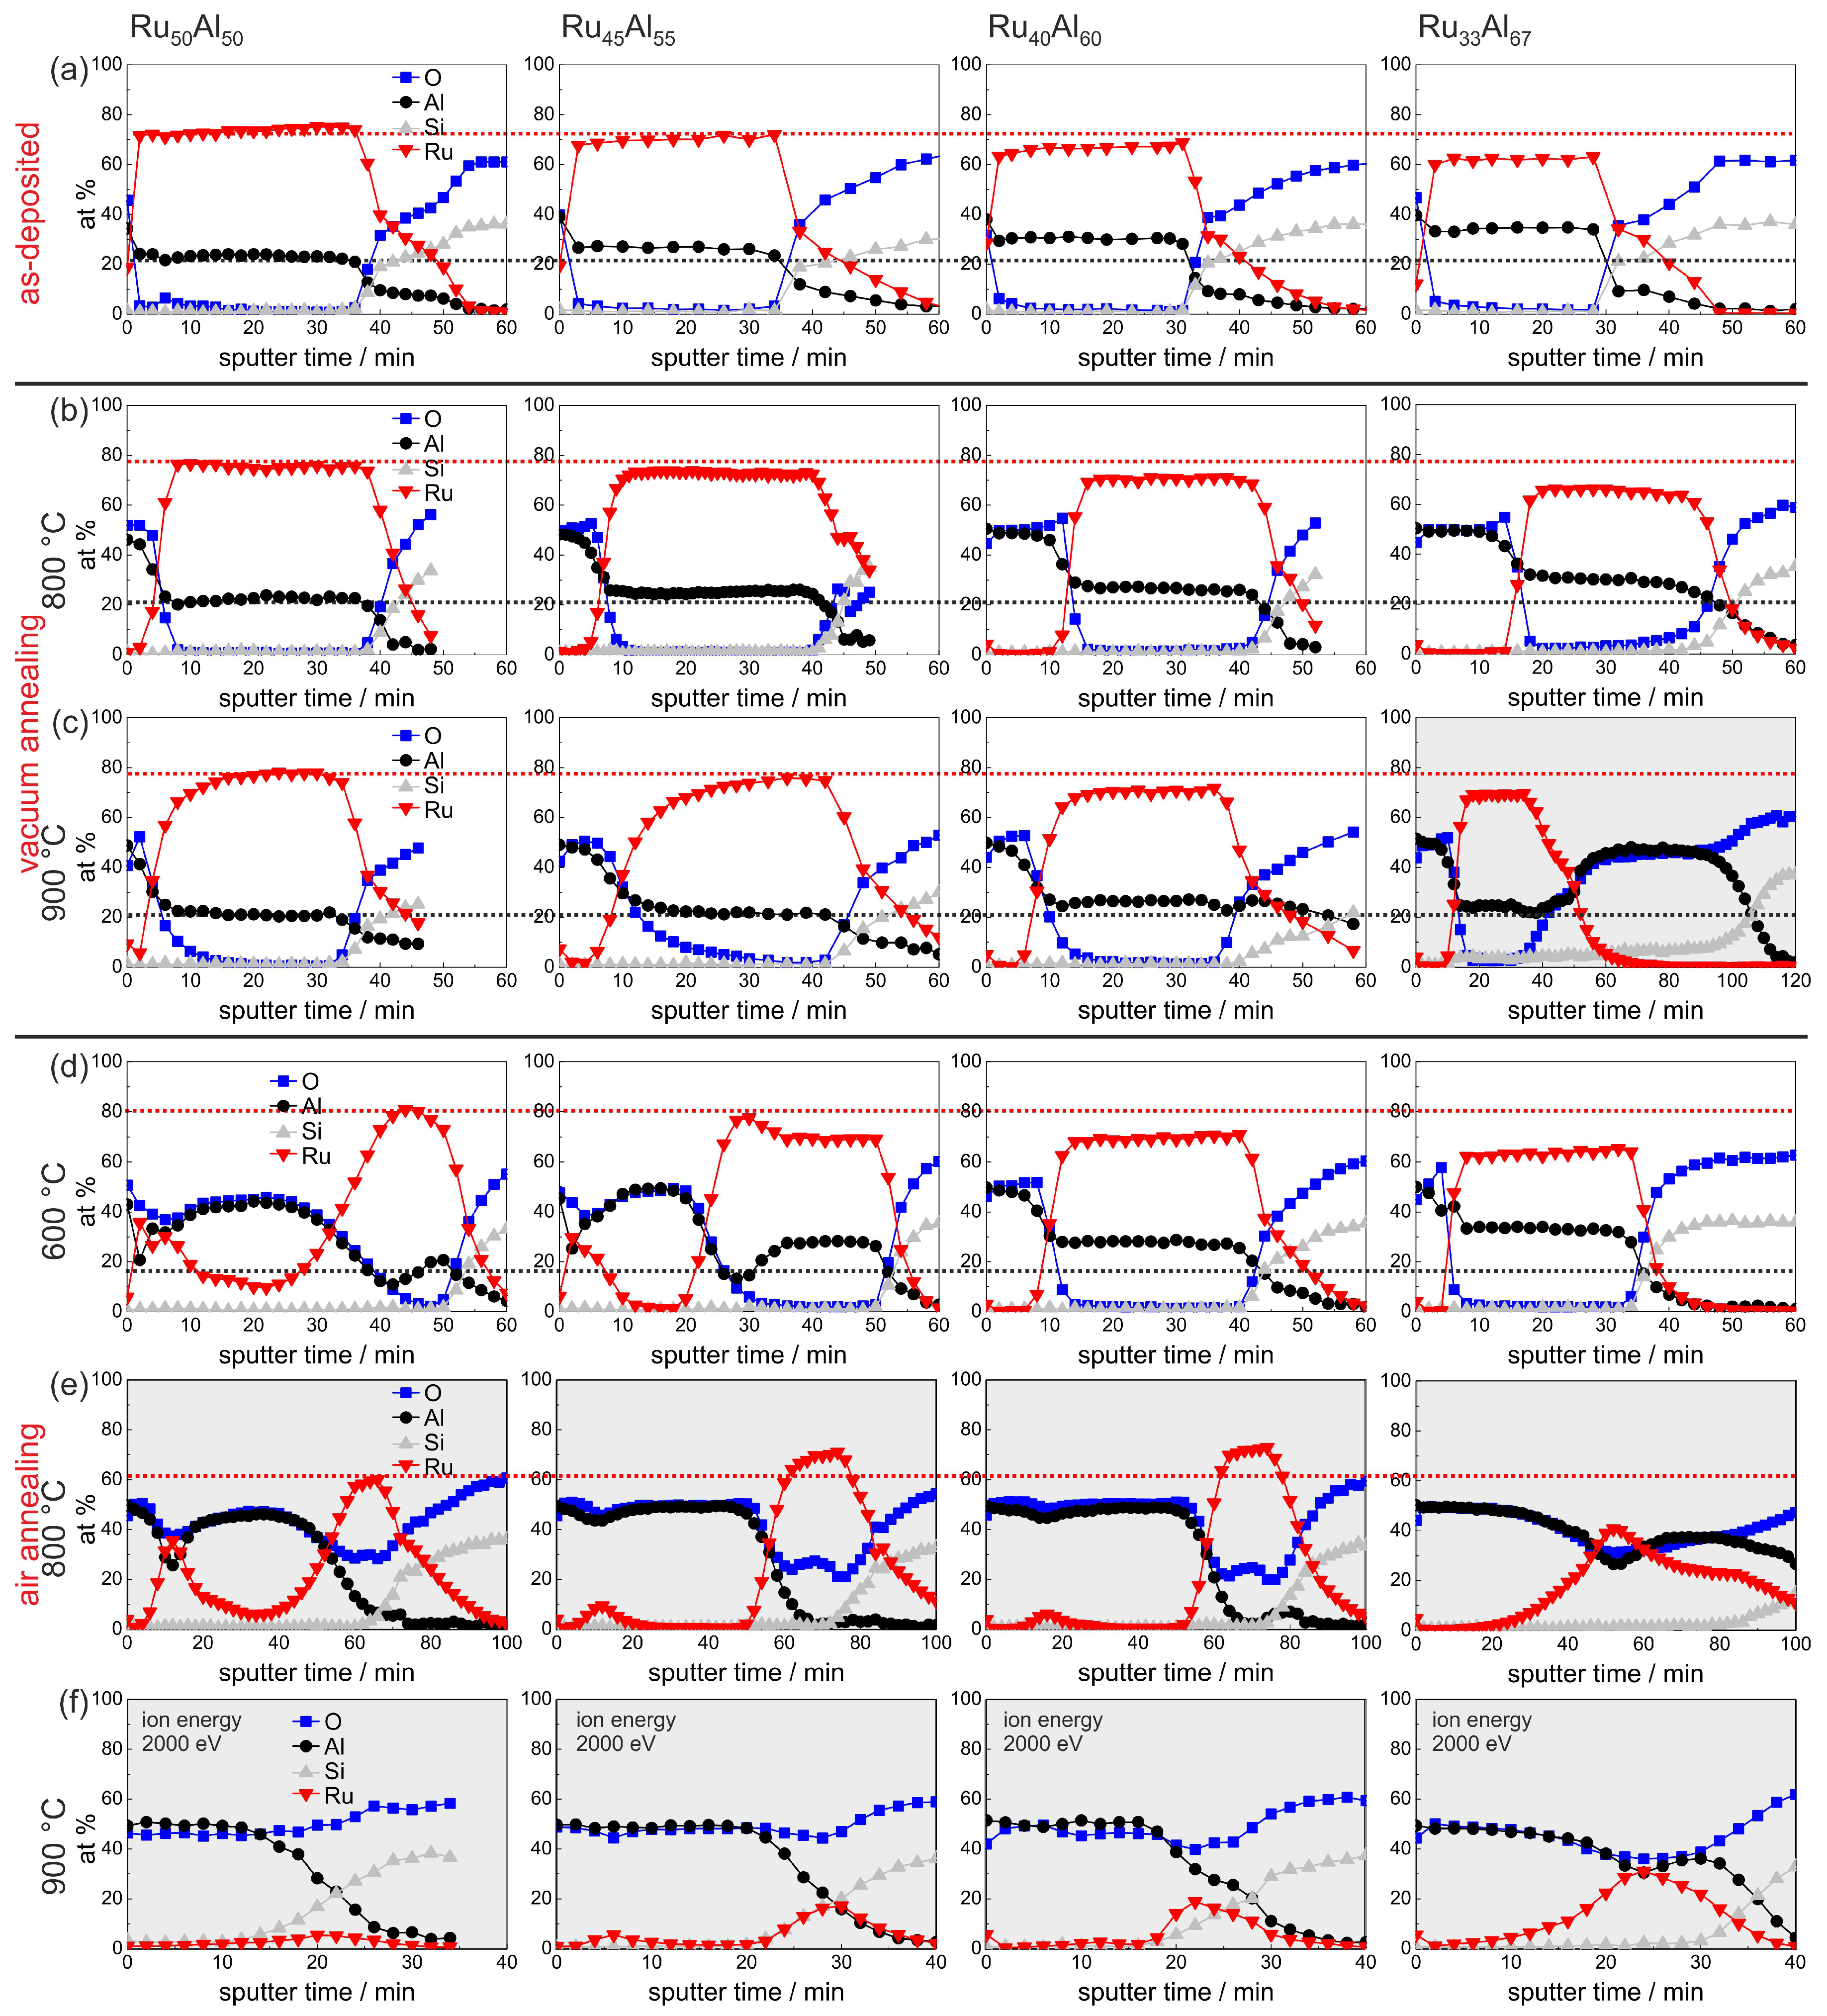
An overview summary of the results of the AES measurements of all samples with the different compositions and for the different annealing temperatures is presented in
Figure 7. In
Figure 7a–e, the red and the black dotted lines indicate the maximum Ru and Al content, respectively, in the reference Ru
Al
sample, which simplifies the comparison between the films. This assembly of all measurements, depending on both the initial composition and the annealing temperature, allows a direct comparison of all samples.
The sample with the lowest Ru content Ru
Al
shows some peculiarities compared to the other films. The AES measurement of the 900
C vacuum annealed sample (
Figure 7c) reveals a strong reaction between the film and the substrate. The sputtering of the Ru-Al layer is followed by a more than 40 min sputtering of an Al
O
layer. However, the thickness of this layer is probably overestimated due to charging effects. A reaction between the film and the substrate after annealing at this temperature is also indicated by the cross section image (
Figure 3b) where inhomogeneities between the Ru-Al layer and the substrate are visible. Moreover, after annealing at 900
C in air (
Figure 7f), this sample contains the highest residual Ru content of all prepared samples in this series.
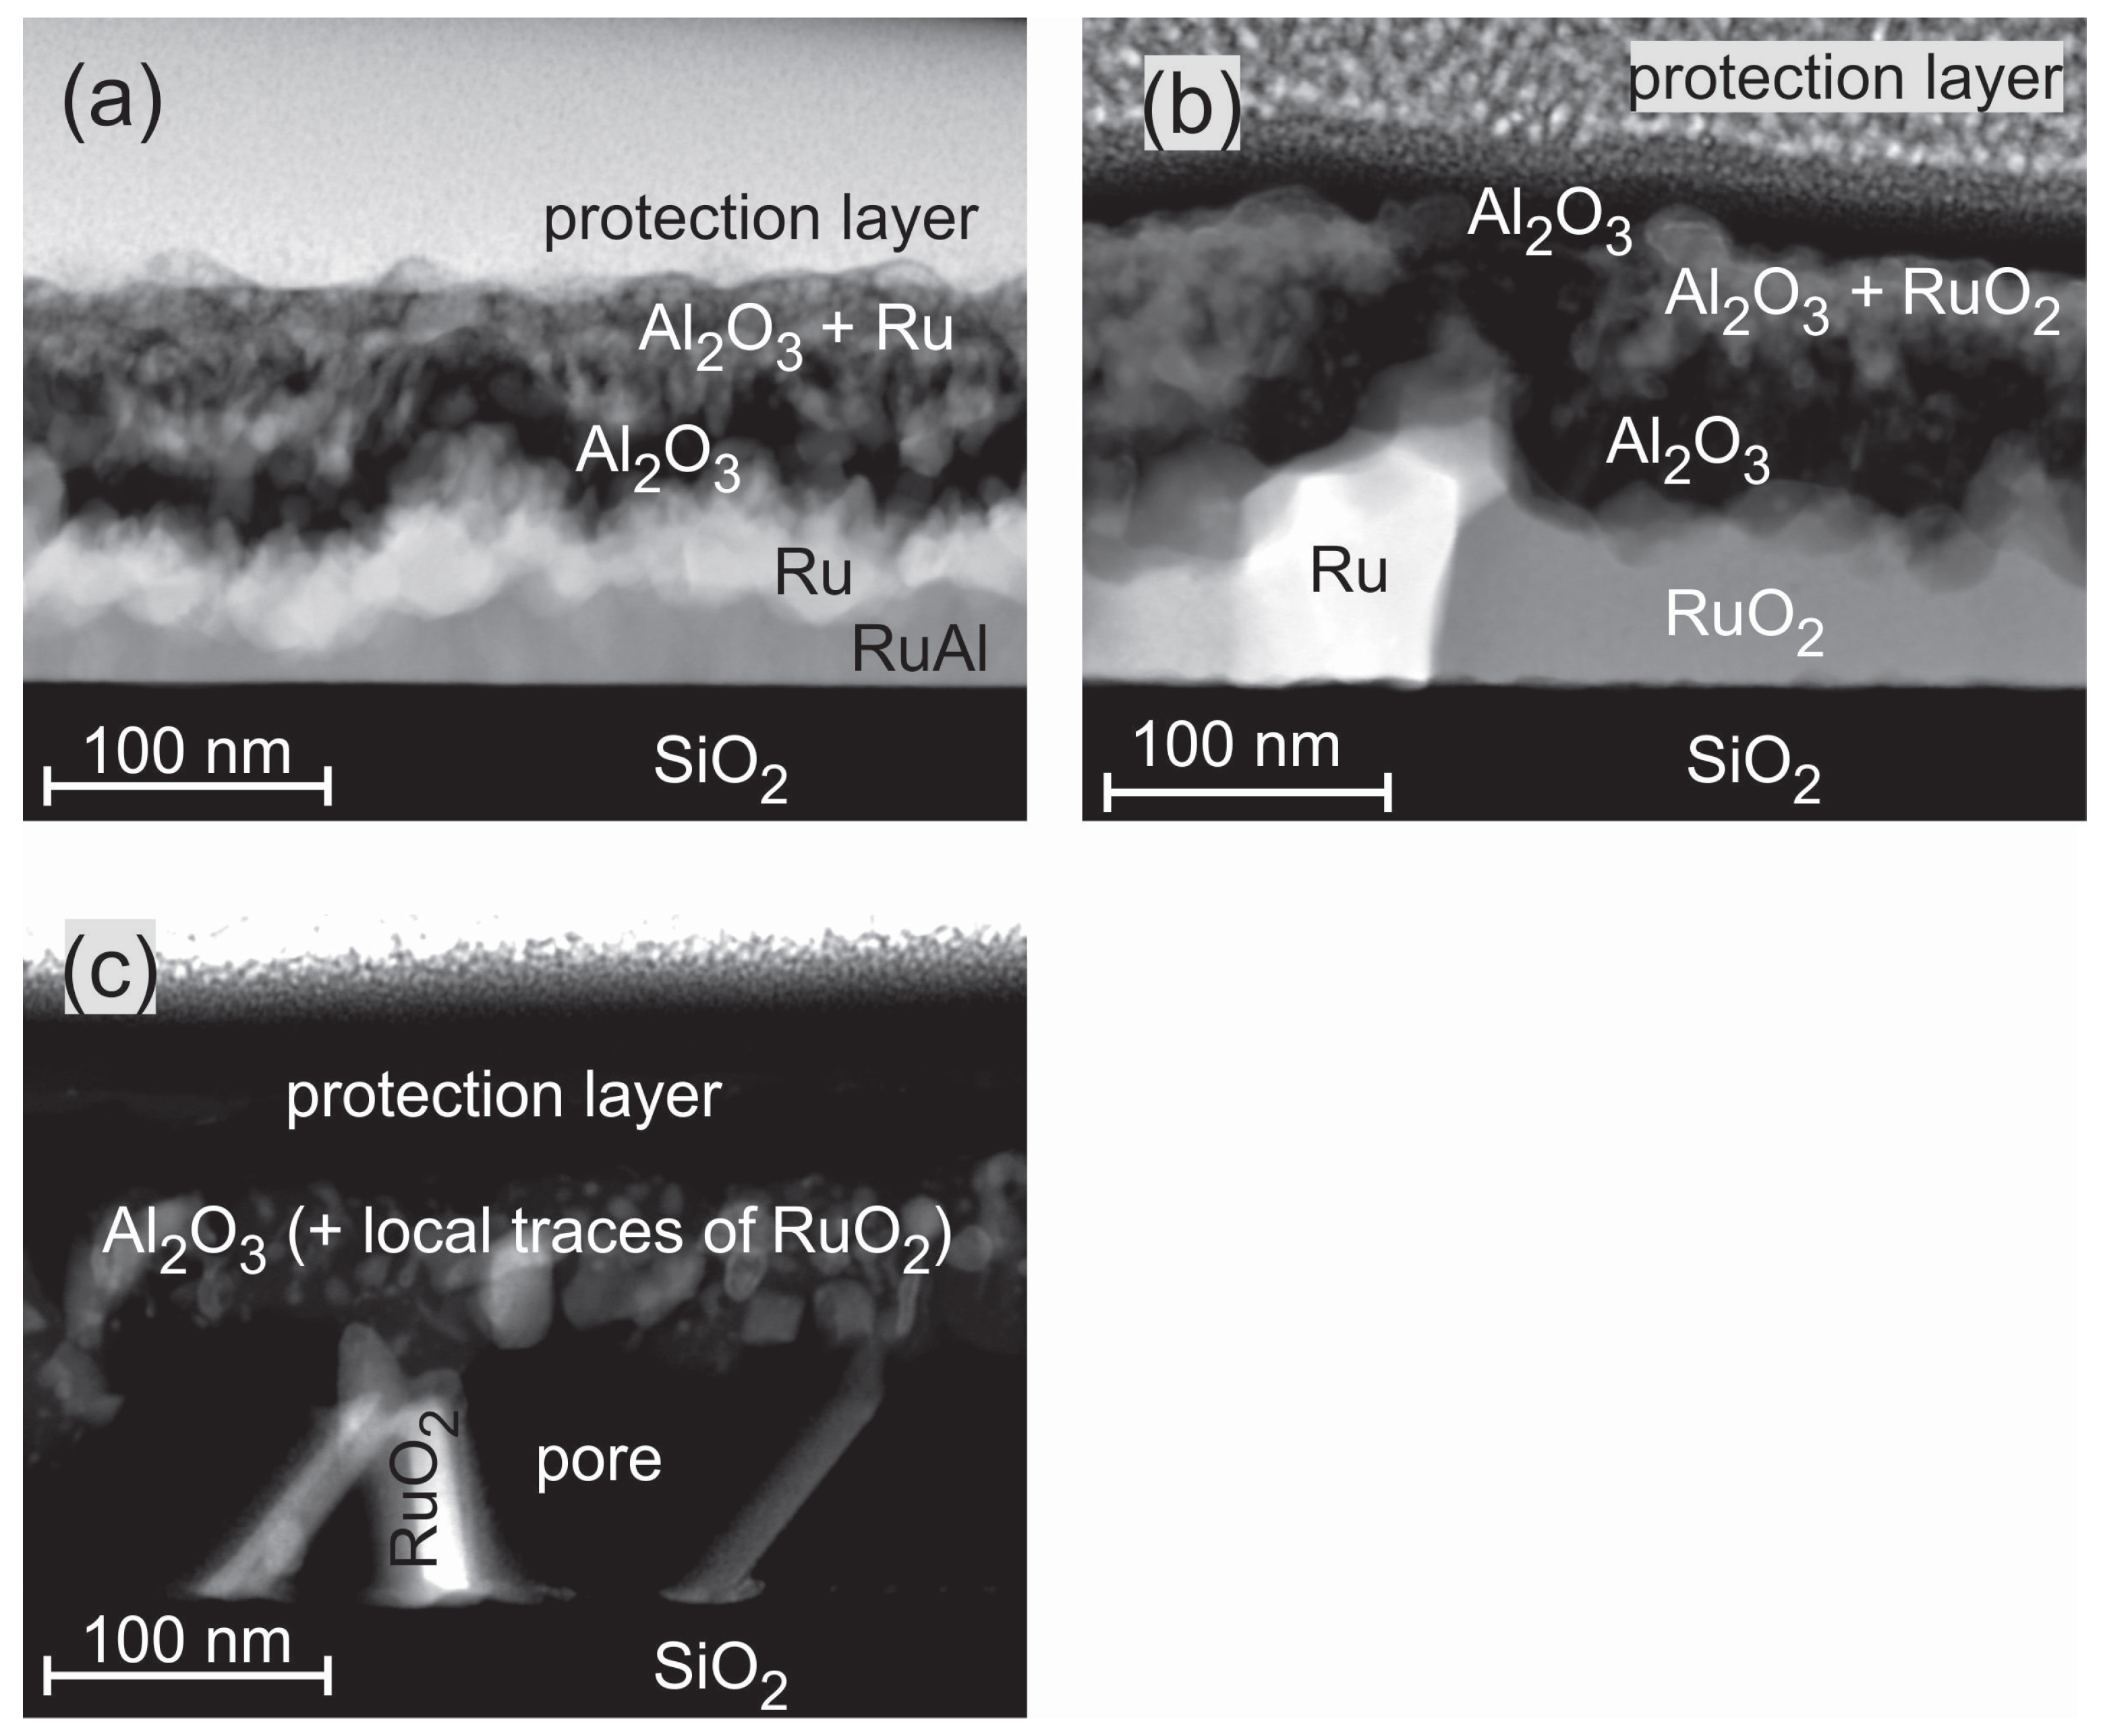
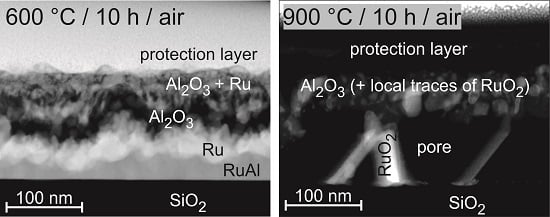
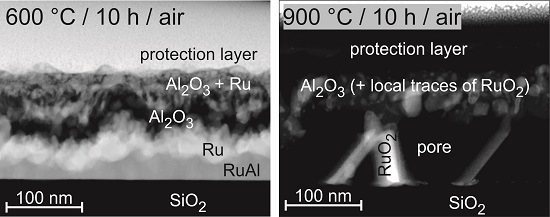
Figure 8 presents HAADF STEM images of the exemplary Ru
Al
samples for the annealing steps under air conditions. The images confirm the complicated film structure that was derived from the cross section SEM images and AES measurements. After annealing at 600
C, the STEM images show a four-layer structure (
Figure 8a). Above the SiO
substrate, a thin Ru-Al layer with varying thickness (≈10–50 nm) is present, followed by a layer consisting of pure Ru (≈40 nm). On top of it, there is a layer of pure Al
O
(≈30 nm) followed by a matrix of Al
O
with embedded Ru grains (≈20–50 nm). An Ru rich layer directly below the sample surface as indicated by the AES measurements was not confirmed in the particular position of the STEM measurement.
The annealing at 800
C (
Figure 8b) under air conditions leads to the partial oxidation of Ru. Above the substrate, a layer consisting of Ru grains embedded in a RuO
matrix has formed (≈40–90 nm). Above this layer, a thicker Al
O
layer as compared to the 600
C case (≈60 nm) is present. For the 800
C sample, a thin layer (≈20 nm) with an accumulation of RuO
grains within the Al
O
, which was detected by AES, is now clearly visible. The film is covered with a pure Al
O
layer.
During the annealing of the sample at 900
C in air (
Figure 8c), a further oxidation of the RuO
takes place. The formation of gaseous RuO
species leads to the development of pores in the former Ru/RuO
layer. The upper part of the film consists of Al
O
. The EDX analysis proves the presence of few Ru species at single regions in the Al
O
. This fits with the AES data, which only show a small amount of Ru (up to 5 at %) close to the interface of the SiO
substrate. The wide transition zone in the AES measurement between the film and the SiO
evolves from large pores that account for more than 50 % of the lower layer between the scattered RuO
grains. This leads to a simultaneous sputtering of RuO
and the SiO
substrate.
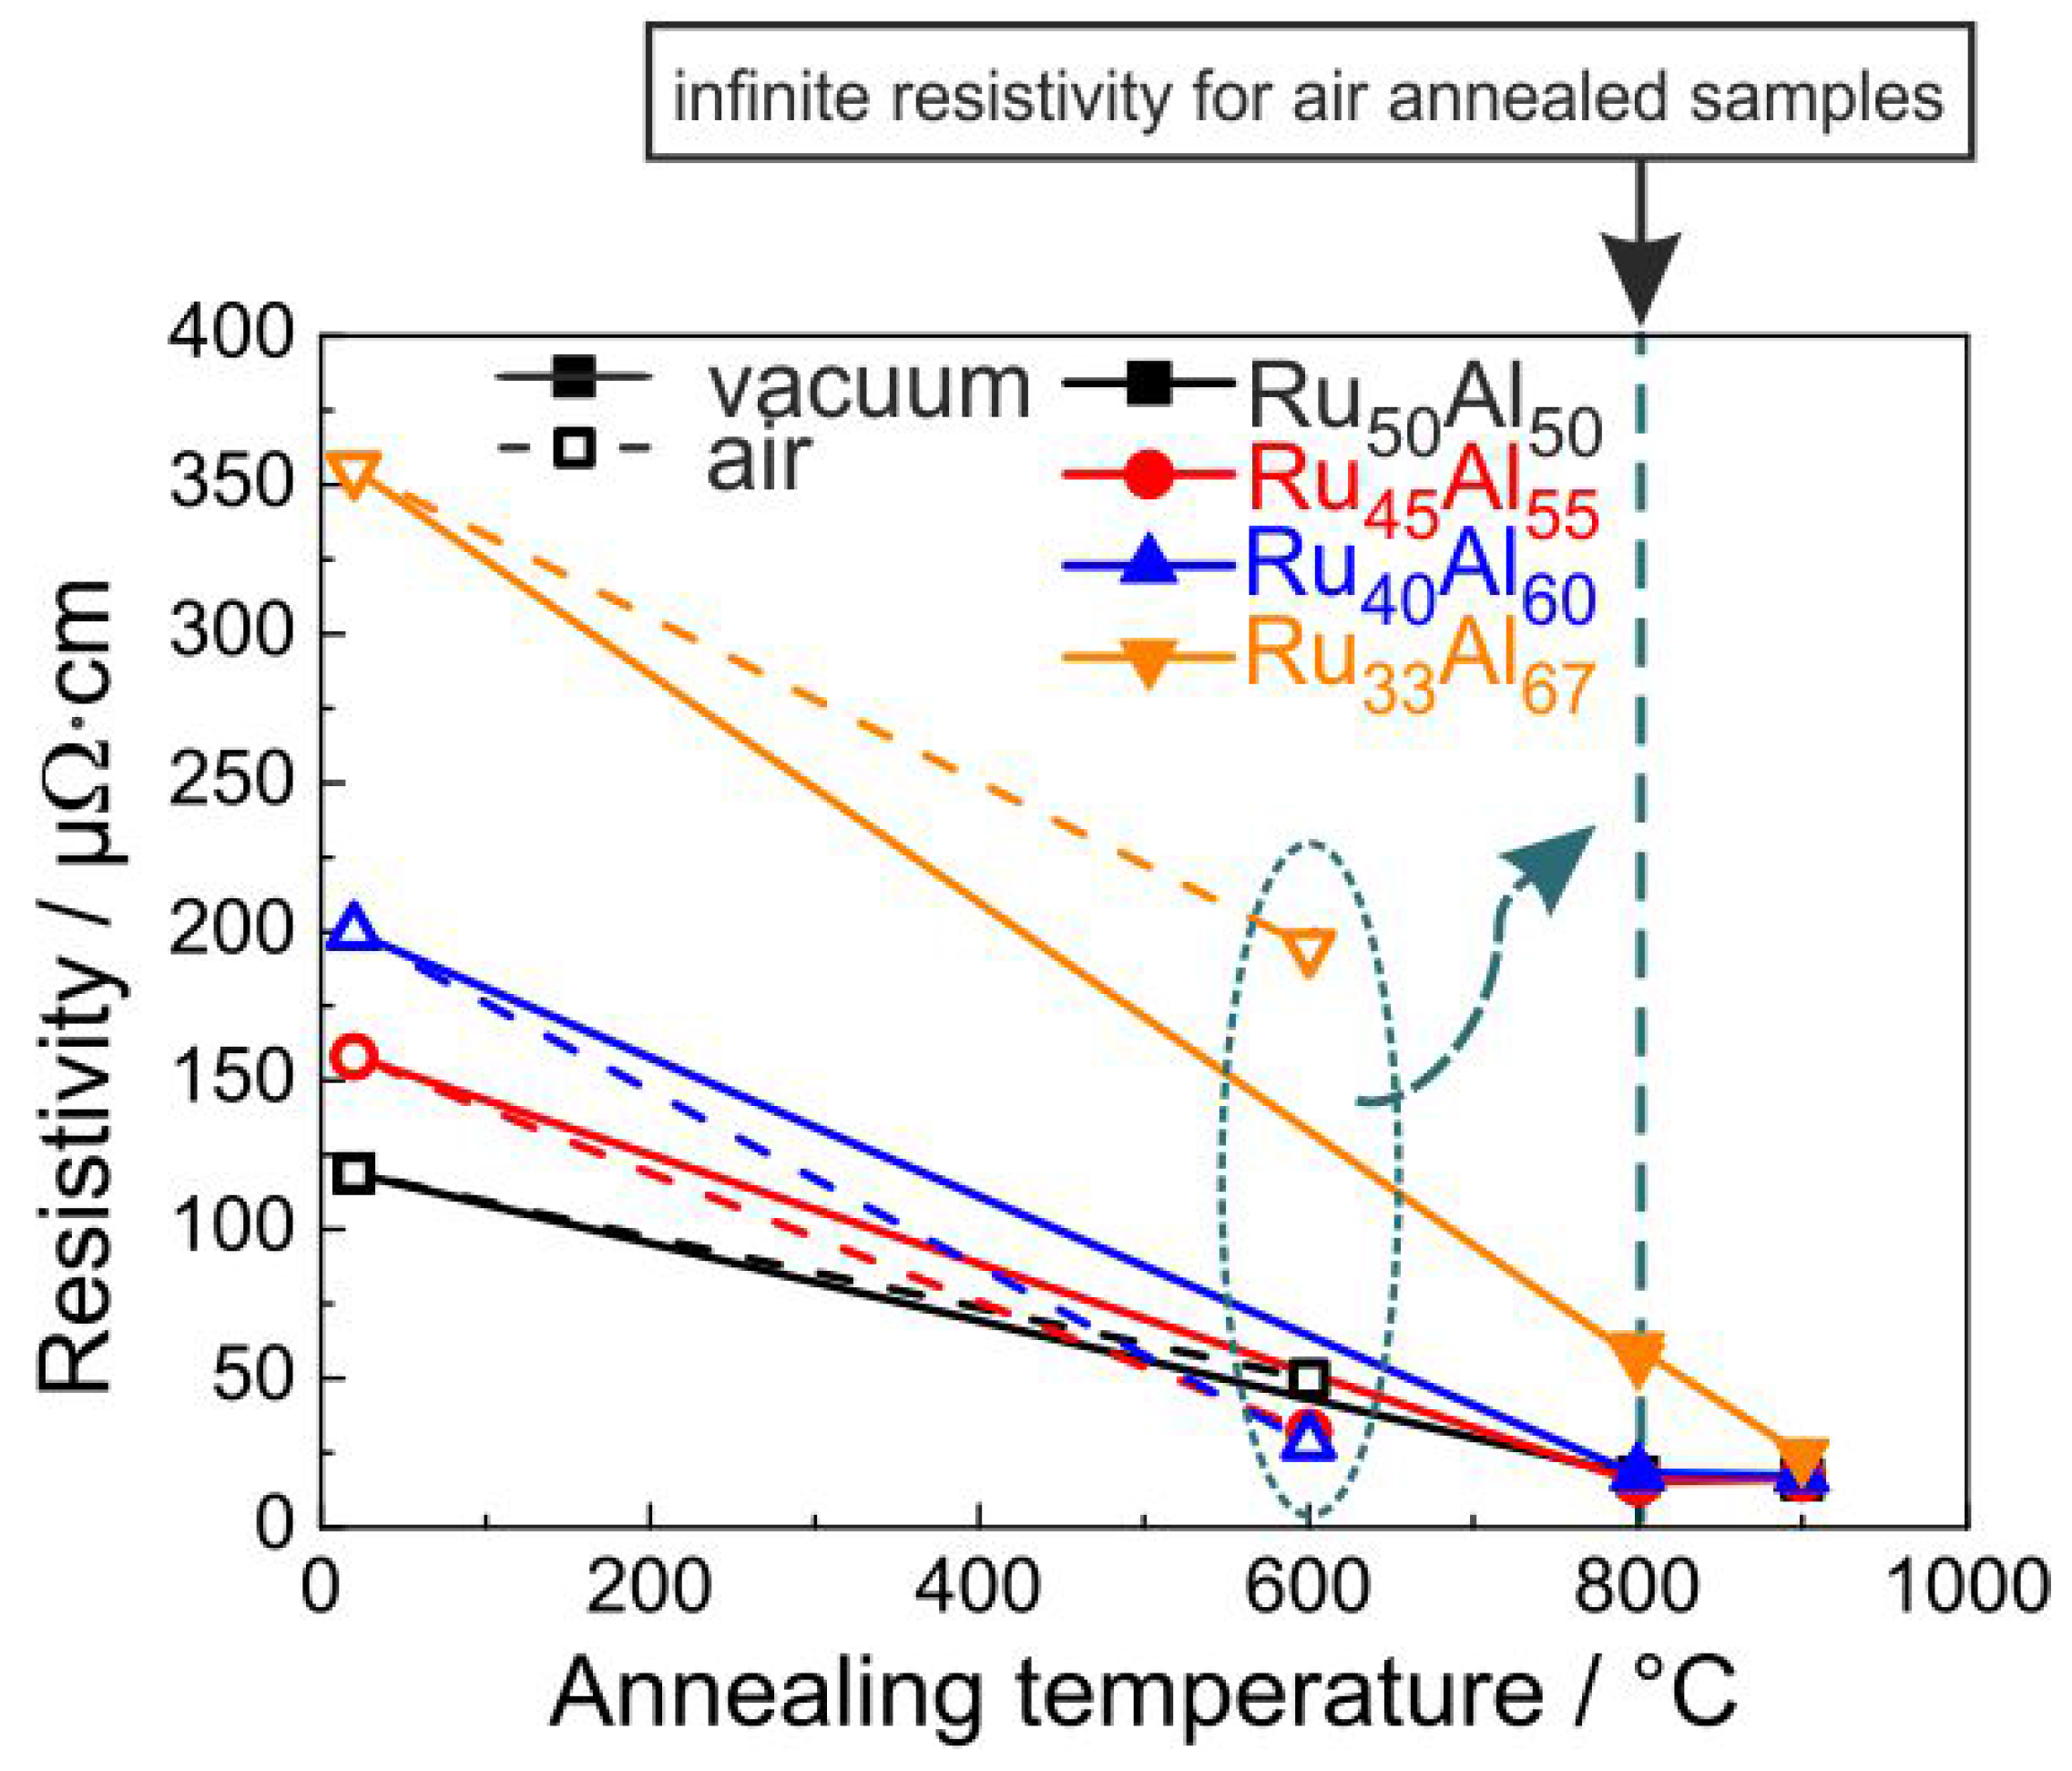
3.5. Electrical Properties
Since, for the application as metallization film, the electrical properties play an important role, the electrical resistivity was measured for the samples at RT after the annealing process. The results are presented in
Figure 9. The resistivity was calculated from the sheet resistance considering the thickness of the films measured after deposition. Of course, due to the annealing process and the formation of the oxide layers, the real thickness of the conductive layer becomes smaller. The non-conductive oxides on top of the films and the formation of voids within the layers also complicate these measurements. Therefore, the results in
Figure 9 represent only a mean value of the resistivity for the respective piece of sample.
It is obvious that a higher Al content leads to a higher resistivity for the as-prepared samples. The XRD measurements showed a reduced crystallization with increased Al content, which can explain this trend of the electrical properties. The heat treatment under high vacuum conditions leads to a strong reduction of the resistivity. After annealing at 800
C, all samples except the Ru
Al
film (60
cm) possess the same resistivity of about 17
cm. The heat treatment at 900
C hardly changes the resistivity of the Ru
Al
, Ru
Al
and Ru
Al
samples. The value of Ru
Al
further approaches the values of the other films and reaches 24
cm. The clear reduction in electrical resistivity is in agreement with the crystal growth, which is visible from the sharper peaks and higher intensity in XRD measurements as seen in
Figure 1. A better crystallization of the RuAl B2 phase with higher temperature also leads to fewer defects. Both effects additionally reduce the electrical resistivity.
The situation is different if the samples are annealed under air conditions. The resistivity values for the 600
C annealed samples are also presented in
Figure 9. However, the measurements showed no conductivity for the samples annealed at higher temperatures. The 600
C annealing leads to the lowest resistivity for the Ru
Al
sample (28
cm), followed by the Ru
Al
sample with a slightly higher value (32
cm) and the Ru
Al
sample with a clearly higher resistivity (50
cm). Again, the highest value is observed for the Ru
Al
film (195
cm). The same qualitative behavior is observed for the RuAl peak heights in the XRD measurements, proving that there is a clear coherence between higher XRD peaks and a lower electrical resistivity.
All films annealed in air at 800
C showed an infinite resistivity. As bulk RuO
has a relatively low electrical resistivity of 35
cm [
18], its formation does not explain why these samples are not electrically conductive anymore. Furthermore, FIB and STEM imaging of cross-sections showed a sparse distribution of pores well below the electrical percolation threshold.
Each electrical measurement was repeated four times and the direction of the electrical current was systematically changed, so that each measurement point consists of 16 individual measurements. The standard deviation of the measurements was in nearly all cases less than 0.1%, meaning that the respective error bar is smaller than the symbols shown in
Figure 9. As mentioned above, the reduction of the effective thickness of the conductive layer is not considered in the calculation of the resistivity. Since the thickness of the conductive layer is smaller than the initial Ru-Al layer, the actual values of resistivity are smaller than the calculated ones.


