
Investigation of Quasi-Static Indentation Response of Inkjet Printed Sandwich Structures under Various Indenter Geometries

 ,
,  ,
,  ,
, 
Abstract
:
1. Introduction
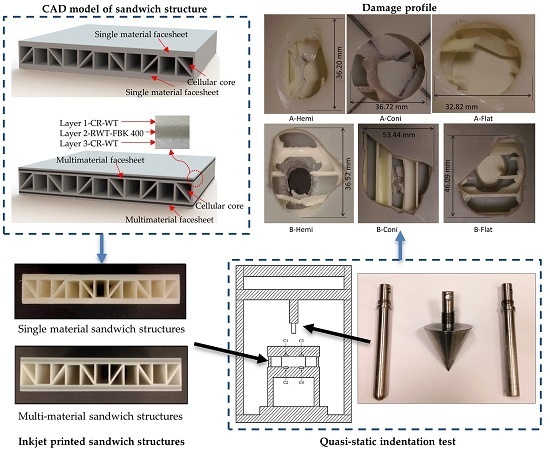
2. Three-Dimensional (3D) Printing of Core
2.1. Materials
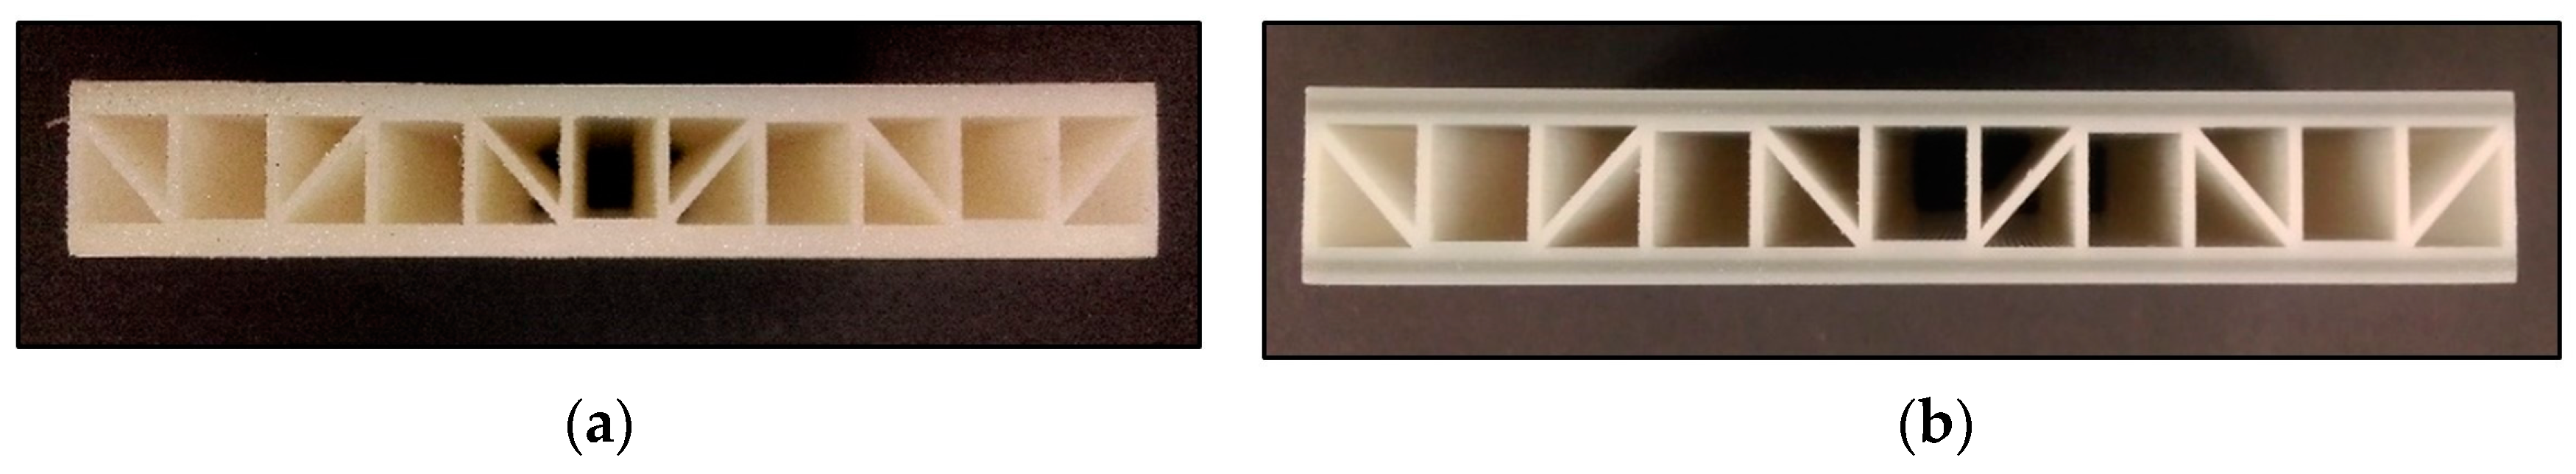
2.2. Processing of 3D Printed Sandwich Structure
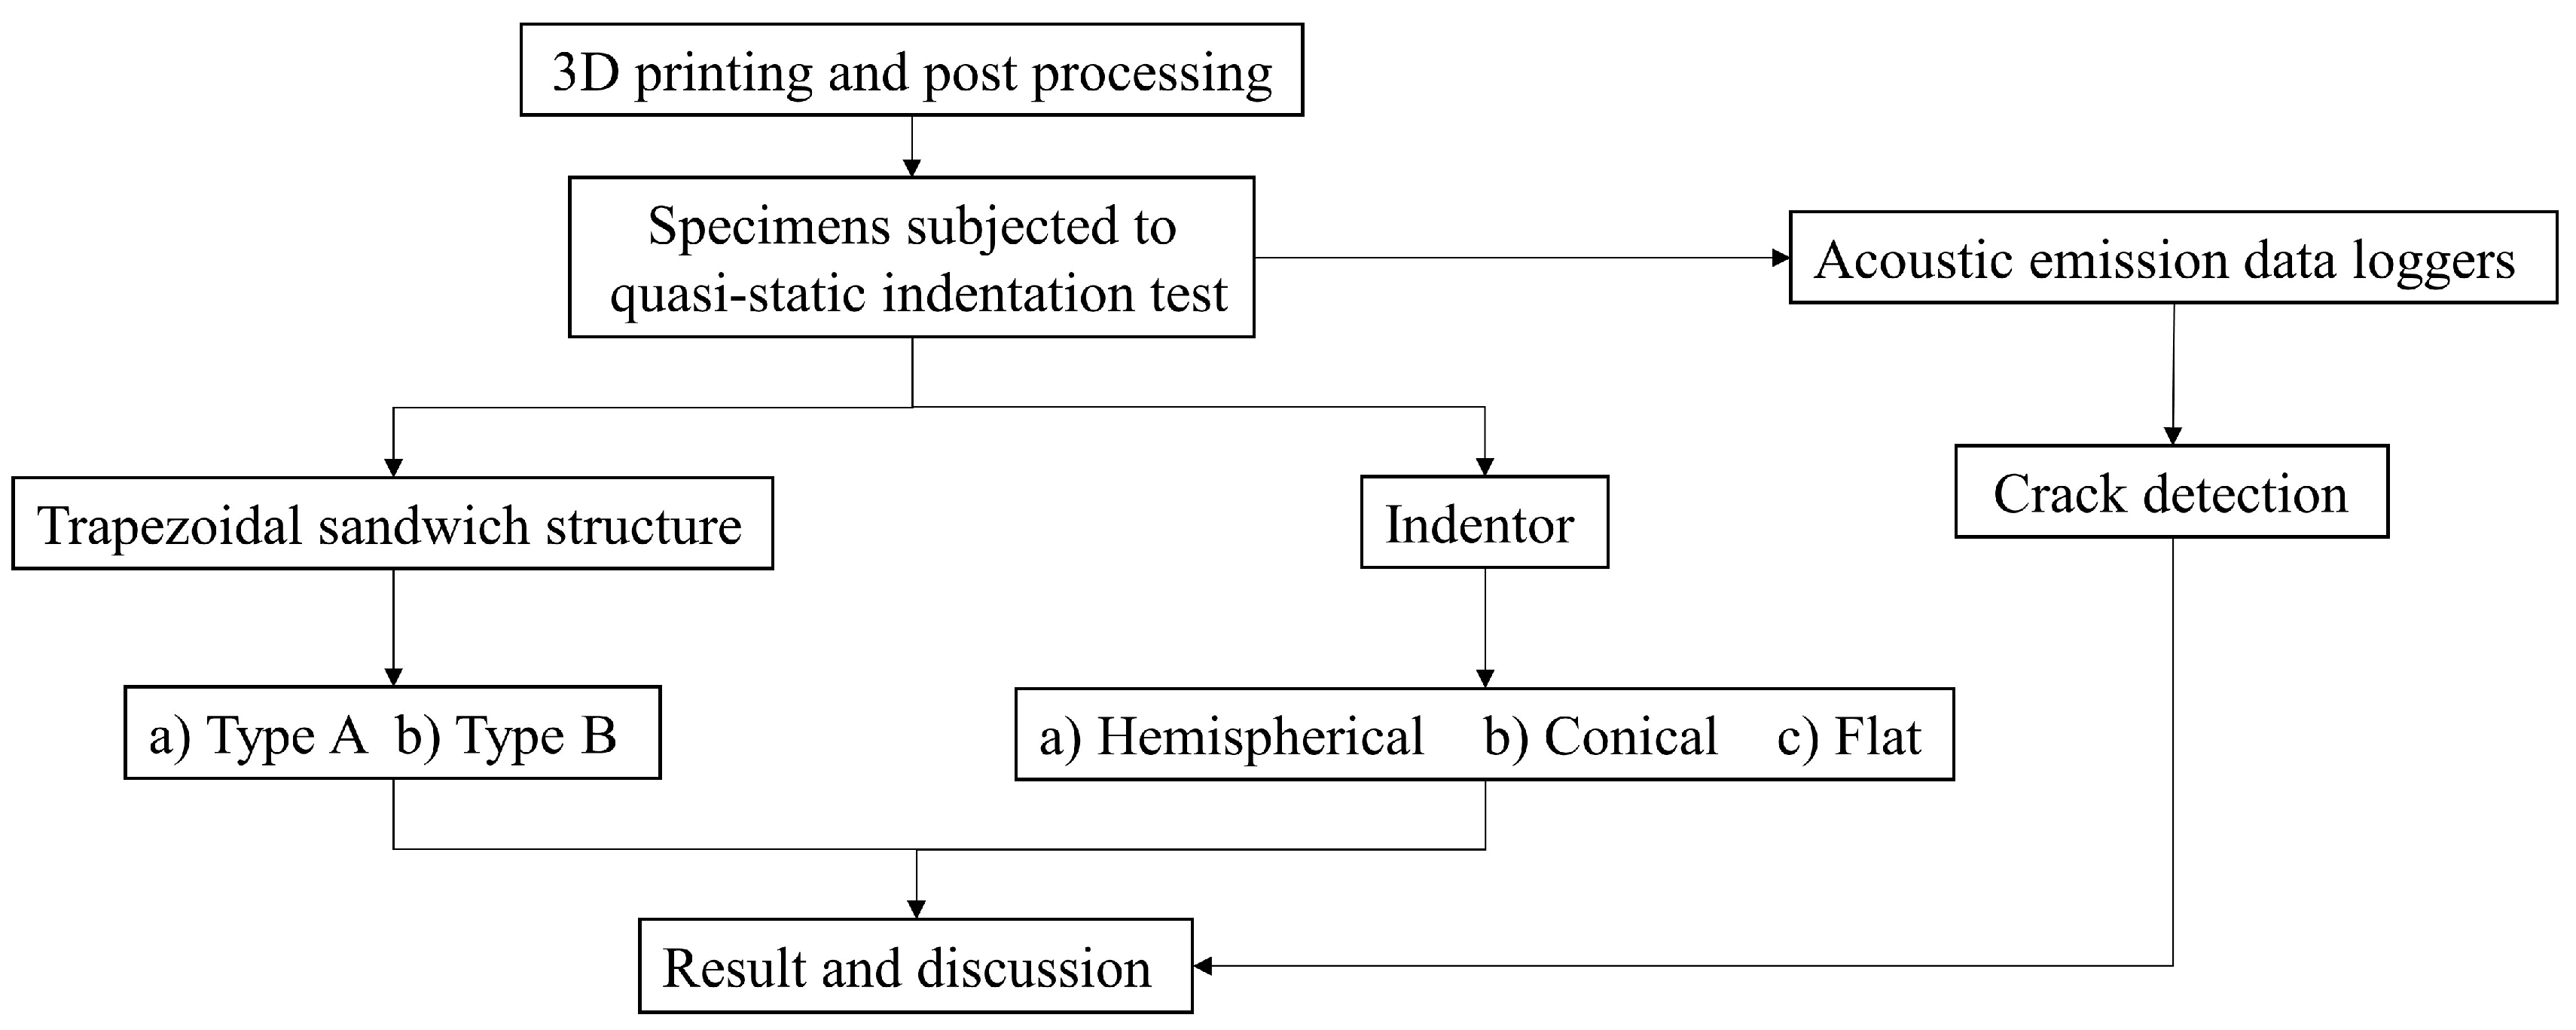
3. Test Procedures and Observations
3.1. Significance of the Test
3.2. American Society for Testing and Materials (ASTM) Standard
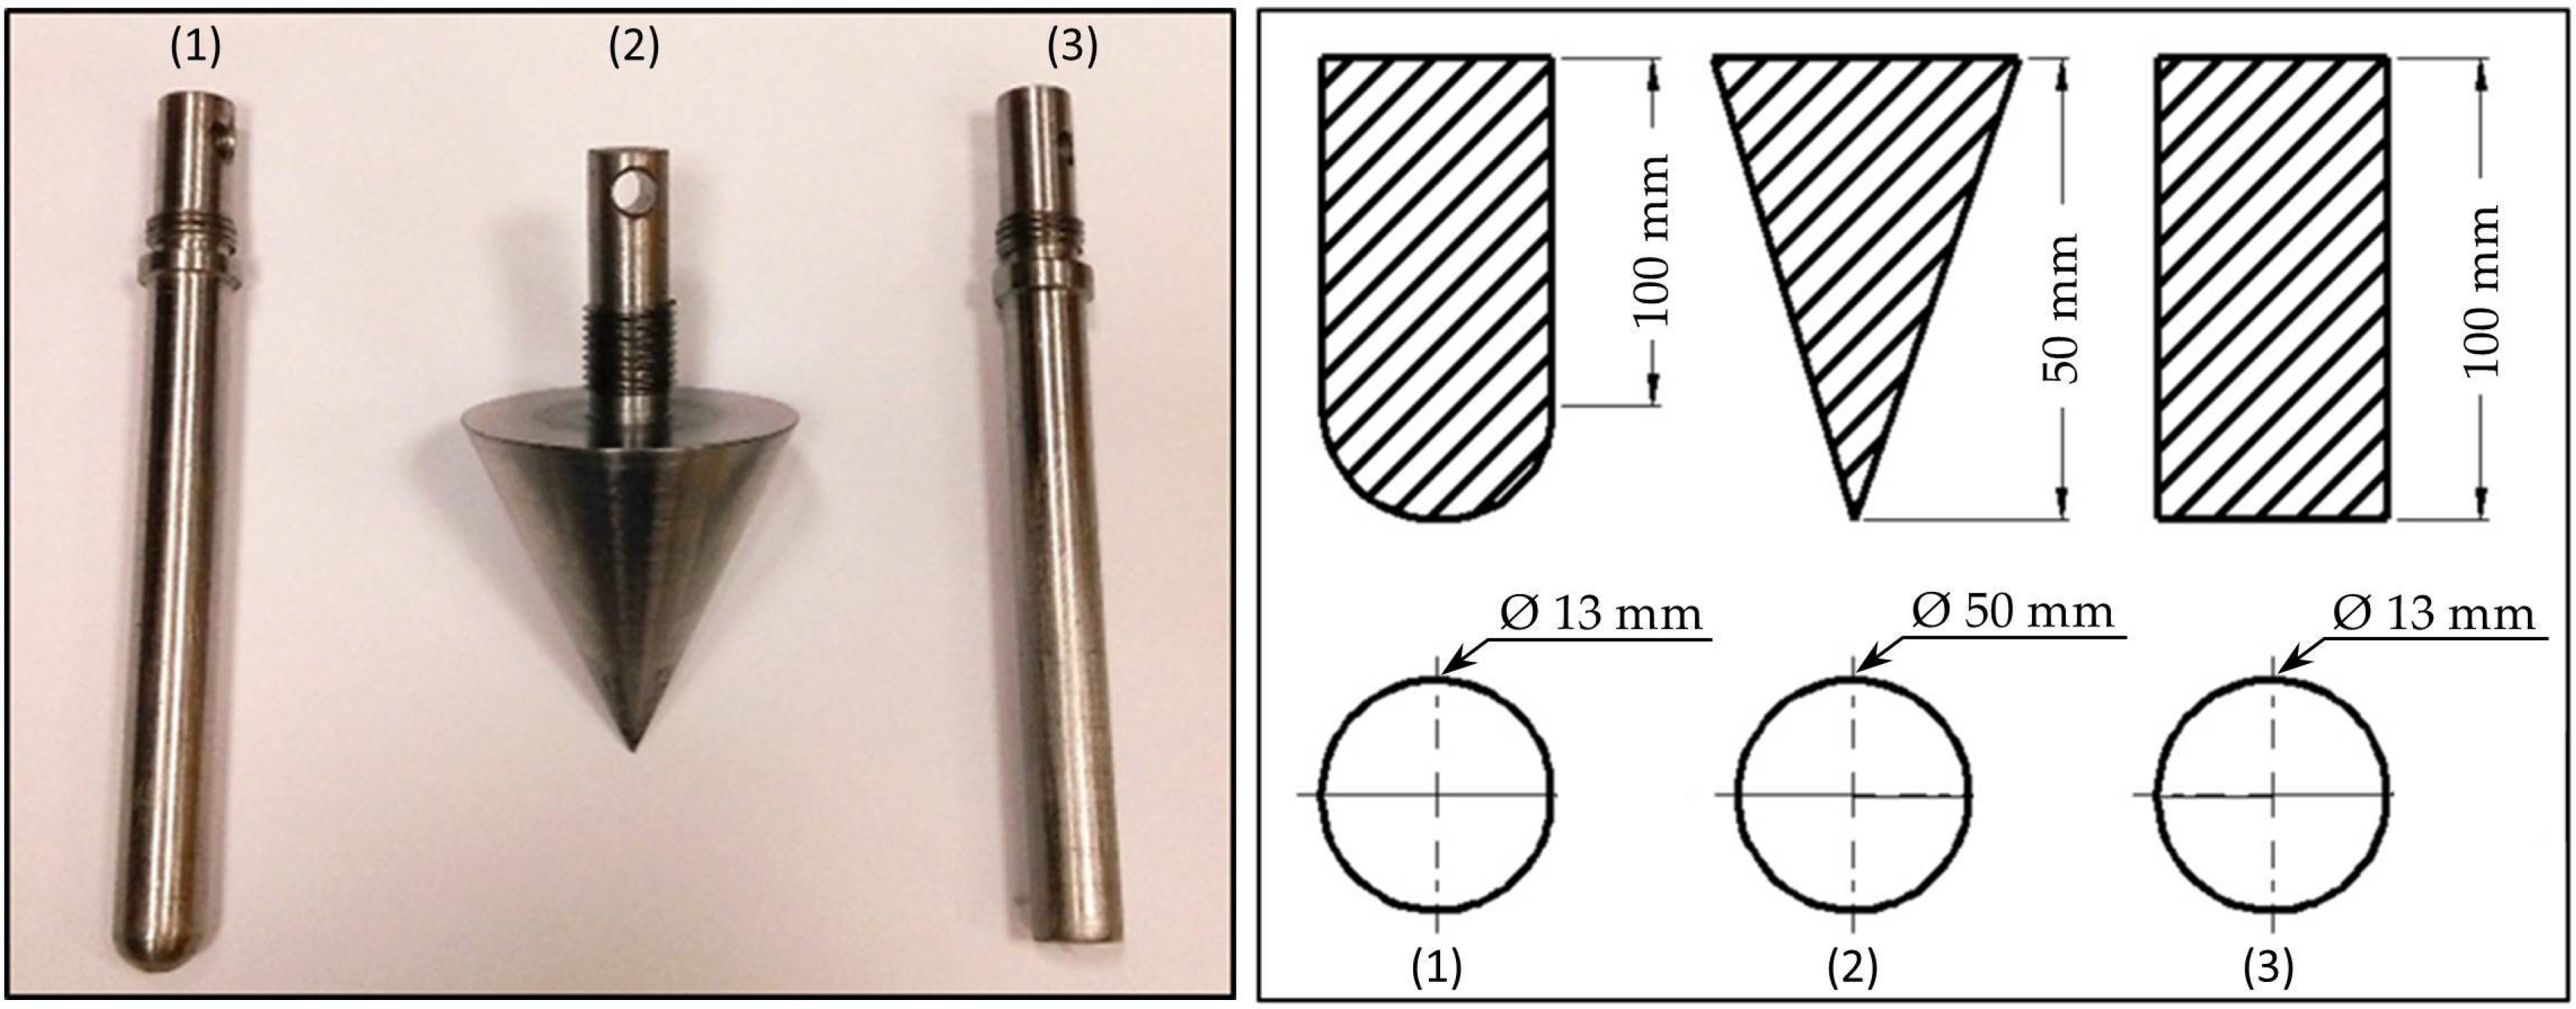
3.3. Experiment Equipment and Load
3.4. Experimental Plan
4. Result and Discussion
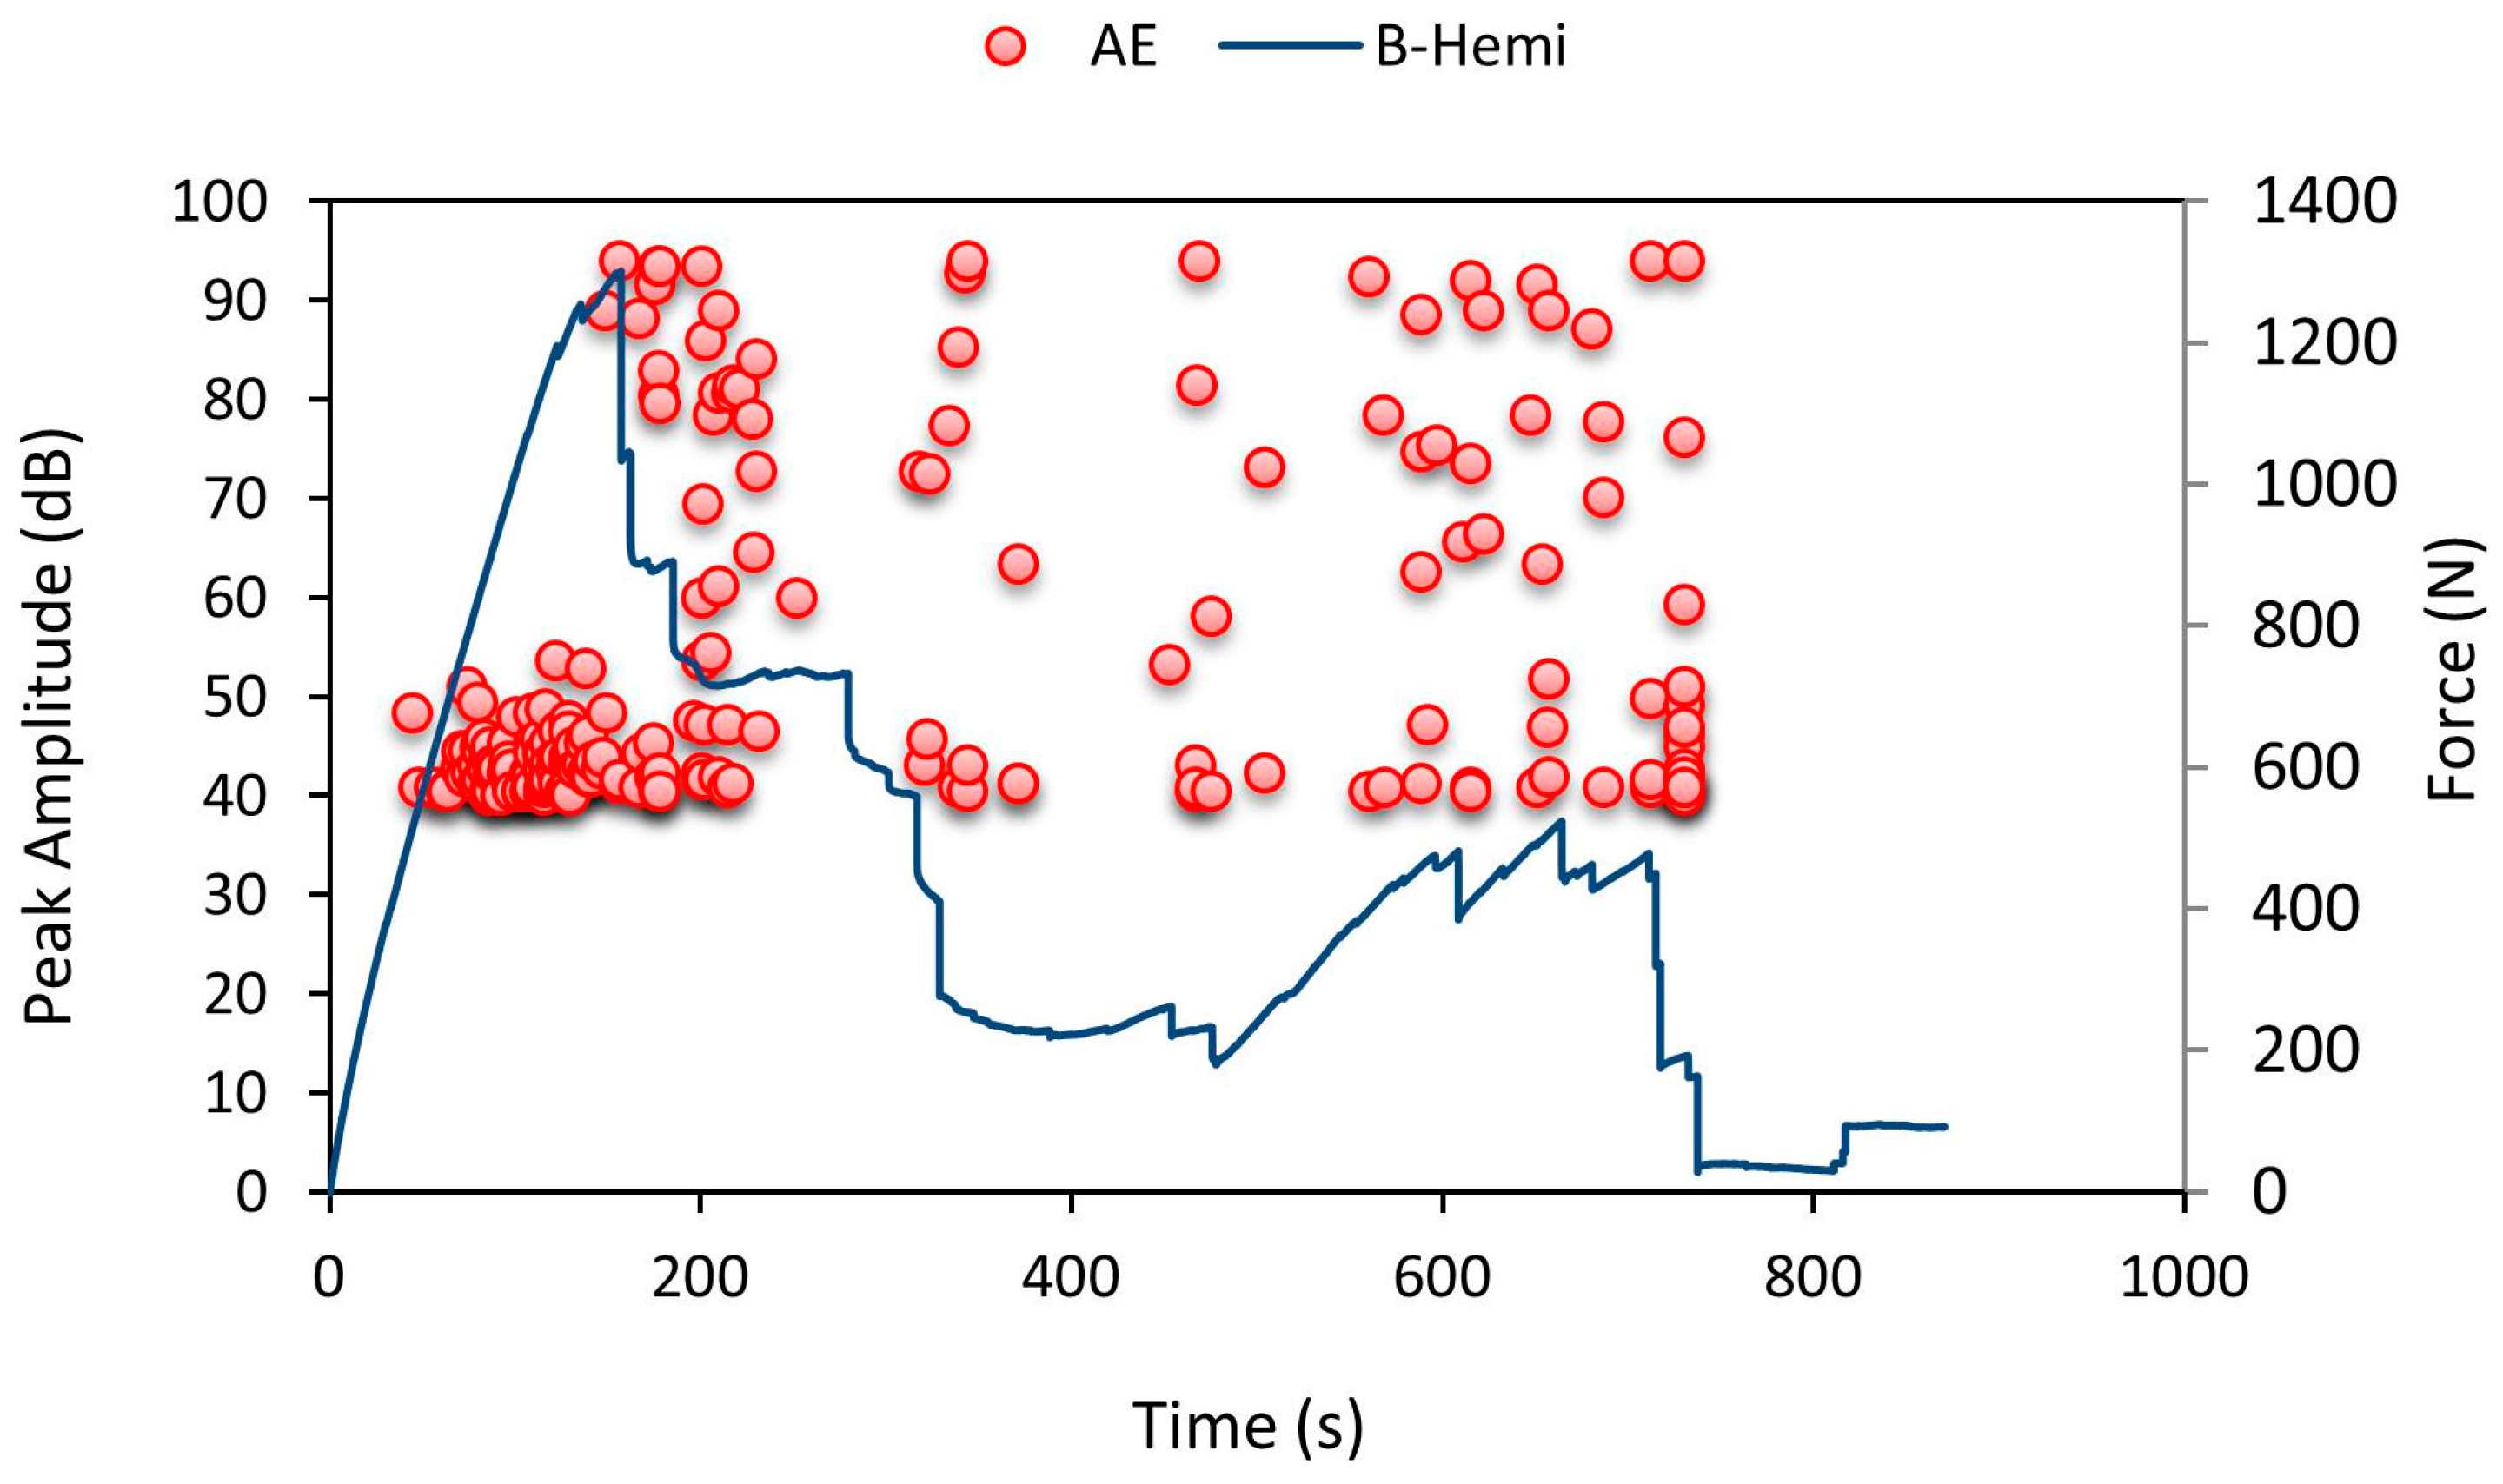
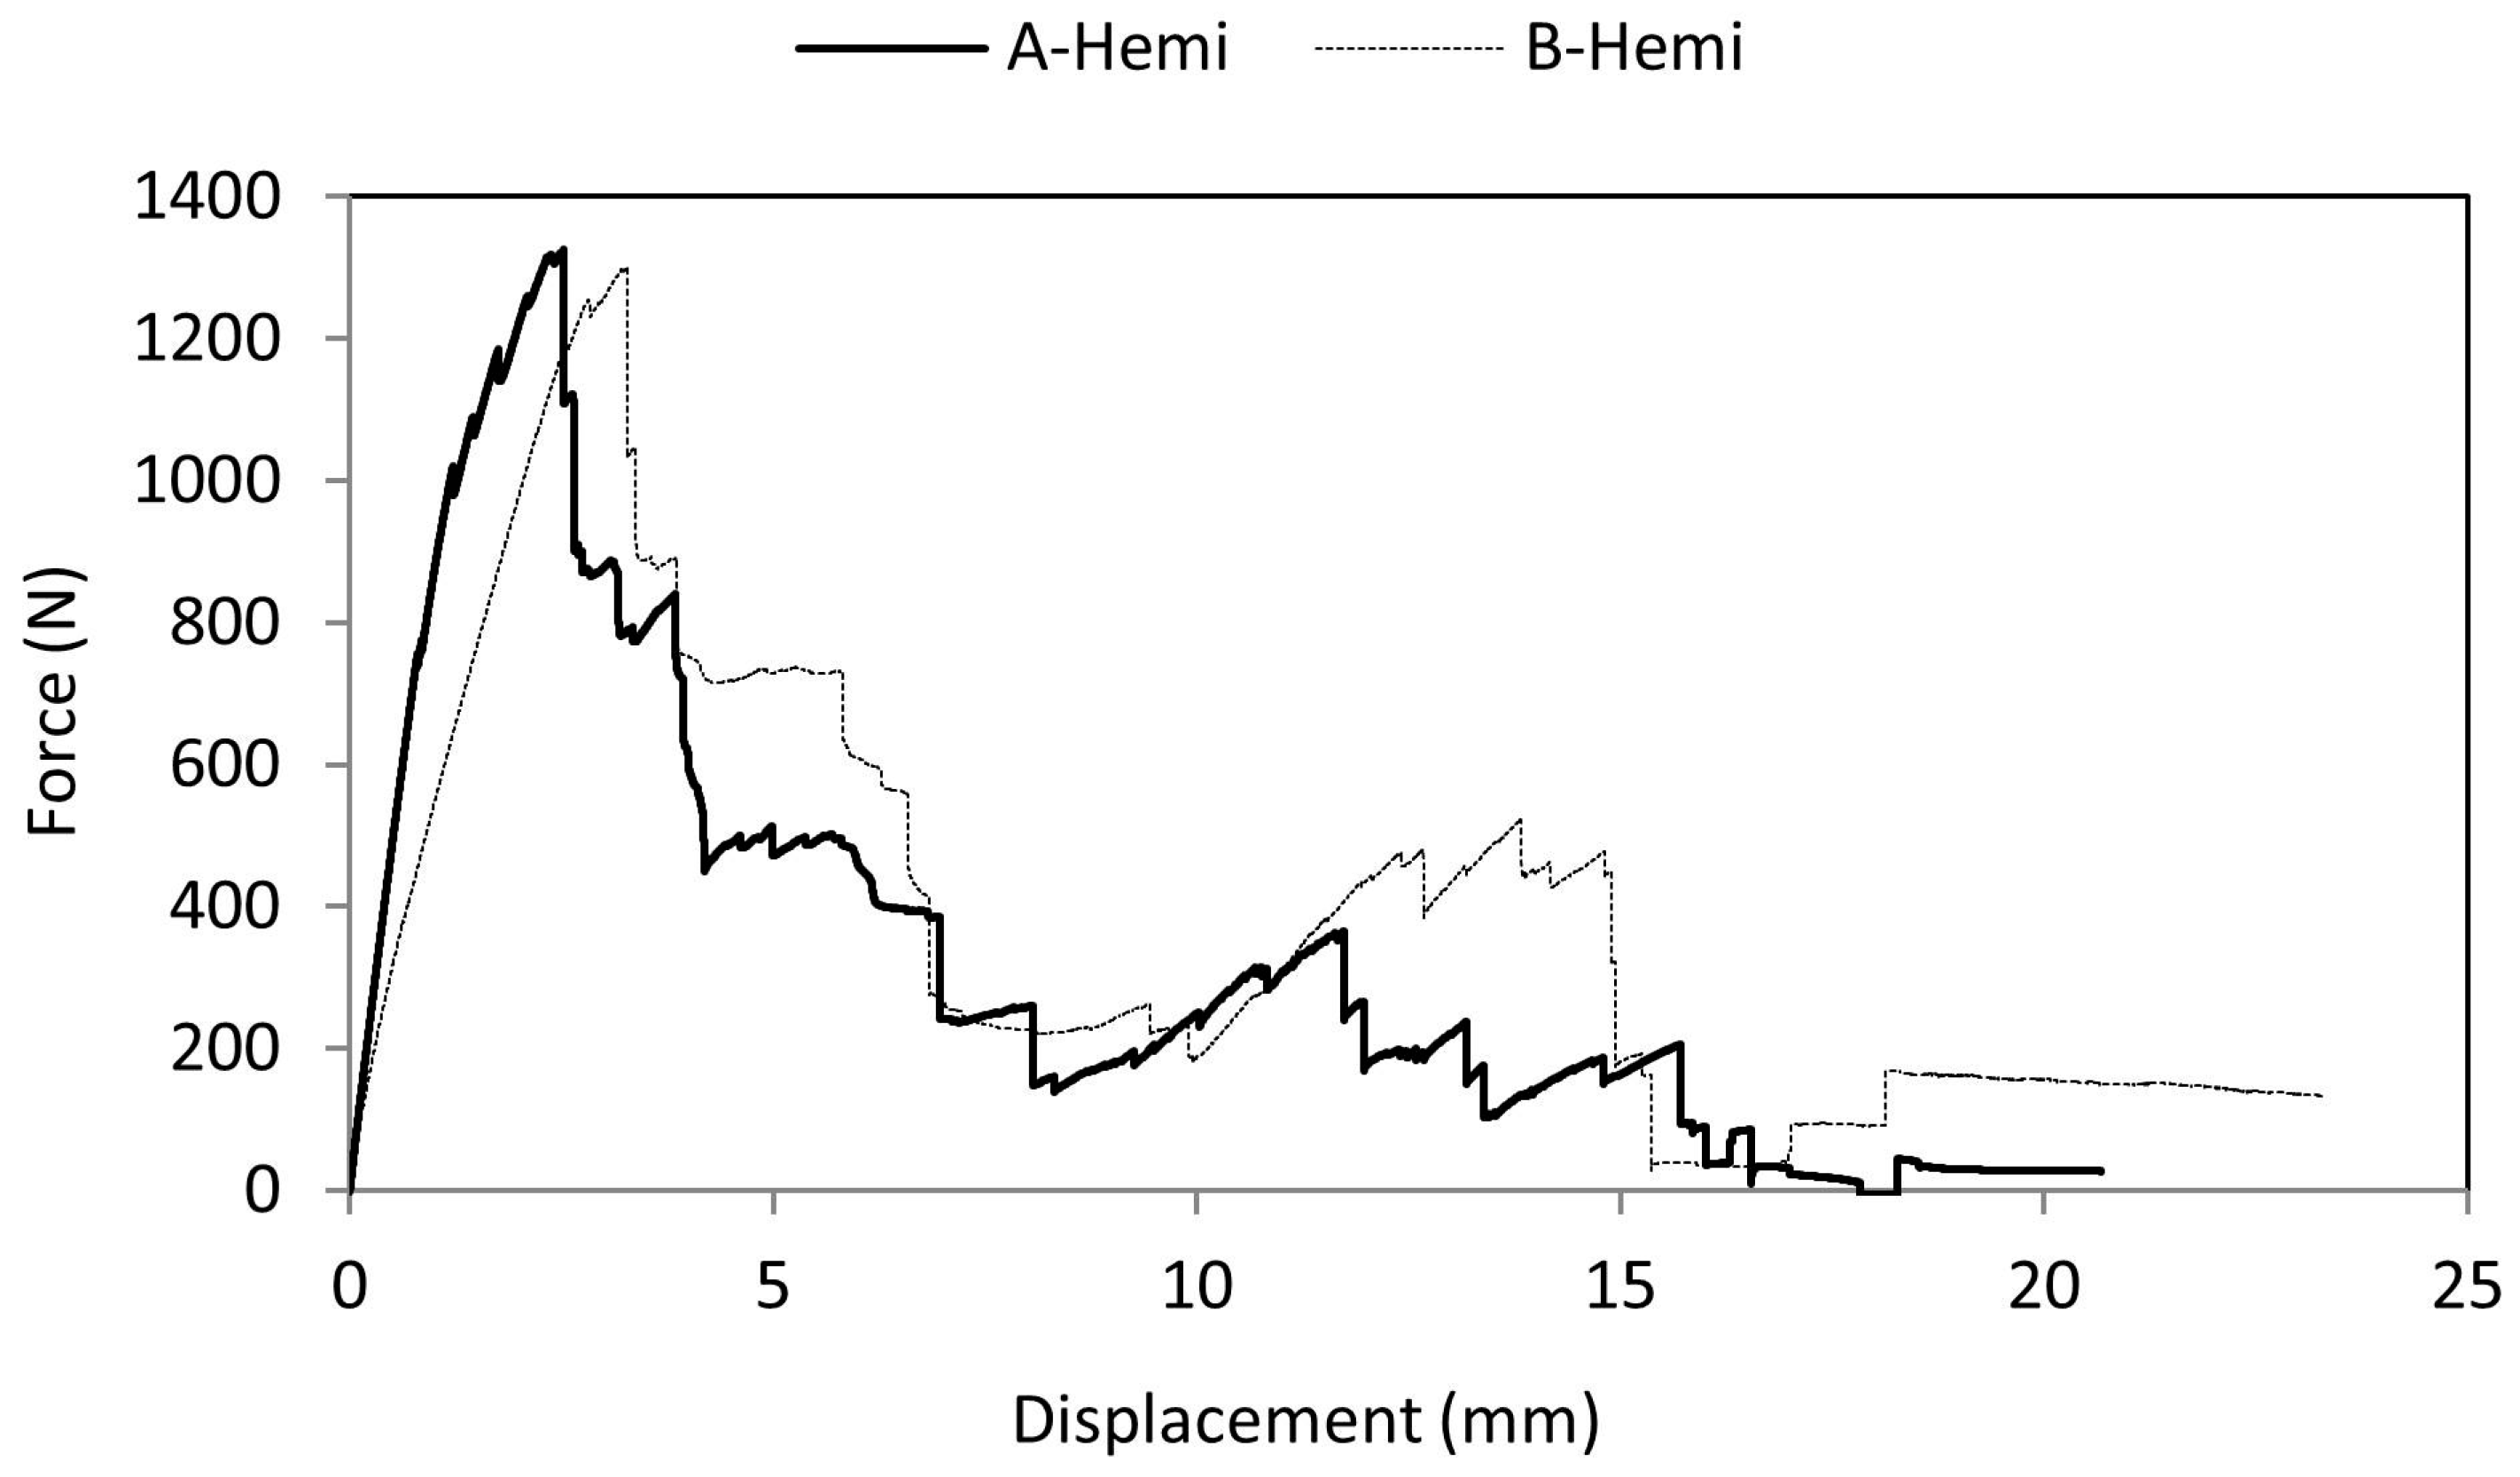
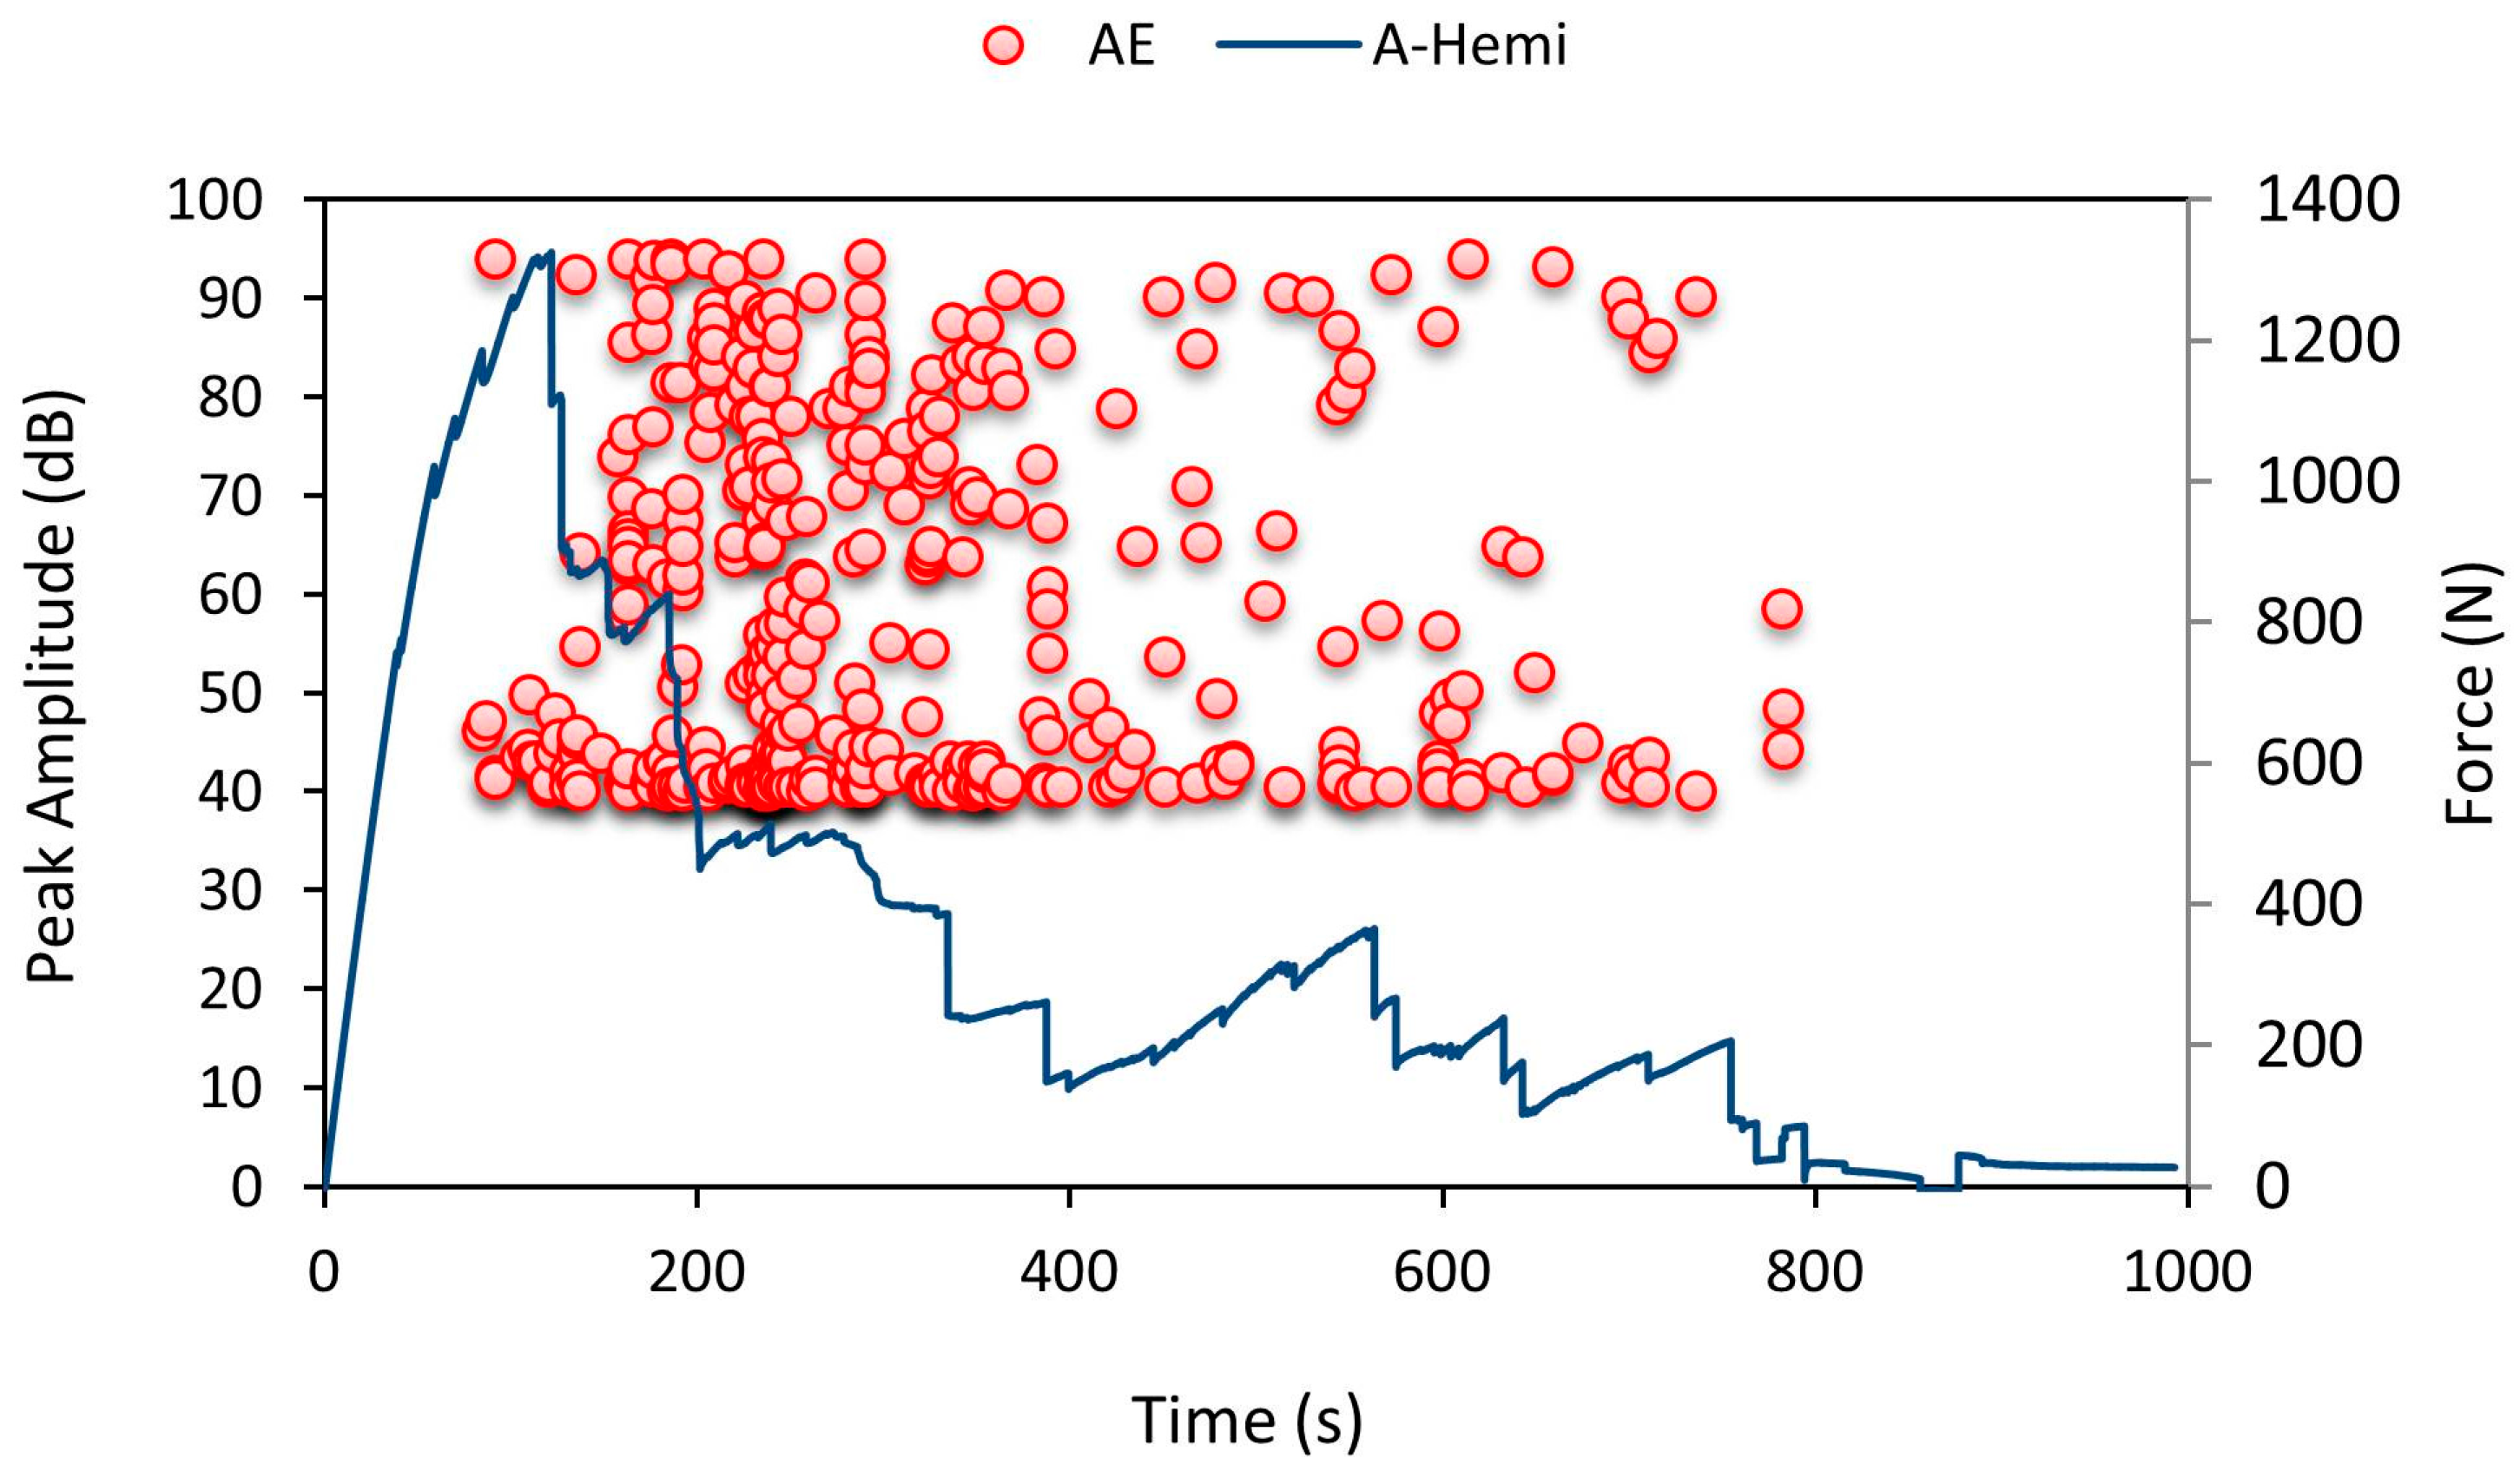
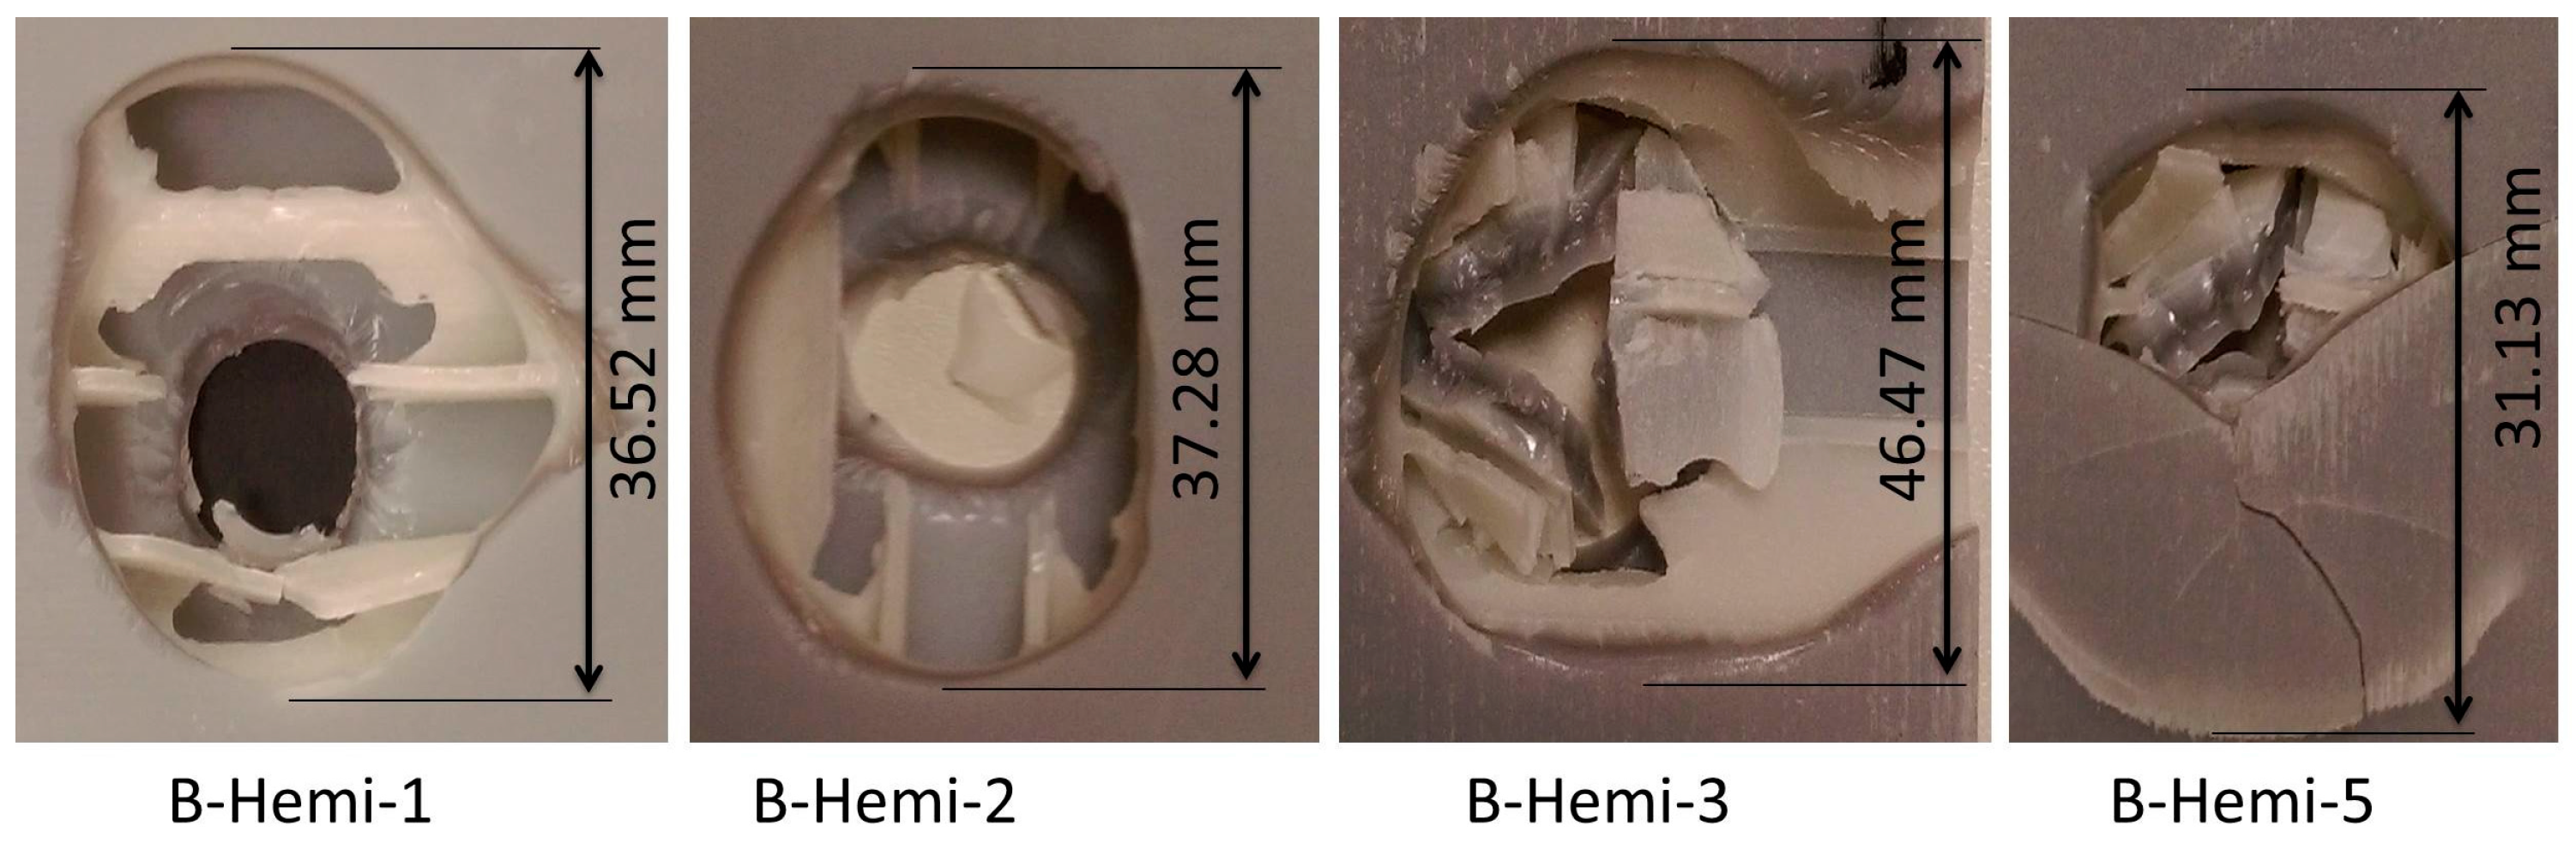
4.1. Force vs. Displacement, Force vs. Time and Peak Amplitude Pattern under Hemispherical Indenter
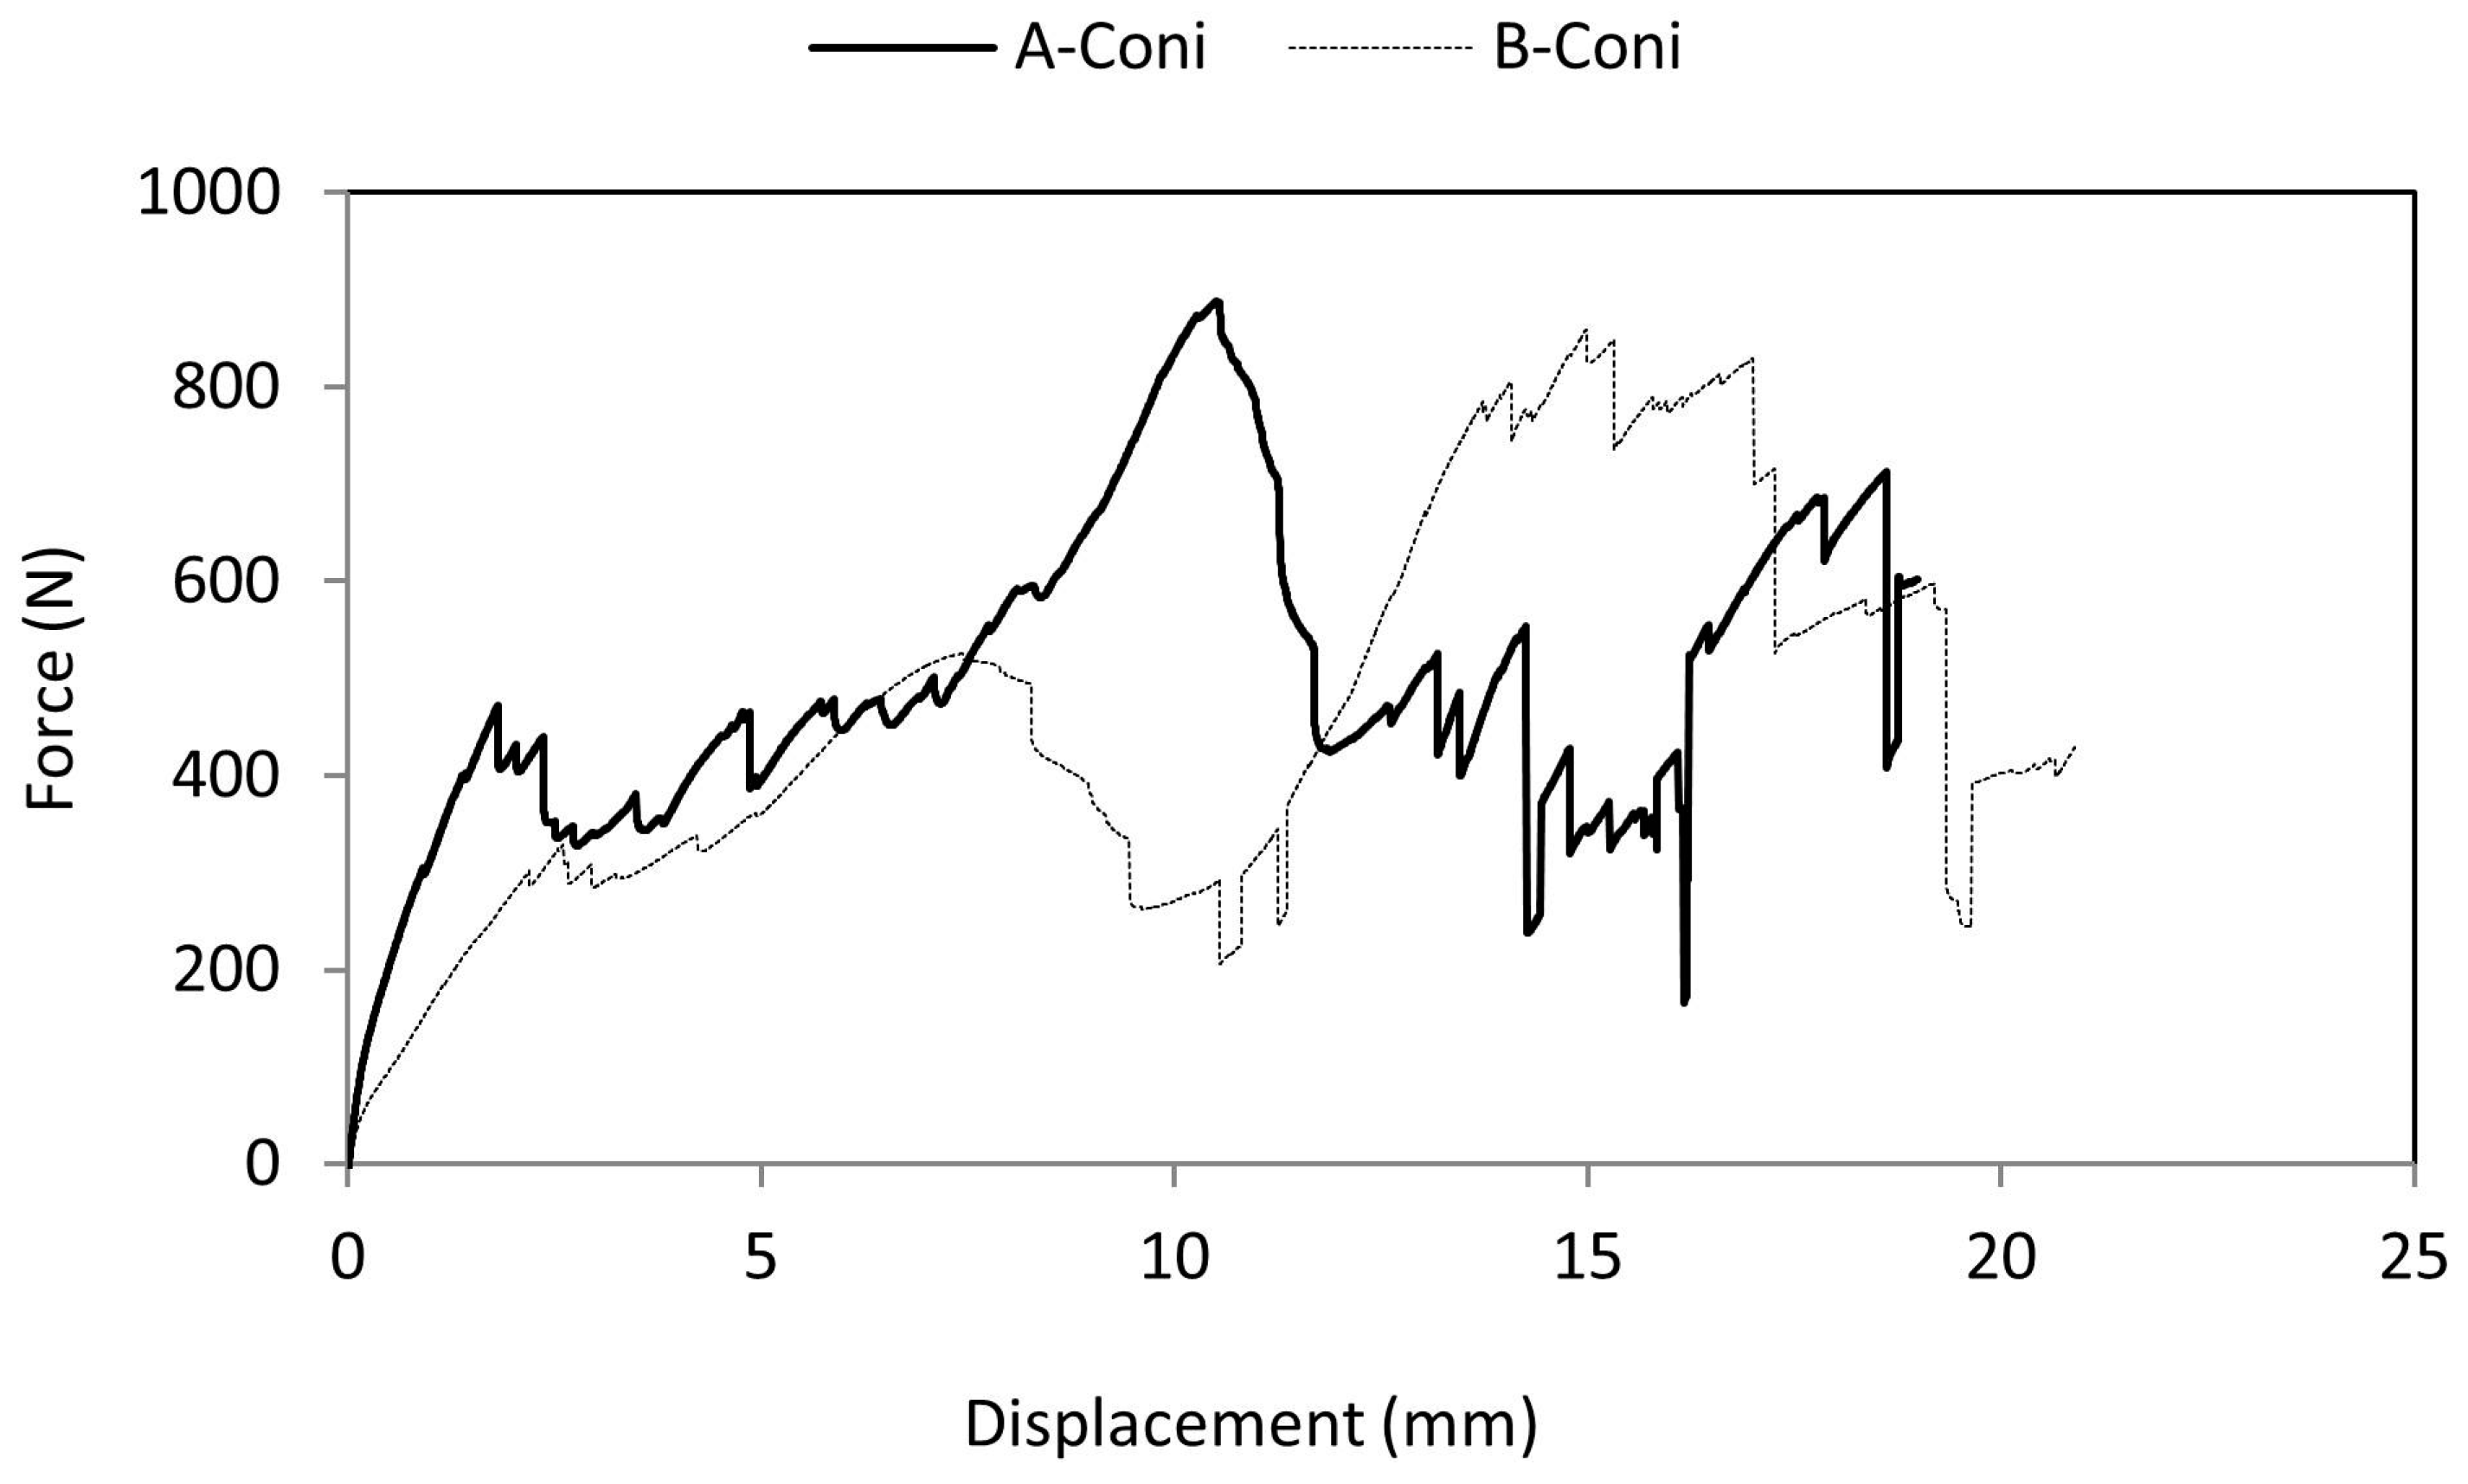
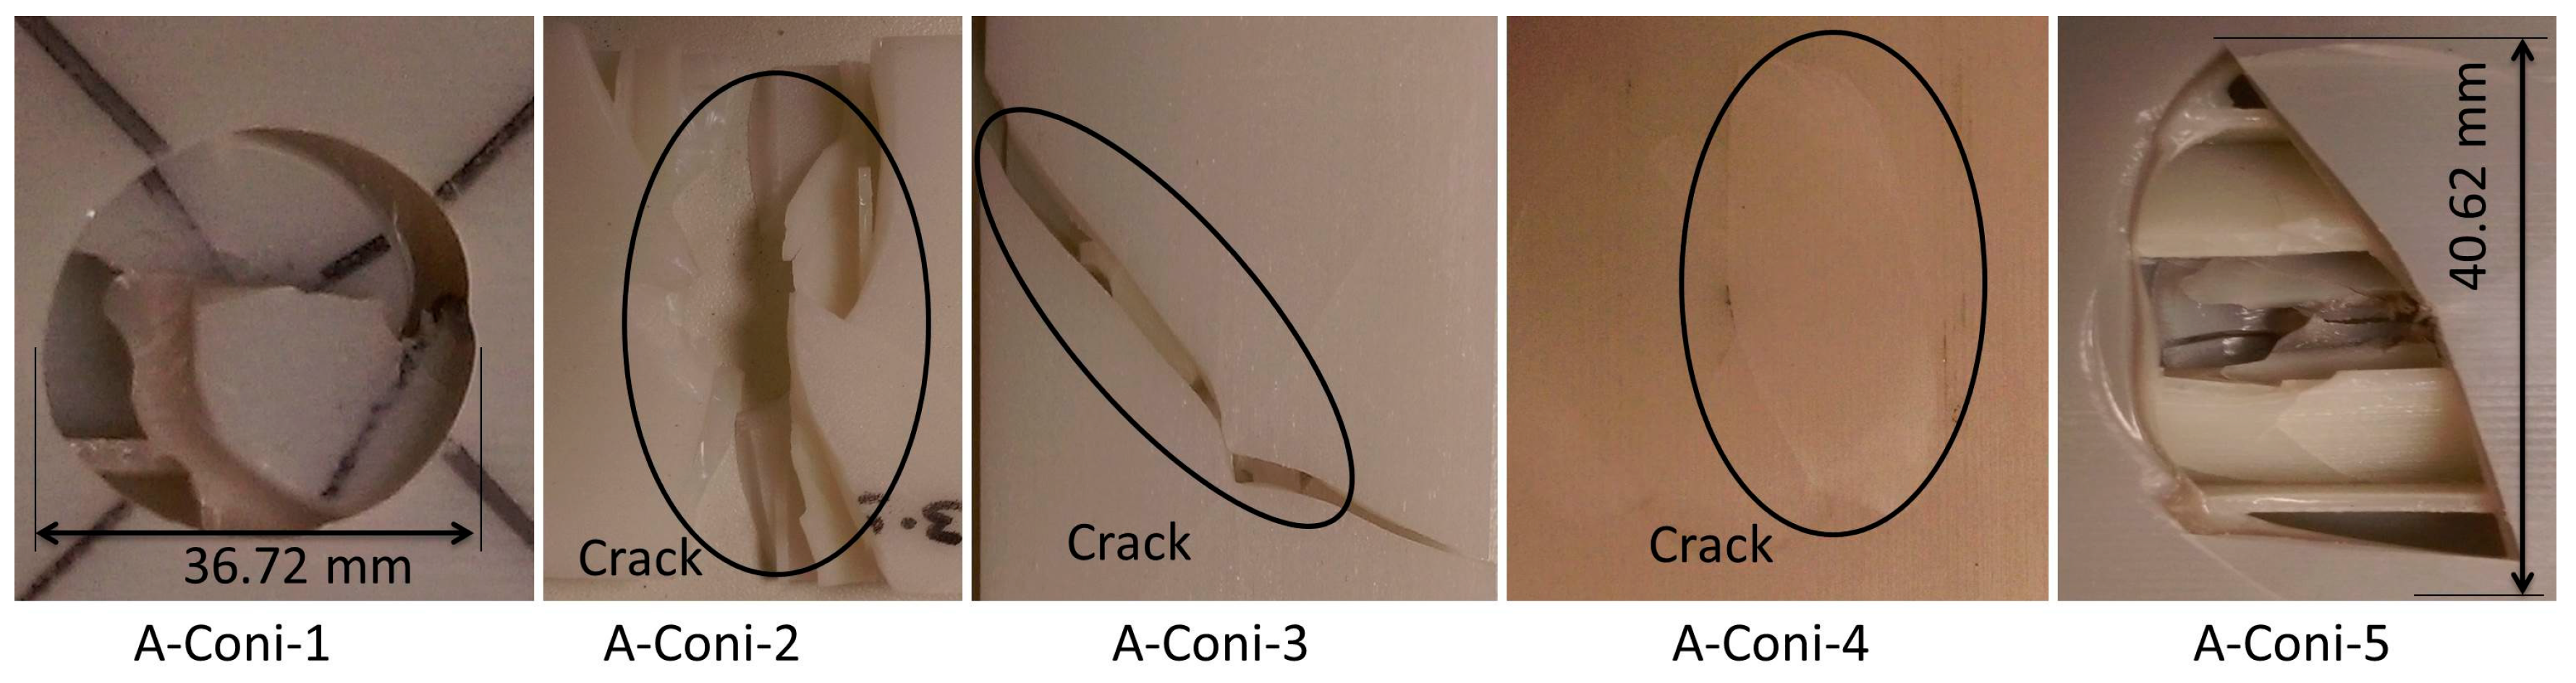
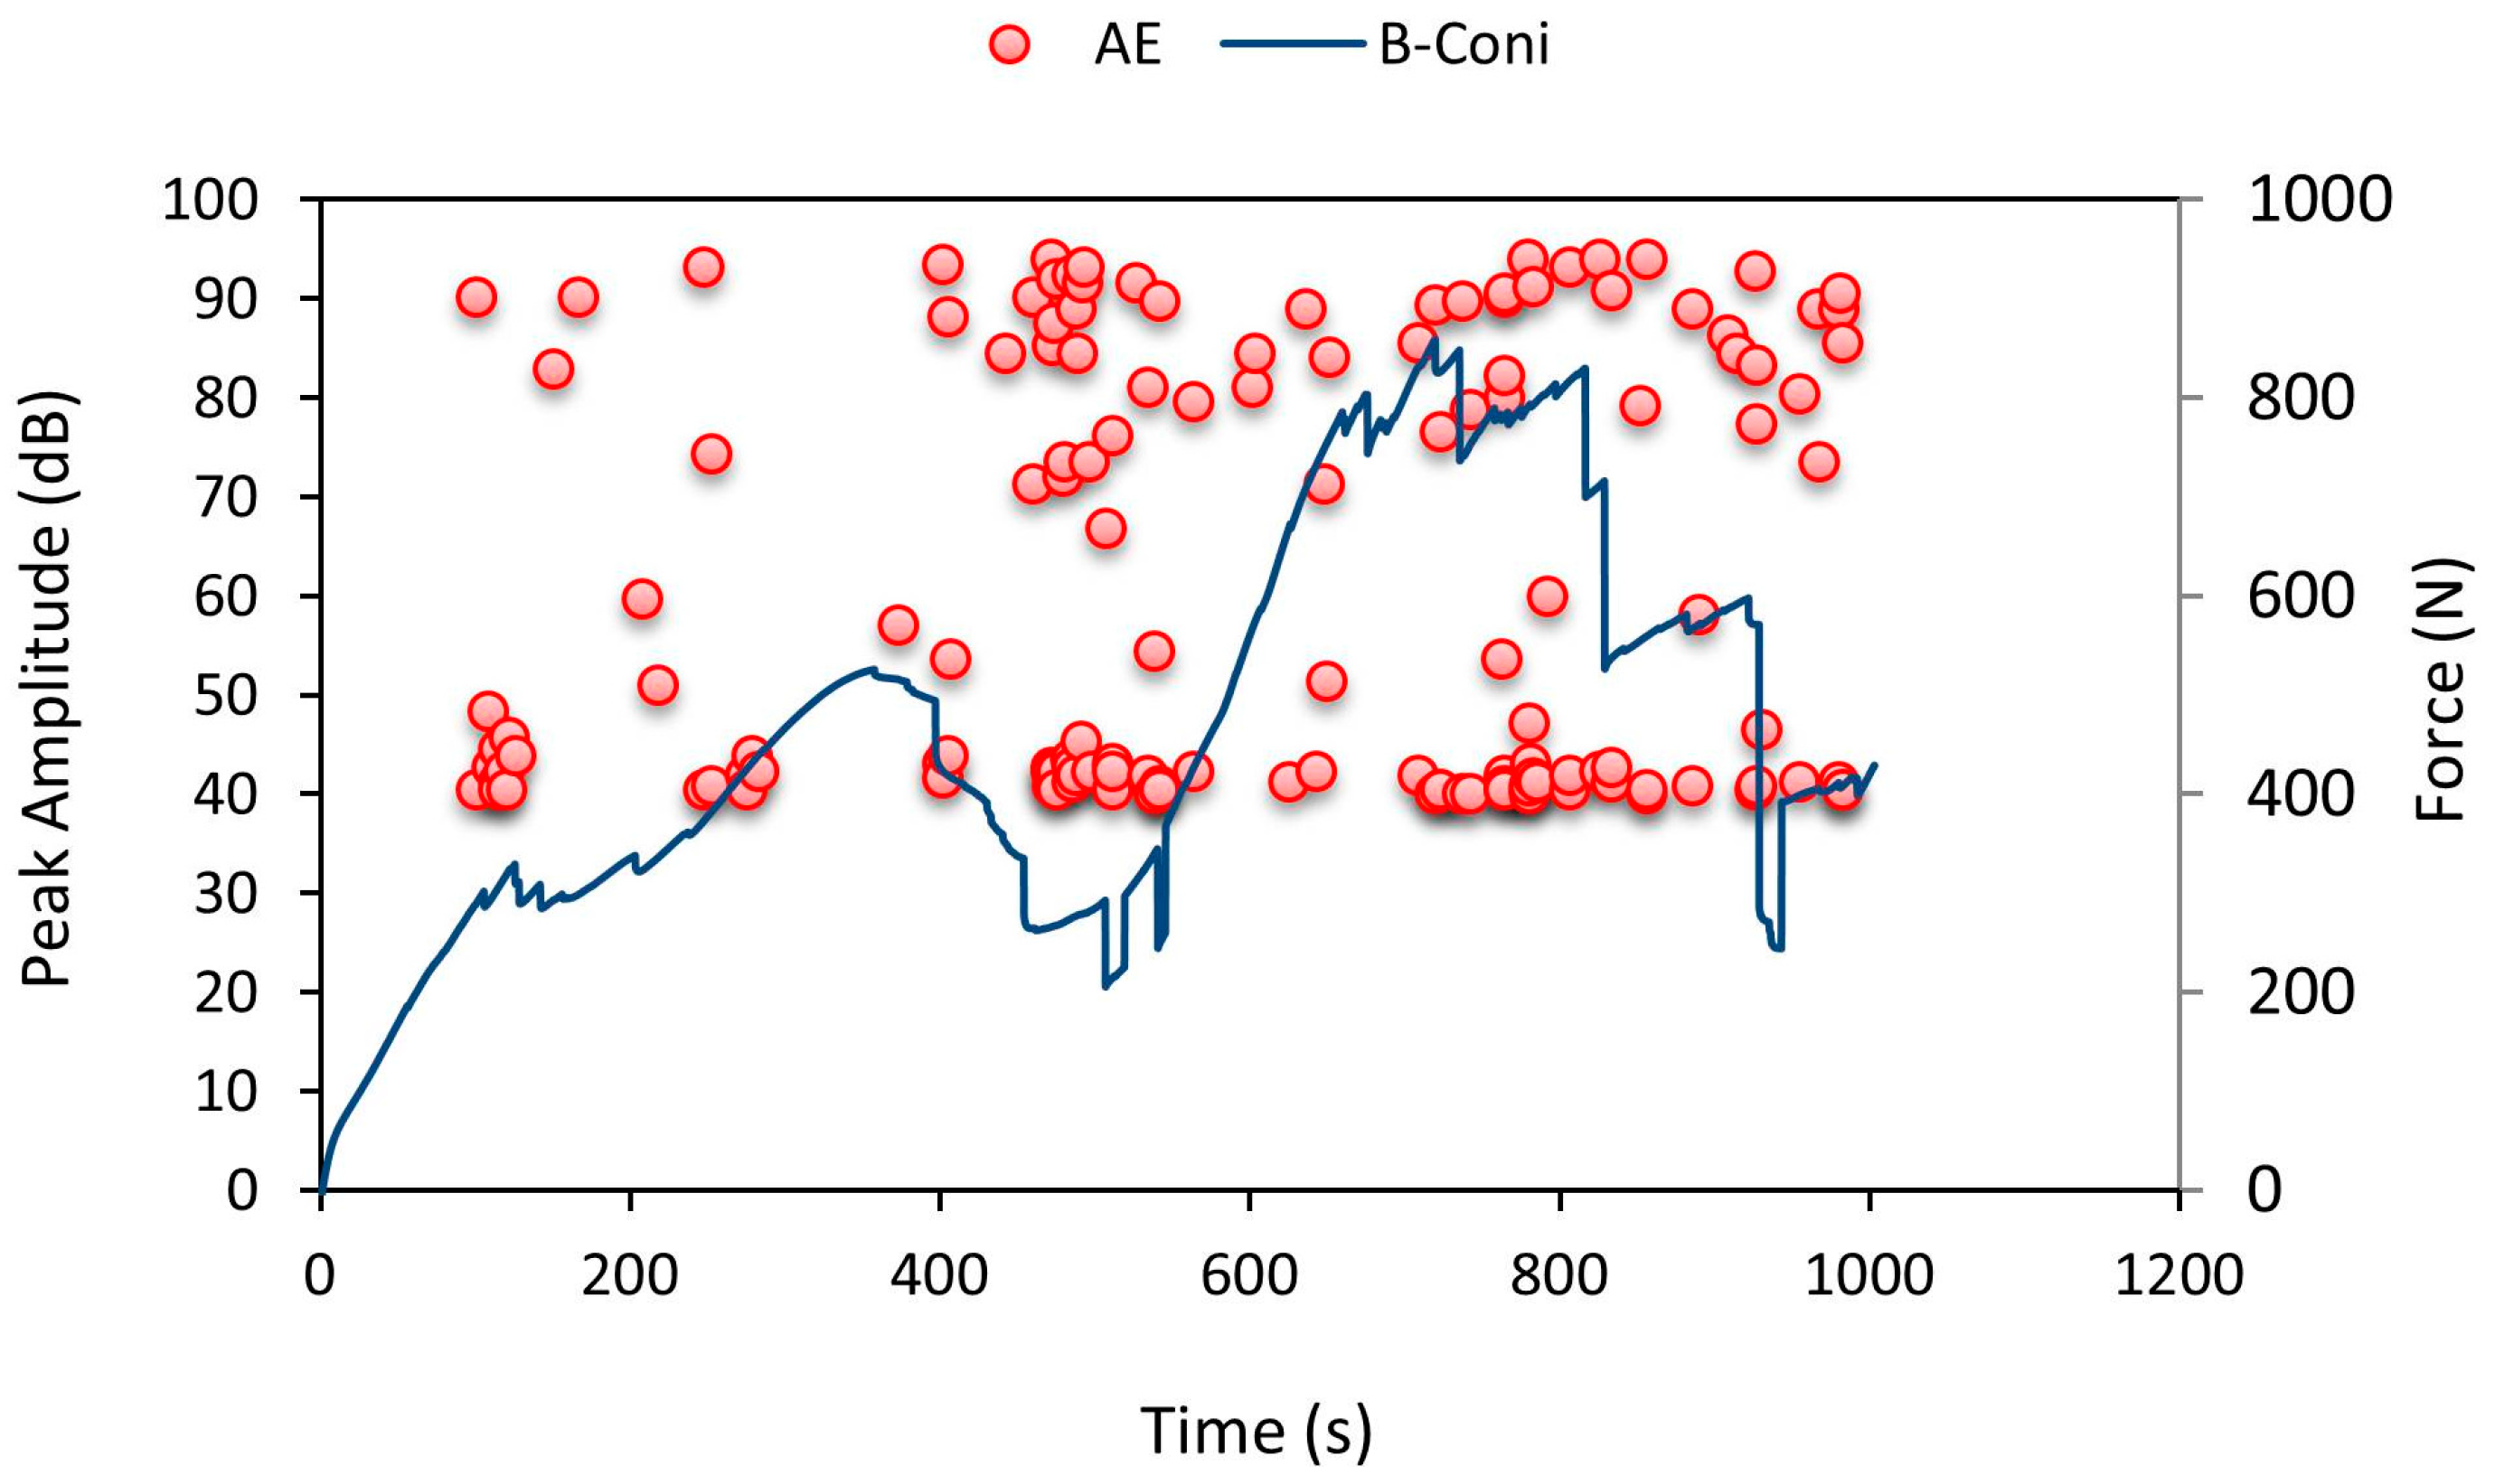
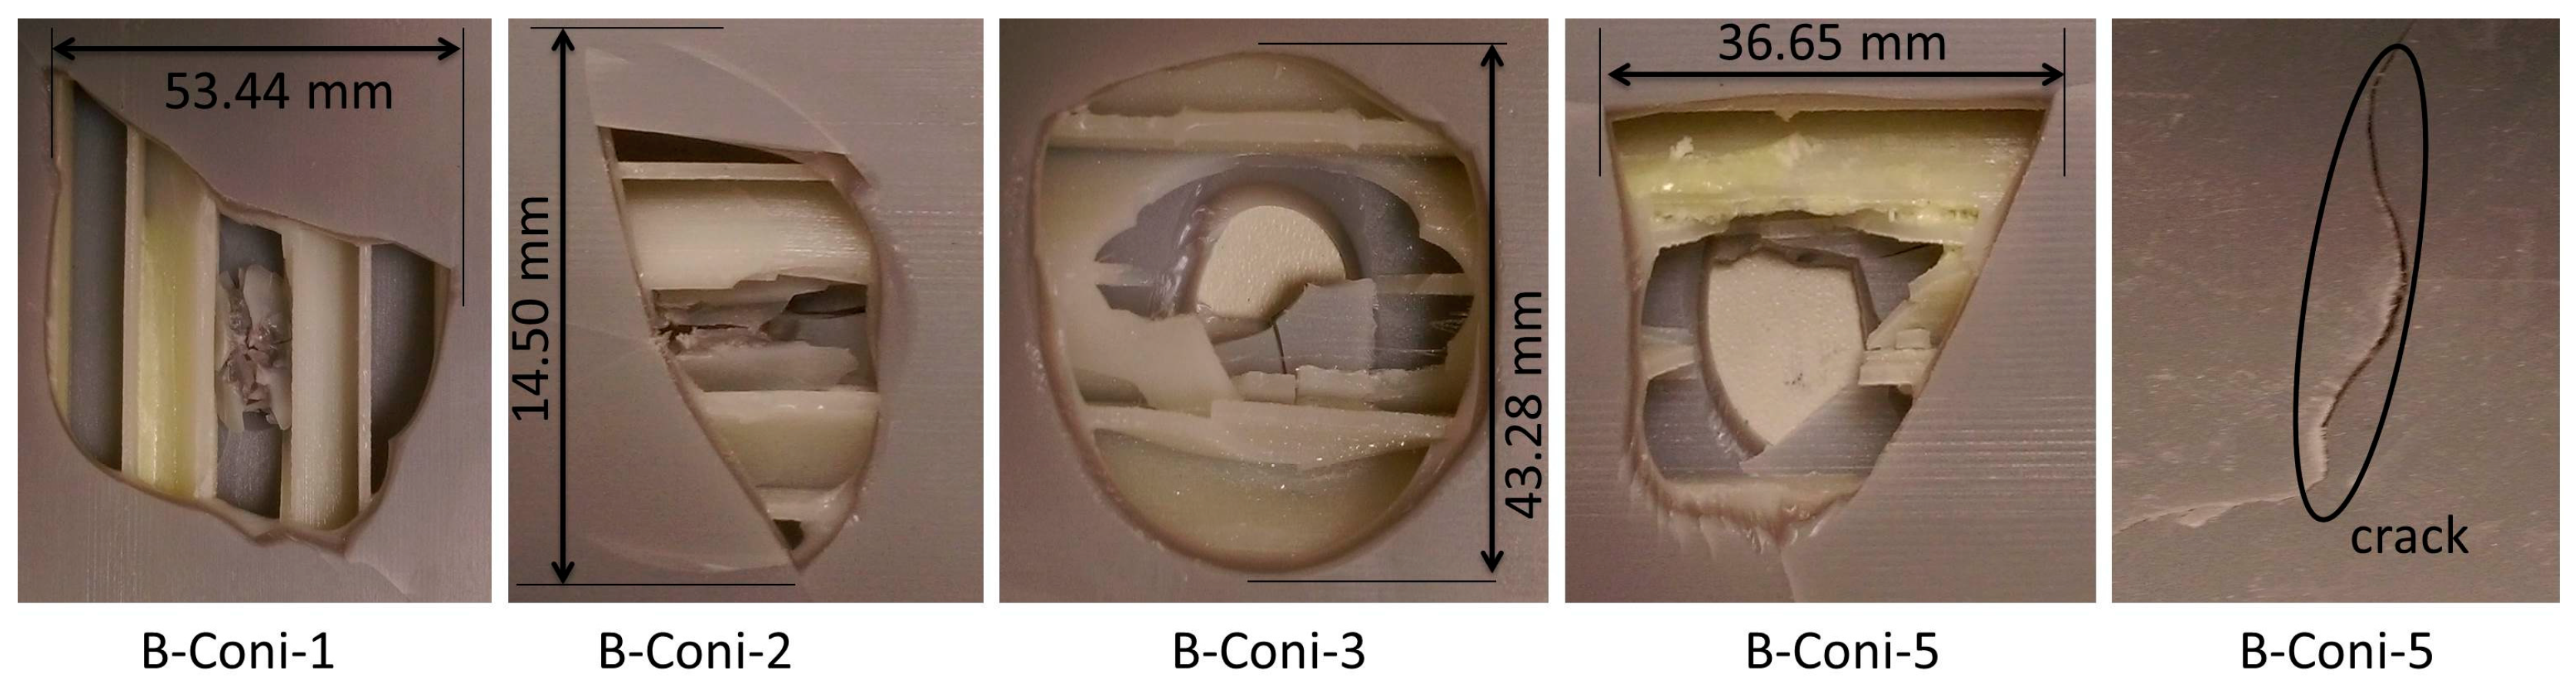
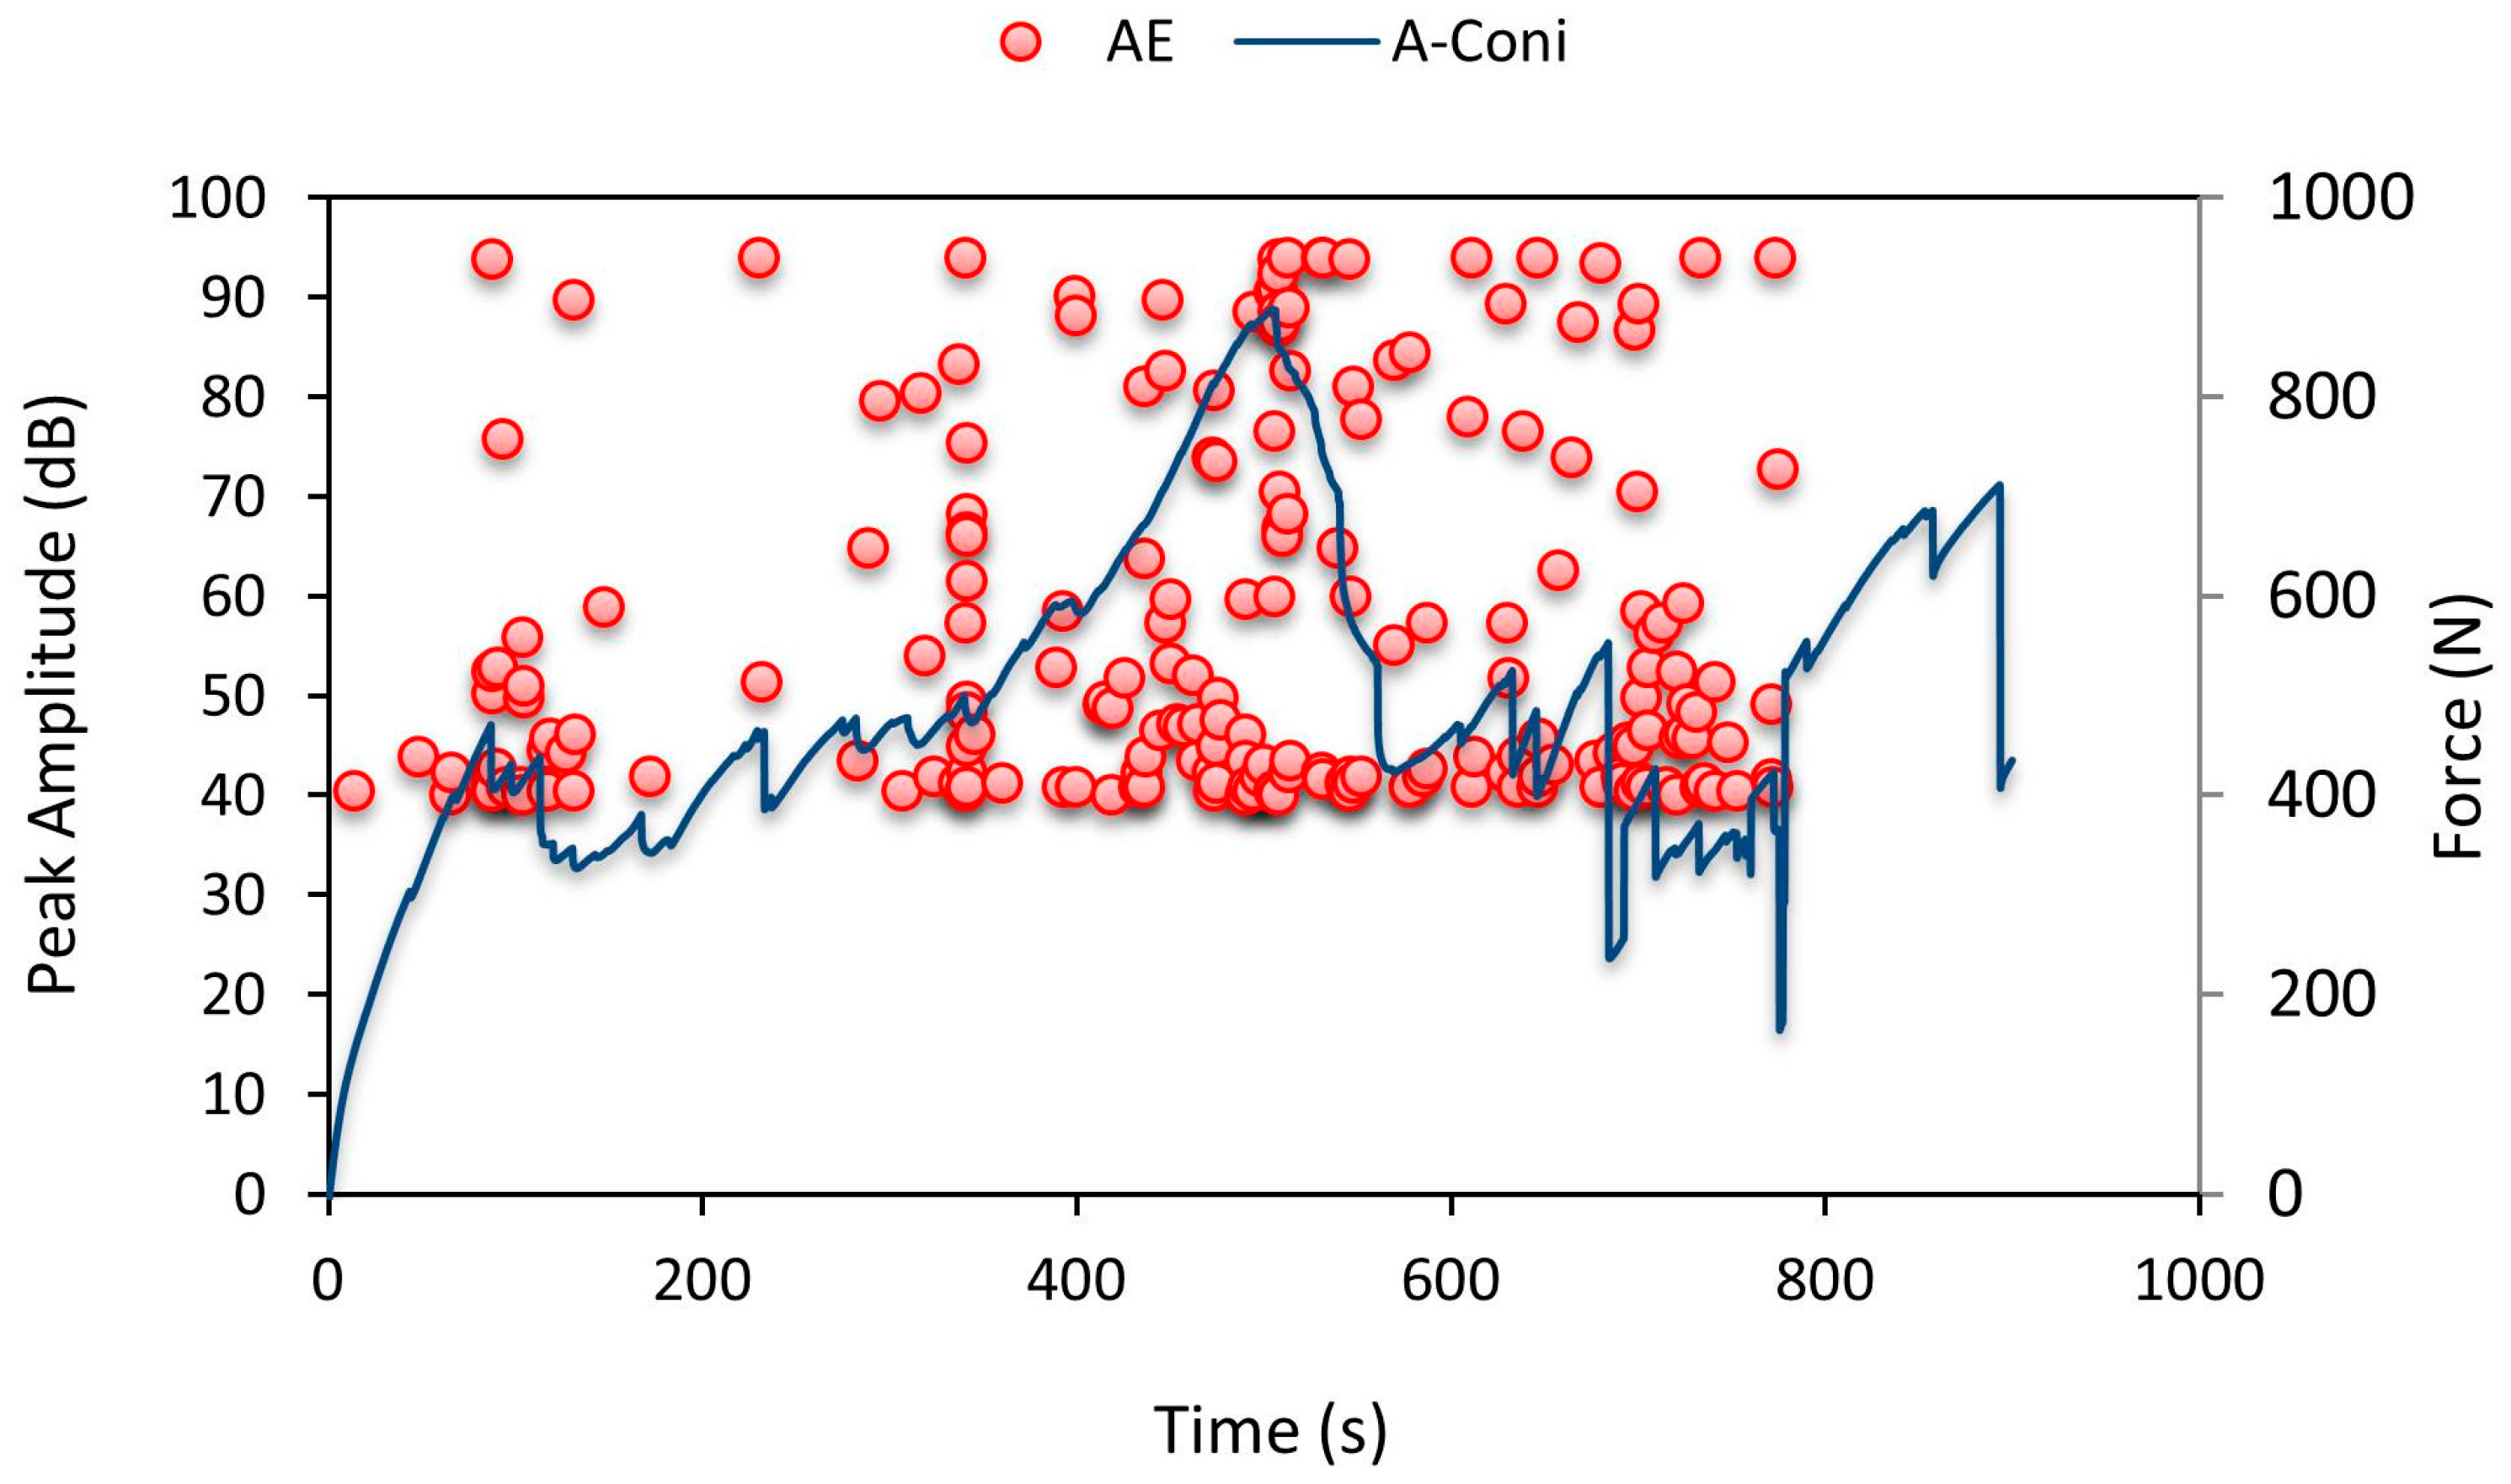
4.2. Force vs. Displacement, Force vs. Time and Peak Amplitude Pattern under Conical Indenter
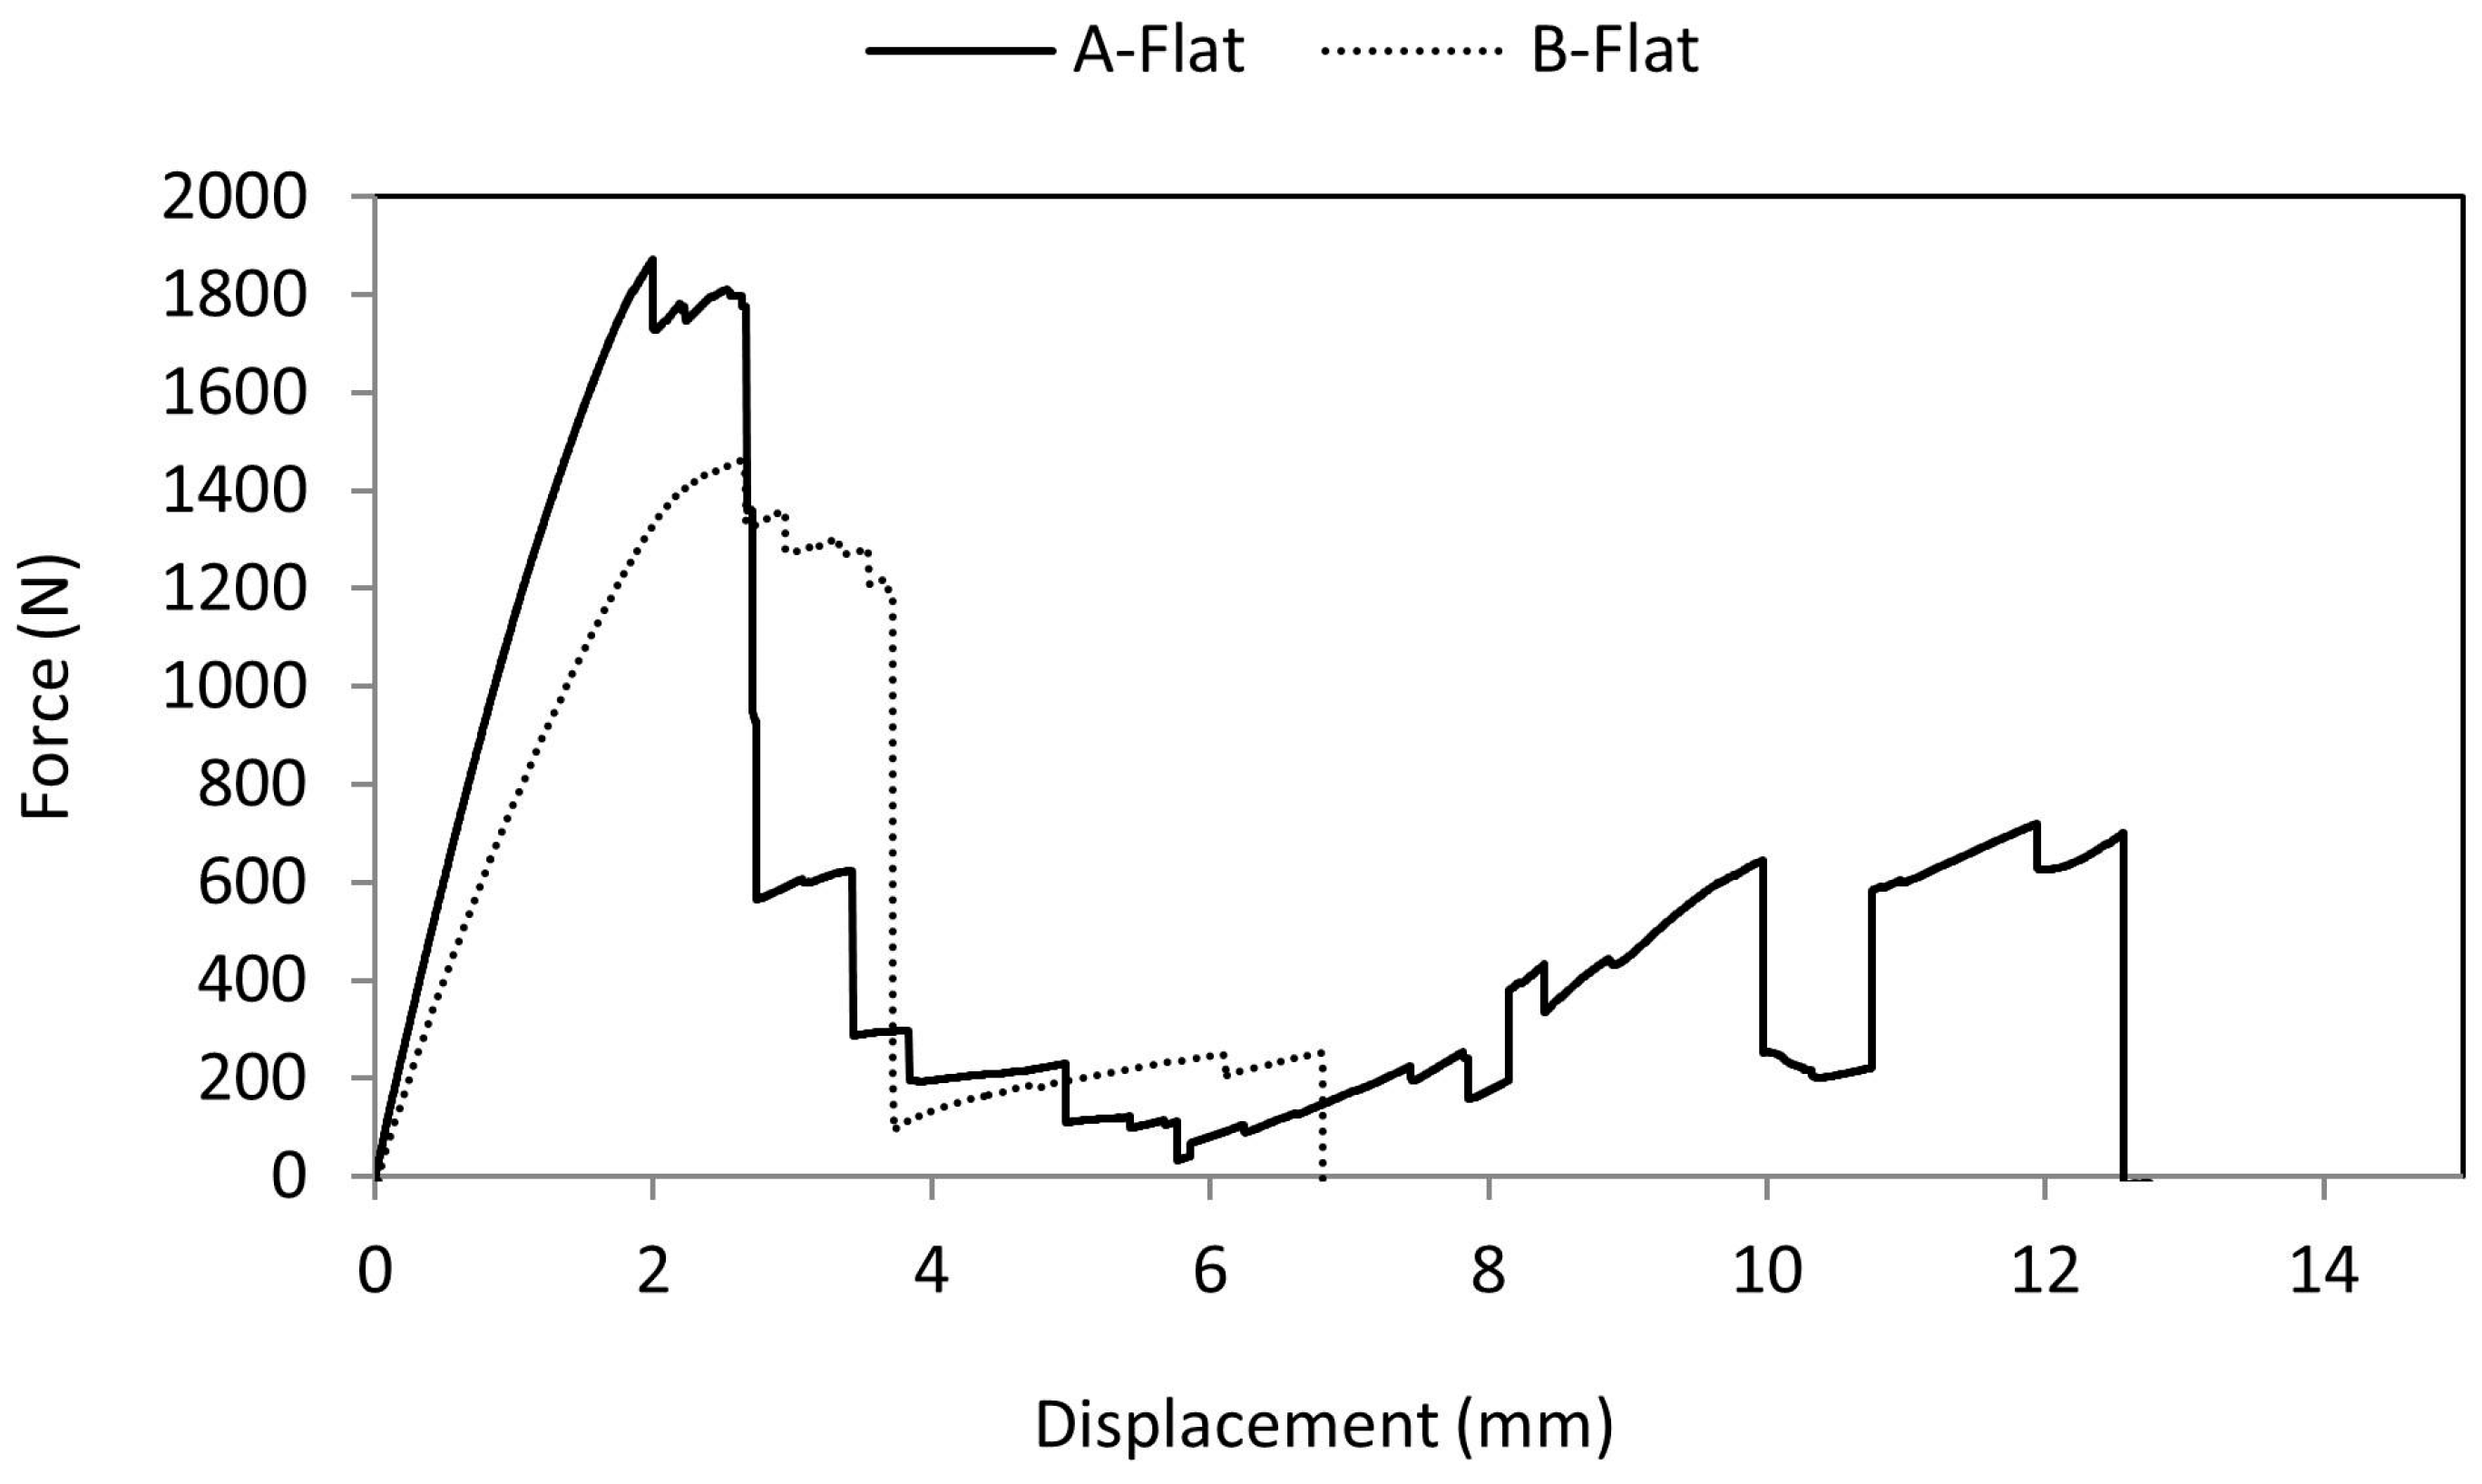
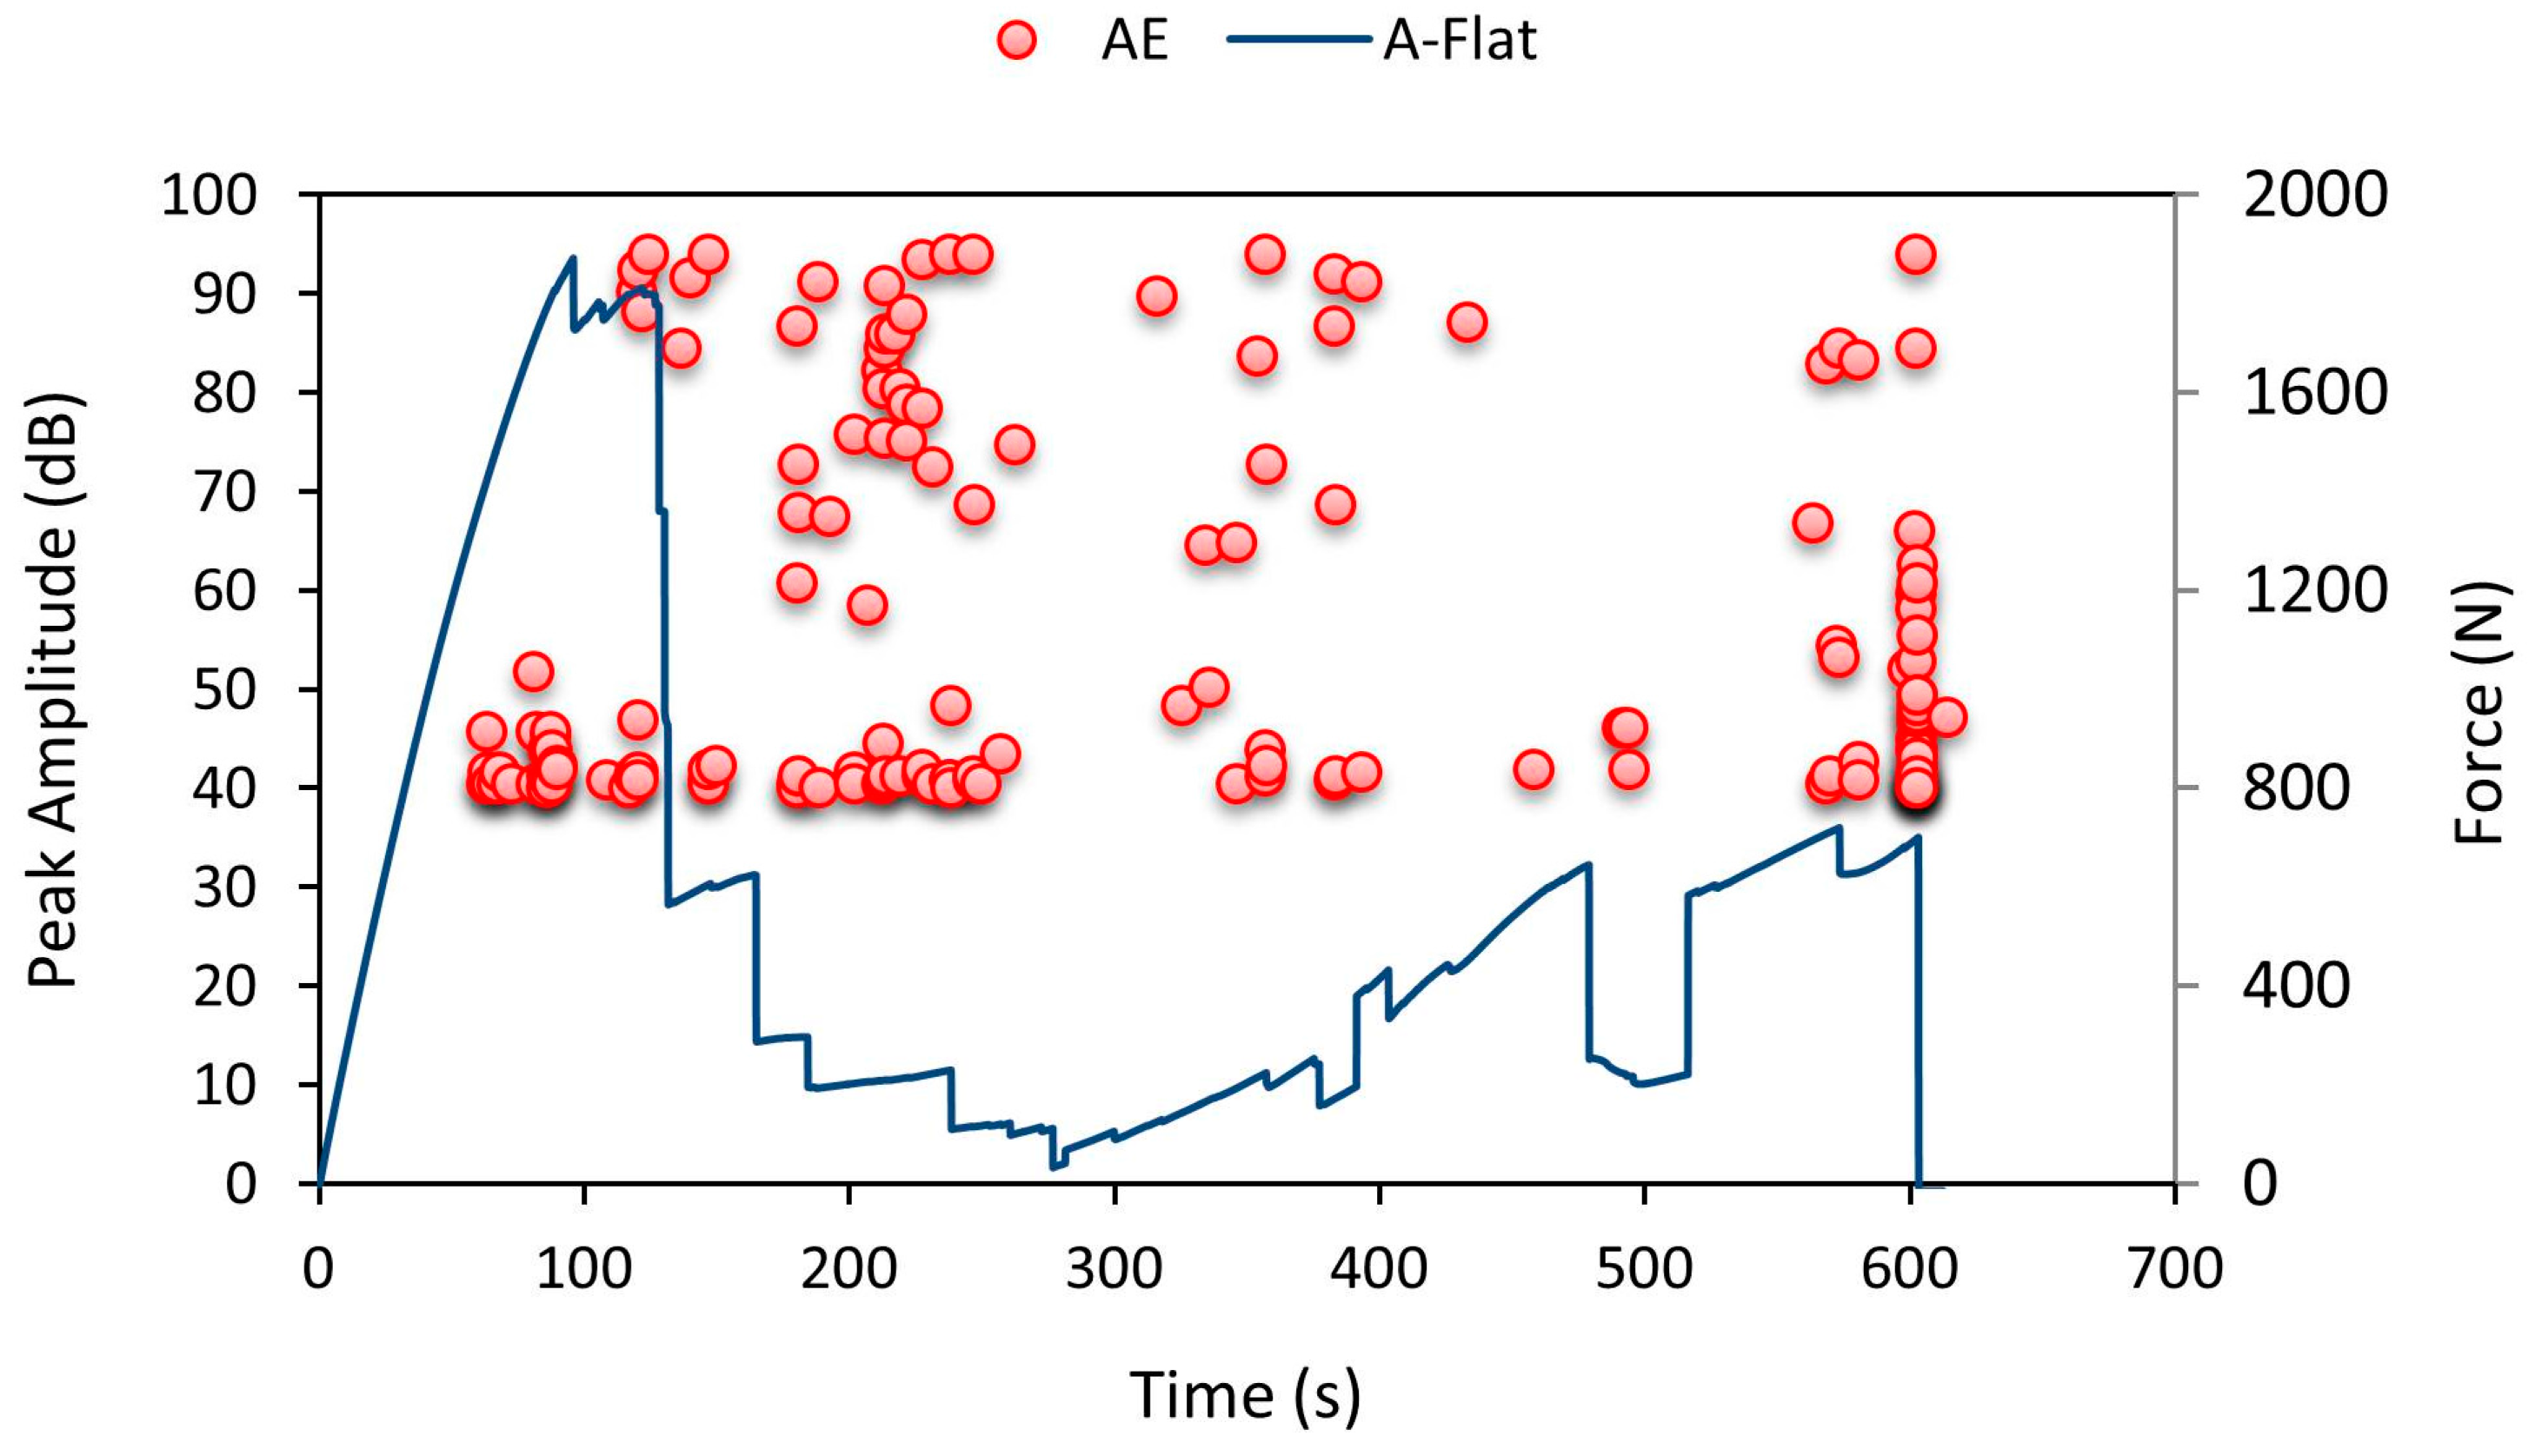
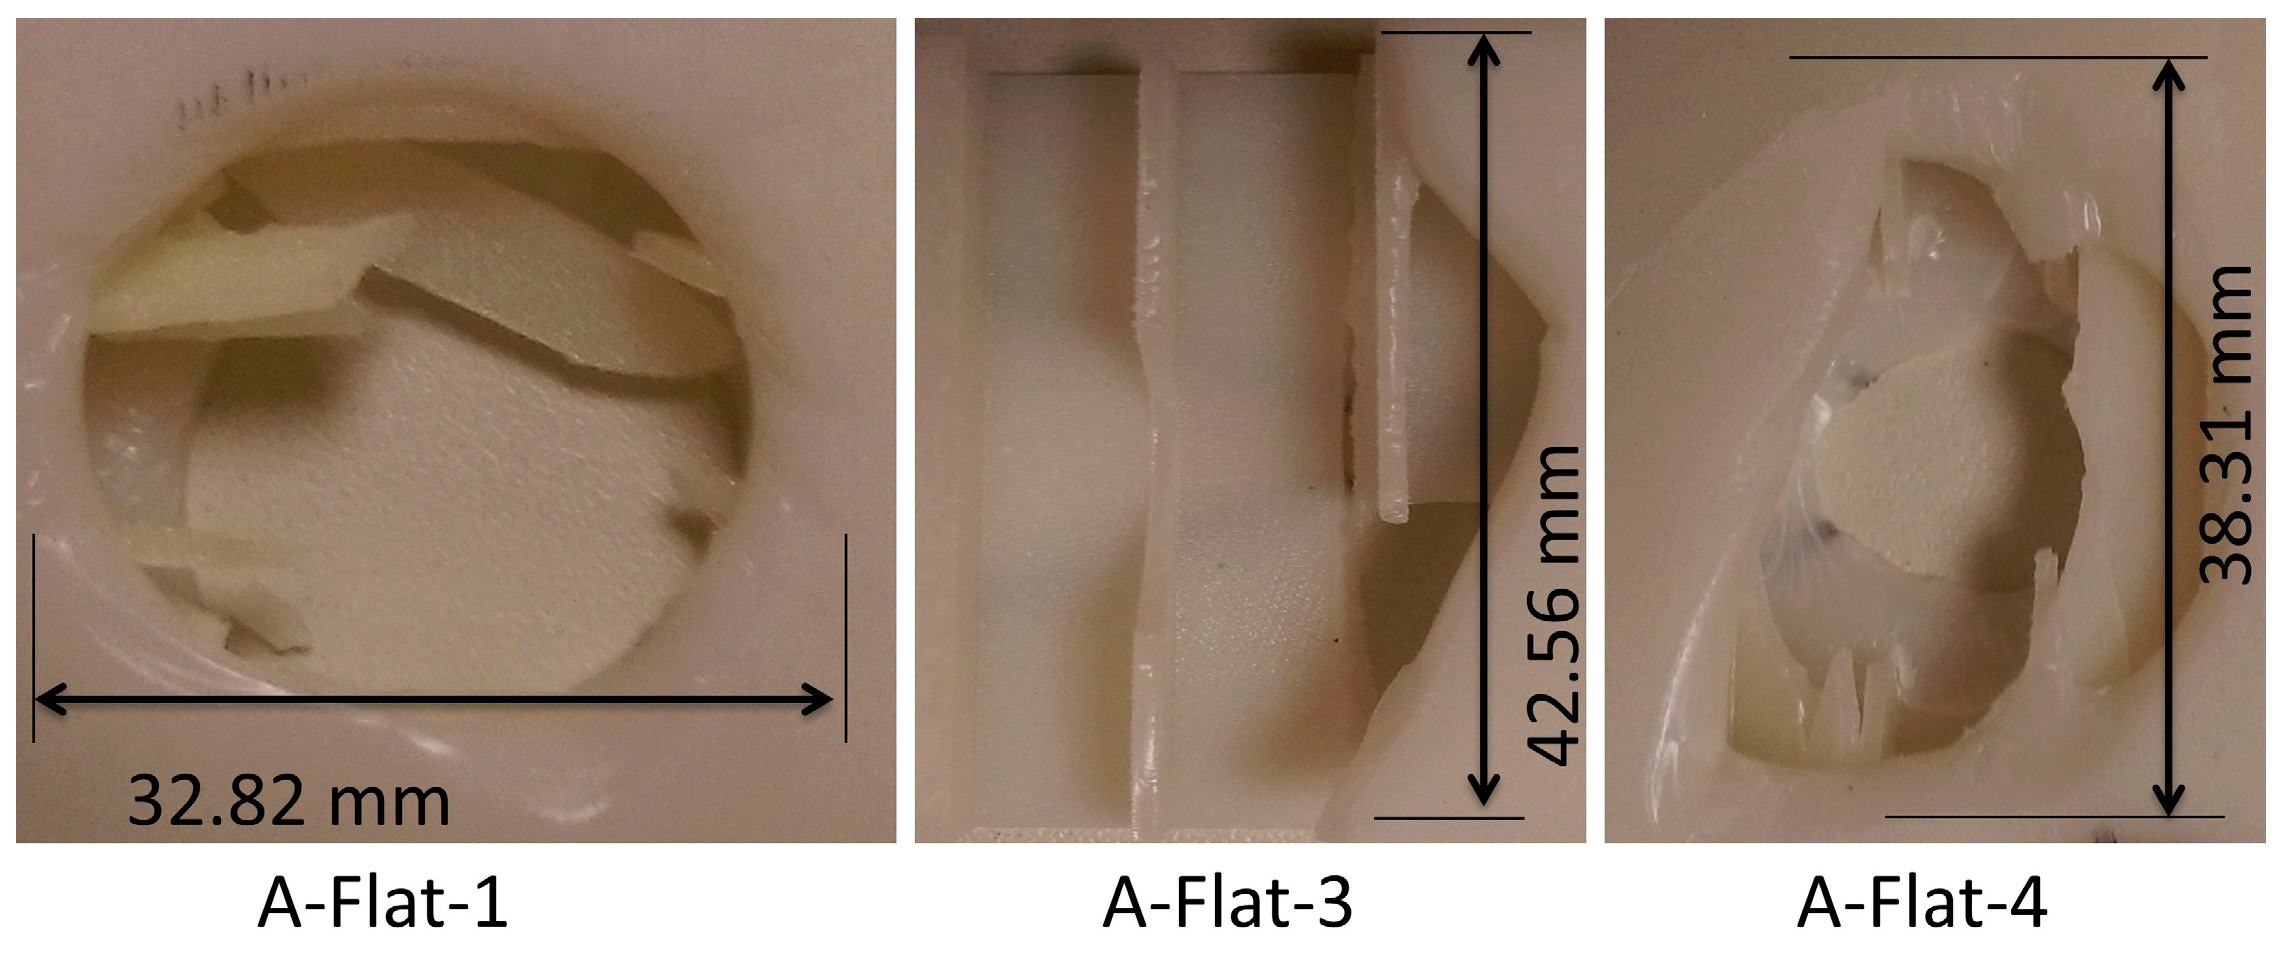
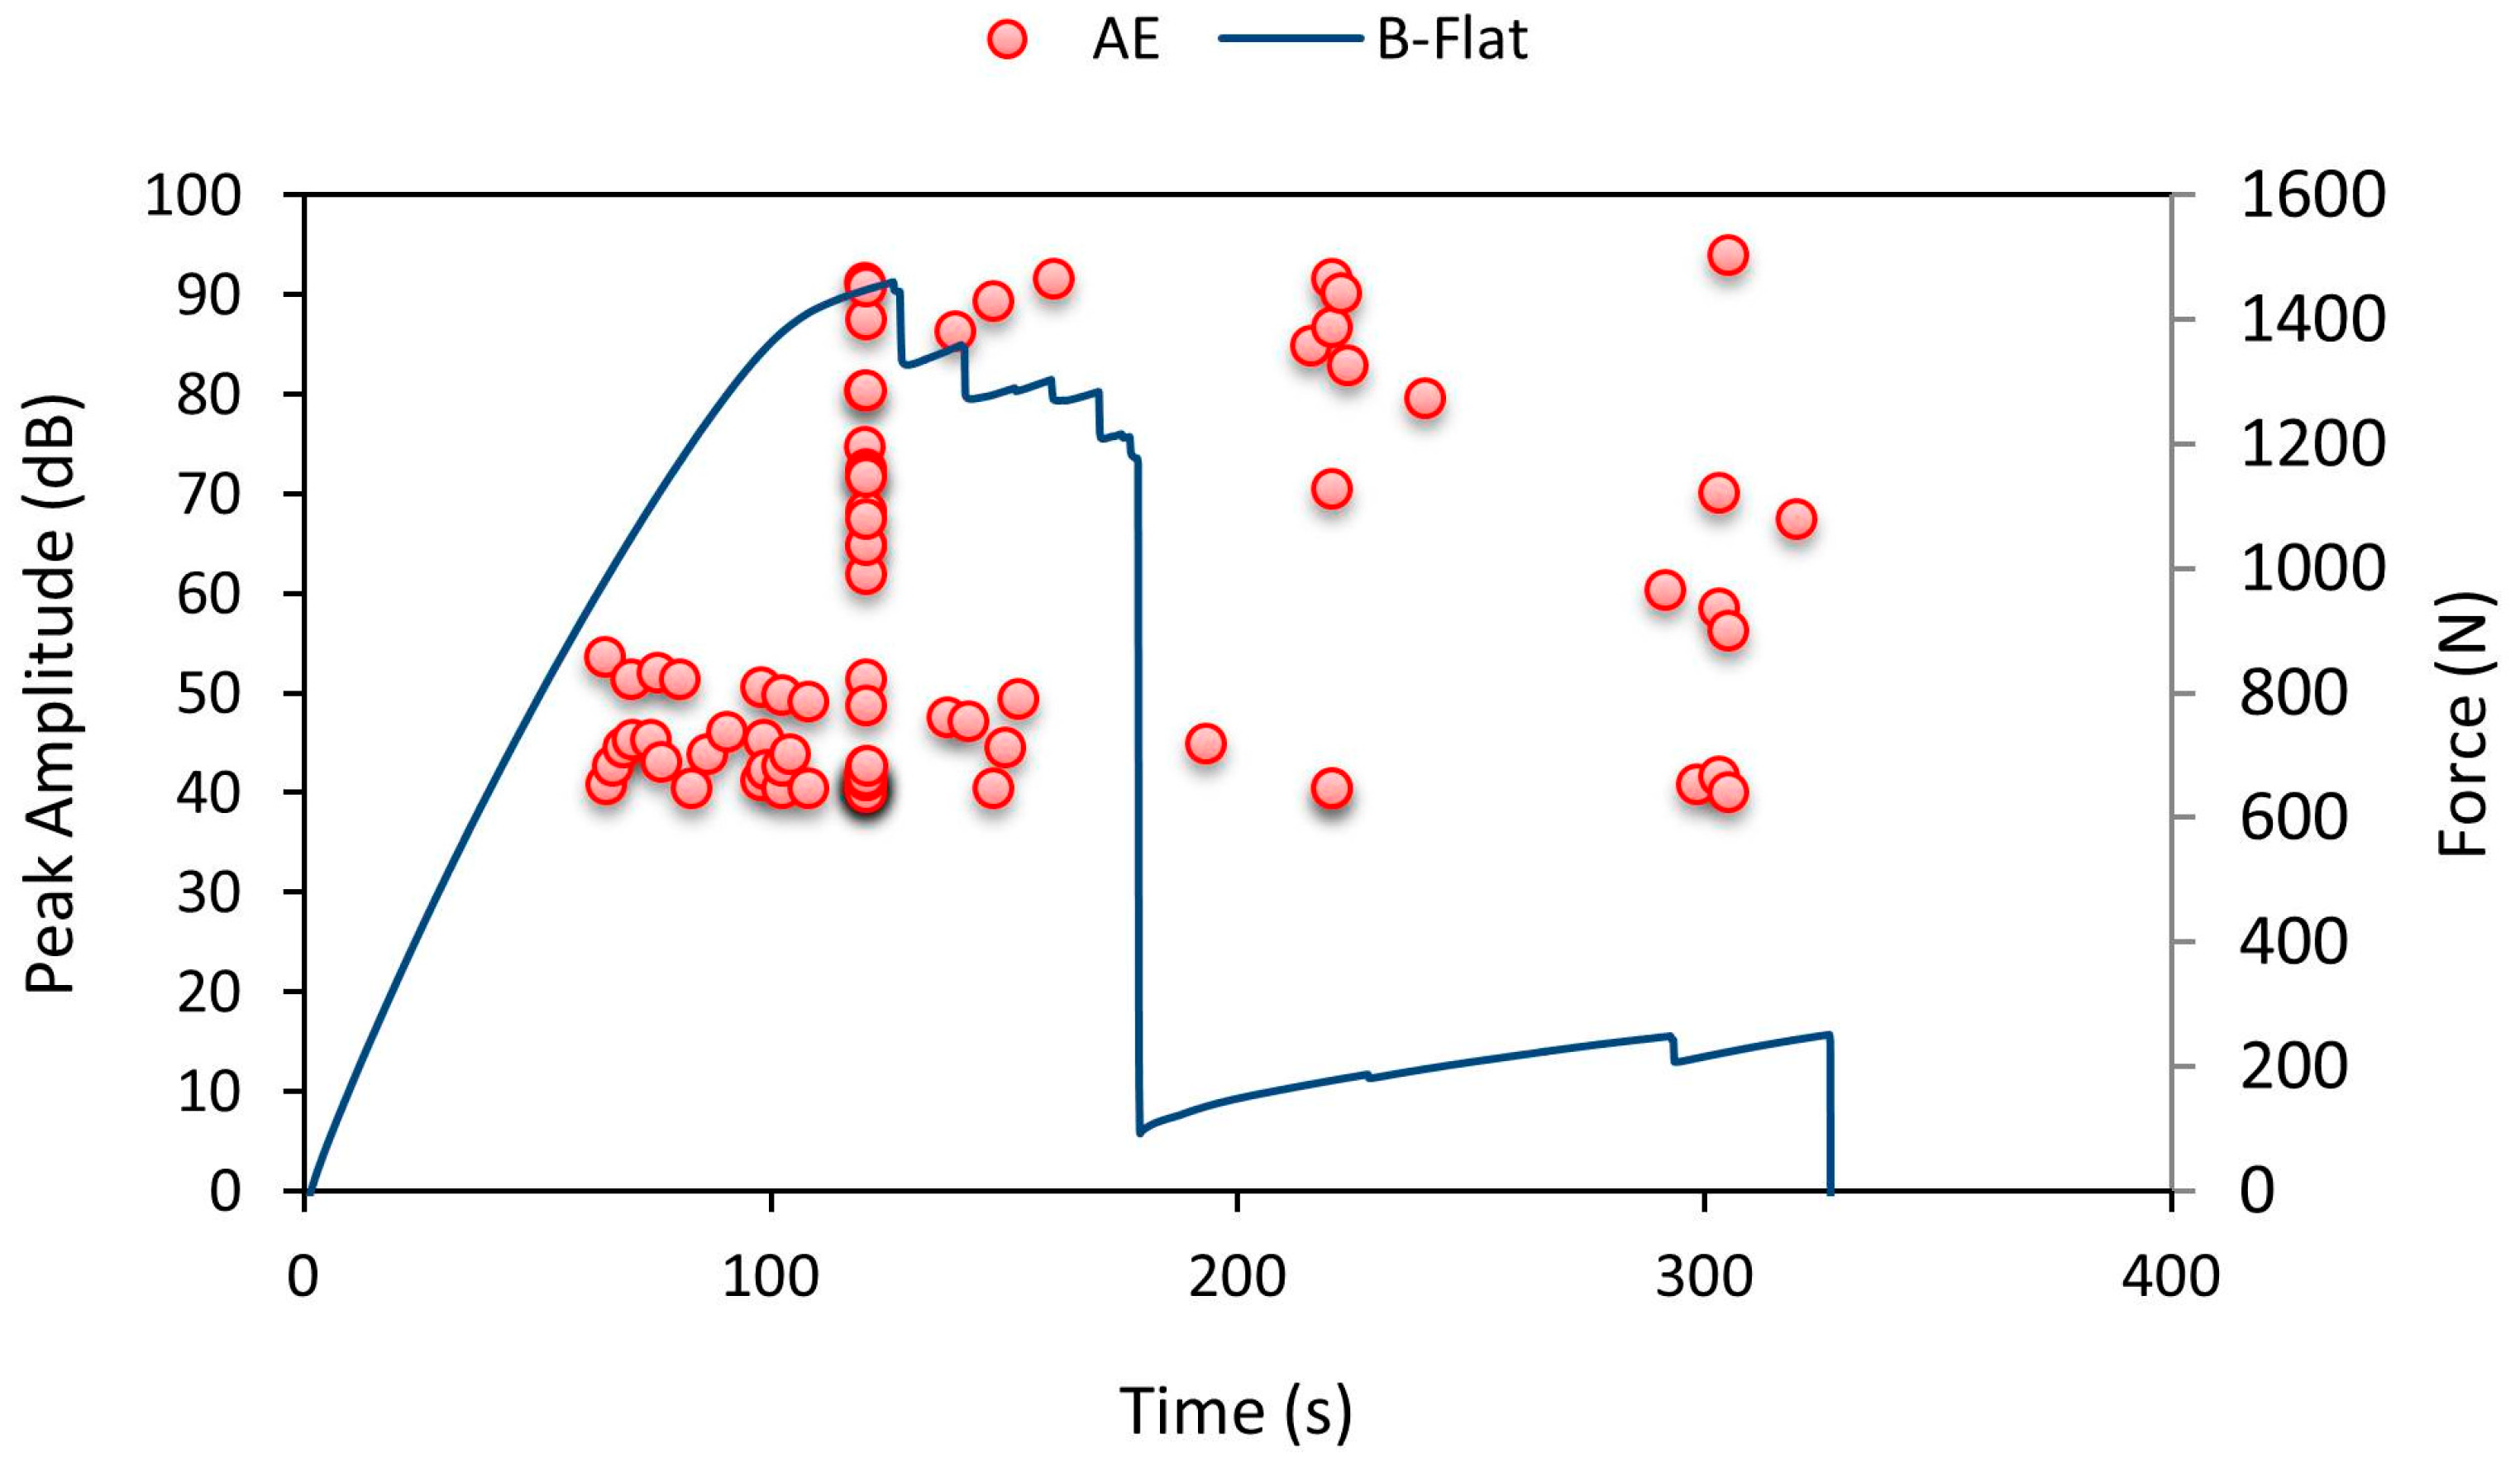
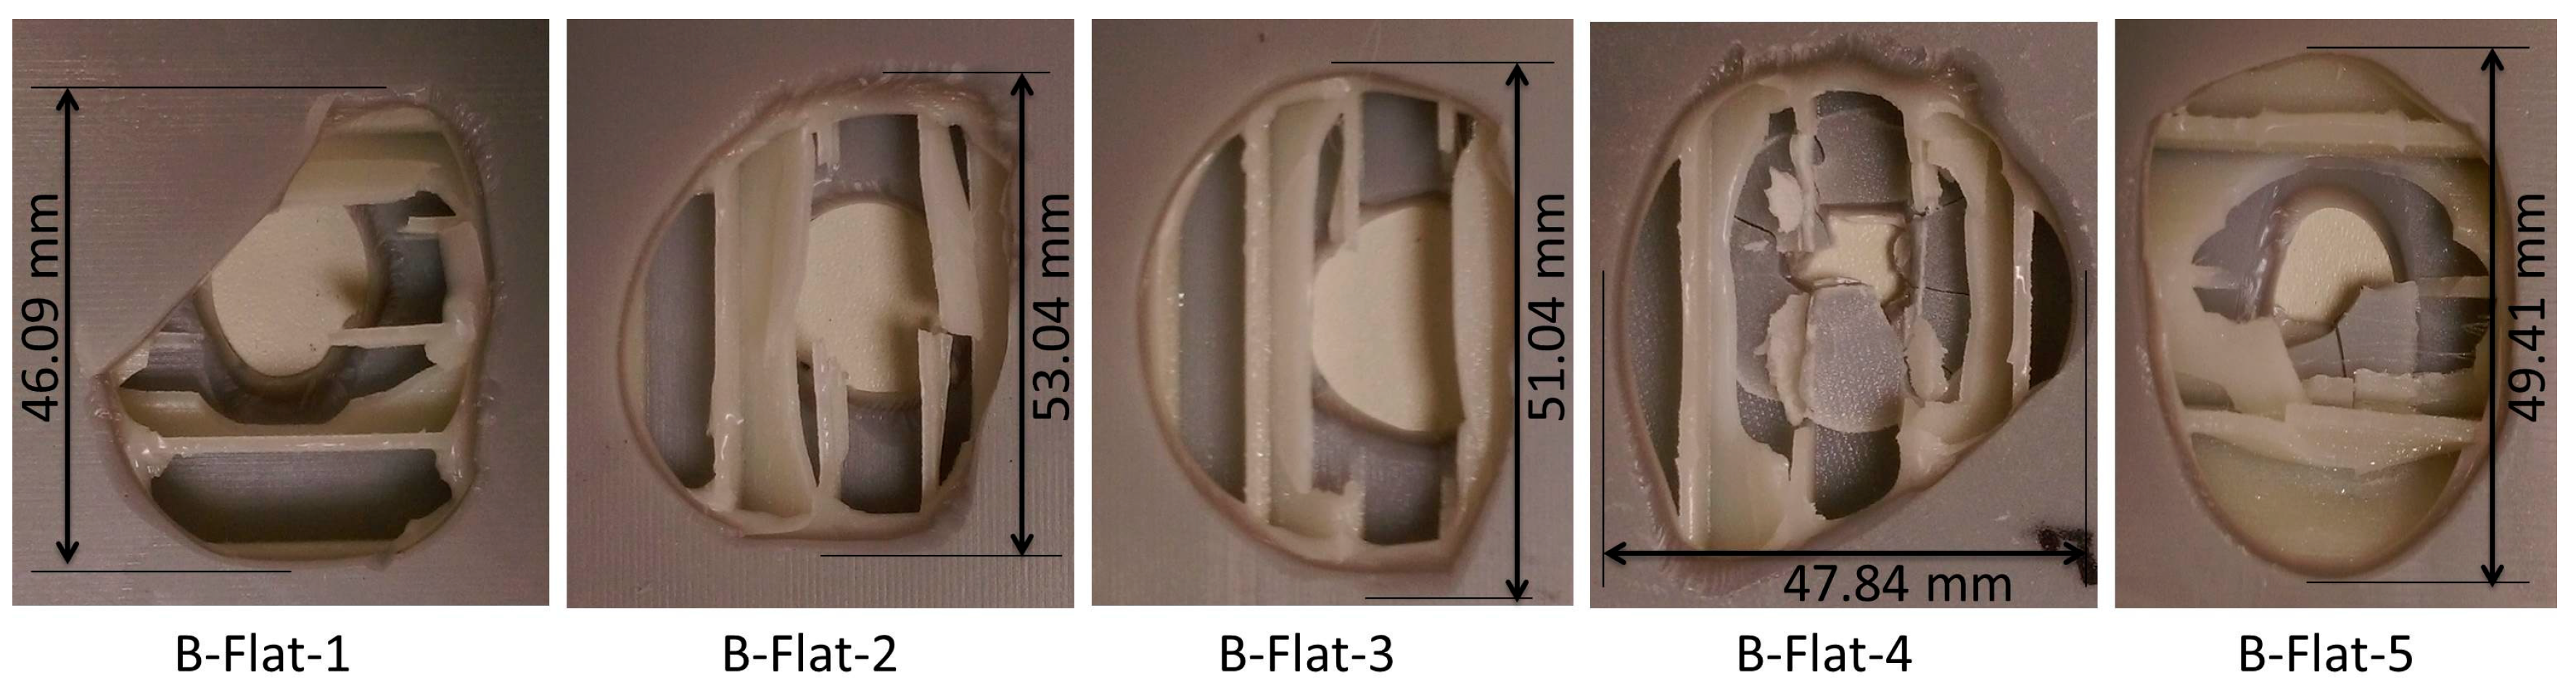
4.3. Force vs. Displacement, Force vs. Time and Peak Amplitude Pattern under Flat Indenter
4.4. Energy Absorption Characteristics
5. Conclusions
- (1)
- Indenter geometry (geometry of impacting object) has a major influence in determining the load bearing capacity of the sandwich structures. Type A and type B series specimens could withstand loads up to 2.0 kN and 1.54 kN under a flat faced indenter. The specimens are prone to damage easily under sharp tip indenters with a low load bearing capacity of 0.92 kN and 0.76 kN for Type A and type B series specimens. These findings also agree with the findings of other researchers.
- (2)
- 3D printed trapezoidal sandwich structures of type A series can withstand high loads but fail immediately with brittle behavior with lower indenter displacements. This failure mode was because of the brittle material used for 3D printing. In addition, the type B series specimens could only withstand low loads but failed only after higher indenter displacement. Indenter geometries and facesheet material variation were found to be the factors most influencing the load bearing capacity and energy absorption characteristics of the specimen.
- (3)
- High sensitive AE patterns as a cluster of low amplitude noise levels indicate invisible crack initiation in the specimens and high amplitude noise levels obtained indicate crack propagation in the specimen. Therefore, this type of high sensitive crack detection technique is useful in detecting even minor and internal failures in aerospace applications reducing the high risk of complete part failure during operation.
Acknowledgments
Author Contributions
Conflicts of Interest
References
- Sun, D.; Zhang, W.; Zhao, Y.; Li, G.; Xing, Y.; Gong, G. In-plane crushing and energy absorption performance of multi-layer regularly arranged circular honeycombs. Compos. Struct. 2013, 96, 726–735. [Google Scholar] [CrossRef]
- Nagasankar, P.; Balasivanandha Prabu, S.; Velmurugan, R. Role of different fiber orientations and thicknesses of the skins and the core on the transverse shear damping of polypropylene honeycomb sandwich structures. Mech. Mater. 2015, 91, 252–261. [Google Scholar] [CrossRef]
- Han, B.; Zhang, Z.-J.; Zhang, Q.-C.; Zhang, Q.; Lu, T.J.; Lu, B.-H. Recent advances in hybrid lattice-cored sandwiches for enhanced multifunctional performance. Extreme Mech. Lett. 2017, 10, 58–69. [Google Scholar] [CrossRef]
- Fathers, R.K.; Gattas, J.M.; You, Z. Quasi-static crushing of eggbox, cube, and modified cube foldcore sandwich structures. Int. J. Mech. Sci. 2015, 101–102, 421–428. [Google Scholar] [CrossRef]
- Norouzi, H.; Rostamiyan, Y. Experimental and numerical study of flatwise compression behavior of carbon fiber composite sandwich panels with new lattice cores. Constr. Build. Mater. 2015, 100, 22–30. [Google Scholar] [CrossRef]
- Cao, B.T.; Hou, B.; Li, Y.L.; Zhao, H. An experimental study on the impact behavior of multilayer sandwich with corrugated cores. Int. J. Solids Struct. 2017, 109, 33–45. [Google Scholar] [CrossRef]
- Liu, J.; He, W.; Xie, D.; Tao, B. The effect of impactor shape on the low-velocity impact behavior of hybrid corrugated core sandwich structures. Compos. Part B Eng. 2017, 111, 315–331. [Google Scholar] [CrossRef]
- Dikshit, V.; Prasanth, N.A.; Kumar, J.; Yap, Y.L.; Yeong, W.Y. Investigation of quasi static indentation on 3D printed honeycomb based truncated-pyramid square structure. In Proceedings of the 2nd International Conference on Progress in Additive Manufacturing (Pro-AM 2016), Singapore, 16–19 May 2016.
- Lu, L.; Song, H.; Huang, C. Experimental investigation of unbound nodes identification for metallic sandwich panels with truss core. Compos. Struct. 2017, 163, 248–256. [Google Scholar] [CrossRef]
- Andrews, E.W.; Moussa, N.A. Failure mode maps for composite sandwich panels subjected to air blast loading. Int. J. Impact Eng. 2009, 36, 418–425. [Google Scholar] [CrossRef]
- Zhu, S.; Chai, G.B. Damage and failure mode maps of composite sandwich panel subjected to quasi-static indentation and low velocity impact. Compos. Struct. 2013, 101, 204–214. [Google Scholar] [CrossRef]
- Campi, F.; Massabò, R. An analytical assessment of the influence of skin imperfections on the indentation collapse mechanism in composite sandwich beams. Compos. Struct. 2011, 94, 299–311. [Google Scholar] [CrossRef]
- Caprino, G.; Durante, M.; Leone, C.; Lopresto, V. The effect of shear on the local indentation and failure of sandwich beams with polymeric foam core loaded in flexure. Compos. Part B Eng. 2015, 71, 45–51. [Google Scholar] [CrossRef]
- Meraghni, F.; Desrumaux, F.; Benzeggagh, M. Mechanical behaviour of cellular core for structural sandwich panels. Compos. Part A Appl. Sci. Manuf. 1999, 30, 767–779. [Google Scholar] [CrossRef]
- Scarpa, F.; Burriesci, G.; Smith, F.; Chambers, B. Mechanical and electromagnetic behaviour of auxetic honeycomb structures. Aeronaut. J. 2003, 107, 175. [Google Scholar]
- Ashab, A.S.M.; Ruan, D.; Lu, G.; Xu, S.; Wen, C. Experimental investigation of the mechanical behavior of aluminum honeycombs under quasi-static and dynamic indentation. Mater. Des. 2015, 74, 138–149. [Google Scholar] [CrossRef]
- Cheng, S.L.; Zhao, X.Y.; Xin, Y.J.; Du, S.Y.; Li, H.J. Quasi-static localized indentation tests on integrated sandwich panel of aluminum foam and epoxy resin. Compos. Struct. 2015, 129, 157–164. [Google Scholar] [CrossRef]
- Icardi, U.; Sola, F. Indentation of sandwiches using a plate model with variable kinematics and fixed degrees of freedom. Thin Walled Struct. 2015, 86, 24–34. [Google Scholar] [CrossRef]
- Petras, A.; Sutcliffe, M.P.F. Indentation resistance of sandwich beams. Compos. Struct. 1999, 46, 413–424. [Google Scholar] [CrossRef]
- Rajaneesh, A.; Sridhar, I.; Akisanya, A.R. Indentation failure of circular composite sandwich plates. Mater. Des. 2016, 89, 439–447. [Google Scholar] [CrossRef]
- St-Pierre, L.; Fleck, N.A.; Deshpande, V.S. The dynamic indentation response of sandwich panels with a corrugated or y-frame core. Int. J. Mech. Sci. 2015, 92, 279–289. [Google Scholar] [CrossRef]
- Zameer Abbas, S.; Ahmad Khalid, F.; Zaigham, H. Indentation and deformation behavior of feco-based bulk metallic glass alloys. Mater. Sci. Eng. A 2016, 654, 426–435. [Google Scholar] [CrossRef]
- Zhou, G.; Hill, M.; Loughlan, J.; Hookham, N. Damage characteristics of composite honeycomb sandwich panels in bending under quasi-static loading. J. Sandwich Struct. Mater. 2006, 8, 55–90. [Google Scholar] [CrossRef]
- Muscat–Fenech, C.D.M.; Cortis, J.; Cassar, C. Characterizing qslvii damage of composite sandwich hulls. Procedia Eng. 2014, 88, 141–148. [Google Scholar] [CrossRef]
- Tan, Y.J.; Tan, X.; Yeong, W.Y.; Tor, S.B. Additive manufacturing of patient-customizable scaffolds for tubular tissues using the melt-drawing method. Materials 2016, 9, 893. [Google Scholar] [CrossRef]
- Lee, J.M.; Yeong, W.Y. Design and printing strategies in 3D bioprinting of cell-hydrogels: A review. Adv. Healthc. Mater. 2016, 5, 2856–2865. [Google Scholar] [CrossRef] [PubMed]
- Sing, S.L.; An, J.; Yeong, W.Y.; Wiria, F.E. Laser and electron-beam powder-bed additive manufacturing of metallic implants: A review on processes, materials and designs. J. Orthop. Res. 2016, 34, 369–385. [Google Scholar] [CrossRef] [PubMed]
- Wong, K.K.; Ho, J.Y.; Leong, K.C.; Wong, T.N. Fabrication of heat sinks by selective laser melting for convective heat transfer applications. Virtual Phys. Prototyp. 2016, 11, 159–165. [Google Scholar] [CrossRef]
- Tan, W.S.; Chua, C.K.; Chong, T.H.; Fane, A.G.; Jia, A. 3D printing by selective laser sintering of polypropylene feed channel spacers for spiral wound membrane modules for the water industry. Virtual Phys. Prototyp. 2016, 11, 151–158. [Google Scholar] [CrossRef]
- Wilkinson, S.; Cope, N. Chapter 10—3D printing and sustainable product development a2–akhgar, mohammad dastbazcolin pattinsonbabak. In Green Information Technology; Morgan Kaufmann: Boston, MA, USA, 2015; pp. 161–183. [Google Scholar]
- Thornton, A. Additive Manufacturing (AM): Emerging Technologies, Applications and Economic Implication; Nova Science Publishers, Inc.: Hauppauge, NY, USA, 2015; pp. 1–154. [Google Scholar]
- Joshi, S.C.; Sheikh, A.A. 3D printing in aerospace and its long-term sustainability. Virtual Phys. Prototyp. 2015, 10, 175–185. [Google Scholar] [CrossRef]
- Yap, Y.L.; Yeong, W.Y. Shape recovery effect of 3D printed polymeric honeycomb: This paper studies the elastic behaviour of different honeycomb structures produced by polyjet technology. Virtual Phys. Prototyp. 2015, 10, 91–99. [Google Scholar] [CrossRef]
- Yap, Y.L.; Lai, Y.M.; Zhou, H.F.; Yeong, W.Y. Compressive strength of thin-walled cellular core by inkjet-based additive manufacturing. In Proceedings of the 1st International Conference on Progress in Additive Manufacturing, Singapore, 26–28 May 2014; pp. 333–338.
- Dikshit, V.; Yap, Y.L.; Goh, G.D.; Yang, H.; Lim, J.C.; Qi, X.; Yeong, W.Y.; Wei, J. Investigation of out of plane compressive strength of 3D printed sandwich composites. IOP Conf. Ser. Mater. Sci. Eng. 2016, 139, 012017. [Google Scholar] [CrossRef]
- Dikshit, V.; Prasanth, N.A.; Kumar, J.; Yap, Y.L.; Agarwala, S.; Yeong, W.Y. Out of plane compressive strength of 3D printed vertical pillared corrugated core structure. In Proceedings of the 2nd International Conference on Progress in Additive Manufacturing, Singapore, 16–19 May 2016; pp. 128–133.
- Yang, H.; Lim, J.C.; Liu, Y.; Qi, X.; Yap, Y.L.; Dikshit, V.; Yeong, W.Y.; Wei, J. Performance evaluation of projet multi-material jetting 3D printer. Virtual Phys. Prototyp. 2017, 82, 95–103. [Google Scholar] [CrossRef]
- Lu, L.; Sharf, A.; Zhao, H.; Wei, Y.; Fan, Q.; Chen, X.; Savoye, Y.; Tu, C.; Cohen-Or, D.; Chen, B. Build-to-last: Strength to weight 3D printed objects. ACM Trans. Graph. 2014, 33, 97. [Google Scholar] [CrossRef]
- Dayyani, I.; Shaw, A.D.; Saavedra Flores, E.I.; Friswell, M.I. The mechanics of composite corrugated structures: A review with applications in morphing aircraft. Compos. Struct. 2015, 133, 358–380. [Google Scholar] [CrossRef]
- American Society for Testing Materials. ASTM D6264/D6264M-12. Standard test Method for Measuring the Damage Resistance of a Fiber-Reinforced Polymer-Matrix Composite to a Concentrated Quasi-Static Indentation Force; ASTM International: West Conshohocken, PA, USA, 2012. [Google Scholar]
- Schindelin, J.; Rueden, C.T.; Hiner, M.C.; Eliceiri, K.W. The ImageJ ecosystem: An open platform for biomedical image analysis. Mol. Reprod. Dev. 2015, 82, 518–529. [Google Scholar] [CrossRef] [PubMed]
- Schneider, C.A.; Rasband, W.S.; Eliceiri, K.W. Nih image to ImageJ: 25 years of image analysis. Nat. Methods 2012, 9, 671–675. [Google Scholar] [CrossRef] [PubMed]


| Material/Property | VisiJet® CR-WT White Rigid ABS-Like Material | VisiJet® CF-BK Black Rubber-like Elastic Material | VisiJet® RWT-FBK 400 Slightly Flexible Material |
|---|---|---|---|
| Density (g/cc) | 1.04 | 1.04 | 1.04 |
| Tensile Strength (MPa) | 56 | 2.2 | 10 |
| Elongation at Break (%) | 8.1 | 290 | 25 |
| Flexural Strength (MPa) | 74 | 0.5 | 7.3 |
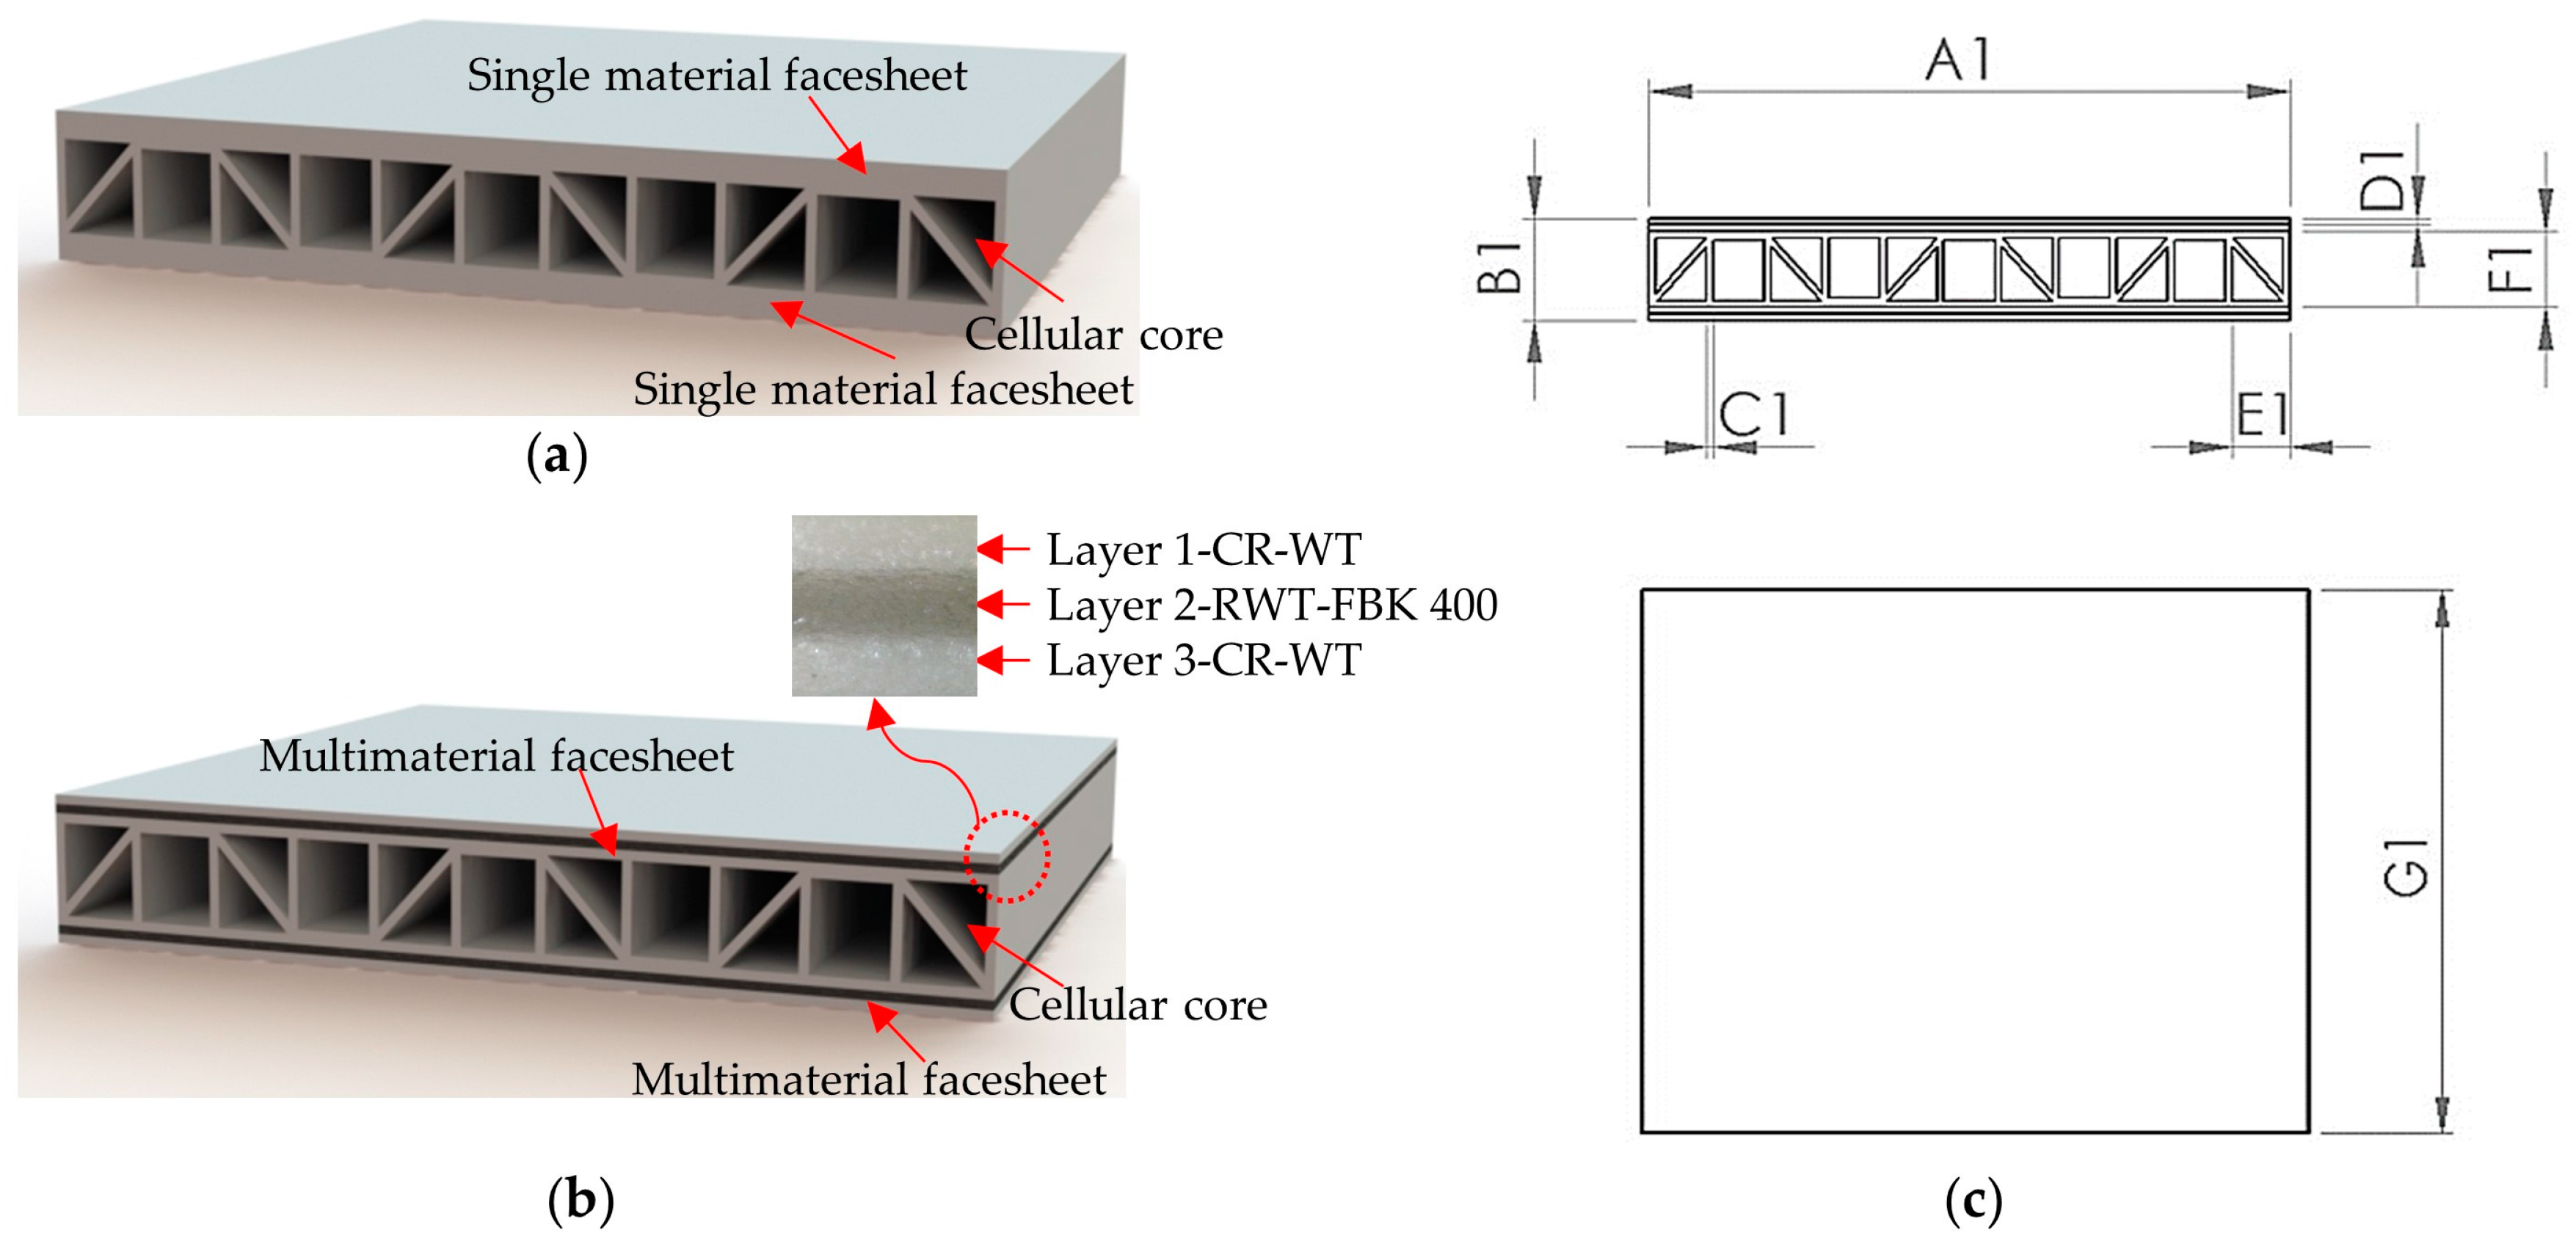
| Nomenclature | A1 | B1 | C1 | D1 | E1 | F1 | G1 |
|---|---|---|---|---|---|---|---|
| Vertical pillared trapezoidal structures (All dimensions are in mm) | 100 | 16 | 1 | 1 | 10 | 12 | 100 |
| Nomenclature | Definition |
|---|---|
| Type A | Specimen facesheet with VisiJet® CR-WT white rigid ABS-like material |
| Type B | Specimen facesheet with three layers Layer 1-VisiJet® CR-WT, Layer 2-VisiJet® Layer 2-RWT-FBK 400 and Layer 3-VisiJet® CR-WT materials respectively |
| Hemi, Coni, Flat | Testing was done using hemispherical, conical, and flat indenters respectively |
| Specimen | Emax (J) |
|---|---|
| A-Hemi | 6.87 |
| A-Coni | 9.40 |
| A-Flat | 6.96 |
| B-Hemi | 8.82 |
| B-Coni | 9.66 |
| B-Flat | 8.95 |
| Specimen | Max Force that the Specimen Can Withstand during Crack Initiation | Max Displacement During Drop in Force | Damage Area on Top Facesheet | Damage Area on Bottom Facesheet | Percentage of Damage Occurred in Exposed Area (Bottom Side) |
|---|---|---|---|---|---|
| (kN) | (mm) | mm2 | mm2 | (%) | |
| A-Hemi Average ± SD | 1.36 ± 0.07 | 2.62 ± 0.40 | 133.60 | 1531.00 | 33.40 |
| A-Coni Average ± SD | 0.92 ± 0.21 | 12.03 ± 2.02 * | 168.28 | 396.12 | 48.62 |
| A-Flat Average ± SD | 2.0 ± 0.29 | 2.34 ± 0.31 | 132.02 | 963.32 | 40.94 |
| B-Hemi Average ± SD | 1.31 ± 0.16 | 3.37 ± 0.38 | 133.41 | 1379.20 | 30.04 |
| B-Coni Average ± SD | 0.76 ± 0.29 | 12.84 ± 5.15 * | 163.43 | 757.80 | 36.50 |
| B-Flat Average ± SD | 1.54 ± 0.13 | 2.25 ± 0.50 | 133.30 | 1659.16 | 36.16 |
© 2017 by the authors. Licensee MDPI, Basel, Switzerland. This article is an open access article distributed under the terms and conditions of the Creative Commons Attribution (CC BY) license ( http://creativecommons.org/licenses/by/4.0/).
Share and Cite
Dikshit, V.; Nagalingam, A.P.; Yap, Y.L.; Sing, S.L.; Yeong, W.Y.; Wei, J. Investigation of Quasi-Static Indentation Response of Inkjet Printed Sandwich Structures under Various Indenter Geometries. Materials 2017, 10, 290. https://doi.org/10.3390/ma10030290
Dikshit V, Nagalingam AP, Yap YL, Sing SL, Yeong WY, Wei J. Investigation of Quasi-Static Indentation Response of Inkjet Printed Sandwich Structures under Various Indenter Geometries. Materials. 2017; 10(3):290. https://doi.org/10.3390/ma10030290
Chicago/Turabian StyleDikshit, Vishwesh, Arun Prasanth Nagalingam, Yee Ling Yap, Swee Leong Sing, Wai Yee Yeong, and Jun Wei. 2017. "Investigation of Quasi-Static Indentation Response of Inkjet Printed Sandwich Structures under Various Indenter Geometries" Materials 10, no. 3: 290. https://doi.org/10.3390/ma10030290