Assembly of One-Patch Colloids into Clusters via Emulsion Droplet Evaporation

1
Theoretische Physik II, Physikalisches Institut, Universität Bayreuth, Universitätsstraße 30, D-95440 Bayreuth, Germany
2
Department of Physics, Hanoi National University of Education, 136 Xuanthuy, Hanoi 100000, Vietnam
3
Department of Physics, University of Surrey, Guildford GU2 7XH, UK
*
Author to whom correspondence should be addressed.
Materials 2017, 10(4), 361; https://doi.org/10.3390/ma10040361
Submission received: 23 February 2017
/
Revised: 24 March 2017
/
Accepted: 27 March 2017
/
Published: 29 March 2017
(This article belongs to the Special Issue Designed Colloidal Self-Assembly)
Abstract
:We study the cluster structures of one-patch colloidal particles generated by droplet evaporation using Monte Carlo simulations. The addition of anisotropic patch–patch interaction between the colloids produces different cluster configurations. We find a well-defined category of sphere packing structures that minimize the second moment of mass distribution when the attractive surface coverage of the colloids χ is larger than 0.3. For χ < 0.3, the uniqueness of the packing structures is lost, and several different isomers are found. A further decrease of χ below 0.2 leads to formation of many isomeric structures with less dense packings. Our results could provide an explanation of the occurrence of uncommon cluster configurations in the literature observed experimentally through evaporation-driven assembly.
1. Introduction
Packings of colloidal particles in regular structures are of great interest in colloid science. One particular class of such packings is formed by colloidal clusters which can be regarded as colloidal analogues to small molecules, i.e., “colloidal molecules” [1,2]. In pioneering work, Manoharan, Elsesser, and Pine [3] reported a method for the fabrication of clusters of microspheres. The microspheres absorb at the interface of (liquid) emulsion droplets. During the droplet evaporation, capillary forces and van der Waals attractive interactions pack the micropheres into stable clusters. The final cluster configurations are unique (i.e., possess a single well-defined geometry) for with the number of constituent particles. Lauga and Brenner [4] later have shown that the unique configuration of each -sphere cluster can be correctly predicted by minimization of the total surface energy of the droplet–particle interface. Remarkably, these configurations with exactly correspond to those obtained from the calculation of the packings that minimize the second moment of the mass distribution, namely -minimal packings (-minimal clusters), by Sloane et al. [5]. In addition to -minimal packings, many other optimal sphere packings based on optimization principles have been investigated, such as the Lennard–Jones packing problem [6], Coulomb packing [7], spherical packing [8] and hard-sphere packing with a short-range attraction [9]. The geometric structures of the Lennard–Jones packing were obtained by mimimizing the Lennard–Jones potential between spheres. Coulomb packing, sometimes known as the Thomson problem [7], is an equilibrium arrangement of identical point charges on a sphere so that the total electrostatic potential energy is minimal. In the spherical packing or the Tammes problem [8], monodisperse hard spheres arrange on the surface of another sphere such that the smallest distance between the center-center distance of spheres is maximized, or equivalently maximizing the area density of spheres. Interestingly, all these packings have exactly the same structures for up to six, but differ at most values .
A higher level of complexity of cluster structures can be achieved when the colloidal shape is extended beyond spherical. Peng and cowokers [10] prepared clusters of dumbbell-shaped particles and indicated that minimization of is not a general rule for aggregation of shape-anisotropic particles. Open clusters with a compact core and protruding arms were obtained by varying the relative size of colloidal spheres in dumbbells [11]. Besides extending the colloidal shape, anisotropic surface chemistry has attracted considerable attention [12]. Granick et al. [13] prepared clusters of charged Janus particles, i.e., spherical particles possessing oppositely charged hemispheres. The authors later considered clusters of amphiphilic Janus colloids whose two hemispheres are negatively charged and hydrophobic, respectively [14,15]. Experimental results that were complemented by Monte Carlo simulations revealed the existence of several cluster structures that belong to both the conventional polyhedra and less densely packed structures. However, the authors investigated cluster formation without emulsion droplets, and therefore the resulting clusters may represent intermediate states of larger packings because there is no limitation to the size of clusters that can form through electrostatic interactions. Sciortino and coworkers performed numerical simulations to investigate the collective structure as well as the phase behavior of one-patch particles [16,17]. They found that self-assembly of such colloids gives rise to a rich variety of increasingly complex structures and produces unconventional phase equilibria.
Despite the number of experimental [18,19,20], theoretical [21,22,23] and simulation works [16,17,23] on assemblies of one-patch particles, there is no report about cluster assembly through emulsion droplet evaporation of colloidal particles with such anisotropic interparticle potentials. In this article, we study a binary mixture of one-patch colloidal particles and emulsion droplets. To characterize the anisotropic pair interactions between patches on two colloid surfaces, we employ a simple model proposed by Kern and Frenkel [24]. An advantage of the Kern–Frenkel potential is that the competing short-ranged repulsive and attractive interactions between patches can be tuned by simply changing the surface coverage. Similar to previous work [25], we use Monte Carlo simulations to simulate the dynamic pathways of cluster formation. We find the cluster structures to be in good agreement with the majority of experimental structures in the literature. This finding also indicates that strong short-ranged repulsive interactions between colloidal spheres result in the occurrence of particular cluster structures in addition to common -minimal clusters.
This article is organized as follows. In Section 2, we give the details of the pair interactions and simulation method. In Section 3, we compare the final cluster structures, histograms of cluster size distribution for different values of the surface coverages. Additionally, we analyze the dynamics of cluster formation and an orientational order parameter of the final clusters. Conclusions are given in Section 4.
2. Model and Methods
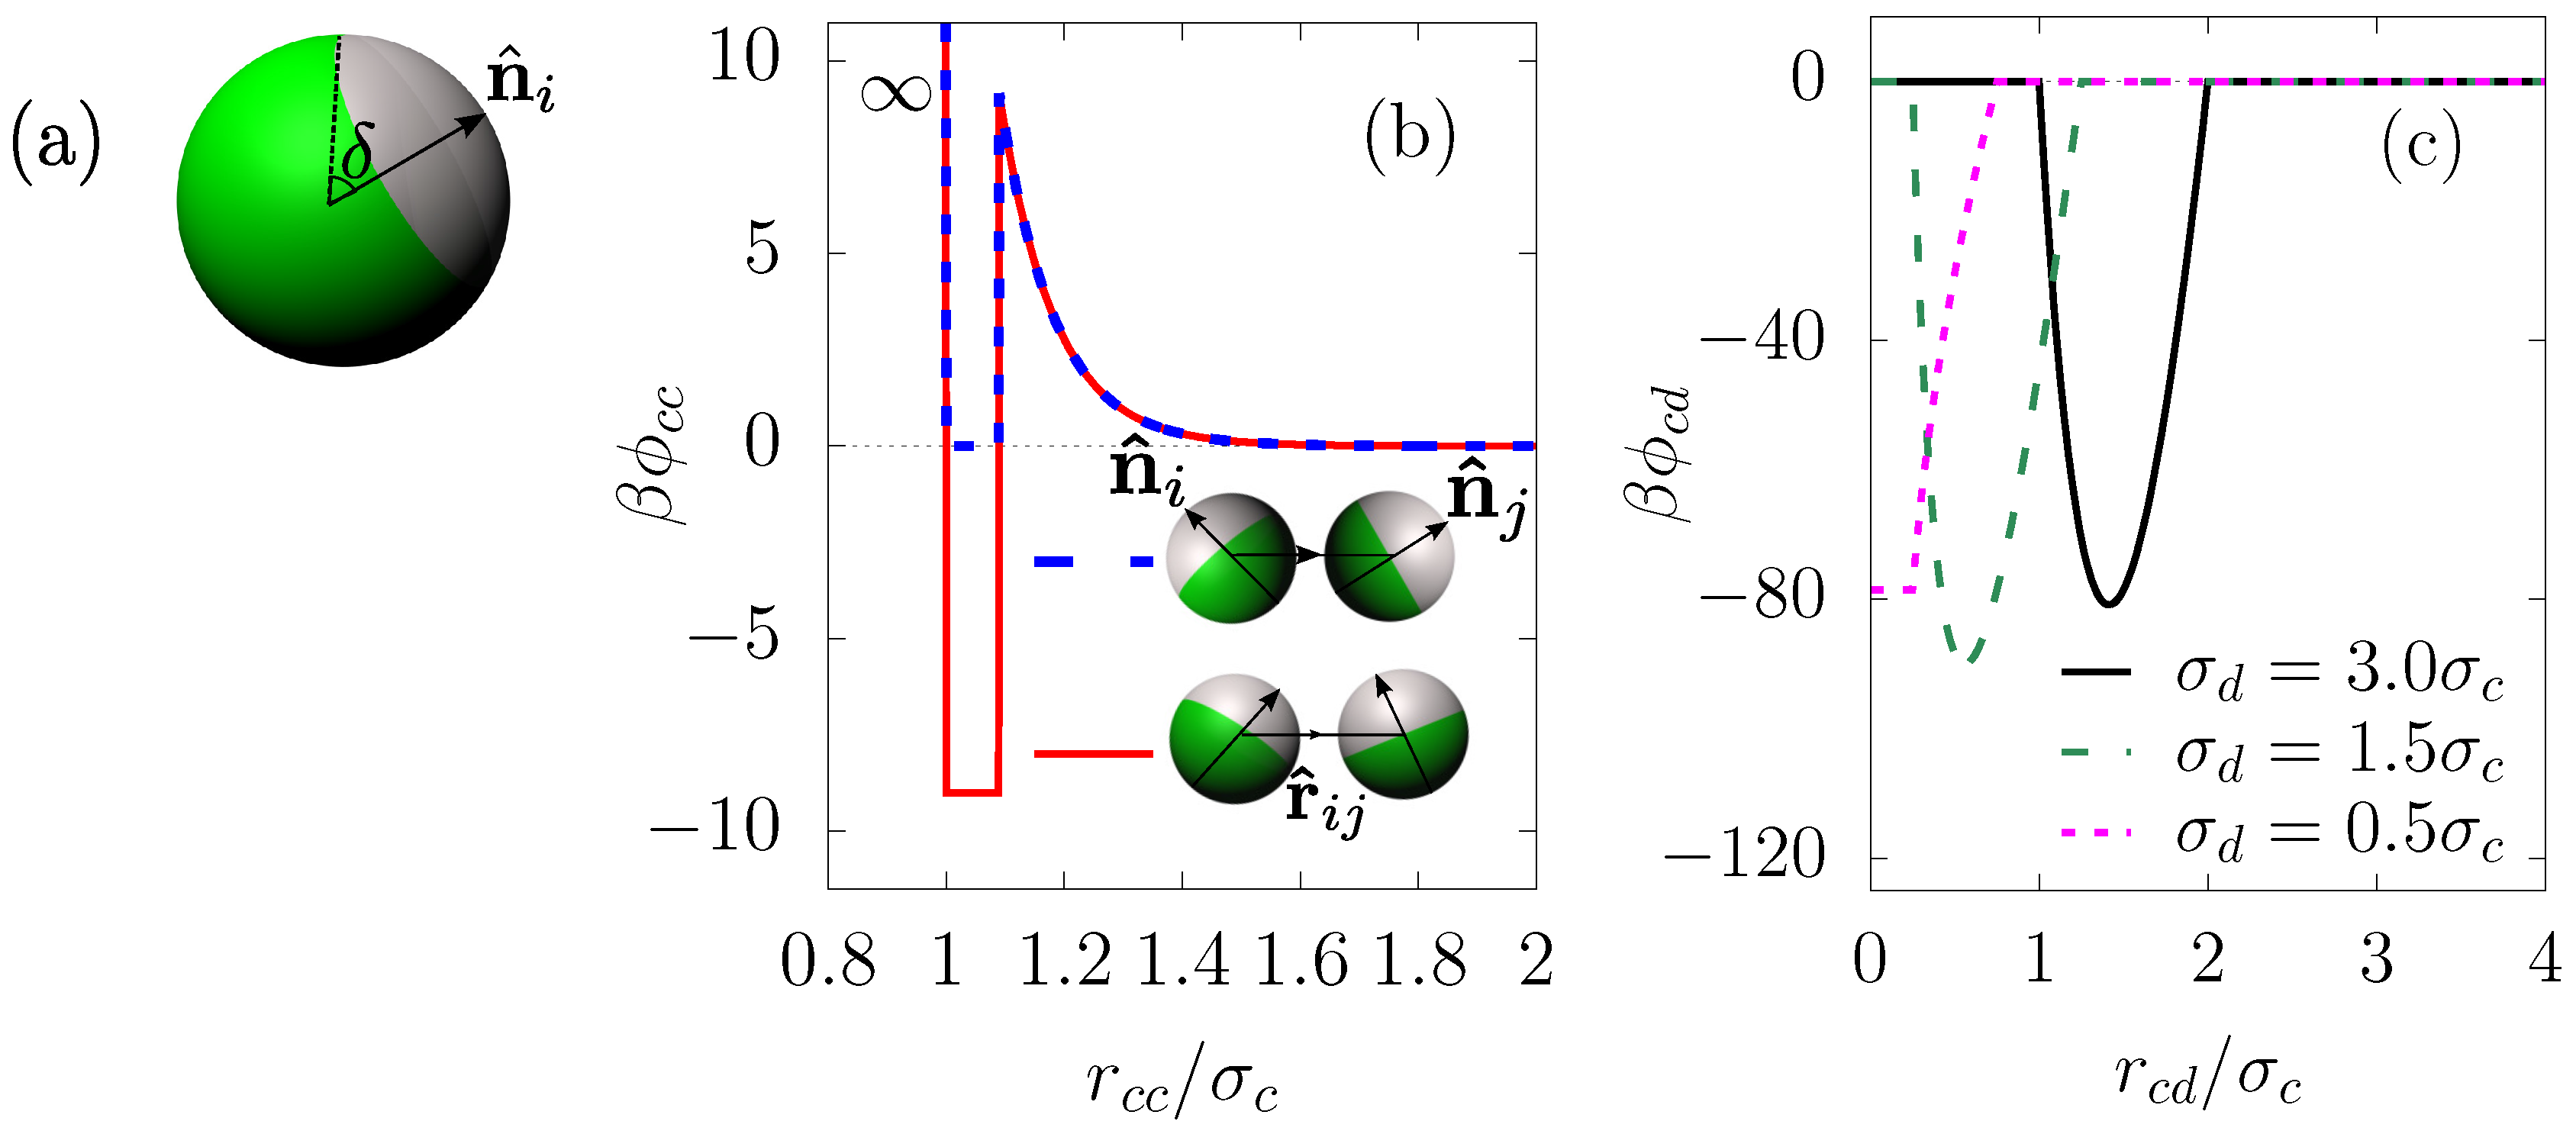
We study a binary mixture of one-patch colloids with hard-sphere diameter and spherical droplets of diameter . Each colloid possesses a central position and a unit vector locating the direction of patch on the ith particle surface. The size of the attractive patch is determined by a conical segment of (half) opening angle δ around the direction (Figure 1a). It is convenient to define the surface coverage χ as the relative ratio between the attractive surface area and total surface area. Therefore, χ is related to the half opening angle δ via
The patch–patch interaction between colloid i and j is described by a Kern–Frenkel (KF) potential, , defined as a product of a square-well (SW) potential with an angular modulation
where
and
where is an isotropic square-well potential of depth and width Δ. is a modulation function that depends on the relative orientation of the two particles, () is the unit vector pointing from the center of sphere i (j) to the center of the corresponding attractive patch and is the unit vector of distance between the centers of two spheres i and j.
By varying the surface coverage χ, one can control the angular range of the anisotropic interaction. The special case of () is known as the Janus limit with half–half geometry. In the extreme case , the pair potential reduces to a hard-core interaction, while, for it reduces to an isotropic square-well interaction.
The Yukawa repulsion describes the interaction between two charged colloidal particles screened by a electrolyte solution with inverse Debye length κ, i.e.,
where the parameter controls the strength of the long-ranged repulsion.
The colloid–colloid pair interaction, , is expressed in terms of the anisotropic, short-ranged attraction and the longer-ranged Yukawa repulsion , i.e.,
As illustrated in Figure 1b, the potential is plotted for a typical set of parameters (justified below). Here, two colloids interact via the square-well potential of depth or depending on the orientation of the patch unit vectors and ; and the distance between the two particles is within the range . Note that we choose a sufficiently large strength of the attractive interaction () to ensure that physical bonds between colloids once formed via droplet evaporation are permanent. The repulsive barrier is also set to be large enough in order to hinder spontaneous clustering, i.e., clustering that is not mediated by the droplets. In principle, one can choose a wide range of interacting parameters subject to the two above constraints without qualitatively affecting the final results.
The droplet–droplet interaction is aimed at modeling the repulsive interaction of charged droplets so that coalescence is negligible. Furthermore, in order to avoid the binding between any two droplets due to a shared Janus colloid, we assume that each droplet has an effective interaction diameter that is larger than the geometric droplet diameter . Hence, the droplet–droplet pair interaction is
Similarly to the previous model of Schwarz et al. [25], we assume that the colloid–solvent interfacial tension is equal to the colloid–droplet interfacial tension, so that the contact angle is 90°. This assumption is reasonable since a change in the contact angle seems to not have an influence on the final outcomes [4]. We neglect the influence of the adsorbed colloids on the droplet shape and hence assume that the droplets remain spherical. We also assume that the colloid–droplet interaction is isotropic. In reality, Janus particles will in general have differing wetting properties of their two types of surfaces. Therefore, one would expect preferential orientation of a colloid that is adsorbed on a droplet surface. Within our current model, we neglect this effect and restrict ourselves to colloids with identical wetting properties. More complex investigations [26,27] would be necessary to describe orientational effects.
The evaporation of the dispersed oil droplet implies that the droplet diameter is initially larger and eventually smaller than the colloid diameter. In order to mimic this situation, the colloid–droplet potential is given as follows:
If ,
and if ,
with γ the colloid–droplet interfacial tension and h the height of the spherical cap that results from the colloid–droplet intersection given by
Figure 1c shows the colloid–droplet pair potential as a function of the scaled distance for several different ratios of the droplet diameter and colloid diameter.
The total interaction energy U is written as the sum of colloid–colloid, droplet–droplet, and colloid–droplet pair interactions,
where and is the center-of-mass coordinate and the unit vector locating the attractive patch of colloid i and colloid j, respectively; is the center-of-mass coordinate of droplet i, is the Boltzmann constant, and T is the temperature.
The binary mixture of patchy colloids and droplets was simulated in the canonical ensemble using the kinetic Monte Carlo (MC) method. The total number of MC cycles per particle is with MC cycles used for droplet shrinkage and the remaining MC cycles used to equilibrate the simulation system. In each MC cycle, we attempt to move each particle once on average. A maximum trial displacement and maximum rotation step of the colloids are set to and , respectively. The droplets move with a maximum trial displacement and shrink at a constant rate such that their diameter vanishes completely after MC cycles. The choice of such small movement steps enables to approximate the Brownian dynamics [28]. The physical time can be expressed in terms of the total number of MC cycles per particle. From the Einstein relation and the Stokes–Einstein equation for diffusion of spherical particles, we roughly estimate the physical time of the evaporation process to be on the order of seconds. For details of the calculation, see reference [11]. Although this physical time is quite small compared to experimental timescales that typically last tens of minutes, we do not expect the MC timescale to affect the final outcomes [25]. In addition, within the kinetic MC simulation, we perform sequential moves of individual particles and neglect the collective motion of particles in the cluster, i.e., collective translational and rotational cluster moves are not carried out. Such collective modes of motion only play a role in dense colloidal systems with interpaticle attractive interactions that vary strongly with distance or angle [29,30].
All simulations are performed in a cubic box with periodic boundary conditions for the binary mixture of , , at a fixed colloid packing fraction , and droplet packing fraction . The initial droplet diameter is set to . We have studied one-patch colloids for different values of attractive patches, i.e., χ between 0 and 1, by varying the value of . For a given set of parameters, statistical data is collected by running 20 independent simulations.
We determine the existence of a bond between two colloids when their distance is smaller than and define a cluster as a network of colloids that are connected with each other by bonds. Each cluster (isomer) is therefore described by both the number of colloids and the number of bonds . To initialize the simulation, the colloids are distributed randomly outside droplets, i.e., and with random orientations. The minimum distance between the colloids is set larger than one bond length . In this way, no two colloids form a bond in the initial stage of the simulation.
3. Results and Discussion
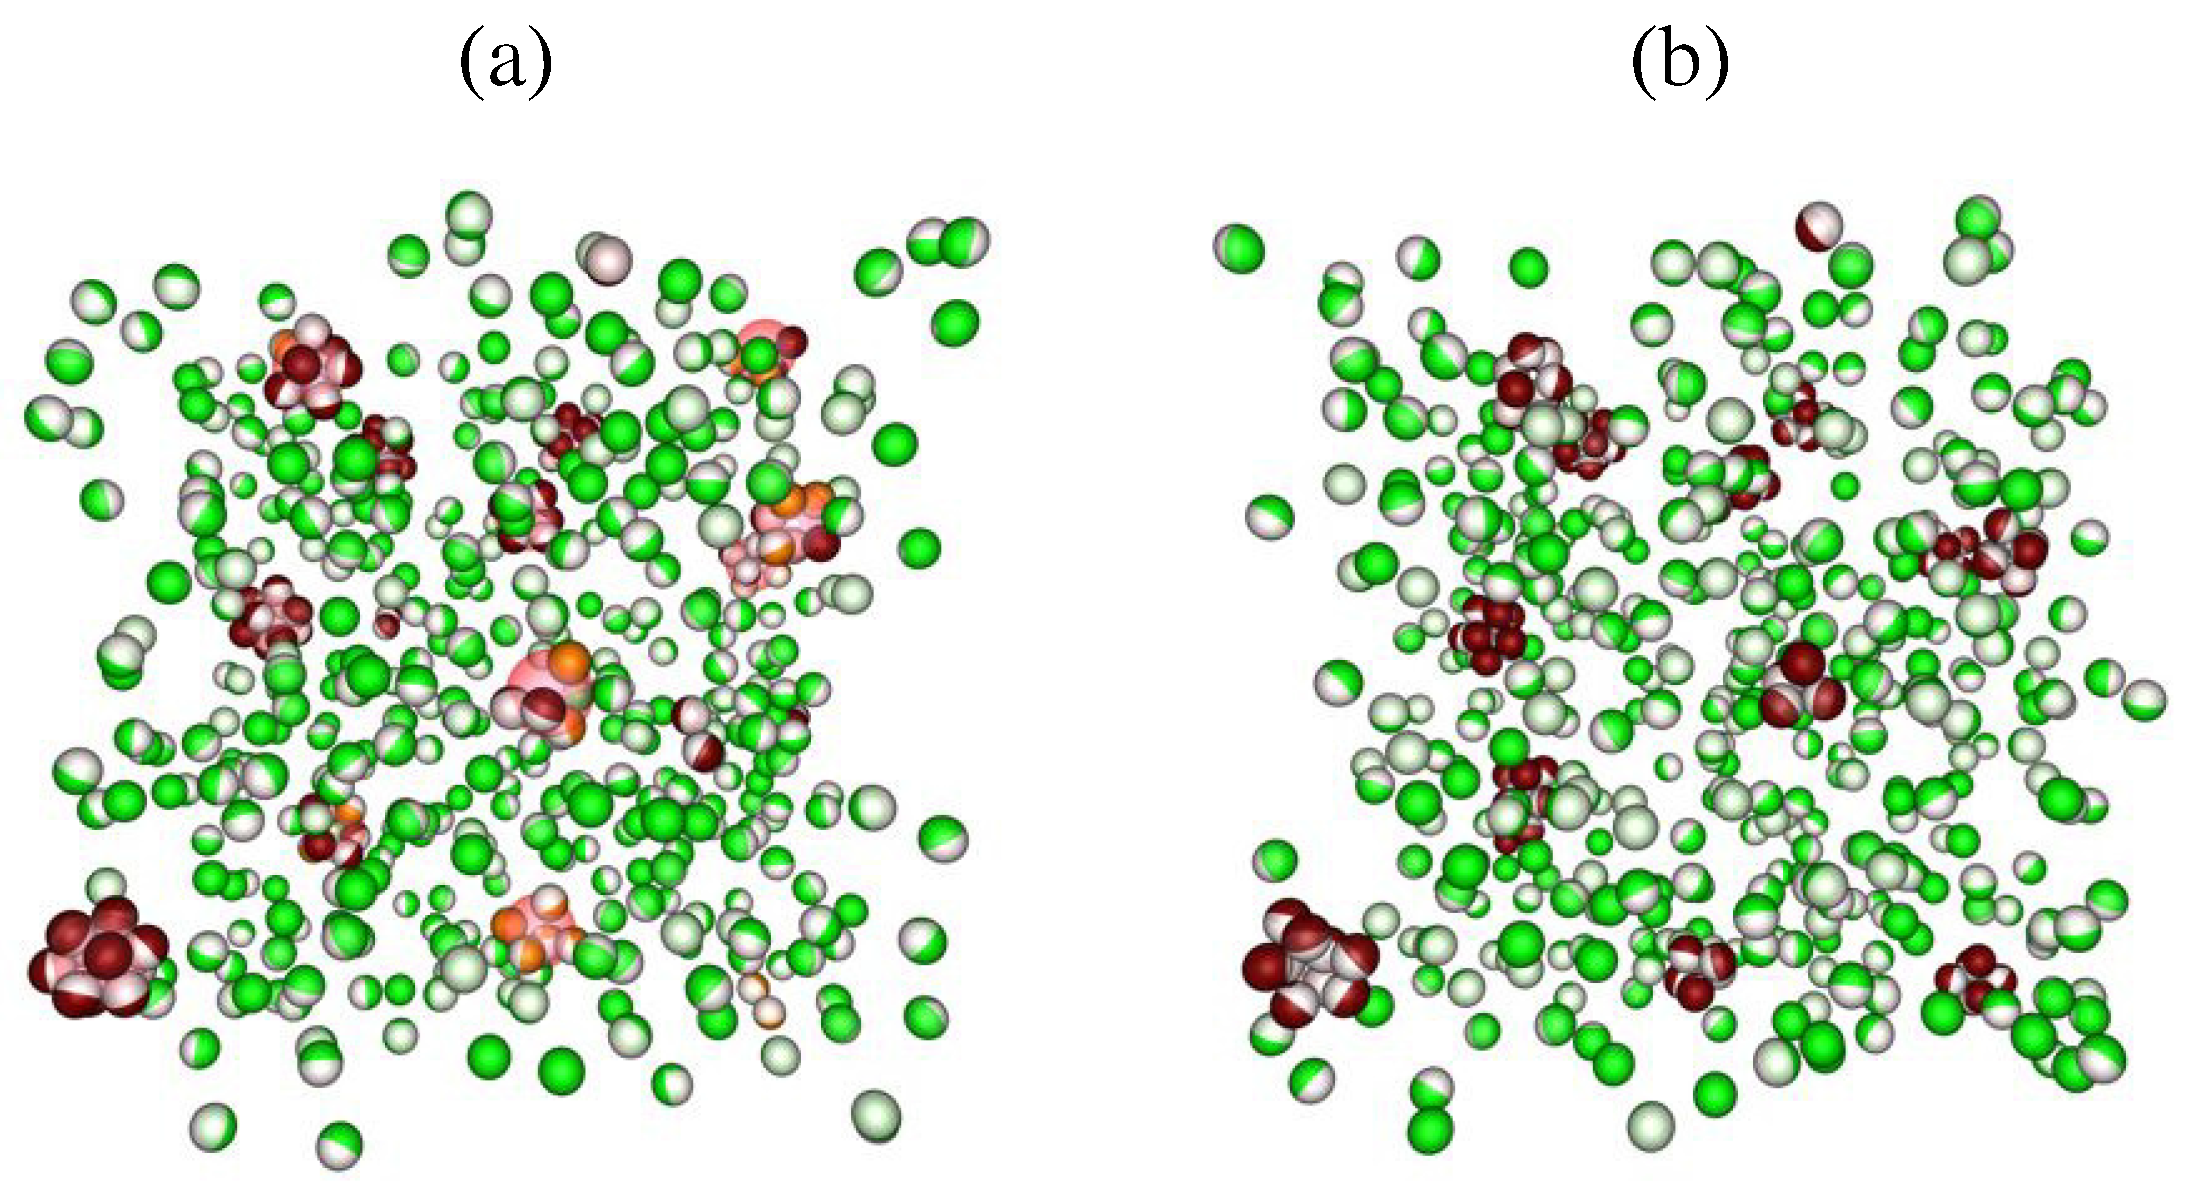
Figure 2 shows snapshots at two different stages of the time evolution for the colloid surface coverage . After MC cycles (Figure 2a), the droplets (pink spheres) capture several Janus colloids (green-white spheres) and pull them into clusters (red-white spheres). Figure 2b shows the final configuration after MC cycles. All droplet-induced clusters have well-defined structures and are stable against thermal fluctuations on the time scales considered.
Compared to the simulation results obtained at an isotropic, short-ranged, attractive colloid–colloid pair potential [25], our model for the one-patch colloids reproduces similar cluster structures at surface coverages . Here, we find stable clusters of unique configurations, including dumbbell (), triplet (), tetrahedron (), triangular dipyramid (), octahedron (), and pentagonal dipyramid (). For higher order clusters (), we find snub disphenoid (), triaugmented triangular prism (), gyroelongated square dipyramid (), icosahedron minus one () and icosahedron (). Clusters with –15 are also found but skipped for analysis because of their multiple structures. These structures ( to 12, except for ) belong to a set of convex polyhedra with equilateral triangular faces, known as convex deltahedra that minimize the second moment of the mass distribution [5], , where is the position of the particle i and is the position of the cluster center-of-mass. Notably, such structures satisfy the relation and are found to be identical to those of colloidal clusters observed through evaporation-driven assembly [3,31].
Figure 3 shows the cluster structures obtained at surface coverage . We find clusters containing 2 to 12 constituent spheres (dumbbells and triplets not shown). For , 7, and 10, clusters of same show two different structures corresponding to two different bond numbers , whereas for the clusters with the remaining colloid numbers , only one specific structure is observed. We consider in turn each of the -sphere clusters and adopt the convention that all clusters that do not minimize are referred to -nonminimal clusters.
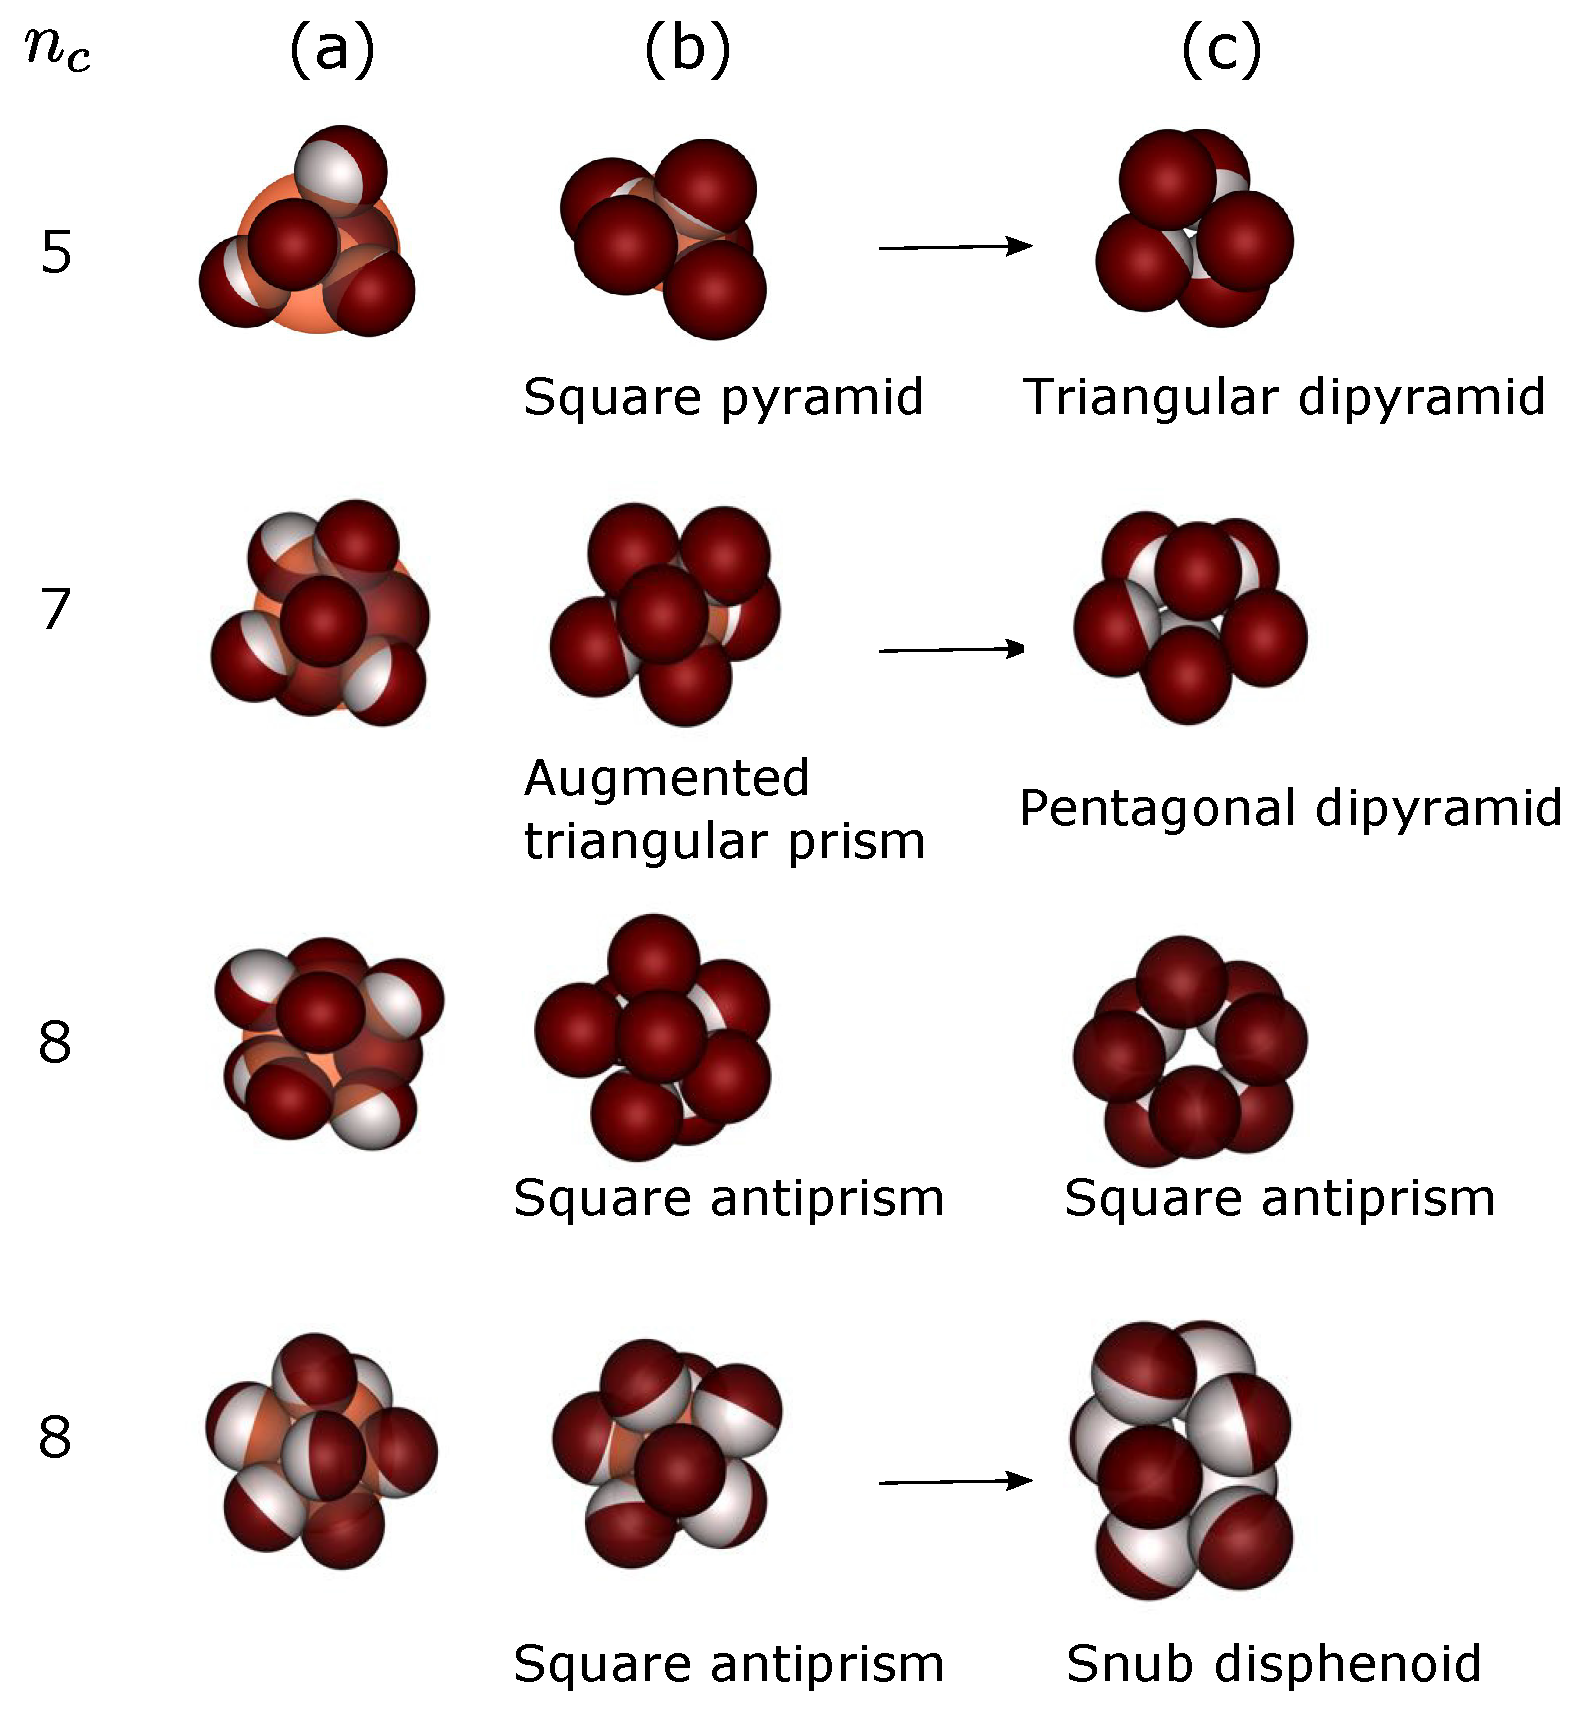
For clusters of five constituent spheres (), two different isomers are found, i.e., an uncommon isomer of the square pyramidal structure (eight bonds) and an -minimal isomer of the triangular dipyramid structure (nine bonds). In agreement with the results of Wittemann et al. [25,33], we find that the square pyramidal isomers possess a very small fraction of the total number of clusters compared to that of the triangular dipyramidal isomers. For , only octahedral clusters are found. For the seventh order clusters, we find pentagonal dipyramidal clusters (15 bonds) together with clusters of augmented triangular prim configuration (13 bonds), both of which are found with the same probability. Interestingly, clusters with the square pyramid and augmented triangular prism structure were also observed through evaporation-driven assembly, such as clusters of silica particles from aerosol droplets [34], clusters of polystyrene particles coated with silica particles [35], and clusters of crossliked polystyrene/divinylbenzene microspheres mixed with polystyrene polymers [36]. For 8-sphere clusters, single-patch colloids assemble into the square antiprism instead of the -minimal snub disphenoid. This result agrees well with that of the cluster sample obtained from aqueous aerosol droplets [34]. In addition, the square antiprism configuration was frequently found in experiments of Cho et al. [34,37,38] and other authors [33,36]. Cho and coworkers explained the square antiprism configuration, which matches the geometry of a Coulomb cluster for [7], as a result of the electrostatic repulsion between the particles in emulsion droplets. In our simulations, we find this configuration only when the attractive surface coverage χ is less than . In other words, choosing a sufficiently large, short-ranged, repulsive part of the Kern–Frenkel potential between the single-patchy colloids leads to the formation of this configuration. For , the colloids pack into a specific configuration that is identical to the triaugemented triangular prism except for some missing bonds. Two specific structures are found again for clusters of order ; one is a cluster of gyroelongated square dipyramid and the other a sphenocorona. Remarkably, while the former structure is the familiar -minimal cluster, the latter structure seems not to be a member of sphere packings generated by global minimal constraints [5,6,7,9] and have not yet been observed experimentally as well. In the case of the eleventh order clusters (), differently from a -minimal nonconvex structure in the experiments as discussed in the context, we find a convex augmented sphenocorona. To our knowledge, only one other study has detected the convex structure of the 11-sphere clusters [37]. Finally, for , all colloids assemble into clusters with icosahedral symmetry.
For the same number of constituent colloids , a common feature of the above -nonminimal clusters is their smaller bond number compared to that of the -minimal clusters. Each of the -nonminimal polyhedra in Figure 3 has at least one square face instead of all triangular faces as in the case of the -minimal polyhedra. For example, the square pyramid () contains one square face, the augmented triangular prism () and square antiprism () include two square faces. A second point to be made is that three configurations (tetrahedron, octahedron, and icosahedron) where all sphere positions are equivalent are found in the simulations, regardless of the value of χ. This result indicates that clusters with high symmetry appear to be insensitive to the interactions between particles.
We analyze the mechanism by which the clusters form using visual inspection. Figure 4 shows ‘time’-lapsed frames of the clusters for , 7 and 8. In column (a), the colloids are bound to the droplet surface and freely diffusing at its surface. After MC cycles, the colloids are arranged as -nonminimal packings (column (b)). Since then, two scenarios are possible for the clusters containing 5 and 7 colloids. In the first scenario the colloids are rearranged to form the final -minimal packings with the higher bond number; in the second scenario (not shown), the final packings of the colloids remain -nonminimal packings. However, for the 8-sphere cluster, only the second scenario appears. The colloids in this configuration show less motion in comparison with those of the cluster configurations with five and seven constituents. The weak attractive part between the colloids might prevent rearrangement in the 8-sphere cluster. This is evident in the last row of Figure 4, which shows the scenario of the 8-sphere cluster but for the surface coverage or, equivalently, a higher attractive part. We observe a structural transformation from the square antiprism to the snub disphenoid configuration, which is not observed in the case of . Therefore, all -minimal clusters may represent collapsed states of -nonmimimal clusters.
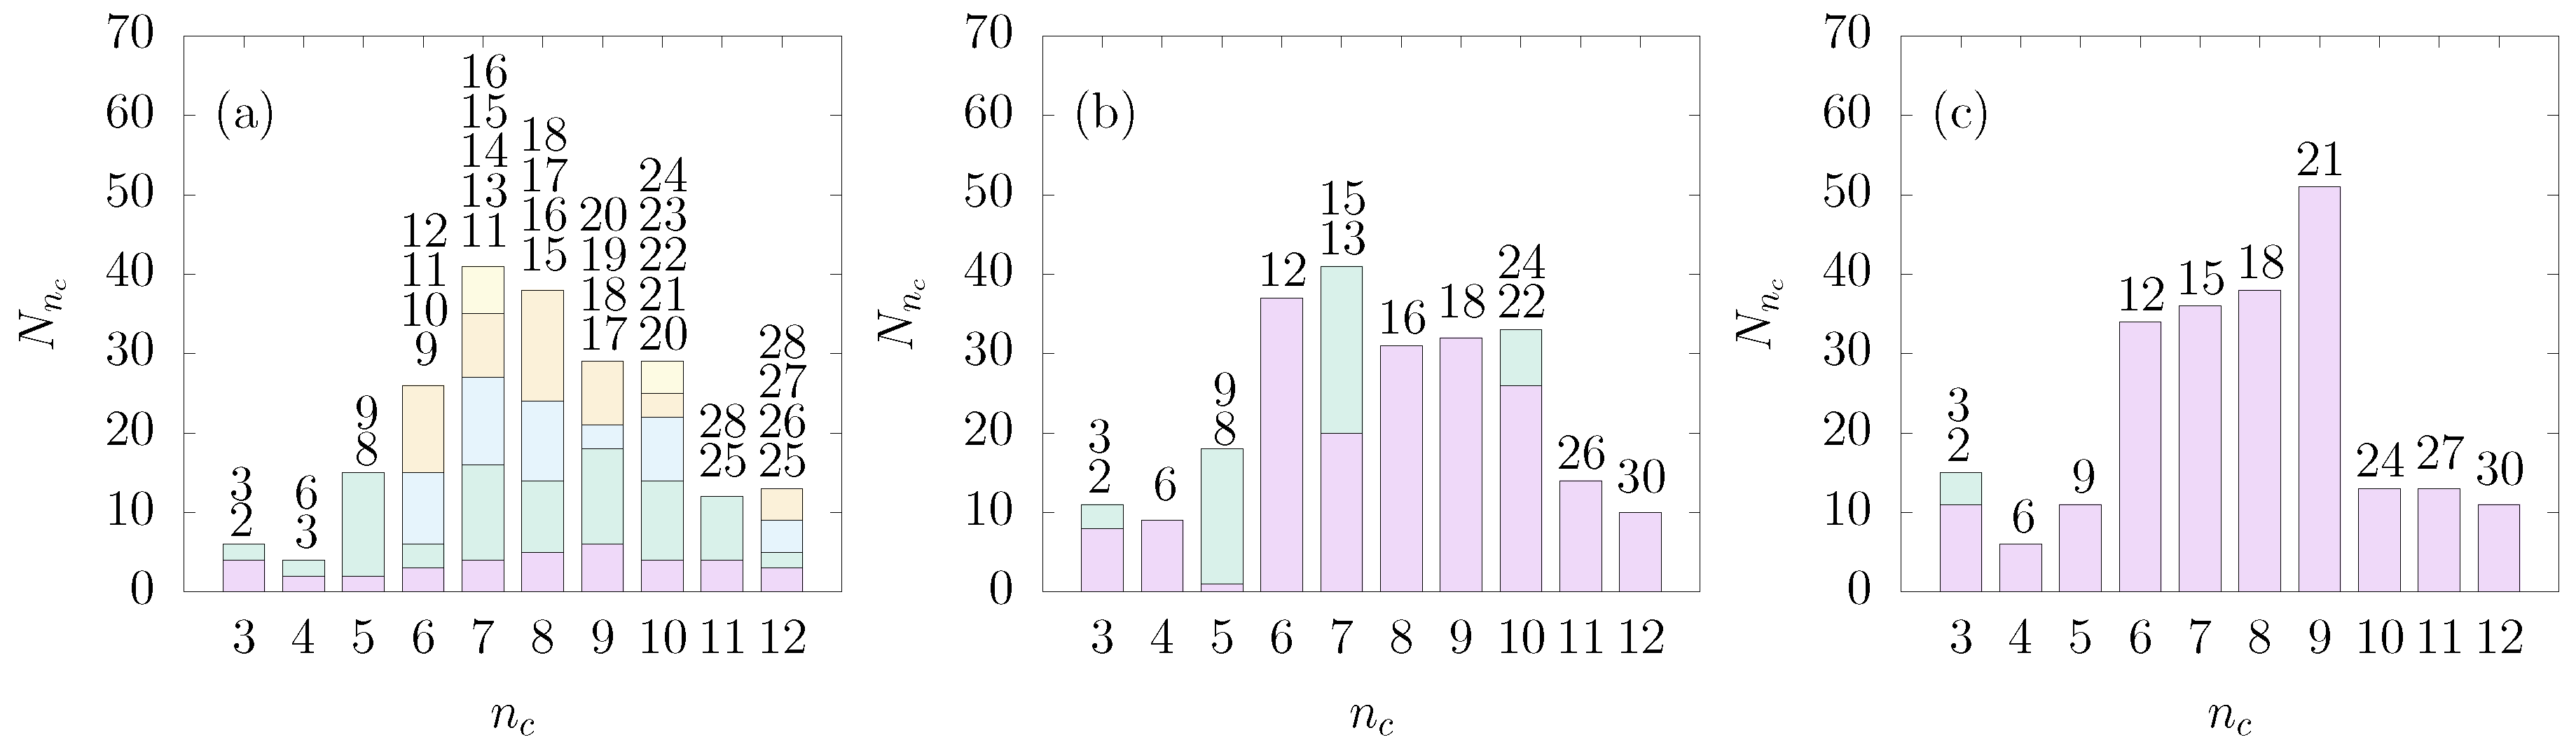
Figure 5 shows a stacked histogram of the number of clusters with constituent colloids at three different values of χ. The height of each differently colored bar is proportional to the number of clusters with the bond number . For a small value of χ (Figure 5a), a variety of different isomers with small bond numbers are observed. We interpret this as as a direct result of the difficult equilibration of cluster structures in the presence of a strong patch–patch repulsion. In addition, the distribution of the number of clusters shows a large fraction of the clusters with colloid numbers between six and ten. At a higher value of χ (), there is no significant change in the cluster size distribution. However, the number of distinct isomers decreases, as shown in Figure 5b. For the clusters with , 5, 7 and 10, two isomers are possible, while for the clusters with the remaining values of , only one isomer is present. When χ is larger than , e.g., , almost all clusters have only a single well-defined structure (see Figure 5c).
As the cluster configurations are in a stable state in the final stage of the simulations, the constituent colloids align in such a way that their attractive patches face each other in order to minimize the total potential energy. We employ an orientational order parameter that was used in a classification of self-assembled structures of patchy colloidal dumbbells [39], defined as
where the angular brackets denote an average over all clusters that are composed of constituent colloids, is the center of mass of colloid i, is the center of mass of the cluster and is the unit vector pointing in the direction of the attractive patch of colloid i (c.f. Section 2). For a perfectly spherical cluster, i.e., all directional vectors of colloids belonging to the cluster point towards the center of the cluster, we have . If clusters have , we consider them as spherical (marked with a red filled circle). Otherwise, if any cluster has , we consider it to be a non-spherical cluster (elongated cluster) and mark it with a blue filled square. Finally, clusters of are considered as having randomly oriented patches (depicted by a black asterisk).
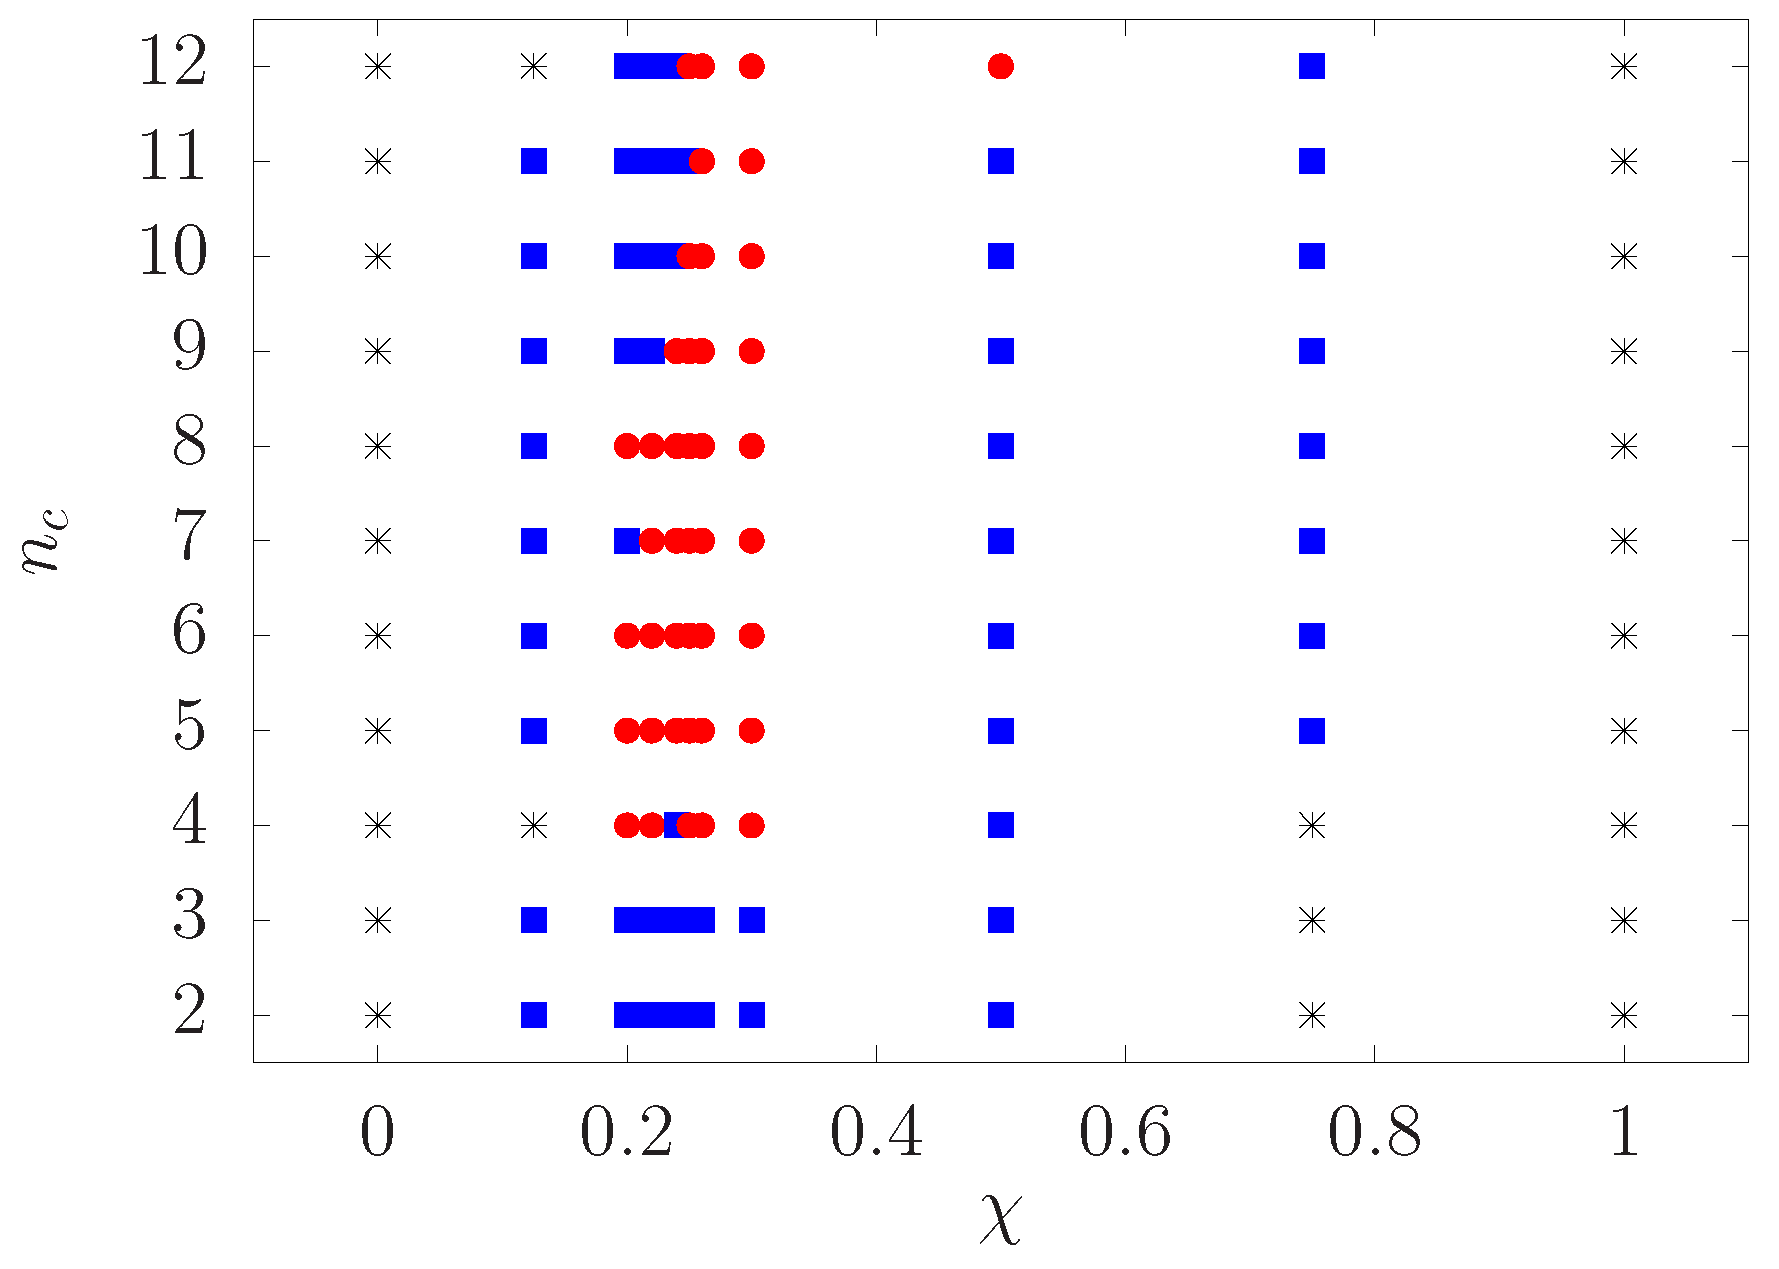
Using the orientational order parameter of the clusters, we map out the state diagram in the surface coverage χ-cluster size representation, as shown in Figure 6. We find a narrow region of χ in the range 0.20–0.30 in which spherical clusters are favored, and a broader region of non-spherical clusters when χ is outside of this range. The clusters of randomly oriented patches are found when χ is larger than or smaller than 0.2. Of the cluster states observed, the spherical and non-spherical clusters regarded as micelles are interesting. Additionally, the relatively small range of χ (0.20–0.30) generating spherical clusters are also in accordance with the values of χ that exhibit two isomeric structures, as discussed above. Comparison of for these two isomers with the same (see Table 1) shows that of -nonminimal isomers is slightly larger than that of -minimal isomers (), demonstrating that the former structure has a more spherical shape.
4. Conclusions
We have investigated the hierarchical assembly of patchy colloids via emulsion droplet evaporation by means of Metropolis-based kinetic Monte Carlo simulations. We employed the one-patch Kern–Frenkel potential as a generic model for the anisotropic, short-ranged interaction between colloids. The advantage of the Kern–Frenkel potential is that it interpolates smoothly between the isotropic square-well and hard-core potential upon decreasing the attractive coverage χ or, equivalently, the bonding angle.
We found that for the cases when , our model reproduces -minimal cluster structures that have been widely observed in both experiments and simulations based on evaporation-induced assembly of colloidal particles. At values of χ below , several additional isomeric structures are produced, including the square dipyramid (), augmented triangular prism (), and square antiprism (). Surprisingly, these structures, which are not members of the -minimal packings, were also frequently found in experiments. For higher order clusters, we obtain new cluster configurations with the sphenocorona () and augmented sphenocorona () shape. In particular, we found that, in all cases in which -minimal clusters have formed, they must proceed through the packing process of -nonminimal clusters. In other words, the -minimal clusters represent collapsed states of -nonminimal clusters. A further decrease of χ below produces more isomers with smaller bond-numbers as a direct result of the increasingly difficult equilibration of cluster structures. We note that although the patchy interaction in our model differs from a dipole–dipole interaction between colloidal particles trapped at the droplet surface, our model reproduces most known experimental structures [40]. Therefore, the strongly anisotropic interaction may be a reason for the formation of -nonminimal cluster structures.
An orientational order parameter was used to classify the clusters obtained. We found that spherical clusters are only observed in a narrow region of χ (0.2–0.3). In addition, for the same number of constituent colloids, the order parameter of -nonminimal clusters is higher than that of -minimal clusters. It is therefore plausible to suppose that maximization of the order parameter appears to favor structures that are more spherical.
Acknowledgments
Hai Pham Van acknowledges support from the Vietnamese Government Scholarship Program (Project 911). This publication was funded by the German Research Foundation (DFG) and the University of Bayreuth in the funding programme Open Access Publishing.
Author Contributions
H.P.V. performed the computer simulations, analyzed data and wrote the paper; A.F. conceived and contributed analysis tools. M.S. supervised the project and co-wrote the paper. All authors discussed the results and implications and commented on the manuscript at all stages.
Conflicts of Interest
The authors declare no conflict of interest.
References
- Van Blaaderen, A. CHEMISTRY: Colloidal Molecules and Beyond. Science 2003, 301, 470–471. [Google Scholar] [CrossRef] [PubMed]
- Duguet, E.; Desert, A.; Perro, A.; Ravaine, S. Design and elaboration of colloidal molecules: An overview. Chem. Soc. Rev. 2011, 40, 941–960. [Google Scholar] [CrossRef] [PubMed]
- Manoharan, V.N.; Elsesser, M.T.; Pine, D.J. Dense Packing and Symmetry in Small Clusters of Microspheres. Science 2003, 301, 483–487. [Google Scholar] [CrossRef] [PubMed]
- Lauga, E.; Brenner, M.P. Evaporation-Driven Assembly of Colloidal Particles. Phys. Rev. Lett. 2004, 93. [Google Scholar] [CrossRef] [PubMed]
- Sloane, N.J.A.; Hardin, R.H.; Duff, T.D.S.; Conway, J.H. Minimal-energy clusters of hard spheres. Discrete Comput. Geom. 1995, 14, 237–259. [Google Scholar] [CrossRef]
- Hoare, M.; Pal, P. Physical cluster mechanics: Statics and energy surfaces for monatomic systems. Adv. Phys. 1971, 20, 161–196. [Google Scholar] [CrossRef]
- Livshits, A.; Lozovik, Y. Coulomb clusters on a sphere: Topological classification. Chem. Phys. Lett. 1999, 314, 577–583. [Google Scholar] [CrossRef]
- Sloane, N.J.A. Tables of sphere packings and spherical codes. IEEE Trans. Inf. Theory 1981, 27, 327–338. [Google Scholar] [CrossRef]
- Arkus, N.; Manoharan, V.N.; Brenner, M.P. Minimal Energy Clusters of Hard Spheres with Short Range Attractions. Phys. Rev. Lett. 2009, 103. [Google Scholar] [CrossRef] [PubMed]
- Peng, B.; Smallenburg, F.; Imhof, A.; Dijkstra, M.; van Blaaderen, A. Colloidal Clusters by Using Emulsions and Dumbbell-Shaped Particles: Experiments and Simulations. Angew. Chem. Int. Ed. 2013, 52, 6709–6712. [Google Scholar] [CrossRef] [PubMed]
- Pham Van, H.; Fortini, A.; Schmidt, M. Assembly of open clusters of colloidal dumbbells via droplet evaporation. Phys. Rev. E 2016, 93. [Google Scholar] [CrossRef] [PubMed]
- Glotzer, S.C.; Solomon, M.J. Anisotropy of building blocks and their assembly into complex structures. Nat. Mater. 2007, 6, 557–562. [Google Scholar] [PubMed]
- Hong, L.; Cacciuto, A.; Luijten, E.; Granick, S. Clusters of Charged Janus Spheres. Nano Lett. 2006, 6, 2510–2514. [Google Scholar]
- Hong, L.; Cacciuto, A.; Luijten, E.; Granick, S. Clusters of Amphiphilic Colloidal Spheres. Langmuir 2008, 24, 621–625. [Google Scholar] [CrossRef] [PubMed]
- Chen, Q.; Whitmer, J.K.; Jiang, S.; Bae, S.C.; Luijten, E.; Granick, S. Supracolloidal Reaction Kinetics of Janus Spheres. Science 2011, 331, 199–202. [Google Scholar] [CrossRef] [PubMed]
- Sciortino, F.; Giacometti, A.; Pastore, G. Phase Diagram of Janus Particles. Phys. Rev. Lett. 2009, 103. [Google Scholar] [CrossRef] [PubMed]
- Sciortino, F.; Giacometti, A.; Pastore, G. A numerical study of one-patch colloidal particles: From square-well to Janus. Phys. Chem. Chem. Phys. 2010, 12, 11869–11877. [Google Scholar] [CrossRef] [PubMed]
- Du, J.; O’Reilly, R.K. Anisotropic particles with patchy, multicompartment and Janus architectures: Preparation and application. Chem. Soc. Rev. 2011, 40, 2402–2416. [Google Scholar] [CrossRef] [PubMed]
- Walther, A.; Müller, A.H.E. Janus Particles: Synthesis, Self-Assembly, Physical Properties, and Applications. Chem. Rev. 2013, 113, 5194–5261. [Google Scholar] [CrossRef] [PubMed]
- Hu, J.; Zhou, S.; Sun, Y.; Fang, X.; Wu, L. Fabrication, properties and applications of Janus particles. Chem. Soc. Rev. 2012, 41, 4356–4378. [Google Scholar] [CrossRef] [PubMed]
- Fantoni, R.; Giacometti, A.; Sciortino, F.; Pastore, G. Cluster theory of Janus particles. Soft Matter 2011, 7, 2419–2427. [Google Scholar] [CrossRef]
- Fantoni, R. A cluster theory for a Janus fluid. Eur. Phys. J. B 2012, 85, 1–12. [Google Scholar] [CrossRef]
- Rosenthal, G.; Gubbins, K.E.; Klapp, S.H.L. Self-assembly of model amphiphilic Janus particles. J. Chem. Phys. 2012, 136. [Google Scholar] [CrossRef] [PubMed]
- Kern, N.; Frenkel, D. Fluid–fluid coexistence in colloidal systems with short-ranged strongly directional attraction. J. Chem. Phys. 2003, 118, 9882–9889. [Google Scholar] [CrossRef]
- Schwarz, I.; Fortini, A.; Wagner, C.S.; Wittemann, A.; Schmidt, M. Monte Carlo computer simulations and electron microscopy of colloidal cluster formation via emulsion droplet evaporation. J. Chem. Phys. 2011, 135. [Google Scholar] [CrossRef] [PubMed]
- Binks, B.P.; Lumsdon, S.O. Influence of particle wettability on the type and stability of surfactant-free emulsions. Langmuir 2000, 16, 8622–8631. [Google Scholar] [CrossRef]
- Binks, B.P.; Fletcher, P.D.I. Particles adsorbed at the oil-water interface: A theoretical comparison between spheres of uniform wettability and Janus particles. Langmuir 2001, 17, 4708–4710. [Google Scholar] [CrossRef]
- Sanz, E.; Marenduzzo, D. Dynamic Monte Carlo versus Brownian dynamics: A comparison for self-diffusion and crystallization in colloidal fluids. J. Chem. Phys. 2010, 132. [Google Scholar] [CrossRef] [PubMed]
- Whitelam, S.; Feng, E.H.; Hagan, M.F.; Geissler, P.L. The role of collective motion in examples of coarsening and self-assembly. Soft Matter 2009, 5, 1251–1262. [Google Scholar] [CrossRef] [PubMed]
- Whitelam, S. Approximating the dynamical evolution of systems of strongly interacting overdamped particles. Mol. Simul. 2011, 37, 606–612. [Google Scholar] [CrossRef]
- Wagner, C.S.; Lu, Y.; Wittemann, A. Preparation of Submicrometer-Sized Clusters from Polymer Spheres Using Ultrasonication. Langmuir 2008, 24, 12126–12128. [Google Scholar] [CrossRef] [PubMed]
- Sandia Laboratories. Netlib Polyhedron Database. 2008. Available online: http://netlib.sandia.gov/polyhedra/ (accessed on 29 March 2017).
- Wagner, C.; Fischer, B.; May, M.; Wittemann, A. Templated assembly of polymer particles into mesoscopic clusters with well-defined configurations. Colloid Polym. Sci. 2010, 288, 487–498. [Google Scholar] [CrossRef]
- Cho, Y.S.; Yi, G.R.; Chung, Y.S.; Park, S.B.; Yang, S.M. Complex Colloidal Microclusters from Aerosol Droplets. Langmuir 2007, 23, 12079–12085. [Google Scholar] [CrossRef] [PubMed]
- Cho, Y.S.; Kim, T.Y.; Yi, G.R.; Kim, Y.K.; Choi, C.J. Fabrication of Colloidal Clusters of Polymer Microspheres and Nonspherical Hollow Micro-particles from Pickering Emulsions. Bull. Korean Chem. Soc. 2012, 33, 159–166. [Google Scholar] [CrossRef]
- Lin, K.H.; Lai, L.J.; Chang, C.C.; Chen, H. Assembly of microspheres with polymers by evaporating emulsion droplets. Phys. Rev. E 2008, 78. [Google Scholar] [CrossRef] [PubMed]
- Cho, Y.S.; Yi, G.R.; Kim, S.H.; Pine, D.J.; Yang, S.M. Colloidal Clusters of Microspheres from Water-in-Oil Emulsions. Chem. Mater. 2005, 17, 5006–5013. [Google Scholar] [CrossRef]
- Cho, Y.S.; Yi, G.R.; Lim, J.M.; Kim, S.H.; Manoharan, V.N.; Pine, D.J.; Yang, S.M. Self-Organization of Bidisperse Colloids in Water Droplets. J. Am. Chem. Soc. 2005, 127, 15968–15975. [Google Scholar] [CrossRef] [PubMed]
- Whitelam, S.; Bon, S.A.F. Self-assembly of amphiphilic peanut-shaped nanoparticles. J. Chem. Phys. 2010, 132. [Google Scholar] [CrossRef] [PubMed]
- Manoharan, V.N. Colloidal spheres confined by liquid droplets: Geometry, physics, and physical chemistry. Solid State Commun. 2006, 139, 557–561. [Google Scholar] [CrossRef]
Figure 1.
Pair potentials for the binary mixture of patchy colloids and droplets. (a) illustration of a single patchy colloid i with orientation and opening angle δ of the attractive patch (white); (b) potentials between two colloids with , , , . Shown in the legend is the Janus case . When the attractive parts of two particles properly face each other, they interact via the square-well potential of depth (red solid line), and otherwise they interact via the square-well potential of depth (blue dashed line); (c) colloid–droplet potential at , and .

Figure 2.
Simulation snapshots of the mixture for Janus colloids () and droplets. Results are shown at two different stages of the time evolution: (a) after MC cycles and (b) after MC cycles. Droplets are depicted as pink spheres. Each Janus colloid has two hemispheres where the white hemisphere corresponds to the attractive patch, and the green one is the repulsive patch. When colloidal particles are trapped at the droplet surface or in droplet-induced clusters, the repulsive part of Janus colloids are shown in red.

Figure 3.
Typical cluster structures obtained in simulations (middle columns) at surface coverage . The white colloid patch is attractive and the red one is repulsive. The wire frame connecting the colloid centers illustrates the bond skeleton. Shown in the left columns are the number of constituent colloids and the number of bonds of the corresponding clusters. Right columns illustrate the polyhedra formed by drawing lines from the center of the colloidal sphere to its neighbors. Below are the names of the polyhedra from [32].

Figure 4.
Simulation snapshots of -sphere clusters of the packing process. The column (a) shows a droplet (shown in pink large sphere) and single-patch colloids trapped at its surface after MC cycles. After MC cycles (column (b)), the droplet has shrunk and the colloids have packed into a well-defined structure. In the final stage of the simulations (column (c)), some clusters are rearranged to form -minimal clusters. The arrows refer to the structures that are rearranged during evaporation. The first rows are the results in the case of , and the last row is for .

Figure 5.
Distribution of the number of clusters with colloids at three different coverages: (a) ; (b) ; and (c) . Each differently colored bar is labeled, from top to bottom, with the bond number .
Figure 5.
Distribution of the number of clusters with colloids at three different coverages: (a) ; (b) ; and (c) . Each differently colored bar is labeled, from top to bottom, with the bond number .

Figure 6.
State diagram of the colloidal clusters in the surface coverage-cluster size plane. The symbols indicate the following states of the clusters based on the orientational order parameter: ![Materials 10 00361 i001]() , spherical cluster;
, spherical cluster; ![Materials 10 00361 i002]() , non-spherical cluster; *, clusters with randomly oriented patches.
, non-spherical cluster; *, clusters with randomly oriented patches.
 , spherical cluster;
  , non-spherical cluster; *, clusters with randomly oriented patches.
Figure 6.
State diagram of the colloidal clusters in the surface coverage-cluster size plane. The symbols indicate the following states of the clusters based on the orientational order parameter: ![Materials 10 00361 i001]() , spherical cluster;
, spherical cluster; ![Materials 10 00361 i002]() , non-spherical cluster; *, clusters with randomly oriented patches.
, non-spherical cluster; *, clusters with randomly oriented patches.
, spherical cluster; , non-spherical cluster; *, clusters with randomly oriented patches.

Table 1.
Orientational order parameter for clusters composed of colloids and bonds for .
| 5 | 5 | 7 | 7 | 10 | 10 | |
| 8 | 9 | 13 | 16 | 22 | 24 | |
© 2017 by the authors. Licensee MDPI, Basel, Switzerland. This article is an open access article distributed under the terms and conditions of the Creative Commons Attribution (CC BY) license (http://creativecommons.org/licenses/by/4.0/).
Share and Cite
MDPI and ACS Style
Van, H.P.; Fortini, A.; Schmidt, M. Assembly of One-Patch Colloids into Clusters via Emulsion Droplet Evaporation. Materials 2017, 10, 361. https://doi.org/10.3390/ma10040361
AMA Style
Van HP, Fortini A, Schmidt M. Assembly of One-Patch Colloids into Clusters via Emulsion Droplet Evaporation. Materials. 2017; 10(4):361. https://doi.org/10.3390/ma10040361
Chicago/Turabian StyleVan, Hai Pham, Andrea Fortini, and Matthias Schmidt. 2017. "Assembly of One-Patch Colloids into Clusters via Emulsion Droplet Evaporation" Materials 10, no. 4: 361. https://doi.org/10.3390/ma10040361
Note that from the first issue of 2016, this journal uses article numbers instead of page numbers. See further details here.