
Simulation of the Continuous Casting and Cooling Behavior of Metallic Glasses

1
Graduate School of Saitama Institute of Technology, Fusaiji 1690, Fukaya 369-0293, Japan
2
High-Tech Research Center, Saitama Institute of Technology, Fusaiji 1690, Fukaya 369-0293, Japan
3
University of Science and Technology Liaoning, Anshan 114051, China
*
Author to whom correspondence should be addressed.
Materials 2017, 10(4), 420; https://doi.org/10.3390/ma10040420
Submission received: 21 February 2017
/
Revised: 1 April 2017
/
Accepted: 6 April 2017
/
Published: 17 April 2017
Abstract
:The development of melt spinning technique for preparation of metallic glasses was summarized. The limitations as well as restrictions of the melt spinning embodiments were also analyzed. As an improvement and variation of the melt spinning method, the vertical-type twin-roll casting (VTRC) process was discussed. As the thermal history experienced by the casting metals to a great extent determines the qualities of final products, cooling rate in the quenching process is believed to have a significant effect on glass formation. In order to estimate the ability to produce metallic glasses by VTRC method, temperature and flow phenomena of the melt in molten pool were computed, and cooling rates under different casting conditions were calculated with the simulation results. Considering the fluid character during casting process, the material derivative method based on continuum theory was adopted in the cooling rate calculation. Results show that the VTRC process has a good ability in continuous casting metallic glassy ribbons.
1. Introduction
Amorphous metallic alloys exhibit outstanding mechanical, magnetic, and chemical properties that are unusual for solid metals. More than half a century has passed since Pol Duwez reported his remarkable findings in 1960 [1], and the subject area has moved a long way. Once the potential of metallic glasses for any certain application was recognized, it was seen that a scaling-up method was needed to deploy metallic glasses commercially [2]. To produce metallic glasses continuously, in the early 1970s, researchers at Allied Chemical Corporation developed continuous casting or melt spinning processes for commercial manufacture of metallic glass ribbons and sheets, and at that time the field of melt spinning technique in producing metallic glasses started gaining momentum [3,4,5,6,7]. Relations between processing parameters and ribbon quality and dimensions have been discussed by some researchers in recent years [8,9,10,11]; however, only a small fraction of the metallic glasses have so far been commercially deployed mainly due to the difficulty in obtaining good quality in such thin products. For applications in transformer cores, metallic glasses such as Metglas® Alloy 2605SA1 can reduce transformation losses by 70% compared to crystalline iron cores [2,12].
In the melt spinning process, conditions between the roll-contact surface and free surface of ribbon are different, and these will affect the final ribbon quality [9,13]. In contrast, metallic ribbons produced by twin-roll casting technique are casted and hot rolled at the same time and a better surface quality is expected. The concept of continuous casting in a single stage dates back to Bessemer, in 1846, who envisioned using a twin-roll technique to cast steel strips [14], but technical realization was more than a century later. In 1970, after Duwez’s seminal discoveries, a twin-roll casting (TRC) technique for preparing uniform films of metastable phases was devised by Chen and Miller [15]. To date, this technique in producing metallic glass ribbons is still almost limited to laboratory scale studies [16,17,18,19,20,21,22]. It turns out that TRC is an available process for producing amorphous alloy sheets with a wide range of cooling rates. Nevertheless, most of the studies so far have been based on horizontal type twin-roll casters. Studies on TRC technique for producing metallic glasses are listed in Table 1.
Because the influence of gravity, it shows that the casting speed of vertical type twin-roll casting (VTRC) is higher than horizontal-type twin-roll casting (HTRC), and the heat transmission of the former is more effective [24,25,26]. In the present study, based on the VTRC process, thermal history experienced by metallic materials during casting process was computed, and the cooling rate was also calculated. In order to make a judgment on the process cooling ability in producing metallic glasses, a continuous cooling transformation (CCT) diagram was proposed. The influences of casting parameters on glass forming were discussed. As Al-rich metallic glasses are interesting lightweight alloys with a high specific strength (compressive fracture strength exceeded 1000 MPa) which make them a potential material for aerospace applications [27,28], material property parameters of high aluminum alloys (Al contents as high as 35–40 at %, e.g., Al35La50Ni15) are adopted in this paper.
2. TRC Simulation
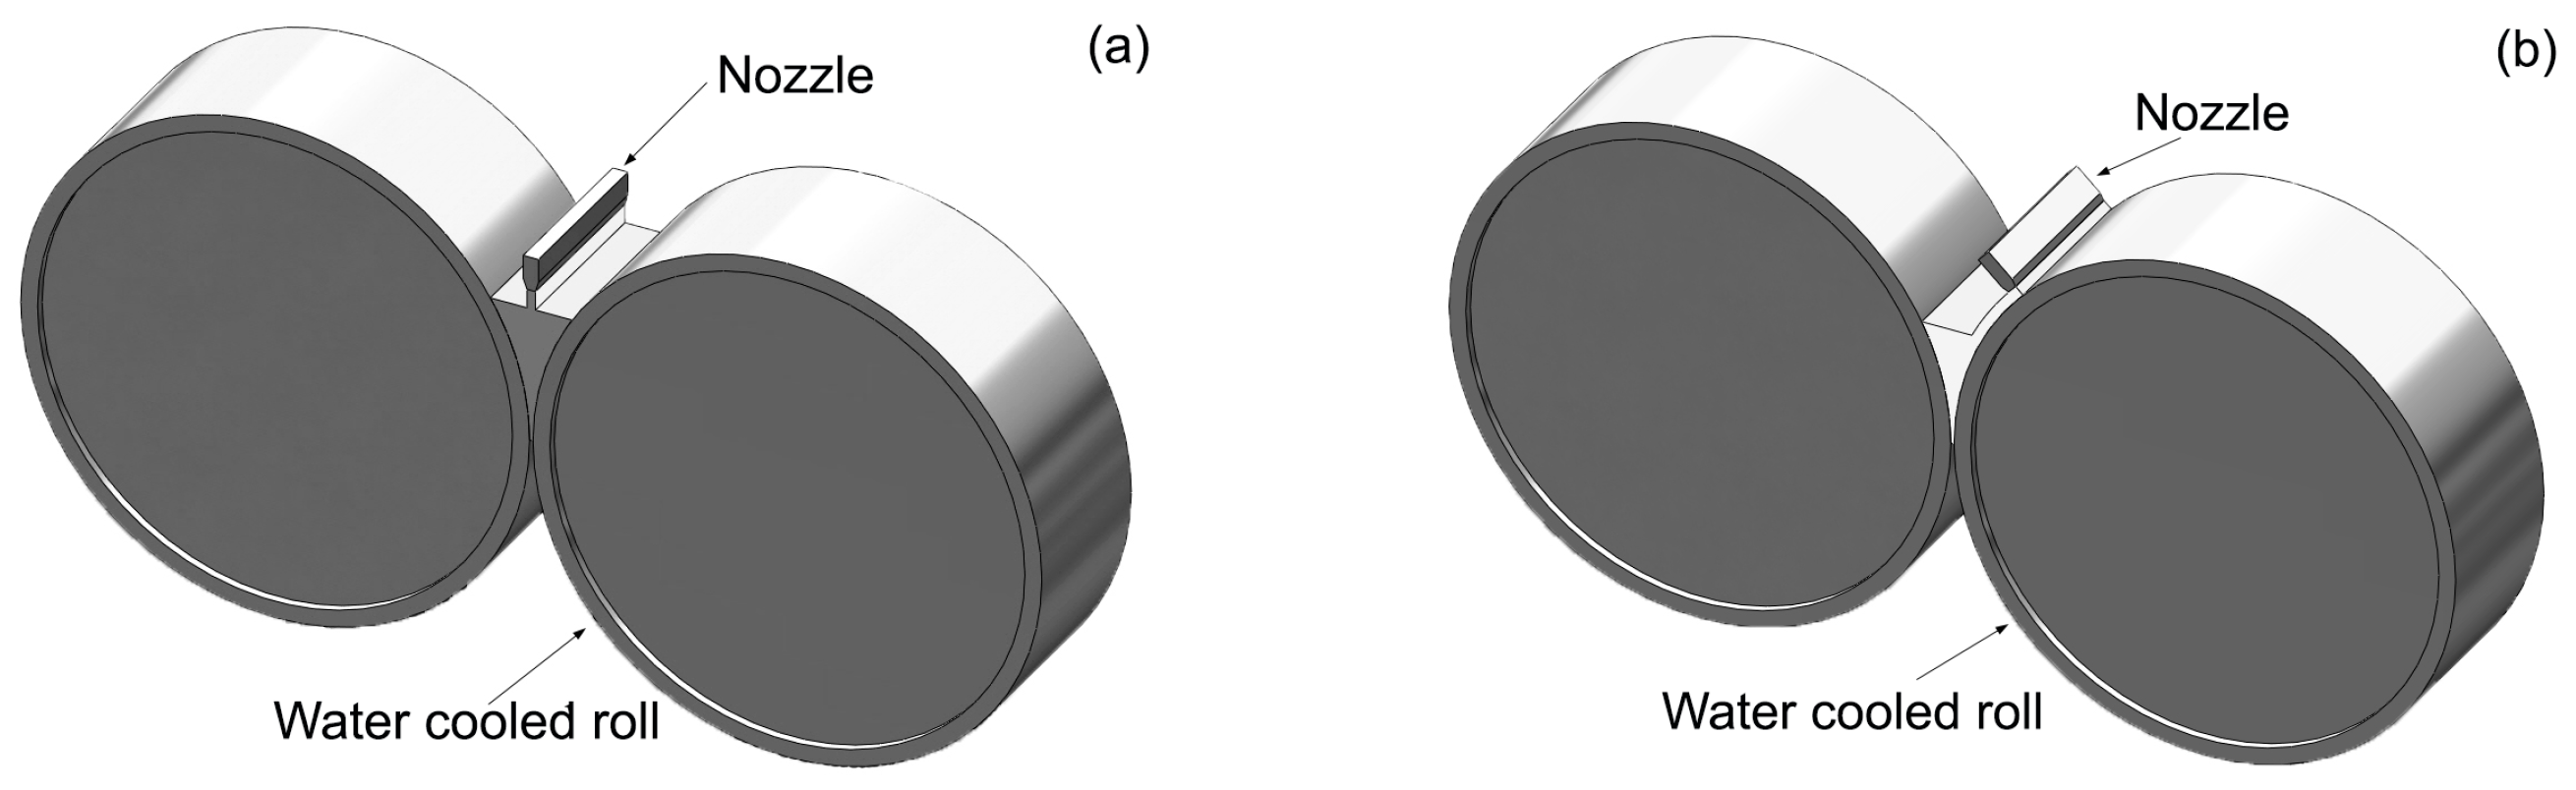
Amorphization or crystallization can occur depending on the cooling rates and thermal behavior experienced by the melt [17,25]. For a better understanding of the solidification behavior of TRC process, thermal flow simulation was carried out based on the condition of a pilot vertical twin-roll caster with roll radius of 150 mm, roll width of 100 mm. Figure 1 shows the schematic of TRC process, with melt supplied in two ways (i.e., center pouring mode shown in Figure 1a, and one side pouring mode shown in Figure 1b). Because the ratio of the width to thickness is quite large, if one ignores the effect of side dams, a 2D finite element method (FEM) model is used. Considering the high speed feeding flow of liquid metal during the strip casting process, flow phenomenon in the molten pool is characterized as turbulent flow. Moreover, the following assumptions are made for steady-state simulations: there is no relative slip between the roll and strip, and heat transfer coefficient between them is constant (i.e., 18 kW∙m−2∙K−1); surface temperature of the roller is 373 K; free surface of the melt is steady. Influences of melt level h, strip thickness δ, casting speed v (i.e., rotating speed) and pouring temperature Tp are considered in simulation. Considering geometric symmetry of the center pouring mode (i.e., Figure 1a), half of the twin-roll casting model was employed.
Figure 2 illustrates the formation of the molten pool of the one side pouring mode. The process and dimensions are specified as follows: the melt is ejected on one roll through a nozzle, a strip shell forms along the roll surface, and the strip shell thickness is marked as d, which has the same value as nozzle. The metal shell of this part is cooled by the roll (the metal-roll contact side) and the atmosphere around it (the metal-air contact side), nearly the same as melt spinning process. As the metal shell rolling down towards to the nip, it contacts to the other side roll, and the height to the nip from this location is marked as h. The metal of this part is cooled by both of the rolls. In Figure 2a, h, which is marked as ha, depends on the metal shell thickness d and the roll gap. We can get a larger value of h with a smaller roll gap under a certain metal shell thickness d. In Figure 2b, a molten liquid level has formed, and h here is marked as hb, which is higher than ha under the same metal shell thickness and roll gap, and can change independently. With the effect of roll pressure (i.e., roll separating force), a thin solidified strip forms and escapes from the roll nip. The total height of the molten pool is marked as L.
3. Calculation of Time Reduced Temperature Transformation (T-Tr-T) and CCT Diagrams
3.1. Calculation of T-Tr-T Diagram
The following equation based on the steady-state homogeneous nucleation theory proposed by Davies and derived by Inoue [29]:
Equation (1) gives a time transformation curve (C-curve) that expresses the time to transform to crystal as a function of temperature. Here, k is the Boltzmann constant, x is the fraction of crystal formed in time t, and a volume fraction of 10−6 as a just-detectable concentration of crystals was used [30]. a0 is the mean atomic diameter, Nv is the volume concentration of atoms. Tr (=T/Tm) is the reduced temperature, and ΔTr (=1 − Tr) is the reduced undercooling of the melt. Br, T0r and η0r are defined as B/Tm, T0/Tm and η0/Tm respectively. B, T0 and η0 are the parameters in the Vogel-Fulcher-Tammann (VFT) equation:
where T0 is known as an ideal glass transition temperature and B is constant depending on materials. D* is the fragility parameter (1 ≤ D* ≤ 100). η0 has the relation of η0 = NAh/V, with NA, Avogadro’s constant, h, Planck’s constant and V, the molar volume [31]. In this paper, the values of V are calculated by the JMatPro software and then we can get the value of η0. The first term of Equation (1) is considered a constant [29], in this paper it is 0.89 × 10⁻⁶ J−1∙K∙m3. Since B and T0 are empirical parameters and were not known clearly for the alloys below, referring to the data summarized by Takeuchi and B.A. Sun [27,29,32], considering the mostly used processing method of high aluminum content bulk metallic glasses [2,33,34], parameters of hypothetical alloys used in this paper are listed in Table 2. These hypothetical alloys are assumed to have compositions range near the given alloy (i.e., Al35La50Ni15).
3.2. Calculation of CCT Diagram
In order to determine the critical cooling rate for a glass-forming material solidified from liquid state without crystallization, constructing a CCT curve instead of time-temperature-transformation (TTT) curve is more realistic [35]. Here, we used the additivity rule to relate the transformation behavior during continuous cooling with the isothermal transformation data calculated above. The additivity rule was proposed by Scheil firstly and can be expressed by [36]:
where ti is the time spent at a particular temperature and τi is the incubation time at that temperature. According to the additivity rule, CCT curve could be gained using the calculated T-Tr-T diagram. The cooling routes used in calculation are given by:
where q is the cooling rate, and here it is negative.
4. Results and Discussion
4.1. Estimation of the Critical Cooling Rates Using CCT Curves
It was found that strong glass formers exhibit a very small T0 and a very high melt viscosity, while fragile glass formers, show a T0 near Tg, as well as low melt viscosities [37]. The T-Tr-T curves of Al-rich alloys listed in Table 1 calculated by Equation (1) are shown in Figure 3. Alloys with compositions close to Al35La50Ni15 could have small D* and T0 near Tg, and they may have “C-curves” located between the area of the two curves which with Br of 2.7 and 4. The curve with Br of 2.7 has a “nose time” of 1.9 × 10⁻³ s at Tr of 0.76 and a critical cooling rate of 1.22 × 10⁵ K/s. The curve with Br of 4 has a “nose time” of 0.043 s at Tr of 0.75 and a critical cooling rate of 5.55 × 10³ K/s. Therefore, according to the T-Tr-T curve, a critical cooling rate of four orders of magnitude was estimated for these alloys.
Figure 4 shows the calculated CCT curve of the alloy which has composition close to Al35La50Ni15 with Br of 2.7. It can be found that the critical cooling rate of the hypothetical alloy is 3.71 × 10⁴ K/s, and it is lower than the value attained from T-Tr-T diagram.
4.2. Influence of Casting Parameters
In the evaluation of the cooling ability of the twin-roll caster, average cooling rate, RAVG, was calculated with the following equation:
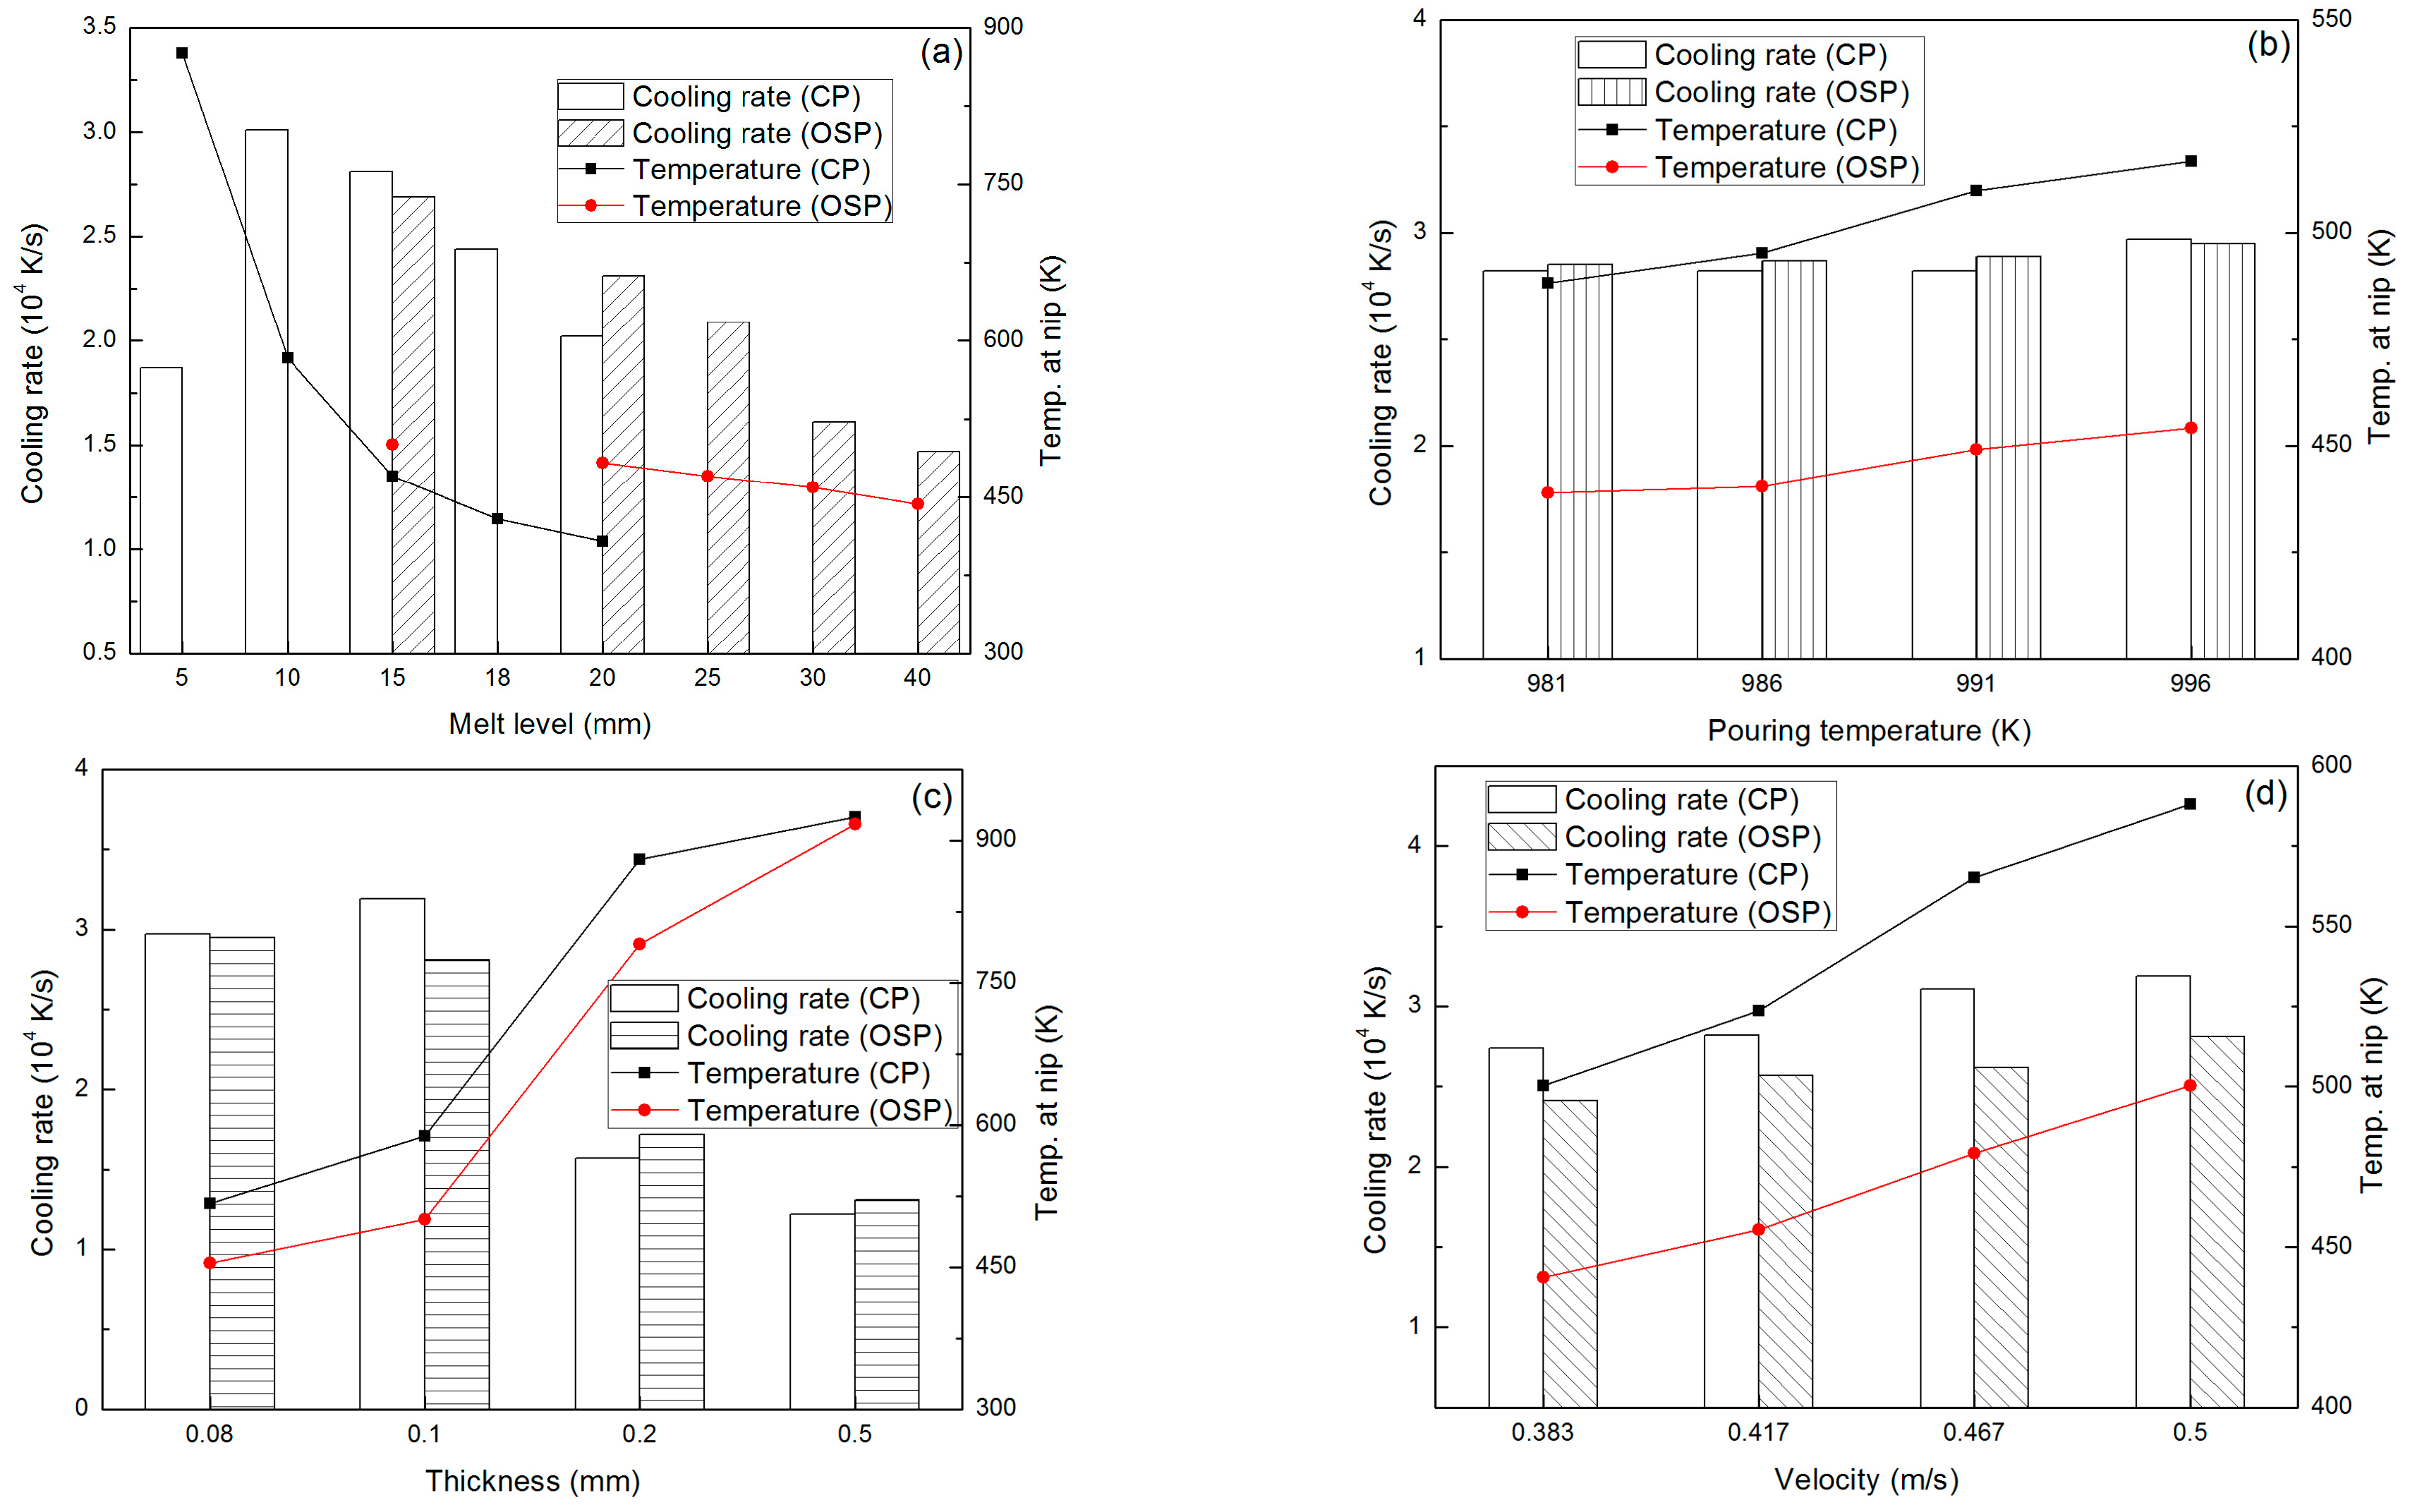
where Tp and Tnip are, respectively, pouring temperature and temperature at the roll nip, h the melt level of molten pool, and vc the casting speed. Figure 5 shows the influences of different casting conditions on the average cooling rate for Al35La50Ni15 alloy based on simulated results, and CP indicates the center pouring mode, OSP indicates the one side pouring mode. For the OSP mode, molten pool has a shape shown in Figure 2a. Here, we call L the melt level. From these results we can see that the average cooling rate under the CP mode is faster than that under the OSP mode. Figure 5a shows the results under the casting conditions of pouring temperature 918 K, casting speed 0.5 m/s and strip thickness 0.08 mm. We can see that average cooling rate becomes slower with the increasing of melt level. Well, for the melt level of 5 mm, it is too fast to solidify within such a short metal-roll contact distance that temperature at the roll nip is 876.11 K, and the process will not continue. When the strip thickness (i.e., nip width) comes to 0.2 mm and 0.5 mm with a melt level of 10 mm, as shown in Figure 5c, much more heat needs to be dissipated for the liquid to become fully solidified before it passes the roll nip, and the process cannot be continued. On the other hand, when setting the melt level smaller and strip thickness thinner, a faster cooling rate could be attained and temperature at the roll nip is also appropriate. However, it may cause a rolling block if the temperature at the roll nip gets too low since a fully amorphous metal is formed before it passes the roll nip. From Figure 5b we can see that there is no influence of the pouring temperature on the average cooling rate, but it can adjust the temperature at roll nip, a lower pouring temperature leads to a lower nip temperature. As a faster casting speed causes a faster cooling rate and a higher nip temperature (Figure 5d), we can control the nip temperature through adjusting the pouring temperature. However, if the nip temperature is so high that it makes the temperature of the supercooled alloy still well above Tg before it passes the roll nip area, full formation of an amorphous structure might not be possible [17], therefore the casting speed has an upper limit. Incidentally, the cooling rates at current conditions, as illustrated in Figure 5b,d, are all in the order of magnitude of 104 K/m, which has a same level with the calculated critical cooling rate.
Based on the continuum theory, a special form of material (or material-time) derivative for any physical quantity ψ under motion status in Eulerian coordinate has been proposed by Ju [38]:
where ν is the velocity vector of material point, x is a vector and represents a space-fixed coordinate system. According to the theory above, considering the thermal phenomenon of the molten pool, cooling rate R(T) at the center of pool was calculated by:
where T is the temperature at pool center, y is the location in the pool height direction, ν is the velocity of the local melt, and t is the time.
According to the analyses of results in Figure 5, in the twin-roll casting process, one of the most important factors is the melt level L. The influences to the temperature distribution under different conditions were discussed as below. Casting conditions are as follows: pouring temperature 981 K, casting speed 32 m/min, strip thickness 0.1 mm, and melt levels under the two pouring mode are listed in Table 3. For the one side pouring mode (Figure 2b), it has a strip shell thickness of 1 mm (i.e., d = 1 mm).
It can be seen from Table 3 that, for a certain melt level, we can get a faster cooling rate with using the CP mode, and also nip temperature is lower than that under OSP mode. On the other hand, however, it is not expected to get a temperature too low at the roll nip because the special properties of metallic glass. Fully solidified metallic glass deforms hardly due to its very high strength. Therefore, we can use the OSP mode to adjust the strip temperature at nip for a certain melt level.
5. Conclusions
- A CCT diagram of a certain alloy could be attained by the combination of an equation derived by Inoue and the additivity rule.
- Critical cooling rate of a metallic alloy for forming metallic glass could be evaluated using the current method.
- Changing the casting conditions or adopting the one side pouring mode could improve the temperature distribution of the pool metal, and the rolling block can be avoided in the VTRC process.
- Cooling rates with 4 orders of magnitude by the VTRC process under the current conditions can be attained, which shows that the VTRC technique has a potential ability in continuous fabrication of Al-rich bulk metallic alloys in sheet form.
Acknowledgments
This research receives ongoing support from the High-Tech Research Center and Nano-technology Project at Saitama Institute of Technology.
Author Contributions
Z.P. and D.J. conceived and designed the calculation and simulation; Z.P. performed the calculation and simulation; Z.P. and D.J. analyzed the data; Z.P. wrote the paper.
Conflicts of Interest
The authors declare no conflict of interest.
References
- Klement, W.; Willens, R.H.; Duwez, P.O.L. Non-crystalline Structure in Solidified Gold-Silicon Alloys. Nature 1960, 187, 869–870. [Google Scholar] [CrossRef]
- Löffler, J.F.; Kündig, A.A.; Dalla Torre, F.H. Rapid Solidification and Bulk Metallic Glasses—Processing and Properties. In Materals Processing Handbook; Powers, M.T., Lavernia, E.J., Groza, J.R., Shackelford, J.F., Eds.; CRC Press: Boca Raton, FL, USA, 2007; pp. 17-1–17-44. [Google Scholar]
- Bedell, J.R.; Polk, D.E. Method of Continuous Casting Metal Filament on Interior Groove of Chill Roll. Patents US3,881,542 A, 6 May 1975. [Google Scholar]
- Sheldon, K. Method of Forming Metallic Filament Cast on Interior Surface of Inclined Annular Quench Roll. U.S. Patent 3,881,540, 6 May 1975. [Google Scholar]
- Liebermann, H.; Graham, C. Production of amorphous alloy ribbons and effects of apparatus parameters on ribbon dimensions. In Proceedings of the IEEE Transactions on Magnetics, New York, NY, USA, 6 January 1976; Volume 12, pp. 921–923. [Google Scholar]
- Johnson, W.L. Bulk Glass-Forming Metallic Alloys: Science and Technology. MRS Bull. 1999, 24, 42–56. [Google Scholar] [CrossRef]
- Aqida, S.N.; Shah, L.H.; Naher, S.; Brabazon, D. Rapid Solidification Processing and Bulk Metallic Glass Casting. In Comprehensive Materials Processing; Hashmi, S., Ed.; Elsevier: Singapore, 2014; pp. 69–88. [Google Scholar]
- Huang, S.C.; Fiedler, H.C. Amorphous ribbon formatin and the effects of casting velocity. Mater. Sci. Eng. 1981, 51, 39–46. [Google Scholar] [CrossRef]
- Carpenter, J.; Steen, P. Planar-flow spin-casting of molten metals: Process behaviour. J. Mater. Sci. 1992, 27, 215–225. [Google Scholar] [CrossRef]
- Wilde, P.D.; Matthys, E.F. Experimental investigation of the planar flow casting process: Development and free surface characteristics of the solidification puddle. Mater. Sci. Eng. A 1992, 150, 237–247. [Google Scholar] [CrossRef]
- Sohrabi, S.; Arabi, H.; Beitollahi, A.; Gholamipour, R. Planar Flow Casting of Fe71Si13.5B9Nb3Cu1Al1.5Ge1 Ribbons. J. Mater. Eng. Perform. 2013, 22, 2185–2190. [Google Scholar] [CrossRef]
- Metglas®. Avaliable online: http://www.metglas.com/ (accessed on 25 October 2016).
- Praisner, T.J.; Chen, J.S.; Tseng, A.A. An experimental study of process behavior in planar flow melt spinning. Metall. Mater. Trans. B 1995, 26, 1199–1208. [Google Scholar] [CrossRef]
- Jones, H. A perspective on the development of rapid solidification and nonequilibrium processing and its future. Mater. Sci. Eng. A 2001, 304, 11–19. [Google Scholar] [CrossRef]
- Chen, H.S.; Miller, C.E. A Rapid Quenching Technique for the Preparation of Thin Uniform Films of Amorphous Solids. Rev. Sci. Instrum. 1970, 41, 1237–1238. [Google Scholar] [CrossRef]
- Suzuki, T.; Anthony, A.M. Rapid quenching on the binary systems of high temperature oxides. Mater. Res. Bull. 1974, 9, 745–753. [Google Scholar] [CrossRef]
- Lee, J.G.; Park, S.S.; Lee, S.B.; Chung, H.T.; Kim, N.J. Sheet fabrication of bulk amorphous alloys by twin-roll strip casting. Scr. Mater. 2005, 53, 693–697. [Google Scholar] [CrossRef]
- Lee, J.G.; Lee, H.; Oh, Y.S.; Lee, S.; Kim, N.J. Continuous fabrication of bulk amorphous alloy sheets by twin-roll strip casting. Intermetallics 2006, 14, 987–993. [Google Scholar] [CrossRef]
- Oh, Y.S.; Lee, H.; Lee, J.G.; Kim, N.J. Twin-Roll Strip Casting of Iron-Base Amorphous Alloys. Mater. Trans. 2007, 48, 1584–1588. [Google Scholar] [CrossRef]
- Urata, A.; Nishiyama, N.; Amiya, K.; Inoue, A. Continuous casting of thick Fe-base glassy plates by twin-roller melt-spinning. Mater. Sci. Eng. A 2007, 449, 269–272. [Google Scholar] [CrossRef]
- Hofmann, D.C.; Roberts, S.N.; Johnson, W.L. Twin Roll Sheet Casting of Bulk Metallic Glasses and Composites in an Inert Environment. Patent US20130025746 A1, 31 January 2013. [Google Scholar]
- East, D.R.; Kellam, M.; Gibson, M.A.; Seeber, A.; Liang, D.; Nie, J.F. Amorphous magnesium sheet produced by twin roll casting. Mater. Sci. Forum 2010, 654, 1078–1081. [Google Scholar] [CrossRef]
- Park, Y.S.; Lee, S.B.; Kim, N.J. Microstructure and Mechanical Properties of Strip Cast Al-Mg-Si-X Alloys. Mater. Trans. 2003, 44, 2617–2624. [Google Scholar] [CrossRef]
- Ding, P.D.; Pan, F.S.; Jiang, B.; Wang, J.; Li, H.L.; Wu, J.C.; Wen, Y. Twin-roll strip casting of magnesium alloys in China. Trans. Nonferr. Met. Soci. China 2008, 18, s7–s11. [Google Scholar] [CrossRef]
- Hu, X.D.; Ju, D.Y.; Zhao, H. Y. Thermal flow simulation of twin-roll casting magnesium alloy. J. Shanghai Jiaotong Univ. Sci. 2012, 17, 479–483. [Google Scholar] [CrossRef]
- Haga, T.; Suzuki, S. Melt ejection twin roll caster for the strip casting of aluminum alloy. J. Mater. Process. Technol. 2003, 137, 92–95. [Google Scholar] [CrossRef]
- Sun, B.A.; Pan, M.X.; Zhao, D.Q.; Wang, W.H.; Xi, X.K.; Sandor, M.T.; Wu, Y. Aluminum-rich bulk metallic glasses. Scr. Mater. 2008, 59, 1159–1162. [Google Scholar] [CrossRef]
- Chen, Z.P.; Gao, J.E.; Wu, Y.; Wang, H.; Liu, X.J.; Lu, Z.P. Designing novel bulk metallic glass composites with a high aluminum content. Sci. Rep. 2013, 3. [Google Scholar] [CrossRef] [PubMed]
- Takeuchi, A.; Inoue, A. Evaluation of Glass-Forming Ability for Metallic Glasses from Time-Reduced Temperature-Transformation Diagram. Mater. Trans. 2001, 42, 2374–2381. [Google Scholar] [CrossRef]
- Uhlmann, D.R. A kinetic treatment of glass formation. J. Non-Cryst. Solids 1972, 7, 337–348. [Google Scholar] [CrossRef]
- Lee, S.B.; Kim, N.J. Kinetics of crystallization in continuously cooled BMG. Mater. Sci. Eng. A 2005, 404, 153–158. [Google Scholar] [CrossRef]
- Takeuchi, A.; Inoue, A. Quantitative evaluation of critical cooling rate for metallic glasses. Mater. Sci. Eng. A 2001, 304, 446–451. [Google Scholar] [CrossRef]
- Inoue, A.; Nakamura, T.; Sugita, T.; Zhang, T.; Masumoto, T. Bulky La-Al-TM (TM=Transition Metal) Amorphous Alloys with High Tensile Strength Produced by a High-Pressure Die Casting Method. Mater. Trans. JIM 1993, 34, 351–358. [Google Scholar] [CrossRef]
- Yang, G.N.; Shao, Y.; Yao, K.F.; Chen, S.Q. A study of cooling process in bulk metallic glasses fabrication. AIP Adv. 2015, 5. [Google Scholar] [CrossRef]
- Xu, K.; Wang, Y.; Li, J.; Li, Q. Critical cooling rate for the glass formation of ferromagnetic Fe80P13C7 alloy. Acta Metall. Sin. 2013, 26, 56–62. [Google Scholar] [CrossRef]
- Umemoto, M.; Horiuchi, K.; Tamura, I. Pearlite Transformation during Continuous Cooling and Its Relation to Isothermal Transformation. Trans. Iron Steel Inst. Jpn. 1983, 23, 690–695. [Google Scholar] [CrossRef]
- Busch, R.; Liu, W.; Johnson, W.L. Thermodynamics and kinetics of the Mg65Cu25Y10 bulk metallic glass forming liquid. J. Appl. Phys. 1998, 83, 4134–4141. [Google Scholar] [CrossRef]
- Inoue, T.; Ju, D.Y.; Yosihara, N. Temperature and Viscoplastic Stresses During Vertical Semi-Continuous Direct Chill Casting of Aluminum Alloy. In International Conference on Residual Stresses (ICRS2); Beck, G., Denis, S., Simon, A., Eds.; Springer: Dordrecht, The Netherlands, 1989; pp. 523–528. [Google Scholar]
Figure 1.
Schematic of TRC process: (a) Center pouring mode; (b) One side pouring mode.

Figure 2.
Schematic of the molten pool of one side pouring mode: (a) ha depends on the roll gap and d; (b) hb > ha and can change independently.
Figure 2.
Schematic of the molten pool of one side pouring mode: (a) ha depends on the roll gap and d; (b) hb > ha and can change independently.
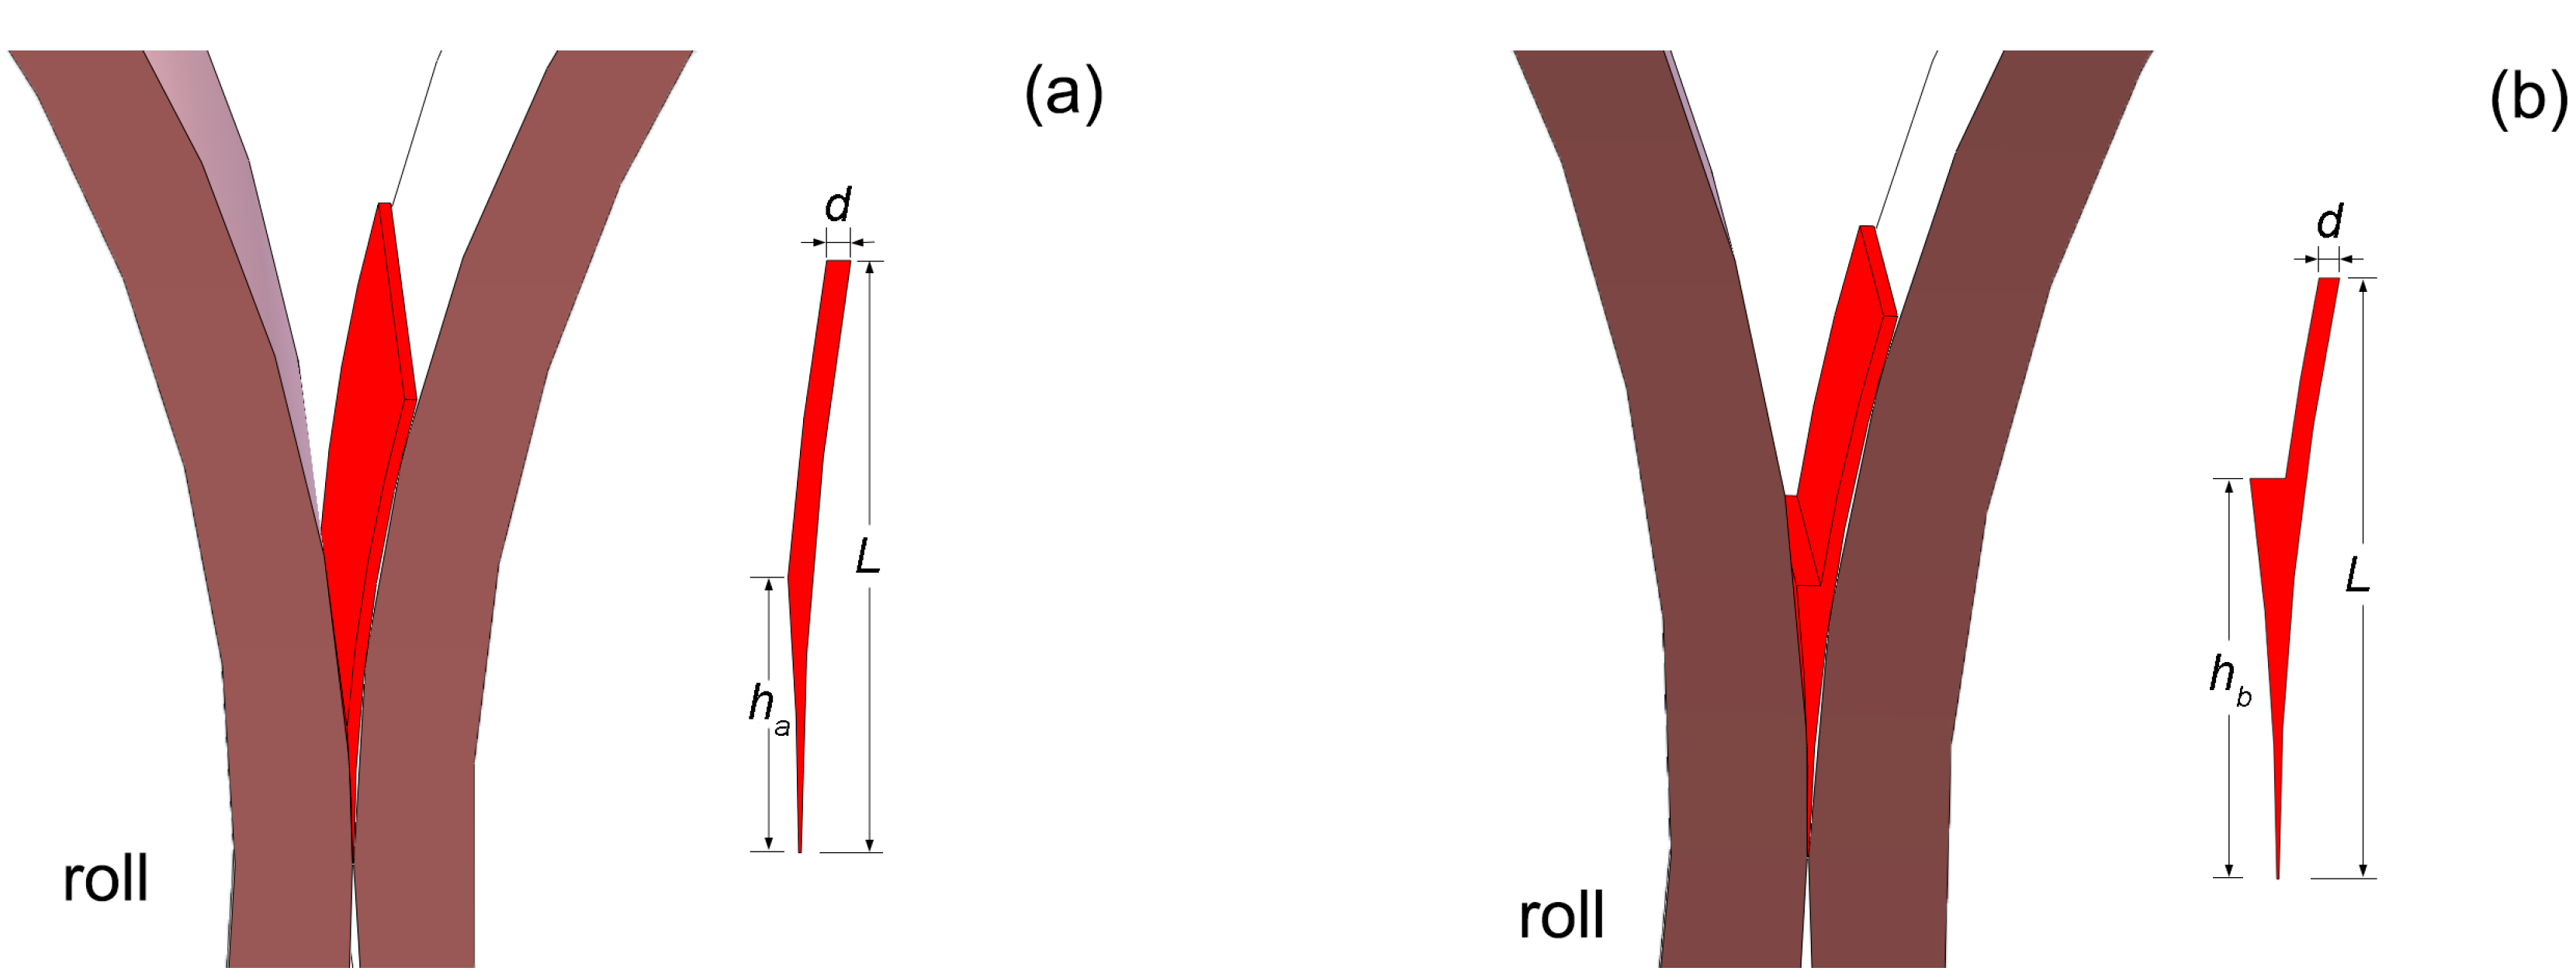
Figure 3.
Calculated T-Tr-T diagram: alloys with compositions close to Al35La50Ni15.
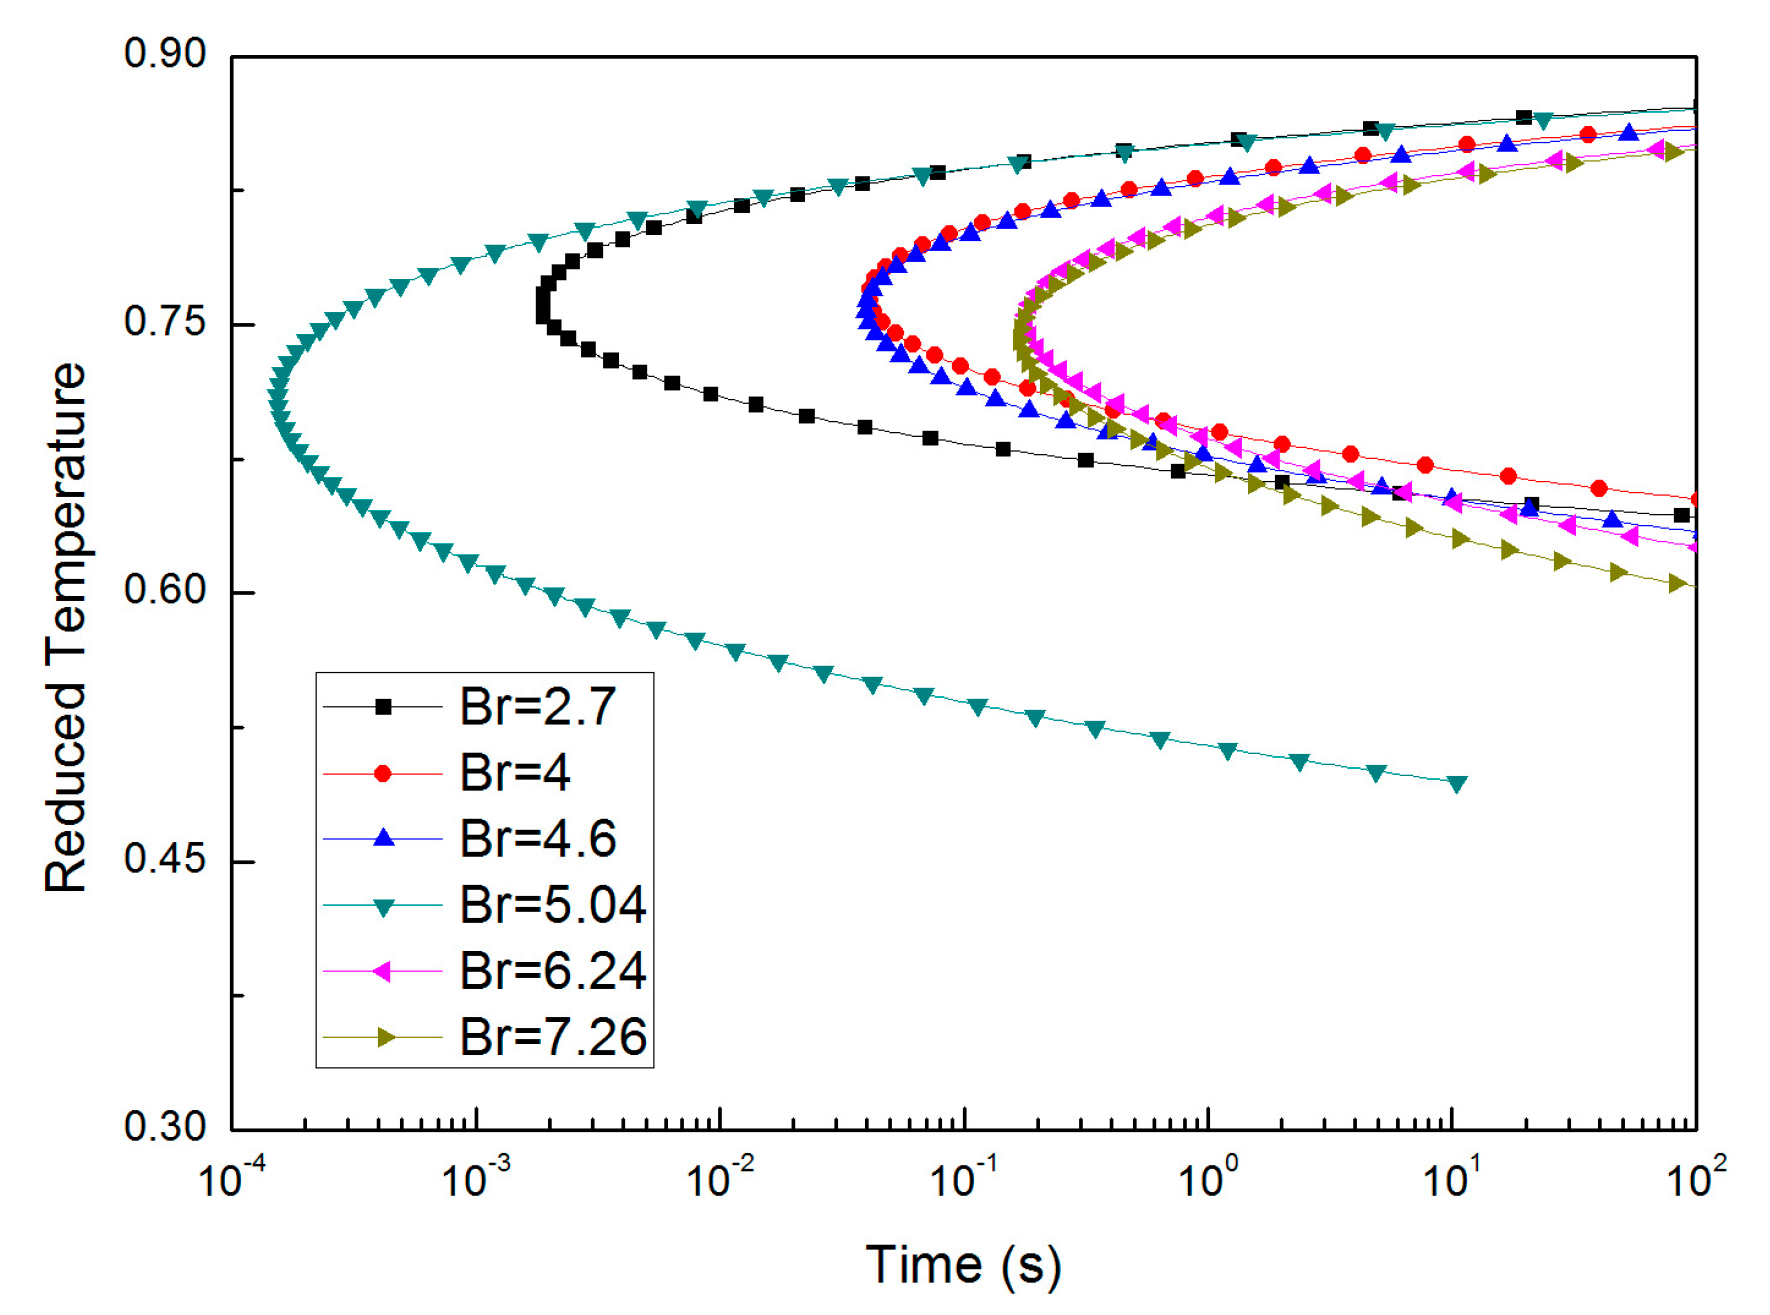
Figure 4.
Calculated continuous cooling transformation (CCT) diagram: alloy with composition close to Al35La50Ni15.
Figure 4.
Calculated continuous cooling transformation (CCT) diagram: alloy with composition close to Al35La50Ni15.
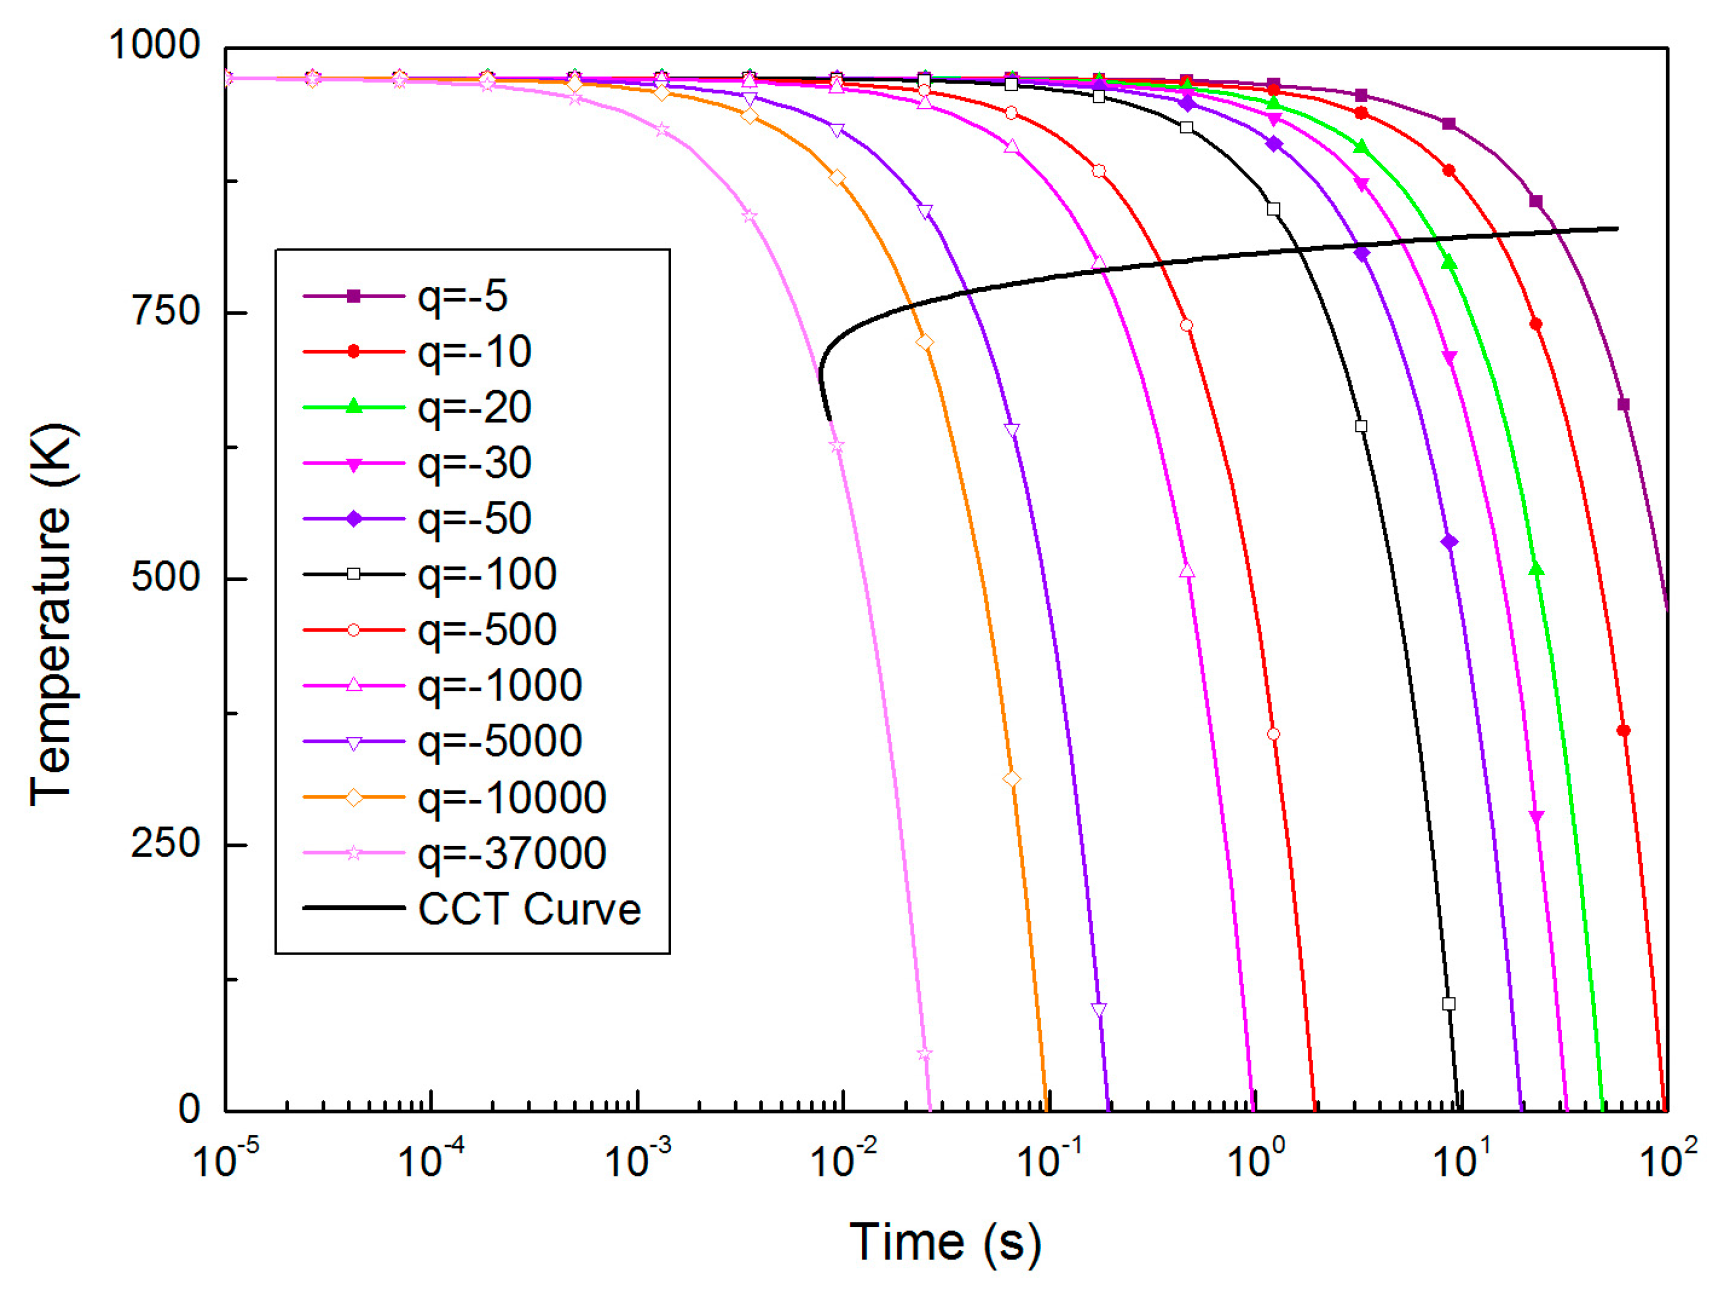
Figure 5.
Effects of casting conditions on cooling rate: (a) Effect of melt level; (b) Effect of pouring temperature; (c) Effect of strip thickness; (d) Effect of casting speed.
Figure 5.
Effects of casting conditions on cooling rate: (a) Effect of melt level; (b) Effect of pouring temperature; (c) Effect of strip thickness; (d) Effect of casting speed.

Table 1.
Papers on the research of twin-roll casting (TRC) of metallic glasses.
| Year | Type | Cooling Rate (K/s) | Speed (rpm) | References |
|---|---|---|---|---|
| 1970 | Vertical | 105 | 100–5000 | [15] |
| 1974 | Vertical | 105 | --- | [16] |
| 2005 | Horizontal | 102–103 | 1, 3 | [17,18,23] |
| 2007 | Horizontal | --- | 0.75 m/s | [20] |
| 2010 | Horizontal | --- | 102 m/s | [22] |
| 2013 | Vertical | 1–103 | --- | [21] |
Table 2.
Parameters used for the calculation of T-Tr-T diagram for aluminum alloys.
| Alloy | η0 (Pa·s) | B (K) | Br | D* | T0 (K) | T0r | Tm (K) | x |
|---|---|---|---|---|---|---|---|---|
| Al35La50Ni15/Hypothetical alloys | 2.39 × 10⁻⁵ | 4893.84 | 5.04 | 18 | 271.88 | 0.28 | 971 | 10−6 |
| 7049.46 | 7.26 | 22 | 320.43 | 0.33 | ||||
| 6059.04 | 6.24 | 16 | 378.69 | 0.39 | ||||
| 4466.6 | 4.6 | 10 | 446.66 | 0.46 | ||||
| 3884 | 4 | 8 | 485.5 | 0.5 | ||||
| 2621.7 | 2.7 | 5 | 524.34 | 0.54 |
Table 3.
Influence of melt level to cooling rates and nip temperature under the two pouring modes.
| Melt Level/L (mm) | 11.63 | 15 | 20 | 25 | 30 | 35 | |
|---|---|---|---|---|---|---|---|
| Cooling Rate (104 K/s) R (737.96) | CP | 3.24 | 3.88 | 3.27 | 38 | 39.6 | --- |
| OSP | --- | 3.53 | 2.77 | 3.59 | 2.21 | 2.74 | |
| Tnip (K) | CP | 497.16 | 445.27 | 405.11 | 396.25 | 395.44 | --- |
| OSP | --- | 470.54 | 501.07 | 458.26 | 423.21 | 417.58 | |
© 2017 by the authors. Licensee MDPI, Basel, Switzerland. This article is an open access article distributed under the terms and conditions of the Creative Commons Attribution (CC BY) license (http://creativecommons.org/licenses/by/4.0/).
Share and Cite
MDPI and ACS Style
Pei, Z.; Ju, D. Simulation of the Continuous Casting and Cooling Behavior of Metallic Glasses. Materials 2017, 10, 420. https://doi.org/10.3390/ma10040420
AMA Style
Pei Z, Ju D. Simulation of the Continuous Casting and Cooling Behavior of Metallic Glasses. Materials. 2017; 10(4):420. https://doi.org/10.3390/ma10040420
Chicago/Turabian StylePei, Zhipu, and Dongying Ju. 2017. "Simulation of the Continuous Casting and Cooling Behavior of Metallic Glasses" Materials 10, no. 4: 420. https://doi.org/10.3390/ma10040420
Note that from the first issue of 2016, this journal uses article numbers instead of page numbers. See further details here.