
Strong Photoluminescence Enhancement of Silicon Oxycarbide through Defect Engineering

Colleges of Nanoscale Science and Engineering, SUNY Polytechnic Institute, Albany, NY 12203, USA
*
Author to whom correspondence should be addressed.
Materials 2017, 10(4), 446; https://doi.org/10.3390/ma10040446
Submission received: 3 March 2017
/
Revised: 1 April 2017
/
Accepted: 18 April 2017
/
Published: 23 April 2017
Abstract
:The following study focuses on the photoluminescence (PL) enhancement of chemically synthesized silicon oxycarbide (SiCxOy) thin films and nanowires through defect engineering via post-deposition passivation treatments. SiCxOy materials were deposited via thermal chemical vapor deposition (TCVD), and exhibit strong white light emission at room-temperature. Post-deposition passivation treatments were carried out using oxygen, nitrogen, and forming gas (FG, 5% H2, 95% N2) ambients, modifying the observed white light emission. The observed white luminescence was found to be inversely related to the carbonyl (C=O) bond density present in the films. The peak-to-peak PL was enhanced ~18 and ~17 times for, respectively, the two SiCxOy matrices, oxygen-rich and carbon-rich SiCxOy, via post-deposition passivations. Through a combinational and systematic Fourier transform infrared spectroscopy (FTIR) and PL study, it was revealed that proper tailoring of the passivations reduces the carbonyl bond density by a factor of ~2.2, corresponding to a PL enhancement of ~50 times. Furthermore, the temperature-dependent and temperature-dependent time resolved PL (TDPL and TD-TRPL) behaviors of the nitrogen and forming gas passivated SiCxOy thin films were investigated to acquire further insight into the ramifications of the passivation on the carbonyl/dangling bond density and PL yield.
1. Introduction
Silicon (Si)-based luminescent materials and nanostructures have attracted appreciable attention in recent years due to their potential utilization in a vast amount of technological applications [1,2]. While crystalline Si is the most important semiconductor material for the electronics industry, its optical properties are relatively poor due to its indirect band gap, preventing efficient emission and absorption of light [1]. Silicon oxycarbide (SiCxOy) materials have been extensively studied, owing to their compatibility with technologies currently used in the Si semiconductor industry, as low-k dielectrics, passivation layers, and etch-stop layers [3,4].
Furthermore, there is ongoing research in employing SiCxOy materials and nanostructures in a diverse range of applications, displaying favorable properties for use in white light emitting materials [5,6], hydrogen storage materials [7], gas sensors [8], and even in biomedical devices [9]. Towards this, SiCxOy nanowires (NWs) have been recently shown to exhibit strong room-temperature visible light emission [10,11]. Additionally, SiCxOy has demonstrated to be a suitable host material for optically active rare-earth ions [12,13]. Owing to its chemical inertness and biocompatibility, SiCxOy thin films and NWs may thus be considered as potential candidates for employment in integrated photonic and biosensing applications.
However, potential obstacles for practical application of ultra-thin films and nanostructured materials for light emission applications include their sensitivity to surface chemistry, and their low emission yield caused by charge-carrier dissociation associated with surface defects [14]. Furthermore, unpassivated surfaces of nanostructures and ultra-thin films have exhibited low chemical ambient stability due to an increase in surface defects [15]. Surface passivation/functionalization treatments have shown to significantly enhance the luminescence efficiency [16].
To this end, prior work by researchers has been dedicated to the development of a chemical vapor deposition (CVD) synthesis strategy for the growth of SiCxOy thin films and NWs for light emission applications [10,17]. It has been demonstrated that the as-deposited SiCxOy thin films follow closely to the pure silicon oxycarbide stoichiometry [SiCxO2(1-x), (0 < x < 1)]. The compositional evolution of the SiCxOy materials spans from SiC to SiO2, for respectively, x = 1 and x = 0. The resulting materials exhibit strong white light emission, originating from the recombination of photo-generated carriers between the energy bands and/or at their tail states, associated with the Si–O–C/Si–C bonding configurations [11,17].
This report describes the effects of post-deposition passivation treatments in oxygen (O2), nitrogen (N2), and forming gas (FG, 5% H2 and 95% N2) ambients on the structural and photoluminescence (PL) characteristics of two compositions of amorphous SiCxOy materials. The white light emission from both the as-deposited and passivated materials was strong enough to be seen by the naked eye in bright room conditions, and the integrated PL intensity was found to be related to the carbonyl (C=O) bonding present in the films.
2. Results and Discussion
The room-temperature steady-state PL spectra for the O-rich and C-rich SiCxOy thin films are presented in Figure 1a. The peak-to-peak PL increased ~18 times from the N2 900 °C passivation to the forming gas (FG) 700 °C passivated sample in the case of the O-rich SiCxOy, whereas its C-rich counterpart exhibited a ~17 times increase for its corresponding passivated samples. Single thermal passivation in FG ambient (between 500 and 900 °C) yielded a continuous luminescence enhancement in the case of the C-rich matrix, as depicted in Figure 1b.
The largest integrated PL (IPL) increase for the C-rich SiCxOy was ~8.4 times, as compared with the as-deposited sample, via post-deposition passivation in FG at 900 °C. For the O-rich matrix, the largest IPL increase of ~4.2 occurred at 700 °C in FG, followed by a decrease at 900 °C. This behavior may be associated with an interplay between hydrogen desorption, as assessed by Fourier transform infrared spectroscopy (FTIR) and nuclear reaction analysis (NRA) measurements, and reduced structural disorder upon passivation (e.g., passivation of dangling bonds) [18]. The passivation benefits of FG treatments are expected to be more pronounced on C-rich thin films, which exhibit higher local disorder compared to their O-rich analogs. The latter behavior is clearly reflected by the higher bond-angle disorder seen in C-rich CVD-grown SiCxOy, as observed in FTIR studies [19].
Thermal treatments in N2 yielded a decrease in IPL for both matrices beyond 700 °C, as shown in Figure 1c, ruling out the increase in IPL for the FG-passivated samples being due to purely thermal treatment. Instead, this suggests that the two ambients affect the observed PL differently. In an attempt to recover the observed PL after the N2 900 °C passivation, a 700 °C FG-passivation was performed sequentially, shown in Figure 1c. The IPL was not recovered, suggesting that the induced structural changes via N2-passivation cannot be recovered with FG-passivation at this temperature.
In order to further elucidate on the behavior of the IPL from the SiCxOy matrix with regards to the structural composition itself, a combinational and systematic FTIR and PL study was carried out. It was observed that the IPL of the films was inversely related to a bonding configuration at ~1880 cm−1 in the infrared spectra, as depicted in the inset of Figure 2. This bonding configuration is attributed to carbonyl (C=O) stretching mode [19], blue-shifted by nearby oxygen atoms. This PL behavior is in agreement with the observed role of C=O groups in materials, where C=O act as traps for non-radiative pathways dissociating the photo-generated carriers, and thus quenching the PL [20,21]. Therefore, the decrease in IPL with increasing C=O bond area (Figure 2) is expected, suggesting an increase in the density of non-radiative pathways related to the carbonyl bonding configuration in films, which has been also observed in graphene oxide [22].
It was found that the presence of carbonyl bonding in the films could be further modulated beyond composition control during synthesis, as thermal passivations in FG and N2 ambients, respectively, decreased and increased the carbonyl present in the films. The solid points representative of the modulation of the bond density of C=O in the SiCxOy matrix correspond to the FTIR spectra of the same color depicted in the inset of Figure 2. As is highlighted in the inset of Figure 2, N2-passivation increased the C=O present in the O-rich matrix, whereas FG-passivation decreased the amount present with respect to its as-deposited. Through effective defect engineering by means of proper tailoring of the passivations, it was found that the density of C=O could be reduced by a factor of ~2.2, yielding a substantial non-linear PL enhancement of ~50 times (Figure 2).
Additionally, FTIR analysis revealed the presence of Si–H bonding (~2050 cm−1) in both as-deposited matrices [19]. Upon annealing treatments in N2 up to 900 °C, there was no observable change in Si–H bonding; however, passivation in FG revealed an increase in the Si–Hn stretching mode at ~2250 cm−1 [19,23], suggesting the presence of unsaturated bonds in the as-deposited and N2-passivated samples. Coupled with the decrease in C=O upon FG-passivation, it is therefore implied that the FG-passivation reduces the carbonyl bonding, and in parallel, saturates dangling bonds. Conversely, FTIR showed that the N2-passivation increases the C=O present in the matrix, and this is coupled with the absence of any Si-Hn bonding (2100–2250 cm−1), indicating that any dangling bonds in the films remained unsaturated. This would lead to enhanced structural disorder and density of defect states in films, thereby increasing the absorption (α). This was indeed observed by ultraviolet-visible spectroscopy ellipsometry (UV-VIS-SE) analysis (inset of Figure 3a), as increased absorption was seen in the case of the 900 °C N2-annealed SiCxOy.
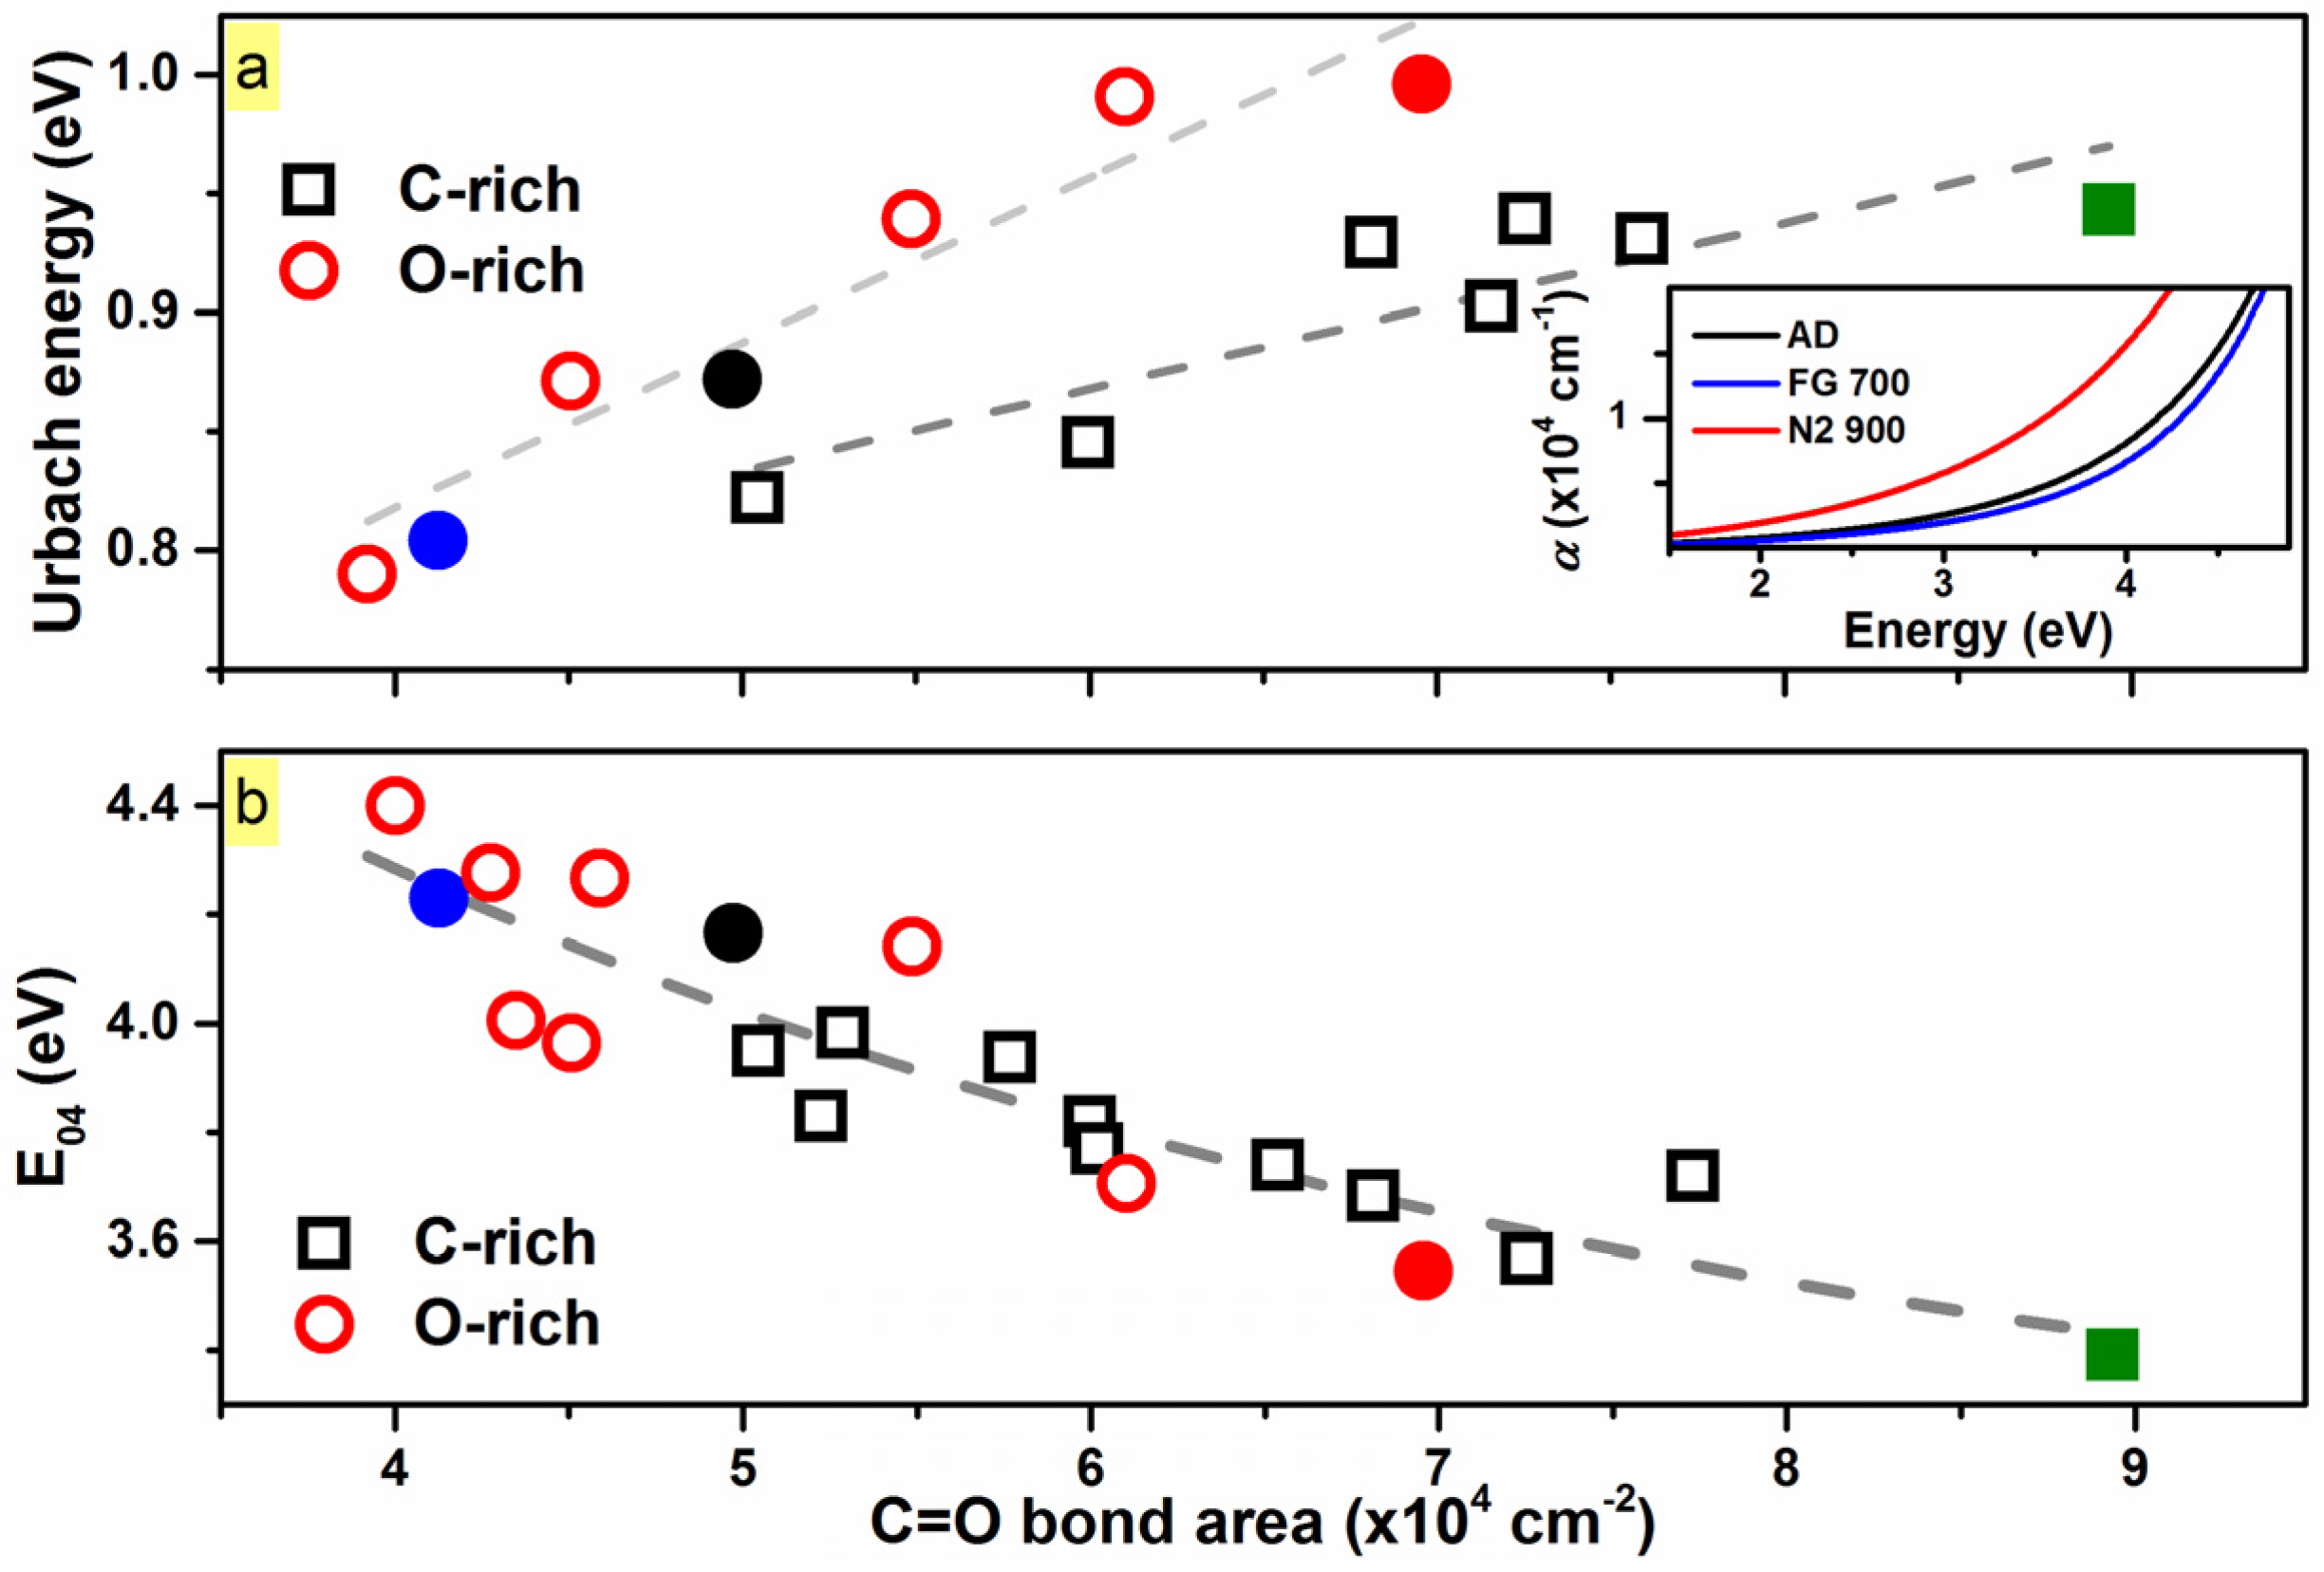
Furthermore, sub-E04 optical gap absorption involves transitions from or to localized states, and has an exponential-like dependence on the photon energy (E04: energy where the absorption coefficient, α, is 104 cm−1) [24]. The tailing of the band edges is characterized by the Urbach energy, Eu, and can be employed to characterize the energy width of the band-tail states in amorphous systems [25]. As shown in Figure 3a, the Eu energies for the samples increases almost linearly with the increased presence of carbonyl in materials, suggesting broadening of the band-tails in SiCxOy. Accordingly, the E04 gap decreased linearly with increased C=O.
Thus, the increase in Eu energies, correlated to the presence of C=O in films, may be attributed to an increased disorder in SiCxOy. As discussed, the latter is suggested to be related to the formation of dangling bonds (e.g., during N2 annealing), which in turn is expected to result in increased absorption and lower E04 values, as evidently seen in Figure 3b. This effectively reduces the probability of radiative transitions, as photo-generated carriers during thermalization would diffuse away by hopping to non-radiative recombination centers (e.g., Si dangling bonds) before they recombine [26,27]. Hence, there is an observed decrease in IPL with increasing Eu.
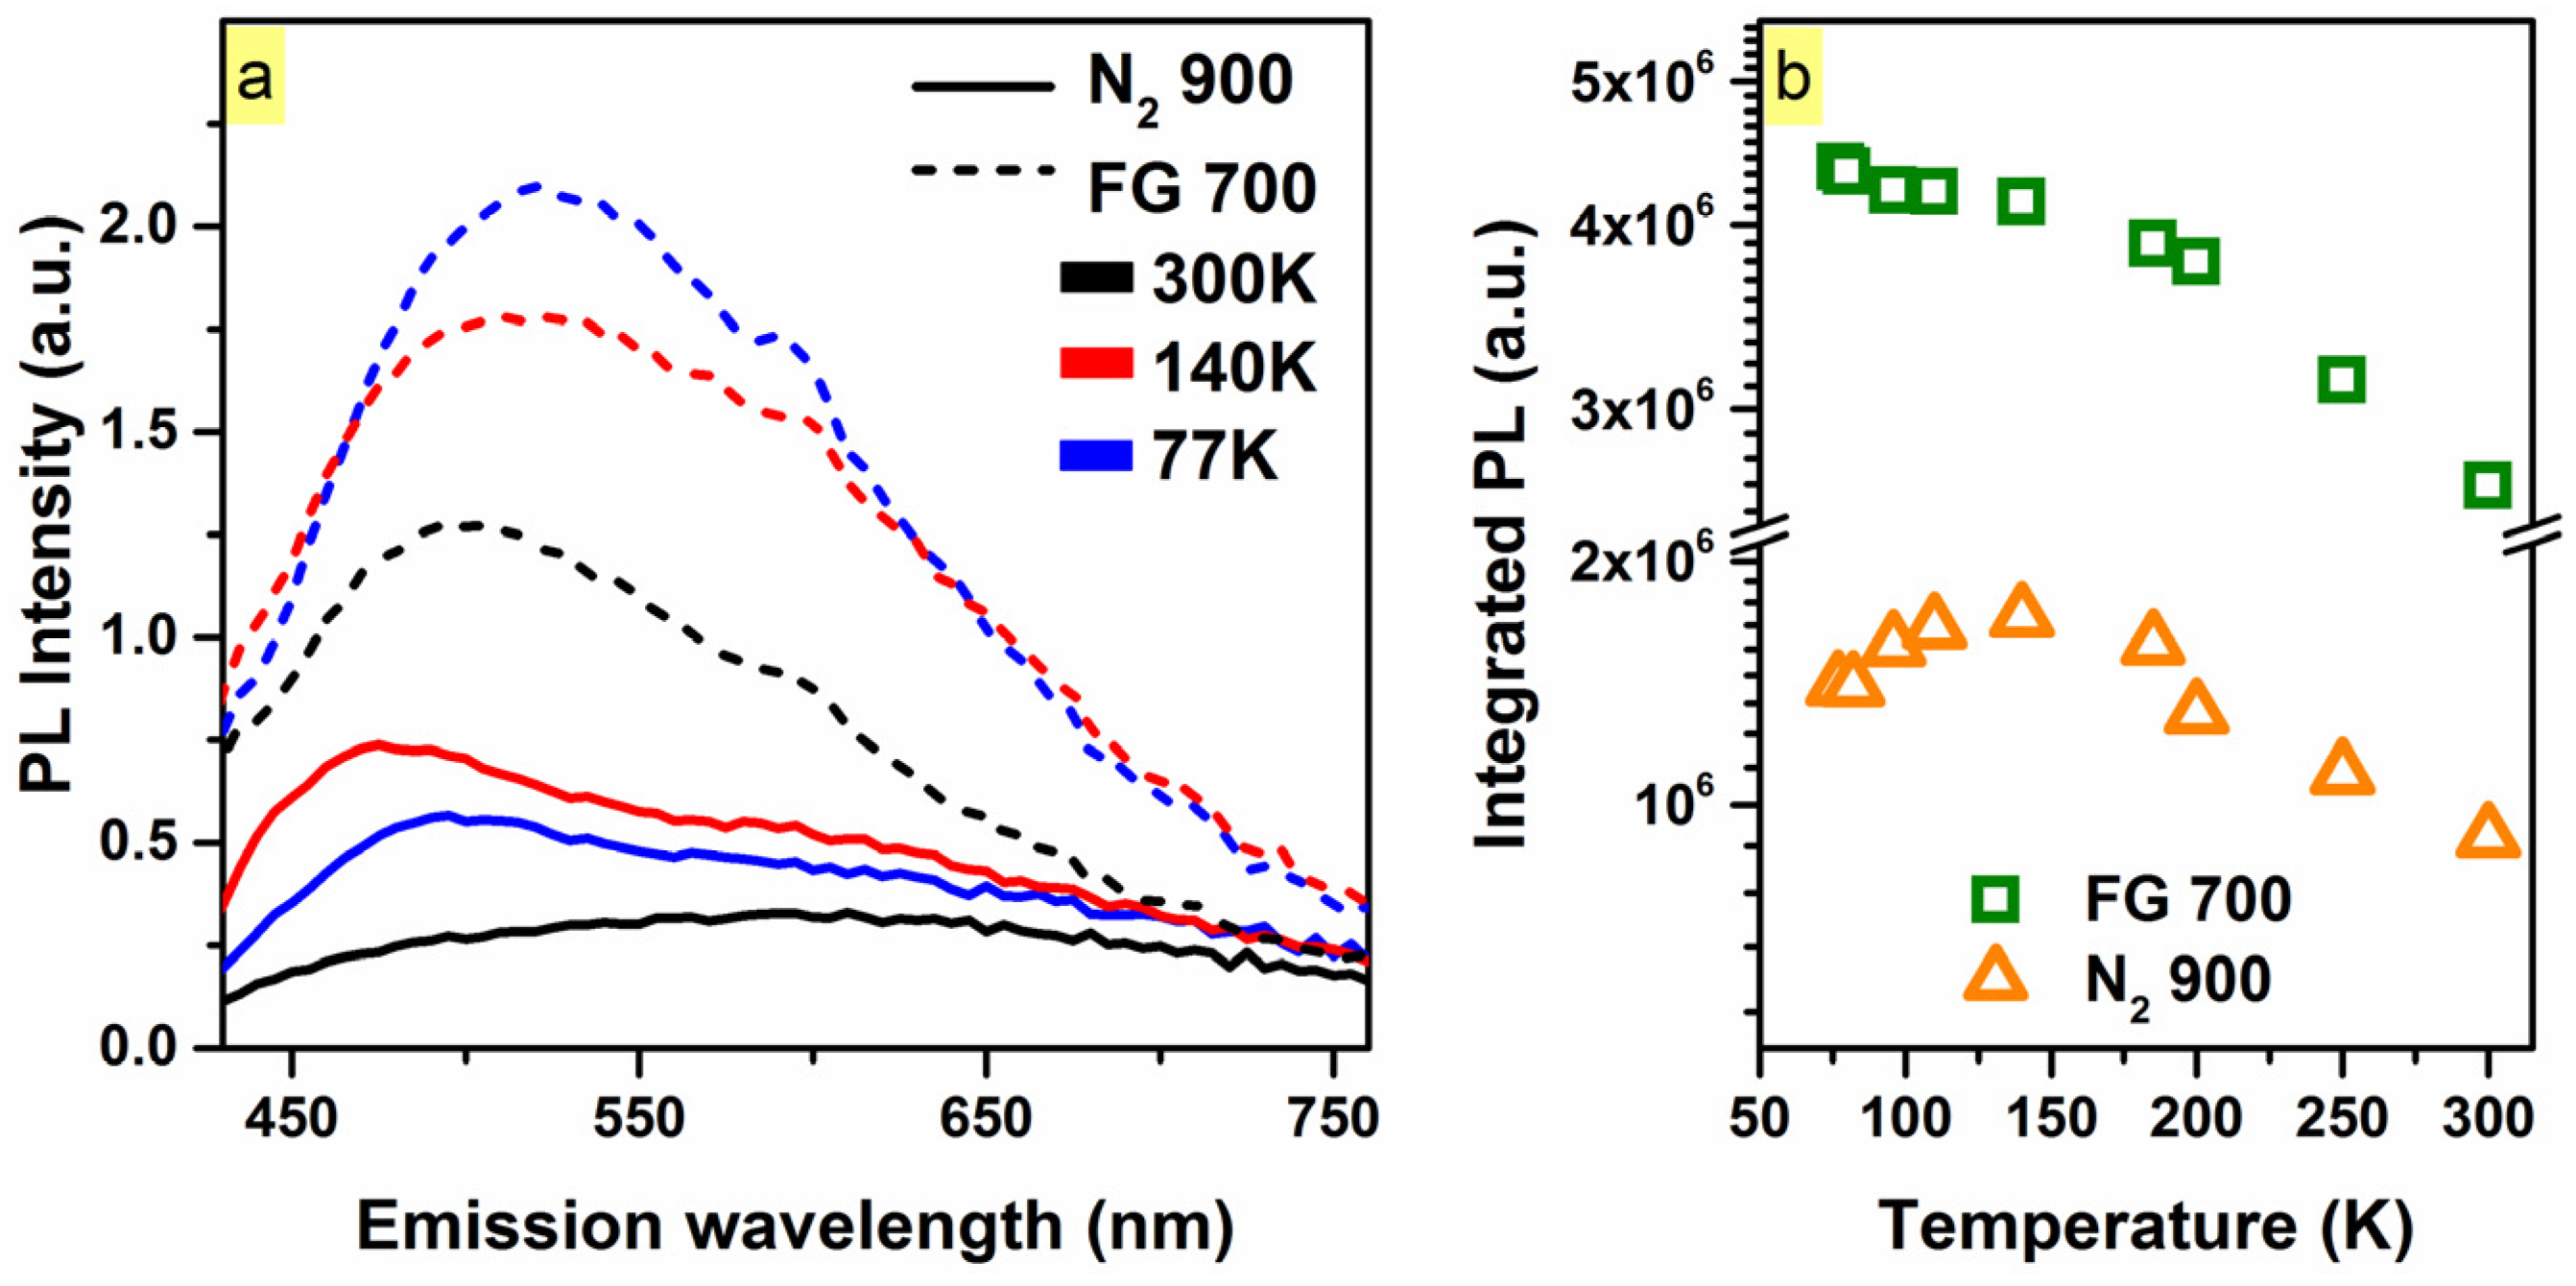
To gain further insight into the spectral characteristics of SiCxOy (such as possible luminescence emanating from defects/localized states (e.g., C=O defect-related states)), temperature-dependent photoluminescence (TDPL) spectra of two passivated O-rich thin films with varying C=O density were collected. This corresponds to blue and red solid points for the, respectively, FG 700 °C (low bond density of C=O) and N2 900 °C (high C=O bond density) O-rich samples in Figure 2 and Figure 3.
Figure 4a shows the steady-state TDPL spectra for these two samples under 400 nm excitation (sub-gap excitation in the case of FG-passivated sample). Two characteristic areas of the PL spectra were observed and further probed at ~470 nm and ~580 nm. The 470 nm component exhibited stronger temperature dependence in the N2-passivated sample compared to its FG-passivated counterpart, exhibiting an increase in intensity of ~3 from 300 K to 140 K. The 580 nm component exhibited an increase in intensity of ~1.7 times for both of the annealed samples. As shown in Figure 4b, the total integrated PL of both samples increased ~1.5 times, from 300 K to 77 K.
The temperature-dependence behavior and red-shift (as expected with a decreasing density of states considering sub-gap excitation) of the PL of the FG-passivated sample is consistent with band-tail state luminescence [26,28]. The PL efficiency monotonically decreases as the temperature increases from 77 K to 140 K. Temperature-dependent tail-state luminescence occurs because at low temperatures (e.g., 77 K), electron-hole pairs have less chance (in contrast to high temperatures) to hop and diffuse out to adjacent energy states, making radiative recombination more likely. Consequently, the temperature dependence is more pronounced for lower band-tail states (~520 nm). These states are closer to the hopping edge and are thus less localized compared to the deepest and more localized tail states (longer wavelength).
In the case of the N2 900 °C sample, IPL increased with increasing temperature from ~77 to 140 K, and then monotonically decreased until room-temperature. This negative thermal PL quenching behavior from ~77 to ~140 K [29] (i.e., the increase in IPL with an increase in temperature) is not consistent with tail-state luminescence, indicating the presence of additional defect-related localized states ~470 nm. To this end, carbonyl (C=O) groups exhibit light emission around ~470 nm, having a long PL lifetime in the ms range [30,31].
To provide further evidence into this, TDPL and TD-TRPL were utilized to probe the two emissions at 470 and 580 nm of the N2 900 °C O-rich (SiC0.3O1.6) sample. The temperature-dependent PL and lifetime of the two emissions, deconvoluted from the steady-state spectra, are depicted in Figure 5. The PL intensity and lifetime from the 580 nm component monotonically decreased as temperature increased, agreeing with the band-tail state recombination model. On the contrary, the 470 nm component exhibited negative thermal quenching from ~77 to ~140 K (Figure 5a, blue), as PL intensity initially increased in this range, and then decreased until room-temperature.
This temperature-dependent PL behavior at ~470 nm further implies the presence of a C=O defect-related emission in the SiCxOy sample with high C=O bond-density. It is suggested that at 77 K, carriers are localized at band-tails states below 2.6 eV (~470 nm). As temperature is increased to 140 K, a higher number of carriers can attain enough thermal energy to thermalize up to higher band-tail states (~2.6 eV). Thus, this has a higher probability to hop/migrate to spatially nearby C=O-related energy states to recombine radiatively. Further increases in temperature would decrease the probability of hopping/migration to C=O-related energy states, as the probability of the carriers to thermalize to lower band-tail states and/or to hope away to defects (e.g., dangling bonds) to recombine non-radiatively is significantly increased [26,32], thus decreasing the 470 nm-PL (Figure 5a).
Additionally, if the 470 nm component were to originate from the C=O present in the N2 900 °C passivated sample, this would involve a triplet-to-singlet transition and would be characterized by a long lifetime. For the 470 nm component (C=O-related PL emission), the lifetime was determined to be ~8 ns below 250 K. However, this lifetime value, which exhibited a standard deviation of ±2.2 ns, is approximately the upper limit of the TRPL measurement under the acquisition parameters utilized (repetition rate of 20 MHz), suggesting a longer lifetime. In order to accurately measure the lifetime of the C=O-related PL emission (~470 nm), a microsecond flashlamp (repetition rate of 1 Hz) was employed. The PL lifetime was determined to be ~160 ms at 140 K. This long lifetime is expected from PL emission, originating from triplet to singlet C=O-related transitions [33], in agreement with our attribution of the ~470 nm-PL emission.
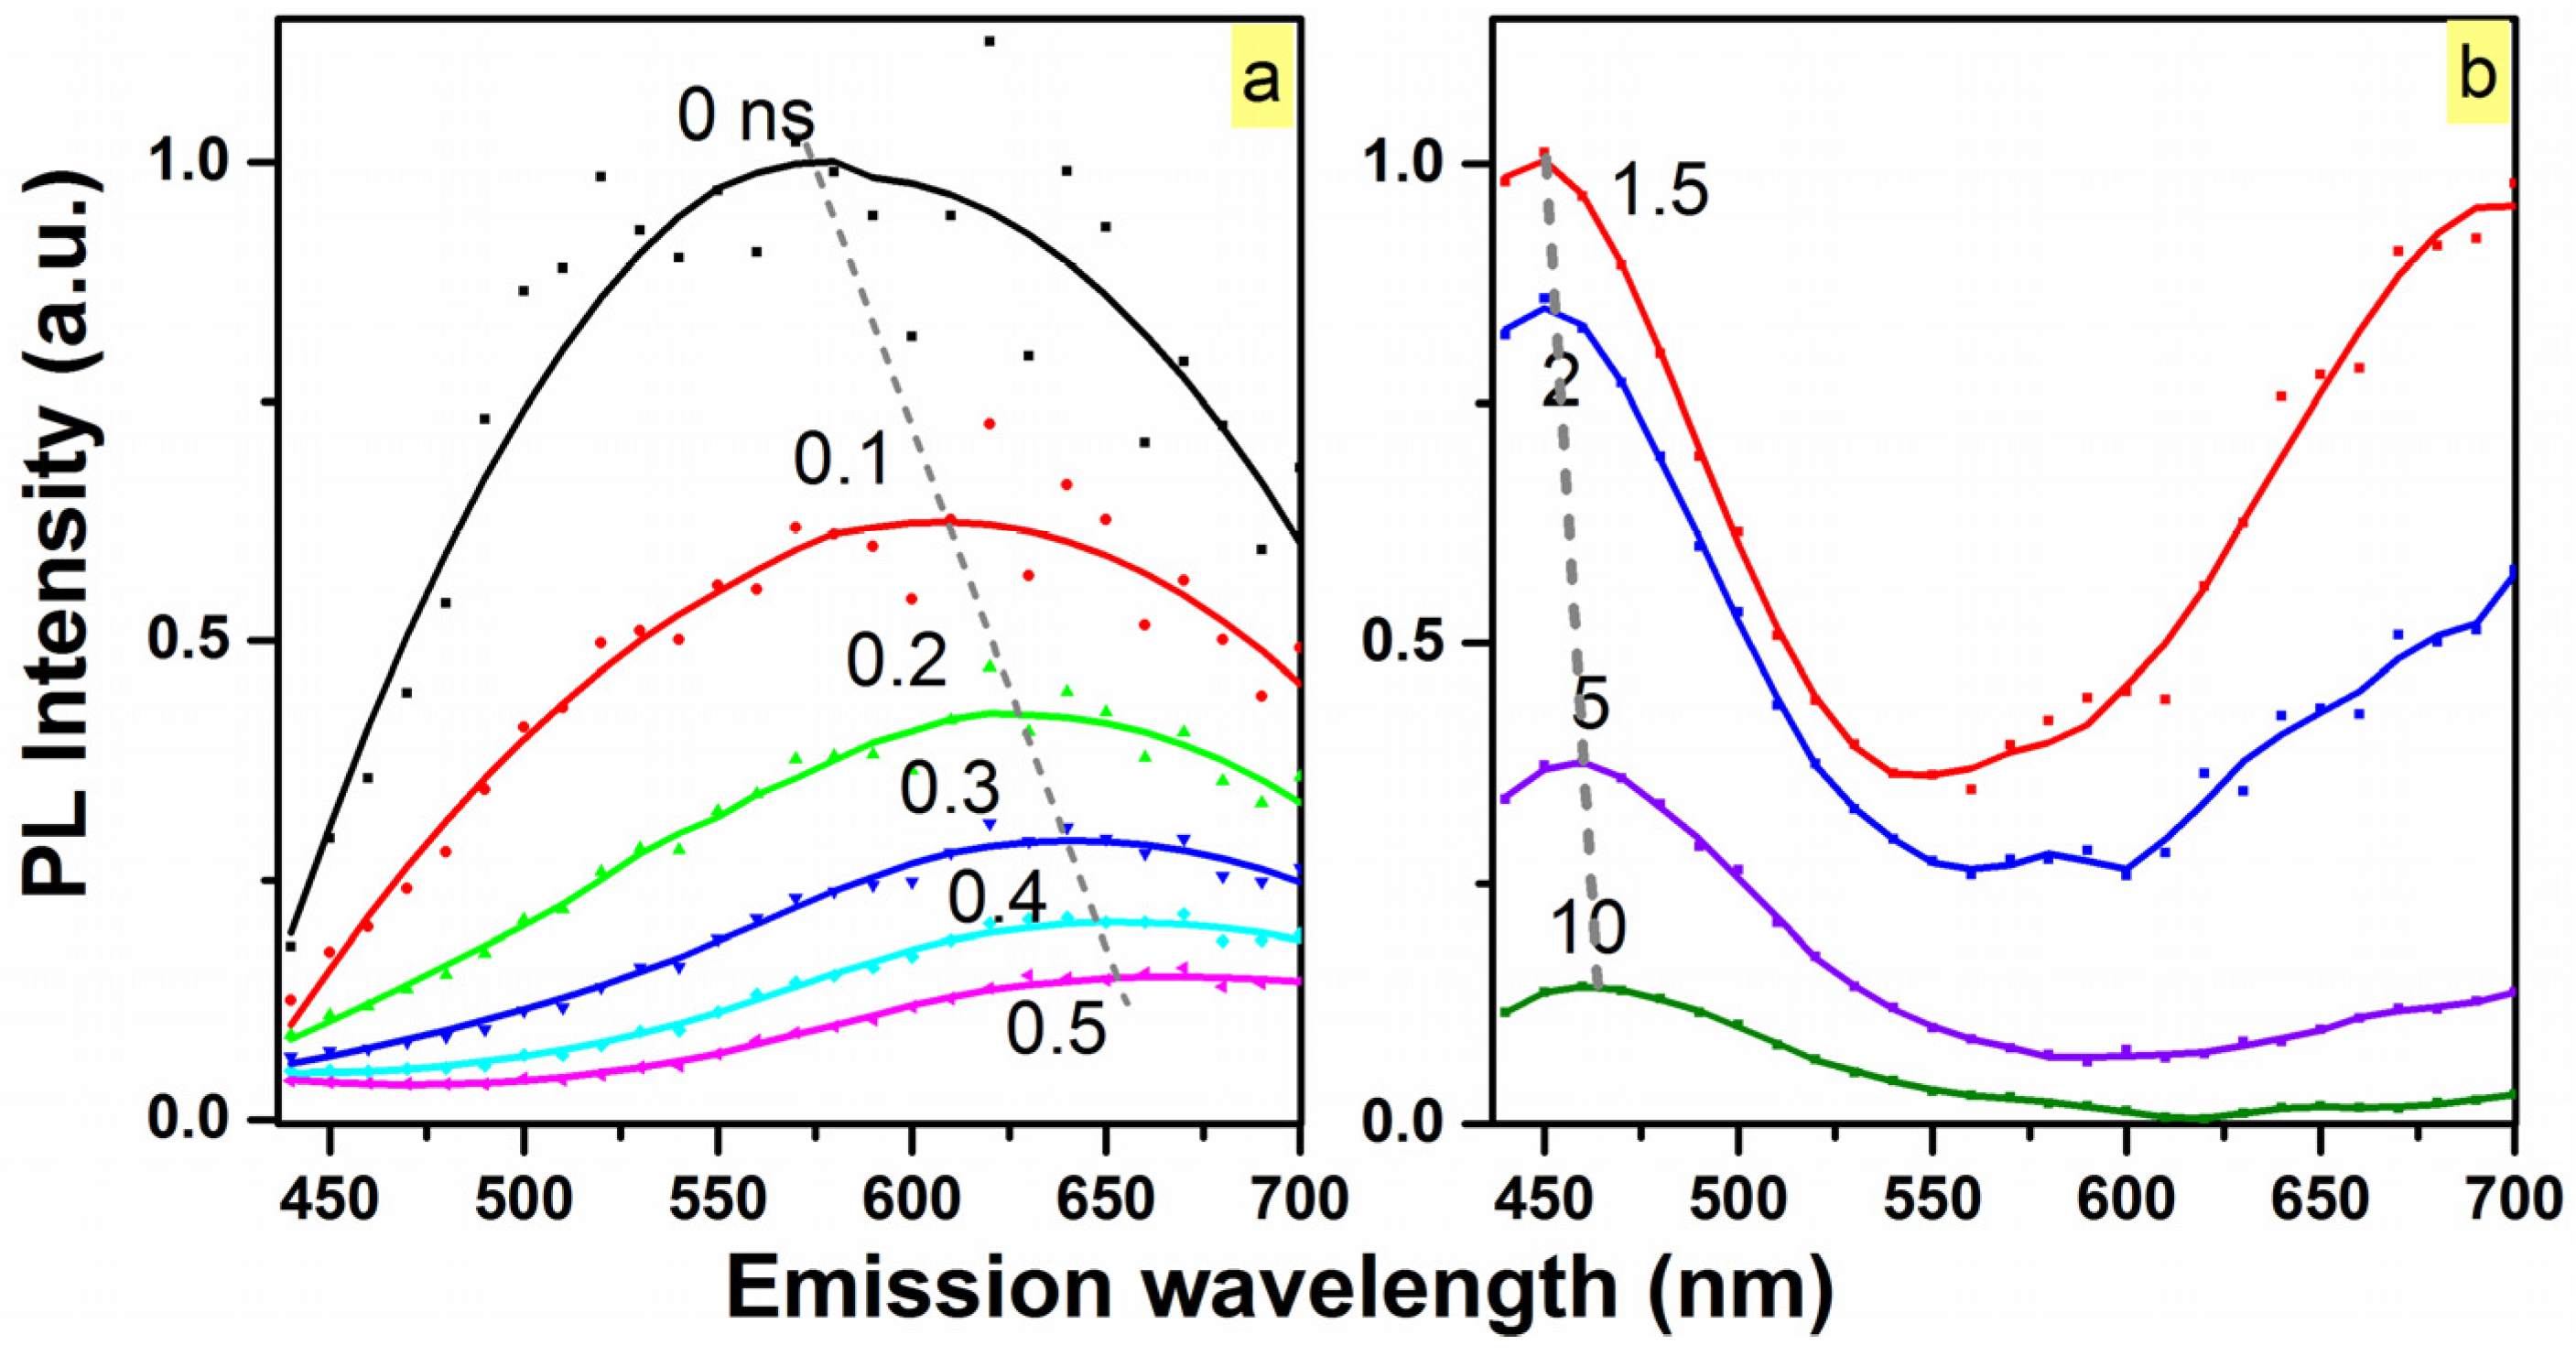
Time-resolved emission spectroscopy (TRES) at 77 K was carried out to investigate the spectral evolution of the N2 900 °C passivated O-rich sample (Figure 6). Within the first 500 ps, the red emission at 580 nm related to the band-tail recombination present in the matrix drops more than one order of magnitude, and it is clearly shown in Figure 6a that the emission red-shifts with time. This behavior is expected, as transitions associated with lower energy band-tail states would exhibit slower recombination rates as the thermalization rate towards lower energy states decreases significantly, due to the decreasing density of band-tail states [11]. However, beyond the first nanosecond, the emission at 470 nm persists even up to the measurement limit of 50 ns (as seen in Figure 6b), and does not appear to shift, indicative of emission from defect-related localized states.
3. Materials and Methods
3.1. Thin Film Synthesis
SiCxOy thin films and NWs (~180 nm thick) were synthesized in a hot-wall quartz tube furnace by TCVD at 800 °C on Si(100) substrates. Si(100) substrates were cleaned using acetone, isopropyl alcohol, deionized water, and were dried using nitrogen. System pressure was maintained between 1 to 2 Torr via a throttle valve, and the oxygen content of the films was modulated by changing the flow rate (hence partial pressure) of ultra-high purity oxygen during deposition. A non-halogenated organosilcate (2,4,6-trimethyl-2,4,6-trisilaheptane) was used as the silicon and carbon source, flown into the chamber with a vapor source mass flow controller at 10 sccm. Further experimental details for the thin film synthesis, NW fabrication, and their associated structural and optical properties can be found in prior publications by the current investigators [10,11,19].
3.2. Thermal Passivation of the SiCxOy Thin Films
The carbon-rich (C-rich) SiC0.5O1.3 and oxygen-rich (O-rich) SiC0.3O1.6 amorphous thin films underwent passivation for 1 h at temperatures of 500–900 °C in ultra-high purity O2, N2 and FG. System chamber was evacuated and underwent three purge cycles using the gas for the passivation prior to starting the heating process.
3.3. Characterization of the SiCxOy Thin Films
The structural and optical properties of the as-deposited and passivated samples were characterized by FTIR (Nicolet iS50, Thermo Scientific, Waltham, MA, USA) and UV-VIS-SE (GESP-5, Semilab, Budapest, Hungary). The room-temperature steady-state PL measurements were performed in an FLSP920 spectrometer from Edinburgh Instruments using a Xe lamp at 300 and 400 nm excitation (Edinburgh Instruments, Livingston, UK). Additionally, TDPL and TD-TRPL studies were conducted by utilizing a closed-loop cold finger cryostat (ST-100, Janis Research, Woburn, MA, USA). TRPL spectra were collected in the same spectrometer utilizing a time correlated single photon counting method, with a pulsed diode laser source [λ = 405 nm (3.06 eV), ~50 ps full width at half maximum (FWHM) and 20 MHz repetition rate].
4. Conclusions
The PL from both the as-deposited and passivated CVD-synthesized SiCxOy materials was strong enough to be seen by the naked eye, while the PL yield was found to be inversely related to the carbonyl (C=O) bond density present in the materials. Through post-deposition passivations, the peak-to-peak PL was enhanced ~18 and ~17 times, respectively, for the O-rich and C-rich matrices in this study.
Furthermore, through optimized post-deposition FG-passivation treatments, the local bonding environment of the SiCxOy can be modified to decrease the amount of C=O. Based on FTIR analysis, this is coupled to the effective passivation of dangling bonds in the materials. In turn, the Eu and E04 energies are, respectively, decreased and increased with decreasing C=O in the materials, yielding the observed substantial non-linear PL enhancement of ~50 times.
Acknowledgments
This work was supported by the Colleges of Nanoscale Science and Engineering of SUNY Polytechnic Institute and The Research Foundation for the State University of New York. The support is gratefully acknowledged.
Author Contributions
S.G. and V.N. conceived and designed the experiments; B.F. and N.T. performed the experiments and analyzed the data; S.G. supervised all aspects of the project. All authors contributed in discussion and preparation of the manuscript.
Conflicts of Interest
The authors declare no conflict of interest.
References
- Priolo, F.; Gregorkiewicz, T.; Galli, M.; Krauss, T.F. Silicon nanostructures for photonics and photovoltaics. Nat. Nanotechnol. 2014, 9, 19–32. [Google Scholar] [CrossRef] [PubMed]
- He, Y.; Fan, C.; Lee, S.T. Silicon nanostructures for bioapplications. Nano Today 2010, 5, 282–295. [Google Scholar] [CrossRef]
- Grill, A.; Gates, S.M.; Ryan, T.E.; Nguyen, S.V.; Priyadarshini, D. Progress in the development and understanding of advanced low k and ultralow k dielectrics for very large-scale integrated interconnects—State of the art. Appl. Phys. Rev. 2014, 1, 11306. [Google Scholar] [CrossRef]
- King, S.W. Dielectric Barrier, Etch Stop, and Metal Capping Materials for State of the Art and beyond Metal Interconnects. ECS J. Solid State Sci. Technol. 2014, 4, N3029–N3047. [Google Scholar] [CrossRef]
- Vasin, A.V. Structural and Luminescent Properties of Carbonized Silicon Oxide Thin Layers. In Functional Nanomaterials and Devices for Electronics, Sensors and Energy Harvesting, 1st ed.; Nazarov, A., Balestra, F., Kilchytska, V., Flandre, D., Eds.; Springer International Publishing: Cham, Switzerland, 2014; pp. 297–321. [Google Scholar]
- Gallis, S.; Nikas, V.; Suhag, H.; Huang, M.; Kaloyeros, A.E. White light emission from amorphous silicon oxycarbide (a-SiCxOy) thin films: Role of composition and postdeposition annealing. Appl. Phys. Lett. 2010, 97, 81905. [Google Scholar] [CrossRef]
- Nghiem, Q.D.; Cho, S.J.; Kim, D.-P. Synthesis of heat-resistant mesoporous SiOC ceramic and its hydrogen adsorption. J. Mater. Chem. 2006, 16, 558–562. [Google Scholar] [CrossRef]
- Karakuscu, A.; Ponzoni, A.; Aravind, P.R.; Sberveglieri, G.; Soraru, G.D. Gas Sensing Behavior of Mesoporous SiOC Glasses. J. Am. Ceram. Soc. 2013, 96, 2366–2369. [Google Scholar] [CrossRef]
- Zhuo, R.; Colombo, P.; Pantano, C.; Vogler, E.A. Silicon oxycarbide glasses for blood-contact applications. Acta Biomater. 2005, 1, 583–589. [Google Scholar] [CrossRef] [PubMed]
- Nikas, V.; Tabassum, N.; Ford, B.; Smith, L.; Kaloyeros, A.E.; Gallis, S. Strong visible light emission from silicon-oxycarbide nanowire arrays prepared by electron beam lithography and reactive ion etching. J. Mater. Res. 2015, 30, 1–8. [Google Scholar] [CrossRef]
- Tabassum, N.; Nikas, V.; Ford, B.; Huang, M.; Kaloyeros, A.E.; Gallis, S. Time-resolved analysis of the white photoluminescence from chemically synthesized SiCxOy thin films and nanowires. Appl. Phys. Lett. 2016, 109, 43104. [Google Scholar] [CrossRef]
- Bellocchi, G.; Franzò, G.; Boninelli, S.; Miritello, M.; Cesca, T.; Iacona, F.; Priolo, F. Structural and luminescence properties of undoped and Eu-doped SiOC thin films. IOP Conf. Ser. Mater. Sci. Eng. 2014, 56, 12009. [Google Scholar] [CrossRef]
- Gallis, S.; Huang, M.; Kaloyeros, A.E. Efficient energy transfer from silicon oxycarbide matrix to Er ions via indirect excitation mechanisms. Appl. Phys. Lett. 2007, 90, 10–13. [Google Scholar] [CrossRef]
- Kilina, S.V.; Tamukong, P.K.; Kilin, D.S. Surface Chemistry of Semiconducting Quantum Dots: Theoretical Perspectives. Acc. Chem. Res. 2016, 49, 2127–2135. [Google Scholar] [CrossRef] [PubMed]
- Wood, J.D.; Wells, S.A.; Jariwala, D.; Chen, K.-S.; Cho, E.; Sangwan, V.K.; Liu, X.; Lauhon, L.J.; Marks, T.J.; Hersam, M.C. Effective Passivation of Exfoliated Black Phosphorus Transistors against Ambient Degradation. Nano Lett. 2014, 14, 6964–6970. [Google Scholar] [CrossRef] [PubMed]
- Yang, F.; LeCroy, G.E.; Wang, P.; Liang, W.; Chen, J.; Fernando, K.A.S.; Bunker, C.E.; Qian, H.; Sun, Y.-P. Functionalization of Carbon Nanoparticles and Defunctionalization—Toward Structural and Mechanistic Elucidation of Carbon “Quantum” Dots. J. Phys. Chem. C 2016, 120, 25604–25611. [Google Scholar] [CrossRef]
- Nikas, V.; Gallis, S.; Huang, M.; Kaloyeros, A.E.; Nguyen, A.P.D.; Stesmans, A.; Afanas’ev, V.V. The origin of white luminescence from silicon oxycarbide thin films. Appl. Phys. Lett. 2014, 104, 61906. [Google Scholar] [CrossRef]
- Rui, Y.; Chen, D.; Xu, J.; Zhang, Y.; Yang, L.; Mei, J.; Ma, Z.; Cen, Z.; Li, W.; Xu, L.; et al. Hydrogen-induced recovery of photoluminescence from annealed a-Si:H/a-SiO2 multilayers. J. Appl. Phys. 2005, 98, 33532. [Google Scholar] [CrossRef]
- Gallis, S.; Nikas, V.; Huang, M.; Eisenbraun, E.; Kaloyeros, A.E. Comparative study of the effects of thermal treatment on the optical properties of hydrogenated amorphous silicon-oxycarbide. J. Appl. Phys. 2007, 102. [Google Scholar] [CrossRef]
- Papadimitrakopoulos, F.; Konstadinidis, K.; Miller, T.M.; Opila, R.; Chandross, E.A.; Galvin, M.E. The Role of Carbonyl Groups in the Photoluminescence of Poly(p-phenylenevinylene). Chem. Mater. 1994, 6, 1563–1568. [Google Scholar] [CrossRef]
- Yan, M.; Rothberg, L.J.; Papadimitrakopoulos, F.; Galvin, M.E.; Miller, T.M. Defect Quenching of Conjugated Polymer Luminescence. Phys. Rev. Lett. 1994, 73, 744–747. [Google Scholar] [CrossRef] [PubMed]
- Rani, J.R.; Lim, J.; Oh, J.; Kim, J.-W.; Shin, H.S.; Kim, J.H.; Lee, S.; Jun, S.C. Epoxy to Carbonyl Group Conversion in Graphene Oxide Thin Films: Effect on Structural and Luminescent Characteristics. J. Phys. Chem. C 2012, 116, 19010–19017. [Google Scholar] [CrossRef]
- Tolstoy, V.P.; Chernyshova, I.V.; Skryshevsky, V.A. Handbook of Infrared Spectroscopy of Ultrathin Films, 1st ed.; John Wiley & Sons, Inc.: Hoboken, NJ, USA, 2003; pp. 416–475. [Google Scholar]
- Zanatta, A.R.; Chambouleyron, I. Absorption edge, band tails, and disorder of amorphous semiconductors. Phys. Rev. B 1996, 53, 3833–3836. [Google Scholar] [CrossRef]
- Knief, S.; von Niessen, W. Disorder, defects, and optical absorption in a-Si and a-Si:H. Phys. Rev. B 1999, 59, 12940–12946. [Google Scholar] [CrossRef]
- Robertson, J. Recombination and photoluminescence mechanism in hydrogenated amorphous carbon. Phys. Rev. B 1996, 53, 16302–16305. [Google Scholar] [CrossRef]
- Street, R.A.; Zesch, J.; Thompson, M.J. Effects of doping on transport and deep trapping in hydrogenated amorphous silicon. Appl. Phys. Lett. 1983, 43, 672–674. [Google Scholar] [CrossRef]
- Monroe, D. Hopping in Exponential Band Tails. Phys. Rev. Lett. 1985, 54, 146–149. [Google Scholar] [CrossRef] [PubMed]
- Shibata, H. Negative Thermal Quenching Curves in Photoluminescence of Solids. Jpn. J. Appl. Phys. 1998, 37, 550–553. [Google Scholar] [CrossRef]
- Kuzmany, H. Solid-State Spectroscopy: An Introduction, 2nd ed.; Springer: Berlin/Heidelberg, Germany, 2009; pp. 144–146. [Google Scholar]
- Klopffer, W. Introduction to Polymer Spectroscopy, 1st ed.; Springer: Berlin/Heidelberg, Germany, 1984; pp. 48–49. [Google Scholar]
- Estes, M.J.; Moddel, G. Luminescence from amorphous silicon nanostructures. Phys. Rev. B 1996, 54, 14633–14642. [Google Scholar] [CrossRef]
- Skuja, L. Optically active oxygen-deficiency-related centers in amorphous silicon dioxide. J. Non Cryst. Solids 1998, 239, 16–48. [Google Scholar] [CrossRef]
Figure 1.
(a) Room-temperature steady-state photoluminescence (PL) spectra for the as-deposited, N2 900°C, and forming gas (FG) 700 °C O-rich SiC0.3O1.6 and C-rich SiC0.5O1.3 matrices under 300 nm (4.13 eV) excitation. More than one order of magnitude (~17.8 and ~16.6 times for the O-rich and C-rich respectively) difference in PL (peak-to-peak) was observed between passivated samples; (b) The integrated PL (IPL) as a function of FG-passivation temperature for both matrices. The maximum increase in IPL was found to be at 700 °C for the O-rich matrix while the FG-passivation for the C-rich matrix yielded a continuous luminescence increase at 900 °C; (c) The IPL as a function of N2-passivation temperature for both matrices. For both compositions of SiCxOy, it was found that higher temperature N2-passivations yielded a decrease in observed IPL. After passivating in N2 at 900 °C, both samples were passivated in FG at 700 °C (green square and blue circle for C-rich and O-rich respectively), to attempt to recover the IPL.
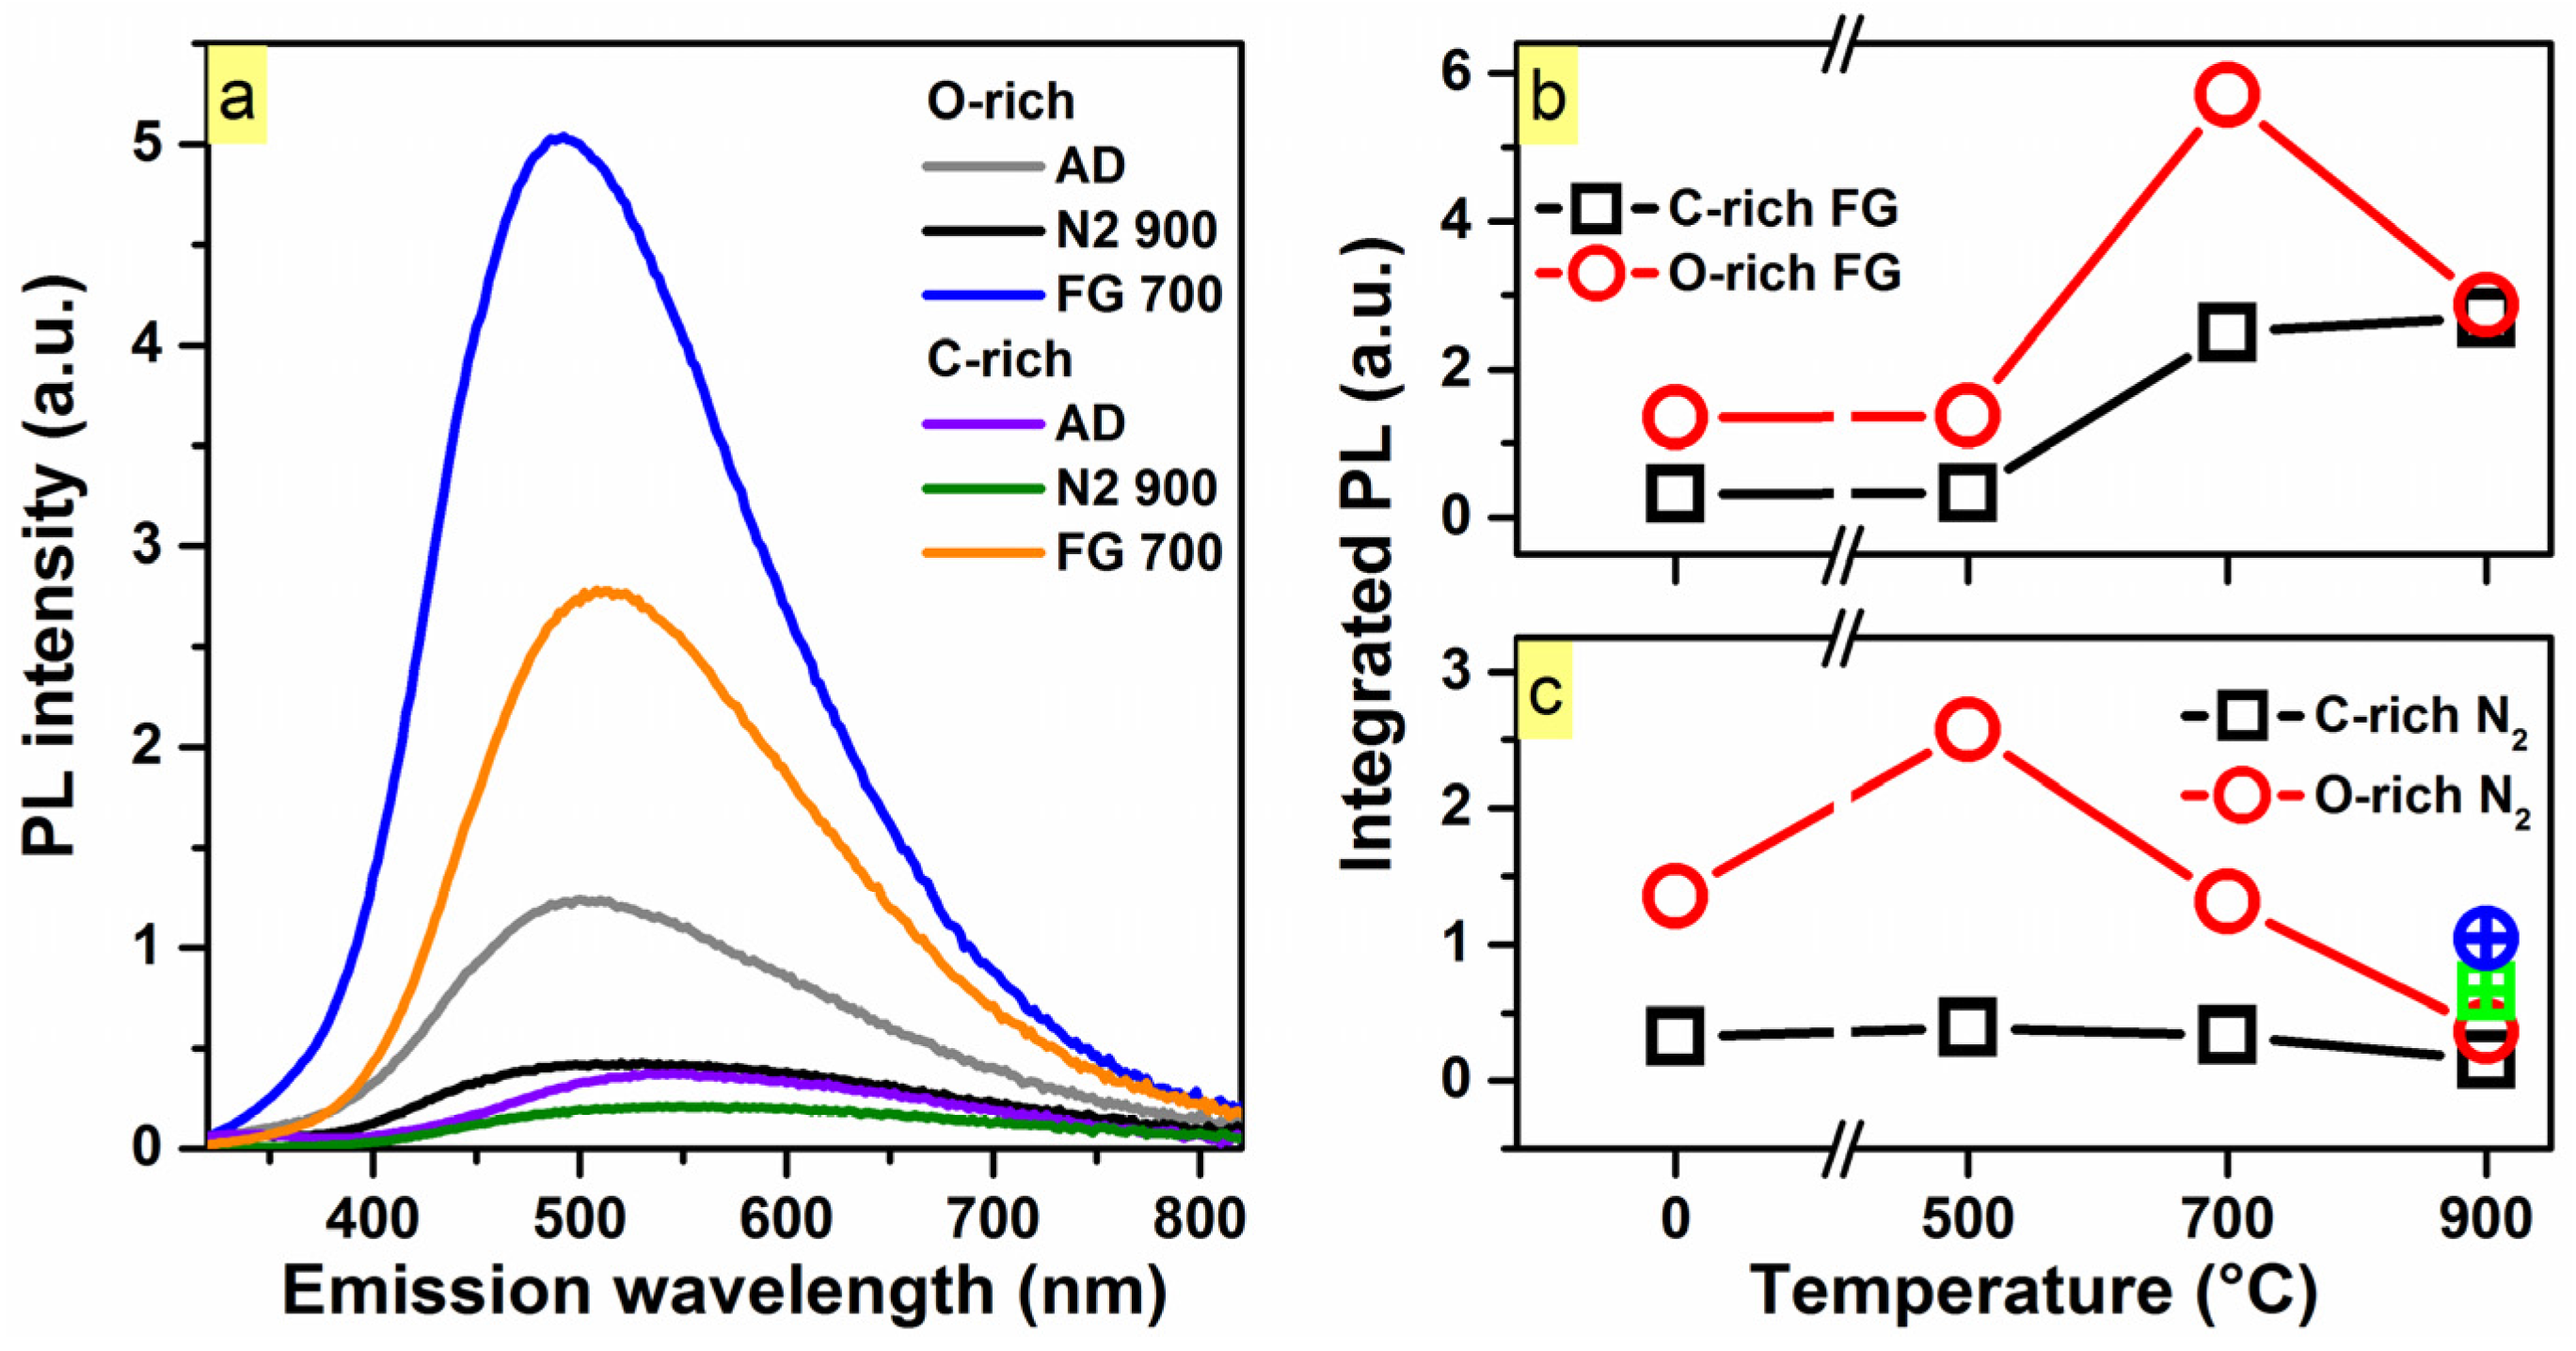
Figure 2.
IPL of both compositions of SiCxOy thin films and nanowires (NWs) related to the carbonyl bond area from the infrared absorption spectra. It was observed that the IPL of the films dropped in an exponential fashion with respect to the carbonyl bond area present in the material by ~50 times. Gray dashed line is a guide-to-eye. Solid blue, black, and red points correspond to the O-rich FG 700 °C, as-deposited, and N2 900 °C samples respectively. Solid green square corresponds to the C-rich N2 900 °C sample. Inset: Infrared absorption spectra depicting the modulation of the carbonyl bonding present in the as-deposited, FG 700 °C, and N2 900 °C passivated O-rich samples, as well as the N2 900 °C passivated C-rich sample.
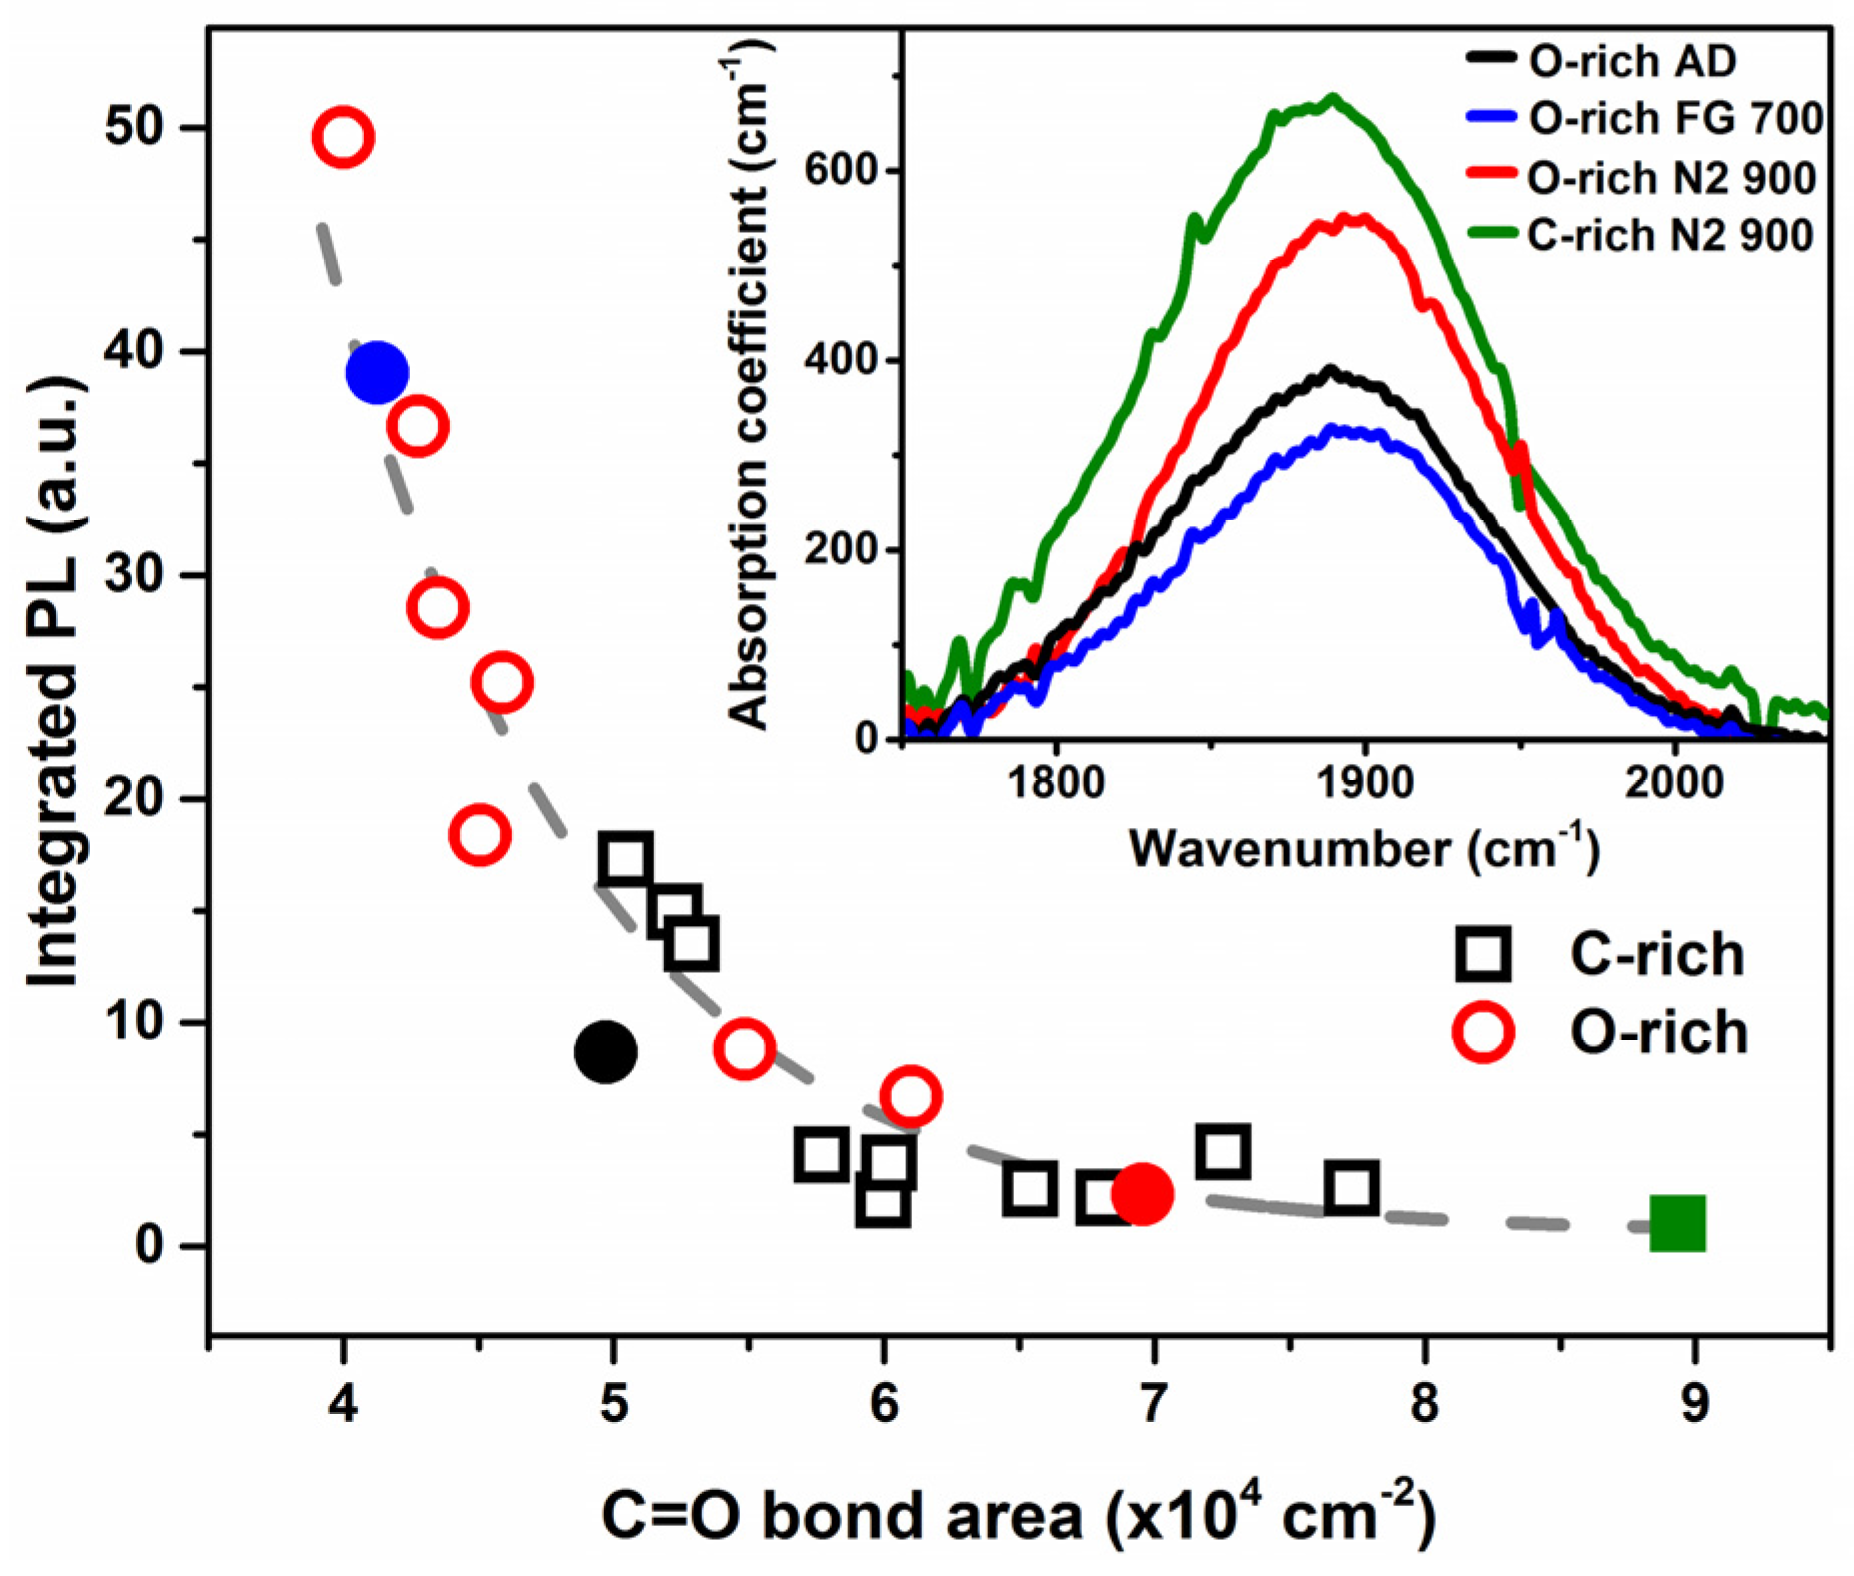
Figure 3.
(a) Urbach energy (Eu) of both compositions of SiCxOy related to the carbonyl bond area from the infrared absorption spectra. Eu was determined based on the following equation, , where α is the absorption coefficient, α0 is a constant, and Eu is the Urbach energy. Eu energies are correlated linearly and trend upward with increasing carbonyl (gray dashed lines), suggesting increasing band tail width with increasing carbonyl. Inset: The absorption coefficient (α) as a function of energy for the O-rich as-deposited, FG 700 °C, and N2 900 °C passivated samples. Increased sub-E04 gap absorption was seen in the case of the 900 °C N2-annealed SiCxOy thin film; (b) E04 of both compositions of SiCxOy related to the carbonyl bond area. The E04 values decrease with increasing carbonyl present in the films. Gray dashed line is a guide-to-eye.

Figure 4.
(a) Temperature-dependent steady-state photoluminescence spectra of the N2 900 °C (solid) and FG 700 °C passivated (dashed) O-rich sample under 400 nm excitation. Two components were observed at ~470 and ~580 nm; (b) IPL as a function of temperature for the corresponding passivated samples. The N2-passivated sample exhibited stronger temperature dependence, with the IPL nearly doubling from 300 to 140 K.

Figure 5.
Temperature dependence behavior of (a) the IPL and (b) luminescence lifetime for the ~470 and ~580 nm components deconvoluted from the spectra of the N2 900 °C passivated SiC0.3O1.6 sample. A monotonic increase in the IPL of the 580 nm component was observed as temperature was decreased, which was also reflected in the luminescence lifetime. The IPL of the 470 nm component increased until 140 K, and then decreased as temperature was lowered to 77 K. Below room temperature, the apparent luminescence lifetime of the 470 nm component plateaued around 8 ns; however, under the acquisition parameters used during the measurement, the ~8 ns extracted is not the lifetime, but is the upper limit of the measurement, with the values exhibiting a standard deviation of ± 2.2 ns below 250 K. Inset: Time-resolved photoluminescence (TRPL) spectrum of the 470 nm component acquired at 140 K with a microsecond flashlamp (repetition rate of 1 Hz).
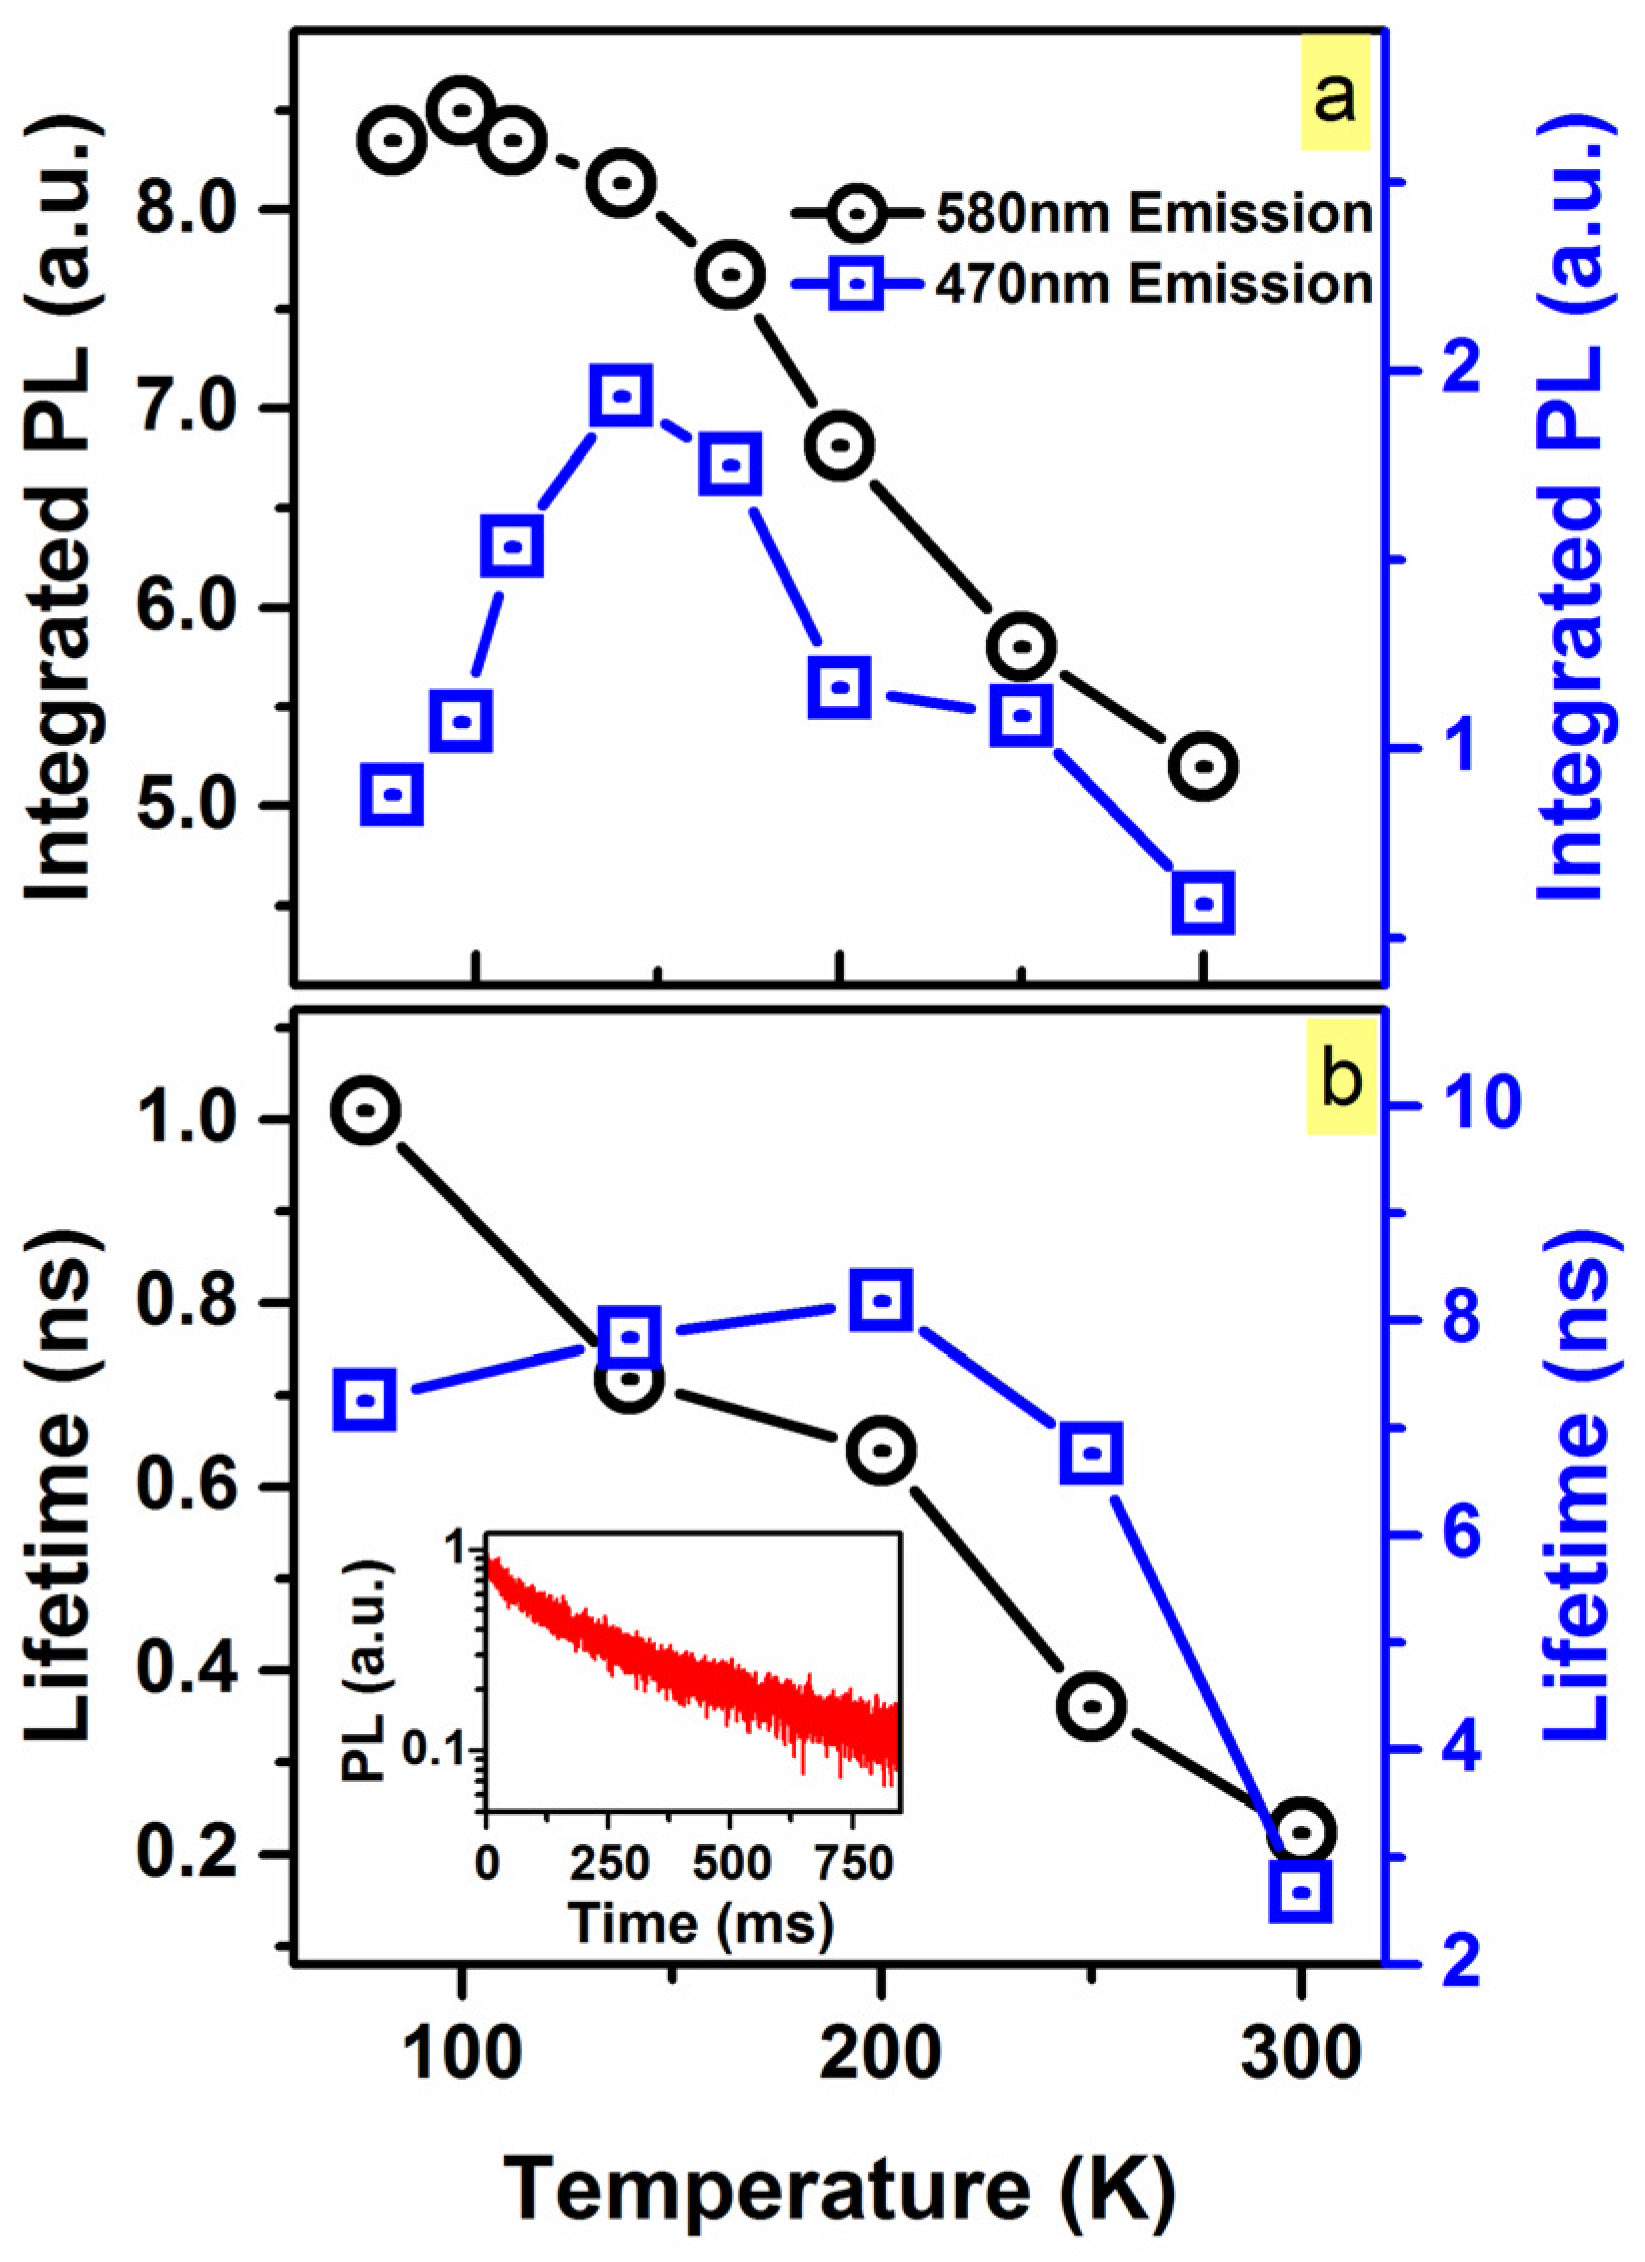
Figure 6.
Time evolution of the steady-state PL of the N2 900 °C passivated SiC0.3O1.6 sample at 77 K. (a) Over the first few hundreds of picoseconds, the PL of the ~580 nm component dominates the spectrum before decaying completely; (b) Beyond one nanosecond, the ~470 nm component persists in the spectrum up to 50 ns (measurement upper limit-20 MHz repetition rate).
© 2017 by the authors. Licensee MDPI, Basel, Switzerland. This article is an open access article distributed under the terms and conditions of the Creative Commons Attribution (CC BY) license (http://creativecommons.org/licenses/by/4.0/).
Share and Cite
MDPI and ACS Style
Ford, B.; Tabassum, N.; Nikas, V.; Gallis, S. Strong Photoluminescence Enhancement of Silicon Oxycarbide through Defect Engineering. Materials 2017, 10, 446. https://doi.org/10.3390/ma10040446
AMA Style
Ford B, Tabassum N, Nikas V, Gallis S. Strong Photoluminescence Enhancement of Silicon Oxycarbide through Defect Engineering. Materials. 2017; 10(4):446. https://doi.org/10.3390/ma10040446
Chicago/Turabian StyleFord, Brian, Natasha Tabassum, Vasileios Nikas, and Spyros Gallis. 2017. "Strong Photoluminescence Enhancement of Silicon Oxycarbide through Defect Engineering" Materials 10, no. 4: 446. https://doi.org/10.3390/ma10040446
Note that from the first issue of 2016, this journal uses article numbers instead of page numbers. See further details here.