
Prediction Model for the Carbonation of Post-Repair Materials in Carbonated RC Structures


Department of Architectural Engineering, Hanyang University, 1271 Sa 3-dong, Sangrok-gu, Ansan 15588, Korea
*
Author to whom correspondence should be addressed.
Materials 2017, 10(5), 492; https://doi.org/10.3390/ma10050492
Submission received: 29 March 2017
/
Revised: 24 April 2017
/
Accepted: 28 April 2017
/
Published: 3 May 2017
Abstract
:Concrete carbonation damages the passive film that surrounds reinforcement bars, resulting in their exposure to corrosion. Studies on the prediction of concrete carbonation are thus of great significance. The repair of pre-built reinforced concrete (RC) structures by methods such as remodeling was recently introduced. While many studies have been conducted on the progress of carbonation in newly constructed buildings and RC structures fitted with new repair materials, the prediction of post-repair carbonation has not been considered. In the present study, accelerated carbonation was carried out to investigate RC structures following surface layer repair, in order to determine the carbonation depth. To validate the obtained results, a second experiment was performed under the same conditions to determine the carbonation depth by the Finite Difference Method (FDM) and Finite Element Method (FEM). For the accelerated carbonation experiment, FDM and FEM analyses, produced very similar results, thus confirming that the carbonation depth in an RC structure after surface layer repair can be predicted with accuracy. The specimen repaired using inhibiting surface coating (ISC) had the highest carbonation penetration of 19.81, while this value was the lowest for the corrosion inhibiting mortar (IM) with 13.39 mm. In addition, the carbonation depth predicted by using the carbonation prediction formula after repair indicated that that the analytical and experimental values are almost identical if the initial concentration of Ca(OH)2 is assumed to be 52%.
Keywords:
carbonation; repair; prediction; post repair; carbonation depth; FEM analysis; FDM analysis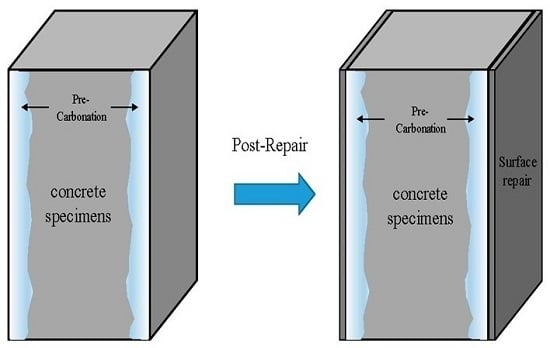
1. Introduction
Concrete carbonation is one of the main causes for the deterioration of reinforced concrete (RC) structures. This phenomenon is caused by the penetration of atmospheric CO2 into the concrete, resulting in decreased basicity [1,2,3,4,5,6]. Concrete carbonation is a complex physicochemical process that takes place upon prolonged exposure to atmospheric CO2. The concentration of CO2 is variable and depends on the different climatic and atmospheric conditions. Generally, 0.03% CO2 is present in normal air while in industrially polluted environment, it could reach around 0.3% and at such concentrations, CO2 can penetrate easily if there is no protection applied on the concrete cover [7,8]. This process destroys the passive film that surrounds the reinforcement bars exposing them to corrosive attack [9,10,11,12,13,14].
The carbonation of concrete is one of the most disruptive processes that affects the durability of concrete and causes a significant reduction in its service life [15,16].
Reinforcement bars can be inflated due to corrosion, which causes the concrete to crack, resulting in decreased strength of the member and degradation of its structural durability. This problem has necessitated the repair of many RC structures in recent times. However, there has been almost no study on post-repair concrete carbonation. Many researchers have proposed carbonation estimation equations, which enable the prediction of the carbonation depth. Such equations were based on results obtained under conditions of indoor accelerated carbonation and exposure experiments, which were performed on concrete that had not undergone repair. Such tests have also been used to develop equations to evaluate the carbonation depth from which the endurance life of concrete can be predicted.
The reduction in durability of RC structures can be caused by a destruction of concrete or the corrosion of the reinforcement bars or a combination of both [17].
In the report by RILEM, it was stated that a high amount of CH and CSH in concrete might reduce the penetration of CO2 [18], but until now it is a controversial topic. It has also been reported that both the type of filler and the cement paste composition play major roles.
A prognosis durability model has been discussed by Czarnecki and Woyciechowski (2013) for the repair of RC structures that suffered carbonation and chloride attack [19].
Neves et al. [20] examined the carbonation resistance of concrete by measuring its gas permeability. Kuosa et al. [21] presented an equation to predict the carbonation caused only by freezing and thawing, from which the endurance life of the concrete could be evaluated. Duprat et al. [22] conducted accelerated carbonation tests on unrepaired concretes for a probabilistic durability prediction. Kashef-Haghighi et al. [23] developed a mathematical model of CO2 absorption based on an accelerated carbonation test on concrete without repair materials. Silva et al. [24] investigated the carbonation process in recycled aggregate concretes, while Hills et al. [25] statistically analyzed the carbonation rate in concretes containing no repair materials. Also, the Korea Concrete Institute (KCI) [26] predicted the rate of carbonation as a function of the water/binder (W/B) ratio.
While the previous studies mentioned above have predicted the carbonation of only concrete without considering repair materials, there have been several other works which have also taken repair materials into consideration in their studies. The accelerated carbonation test for the durability of concrete was mentioned in the Chinese National Standard GB/T 50082-2009 titled “Standard for test methods of long-term performance and durability of ordinary concrete” [27]. The Architectural Institute of Japan (AIJ) [28] also assigned coefficients to different types of repair materials for the prediction of carbonation. In addition, Köliö et al. [29] investigated the corrosion of a reinforcement bar induced by the carbonation of a concrete repair material additive. However, the carbonation prediction equations derived in these studies only considered the carbonation in the original concrete, or carbonation in a concrete to which a repair material had already been applied.
Liu et al. have proposed a mechanism to understand the effect of carbonation and chloride aerosol attack in ordinary Portland cement concrete using 20% CO2 [30]. On the other hand, Mohammed et al have investigated the 100% carbonation of self-compacting concrete and found that the replacement of limestone powder (LP) increased the depth of carbonation during the accelerated test, whereas there was no effect if fly ash (FA) or a combination of fly ash and silica fume (FA + SF) was used [31]. Since there are only a few reports on the accelerated carbonation in post-repair carbonated concrete, especially with respect to experimental and analytical data, there is a need to investigate this phenomenon. Therefore, in the present study, we have focused on concrete structures in which carbonation was already underway. Carbonated building structures were simulated by accelerated carbonation as a sequel to surface repair. The carbonation coefficients for different repair materials were compared by conducting accelerated carbonation tests using 20% CO2 [31,32]. From the values of carbonation coefficients obtained for the different repair materials, the progress of carbonation was predicted using the prediction equation for post-repair carbonation. The reliability of the predicted carbonation depths was examined using both the Finite Difference Method (FDM) and the Finite Element Method (FEM).
2. Experimental
2.1. Experimental Design
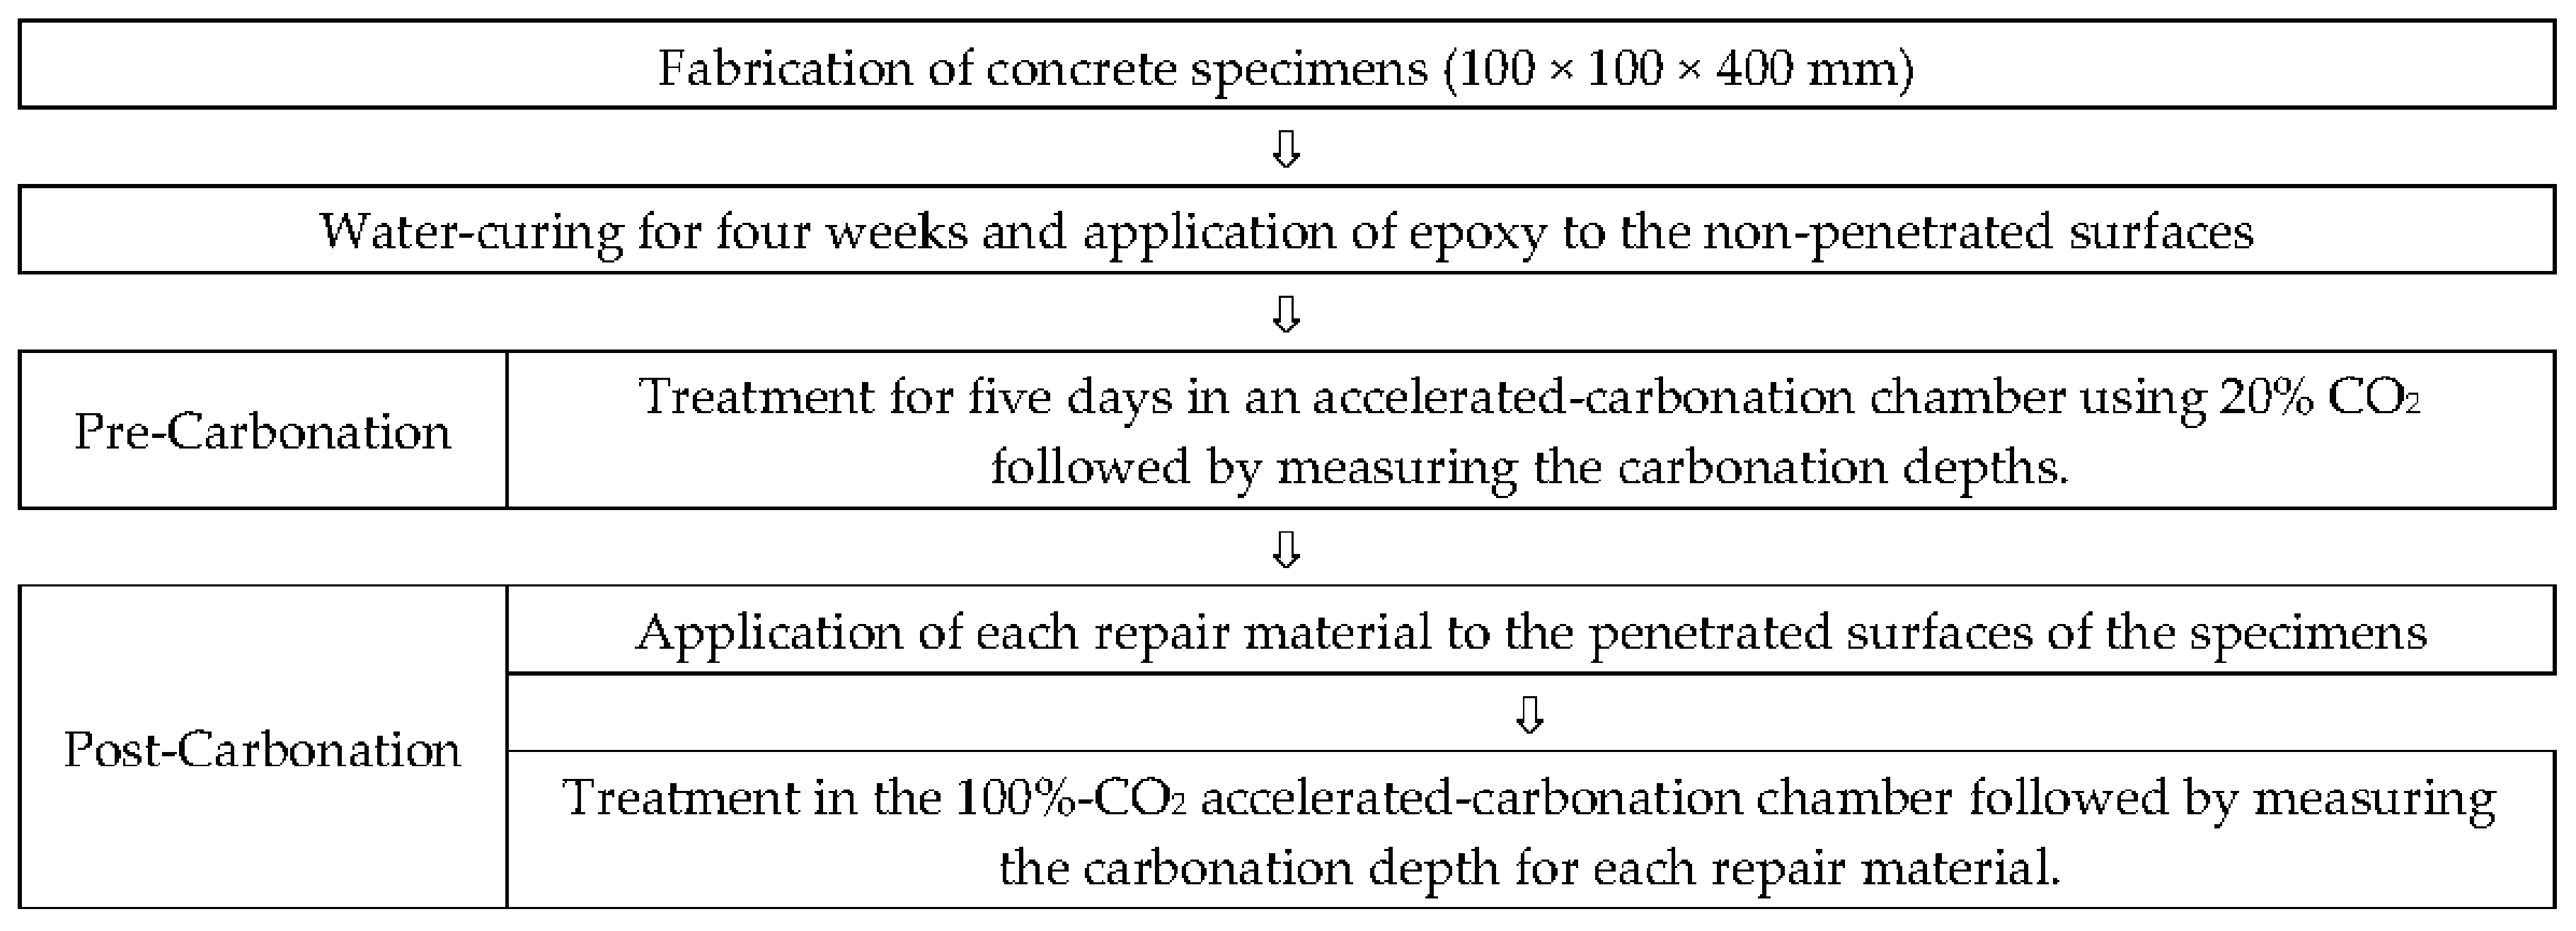
The experiments were grouped according to the nature of the repair materials present; each set of sample was tested in triplicate. The considered repair materials were Organic Alkaline Inhibitor (OAI), Inhibiting Surface Coating (ISC), Corrosion-Inhibiting Mortar (IM), and Water-Based Paint (WP). Table 1 lists the concrete compositions. The concrete specimens were fabricated with a water/cement ratio of 55% using a 100 × 100 × 400 mm3 concrete mold. As described in Figure 1, after curing the specimens in water for 28 days, epoxy was applied to the non-penetrated surface. The specimens were subsequently pre-carbonated for five days in a 20%-CO2 accelerated-carbonation chamber (20 °C and 60% Relative Humidity) and the carbonation depths were measured by the KS F 2596 method [33]. Each repair material was then applied to the penetrated surfaces of the specimens, which were treated again in the 20%-CO2 accelerated-carbonation chamber. The carbonation depths were measured again.
2.2. Selected Materials
Type 1 general-purpose Portland cement was used. Table 2 gives the physical properties of the employed OAI, the main ingredient of which was (CH3)2NCH2CH2OH with a pH of 11.9, and specific gravity of 1.07. The ISC material contained latex with a viscosity of <20 centipoise (CPS). The IM had a solid acrylic polymer content of >98% and a pH in the range 6.5–8.5. The WP used was mainly composed of an acrylic emulsion resin and had a density of 1.63 g/cm3.
2.3. Fabrication of Specimens and Experimental Method
Figure 2 describes the application of the repair materials to the concrete specimens. In the experiments to predict concrete carbonation after surface repair, epoxy was applied to the surfaces that were not penetrated by CO2. The pre-carbonation was performed for five days in a 20% CO2 accelerated-carbonation chamber, after which the specimens were split to measure the carbonation depth. The same experiment was repeated by applying other repair materials on the surfaces of the concrete specimens after pre-carbonation and the corresponding carbonation depths were measured. The thickness of the repair materials WP and IM were measured by a non-destructive technique using Elcometer 456 (Elcometer, Tokyo, Japan), while for OAI and ISC, this was carried out using a caliper at different places on the concrete surface. Table 3 gives the thickness of each repair material that was applied. IM exhibited higher thickness while OAI spread all over the surface through the pores in the concrete. OAI is a liquid while ISC is a viscous material. Therefore, it is noted here that the thicknesses of the different applied repair materials are different.
3. Experimental Results and Analysis
3.1. Carbonation Depth and Rate after Repair
3.1.1. Carbonation Depth after Repair
Figure 3 shows the physical carbonation depths of split specimens. The measurement was done in accordance with KS F 2596 [20] after the repair materials had been left to dry for 7 days. This figure clearly shows that after spraying of phenolphthalein indicator on specimens, IM exhibited minimum spreading. This result indicates that IM repair material has minimum carbonation. A second carbonation process was then performed on the specimens in the 20% CO2 carbonation chamber under the same conditions as the pre-carbonation. The carbonation depths were then measured again for 7 and 28 days after the initiation of the carbonation process.
Figure 4 also shows the measured carbonation depths for 7 days after the initiation of accelerated carbonation following the application of the repair materials and error bar for corresponding specimens. It can be observed that the unrepaired specimen has a carbonation depth of about 14.98 mm, which is 4.85 mm greater than that after pre-carbonation. This figure shows the carbonation depth after the application of the repair materials as well as that obtained under accelerated conditions. Comparison of the carbonation depths after 28 days for the different repair materials reveals that the value for ISC is the highest (~19.81 mm), while that for IM is the lowest (13.39 mm). It is may be due to that IM contain acrylic polymer that resist the penetration of CO2 toward concrete and work as barrier.
3.1.2. Carbonation Rate
To compare the concrete carbonation rates for the different repair materials, it is necessary to correct for the 20% CO2 concentration during accelerated carbonation test, so that the results will be applicable to normal atmospheric conditions. The carbonation coefficient was calculated using Equation (1) [24]. The results are given in Table 4.
where C is the carbonation depth (mm), t is the time (year), A is the carbonation coefficient () and CO2 is the CO2 concentration in the atmosphere (%).
As can be observed from above table, the carbonation coefficient is different for the various specimens tested. The Unrepaired specimen shows a value of 9.4 , while the specimen repaired by IM has a low value of only 1.5 .
The carbonation rate for each repair material can be determined using Equation (2). The carbonation rate is the ratio of the carbonation coefficient of the specimen using a given repair material () to that of the unrepaired specimen (A), which is assumed to be 100%. The carbonation rate can be assessed based on Equation (2).
where is the carbonation coefficient of the specimen with a given repair material (), and A is the carbonation coefficient of the unrepaired specimen ().
Figure 5 shows the comparison of the carbonation rates of the different specimens. The specimen repaired with ISC has the highest carbonation rate, which implies that it has the lowest carbonation resistance. The specimens repaired with WP and OAI have carbonation rates of 44.2% and 30.8%, respectively, with the IM-repaired specimen having the lowest value of 28.8%, pointing to the best carbonation resistance. This result is attributed to the fact that moisture permeation is blocked by the acrylic polymer which was tightly bound to the interface of the concrete.
3.2. Prediction of the Progress of Post-Repair Carbonation Depth by Accelerated Carbonation Test
Figure 6 compares the predicted progression of the carbonation depth for the different repair materials up to 100 years of age. The carbonation depth after 10 years of repair by IM is 4.74 mm, from which it can be deduced that the repair affords a carbonation resistance effect of about 25.26 mm compared to the unrepaired sample. Table 5 compares the carbonation depths for the different repair materials.
A comparison of the carbonation depth values revealed that it is up to 30 mm for the unrepaired specimen after 10 years, which is close to the thickness of the concrete surface layering in the unrepaired specimen. The predicted progression of the carbonation depth in each of the specimens containing repair materials was around 10 mm or lower.
To compare the predicted post-repair progression of carbonation for different repair materials, the carbonation coefficients previously obtained for the repair materials were plugged in. The equations used to predict the progress of the respective post-repair carbonation process are presented in Table 6.
In the case of the unrepaired specimen, the equation to predict the geometric carbonation progress can be derived to be , while the equation for the case using the repair material WP is .
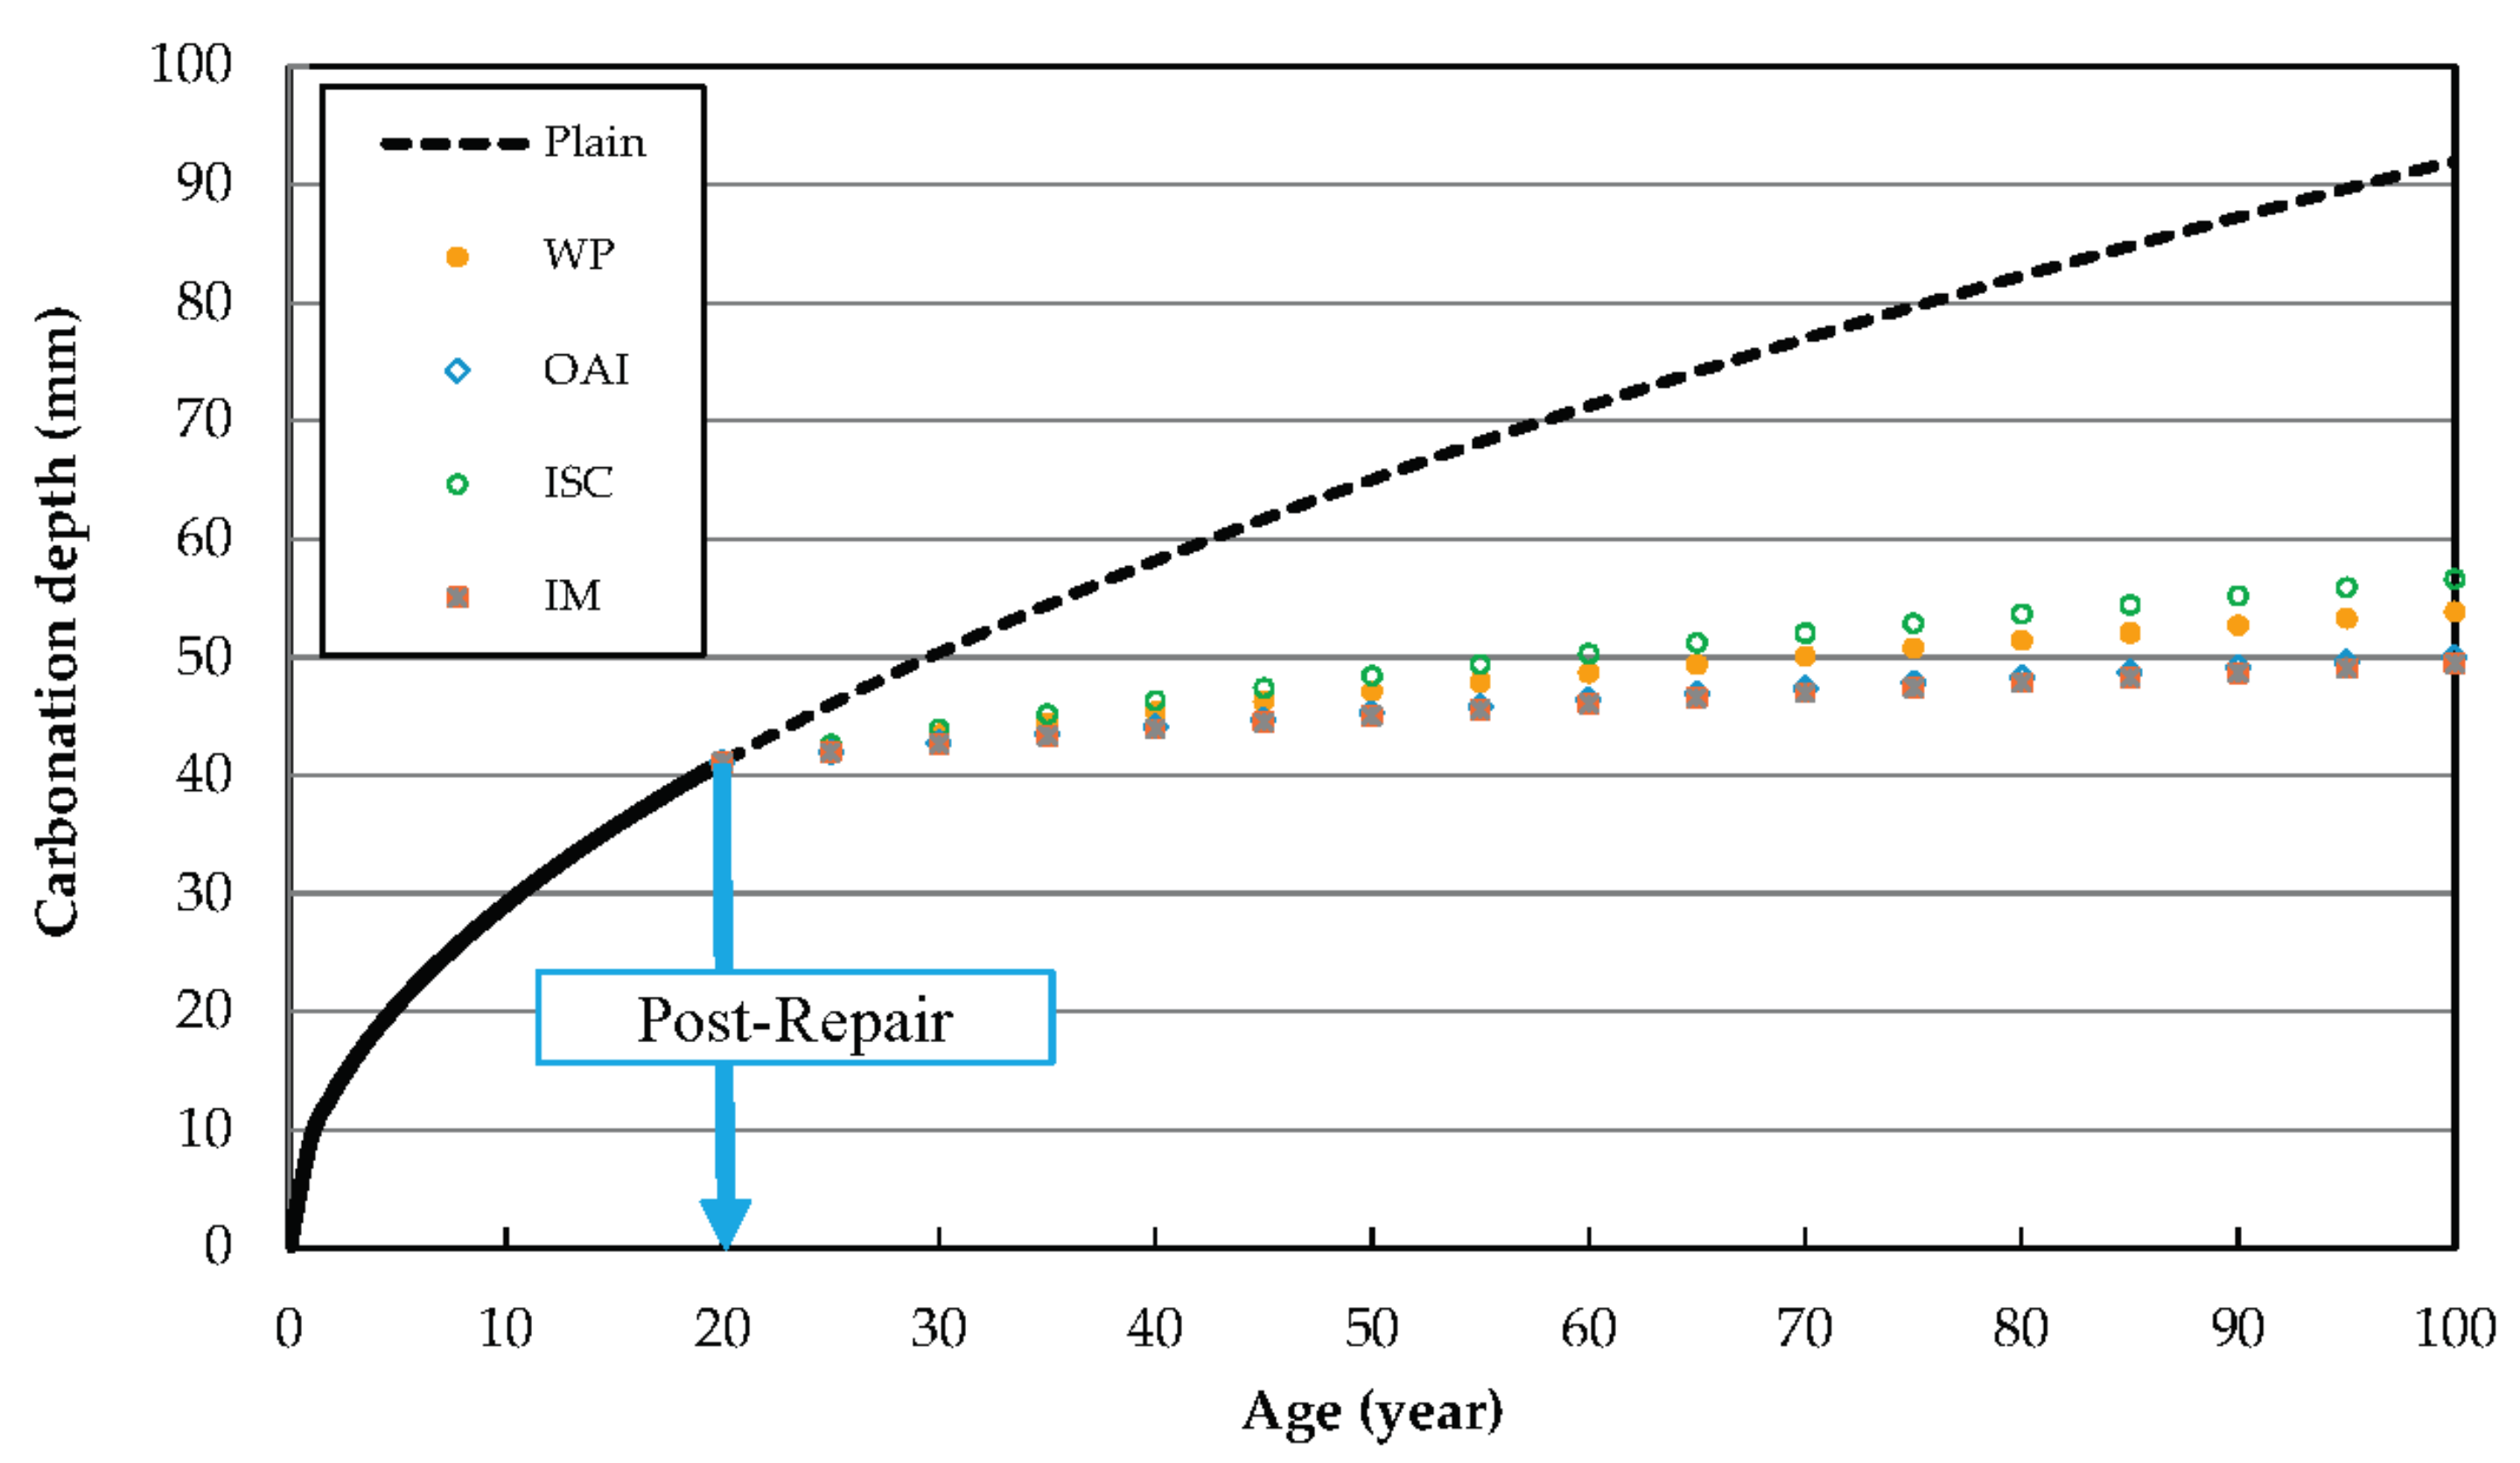
Figure 7 shows the predicted post-repair progression of carbonation. The plots are graphical representations of the carbonation progress prediction equations shown in Table 6. As can be observed, the sample repaired using ISC shows 56.6 mm penetration over 100 years, while using WP results in a carbonation penetration of 53.8 mm in just 20 years. Moreover, 20 years after repair with IM, the carbonation resistance effect is ~42.5 mm relative to the unrepaired sample.
3.3. Prediction of Post-Repair Carbonation by Finite Element Method (FEM) and Finite Difference Method (FDM)
3.3.1. FEM Analysis of Post-Repair Carbonation Depth
FEM analysis was performed using the LECCA2 program from the Architectural Institute of Japan to predict the depth of carbonation by considering the applied repair materials [28]. The input conditions for the analysis include a temperature of 20 °C with 60% humidity as indicated in Table 7.
The cover thickness of the reinforcement bar was assumed to be 30 mm and it was also assumed that the fundamental material properties of concrete were applicable to the fabricated specimens. Equations (3) and (4), which are the carbonation prediction equations provided by AIJ, were used for the FEM analysis [28].
Here, is the carbonation depth (mm), t is the time (year), is the coefficient of Repair 1, is the coefficient of Repair 2, α1 is the coefficient of concrete type, α2 is the coefficient of cement type, α3 is the coefficient of W/C, β1 is the temperature, β2 represents the humidity, β3 is the CO2 concentration and k is the coefficient of Kisitani Equation or Shirayama Equation.
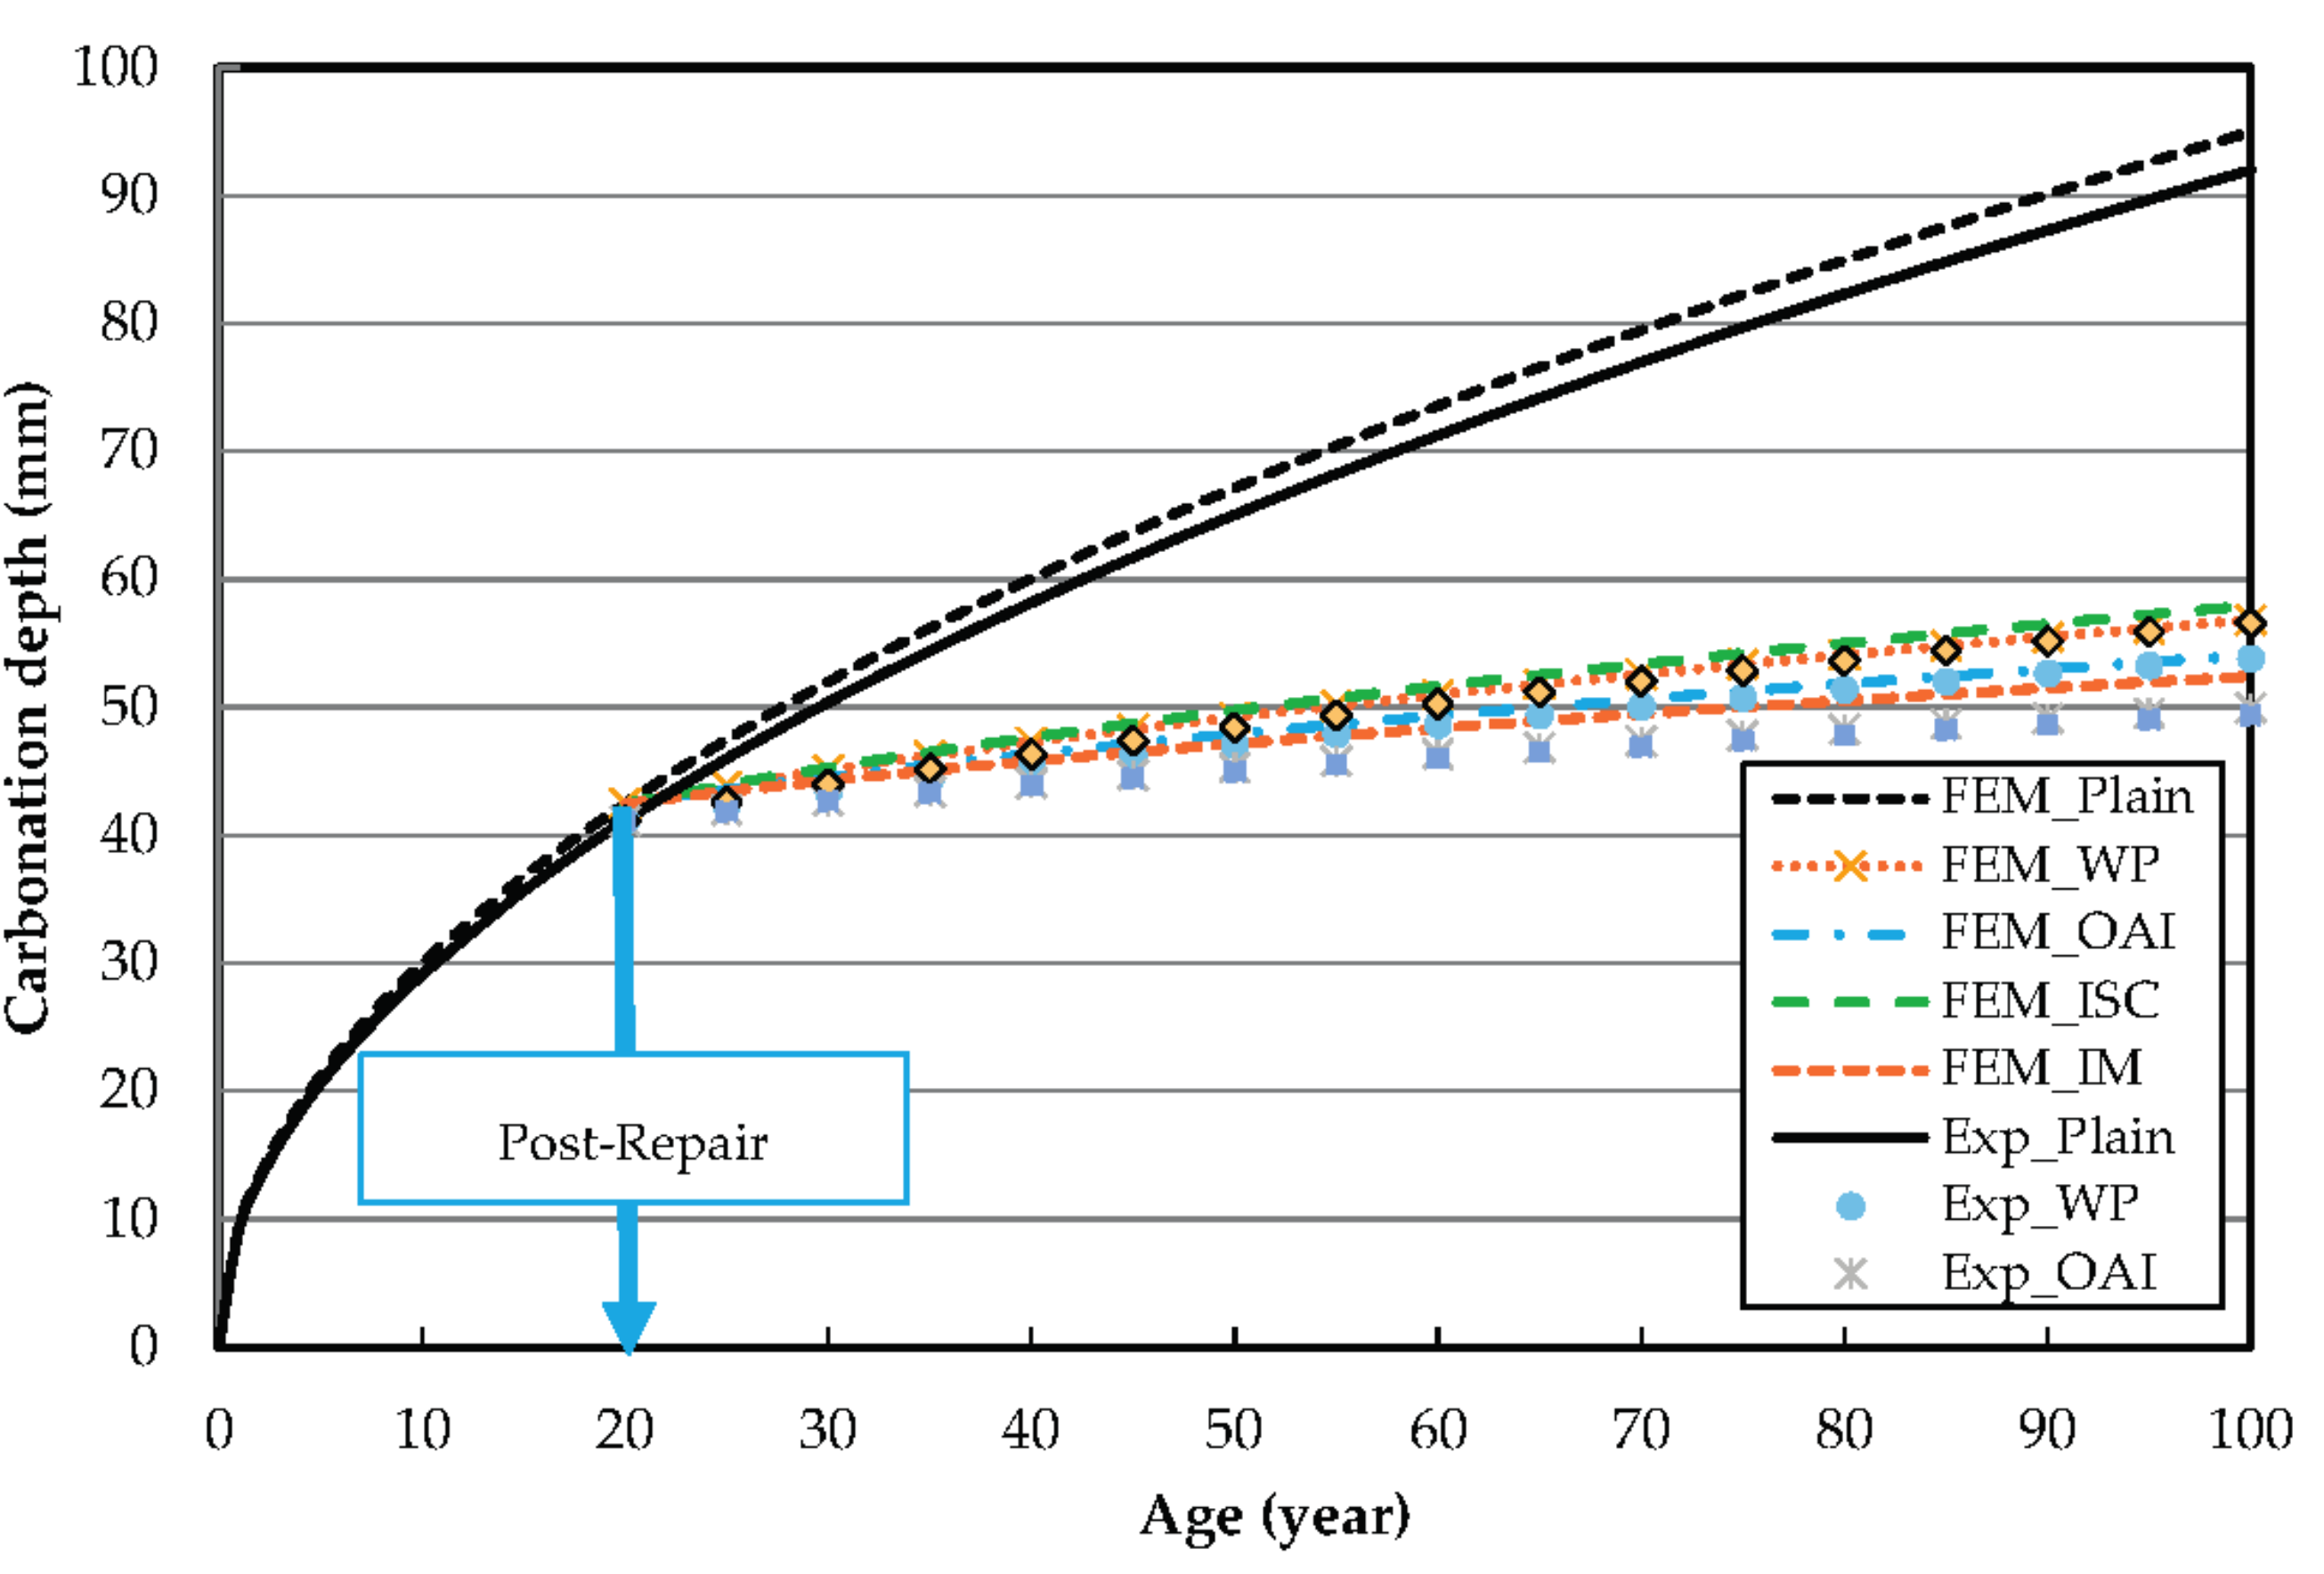
Figure 8 compares the carbonation depth values predicted by FEM analysis with the results of the accelerated carbonation tests. The FEM analysis gives information on the prediction of carbonation of repair materials exposed to accelerated carbonation with 20% CO2. It can be observed that the penetration in the unrepaired specimen after 100 years as determined by FEM analysis is only 3 mm higher than the experimentally determined value. Figure 8 shows the excellent fit of the values of carbonation depth at longer durations of exposure predicted by the model with our experimental results.
Similarly, differences of 3, 4.11, 1.34, and 3 mm can be observed for the repair materials of WP, OAI, ISC, and IM, respectively. These differences are attributed to various variables, such as the diffusion of Ca(OH)2 at the interface between the concrete and the finish coat.
3.3.2. FDM Analysis of the Post-Repair Carbonation Depth
Figure 9 shows the flowchart of the FDM analysis. The movement of CO2 in concrete was set to occur in one direction but the movement of Ca(OH)2 in the concrete was not considered. Table 8 and Table 9 specify the input variables for the concrete and repair materials, respectively [34].
The FDM analysis was conducted using various input conditions and Equation (5). It was assumed that the repair was necessitated by carbonation-induced corrosion of the reinforcement bars when the Ca(OH)2 concentration below a depth of 20 mm was reduced to 40–70% of the initial value [35].
where Dco2 is the diffusion coefficient of CO2 (m2/s), P is the air permeability (cm3 (STP) × cm/(cm2 × s × cm Hg)), and S is the solubility coefficient (mol/m3 × Pa).
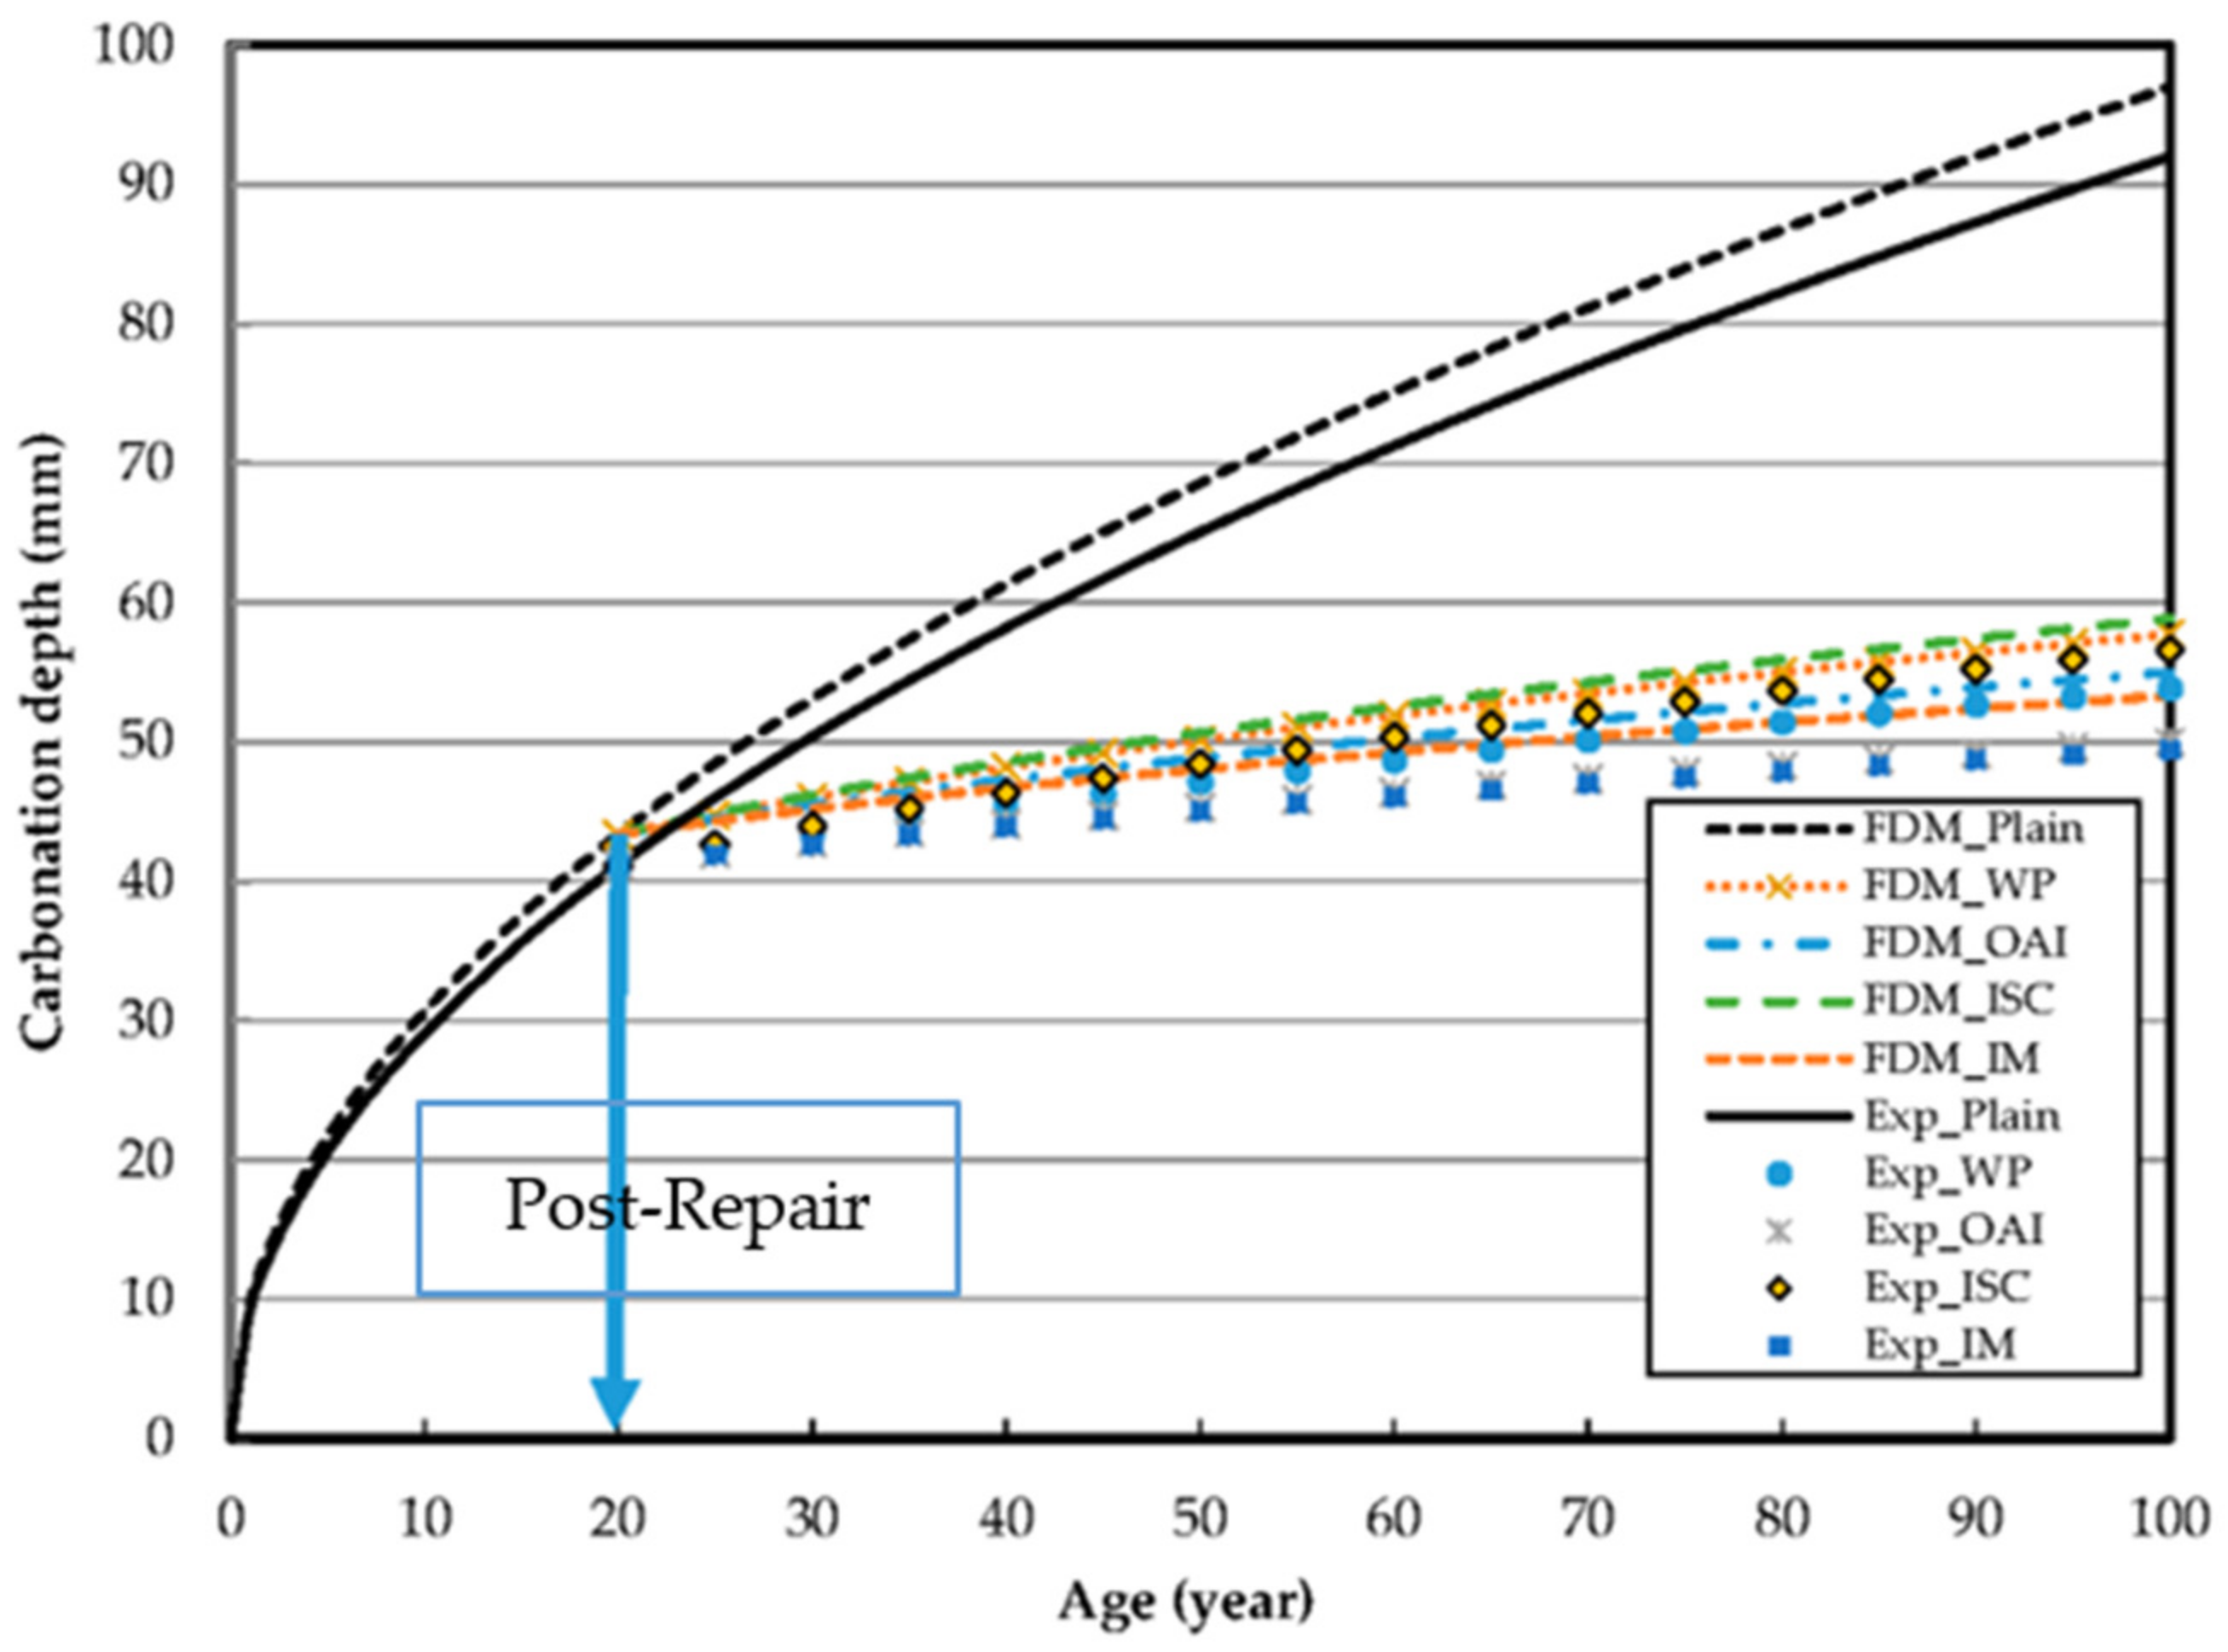
Figure 10 shows the distribution of Ca(OH)2 concentration after 20 years of repair. It is assumed that the initial concentration of Ca(OH)2 is 40% at the time of the repair using different repair materials. The predicted values for the progress of carbonation with exposure time using the FDM model agree very well with our experimental data.
4. Conclusions
In this study, the prediction of the progress of carbonation in RC structures with the repair materials following a previous carbonation process was investigated by conducting accelerated carbonation tests combined with FEM and FDM analyses. A summary of our findings is as follows:
- A comparison of the experimentally determined carbonation depths in specimens containing different repair materials revealed that the specimen repaired using ISC had the highest carbonation penetration of 19.81 mm, while that with IM had the lowest carbonation penetration of 13.39 mm. This result implies that the latter exhibited the best carbonation penetration resistance and is, consequently, the best repair material among those chosen in this study.
- The comparison of the experimental values with and those predicted from FDM analysis are in agreement, and show identical results at 52% Ca(OH)2.
- The FEM and FDM results confirmed the feasibility of predicting the carbonation rate of RC structures through accelerated tests. Its purpose of assessing the endurance life of such structures was fulfilled. Both techniques confirmed IM to be the best material to provide carbonation resistance to concrete under an atmosphere containing 20% CO2.
Acknowledgments
This research was supported by the basic science research program through the National Research Foundation (NRF) of Korea funded by the Ministry of Science, Information and Communications Technologies (ICT) and Future Planning (No. 2015R1A5A1037548).
Author Contributions
Hyung-Min Lee and Jitendra Kumar Singh conducted the experiments, analyzed the data and wrote the initial draft of the manuscript. Han-Seung Lee designed the experiments. All the authors contributed to the analysis of data, and reviewed and read the final manuscript.
Conflicts of Interest
The authors declare no conflicts of interest.
References
- Thomas, M. Chloride Thresholds in Marine Concrete. Cem. Concr. Res. 1996, 26, 513–519. [Google Scholar] [CrossRef]
- Richardson, M.G. Carbonation of Reinforced Concrete: Its Causes and Management; CITIS: Dublin, Ireland, 1988. [Google Scholar]
- Ahmad, S. Reinforcement Corrosion in Concrete Structures, Its Monitoring and Service Life Prediction—A Review. Cem. Concr. Compos. 2003, 25, 459–471. [Google Scholar] [CrossRef]
- Lin, C.; Qu, W.; Zhu, P. Life Cycle Analysis for Concrete Beams Designed with Cross-Sections of Equal Durability. Struct. Concr. 2016, 17, 274–286. [Google Scholar] [CrossRef]
- Kainiemi, L.; Eloneva, S.; Toikka, A.; Levanen, J.; Jarvinen, M. Opportunities and Obstacles for CO2 Mineralization: CO2 Mineralization Specific Frames in the Interviews of Finnish Carbon Capture and Storage (CCS) Experts. J. Clean. Prod. 2015, 94, 352–358. [Google Scholar] [CrossRef]
- Xu, Y.D. The Corrosion Characteristics and Tensile Behavior of Reinforcement under Coupled Carbonation and Static Loading. Materials 2015, 8, 8561–8577. [Google Scholar] [CrossRef]
- Ściślewski, Z. Protection of Reinforced Constructions; Arkady: Warszawa, Poland, 1999. [Google Scholar]
- Łakomy, T. Corrosion of Reinforcement in Bridges Depending on Concrete Condition in Structure. Ph.D. Thesis, Warsaw University of Technology, Warsaw, Poland, 2009. [Google Scholar]
- Stewart, M.G.; Rosowsky, D.V. Time-Dependent Reliability of Deteriorating Reinforced Concrete Bridge Decks. Struct. Saf. 1998, 20, 91–109. [Google Scholar] [CrossRef]
- Basheer, L.; Kropp, J.; Cleland, D.J. Assessment of the Durability of Concrete from its Permeation Properties: A Review. Constr. Build. Mater. 2001, 15, 93–103. [Google Scholar] [CrossRef]
- Shi, X.; Xie, N.; Fortune, K.; Gong, J. Durability of Steel Reinforced Concrete in Chloride Environments: An Overview. Constr. Build. Mater. 2012, 30, 125–138. [Google Scholar] [CrossRef]
- Huang, N.M.; Chang, J.J.; Liang, M.T. Effect of Plastering on the Carbonation of a 35-Year-Old Reinforced Concrete Building. Constr. Build. Mater. 2012, 29, 206–214. [Google Scholar] [CrossRef]
- Isgor, O.B.; Razaqpur, A.G. Finite Element Modeling of Coupled Heat Transfer, Moisture Transport and Carbonation Processes in Concrete Structures. Cem. Concr. Compos. 2004, 26, 57–73. [Google Scholar] [CrossRef]
- Aguiar, J.B.; Junior, C. Carbonation of Surface Protected Concrete. Constr. Build. Mater. 2013, 49, 478–483. [Google Scholar] [CrossRef]
- Chang, J.J.; Yeih, W.; Huang, R.; Chen, C.T. Suitability of Several Current Used Concrete Durability Indices on Evaluating the Corrosion Hazard for Carbonated Concrete. Mater. Chem. Phys. 2004, 84, 71–78. [Google Scholar] [CrossRef]
- Chang, J.J.; Yeih, W.; Huang, R.; Chi, J.M. Mechanical properties of carbonated concrete. J. Chin. Inst. Eng. 2003, 26, 513–522. [Google Scholar] [CrossRef]
- Czarnecki, L.; Emmons, P.H. Repair and Protection of Concrete; Polski Cement: Kraków, Poland, 2002. (In Polish) [Google Scholar]
- RILEM. Final report of RILEM TC 205-DSC: Durability of Self-compacting concrete. Mater. Struct. 2008, 41, 225–233. [Google Scholar]
- Czarnecki, L.; Woyciechowski, P. Prediction of the Reinforced Concrete Structure Durability under the Risk of Carbonation and Chloride Aggression. Bull. Pol. Acad. Sci. Tech. Sci. 2013, 61, 173–181. [Google Scholar] [CrossRef]
- Nevesa, R.; Fonsecac, B.S.D.; Brancob, F.; Brito, J.D.; Castela, A.; Montemor, M.F. Assessing Concrete Carbonation Resistance through Air Permeability Measurements. Constr. Build. Mater. 2015, 82, 304–309. [Google Scholar] [CrossRef]
- Kuosa, H.; Ferreira, R.M.; Holt, E.; Leivo, M.; Vesikari, E. Effect of Coupled Deterioration by Freeze–Thaw, Carbonation and Chlorides On Concrete Service Life. Cem. Concr. Compos. 2014, 47, 32–40. [Google Scholar] [CrossRef]
- Duprat, F.; Vu, N.T.; Sellier, A. Accelerated Carbonation Tests for the Probabilistic Prediction of the Durability of Concrete Structures. Constr. Build. Mater. 2014, 66, 597–605. [Google Scholar] [CrossRef]
- Kashef-Haghighi, S.; Shao, Y.; Ghoshal, S. Mathematical Modeling of CO2 Uptake by Concrete during Accelerated Carbonation Curing. Cem. Concr. Res. 2015, 67, 1–10. [Google Scholar] [CrossRef]
- Silva, R.V.; Neves, R.; Brito, J.D.; Dhir, R.K. Carbonation Behavior of Recycled Aggregate Concrete. Cem. Concr. Compos. 2015, 62, 22–32. [Google Scholar] [CrossRef]
- Hills, T.P.; Gordonc, F.; Florin, N.H.P.; Fennell, S. Statistical Analysis of the Carbonation Rate of Concrete. Cem. Concr. Res. 2015, 72, 98–107. [Google Scholar] [CrossRef]
- Korea Concrete Institute. Standard Concrete Specification and Commentary; Korea Concrete Institute: Seoul, Korea, 2009; pp. 341–342. [Google Scholar]
- GB/T 50082-2009. Standard for Test Methods of Long-Term Performance and Durability of Ordinary Concrete; Ministry of Housing and Urban-Rural Development of the People’s Republic of China: Beijing, China, 2009.
- Architectural Institute of Japan. Recommendations for Durability Design and Construction Practice of Reinforced Concrete Buildings, 2nd ed.; Architectural Institute of Japan: Tokyo, Japan, 2016; pp. 53–126. [Google Scholar]
- Köliö, A.; Honkanen, M.; Lahdensivu, J.; Vippola, M.; Pentti, M. Corrosion Products of Carbonation Induced Corrosion in Existing Reinforced Concrete Facades. Cem. Concr. Res. 2015, 78, 200–207. [Google Scholar] [CrossRef]
- Liu, J.; Qiu, Q.; Chen, X.; Xing, F.; Han, N.; He, Y.; Ma, Y. Understanding the Interacted Mechanism between Carbonation and Chloride Aerosol Attack in Ordinary Portland Cement Concrete. Cem. Concr. Res. 2017, 95, 217–225. [Google Scholar] [CrossRef]
- Mohammed, M.K.; Dawson, A.R.; Thom, N.H. Carbonation of Filler Typed Self-Compacting Concrete and Its Impact on the Microstructure by Utilization of 100% CO2 Accelerating Techniques. Constr. Build. Mater. 2014, 50, 508–516. [Google Scholar] [CrossRef]
- Park, D.C. Carbonation of Concrete in Relation to CO2 Permeability and Degradation of Coatings. Constr. Build. Mater. 2008, 22, 2260–2268. [Google Scholar] [CrossRef]
- Korean Standard. KS F 2596. Method for Measuring Carbonation Depth of Concrete; Korean Agency for Technology and Standards: Seoul, Korea, 2004.
- Japan Concrete Institute. Life Time Evaluation Program for Concrete Structures by Computation Analysis; Version 2.0; Japan Concrete Institute: Tokyo, Japan, 2010; pp. 36–38. [Google Scholar]
- Masuda, Y.; Tanano, H. Mathematical Model on Progress of Carbonation of Concrete. Concr. Res. Technol. 1991, 2, 125–134. [Google Scholar] [CrossRef]
Figure 1.
Flow chart of the experimental procedure.

Figure 2.
A description of the process of application of repair materials to concrete specimens.
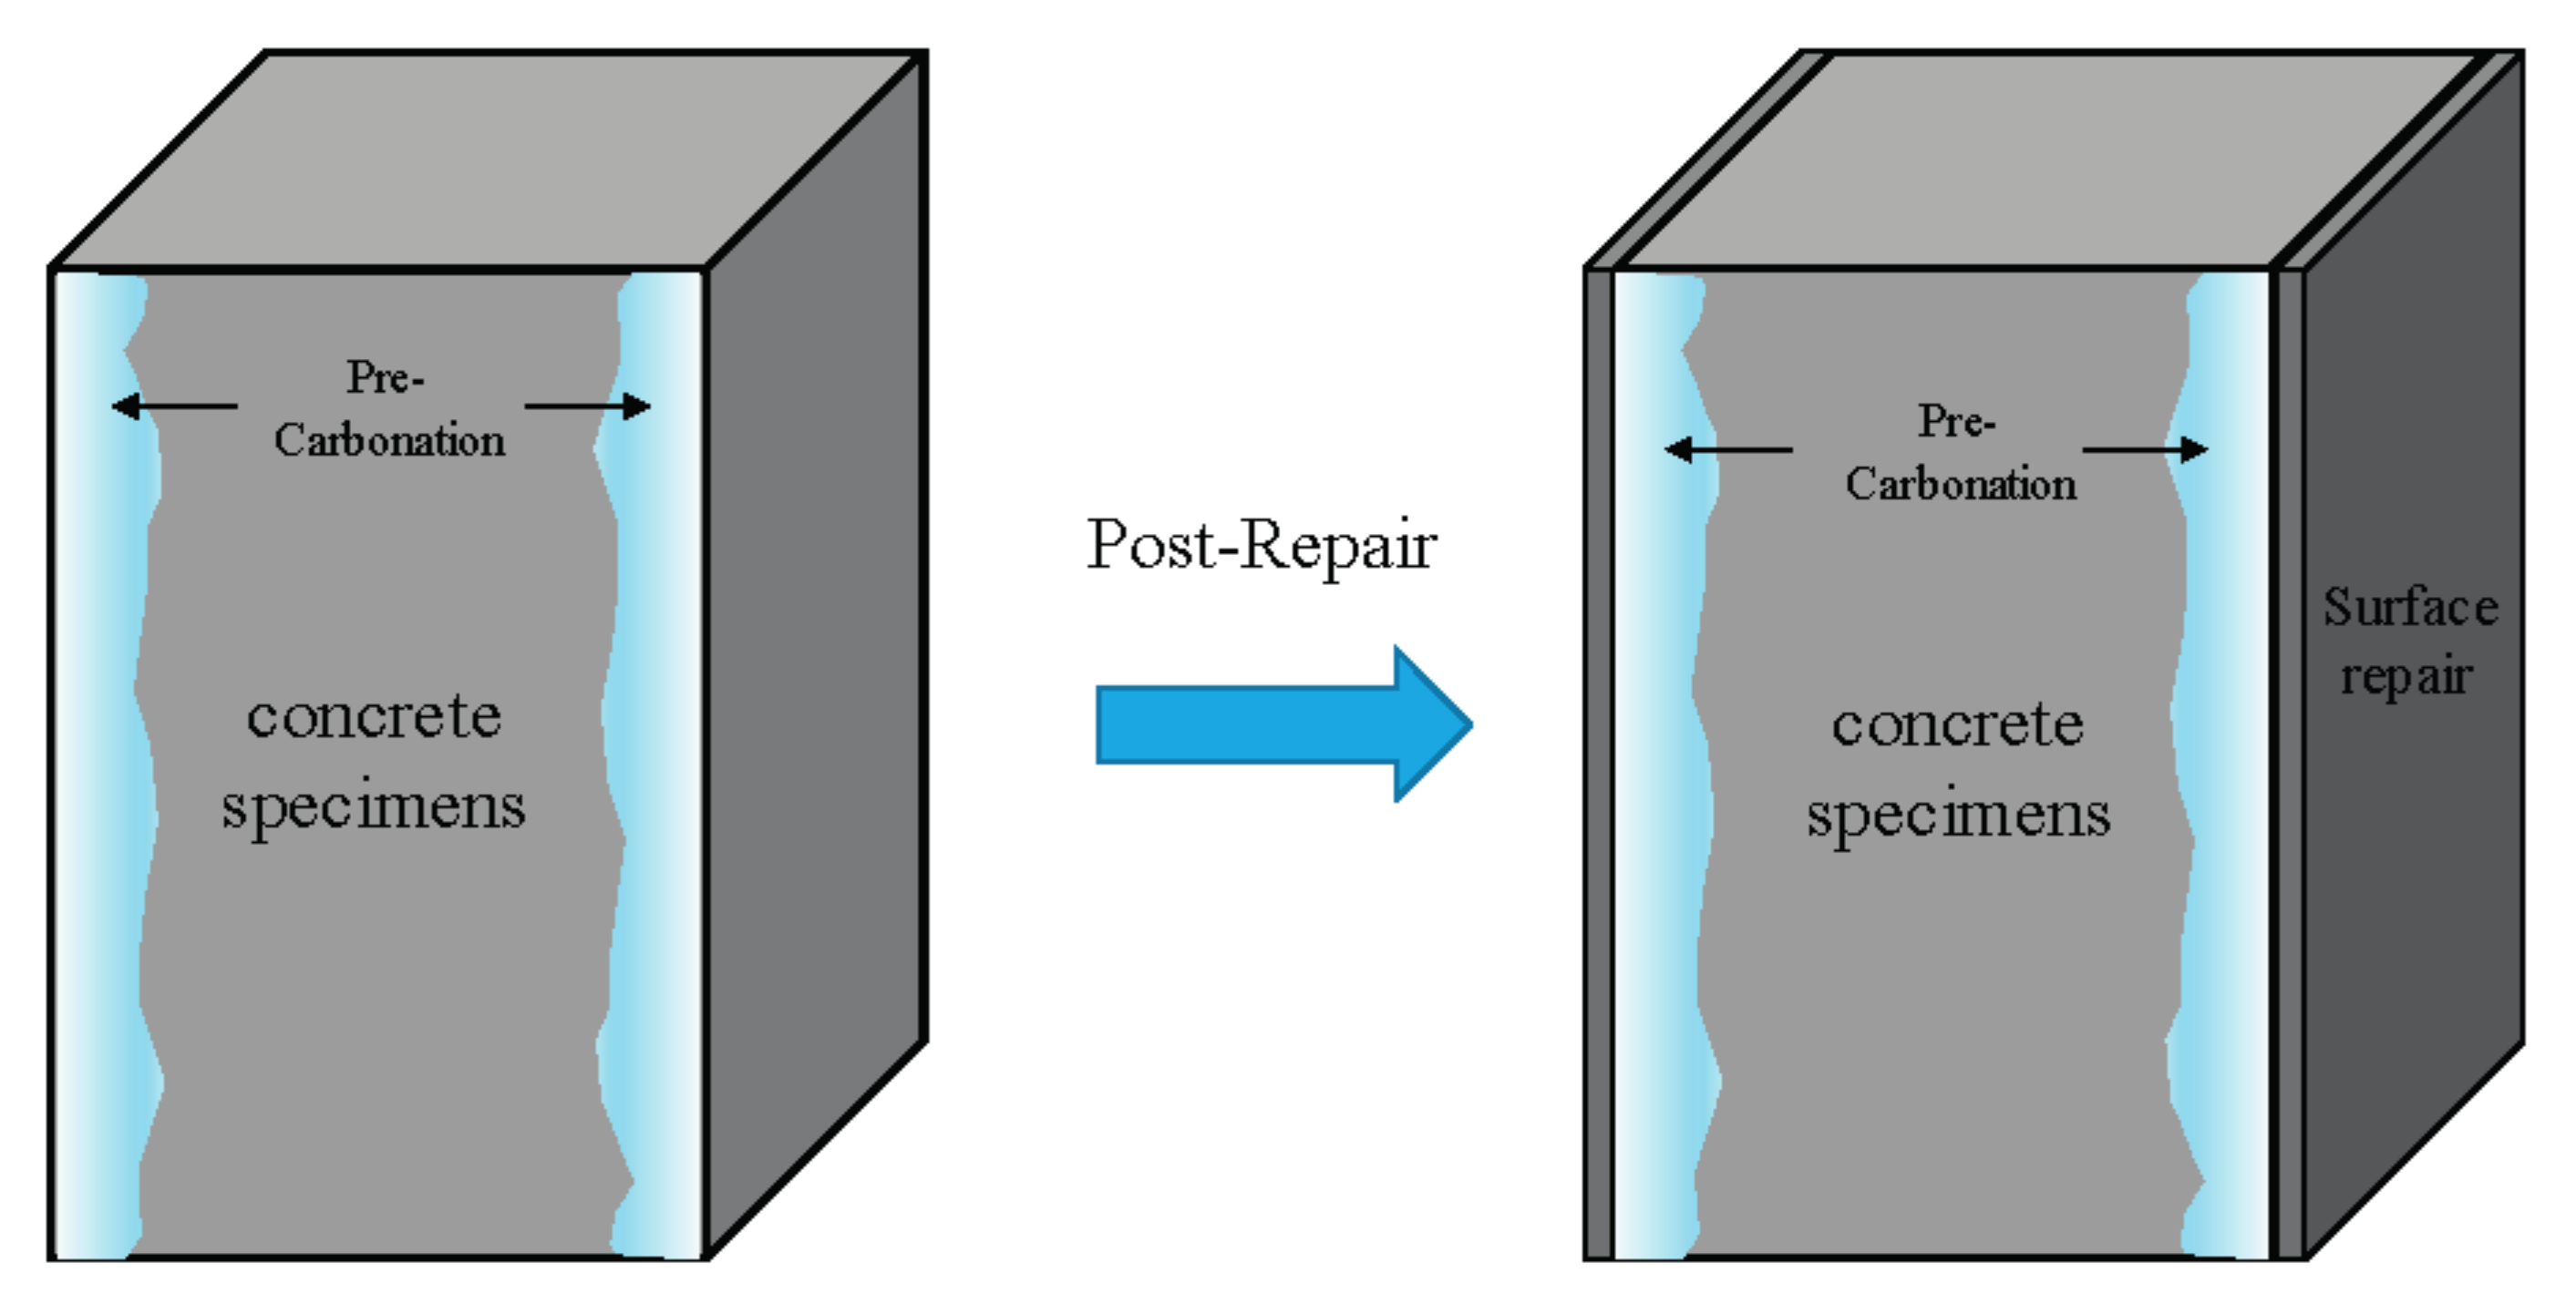
Figure 3.
Measured carbonation depths of the split specimens. (a) Unrepaired, (b) Water-Based Paint (WP), (c) Organic Alkaline Inhibitor (OAI), (d) Inhibiting Surface Coating (ISC) and (e) Corrosion-Inhibiting Mortar (IM).
Figure 3.
Measured carbonation depths of the split specimens. (a) Unrepaired, (b) Water-Based Paint (WP), (c) Organic Alkaline Inhibitor (OAI), (d) Inhibiting Surface Coating (ISC) and (e) Corrosion-Inhibiting Mortar (IM).
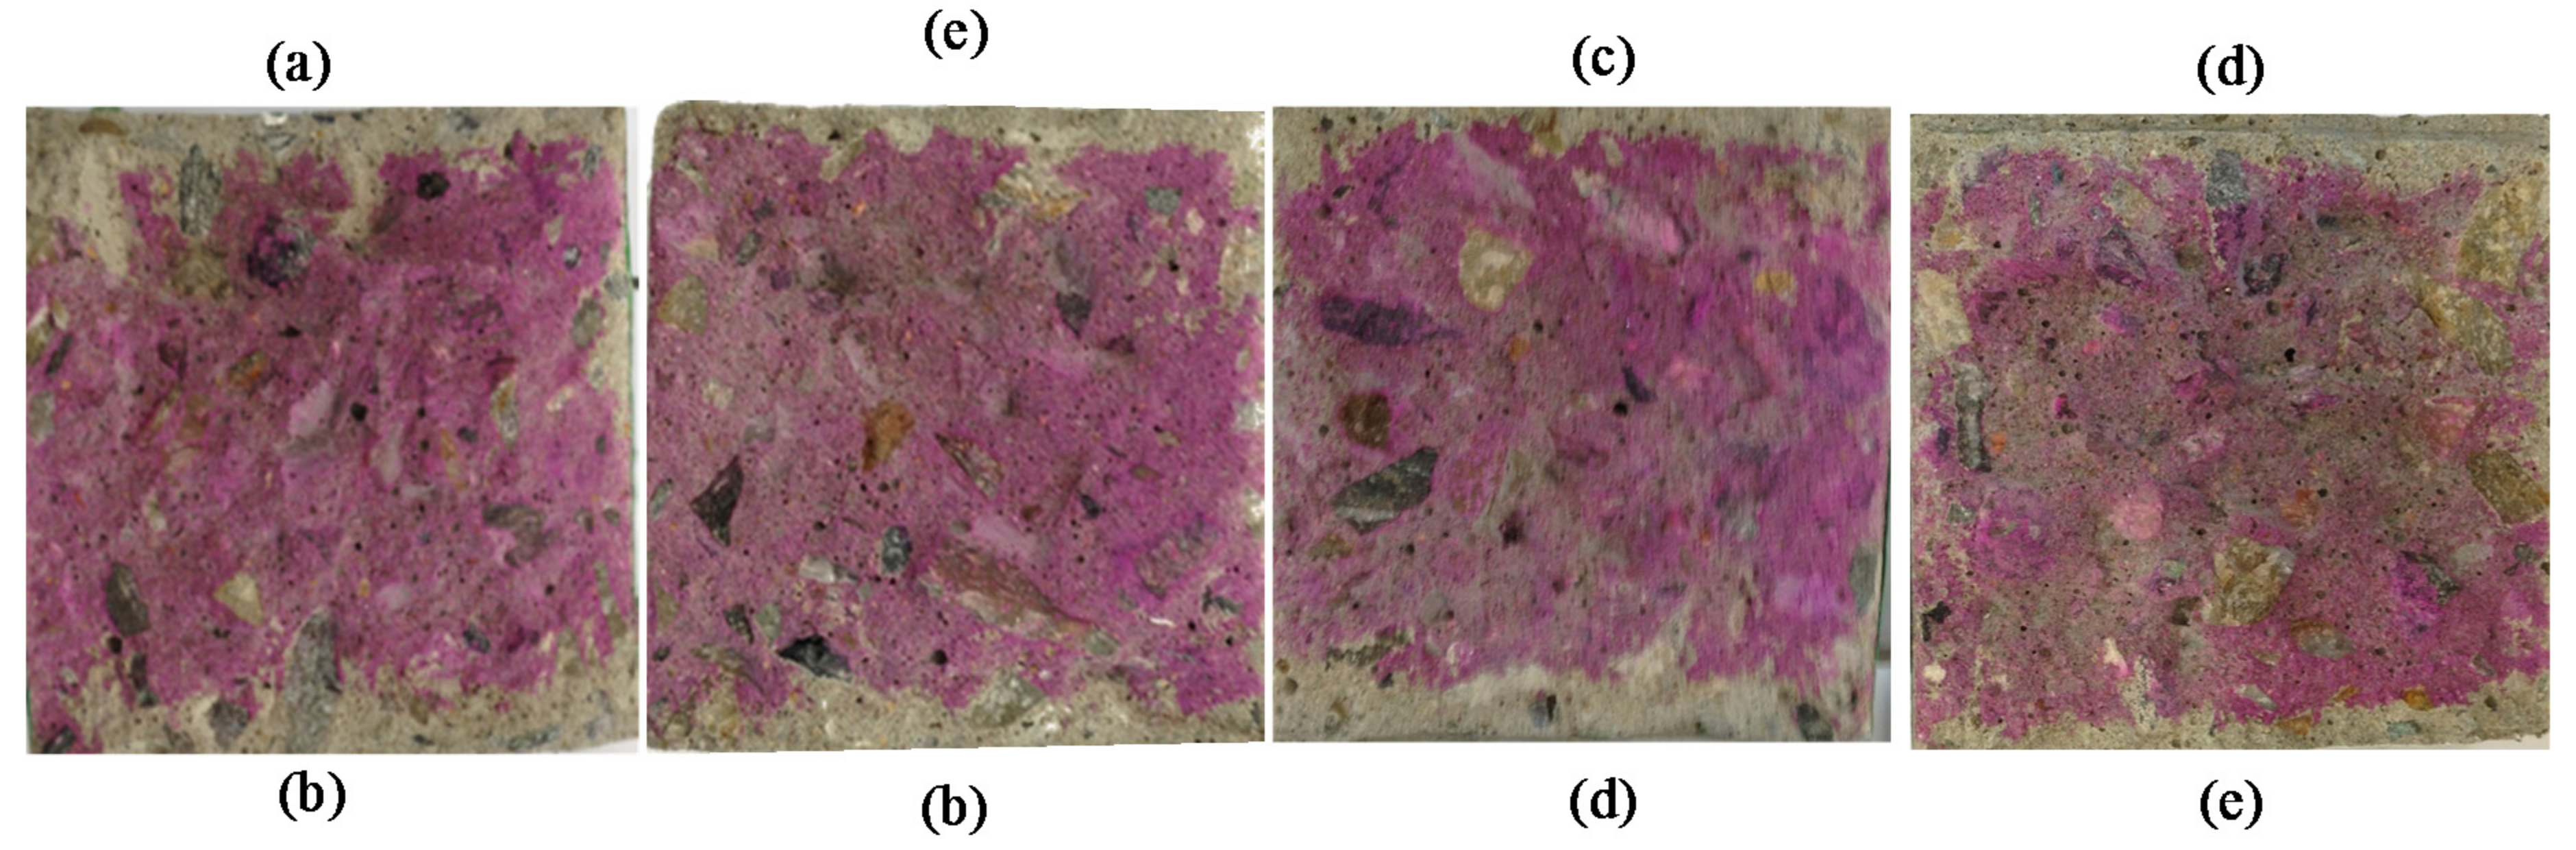
Figure 4.
Carbonation depths after accelerated carbonation.
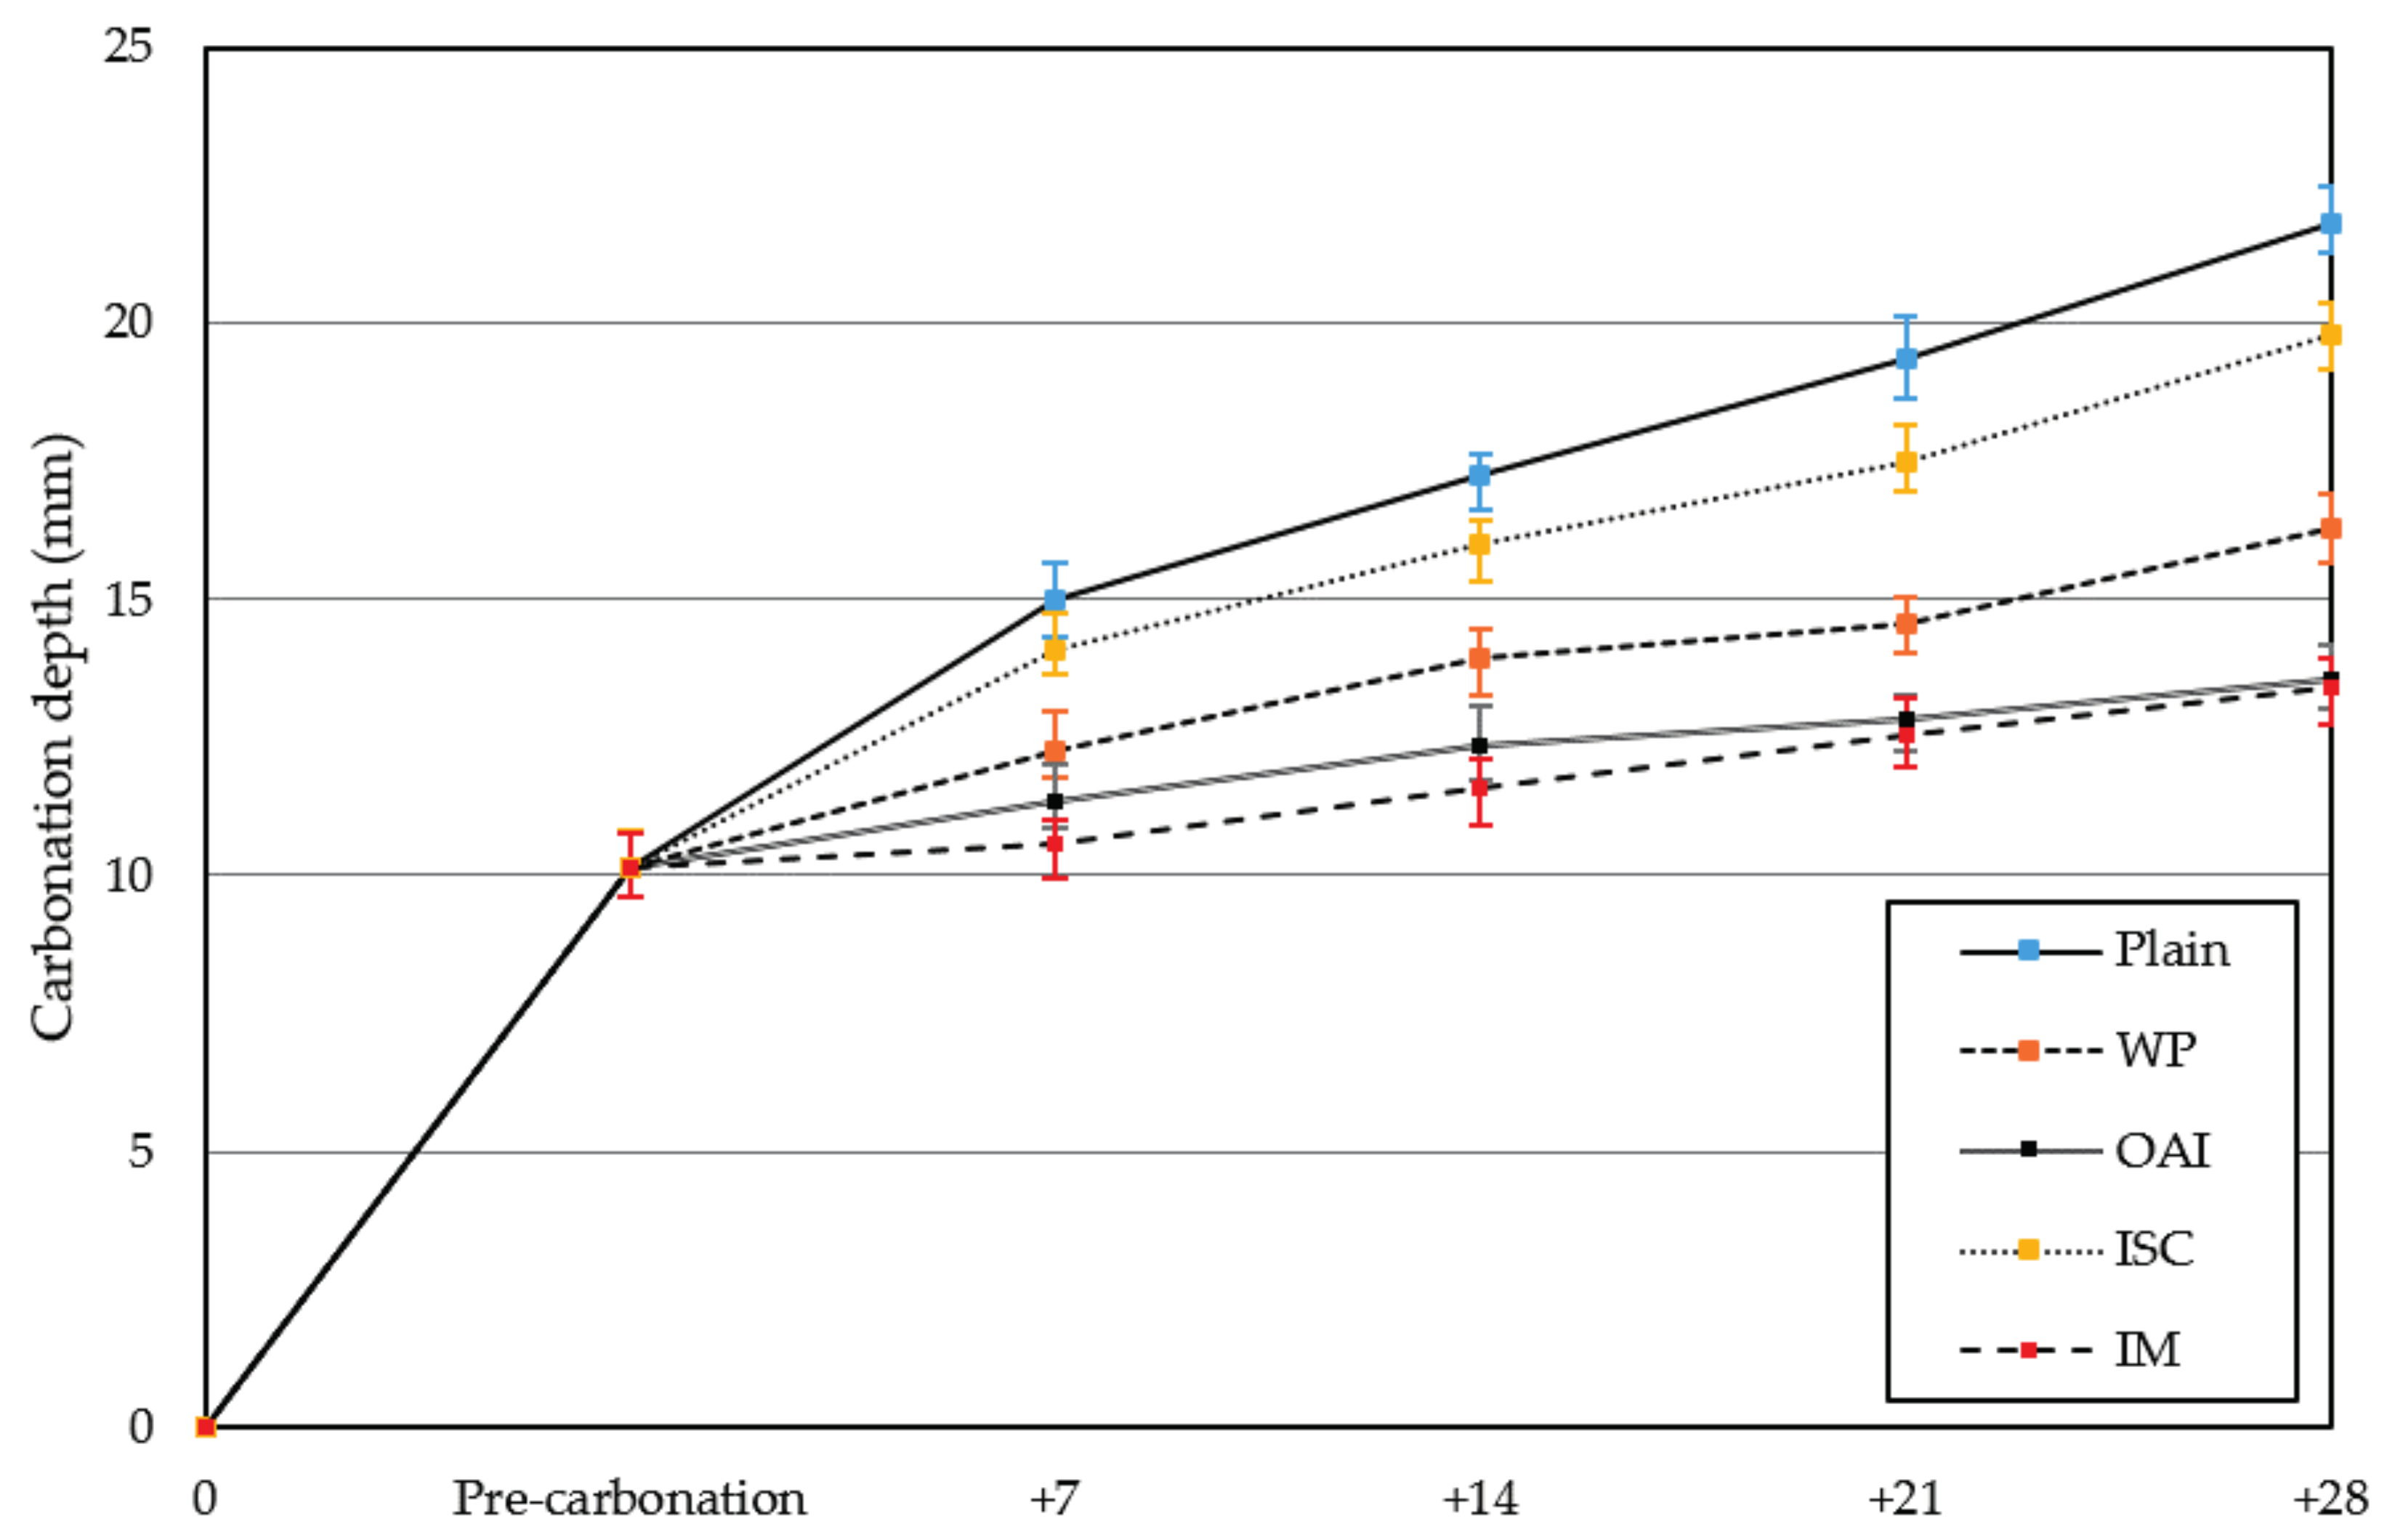
Figure 5.
Comparison of the carbonation rates for the different specimens with ordinary Portland cement (OPC).
Figure 5.
Comparison of the carbonation rates for the different specimens with ordinary Portland cement (OPC).
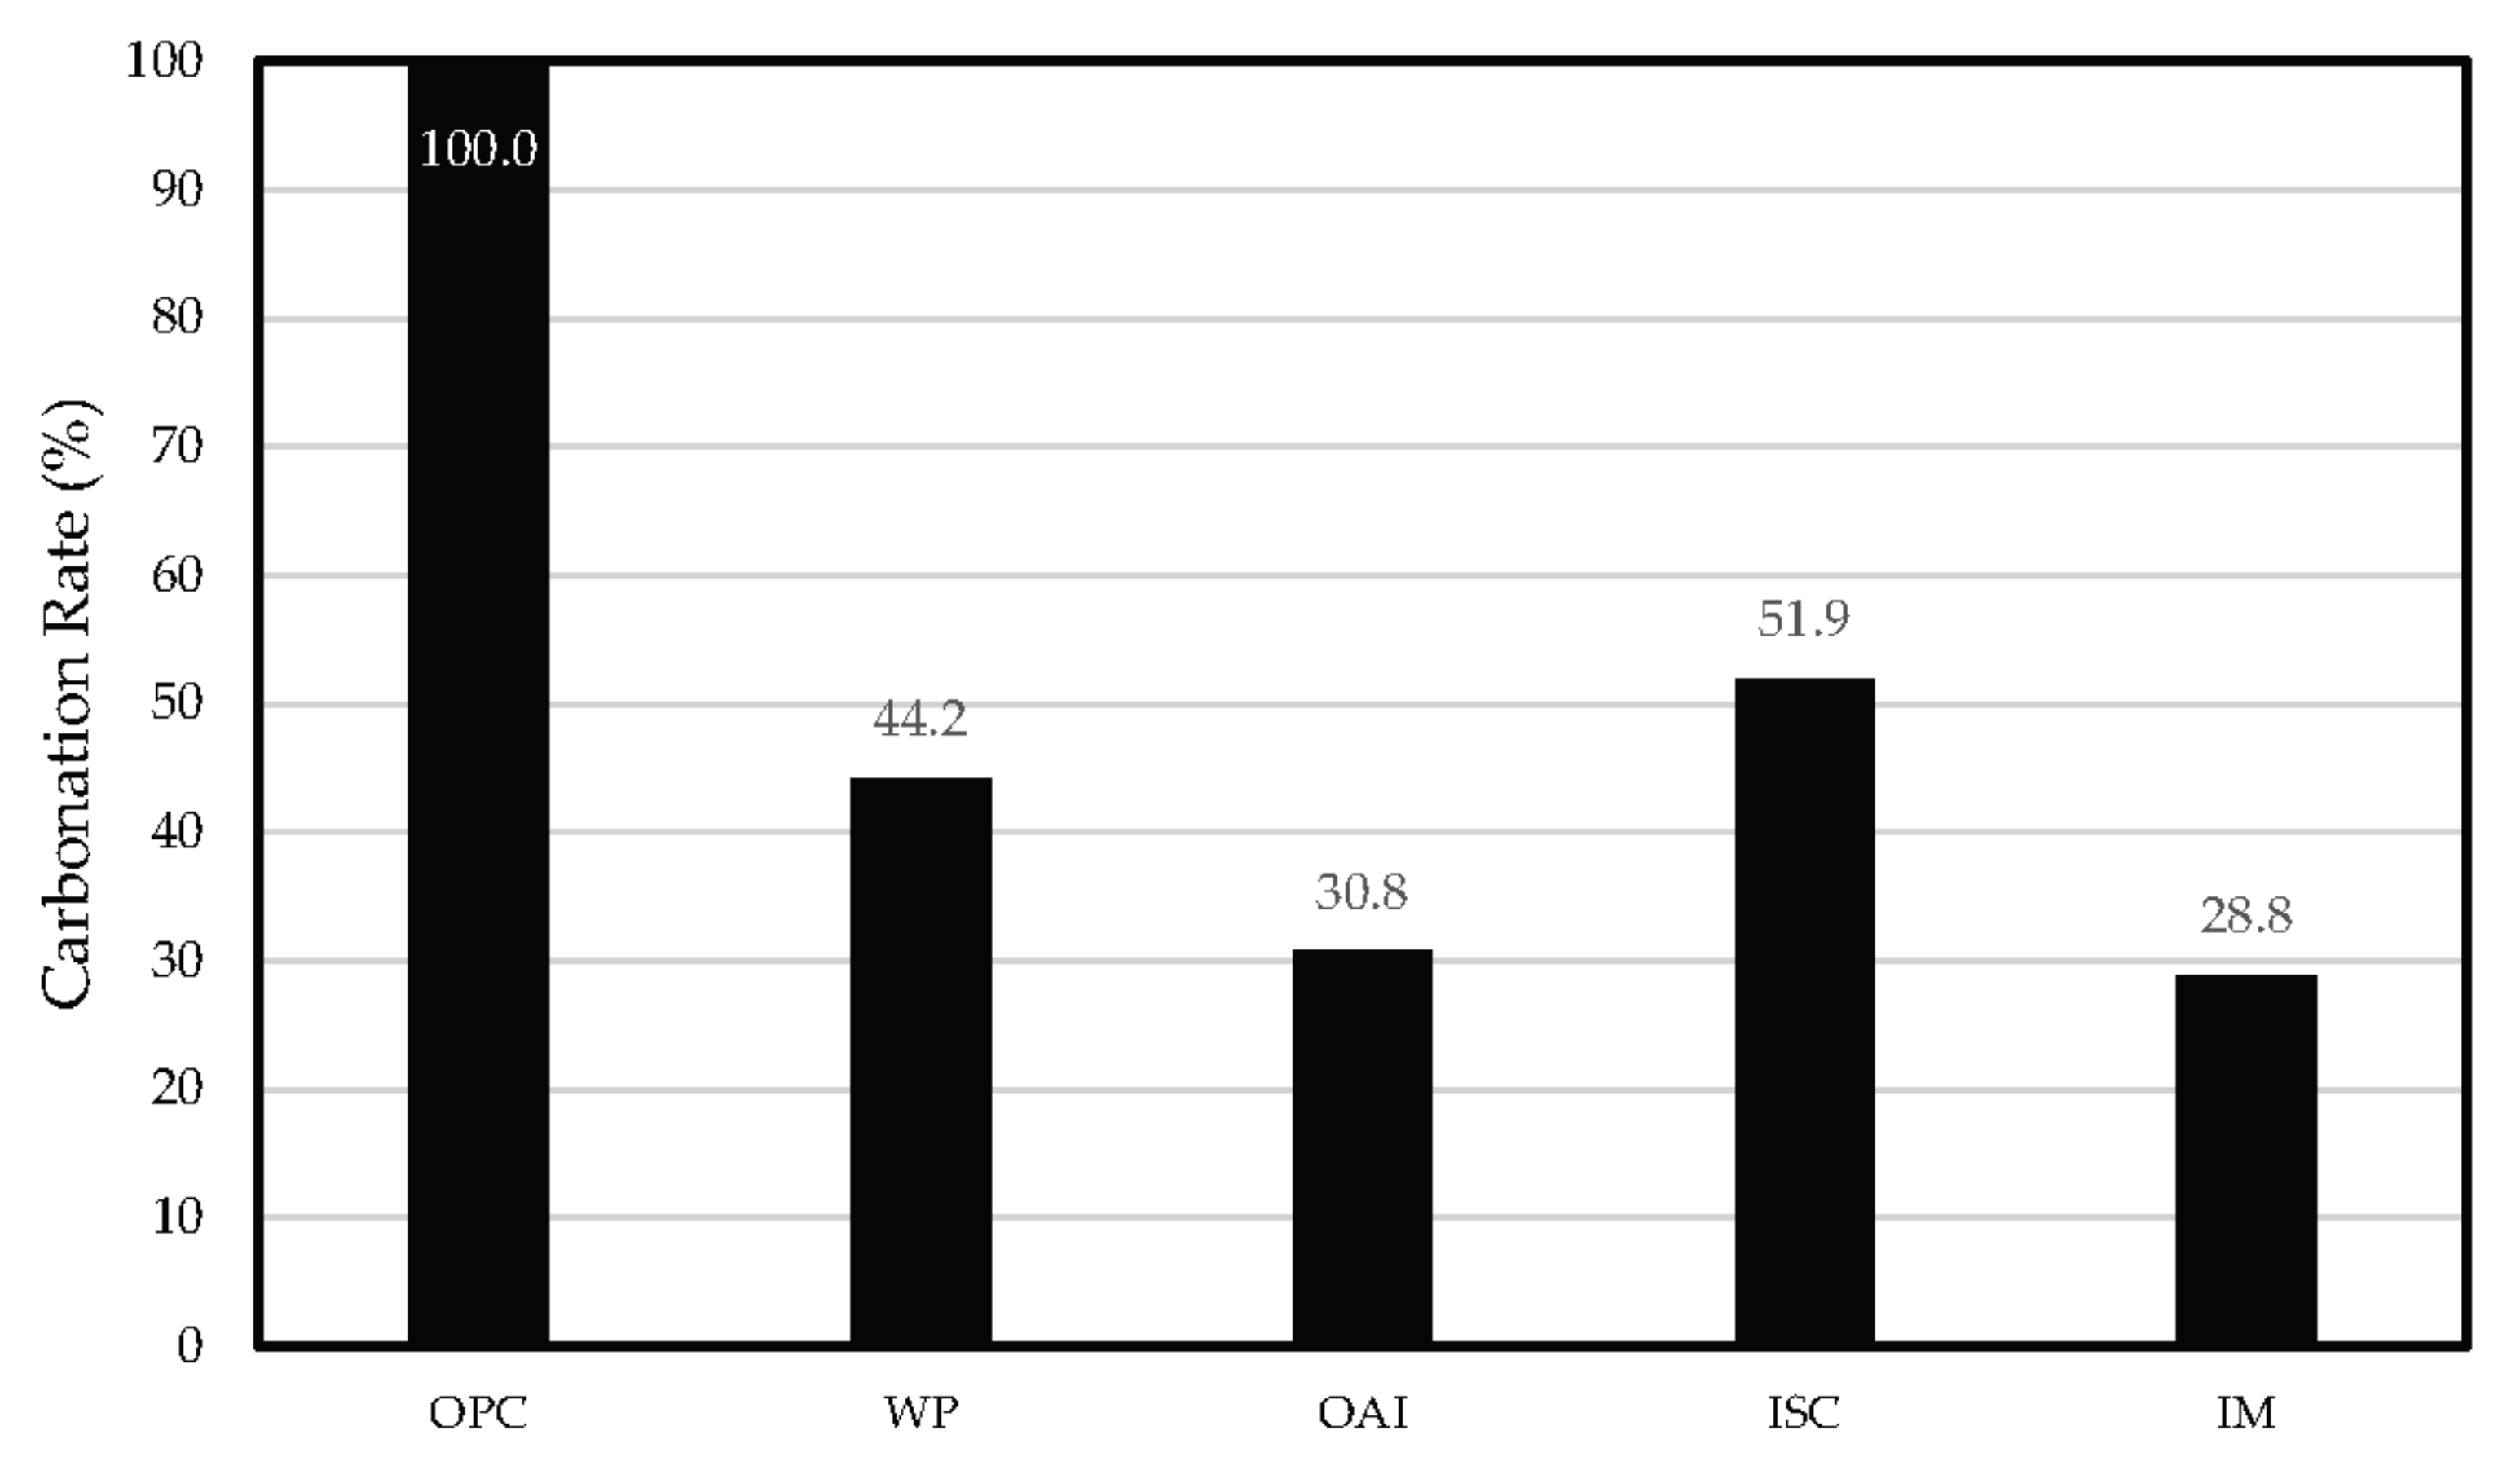
Figure 6.
Predicted progression of the carbonation depth for the different repair materials.
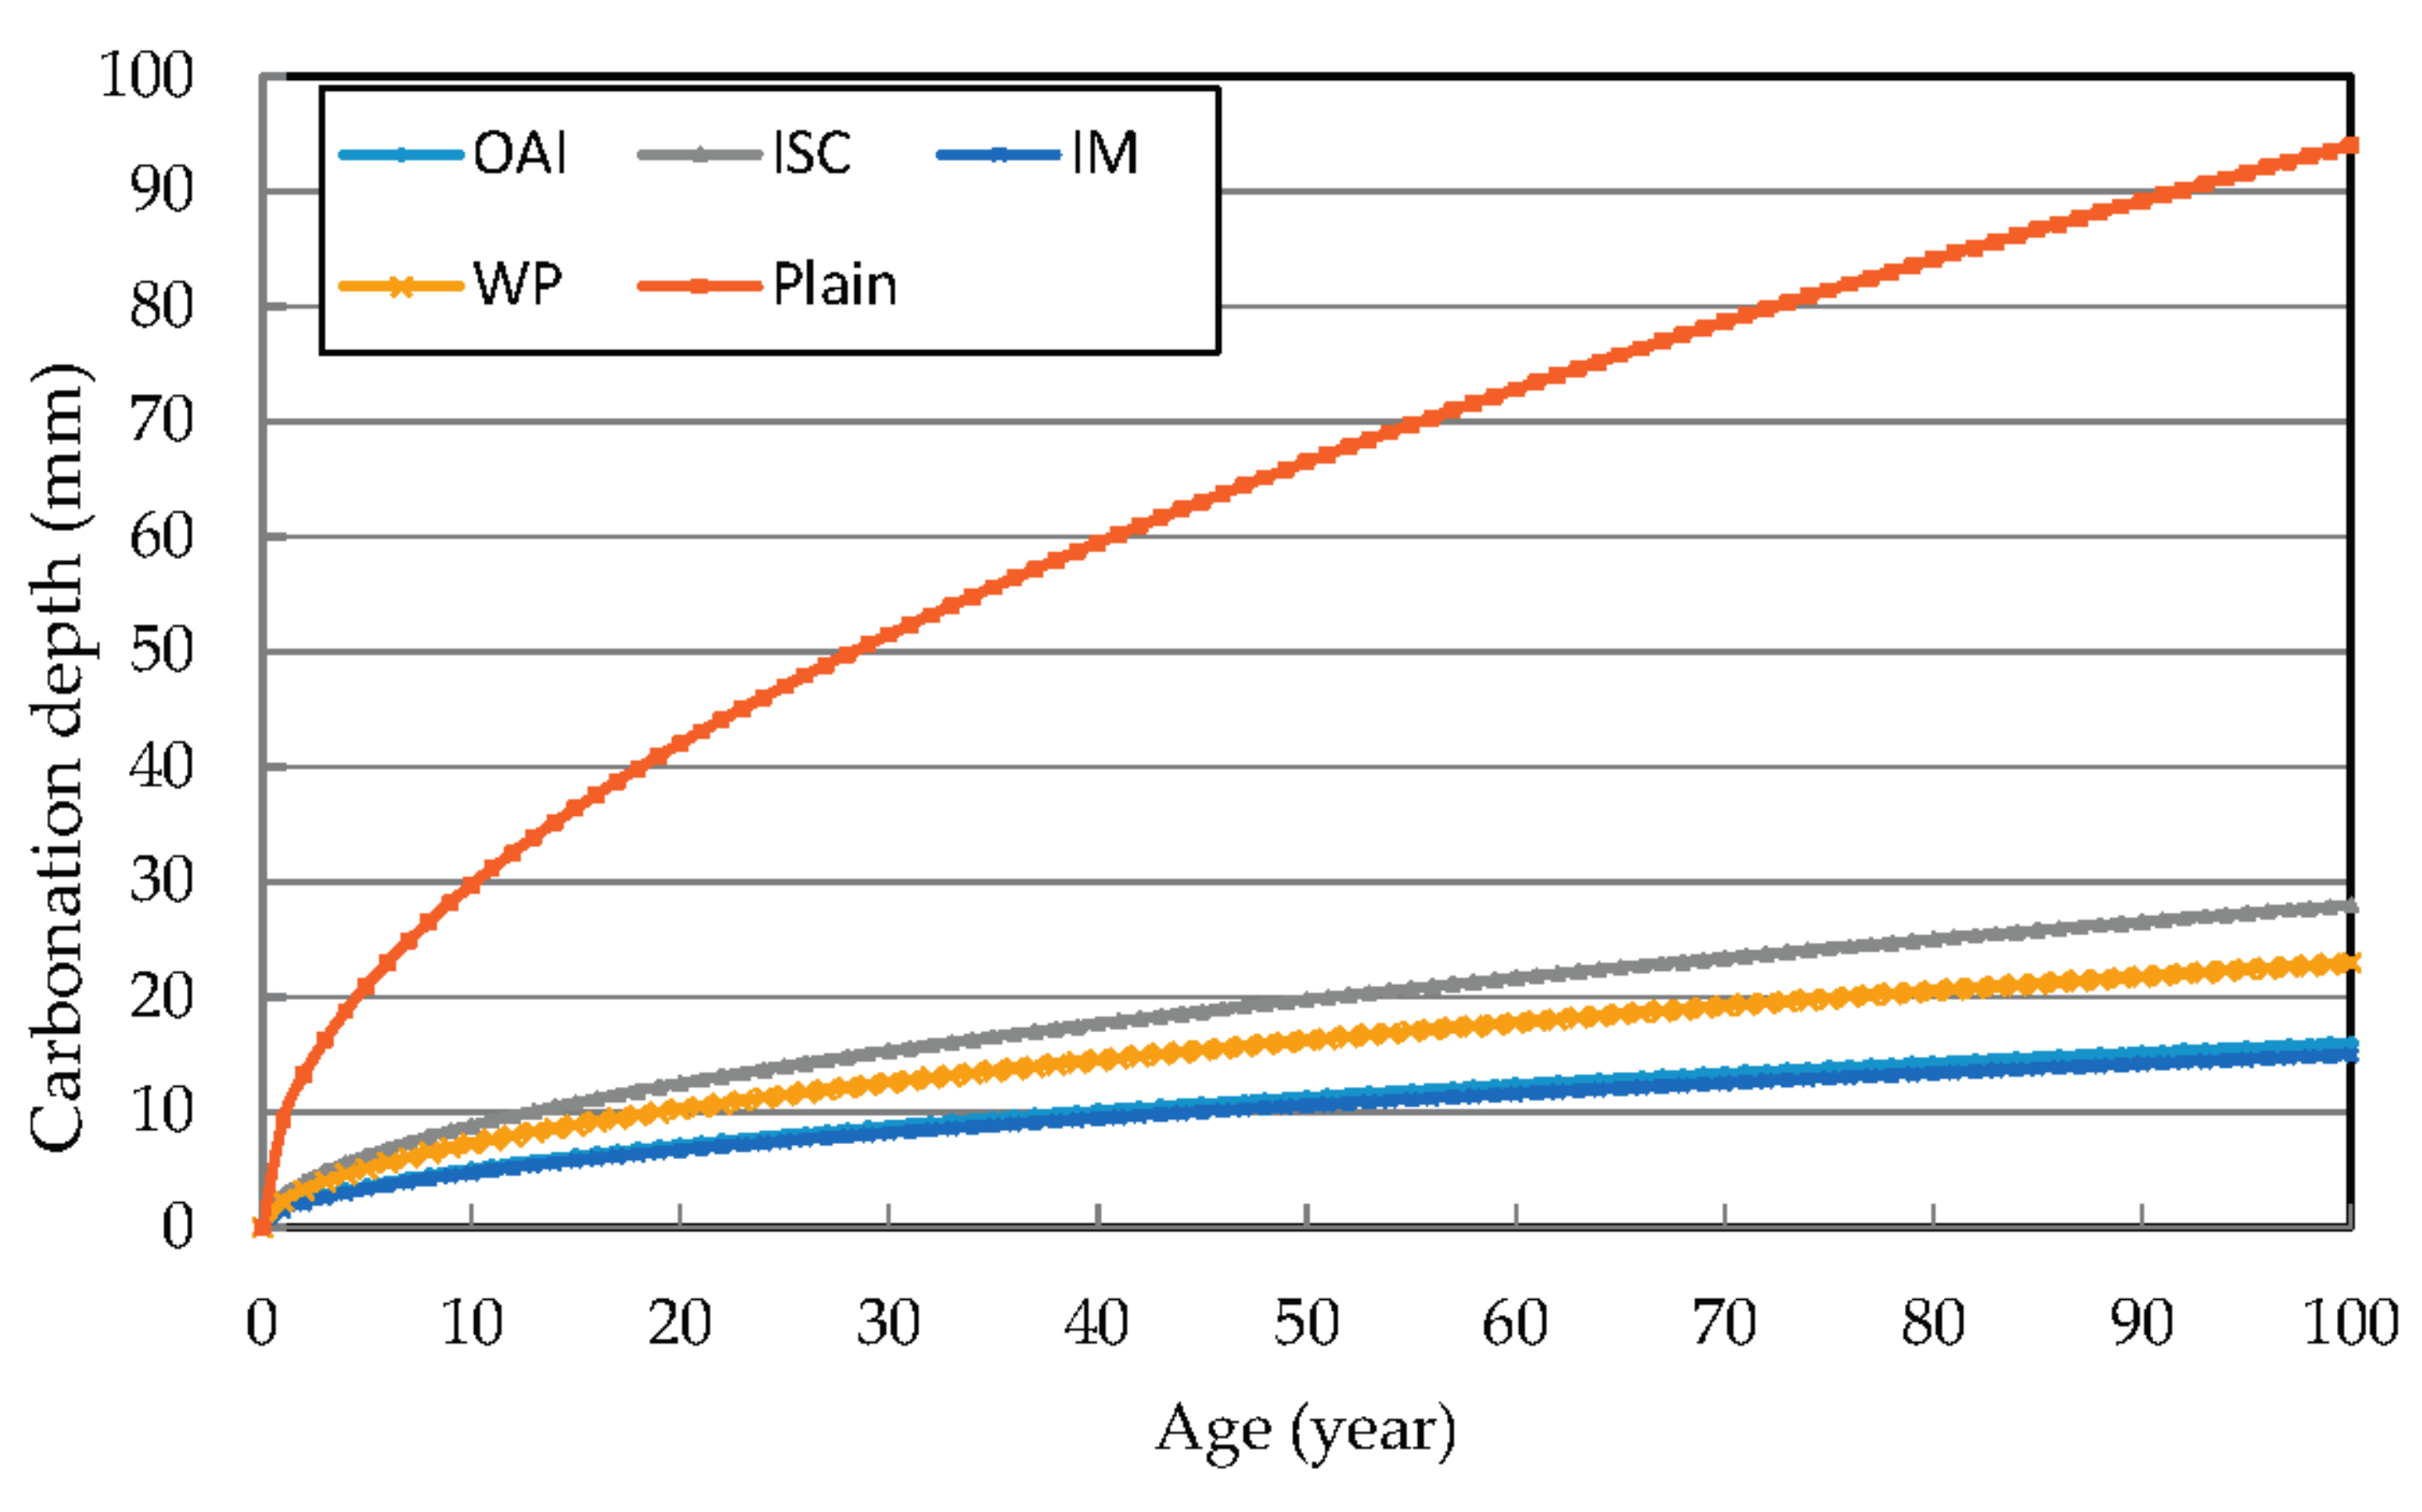
Figure 7.
Predicted post-repair progress of carbonation using different repair materials.

Figure 8.
Carbonation progress predicted by FEM analysis.

Figure 9.
Flowchart of the FDM analysis.
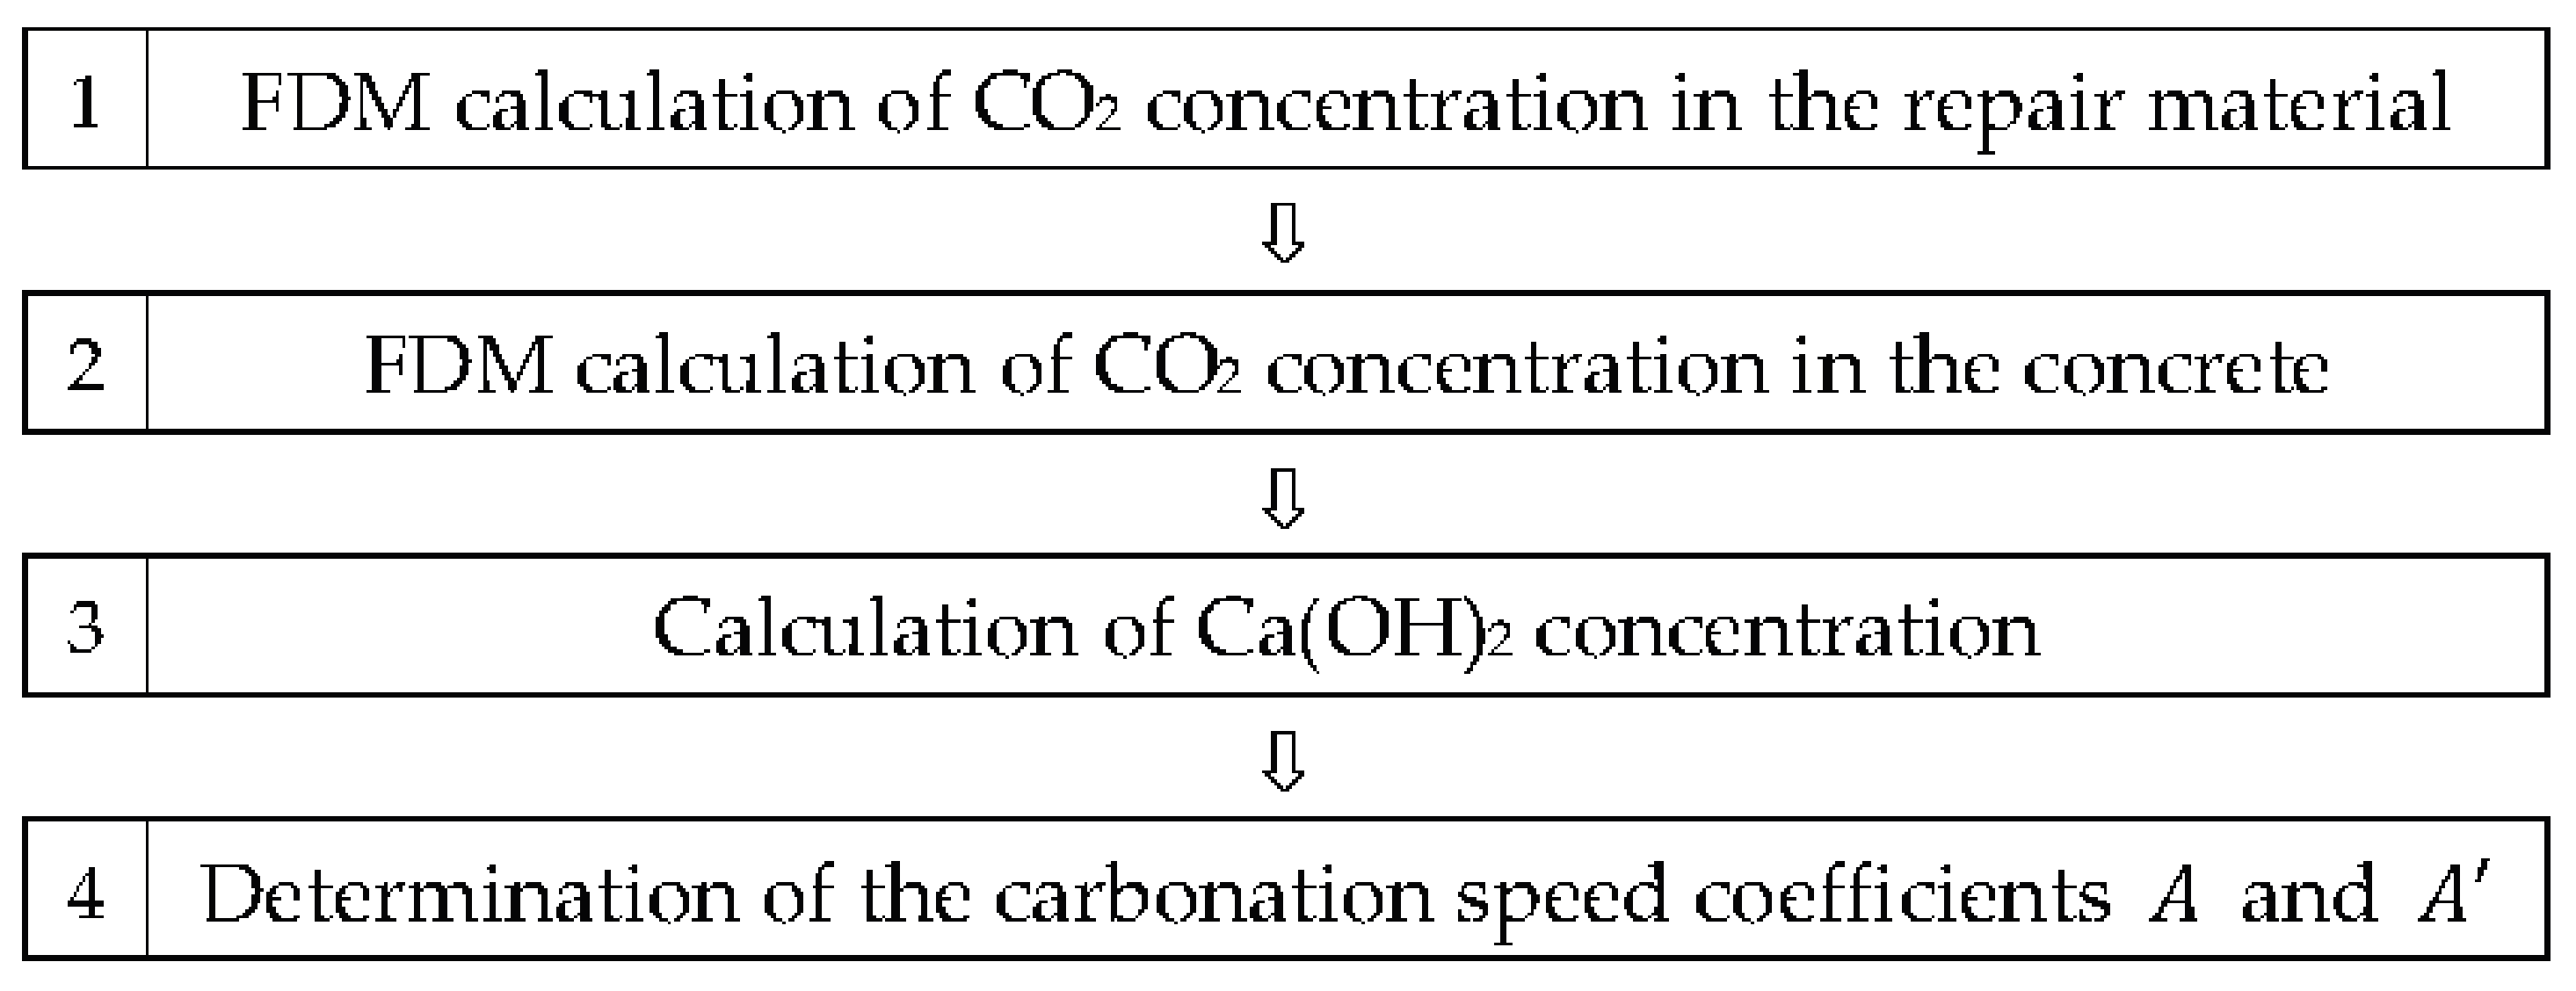
Figure 10.
Carbonation progress predicted from FDM analysis.


Table 1.
Concrete mix proportions. W/C: Water/Cement.
| W/C | Unit Weight (kg/m3) | |||
|---|---|---|---|---|
| Water | Cement | Sand | Coarse Aggregates | |
| 0.55 | 173 | 315 | 891 | 923 |
Table 2.
Physical properties of the Organic Alkaline Inhibitor (OAI).
| Type | Specific Gravity | pH | Viscosity(CPS) | Main Component |
|---|---|---|---|---|
| Organic inhibitor | 1.07 | 11.9 | 11 | (CH3)2NCH2CH2OH |
Table 3.
Thickness of each repair material.
| Sl. No. | Type | Thickness (mm) |
|---|---|---|
| 1 | WP | 0.1 |
| 2 | OAI | spread |
| 3 | ISC | 2 |
| 4 | IM | 6 |
WP: Water-Based Paint; ISC: Inhibiting Surface Coating; IM: Corrosion-Inhibiting Mortar.
Table 4.
Carbonation coefficients under normal atmospheric conditions.
| Sl. No. | Type of Concrete Specimens | Carbonation Coefficient () |
|---|---|---|
| 1 | Unrepaired | 9.4 |
| 2 | WP | 2.3 |
| 3 | OAI | 1.6 |
| 4 | ISC | 2.8 |
| 5 | IM | 1.5 |
Table 5.
Comparison of the carbonation depths for the different repair materials. (After 10 years)
| Sl. No. | Type of Concrete Specimen | Carbonation Depth (mm) |
|---|---|---|
| 1 | Unrepaired | 30 |
| 2 | WP | 7.27 |
| 3 | OAI | 5.06 |
| 4 | ISC | 8.85 |
| 5 | IM | 4.74 |
Table 6.
Equations to predict progress of carbonation.
| Type of Concrete Specimen | Carbonation Progress Prediction Equation |
|---|---|
| Unrepair | |
| WP | |
| OAI | |
| ISC | |
| IM |
is the carbonation depth after repair (mm), is the time of repair (year), and t is the time (year).
Table 7.
Input data for Finite Element Method (FEM) analysis.
| Description | Input Parameter | Unit |
|---|---|---|
| Cover thickness of the reinforcement bar | 30 | mm |
| α1 (Coefficient of concrete type) | 1 | - |
| α2 (Coefficient of cement type) | 1 | - |
| α3 (W/C coefficient) | 0.17 | - |
| β1 (temperature) | 20 | °C |
| β2 (Humidity) | 60 | % |
| β3 (CO2 Concentration) | 0.05 | % |
| k (coefficient of Kisitani Equation or Shirayama Equation) | 1.72 | - |
| R1 (Repair coefficient 1) | 0 | - |
| R2 (Repair coefficient 2) | 30 | - |
| Initial Ca(OH)2 Concentration | 0.876 | mol/cm3 |
| Reaction rate constant | 500,000 | 1/day |
| Ca(OH)2 loss | 40 | % |
Table 8.
Input variables for concrete.
| Parameter | Input Value | Unit |
|---|---|---|
| Diffusion coefficient of CO2 in concrete | 0.0005 | cm2/day |
| Rate constant (k) of the reaction between CO2 and Ca(OH)2 | 500,000 | 1/day |
| Thickness of the concrete specimen | 20 | cm |
| Ca(OH)2 concentration on the specimen surface | 0.000003 | mol/cm3 |
Table 9.
Input variables for the repair materials.
| Type | Diffusion Coefficient of CO2 (m2/s) | Air Permeability (cm3 (STP) × cm/(cm2 × s × cm Hg)) |
|---|---|---|
| WP | 0.000055 | 0.06 |
| OAI | 0.000052 | 1 |
| ISC | 0.000058 | 0.2 |
| IM | 0.000018 | 0.2 |
© 2017 by the authors. Licensee MDPI, Basel, Switzerland. This article is an open access article distributed under the terms and conditions of the Creative Commons Attribution (CC BY) license (http://creativecommons.org/licenses/by/4.0/).
Share and Cite
MDPI and ACS Style
Lee, H.-M.; Lee, H.-S.; Singh, J.K. Prediction Model for the Carbonation of Post-Repair Materials in Carbonated RC Structures. Materials 2017, 10, 492. https://doi.org/10.3390/ma10050492
AMA Style
Lee H-M, Lee H-S, Singh JK. Prediction Model for the Carbonation of Post-Repair Materials in Carbonated RC Structures. Materials. 2017; 10(5):492. https://doi.org/10.3390/ma10050492
Chicago/Turabian StyleLee, Hyung-Min, Han-Seung Lee, and Jitendra Kumar Singh. 2017. "Prediction Model for the Carbonation of Post-Repair Materials in Carbonated RC Structures" Materials 10, no. 5: 492. https://doi.org/10.3390/ma10050492
Note that from the first issue of 2016, this journal uses article numbers instead of page numbers. See further details here.