1. Introduction
Compounds exhibiting large magnetocaloric effect in the vicinity of room temperature have recently drawn much attention due to the possibility of their application in magnetic cooling devices. Among the different types of intermetallic compounds, two groups exhibiting magnetoelastic ferro to paramagnetic state transition are the most prospective. The first one, an La(Fe,Si)
13 group of compounds, is being optimized by introducing cobalt and manganese into the composition and by performing hydrogenation [
1,
2,
3,
4,
5,
6]. All of these procedures are aimed toward shifting the Curie point to the desired room temperature. The second group, which is the subject of this study, constitutes a big family of Fe
2P-based compounds. The three main groups are: (Mn,Fe)
2(P,As), (MnFe)
2(P,Ge) and (MnFe)
2(P,Si) compounds. Our study is focused on the (Mn,Fe)
2(P,As) group, which is known to exhibit the best magnetocaloric properties (highest adiabatic temperature change) [
7,
8,
9,
10,
11,
12,
13]. Most of the studies have concentrated on intermetallic compounds based on four elements. In our study, we will investigate five-element intermetallic compounds with the overall formula: MnFeP
0.5As
0.5−xGe
x. In 2005, Tegus et al. published results of a germanium substitution for arsenic for a Mn
1.1Fe
0.9P
0.7As
0.3−xGe
x series [
14]. In the studied samples, a composition with the germanium amount
x = 0.1 was found to have the highest magnetic entropy change in the high magnetic field B = 3 T. Under a moderate magnetic field of B = 1 T, the highest magnetic entropy change was found for the composition with
x = 0.15 (approximately −ΔS
M = 11 J
.kg
−1.K
−1), however, adiabatic temperature change was not evaluated during this study. The Curie point for the composition with
x = 0.10 was obtained as T
C = 270 K, while for
x = 0.15 it was T
C = 290 K.
In our recent study, it was found that silicon as a fifth element (substituted for arsenic) may increase magnetic entropy change as well as adiabatic temperature change in Fe
2P-type compounds. It was also found that the maximum adiabatic temperature change in silicon-doped MnFeP
0.35As
0.65 compounds can be correlated with the maximum crystal unit cell volume [
15].
The main aim of this work is to study the impact of doping the known composition Mn1.1Fe0.9P0.5As0.5 by germanium Ge on structural and magnetocaloric parameters (adiabatic temperature change ΔTad and magnetic entropy change ΔSM). The second aim is related to finding correlations between structural changes and magnetocaloric properties. In this case, contrary to the silicon atom (atomic radius r = 110 pm), germanium has a higher atomic radius than arsenic (125 versus 115 pm), which should cause unit cell enlargement. Newly synthetized compounds will be studied by means of calorimetry, X-ray diffraction, microanalysis, magnetometry and magnetocalorimetry. Moreover, magnetic entropy change (ΔSM) under a moderate magnetic field (B = 1 T) will be calculated from magnetometric measurements.
2. Materials and Method
Approximately 15 g samples were prepared by initial high energy ball milling the stoichiometric mixture of elemental powder Fe (3 N), red phosphorous P (2N5), elemental shots Mn (4N), Ge (5N) and FeAs2 (2N5) compounds under an argon atmosphere. Powders were then pressed in order to form pellets. Pellets were sintered for 5 h at 1273 K and homogenized for the next 10 h at 923 K under a vacuum 5 × 10⁻⁵ mbar (wire vacuum furnace, Czylok, Poland). Thereafter, samples were slowly cooled down with the furnace to room temperature.
The phase purity and the crystal structures were determined by powder X-ray diffraction (XRD) using Cu
Kα radiation (MiniFlex, Rigaku, Japan). The Rietveld refinement analysis of the X-ray diffraction data were performed using FullProf Suite Program 3.00 [
16]. The microstructure observations and chemical composition evaluation was done by JCXA 733 (JEOL, Japan) equipped with energy dispersive (EDS) and wavelength dispersive (WDS) microanalyzers. The direct adiabatic temperature changes ΔT
ad(T,B) were obtained with an adiabatic magnetocalorimeter (AMT&C Group, Russia) in a temperature range of 170–350 K under magnetic fields up to 1.7 T. The external magnetic field was changed in a cycle of 0T–1.7T–0T with a rate of 2 T/s, during ΔT
ad measurements. ΔT
ad measurements were performed on the samples that were initially milled, mixed and consolidated with 5% of polyvinylidene fluoride (PVDF) powder by heating to 573 K and pressing. Tablets prepared by this method are resistant to the large magnetovolume effect during the measurements, but exhibit lower maximum ΔT
ad than the bulk samples. Differential scanning calorimetry (DSC) studies were performed with use of a Pegasus 404c thermal analyzer (Netzsch, Germany). Samples with a mass of approximately 30 mg were heated with at the rate of 10 K/min under a helium atmosphere a gas flow equal to 50 mL/min.
Magnetic measurements were performed using a Physical Property Measurement System (PPMS-7, Quantum Design, Inc., San Diego, CA, USA). Compounds exhibiting first order magnetic transition were being studied. Therefore, it was advisable to perform isofield measurements or to use the so called “loop process” during isothermal measurements in order to avoid artifacts (“spikes”) at the calculations of magnetic entropy change stage. In this work, isofield measurements were carried out. Magnetization curves M =
f(T), measured for different values of magnetic field induction were further interpolated to obtain the same temperature steps for every value of magnetic field induction, enabling use of the Maxwell relations-based formula for magnetic entropy change calculations [
17]:
The magnetization was measured in a temperature range of 250–400 K under magnetic fields up to 1 T.
3. Results and Discussion
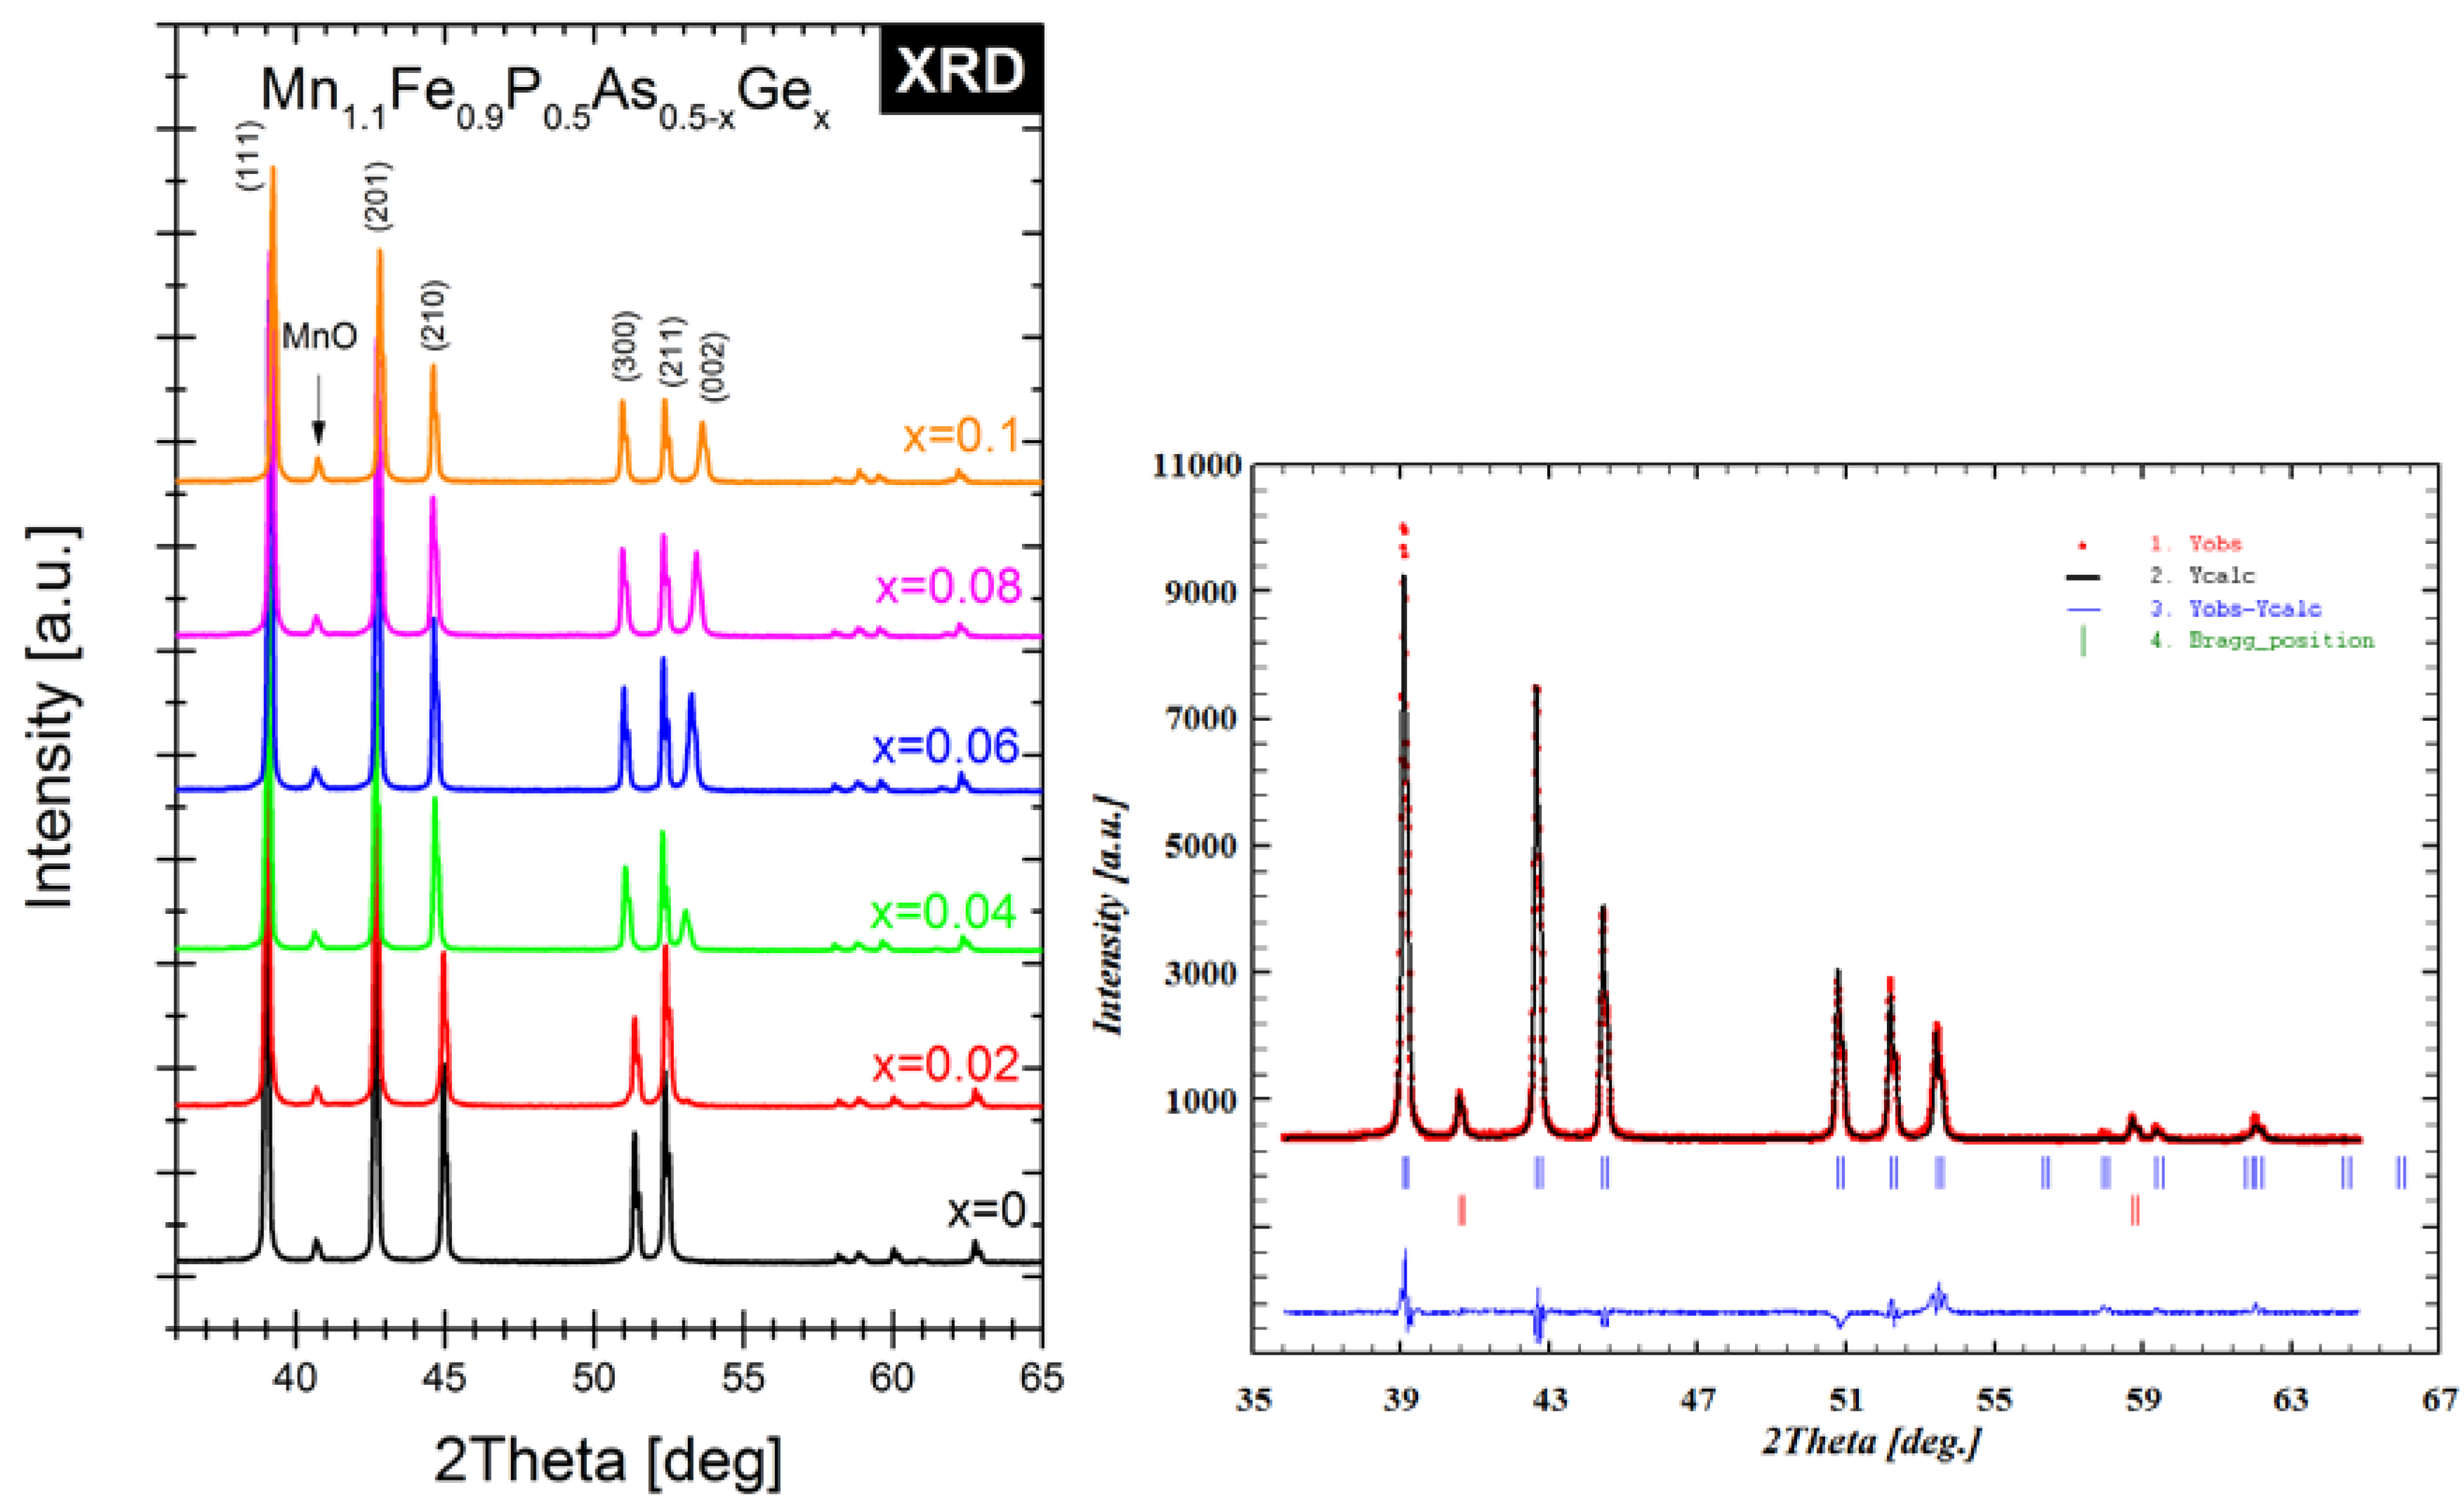
Synthetized compounds were investigated by different experimental methods. The structure of polycrystalline samples was evaluated by XRD. In
Figure 1 (left), one can see the diffraction patterns of all of the studied samples. It can be easily seen that all samples consisted of two phases i.e., major hexagonal Fe
2P-type phase (space group number: 189, Hermann-Mauguin symbol: P −6 2 m) and MnO impurity (space group number: 225, Hermann-Mauguin symbol: F m −3 m). By analyzing the diffraction patterns from 50 to 55 degrees in the 2θ range, it is easily seen that position of the (002) diffraction peak shifts into the smaller value in the 2Theta scale into the position of the (211) peak. Thus, in a high temperature phase (paramagnetic) three maxima are visible instead of two. For paramagnetic samples, the (002) peak shifts into the higher value of the 2Theta value and the so-called “diffraction triplet” from the (300), (211) and (002) peaks is visible in the 50–55 degrees region. Therefore, the sample with composition MnFeP
0.5As
0.48Ge
0.02 is ferromagnetic (FM) at room temperature, while MnFeP
0.5As
0.46Ge
0.04 is paramagnetic (PM). Both compounds exhibit FM-PM transition near room temperature. The weight fractions of the phases, lattice parameters, unit-cell volume and
c/
a ratio for the Fe
2P-type phase were then refined using the Rietveld method, and are presented in
Table 1. The selected Rietveld refinement pattern for the sample of Mn
1.1Fe
0.9P
0.5As
0.4Ge
0.1 is shown in
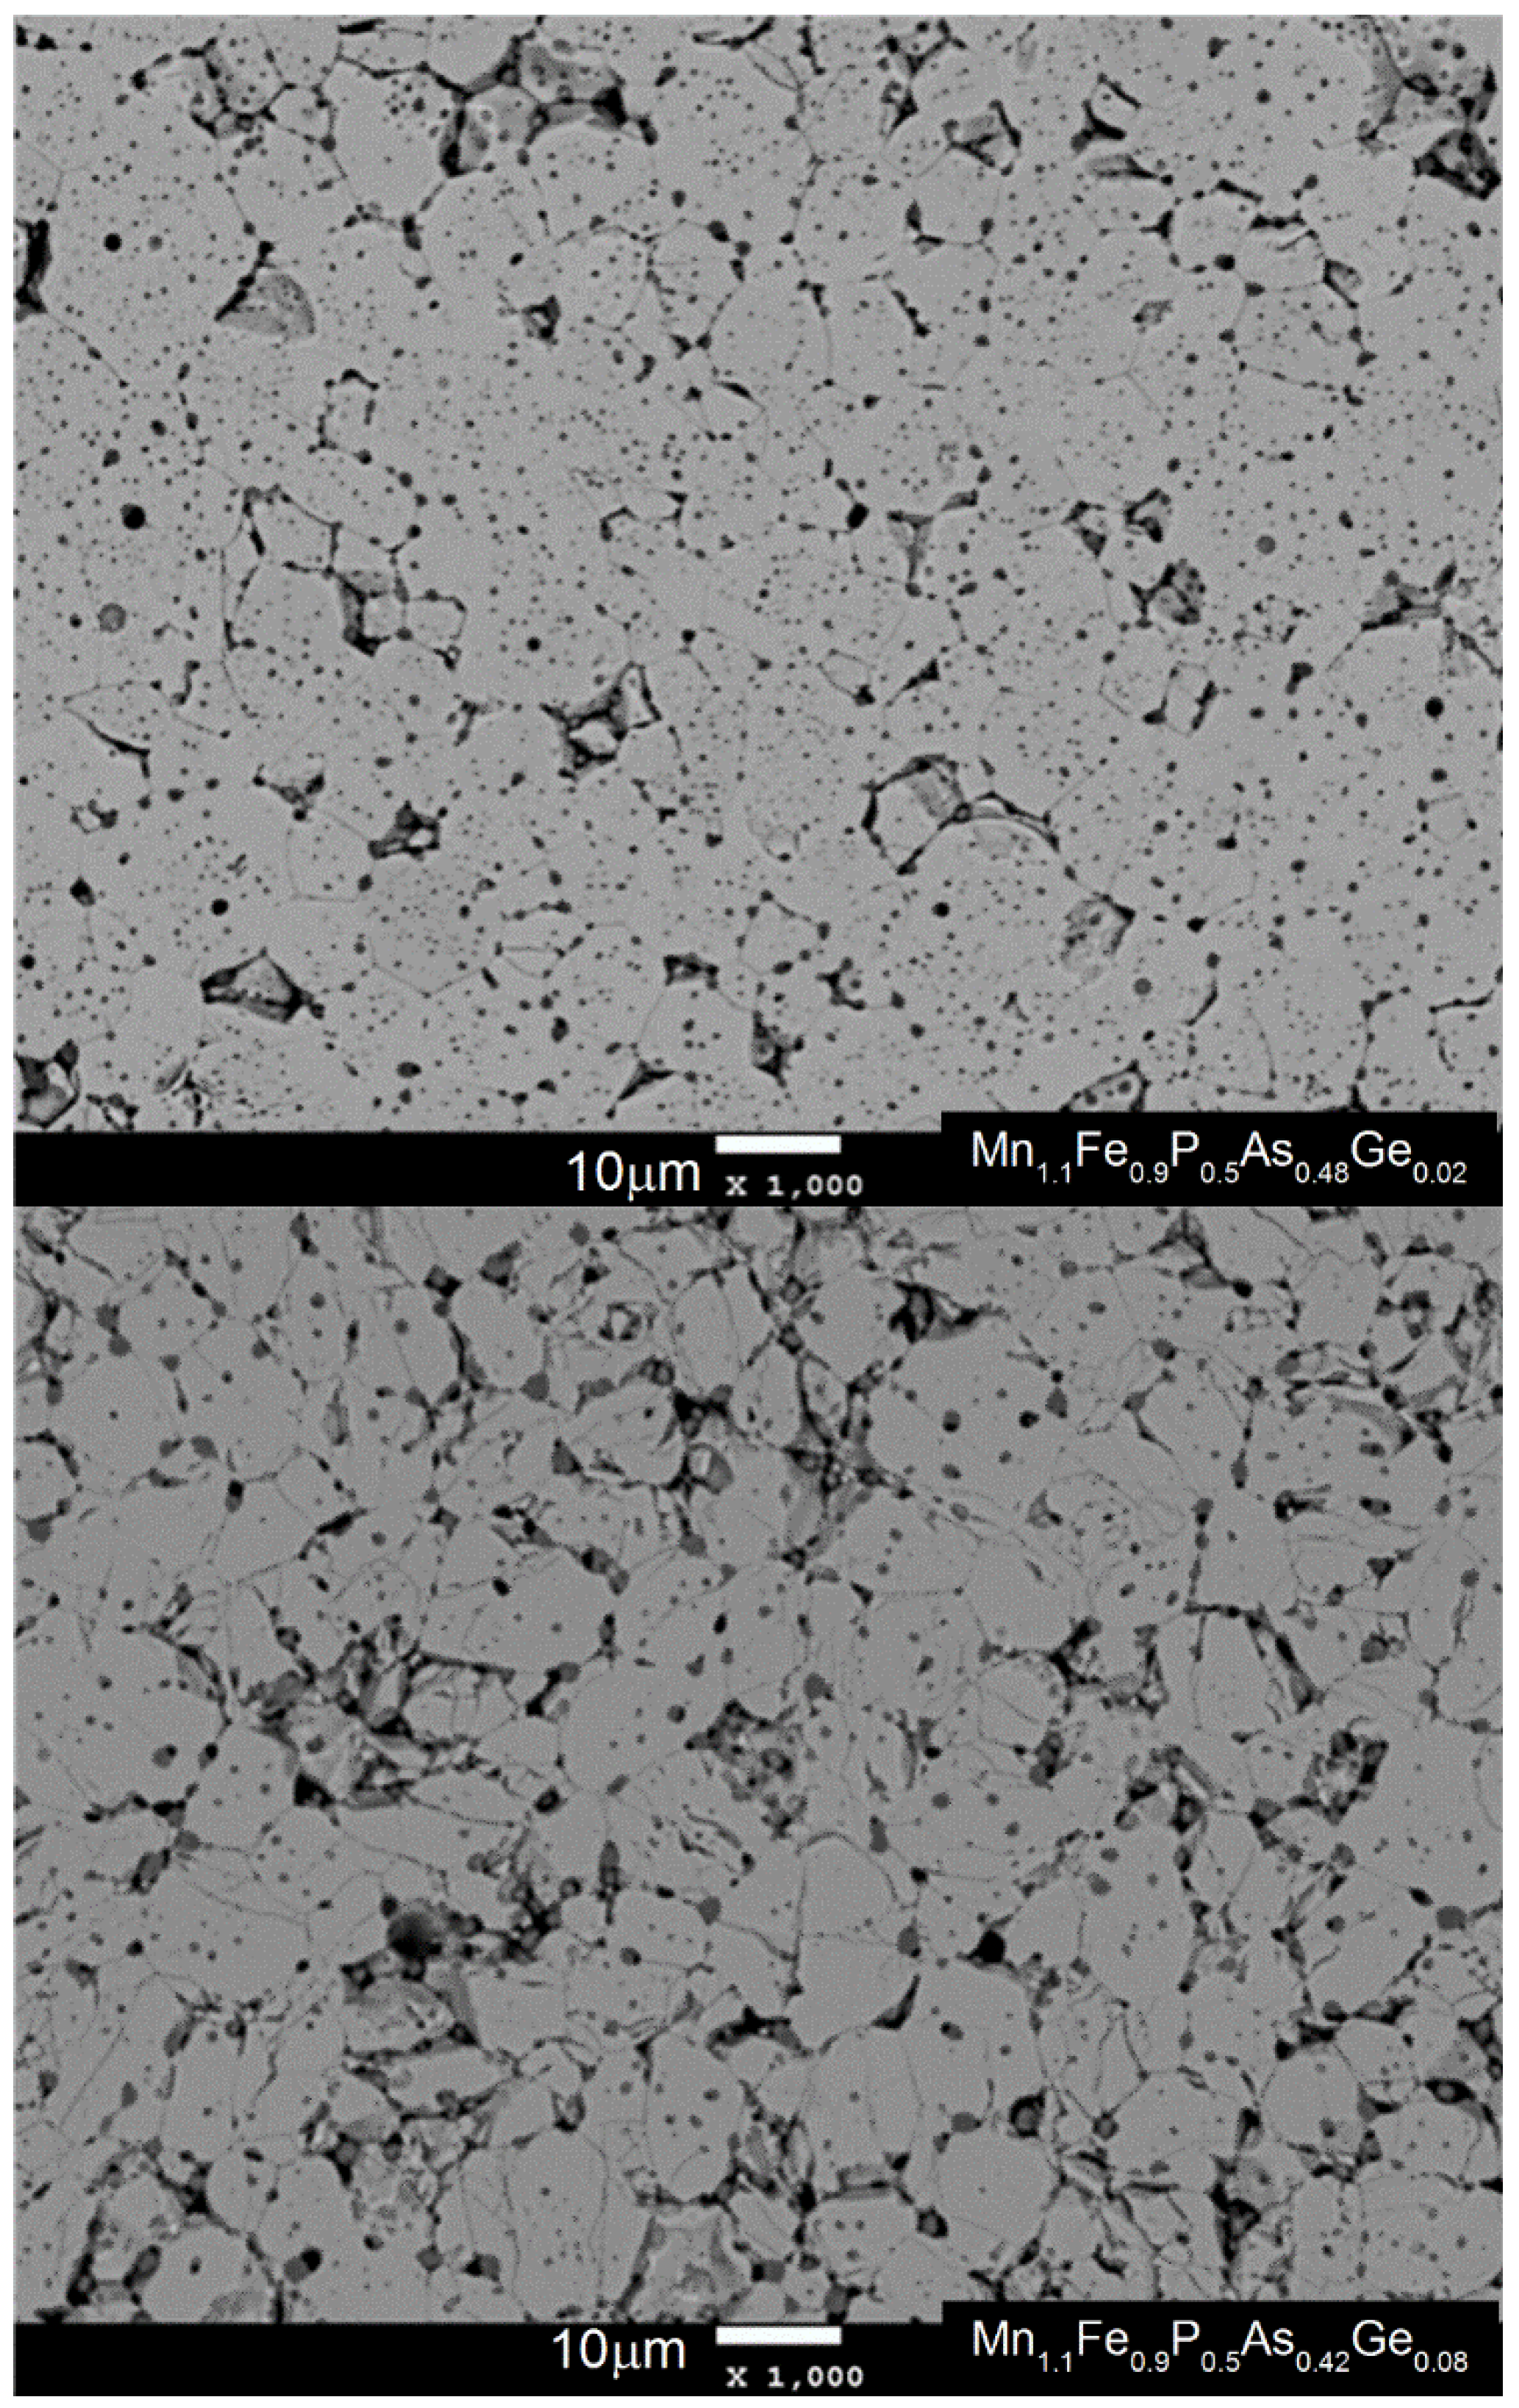
Figure 1 (right). The purity of the synthetized compounds was checked by performing microstructural analysis. In
Figure 2, SEM images of two samples with germanium amounts of
x = 0.02 and
x = 0.08 have been presented. The system with the amount of germanium
x = 0.02 is ferromagnetic at room temperature, while the sample with
x = 0.08 is paramagnetic. The average as well as phase composition was evaluated by means of EDS and WDS analysis. It was found that the paramagnetic sample is more porous than the ferromagnetic sample. Performed microanalysis showed that the manganese oxide MnO can be found mainly in the pores of the presented structure.
Nominal and measured compositions of two samples (
x = 0.02,
x = 0.08) are shown in
Table 2.
The nominal composition stays in good agreement with the measured one. All of the samples have a disturbed Mn/Fe ratio because of MnO second phase formation. From the WDS measurement of the chemical compositions, the amount of MnO was examined. It is equal to 4 at % in the case of the sample with x = 0.02 and 5 at % in the case of the second sample (x = 0.08).
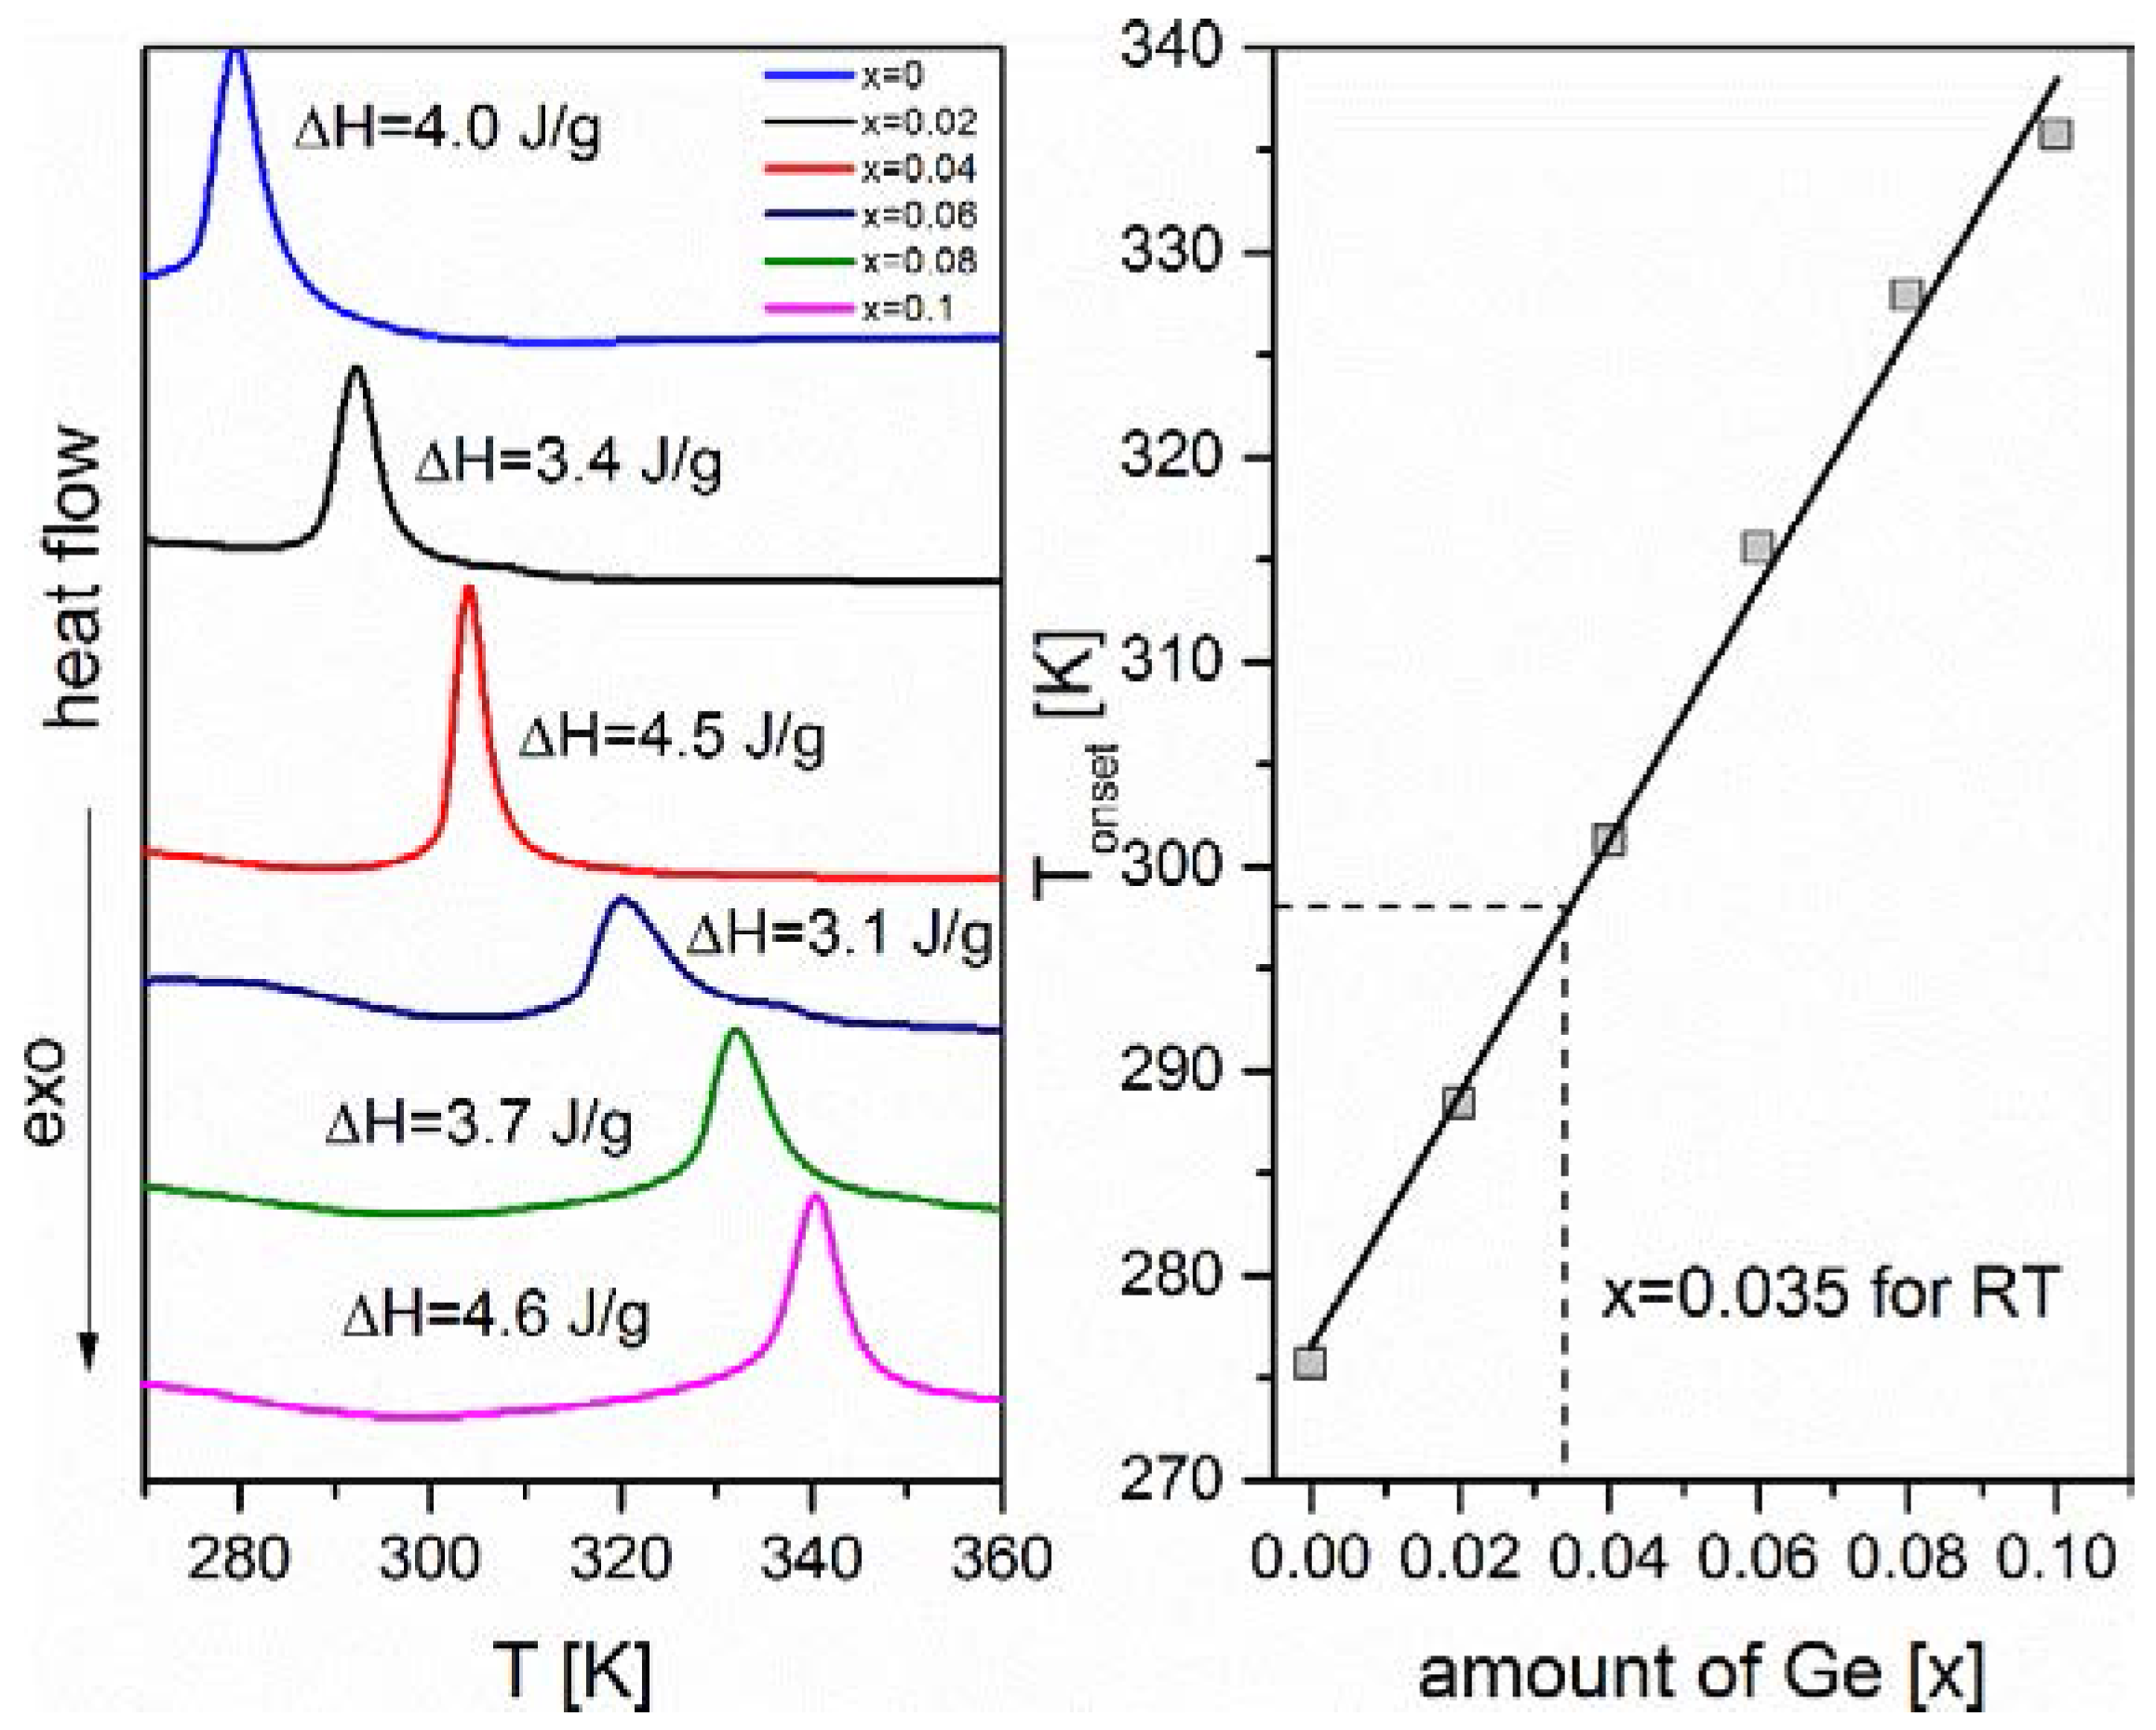
A series of studied compounds exhibit magnetoelastic first-order transition. DSC was used to evaluate latent heat of transition in the absence of a magnetic field. In
Figure 3, one can see the thermograms for all of studied samples up to a germanium amount of
x = 0.1. The latent heat changes in the range of 3.1–4.6 J/g, and is lowest for the sample with
x = 0.06. In the range of compositions from
x = 0.04 to
x = 0.10, the minimum transition enthalpy is can be easily noted at
x = 0.06. It was also found that slight amount of germanium (
x = 0.02) caused a decrease of latent heat from 4.0 to 3.4 J/g. The temperature of transition depends linearly on the germanium amount in the sample. It varies from 276 K for the pure sample to 336 K for the germanium-doped sample with
x = 0.10. It can be also be predicted from the linear fit that the transformation at room temperature occurs for the composition with
x = 0.035.
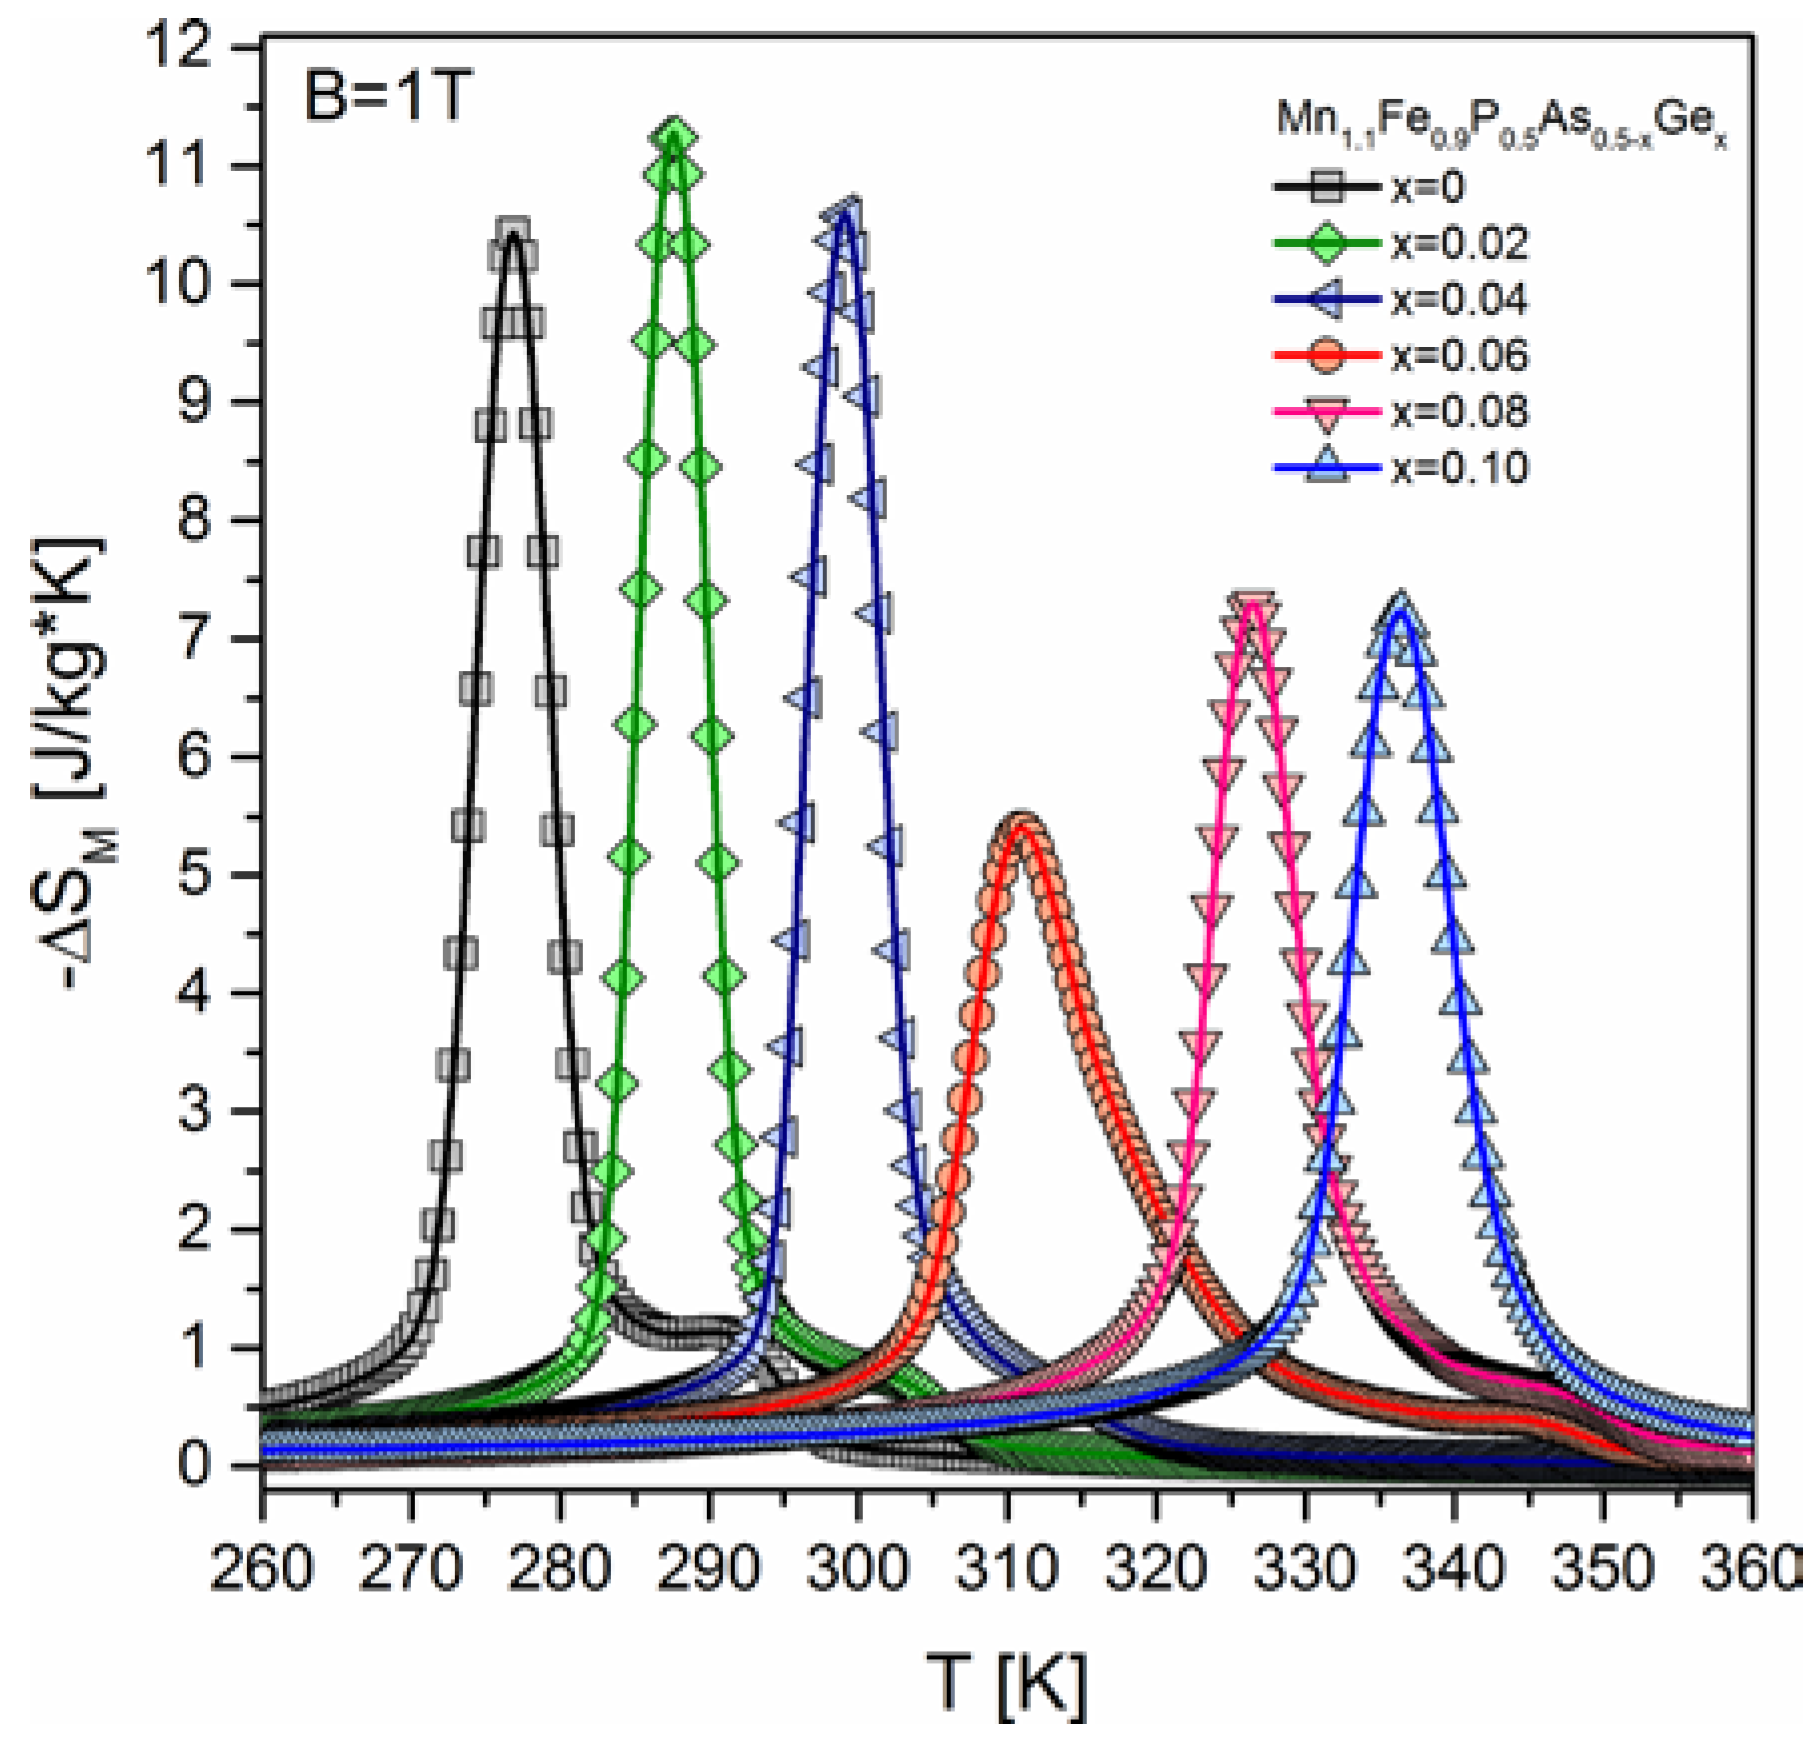
Magnetic entropy change was calculated for all of the studied samples for magnetic field change up to B = 1 T. As one can see in
Figure 4, the magnetic entropy change (at B = 1 T) drops significantly with increasing concentration of germanium from
x = 0.04 to
x = 0.06, where it achieves a minimal value (−ΔS
M = 5.5 J
.kg
−1.K
−1).
The highest magnetic entropy change was obtained for a sample with the germanium amount of
x = 0.02 (−ΔS
M = 11.0 J
.kg
−1.K
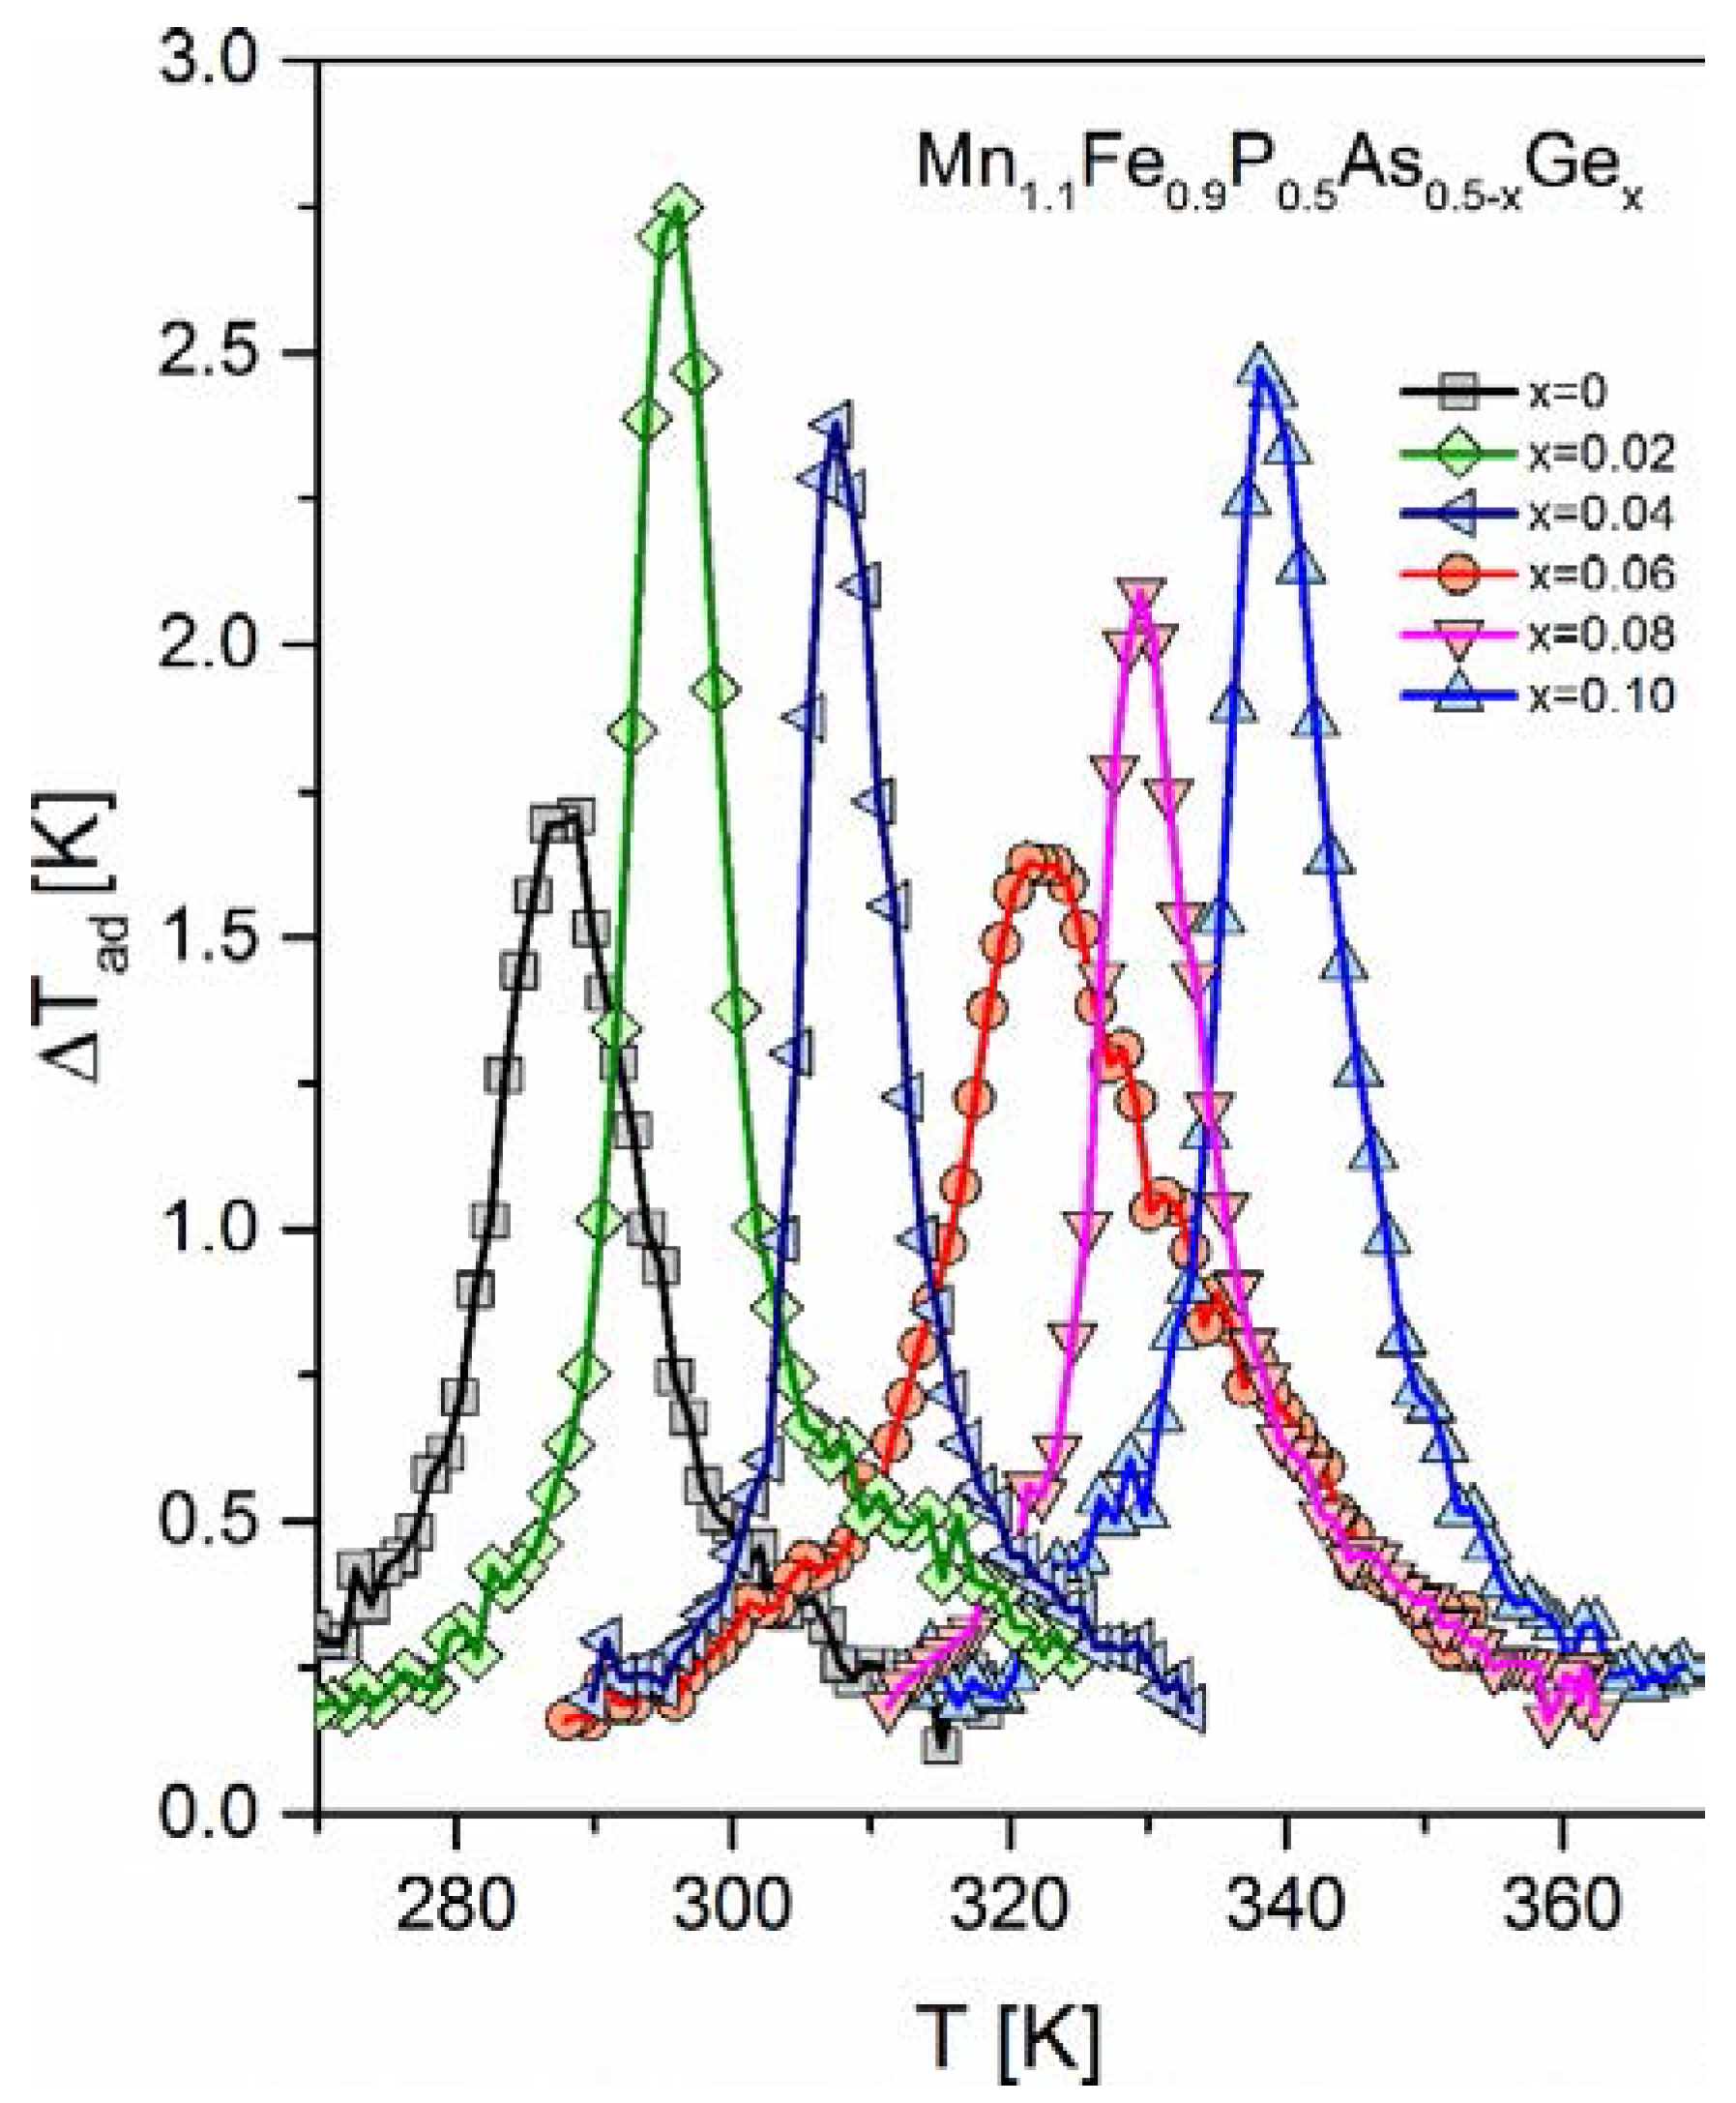
−1). Adiabatic temperature change (see
Figure 5 for details) behaves the same way as the magnetic entropy change. It was found that by the slight substitution of germanium for arsenic (
x = 0.02), the adiabatic temperature change raised from 1.75 to 2.75 K at B = 1.7 T. This quantity exhibits similarly as the magnetic entropy change minimum at the germanium amount of
x = 0.04. For this composition, the adiabatic temperature change equals 1.7 K. It can be easily noticed that germanium substitution for arsenic leads to an increase of the Curie point. The sample exhibiting the highest magnetocaloric effect (
x = 0.02) exhibits FM-PM transition at room temperature, which is advantageous from a practical point view.
Generally, the magnetocaloric effect is related to both the magnetic entropy change and latent heat of transition. In the MnFePAsGe series, the adiabatic temperature change has a similar germanium content dependence as the magnetic entropy change. Therefore, it can be assumed that magnetocaloric effect is mainly altered due to the change of the overall magnetic moment of the unit cell. Many studies, up to now, have indicated that the highest magnetic moment is localized mainly on manganese atoms (~2.9 μB) which prefer the
3g Wyckoff position of the hexagonal P −6 2 m lattice cell. On the other hand, iron atoms prefer the
3f positions (magnetic moment approximately 1.3 μB) and, in consequence, both elements form alternating planes (layers) in the crystal. Therefore, it can be predicted that mainly the modification of
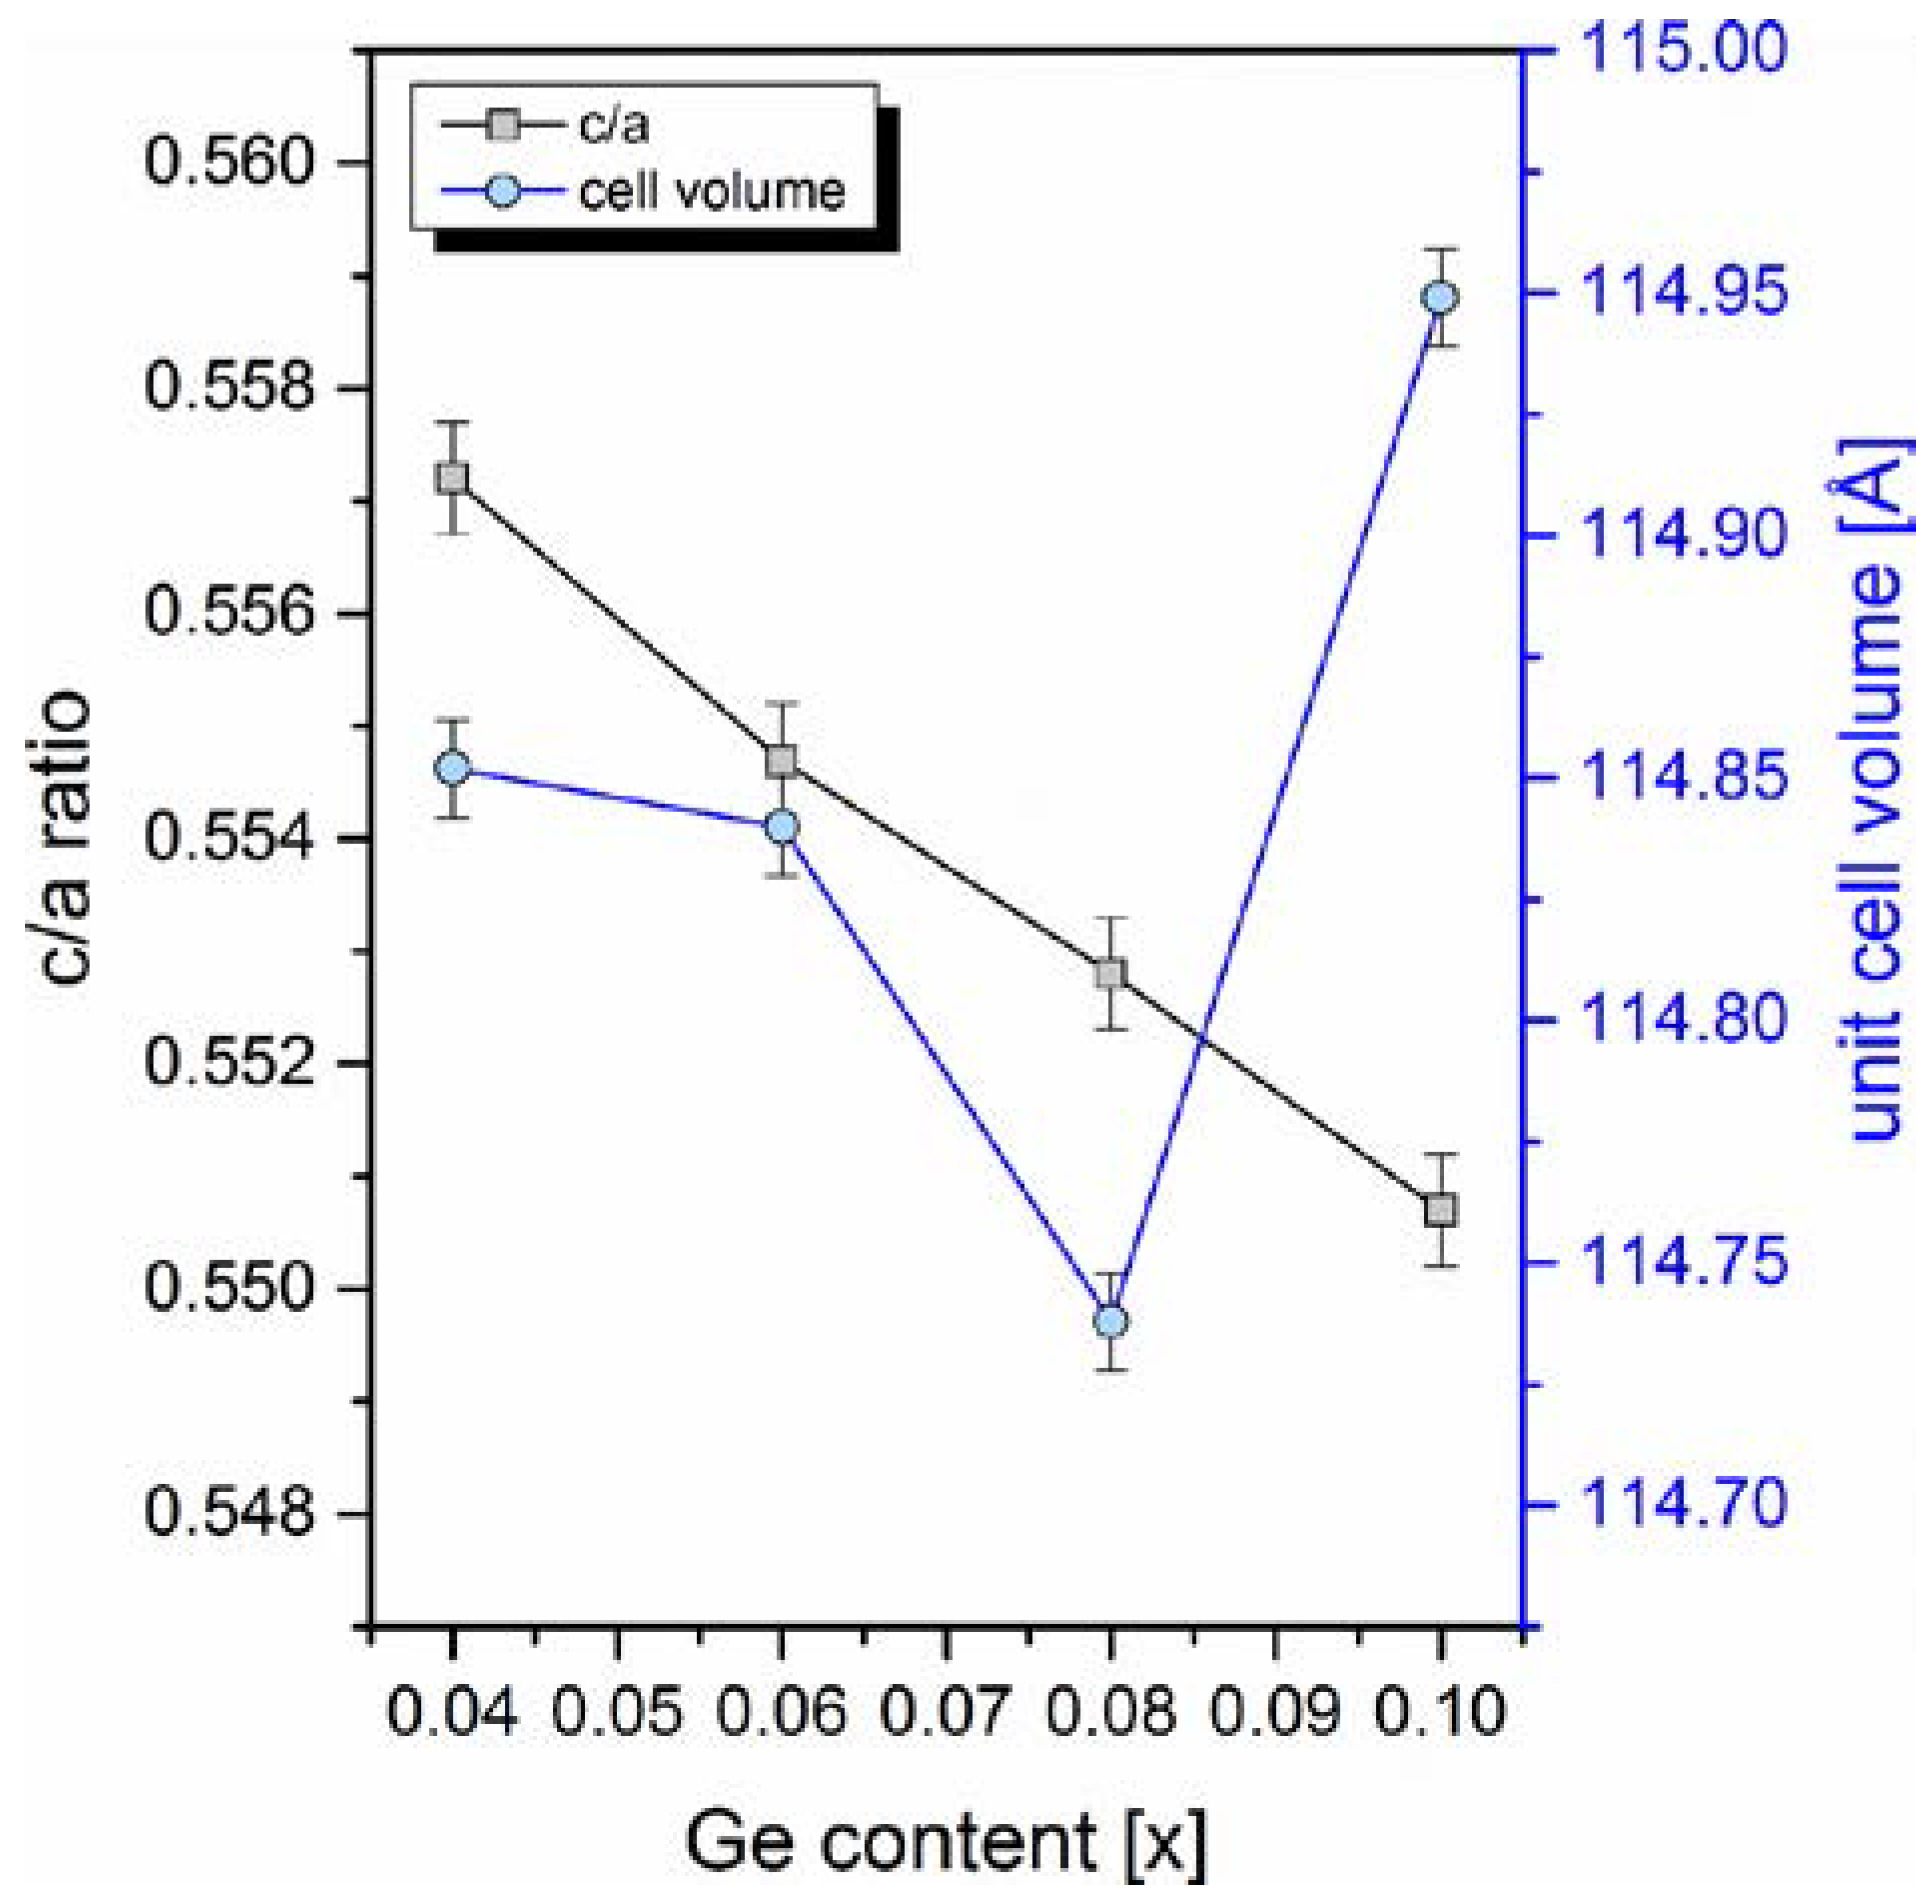
3g-3g intralayer distances leads to large fluctuations of the cell’s magnetic moment and consequently to the alteration of magnetocaloric effect. Despite the fact that germanium atoms have a higher atomic radius than arsenic (125 pm for Ge versus 115 pm for As), a substitution of germanium for arsenic up to the value of
x = 0.08 leads to the unit cell volume contraction. Moreover, the ratio of lattice constants
c/
a decreases with the increasing amount of germanium in the whole range of studied germanium concentrations. Both parameters have been refined from the X-ray diffraction data, and are gathered in
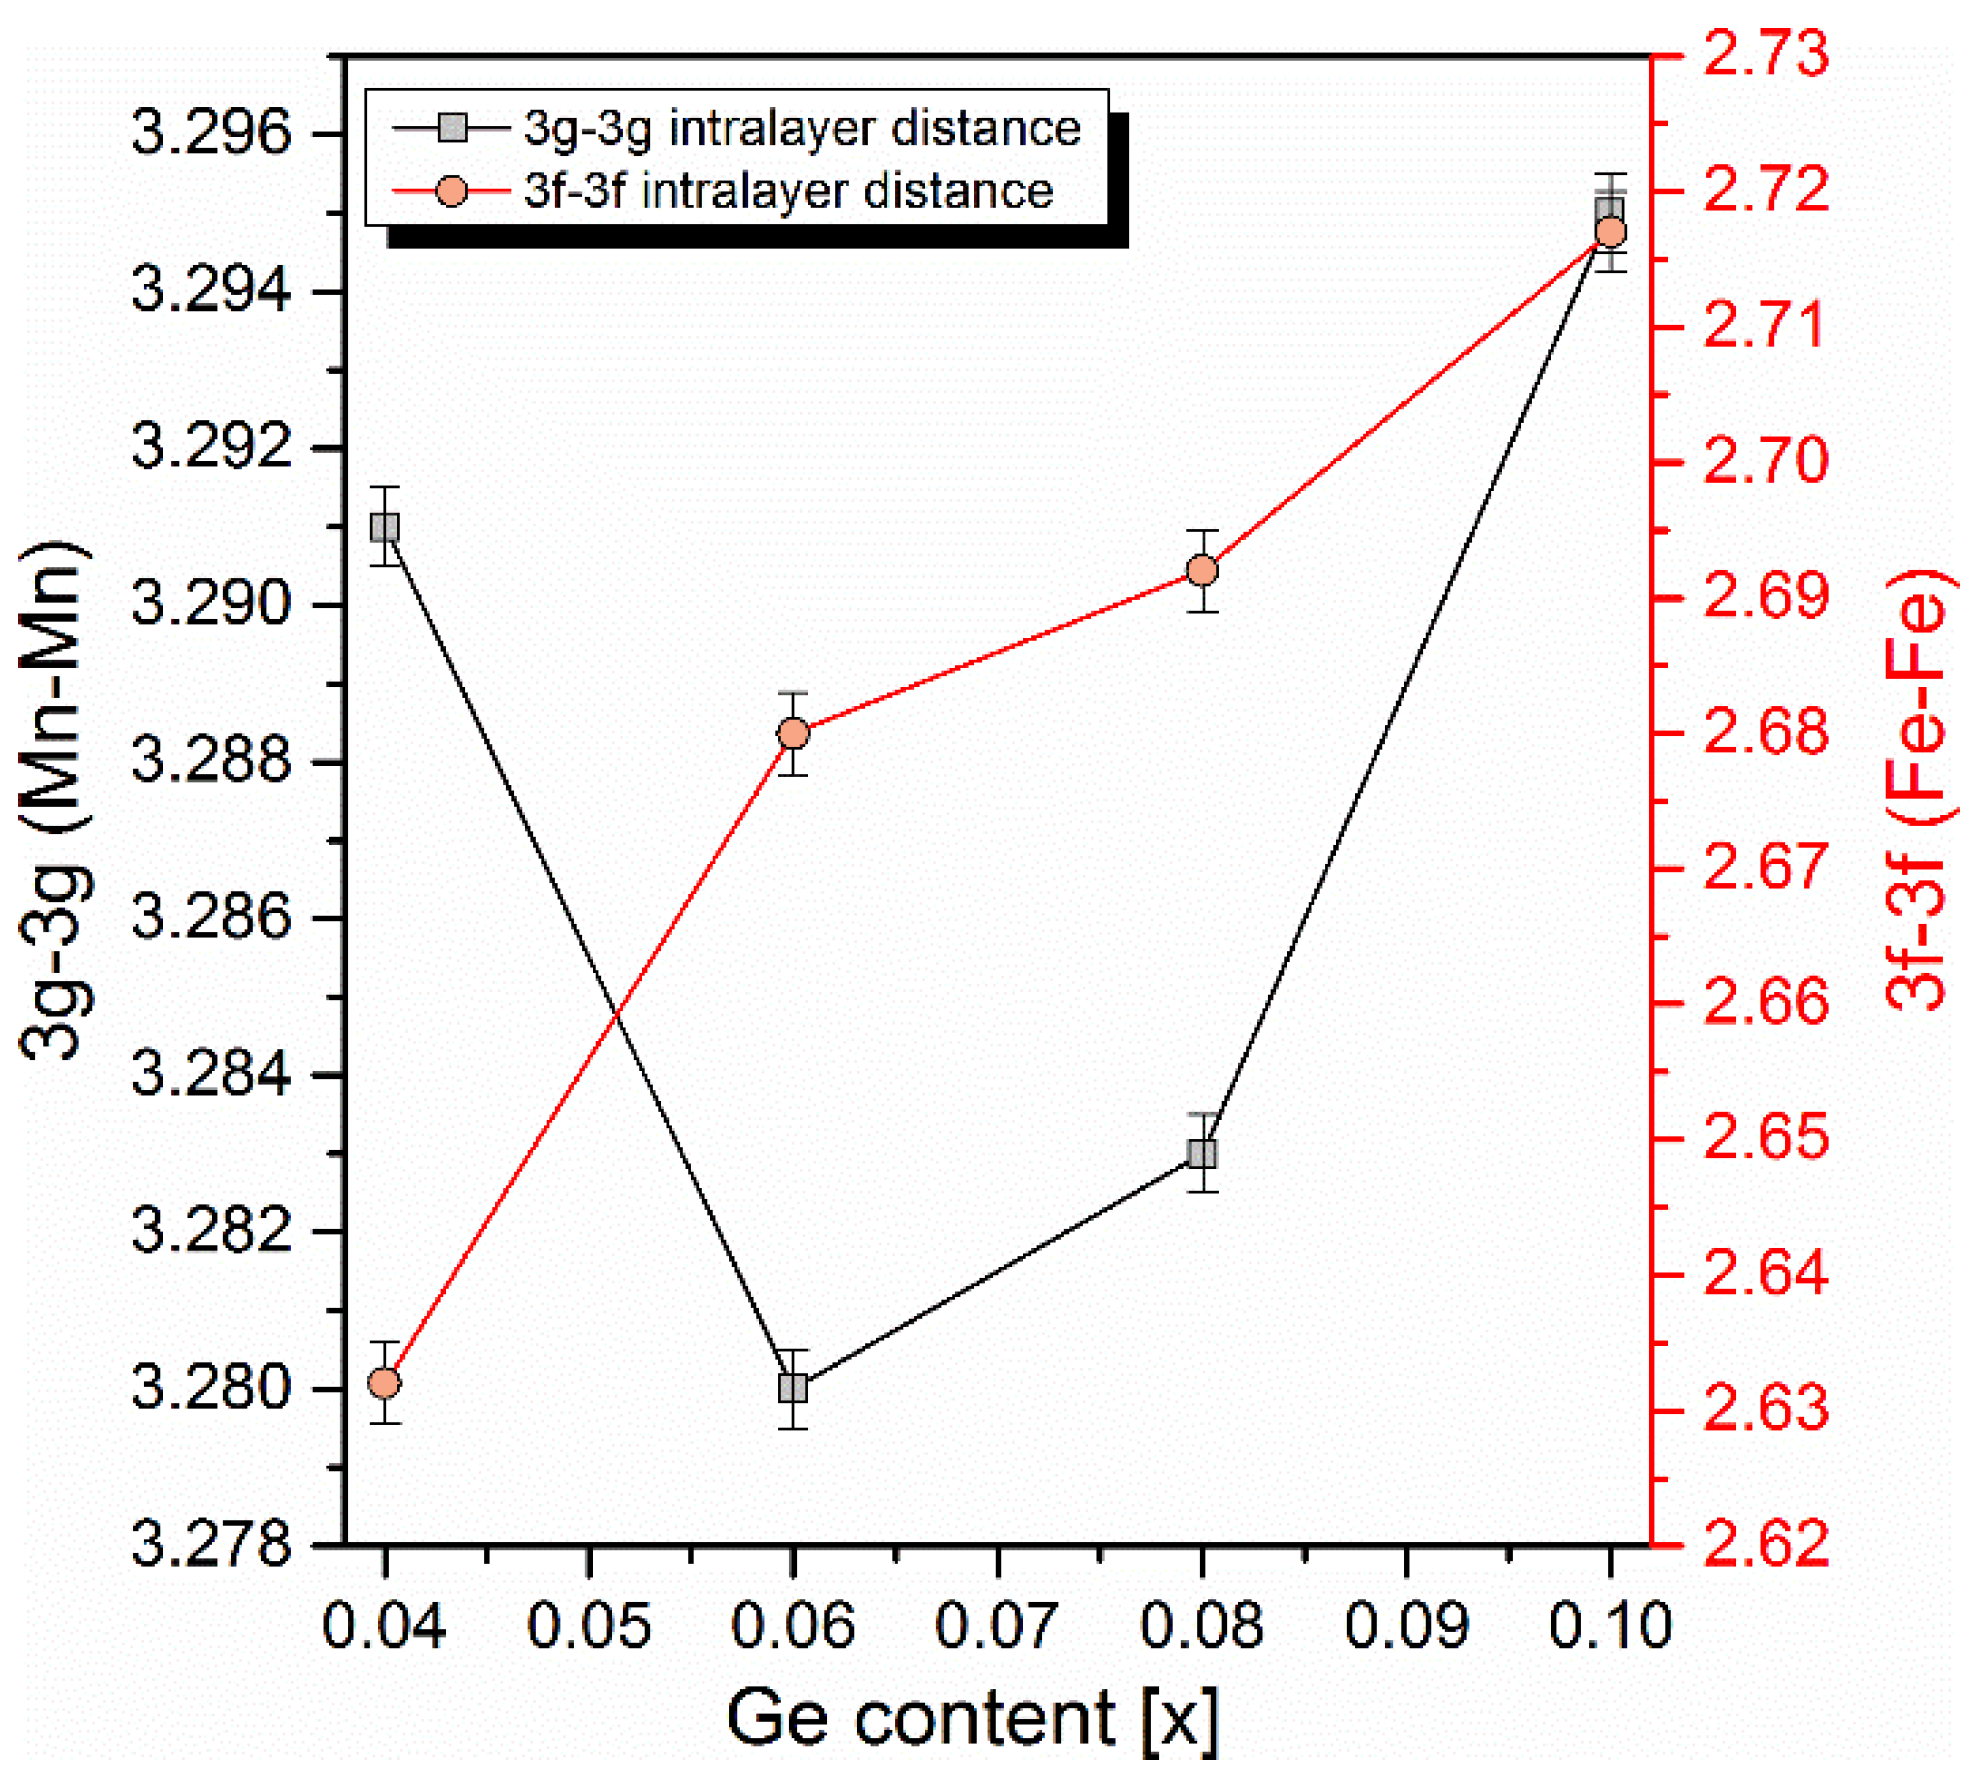
Figure 6. Such modifications of structure leads to the change of magnetic atoms (Fe and Mn) distances in and between layers. It was found that the composition-dependent magnetocaloric parameters can be correlated with the changing
3g-3g intralayer distances. In
Figure 7,
3g-3g and
3f-3f distances are plotted as a function of germanium content. As one can see, the
3g-3g distance exhibits the same minimum as was found for adiabatic temperature and magnetic entropy change. Contrary to the behavior of the
3g-3g distance, the
3f-3f intralayer distance rises in the whole range of germanium concentrations. Assuming that Mn atoms are placed in the
3g Wyckoff positons, by substituting a non-magnetic metalloid atom, i.e., arsenic or phosphorous, for atoms with different atomic radius, one can control the Mn-Mn atomic distance in a crystalline cell, which affects magnetocaloric effect. The sample with composition Mn
1.1Fe
0.9P
0.5As
0.48Ge
0.02 has certain parameters, i.e., a magnetic entropy change calculated for magnetic field induction of B = 1 T and the Curie temperature, similar to the sample obtained by Tegus et al. with composition Mn
1.1Fe
0.9 P
0.7As
0.2Ge
0.1.


